Embed Size (px)
Citation preview

2K
3K
4K
5K
6K
7K
8K
9K
10K
11K
12K
13K
14K
15K
QUALIFYING FLUID & PROPPANT PERFORMANCE®
Atlas Sand
●17222 Huffmeister Rd, Ste. B●Cypress, TX 77429-1643●Ph.: 888-756-2112●Fax: 281-256-8880●
●www.proptester.com●
Atlas Permian 40/70
101-17-09-95-03
Wednesday, September 13, 2017

RFA#101-17-09-95-03
Information:
Date: September 13, 2017
Company Requesting:
Color Analysis – Proppant Test Data:
Proppant test results are referenced against API RP-19C standards and available public data.
Classification by color or numerical variance does not imply a level of performance. However,
coloring of standard and public data does indicate a specific range of variance of sample test
results. The numerical ranges are typical of data variance between laboratories that participate in
API/ISO round robin or performance (e.g. conductivity) evaluation. When limits (e.g. > or <) are
used, then only green or red will apply.
Report Generated by: Brandon White
Technician: Lee Sellers
Background:
Page 2 of 11
Sample Origin: Hand Delivered
Sales Contact: Brandon White
Atlas Sand Company, LLC
A sample was delivered to the PropTester, Inc. laboratory in Cypress, TX from Atlas Sand Company, LLC. The sample was labeled Atlas Permian 40/70. Instructions are toperformfullAPI RP-19C analysis on this sample. All tests are completed according toAPI RP-19C standards.

RFA#101-17-09-95-03
Comments:
Conclusions:
API RP-19C Analyses
➢ Roundness & Sphericity - Does sample meet API RP-19C Krumbein shape requirements?
➢ Particle Distribution -Does sample meet API RP-19C requirements for particle distribution?
➢Does sample meet API RP-19C requirements for commercial grade fracturing
proppant?
➢ Turbidity - Does sample meet API RP-19C requirements for fracturing proppant?
➢ Acid Solubility - Does sample meet API RP-19C "15% HCl" Acid Solubility standards?
➢ K-factor: 8K
PropTester Resin Coated Analyses
Not
Tested➢ UCS: psi
Not
Tested➢ % Loss on Ignition (LOI)
Sample meets or passes requirements Sample fails to meet requirements.
*** Refer to test definitions and descriptions for more information on each critical property. ***
Not
Tested➢ Wettability
Not
Tested➢ Coating Efficiency
Page 3 of 11
Atlas Permian 40/70

RFA#101-17-09-95-03
≤ 250
≥ 0.6 0.55
≥ 0.6 0.55
Sieve
0.600 30 ≤ 0.1
0.425 40
0.355 45
0.300 50
0.250 60
0.212 70
0.150 100
<0.150 Pan ≤ 1.0
≥ 90
Crush Chek✓
≤ 10
≤ 10
Turbidity (NTU) 5
Krumbein Shape Factors
Roundness 0.7
Figure 1: Proppant Test Data -
Quick Chek ✓API
RP-19C 40/70 Cut
Bulk Density (g/cc) 1.48
Bulk Density (lb/ft3) 92.25
Sphericity 0.7
Specific Gravity (Apparent Density) 2.65
Particle Size Distribution, mm
0.0
0.0
1.9
0.1
3.5
12.7
48.7
33.0
Mean Particle Diameter, mm 0.269
Median Particle Diameter (MPD), mm 0.265
Total 100.0
% In Size 98.0
Solubility in 15% HCl for 0.5 HR @ 150°F
(% Weight Loss)≤ 3.0 0.3
3.0
API Crush Analysis (% Fines)
4lb/ft2@ 15,000 psi
API Crush Analysis (% Fines)
4lb/ft2@ 10,000 psi
API Crush Analysis (% Fines)
4lb/ft2@ 12,500 psi
API Crush Analysis (% Fines)
4lb/ft2@ 9,000 psi10.2
API Crush Analysis (% Fines)
4lb/ft2@ 7,500 psi
API Crush Analysis (% Fines)
4lb/ft2@ 8,000 psi8.2
Meets API RP-19C standards Fails API RP-19C standards
Page 4 of 11
Atlas Permian 40/70

RFA#101-17-09-95-03
0.600
0.425
0.355
0.300
0.250
0.212
0.150
<0.150
Median : 0.265 mm Mean : 0.269 mm
40 0.0
45 3.5
30 0.0
70 33.0
50 12.7
60 48.7
100 1.9
Pan 0.1
0.0
10.0
20.0
30.0
40.0
50.0
60.0
30 40 45 50 60 70 100 Pan
Per
cen
t R
etai
ned
Sieve Size
Sieve Distribution
Page 5 of 11
Mesh Size
(mm) Sieve # Atlas Permain 40/70
Atlas Permian 40/70
Figure 2: Particle Distribution Graph

RFA#101-17-09-95-03
Photomicrograph 140X Magnification
Page 6 of 11

RFA#101-17-09-95-03
Testing Definitions & Descriptions
Turbidity – A measure to determine the levels of dust, silt, suspended clay, or finely divided
inorganic matter levels in fracturing proppants. High turbidity reflects improper proppant
manufacturing and/or handling practices. The more often and more aggressively a proppant is
handled, the higher the turbidity. Offloading pressures exceeding manufacturer guidelines can
have a detrimental effect on the proppant performance. Produced dust can consume oxidative
breakers, alter fracturing fluid pH, and/or interfere with crosslinker mechanisms. As a result,
higher chemical loadings may be required to control fracturing fluid rheological properties and
performance. If fluid rheology is altered, then designed or modeled fracture geometry and
conductivity will be altered. A change in conductivity directly correlates to reservoir flow rate.
Krumbein Shape Factors – determines proppant roundness and sphericity. Grain
roundness is a measure of the relative sharpness of grain corners, or of grain curvature. Particle
sphericity is a measure of how closely a proppant particle approaches the shape of a sphere.
Charts developed by Krumbein and Sloss in 1963 are the most widely used method of
determining shape factors.
Clusters – Proppant grains should consist of single, well-rounded particles. During the mining
and manufacturing process of proppants, grains can attach to one another causing a cluster. It is
recommended by API RP-19C that clusters be limited to less than 1% to be considered suitable
for fracturing proppants.
Bulk Density – A dry test to gain an estimation of the weight of proppant that will fill a unit
volume, and includes both proppant and porosity void volume. This is used to determine the
weight of a proppant needed to fill a fracture or a storage tank.
Specific Gravity – Also called Apparent Density, it includes internal porosity of a particle as
part of its volume. It is measured with a low viscosity fluid that wets the particle surface.
Sieve Analysis: Particle Size Distribution & Median Particle Diameter – Also
called a sieve analysis, this test determines the particle size distribution of a proppant sample.
Calibrated sieves are stacked according to API RP-19C recommended practices and loaded with
a pre-measured amount of proppant. The stack is placed in a Ro-Tap sieve shaker for 10 minutes
and then the amount on each sieve is measured and a percent by weight is calculated on each
sieve. A minimum of 90 % of the tested proppant sample should fall between the designated
sieve sizes. Not over 0.1% of the total tested sample should be larger than the first sieve size and
not over 1.0% should fall on the pan. The in-size percent, mean particle diameter, and median
particle diameter are calculated which relates directly to propped fracture flow capacity and
reservoir productivity.
Page 7 of 11
RFA#101-17-09-95-03
Testing Definitions & Descriptions
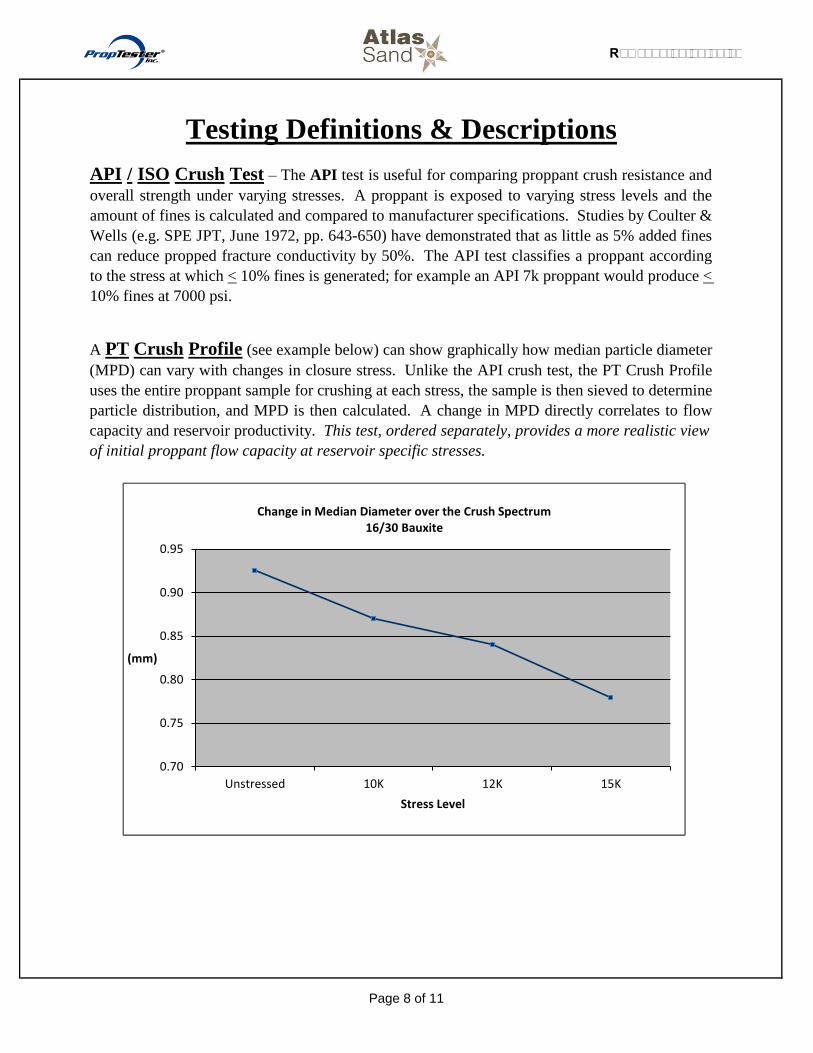
API / ISO Crush Test – The API test is useful for comparing proppant crush resistance and
overall strength under varying stresses. A proppant is exposed to varying stress levels and the
amount of fines is calculated and compared to manufacturer specifications. Studies by Coulter &
Wells (e.g. SPE JPT, June 1972, pp. 643-650) have demonstrated that as little as 5% added fines
can reduce propped fracture conductivity by 50%. The API test classifies a proppant according
to the stress at which < 10% fines is generated; for example an API 7k proppant would produce <
10% fines at 7000 psi.
A PT Crush Profile (see example below) can show graphically how median particle diameter
(MPD) can vary with changes in closure stress. Unlike the API crush test, the PT Crush Profile
uses the entire proppant sample for crushing at each stress, the sample is then sieved to determine
particle distribution, and MPD is then calculated. A change in MPD directly correlates to flow
capacity and reservoir productivity. This test, ordered separately, provides a more realistic view
of initial proppant flow capacity at reservoir specific stresses.
0.70
0.75
0.80
0.85
0.90
0.95
Unstressed 10K 12K 15K
(mm)
Stress Level
Change in Median Diameter over the Crush Spectrum 16/30 Bauxite
0.70
0.75
0.80
0.85
0.90
0.95
Unstressed 10K 12K 15K
(mm)
Stress Level
Change in Median Diameter over the Crush Spectrum 16/30 Bauxite
Page 8 of 11

RFA#101-17-09-95-03
Resin Content/Loss on Ignition (LOI) – This test determines the resin content remaining
on the proppant. Resin content is a direct function of the proppants strength and its ability to
encapsulate the substrate when exposed to high stress levels. By reducing fines generation and
migration, the proppant pack remains clean, allowing maximum well production.
Resin Coating Efficiency – Used to determine the percent of uncoated grains in a resin
coated proppant sample.
Unconfined Compressive Strength (UCS) – Grain-to-grain bonding at specific
temperatures over time will develop bond strength that can be measured by using a UCS test.
This test directly reflects the proppants ability to bond downhole in order to reduce embedment
and control proppant flowback. By reducing embedment and keeping the available proppant in
place, fracture width can be maximized.
pH of Water Extract – This test reflects the potential chemical impact of a proppant on
fracturing fluid pH. Processing or manufacturing of a proppant can leave residues, or ‘free
phenol’ in the case of resin coated proppants, which can interfere with polymer hydration rates,
cross-linking mechanisms, etc. These effects if detected can usually be remedied by increasing
buffering capacity, but if undetected can alter fracturing fluid rheology, change fracture
geometry, and impact propped fracture conductivity. A change in conductivity directly correlates
to reservoir production rate.
Testing Definitions & Descriptions
Acid Solubility – The solubility of a proppant in 12-3 hydrochloric-hydrofluoric acid (HCl-
HF) is an indication of the amount of undesirable contaminates. Exposing a proppant
(specifically gravel pack/frac pack materials) may result in dissolution of part of the proppant,
deterioration in propping capabilities, and a reduction in fracture conductivity in the zone
contacted by such acid. The loss of fracture conductivity near the wellbore may cause a dramatic
reduction in well productivity, as has been demonstrated by Raymond and Binder (JPT, January
1967, Pgs. 120-130).
Page 9 of 11

RFA#101-17-09-95-03
Krumbein Shape Factors
Clusters
Photomicrographs
Old API Crush Test
Current API Crush Test
TEST PROCEDURES
Coating Efficiency % Prop Tester®
Unconfined Compressive Strength (UCS) Prop Tester®
pH of Water Extract Prop Tester®
PT Crush Profile Prop Tester®
Res Chek Procedures
% Resin Content, LOI Prop Tester®
Crush Chek Procedures
API RP 56/58/60
API RP-19C
Particle Size Distribution API RP-19C
Mean Particle Diameter API RP-19C
Median Particle Diameter Prop Tester®
Bulk Density API RP-19C
Specific Gravity API RP-19C
Sieve Analysis API RP-19C
PropTester®
& API test procedures were applied in this Request for Analysis (RFA)
Quick Chek Procedures
Turbidity API RP-19C
Microscopic Exam API RP-19C
Page 10 of 11

RFA#101-17-09-95-03
KBW
PROPTESTER MAKES NO WARRANTY OR REPRESENTATION (EXPRESS OR IMPLIED) CONCERNING THE PRODUCT, ITS MERCHANTABILITY, ITS FITNESS FOR ANY
PURPOSE OR USE, OR FOR ACCURACY OR COMPLETENESS OF ANY INFORMATION BY THE SELLER OR MANUFACTURER. IT IS THE RESPONSIBILITY OF THE USER OF
THE PRODUCT TO INVESTIGATE AND UNDERSTAND ALL PERTINENT SOURCES OF INFORMATION AND TO COMPLY WITH ALL LAWS, REGULATIONS AND
PROCEDURES APPLICABLE TO THE SAFE HANDLING, USE AND DISPOSAL OF THE PRODUCT AND TO DETERMINE THE SUITABILITY OF THE PRODUCT FOR ITS
INTENDED USE. THIS REPORT IS LIMITED TO ONLY THOSE TESTS REQUESTED AND PERFORMED ON THE INDICATED SAMPLE. NO CLAIM OF DAMAGES OF ANY
KIND, WHETHER AS TO PRODUCT DELIVERED, FOR NON-DELIVERY OF PRODUCT OR USE OF PRODUCT AND WHETHER BASED ON CONTRACT, BREACH OF
WARRANTY, BREACH OF REPRESENTATIONS, NEGLIGENCE, STATUTES OR OTHERWISE SHALL BE GREATER THAN THE COST OF THE TEST, PROCEDURES, OR
ANALYSIS COVERED BY THIS REPORT. IN NO EVENT SHALL PROPTESTER BE LIABLE FOR ANY INCIDENTAL OR CONSEQUENTIAL DAMAGES, EVEN IF THE CLAIM IS
BASED ON CONTRACT, BREACH OF WARRANTY REPRESENTATION, NEGLIGENCE, STATUES OR OTHERWISE.
PropTester, Inc. ● 17222 B Huffmeister Rd ● Cypress, TX 77429 ● Customer Service: 888-756-2112 ● Fax: 281-256-8883
DISCLAIMER
Page 11 of 11