Embed Size (px)
Citation preview

Health situation analysis of the African Region
AfricanHealthObservatory
Better information, better action on health
Atlas of African
Health Statistics
2016
African Health ObservatoryWorld Health OrganizationRegional Office for AfricaCité du Djoué, Brazzaville, Congo,Tel.: +(47 241) 39323 / 39140 / 39316email: [email protected] www.aho.afro.who.int
ISBN 978-929023291-9
9 789290 232919
WHO’s Atlas of African Health Statistics series is the most
comprehensive and widely used source of information on the
health situation in the African Region. It provides up-to-date
information on the state of health in countries and covers
critical areas of health outcomes; health services and systems;
specific programmes and services, such as communicable,
non-communicable, and epidemic prone diseases; key
determinants of health; and progress on the MDGs. These data
serve as baseline for monitoring progress on international
agreed targets such as those of the Millennium Development
Goals and the Sustainable Development Goals.
The Atlas is produced by the staff of the African Health
Observatory at the Regional Office with the contributions and
active collaboration of the 47 countries of the African Region.
The online companion to the Atlas can be found on the African
Health Observatory portal (www.aho.afro.who.int) where us-
ers can carry out searches, perform analyses and download
data for further work. The online atlas is developed on an
on-going basis with new indicators and new data when they
become available.
Atlas of African
Health Statistics
2016
Health situation analysis of the African Region
AfricanHealthObservatoryBetter information, better action on health
WHO/AFRO Library Cataloguing – in – Publication Data
Atlas of African Health Statistics 2016 : Health situation analysis of the African Region
1. Health Status Indicators 2. Health Information Systems 3. Health Policy 4. Health Services – Statistics & Numerical Data 5. Statistics 6. Atlases [Publication Type] 7. Africa
I. World Health Organization. Regional Office for Africa II. Title
ISBN: 978-929023291-9 (NLM Classification: WA 900.1)
© WHO Regional Office for Africa, 2016
Publications of the World Health Organization enjoy copyright protection in accordance with the provisions of Protocol 2 of the Universal Copyright Convention. All rights reserved. Copies of this publication may be obtained from the Library, WHO Regional Office for Africa, P.O. Box 6, Brazzaville, Republic of Congo (Tel: +47 241 39100; Fax: +47 241 39507; E-mail: [email protected]). Requests for permission to reproduce or translate this publication – whether for sale or for non-commercial distribution – should be sent to the same address.The designations employed and the presentation of the material in this publication do not imply the expression of any opinion whatsoever on the part of the World Health Organization concerning the legal status of any country, territory, city or area or of its authorities, or concerning the delimitation of its frontiers or boundaries. Dotted lines on maps represent approximate border lines for which there may not yet be full agreement.The mention of specific companies or certain manufacturers’ products does not imply that they are endorsed or recommended by the World Health Organization in preference to others of a similar nature that are not mentioned. Errors and omissions excepted, the names of proprietary products are distinguished by initial capital letters.All reasonable precautions have been taken by the World Health Organization to verify the information contained in this publication. However, the published material is being distributed without warranty of any kind, either express or implied. The responsibility for the interpretation and use of the material lies with the reader. In no event shall the World Health Organization or its Regional Office for Africa be liable for damages arising from its use.This Atlas has been prepared by a core team from the Health Systems and Services Cluster of WHO Regional Office for Africa under the general guidance of the Cluster Director. The core team was coordinated by Derege Kebede and included Harris Benito Koubemba Mona, Davy Audrey Liboko Gnekabassa, Monde Mambimongo Wangou, Anaclet Geraud Nganga Koubemba and Berence Relisy Ouaya Bouesso. It was reviewed by Peter Mbondji Ebongue, Miguel Mesquita de Oliveira Peixoto, Wenceslas H Kouvividila, Yves Turgeon and Hongyi Xu. Specific sections of the Atlas were also reviewed by the relevant technical programmes and units in the Regional Office. The assistance of Satiane Didolance Odika is also acknowledged.
More information about this publication can be obtained from:
African Health Observatory World Health Organization Regional Office for Africa Cité du Djoué, Brazzaville, Congo, Tel.: +(47 241) 39323 / 39140 / 39316 email: [email protected] www.aho.afro.who.int
Printed and bound in the WHO Regional Office for Africa
Contents
Message from the Regional Director ...............................................................................xv
Abbreviations and acronyms ..........................................................................................xvi
Overview ..........................................................................................................................xvii
Progress on the MDGs ............................................................................................................................................................... xviii
1. Introduction .....................................................................................................................1
2. Health status and trends .................................................................................................4
2.1. Life expectancy ..........................................................................................................................................................................4
2.2. Mortality .......................................................................................................................................................................................9
2.3. Burden of disease .................................................................................................................................................................. 21
3. Progress on the MDGs ...................................................................................................23
3.0. MDG progress status in the African Region ................................................................................................................. 23
3.1. MDG-4: Reduce child mortality ........................................................................................................................................ 25
3.2. MDG-5: Improve maternal health .................................................................................................................................... 27
3.3. MDG-6: Combat HIV/AIDS, malaria and other diseases ........................................................................................... 31
3.4. MDG-7: Ensure environmental sustainability .............................................................................................................. 35
3.5. MDG-1: Eradicate extreme poverty and hunger ........................................................................................................ 37
3.6. MDG-2: Achieve universal primary education ............................................................................................................ 38
3.7. MDG-3: Promote gender equality and empower women ...................................................................................... 39
3.8. MDG-8: Develop a global partnership for development ......................................................................................... 40
4. The health system ..........................................................................................................42
4.1. Health system outcomes..................................................................................................................................................... 42
4.2. Leadership and governance .............................................................................................................................................. 52
4.3. Partnership for health development .............................................................................................................................. 54
4.4. Health information ................................................................................................................................................................ 55
4.5. Research .................................................................................................................................................................................... 58
4.6. Health financing ..................................................................................................................................................................... 59
4.7. Service delivery ...................................................................................................................................................................... 68
4.8. Health workforce .................................................................................................................................................................... 69
4.9. Medical products, vaccines, infrastructures and equipment ................................................................................. 72
4.10. Universal coverage ............................................................................................................................................................. 78
5. Specific programmes and services ...............................................................................83
5.1. HIV/AIDS .................................................................................................................................................................................... 83
5.2. Tuberculosis ............................................................................................................................................................................. 88
5.3. Malaria ....................................................................................................................................................................................... 93
5.4. Immunization and vaccines ............................................................................................................................................... 97
5.5. Child and adolescent health ............................................................................................................................................104
5.6. Maternal and newborn health ........................................................................................................................................113
5.7. Gender and women’s health ............................................................................................................................................122
5.8. Ageing .....................................................................................................................................................................................129
5.9. Epidemic and pandemic-prone diseases ....................................................................................................................131
iii

FiguresOverview
Figure A. The WHO African Region ..............................................................xvii
Table. General population characteristics ................................................xvii
Figure B. Ranking of main disorders according to the percentage of death in the African Region, 2000 and 2012 ......................................xvii
Figure C. Distribution of causes of death among children aged <5 years in the African Region, 2013 ................................................................xvii
Figure D. Trend in average of general government health expenditure as percentage of general government expenditure, 1995–2013 ...........................................................................................................xvii
Figure E. Health workforce, 2007–2013 .....................................................xvii
Figure F. Utilization of health services, 2007–2014 ...............................xvii
Figure G. Utilization of health services ......................................................xvii
Figure H. Prevalence of smoking any tobacco product among adults >15 years, 2012 .....................................................................................xvii
Progress on the MDGs
Figure I. Trend in under-5 mortality rate (probability of dying by age 5; per 1 000 live births) in the African Region, 1990-2015 ....... xviii
Figure J. Reduction in under-5 mortality rate (%), 1990–2015 ....... xviii
Figure K. Trend in Measles-containing vaccine (MCV) immunization coverage among 1-year-olds (%) in the African Region, 1980–2012 ......................................................................................... xviii
Figure L. Measles-containing vaccine (MCV) immunization coverage among 1-year-olds (%), 1990 and 2014 .............................. xviii
Figure M. Trend in maternal mortality ratio (per 100 000 live births) in the African Region, 1990–2015 ............................................................ xviii
Figure N. Reduction in maternal mortality ratio (%), 1990–2015 .. xviii
Figure O. Births attended by skilled (SBA) health personnel (%), 1990–1999 and 2007–2014 ......................................................................... xviii
Figure P. Unmet need for family planning (%), 2007–2013 .............. xviii
Figure Q. Antenatal care coverage at least one visit (ANC1) (%), 2007–2014 ......................................................................................................... xviii
Figure R. Antenatal care coverage at least four visits (ANC4) (%), 2007–2014 ......................................................................................................... xviii
Figure S. Reduction in HIV prevalence (%), 2000–2014 ........................xix
Figure T. Antiretroviral therapy coverage among people with advanced HIV infection (%), 2007 and 2014 .............................................xix
Figure U. Reduction in incidence of malaria (%), 2000–2015 .............xix
Figure V. Reduction in mortality rate of tuberculosis (%), 1990–2014 xix
Figure W. Reduction in population using improved drinking-water sources (%), 1990–2015 ...................................................................................xix
Figure X. Reduction in population using improved sanitation (%), 1990–2015 ............................................................................................................xix
Figure Y. Trend in proportion of underweight children under-five years of age in the African Region, 1990–2014 .......................................xix
Figure Z. Reduction in proportion of underweight children under-five years of age (%), 1990–2014 ..................................................................xix
1. Introduction
Figure 1.1. WHO regions .....................................................................................2
Figure 1.2. Population size (in thousands) of countries of the African Region, 2015 ............................................................................................2
Figure 1.3. Population size (in thousands) by WHO region, 2013 ........2
Figure 1.4. Age distribution (%) of the population by WHO region, 2013 ............................................................................................................................3
Figure 1.5. Age distribution (%) of the population in the African Region, 2013 ...........................................................................................................3
Figure 1.6. Annual growth rate (%) distribution of the population by WHO region, 2003–2013 ...............................................................................3
2. Health status and trends
2.1. Life expectancy
Figure 2.1.1. Life expectancy at birth in years in the African Region, 2013 ............................................................................................................................4
Figure 2.1.2. Life expectancy at birth in years by sex and WHO region, 2013.............................................................................................................4
5.10. Neglected tropical diseases ...........................................................................................................................................134
5.11. Noncommunicable diseases and conditions ..........................................................................................................138
6. Key determinants ........................................................................................................143
6.1. Risk factors for health .........................................................................................................................................................143
6.2. The physical environment ................................................................................................................................................149
6.3. Nutrition ..................................................................................................................................................................................153
6.4. Social determinants ............................................................................................................................................................157
Explanatory notes ...........................................................................................................168
1. Introduction ..............................................................................................................................................................................168
2. Health status and trends.......................................................................................................................................................168
3. Progress on the MDGs ...........................................................................................................................................................170
4. The health system ...................................................................................................................................................................171
5. Specific programmes and services ...................................................................................................................................179
6. Key determinants ....................................................................................................................................................................190
References ........................................................................................................................196
iv
Figure 2.1.3. Life expectancy at birth in years by WHO region, 1990 and 2013 ...................................................................................................................4
Figure 2.1.4. Life expectancy at birth in years in the African Region, 1990 and 2013 ........................................................................................................5
Figure 2.1.5. Life expectancy at birth in years by sex in the African Region, 2013 ...........................................................................................................5
Figure 2.1.6. Trend in life expectancy at birth (years) by sex in the African Region, 1990–2013 ................................................................................6
Figure 2.1.7. Healthy life expectancy at birth (years) by sex in the African Region, 2013 ............................................................................................6
Figure 2.1.8. Healthy life expectancy at birth (years) by sex and WHO region, 2013 .................................................................................................6
Figure 2.1.9. Life expectancy at age 60 (years) in the African Region, 2013 ...........................................................................................................7
Figure 2.1.10. Life expectancy at age 60 (years) by sex and WHO region 2013..............................................................................................................7
Figure 2.1.11. Life expectancy at age 60 (years) by WHO region, 1990 and 2013 ........................................................................................................7
Figure 2.1.12. Life expectancy at age 60 (years) in the African Region, 1990 and 2013 ........................................................................................8
Figure 2.1.13. Life expectancy at age 60 (years) by sex in the African Region, 2013 ............................................................................................8
2.2. Mortality
Figure 2.2.1. Adult mortality rate per 1000 population in the African Region, 2013 ............................................................................................9
Figure 2.2.2. Adult mortality rate per 1000 population by sex in the African Region, 2013 ....................................................................................9
Figure 2.2.3. Adult mortality rate per 1000 population by sex and WHO region, 2013 .................................................................................................9
Figure 2.2.4. Adult mortality rate per 1000 population by WHO region, 1990 and 2013 .........................................................................................9
Figure 2.2.5. Under-5 mortality rate per 1000 live births in the African Region, 2015 ..........................................................................................10
Figure 2.2.6. Trend in under-5 mortality rate per 1000 live births by WHO region, 1990–2015 ...................................................................................10
Figure 2.2.7. Trend in infant mortality rate per 1000 live births by WHO region, 1990–2015 ...................................................................................10
Figure 2.2.8. Maternal mortality ratio per 100 000 births in the African Region, 1990 and 2015 ......................................................................11
Figure 2.2.9. Adult mortality rate per 1000 population in the African Region, 1990 and 2013 ......................................................................11
Figure 2.2.10. Maternal mortality ratio per 100 000 live births by WHO region, 1990–2015 ...................................................................................11
Figure 2.2.11. Under-5 mortality rate per 1000 live births in the Af rican Region, 1990 and 2015 ...........................................................................12
Figure 2.2.12. Infant mortality rate per 1000 live births in the African Region, 1990 and 2015 ......................................................................12
Figure 2.2.13. Age-standardized death rates per 100 000 population in the African Region, 2000 and 2012 ...................................13
Figure 2.2.14. Age-standardized death rates per 100 000 population due to communicable diseases in the African Region, 2000 and 2012 ......................................................................................................13
Figure 2.2.15. Age-standardized death rates per 100 000 population due to communicable diseases in the African Region, 2012 ..........................................................................................................................14
Figure 2.2.16. Age-standardized death rates per 100 000 population due to noncommunicable diseases in the African Region, 2012 .........................................................................................................14
Figure 2.2.17. Age-standardized death rates per 100 000 population due to injuries and violence in the African Region, 2012 14
Figure 2.2.18. Age-standardized suicide rates per 100 000 population by sex in the African Region, 2012 .........................................15
Figure 2.2.19. Estimated road traffic death rates per 100 000 population in the African Region, 2010 ......................................................15
Figure 2.2.20. Deaths per 100 000 population by WHO region, 2000 and 2012 ......................................................................................................16
Figure 2.2.21. Deaths per 100 000 population by sex and WHO region, 2012...........................................................................................................16
Figure 2.2.22. Deaths per 100 000 population in the age group 0–27 days by sex and WHO region, 2012 ....................................................16
Figure 2.2.23. Deaths per 100 000 population in the age group 70 years and over by sex and WHO region, 2012 ...........................................16
Figure 2.2.24. Deaths per 100 000 population among women, by age group and WHO region, 2012 .................................................................16
Figure 2.2.25. Deaths per 100 000 population among men, by age group and WHO region, 2012 .........................................................................16
Figure 2.2.26. Leading causes of death shown as percentage of total deaths in the African Region, 2000 and 2012 .................................17
Figure 2.2.27. Leading causes of death shown as percentage of female deaths in the African Region, 2000 and 2012.............................17
Figure 2.2.28. Leading causes of death shown as percentage of female deaths in the age group 0–27 days in the African Region, 2000 and 2012 ......................................................................................................18
Figure 2.2.29. Leading causes of death shown as percentage of female deaths in the age group 1–59 months in the African Region, 2000 and 2012 ......................................................................................18
Figure 2.2.30. Leading causes of death shown as percentage of female deaths in the age group 60–69 years in the African Region, 2000 and 2012 ......................................................................................................18
Figure 2.2.31. Leading causes of death shown as percentage of female deaths in the age group 70 years and over in the African Region, 2000 and 2012 ......................................................................................18
Figure 2.2.32. Leading causes of death shown as percentage of male deaths in the African Region, 2000 and 2012 ................................19
Figure 2.2.33. Leading causes of death shown as percentage of male deaths in the age group 0–27 days in the African Region, 2000 and 2012 ......................................................................................................19
Figure 2.2.34. Leading causes of death shown as percentage of male deaths in the age group 1–59 months in the African Region, 2000 and 2012 ......................................................................................................19
Figure 2.2.35. Leading causes of death shown as percentage of male deaths in the age group 60–69 years in the African Region, 2000 and 2012 ......................................................................................................20
Figure 2.2.36. Leading causes of death shown as percentage of male deaths in the age group 70 years and over in the African Region, 2000 and 2012 ......................................................................................20
Figure 2.2.37. Leading group of disorders shown as percentage of male deaths in the African Region, 2000 and 2012 ................................20
Figure 2.2.38. Leading group of disorders shown as percentage of female deaths in the African Region, 2000 and 2012.............................20
2.3. Burden of disease
Figure 2.3.1. Leading causes of burden of diseases shown as percentage of total DALYs in the African Region, 2000 and 2012 .....21
Figure 2.3.2. Distribution of burden of diseases as percentage of total DALYs by broader causes and WHO region, 2012 .........................21
Figure 2.3.3. Distribution of years of life lost by broader causes (%) and WHO region, 2012 ......................................................................................21
Figure 2.3.4. Distribution of burden of diseases as percentage of total DALYs by group of disorders in the African Region, 2000 and 2012 ..........................................................................................................................21
Figure 2.3.5. Total burden of disease in DALYs per 100 000 population by WHO region, 2000 and 2012 ..............................................21
Figure 2.3.6. Distribution of burden of diseases as percentage of total DALYs by broader causes in the African Region, 2012 .................22
Figure 2.3.7. Distribution of years of life lost by broader causes (%) in the African Region, 2012 ..............................................................................22
v
3. Progress on the MDGs
3.0. MDG progress status in the African Region
Figure 3.0.1. Scorecard of the African Region according to the achievement of the MDG target, 2015 ........................................................23
Figure 3.0.2. Scorecard of countries of the African Region according to the achievement of the MDG target, 2015 ......................24
3.1. MDG-4: Reduce child mortality
3.1.1. Target 4.A: Reduce by two thirds, between 1990 and 2015, the under-five mortality rate
Figure 3.1.1.1. Under-5 mortality rate (per 1000 live births) both sexes by WHO region, 1990 and 2015 ..........................................................25
Figure 3.1.1.2. Under-5 mortality rate (per 1000 live births) by country in the African Region, 2015 and the percent reduction,1990–2015 .........................................................................................25
Figure 3.1.1.3. Classification of countries according to the achievement of the MDG target on under-5 mortality in the African Region, 1990 and 2015 ......................................................................25
Figure 3.1.1.4. Percentage of Measles-containing vaccine (MCV) immunization coverage among 1-year-olds, both sexes by WHO region, 1990 and 2014 .......................................................................................26
Figure 3.1.1.5. Percentage of Measles-containing vaccine (MCV) immunization coverage among 1-year-olds by country in the African Region, 2014 and the percent increase, 1990–2014 ...............26
Figure 3.1.1.6. Classification of countries according to the achievement of the MDG target on Measles-containing vaccine coverage (MCV) in the African Region, 2014 .............................................26
3.2. MDG-5: Improve maternal health
3.2.1. Target 5.A: Reduce by three quarters, between 1990 and 2015, the maternal mortality ratio
Figure 3.2.1.1. Maternal mortality ratio (per 100 000 live births) by WHO region, 2015 ...............................................................................................27
Figure 3.2.1.2. Maternal mortality ratio (per 100 000 live births) in the African Region, 2015 and the percent reduction, 1990–2015.....27
Figure 3.2.1.3. Classification of countries according to the achievement of the MDG target on maternal mortality ratio in the African Region, 1990 and 2015 ......................................................................27
Figure 3.2.1.4. Percentage of births attended by skilled (SBA) health personnel by WHO region, 1990–1999, 2007–2014 .................28
Figure 3.2.1.5. Percentage of births attended by skilled (SBA) health personnel in the African Region, 2007–2014 ..............................28
Figure 3.2.1.6. Classification of countries according to the achievement of the MDG target on births attended by skilled health personnel (%) in the African Region, 2007–2014 .......................28
3.2.2. Target 5.B: Achieve, by 2015, universal access to reproductive health
Figure 3.2.2.1. Percentage of Antenatal care coverage-at least one visit (ANC1) by WHO region, 2007–2014.....................................................29
Figure 3.2.2.2. Percentage of Antenatal care coverage-at least one visit (ANC1) in the African Region, 2007–2014 .........................................29
Figure 3.2.2.3. Classification of countries according to the achievement of the MDG target on percentage of Antenatal care coverage-at least one visit (ANC1) in the African Region, 2007–2014 29
Figure 3.2.2.4. Percentage of Unmet need for family planning, by WHO region, 2007–2013 ...................................................................................30
Figure 3.2.2.5. Percentage of Unmet need for family planning in the African Region, 1990–1999, 2007–2013 ..............................................30
Figure 3.2.2.6. Classification of countries according to the achievement of the MDG Target on percentage of Unmet need for family planning in the African Region, 2007–2013 .................................30
3.3. MDG-6: Combat HIV/AIDS, malaria and other
diseases
3.3.1. Target 6.A: Have halted by 2015 and begun to reverse the spread of HIV/AIDS
Figure 3.3.1.2. Incidence of HIV (%) in the African Region, 2014 and Percent reduction in HIV incidence, 2000–2014 ......................................31
Figure 3.3.1.3. Classification of countries according to the achievement of the MDG target on Incidence of HIV (%) in the African Region, 2000–2014 ..............................................................................31
3.3.2. Target 6.B: Achieve, by 2010, universal access to treatment for HIV/AIDS for all those who need it
Figure 3.3.2.1. Percentage of Antiretroviral therapy coverage among people with advanced HIV infection by WHO region, 2007 and 2014 .................................................................................................................32
Figure 3.3.2.2. Percentage of Antiretroviral therapy coverage among people with advanced HIV infection in the African Region, 2014 ..........................................................................................................................32
Figure 3.3.2.3. Classification of countries according to the achievement of the MDG target on Percentage of Antiretroviral therapy coverage among people with advanced HIV infection in the African Region, 2014 ..................................................................................32
3.3.3. Target 6.C: Have halted by 2015 and begun to reverse the incidence of malaria and other major diseases
Figure 3.3.3.1. Percentage of Malaria incidence reduction by WHO region, 2000–2015 ..............................................................................................33
Figure 3.3.3.2. Percentage of children under 5 years of age sleeping under insecticide-treated bed nets and the Percentage of children under 5 years of age with fever being treated with antimalarial drugs in the African Region, 2007–2013 ............................33
Figure 3.3.3.3. Classification of countries according to the achievement of the MDG Target on malaria incidence reduction in the African Region, 2000–2015 ......................................................................33
Figure 3.3.3.4. Percent reduction in mortality rate of tuberculosis among HIVnegative people by WHO region, 1990–2014 .....................34
Figure 3.3.3.5. Tuberculosis mortality rate ( per 100 000 population per year) among HIV-negative people, 2014 and the Percent reduction in mortality rate in the African Region, 1990–2014 ...........34
Figure 3.3.3.6. Classification of countries according to the achievement of the MDG target on Tuberculosis mortality rate ( per 100 000 population per year) among HIV-negative people in the African Region, 1990–2014 ......................................................................34
3.4. MDG-7: Ensure environmental sustainability
3.4.1. Target 7.C: Halve, by 2015, the proportion of people without sustainable access to safe drinking water and basic sanitation
Figure 3.4.1.1. Percent reduction in proportion of population without access to improved drinking water sources by WHO region, 1990–2015 ..............................................................................................35
Figure 3.4.1.2. Percentage of the population using improved drinking water sources in the African Region, 2015, and the Percent reduction, 1990–2015 .......................................................................35
Figure 3.4.1.3. Classification of countries according to the achievement of the MDG target on Percent reduction of population without access to improved drinking water sources in the African Region, 1990–2015 ......................................................................35
Figure 3.4.1.4. Percent reduction in proportion of population without access to improved sanitation facilities by WHO region, 1990–2015 .............................................................................................................36
Figure 3.4.1.5. Percentage of the population using improved sanitation facilities in the African Region, 2015, and the Percent reduction, 1990–2015 ........................................................................................36
vi
Figure 3.4.1.6. Classification of countries according to the achievement of the MDG target on Percent reduction in proportion of population without access to improved sanitation facilities in the African Region, 1990–2015 ................................................36
3.5. MDG-1: Eradicate extreme poverty and hunger
3.5.1. Target 1.C: Halve, between 1990 and 2015, the proportion of people who suffer from hunger
Figure 3.5.1.1. Percent reduction in proportion of underweight children under 5 years of age by WHO region, 1990–2014 ..................37
Figure 3.5.1.2. Percentage of underweight children under 5 years of age in the African Region, 2007–2014 and the Percent reduction,1990–2014 .........................................................................................37
Figure 3.5.1.3. Classification of countries according to the achievement of the MDG target on Percent reduction in proportion of underweight children under 5 years of age in the African Region, 1990–2014 ..............................................................................37
3.6. MDG-2: Achieve Universal Primary Education
3.6.1. Target 2.A: Ensure that, by 2015, children everywhere, boys and girls alike, will be able to complete a full course of primary schooling
Figure 3.6.1.1. Percentage of net enrolment ratio in primary education in the African Region, 2007–2014 and the MDG target 2015 ..........................................................................................................................38
Figure 3.6.1.2. Percentage of literacy rate of 15–24 year-olds in the African Region, 1990–2000 and 2015 ..........................................................38
3.7. MDG-3: Promote gender equality and
empower women
3.7.1. Target 3.A: Eliminate gender disparity in primary and secondary education, preferably by, 2005, and in all levels of education no later than 2015
Figure 3.7.1.1. The gender parity index in percentage of net enrolment ratio in primary education in the African Region, 2007–2014 .............................................................................................................39
Figure 3.7.1.2. Proportion of seats held by women in national parliament in the African Region, 1990 and 2015 ...................................39
3.8. MDG-8: Develop a global partnership for
development
3.8.1. Target 8.D: In cooperation with pharmaceutical companies, provide access to affordable essential drugs
Figure 3.8.1.1. Percentage in Median availability of selected generic medicines, private sector, in the African Region, 2007–2013 40
Figure 3.8.1.2. Percentage in Median availability of selected generic medicines, public sector, in the African Region, 2007–2013 40
Figure 3.8.1.3. Median consumer price ratio of selected generic medicines, private sector, in the African Region, 2007–2013 .............40
Figure 3.8.1.4. Median consumer price ratio of selected generic medicines, public sector, in the African Region, 2007–2013 ...............40
3.8.2. Target 8.A: Develop further an open, rule-based, non-discriminatory trading and financial system
Figure 3.8.2.1. Official development assistance (ODA) received as percentage of GDP by country in the African Region, 2013 ................41
Figure 3.8.2.2. Total debt service as percentage of exports of goods, services and income by country in the African Region, 1990 and 2013 ......................................................................................................41
Figure 3.8.2.3. Trade (% of GDP) in sub-Saharan Africa, 1990–2014 .41
4. The health system
4.1. Health system outcomes
Figure 4.1.1. Antenatal care coverage – at least one visit (in the five years preceding the survey) (%) by educational level in the African Region, 2000–2013 .............................................................................................42
Figure 4.1.2. Antenatal care coverage – at least one visit (in the five years preceding the survey) (%) by place of residence in the African Region, 2000–2013 ..............................................................................42
Figure 4.1.3. Antenatal care coverage – at least one visit (in the five years preceding the survey) (%) by wealth quintile in the African Region, 2000–2013 .............................................................................................43
Figure 4.1.4. Antenatal care coverage – at least four visits (in the five years preceding the survey) (%) by wealth quintile in the African Region, 2000–2013 ..............................................................................43
Figure 4.1.5. Antenatal care coverage – at least four visits (in the five years preceding the survey) (%) by educational level in the African Region, 2000–2013 ..............................................................................44
Figure 4.1.6. Antenatal care coverage – at least four visits (in the five years preceding the survey) (%) by place of residence in the African Region, 2000–2013 ..............................................................................44
Figure 4.1.7. Births attended by skilled health personnel (in the five years preceding the survey) (%) by educational level in the African Region, 2000–2013 ..............................................................................45
Figure 4.1.8. Births attended by skilled health personnel (in the five years preceding the survey) (%) by place of residence in the African Region, 2000–2013 ..............................................................................45
Figure 4.1.9. Births attended by skilled health personnel (in the five years preceding the survey) (%) by wealth quintile in the African Region, 2000–2013 ..............................................................................46
Figure 4.1.10. Diphtheria tetanus toxoid and pertussis (DTP3) immunization coverage among 1-year-olds (%) by wealth quintile in the African Region, 2000–2013 .................................................................46
Figure 4.1.11. Diphtheria tetanus toxoid and pertussis (DTP3) immunization coverage among 1-year-olds (%) by educational level in the African Region, 2000–2013 .......................................................47
Figure 4.1.12. Diphtheria tetanus toxoid and pertussis (DTP3) immunization coverage among 1-year-olds (%) by place of residence in the African Region, 2000–2013 .............................................47
Figure 4.1.13. Diphtheria tetanus toxoid and pertussis (DTP3) immunization coverage among 1-year-olds (%) by sex in the African Region, 2000–2013 ..............................................................................48
Figure 4.1.14. Measles (MCV) immunization coverage among 1-year-olds (%) by sex in the African Region, 2000–2013 .....................48
Figure 4.1.15. Measles (MCV) immunization coverage among 1-year-olds (%) by educational level in the African Region, 2000–2013 .............................................................................................................49
Figure 4.1.16. Measles (MCV) immunization coverage among 1–year-olds (%) by place of residence in the African Region, 2000–2013 .............................................................................................................49
Figure 4.1.17. Measles (MCV) immunization coverage among 1-year-olds (%) by wealth quintile in the African Region, 2000–2013 50
Figure 4.1.18. Demand for family planning satisfied (%) by wealth quintile in the African Region, 2000–2013 .................................................50
Figure 4.1.19. Demand for family planning satisfied (%) by educational level in the African Region, 2000–2013 ..............................51
Figure 4.1.20. Demand for family planning satisfied (%) by place of residence in the African Region, 2000–2013 .............................................51
4.2. Leadership and governance
Figure 4.2.1. Existence of national health policies by year in the African Region, 2015 ..........................................................................................52
Figure 4.2.2. Existence of national health strategic plans by year in the African Region, 2015 ..................................................................................52
Figure 4.2.3. Countries with institutionalised joint annual reviews in the African Region, 2015 ..............................................................................53
vii
Figure 4.2.4. Countries with comprehensive monitoring and evaluation plan in the African Region, 2015 .............................................53
Figure 4.2.5. Health financing strategy in the African Region, 2013 .53
Figure 4.2.6. Status of national health accounts (NHA) in the African Region, 2015 ..........................................................................................53
4.3. Partnership for health development
Figure 4.3.1. Signatory to Compact in the African Region, 2015 .......54
4.4. Health information
Figure 4.4.1. Percentage of civil registration coverage for deaths in the African Region, latest available year .....................................................55
Figure 4.4.2. Percentage of civil registration coverage for births in the African Region, 2007–2013 ......................................................................55
Figure 4.4.3. Distribution of censuses carried out in the last three census round in the African Region, 1985–1994, 1995–2004 and 2005–2014 .............................................................................................................55
Figure 4.4.4. Availability of census data in African Region, 2005–2014 .............................................................................................................55
4.5. Research
Figure 4.5.1. Availability of national health research policy in the African Region, 2014 ..........................................................................................58
Figure 4.5.2. Availability of national strategic plan for health research in the African Region, 2014 ............................................................58
Figure 4.5.3. Availability of health research programme in the African Region, 2014 ..........................................................................................58
Figure 4.5.4. Availability of health research law in African Region, 2014 ..........................................................................................................................58
4.6. Health financing
Figure 4.6.1. Total health expenditure as percentage of GDP in the African Region, 1995 and 2013 ......................................................................59
Figure 4.6.2. Total health expenditure as percentage of GDP in the African Region, 2013 ..........................................................................................59
Figure 4.6.3. Trend in average of total expenditure on health as percentage of GDP in the African Region, 1995.to 2013 ......................59
Figure 4.6.4. Average of total expenditure on health as percentage of GDP by WHO region, 1995 and 2013 ......................................................59
Figure 4.6.5. General government health expenditure as percentage of GDP in the African Region, 1995 and 2013 ...................60
Figure 4.6.6. General government health expenditure as percentage of GDP in the African Region, 2013 .......................................60
Figure 4.6.7. Total health expenditure per capita (PPP int. $) in the African Region, 1995 and 2013 ......................................................................61
Figure 4.6.8. Total health expenditure per capita (PPP int. $) in the African Region, 2011 ..........................................................................................61
Figure 4.6.9. Trend in average total health expenditure per capita (PPP int. $) in the African Region, 1995–2013 ...........................................61
Figure 4.6.10. Average total health expenditure per capita (PPP int. $) by WHO region, 1995 and 2013.................................................................61
Figure 4.6.11. Total health expenditure per capita at exchange rate in the African Region, 1995 and 2013 ..........................................................62
Figure 4.6.12. Total health expenditure per capita at exchange rate in the African Region, 2013 ..............................................................................62
Figure 4.6.13. Trend in average total health expenditure per capita at exchange rate in the African Region, 1995–2013 ...............................62
Figure 4.6.14. Average total health expenditure per capita at exchange rate by WHO Region, 1995 and 2013 .......................................62
Figure 4.6.15. General government health expenditure per capita (PPP int. $) in the African Region, 1995 and 2013....................................63
Figure 4.6.16. General government health expenditure per capita (PPP int. $) in the African Region, 2013 .......................................................63
Figure 4.6.17. Trend in average general government health expenditure per capita (PPP int. $) in the African Region, 1995–2013 63
Figure 4.6.18. Average of general government health expenditure per capita (PPP int. $) by WHO region, 1995 and 2013 ..........................63
Figure 4.6.19. General government health expenditure as percentage of general government expenditure in the African Region, 1995 and 2013 ......................................................................................64
Figure 4.6.20. General government health expenditure as percentage of general government expenditure in the African Region, 2013 .........................................................................................................64
Figure 4.6.21. Trend in average general government health expenditure as percentage of general government expenditure in the African Region, 1995–2013 ......................................................................64
Figure 4.6.22. Average of general government health expenditure as percentage of general government expenditure by WHO region, 1995 and 2013 .......................................................................................64
Figure 4.6.23. General government health expenditure as percentage of total health expenditure in the African Region, 1995 and 2013 ......................................................................................................65
Figure 4.6.24. General government health expenditure as percentage of total heath expenditure in the African Region, 2013 65
Figure 4.6.25. Trend in average general government health expenditure as percentage of general government expenditure in the African Region, 1995–2013 ......................................................................65
Figure 4.6.26. Average of general government health expenditure as percentage of total health expenditure by WHO region, 1995 and 2013 .................................................................................................................65
Figure 4.6.27. External resources on health as percentage of total health expenditure in the African Region, 1995 and 2013 ..................66
Figure 4.6.28. External resources on health as percentage of total health expenditure in the African Region, 2013 ......................................66
Figure 4.6.29. Trend in average of external resources on health as percentage of total health expenditure in the African Region, 1995–2013 .............................................................................................................66
Figure 4.6.30. Average of external resources on health as percentage of total health expenditure by WHO region, 1995 and 2013 ..........................................................................................................................66
Figure 4.6.31. Out-of-pocket expenditure as percentage of total health expenditure in the African Region, 1995 and 2013 ..................67
Figure 4.6.32. Out-of-pocket expenditure as percentage of total health expenditure in the African Region, 2013 ......................................67
Figure 4.6.33. Trend in average of out-of-pocket expenditure as percentage of total health expenditure in the African Region, 1995–2013 .............................................................................................................67
Figure 4.6.34. Average of out-of-pocket expenditure as percentage of total health expenditure by WHO region, 1995 and 2013 ..........................................................................................................................67
4.7. Service delivery
Figure 4.7.1. Treatment success rate for retreatment tuberculosis cases by income group of countries in the African Region, 2011 ......68
Figure 4.7.2. Treatment success rate for new pulmonary smear-negative and extrapulmonary tuberculosis cases by income group of countries in the African Region, 2011 .....................................................68
Figure 4.7.3. Smear-positive tuberculosis treatment success rate (%) by income group of countries in the African Region, 2011 ..........68
4.8. Health workforce
Figure 4.8.1. Physician-to-population ratio (per 10 000 population) in the African Region, 2007–2013 .................................................................69
Figure 4.8.2. Physician-to-population ratio (per 10 000 population) by WHO region, 2007–2013 .............................................................................69
Figure 4.8.3. Nursing and midwifery personnel-to-population ratio (per 10 000 population) in the African Region, 2007–2013 .................69
Figure 4.8.4. Nursing and midwifery personnel-to-population ratio (per 10 000 population) by WHO region, 2007–2013 ............................69
viii

Figure 4.8.5. Dentistry personnel density (per 10 000 population) in the African Region, 2007–2013 .................................................................70
Figure 4.8.6. Dentistry personnel density (per 10 000 population) by WHO region, 2007–2013 .............................................................................70
Figure 4.8.7. Pharmaceutical personnel density (per 10 000 population) in the African Region, 2007–2013 .........................................70
Figure 4.8.8. Pharmaceutical personnel density (per 10 000 population) in the African Region, 2007–2013 .........................................70
Figure 4.8.9. Laboratory health workers density (per 10 000 population) in the African Region, 2005–2013 .........................................71
Figure 4.8.10. Environmental and public health workers density (per 10 000 population) in the African Region, 2005–2013 .................71
Figure 4.8.11. Community and traditional health workers density (per 1000 population) in the African Region, 2005–2013 ....................71
Figure 4.8.12. Other health workers density (per 1000 population) in the African Region, 2005–2013 .................................................................71
4.9. Medical products, vaccines, infrastructures
and equipment
Figure 4.9.1. Availability of national list of approved medical devices for procurement or reimbursement in the African Region, 2013 ..........................................................................................................................72
Figure 4.9.2. Availability of technical specifications of medical devices to support procurement or donations in the African Region, 2013 .........................................................................................................72
Figure 4.9.3. Presence of Unit in the Ministry of Health responsible for the management of medical devices in the African Region, 2013 72
Figure 4.9.4. Availability of national standards or recommended lists of medical devices in the African Region, 2013 ...............................72
Figure 4.9.5. Median percentage availability of selected generic medicines in a sample of health facilities, countries with data in the African Region, 2007–2013 ......................................................................73
Figure 4.9.6. Median consumer price ratio of selected generic medicines (ratio of median local unit price to management sciences for health international reference price), countries with data in the African Region, 2007–2013 .......................................................73
Figure 4.9.7. Psychiatric beds (per 100 000 population) by WHO region, 2014...........................................................................................................74
Figure 4.9.8. Psychiatric beds (per 100 000 population) in the African Region, 2014 ..........................................................................................74
Figure 4.9.9. Radiotherapy units (per million population) by WHO region, 2013...........................................................................................................74
Figure 4.9.10. Radiotherapy units (per million population) in the African Region, 2013 ..........................................................................................74
Figure 4.9.11. Density of mammographs in 2013 (per million females aged between 50 and 69 years old) in the African Region ..75
Figure 4.9.12. Density of computed tomography units (per million population) in the African Region, 2013 .....................................................75
Figure 4.9.13. Density of magnetic resonance imaging units (per million population) in the African Region, 2013 ......................................75
Figure 4.9.14. Density of linear accelerator units (per million population) in the African Region, 2013 .....................................................75
Figure 4.9.15. Density of gamma camera or nuclear medicine units (per million population) in the African Region, 2013 .............................76
Figure 4.9.16. Density of hospitals (per 100 000 population) in the African Region, 2013 ..........................................................................................76
Figure 4.9.17. Density of health posts (per 100 000 population) in the African Region, 2013 ..................................................................................76
Figure 4.9.18. Density of provincial hospitals (per 100 000 population) in the African Region, 2013 .....................................................76
Figure 4.9.19. Density of health centres (per 100 000 population) in the African Region, 2013 ..............................................................................77
Figure 4.9.20. Density of district/rural hospitals (per 100 000 population) in the African Region, 2013 .....................................................77
4.10. Universal coverage
Figure 4.10.1. Out-of-pocket expenditure as percentage of private health expenditure in the African Region, 1995 and 2013 ..................78
Figure 4.10.2. Out-of-pocket expenditure as percentage of private health expenditure in the African Region, 2013 ......................................78
Figure 4.10.3. Trend in average of out-of-pocket expenditure as percentage of private health expenditure in the African Region, 1995–2013 .............................................................................................................78
Figure 4.10.4. Average of out-of-pocket expenditure as percentage of private health expenditure by WHO region, 1995 and 2013 .................................................................................................................78
Figure 4.10.5. Private health expenditure as percentage of total health expenditure in the African Region, 1995 and 2013 ..................79
Figure 4.10.6. Private health expenditure as percentage of total health expenditure in the African Region, 2013 ......................................79
Figure 4.10.7. Trend in average of out-of-pocket expenditure as percentage of private health expenditure in the African Region, 1995–2013 .............................................................................................................79
Figure 4.10.8. Average of private health expenditure as percentage of total health expenditure by WHO Region, 1995 and 2013 ..........................................................................................................................79
Figure 4.10.9. Satisfied need for family planning (%) in the African Region, 2005-2014 ..............................................................................................80
Figure 4.10.10. Expenditures for health as a proportion of total per person expenditure in the African Region, 2009 .....................................81
Figure 4.10.11. Number of outpatient visits per person per year in the African Region, 2009-2014 .......................................................................81
Figure 4.10.12. Proportion of people with hypertension receiving antihypertensive treatment in the African Region, 2005-2015 ..........81
Figure 4.10.13. Persons protected from out-of-pocket expenditures through a prepayment scheme in the African Region, 2006-2015 ..............................................................................................82
5. Specific programmes and services
5.1. HIV/AIDS
Figure 5.1.1. HIV/AIDS mortality rate (per 100 000 population) in the African Region, 2013 ..................................................................................83
Figure 5.1.2. HIV prevalence rate (%) in the African Region, 2000 and 2014 .................................................................................................................83
Figure 5.1.3. HIV/AIDS mortality rate (per 100 000 population) by WHO Region, 2001 and 2013 ..........................................................................83
Figure 5.1.4. Prevalence of HIV (per 100 000 population) by WHO region, 2001 and 2013 .......................................................................................83
Figure 5.1.5. HIV/AIDS incidence rate (per 100 000 population) in the African Region, 2013 ..................................................................................84
Figure 5.1.6. HIV/AIDS incidence rate (%) in the African Region, 2000 and 2014 ......................................................................................................84
Figure 5.1.7. HIV/AIDS incidence rate (per 100 000 population) by WHO Region, 2001 and 2013 ..........................................................................84
Figure 5.1.8. People with advanced HIV infection receiving antiretroviral (ARV) combination therapy (%) in the African Region, 2014 .........................................................................................................85
Figure 5.1.9. People aged 15 years and over who received HIV testing and counseilling (per 1000 adult population) in the African Region, 2013 .........................................................................................................85
Figure 5.1.10. People with advanced HIV infection receiving antiretroviral (ARV) combination (%) by WHO region, 2013................85
Figure 5.1.11. Prevalence of condom use by adults aged 15–49 years during higher-risk sex (%), by sex in the African Region, 2007–2013 .............................................................................................................86
Figure 5.1.12. Population aged 15–24 years with comprehensive knowledge of HIV/AIDS (%) by sex in the African Region, 2007–2013 86
Figure 5.1.13. Disability adjusted life years (DALY) due to HIV/AIDS (per 100 000 population) by WHO region, 2000 and 2012 ...................87
ix
Figure 5.1.14. Disability adjusted life years (DALY) due to HIV/AIDS (per 100 000 population) by sex and WHO region, 2012 ......................87
Figure 5.1.15. Disability adjusted life years (DALY) due to HIV/AIDS (per 100 000 population) among women, by age group and by WHO region, 2012 ...............................................................................................87
Figure 5.1.16. Disability adjusted life years (DALY) due to HIV/AIDS (per 100 000 population) among men, by age group and by WHO region, 2012...........................................................................................................87
5.2. Tuberculosis
Figure 5.2.1. Tuberculosis mortality rate (per 100 000 population per year) among HIV-negative people in the African Region, 1990 and 2014 .................................................................................................................88
Figure 5.2.2. Tuberculosis incidence rate (per 100 000 population per year) in the African Region, 1990 and 2014 .......................................88
Figure 5.2.3. Tuberculosis prevalence (per 100 000 population per year) in the African Region, 2014 ...................................................................89
Figure 5.2.4. Tuberculosis prevalence (per 100 000 population per year) in the African Region, 1990 and 2014 ...............................................89
Figure 5.2.5. Tuberculosis prevalence (per 100 000 population per year) by WHO region, 2007 and 2014 ..........................................................89
Figure 5.2.6. Trend in tuberculosis prevalence (per 100 000 population per year) in the African Region, 2007–2014 .......................89
Figure 5.2.7. Case-detection rate for all forms of tuberculosis (%) in the African Region, 2014 ..................................................................................90
Figure 5.2.8. Case-detection rate for all forms of tuberculosis (%) in the African Region, 1990 and 2014 ...............................................................90
Figure 5.2.9. Case-detection rate for all forms of tuberculosis (%) by WHO region, 2000 and 2014 .....................................................................90
Figure 5.2.10. Trend in case-detection rate for all forms of tuberculosis (%) in the African Region, 2000–2014 ................................90
Figure 5.2.11. Treatment success rate for new tuberculosis cases (%) in the African Region, 2013 ......................................................................91
Figure 5.2.12. Treatment success rate for new tuberculosis cases (%) in the African Region, 2000 and 2013 ..................................................91
Figure 5.2.13. Treatment success rate for new tuberculosis cases (%) by WHO Region, 2000 and 2013 .............................................................91
Figure 5.2.14. Trend in treatment success rate for new tuberculosis cases (%) in the African Region, 1995–2013 ..............................................91
Figure 5.2.15. Disability adjusted life years (DALY) due to tuberculosis (per 100 000 population) by WHO region, 2000 and 2012 ..........................................................................................................................92
Figure 5.2.16. Disability adjusted life years (DALY) due to tuberculosis (per 100 000 population) by sex and WHO region, 2012 92
Figure 5.2.17. Disability adjusted life years (DALY) due to tuberculosis (per 100 000 population) among women, by age group and by WHO region, 2012 ...................................................................92
Figure 5.2.18. Disability adjusted life years (DALY) due to tuberculosis (per 100 000 population) among men, by age group and by WHO region, 2012 ................................................................................92
5.3. Malaria
Figure 5.3.1. Malaria mortality rate (per 100 000 population) in the African Region, 2012 ..........................................................................................93
Figure 5.3.2. Reported cases of malaria (in thousands) in the African Region, 2014 ..........................................................................................93
Figure 5.3.3. Malaria mortality rate (per 100 000 population) by WHO region, 2012 ...............................................................................................93
Figure 5.3.4. Trend in presumed and confirmedmalaria cases (in million) in the African Region, 2000–2014 .................................................93
Figure 5.3.5. Malaria incidence rate (per 100 000 population) in the African Region, 2012 ..........................................................................................94
Figure 5.3.6. Children under 5 years of age with fever being treated with antimalarial drugs (%) in the African Region, 2007–2013 .............................................................................................................94
Figure 5.3.7. Malaria incidence rate (per 100 000 population) by WHO region, 2012 ...............................................................................................94
Figure 5.3.8. Children under 5 years of age sleeping under insecticide-treated bed nets (%) in the African Region, 2007–2013 95
Figure 5.3.9. Number of insecticide classes to which resistance was reported in the African Region, 2013 and 2005 .......................................95
Figure 5.3.10. Disability adjusted life years (DALY) due to malaria (per 100 000 population) by WHO Region, 2000 and 2012..................96
Figure 5.3.11. Disability adjusted life years (DALY) due to malaria (per 100 000 population) by sex and WHO Region, 2012 .....................96
Figure 5.3.12. Disability adjusted life years (DALY) due to malaria (per 100 000 population) among women, by age group and by WHO region, 2012 ...............................................................................................96
Figure 5.3.13. Disability adjusted life years (DALY) due to malaria (per 100 000 population) among men, by age group and by WHO region, 2012...........................................................................................................96
5.4. Immunization and vaccines
Figure 5.4.1. BCG immunization coverage among 1-year-olds (%) in the African Region, 2014 ..............................................................................97
Figure 5.4.2. BCG immunization coverage among 1-year-olds (%) by WHO region, 1990 and 2014 .....................................................................97
Figure 5.4.3. BCG immunization coverage among 1-year-olds (%) in the African Region, 1980–2014 .................................................................97
Figure 5.4.4. BCG immunization coverage among 1-year-olds (%) in the African Region, 1990 and 2014 ..........................................................97
Figure 5.4.5. Neonates protected at birth against neonatal tetanus (PAB) (%) in the African Region, 2014...........................................................98
Figure 5.4.6. Neonates protected at birth against neonatal tetanus (PAB) (%) by WHO region, 1990 and 2014 ..................................................98
Figure 5.4.7. Neonates protected at birth against neonatal tetanus (PAB) (%) in the African Region, 1980 to 2014 ..........................................98
Figure 5.4.8. Neonates protected at birth against neonatal tetanus (PAB) (%) in the African Region, 1990 and 2014 .......................................98
Figure 5.4.9. Diphteria tetanus toxoid and pertussis third dose (DTP3) immunization coverage among 1-year-olds (%) in the African Region, 2014 ..........................................................................................99
Figure 5.4.10. Diphteria tetanus toxoid and pertussis third dose (DTP3) immunization coverage among 1-year-olds (%) by WHO region, 1990 and 2014 .......................................................................................99
Figure 5.4.11. Diphteria tetanus toxoid and pertussis third dose (DTP3) immunization coverage among 1-year-olds (%) by WHO region, 1980 to 2014 ..........................................................................................99
Figure 5.4.12. Diphteria tetanus toxoid and pertussis third dose (DTP3) immunization coverage among 1-year-olds (%) in the African Region, 1990 and 2014 ......................................................................99
Figure 5.4.13. Polio third dose (Pol3) immunization coverage among 1-year-olds (%) in the African Region, 2014 ............................ 100
Figure 5.4.14. Polio third dose (Pol3) immunization coverage among 1-year-olds (%) by WHO region, 1990 and 2014 .................... 100
Figure 5.4.15. Polio third dose (Pol3) immunization coverage among 1-year-olds (%) in the African Region, 1980–2014 ................ 100
Figure 5.4.16. Polio third dose (Pol3) immunization coverage among 1-year-olds (%) in the African Region, 1990 and 2014 ........ 100
Figure 5.4.17. Measles-containing vaccine (MCV) immunization coverage among 1-year-olds (%) in the African Region, 2014 .........101
Figure 5.4.18. Measles-containing vaccine (MCV) immunization coverage among 1-year-olds (%) by WHO region, 1990 and 2014 101
Figure 5.4.19. Measles-containing vaccine (MCV) immunization coverage among 1-year-olds (%) in the African Region, 1980 to 2014 .......................................................................................................................101
Figure 5.4.20. Measles-containing vaccine (MCV) immunization coverage among 1-year-olds (%) in the African Region, 1990 and 2014 .......................................................................................................................101
x
Figure 5.4.21. Haemophilus influenzae B third dose (Hib3) immunization coverage 1-year-olds (%) in the African Region, 2014 102
Figure 5.4.22. Haemophilus influenzae B third dose (Hib3) immunization coverage 1-year-olds (%) by WHO region, 2010 and 2014 .......................................................................................................................102
Figure 5.4.23. Haemophilus influenzae B third dose (Hib3) immunization coverage 1-year-olds (%) in the African Region, 2000 to 2014 ......................................................................................................102
Figure 5.4.24. Haemophilus influenzae B third dose (Hib3) immunization coverage 1-year-olds (%) in the African Region, 2010 and 2014 ...................................................................................................102
Figure 5.4.25. Hepatitis B third dose (HepB3) immunization coverage 1-year-olds (%) in the African Region, 2014 ........................103
Figure 5.4.26. Hepatitis B third dose (HepB3) immunization coverage 1-year-olds (%) by WHO region, 2010 and 2014 ................103
Figure 5.4.27. Hepatitis B third dose (HepB3) immunization coverage 1-year-olds (%) in the African Region, 2000 to 2014 ........103
Figure 5.4.28. Hepatitis B third dose (HepB3) immunization coverage 1-year-olds (%) in the African Region, 2000 and 2014 ....103
5.5. Child and adolescent health
Figure 5.5.1. Causes of death among children aged <5 years in the African Region, 2000 .......................................................................................104
Figure 5.5.2. Causes of death among children aged <5 years in the African Region, 2013 .......................................................................................104
Figure 5.5.3. Under-five mortality rate vs neonatal mortality rate, both sexes, in the African Region, 1990–2015 ....................................... 104
Figure 5.5.4. Under-five mortality rate (deaths per 1 000 live births) both sexes by WHO region, 1990–2015 ................................................... 104
Figure 5.5.5. Under-five mortality rate (deaths per 1 000 live births), both sexes in the African Region, 1990 ..................................... 105
Figure 5.5.6. Under-five mortality rate (deaths per 1 000 live births), both sexes in the African Region, 2015 ..................................... 105
Figure 5.5.7. Under-five mortality rate (deaths per 1 000 live births) and average annual rate of reduction (AARR) in the African Region, 1990 and 2015 ...................................................................................105
Figure 5.5.8. Children <6 months who are exclusively breastfed (%) in the African Region, 2013 ................................................................... 106
Figure 5.5.9. Children <6 months who are exclusively breastfed (%) in the African Region, 2009–2013 ....................................................... 106
Figure 5.5.10. Early initiation of breastfeeding (%) in the African Region, 2013 ......................................................................................................106
Figure 5.5.11. Early initiation of breastfeeding (%) in the African Region, 2009–2013 ..........................................................................................106
Figure 5.5.12. Complementary feed (% of children 6–8 months who are introduced to solid, semi-solid or soft foods) in the African Region, 2013 .......................................................................................107
Figure 5.5.13. Complementary feed (% of children 6–8 months who are introduced to solid, semi-solid or soft foods) in the African Region, 2009–2013 ........................................................................... 107
Figure 5.5.14. Vitamin A supplementation coverage rate (% of children ages 6–59 months) in the African Region, 2014 ..................107
Figure 5.5.15. Vitamin A supplementation coverage rate (% of children ages 6–59 months) in the African Region, 2007–2014 ......107
Figure 5.5.16. Trend in Vitamin A supplementation coverage rate (% of children ages 6–59 months) in the African Region, 2002–2013 ..........................................................................................................107
Figure 5.5.17. Children aged <5 years with ARI symptoms taken to a health facility (%) in the African Region, 2014....................................108
Figure 5.5.18. Children aged <5 years with ARI symptoms taken to a health facility (%) in the African Region, 2007–2014 ....................... 108
Figure 5.5.19. Children aged <5 years with ARI symptoms who took antibiotic treatment (%) in the African Region, 2014................ 108
Figure 5.5.20. Children aged <5 years with ARI symptoms who took antibiotic treatment (%) in the African Region, 2014................ 108
Figure 5.5.21. Children aged <5 years with diarrhoea receiving ORT (%) in the African Region, 2014 .......................................................... 109
Figure 5.5.22. Children aged <5 years with diarrhoea receiving ORT (%) in the African Region, 2009–2014 ............................................. 109
Figure 5.5.23. Children aged <5 years with fever who received treatment with any antimalarial (%) in the African Region, 2013 ...109
Figure 5.5.24. Children aged <5 years with fever who received treatment with any antimalarial (%) in the African Region, 2009–2014 ..........................................................................................................109
Figure 5.5.25. Children aged <5 years underweight (malnutrition prevalence, weight for age) (%) in the African Region, 2013 ........... 110
Figure 5.5.26. Children aged <5 years underweight (malnutrition prevalence, weight for age) (%) by sex in the African Region, 2014 110
Figure 5.5.27. Low-birthweight babies (%), sub-Saharan Africa, 2005–2013 ..........................................................................................................110
Figure 5.5.28. Adolescent fertility rate (per 1000 girls aged 15–19 years) in the African Region, 2008–2012 ................................................. 111
Figure 5.5.29. Adolescent fertility rate (per 1000 girls aged 15–19 years) in the African Region, 2008–2012 ................................................. 111
Figure 5.5.30. Unmet need for family planning among girls aged 15–19 (%) in the African Region, 2004–2011 ......................................... 111
Figure 5.5.31. Unmet need for family planning among girls aged 15–19 (%) in the African Region, 2004–2011 ......................................... 111
Figure 5.5.32. HIV Prevalence among young men (15–24) in the African Region, 2014 .......................................................................................112
Figure 5.5.33. HIV Prevalence among young women (15–24) in the African Region, 2014 .......................................................................................112
Figure 5.5.34. HIV Prevalence among young people (15–24) by sex in the African Region, 1990–2014 .............................................................. 112
Figure 5.5.35. HIV Prevalence among young people (15–24) by sex in the African Region, 2014 ........................................................................... 112
5.6. Maternal and newborn health
Figure 5.6.1. Main causes of maternal death in sub-Saharan Africa, 2010 .......................................................................................................................113
Figure 5.6.2. Births attended by skilled health personnel in the African Region (%), 1990–1999 and 2007–2014 ................................... 113
Figure 5.6.3. Main causes of maternal death, sub-Saharan Africa, 2013 .......................................................................................................................113
Figure 5.6.4. Births attended by skilled health personnel (%) by WHO region, 1990–1999 and 2007–2014 ................................................ 113
Figure 5.6.5. Lifetime risk of maternal death (1 in N) by WHO region, 2015........................................................................................................113
Figure 5.6.6. Maternal mortality ratio (death per 100 000 live births) in the African Region, 1990 and 2015 ......................................... 114
Figure 5.6.7. Change in maternal mortality ratio and Average annual rate of reduction (AARR) in the African Region, 1990–2015 114
Figure 5.6.8. Maternal mortality ratio (death per 100 000 live births) in the African Region, 1990 ............................................................ 115
Figure 5.6.9. Maternal mortality ratio (death per 100 000 live births) in the African Region, 2015 ............................................................ 115
Figure 5.6.10. Maternal mortality ratio (death per 100 000 live births) by WHO region, 1990–2015 ............................................................ 115
Figure 5.6.11. Maternal mortality ratio vs Neonatal mortality rate in the African Region, 1990–2015 .............................................................. 115
Figure 5.6.12. Percentage change in maternal mortality ratio and Average annual rate of reduction (AARR) by WHO region, 1990–2015 ..........................................................................................................115
Figure 5.6.13. Percentage of births by caesarean section (C-section rate) in the African Region, 2013 ................................................................ 116
Figure 5.6.14. Percentage of births by caesarean section (C-section rate) in the African Region, 2005–2013 .................................................... 116
Figure 5.6.15. Percentage of births by caesarean section (C-section rate) by WHO region, 2007–2014................................................................ 116
xi

Figure 5.6.16. Stillbirth rate (per 1000 total births) in the African Region, 2009 ......................................................................................................117
Figure 5.6.17. Stillbirth rate (per 1000 total births) in the African Region, 2009 ......................................................................................................117
Figure 5.6.18. Stillbirth rate (per 1000 total births) by WHO region, 2009 .......................................................................................................................117
Figure 5.6.19. Antenatal care coverage – at least one visit (ANC1) (%) in the African Region, 2005–2013 ....................................................... 118
Figure 5.6.20. Antenatal care coverage – at least four visits (ANC4) (%) in the African Region, 2005–2013 ....................................................... 118
Figure 5.6.21. Antenatal care coverage – at least one visit (ANC1) (%) by WHO region, 2007–2014 .................................................................. 118
Figure 5.6.22. Antenatal care coverage – at least four visits (ANC4) (%) by WHO Region, 2007–2014 ................................................................. 118
Figure 5.6.23. Pregnant women who received 2+ doses of IPTp* for malaria during pregnancy (%) in the African Region, 2005–2014 119
Figure 5.6.24. Postnatal care visit within two days of child-birth (%) in the African Region, 2005–2011 .............................................................. 119
Figure 5.6.25. Postnatal care visit within two days of child-birth (%) by WHO region, 2005–2011 .......................................................................... 119
Figure 5.6.26. Pregnant women with HIV receiving antiretrovirals to prevent mother-to-child transmission (PMTCT) (%) in the African Region, 2013 .......................................................................................120
Figure 5.6.27. Pregnant women with HIV receiving antiretrovirals to prevent mother-to-child transmission (PMTCT) (%) in the African Region, 2005 and 2013 ................................................................... 120
Figure 5.6.28. Pregnant women with HIV receiving antiretrovirals to prevent mother-to-child transmission (PMTCT) (%) by WHO region, 2013........................................................................................................120
Figure 5.6.29. Existence of the national reproductive, maternal, newborn and child health (RMNCH) scorecard in the African Region, 2015 ......................................................................................................121
Figure 5.6.30. Coverage of reproductive, maternal, newborn and child health (RMNCH) interventions across the continuum of care in the African Region, 2014 ........................................................................... 121
5.7. Gender and women’s health
Figure 5.7.1. Contraceptive prevalence rate (in % of women ages 15–49) in the African Region, 2013 ............................................................ 122
Figure 5.7.2. Contraceptive prevalence rate (in % of women ages 15–49) in the African Region, 2007–2013 ................................................ 122
Figure 5.7.3. Contraceptive prevalence rate (in % of women ages 15–49) by WHO region, 2007–2013 ........................................................... 122
Figure 5.7.4. Unmet need for family planning ( married women ages 15–49) (%) in the African Region, 2013 .......................................... 123
Figure 5.7.5. Unmet need for family planning ( married women ages 15–49) (%) in the African Region, 2007–2013 .............................. 123
Figure 5.7.6. Unmet need for family planning ( married women ages 15–49) (%) by WHO region, 2007–2013 ......................................... 123
Figure 5.7.7. Total fertility rate (per woman) in the African Region, 2013 .......................................................................................................................124
Figure 5.7.8. Total fertility rate (per woman) in the African Region, 1990 and 2013 ...................................................................................................124
Figure 5.7.9. Total fertility rate (per woman) by WHO region, 1990 and 2013 ..............................................................................................................124
Figure 5.7.10. Age standardized incidence rate of cervical cancer (per 100 000 population) in the African Region, 2012 ........................ 125
Figure 5.7.11. Age standardized incidence rate of cervical cancer (per 100 000 population) in the African Region, 2008 and 2012 ....125
Figure 5.7.12. Age standardized incidence rate of cervical cancer (per 100 000 population) by WHO region, 2008 and 2012 ................125
Figure 5.7.13. Prevalence of Femal genital mutilation/Cutting (FGM/C) among girls (%) in the African Region, 2005–2013 ............126
Figure 5.7.14. Prevalence of Female genital mutilation/Cutting (FGM/C) among women (%) in the African Region, 2005–2013 .....126
Figure 5.7.15. Women aged 20–24 that were married before the age of 18 (%) in the African Region, 2005–2013 ................................... 126
Figure 5.7.16. Proportion of seats held by women in national parliaments (%) in the African Region, 2014 .......................................... 127
Figure 5.7.17. Proportion of seats held by women in national parliaments (%) in the African Region, 2000 and 2014 ...................... 127
Figure 5.7.18. Proportion of seats held by women in national parliaments (%) in the African Region, 1997–2014 .............................. 127
Figure 5.7.19. Households with a female head (%) in the African Region, 1994–2013 ..........................................................................................128
Figure 5.7.20. Households with a female head (%) in the African Region, 2013 ......................................................................................................128
Figure 5.7.21. Share of women in wage employment in the nonagricultural sector (% of total nonagricultural employment) in the African Region, 1990–2013 ................................................................... 128
Figure 5.7.22. Share of women in wage employment in the non-agricultural sector (% of total nonagricultural employment) in the African Region, 1990–2013 ........................................................................... 128
5.8. Ageing
Figure 5.8.1. Life expectancy at age 60 (years) by sex in the African Region, 2013 ......................................................................................................129
Figure 5.8.2. Life expectancy at age 60 (years) in the African Region, 2013 ......................................................................................................129
Figure 5.8.3. Life expectancy at age 60 (years) by sex in the African Region, 1990–2013 ..........................................................................................129
Figure 5.8.4. Life expectancy at age 60 (years) both sexes by WHO region, 1990–2013 ...........................................................................................129
Figure 5.8.5. Population 60+ years (%) in the African Region in 2013 .......................................................................................................................130
Figure 5.8.6. Population 60+ years (%) in the African Region in 2013 .......................................................................................................................130
Figure 5.8.7. Sex ratio in 60+ age group (men/100 women) in the African Region, 2012 .......................................................................................130
5.9. Epidemic and pandemic-prone diseases
5.9.1. H influenza type B meningitis
Figure 5.9.1.1. Age-standardized death rate due to H influenza type B meningitis per 100 000 by sex in the African Region, 2013 131
Figure 5.9.1.2. Age-standardized DALY rate due to H influenza type B meningitis per 100 000 in the African Region, 1990 and 2013 .... 131
5.9.2. Pneumococcal meningitis
Figure 5.9.2.1. Age-standardized death rate due to pneumococcal meningitis per 100 000 by sex in the African Region, 2013 .............. 132
Figure 5.9.2.2. Age-standardized DALY rate due to pneumococcal meningitis per 100 000 in the African Region, 1990 and 2013 ........ 132
5.9.3. Meningococcal meningitis
Figure 5.9.3.1. Age-standardized death rate due to meningococcal meningitis per 100 000 by sex in the African Region, 2013 .............. 133
Figure 5.9.3.2. Age-standardized DALY rate due to meningococcal meningitis per 100 000 in the African Region, 1990 and 2013 ........ 133
5.10. Neglected tropical diseases
Figure 5.10.1. Number of reported cases of leprosy in the African Region, 2014 ......................................................................................................134
Figure 5.10.2. Number of reported cases of leprosy in the African Region, 2005 and 2014 ...................................................................................134
Figure 5.10.3. Number of reported cases of leprosy by WHO region, 2013........................................................................................................134
Figure 5.10.4. Trend in number of reported cases of leprosy (in thousands) in the African Region, 2000–2014 ....................................... 134
Figure 5.10.5. Status of endemicity for blinding trachoma in the African Region, 2012 .......................................................................................135
xii
Figure 5.10.6. Dracunculiasis certification status of countries in the African Region, beginning of 2015 ............................................................ 135
Figure 5.10.7. Annual incidence of dracunculiasis cases in the African Region, 2014 .......................................................................................136
Figure 5.10.8. Number of new reported cases of Buruli ulcer in the African Region, 2014 .......................................................................................136
Figure 5.10.9. Distribution of human african trypanosomiasis (caused by Trypanosoma brucei gambiense) in the African Region, 2014 .......................................................................................................................137
Figure 5.10.10. Distribution of human african trypanosomiasis (caused by Trypanosoma brucei rhodesiense) in the African Region, 2014 ......................................................................................................137
5.11. Noncommunicable diseases and conditions
Figure 5.11.1. Distribution of causes of noncommunicable burden of diseases (percentage of total DALYs) in the African Region, 2000 and 2012 ..............................................................................................................138
Figure 5.11.2. Distribution of causes of neuropsychiatric burden of diseases (percentage of total DALYs) in the African Region, 2000 and 2012 ..............................................................................................................138
Figure 5.11.3. Distribution of causes of intentional and non-intentional injuries (percentage of total DALYs) in the African Region, 2000 and 2012 ...................................................................................138
Figure 5.11.4. Age-standardized deaths rate per 100 000 due to noncommunicable diseases by sex in the African Region, 2012 ....139
Figure 5.11.5. Age-standardized deaths rate per 100 000 due to cancers (Malignant neoplasms) by sex in the African Region, 2012 139
Figure 5.11.6. Age-standardized deaths rate per 100 000 due to cardiovascular diseases by sex in the African Region, 2012 .............140
Figure 5.11.7. Age-standardized deaths rate per 100 000 due to chronic respiratory diseases by sex in the African Region, 2012 ....140
Figure 5.11.8. Age-standardized deaths rate per 100 000 due to diabetes mellitus by sex in the African Region, 2012 ..........................141
Figure 5.11.9. Age-standardized incidence rate per 100 000 due to cervical cancer in the African Region, 2008 and 2012 ........................141
Figure 5.11.10. Distribution of the probability (%) of dying between exact ages 30 and 70 from any of cardiovascular diseases, cancers, diabetes or chronic respiratory diseases in the African Region, 2012 .......................................................................................142
Figure 5.11.11. Distribution of the probability (%) of dying between exact ages 30 and 70 from any of cardiovascular diseases, cancers, diabetes or chronic respiratory diseases in the African Region, 2000 .......................................................................................142
6. Key determinants
6.1. Risk factors for health
Figure 6.1.1. Prevalence of smoking any tobacco product among adults aged 15 years of age or older (%) in the African Region, 2013 .......................................................................................................................143
Figure 6.1.2. Prevalence of smoking any tobacco product among adults aged 15 years of age or older (%) by sex and WHO region, 2013 .......................................................................................................................143
Figure 6.1.3. “Prevalence of smoking any tobacco product among adults aged 15 years of age or older (%) by sex in the African Region, 2013 ......................................................................................................143
Figure 6.1.4. Alcohol per capita consumption among adults aged 15 years of age or older (litres of pure alcohol) in the African Region, 2010 ......................................................................................................143
Figure 6.1.5. Prevalence of raised fasting blood glucose among adults aged 18 years or older (%) in the African Region, 2014 ........144
Figure 6.1.6. Prevalence of raised fasting blood glucose among adults aged 18 years or older (%) by WHO region, 2010 and 2014 144
Figure 6.1.7. Prevalence of raised fasting blood glucose among adults aged 18 years or older (%) by sex and WHO region, 2014 ...144
Figure 6.1.8. Prevalence of raised fasting blood glucose among adults aged 18 years or older (%) by sex in the African Region, 2014 .......................................................................................................................144
Figure 6.1.9. Prevalence of raised blood pressure among adults aged 18 years or older (%) in the African Region, 2014...................... 145
Figure 6.1.10. Prevalence of raised blood pressure among adults aged 18 years or older (%) by WHO region, 2010 and 2014 ............. 145
Figure 6.1.11. Prevalence of raised blood pressure among adults aged 18 years or older (%) by sex and WHO region, 2014 ................. 145
Figure 6.1.12. Prevalence of raised blood pressure among adults aged 18 years or older (%) by sex in the African Region, 2014 ........ 145
Figure 6.1.13. Prevalence of raised total cholesterol among adults aged 18 years or older (%) in the African Region, 2008...................... 146
Figure 6.1.14. Prevalence of raised total cholesterol among adults aged 18 years or older (%) by WHO region, 2008 ................................. 146
Figure 6.1.15. Prevalence of raised total cholesterol among adults aged 18 years or older (%) by sex and WHO region, 2008 ................. 146
Figure 6.1.16. Prevalence of raised total cholesterol among adults aged 18 years or older (%) by sex in the African Region, 2008 ........ 146
Figure 6.1.17. Prevalence of insufficient physical activity among adults aged 18 years of age or older (%) in the African Region, 2010 .......................................................................................................................147
Figure 6.1.18. Prevalence of insufficient physical activity among adults aged 18 years of age or older (%) by WHO region, 2010 ...... 147
Figure 6.1.19. Prevalence of insufficient physical activity among adults aged 18 years of age or older (%) by sex and WHO region, 2010 .......................................................................................................................147
Figure 6.1.20. Prevalence of insufficient physical activity among adults aged 18 years of age or older (%) by sex in the African Region, 2010 ......................................................................................................147
Figure 6.1.21. Adults aged 18 years or older who are obese (%) in the African Region, 2014 ............................................................................... 148
Figure 6.1.22. Adults aged 18 years or older who are obese (%) by WHO region, 2010 and 2014 ........................................................................ 148
Figure 6.1.23. Adults aged 18 years or older who are obese (%) by sex and WHO region, 2014 ............................................................................ 148
Figure 6.1.24. Adults aged 18 years or older who are obese (%) by sex in the African Region, 2014 ................................................................... 148
6.2. The physical environment
Figure 6.2.1. Population using improved drinking-water sources (%) in the African Region, 2012 ................................................................... 149
Figure 6.2.2. Population using improved drinking-water sources (%) by WHO region, 2000 and 2012 ........................................................... 149
Figure 6.2.3. Population using improved drinking-water sources (%) in the African Region, 1990 to 2012 ................................................... 149
Figure 6.2.4. Urban and rural population using improved drinking-water sources (%) in the African Region, 2012 ...................................... 149
Figure 6.2.5. Population using improved sanitation (%) in the African Region, 2012 .......................................................................................150
Figure 6.2.6. Population using improved sanitation (%) by WHO region, 2000 and 2012 ....................................................................................150
Figure 6.2.7. Population using improved sanitation (%) in the African Region, 1990-2012 ............................................................................ 150
Figure 6.2.8. Urban and rural population using improved sanitation (%) in the African Region, 2012 .............................................. 150
Figure 6.2.9. Population living in urban areas (%) in the African Region, 2013 ......................................................................................................151
Figure 6.2.10. Population living in urban areas (%) by WHO region, 2000 and 2013 ...................................................................................................151
Figure 6.2.11. Trend in population living in urban areas (%) in the African Region, 2005-2011 ............................................................................ 151
Figure 6.2.12. Population living in urban areas (%) in the African Region, 2000 and 2013 ...................................................................................151
Figure 6.2.13. Population using solid fuels (%) in the African Region, 2013 ......................................................................................................152
Figure 6.2.14. Population using solid fuels (%) by WHO region, 2010 and 2013 ...................................................................................................152
xiii
Figure 6.2.15. Urban and rural population using solid fuels (%) in the African Region, 2013 ............................................................................... 152
6.3. Nutrition
Figure 6.3.1. Children aged under 5 years underweight (%) in the African Region, 2007-2014 ............................................................................ 153
Figure 6.3.2. Children aged under 5 years underweight (%) by WHO region, 1990-1995 and 2007-2014 ................................................. 153
Figure 6.3.3. Children aged under 5 years underweight (%) in the African Region, 1990-1995 and 2007-2014 ............................................. 153
Figure 6.3.4. Children aged under 5 years stunted (%) in the African Region, 2007-2014 ............................................................................ 154
Figure 6.3.5. Children aged under 5 years stunted (%) by WHO region, 2007-2014 ............................................................................................154
Figure 6.3.6. Children aged under 5 years stunted (%) in the African Region, 1990-1995 and 2007-2014 ............................................. 154
Figure 6.3.7. Children aged under 5 years wasted (%) in the African Region, 2007-2014 ...........................................................................................155
Figure 6.3.8. Children aged under 5 years wasted (%) by WHO region, 2007-2014 ............................................................................................155
Figure 6.3.9. Children aged under 5 years wasted (%) by country in the African Region, 2007-2014 .................................................................... 155
Figure 6.3.10. Children aged under 5 years overweight (%) in the African Region, 2007-2014 ............................................................................ 156
Figure 6.3.11. Children aged under 5 years overweight (%) by WHO region, 2007-2014.................................................................................156
Figure 6.3.12. Children aged under 5 years overweight (%) in the African Region, 1990-1995 and 2007-2014 ............................................. 156
6.4. Social determinants
6.4.1. Demography
Figure 6.4.1.1. Total fertility rate (average number of children) per woman in the African Region, 2013 .......................................................... 157
Figure 6.4.1.2. Total fertility rate per woman by WHO region, 2000 and 2013 ..............................................................................................................157
Figure 6.4.1.3. Trend in total fertility rate per woman in the African Region, 2004-2013 ...........................................................................................157
Figure 6.4.1.4. Total fertility rate per woman in the African Region, 2000 and 2013 ...................................................................................................157
Figure 6.4.1.5. Annual growth rate of population (%) in the African Region, 2003-2013 ...........................................................................................158
Figure 6.4.1.6. Annual growth rate (in %) of population by WHO region, 2003-2013 ............................................................................................158
Figure 6.4.1.7. Age distribution of the population (%) by WHO region, 2013........................................................................................................158
Figure 6.4.1.8. Age distribution of the population (%) in the African Region, 2013 .......................................................................................158
6.4.2. Resources and infrastructure
Figure 6.4.2.1. Gross national income per capita (PPP int. $) (in thousands) in the African Region, 2013 ................................................... 159
Figure 6.4.2.2. Gross national income per capita (PPP int. $) (in thousands) by WHO region, 2000 and 2013 ........................................... 159
Figure 6.4.2.3. Trend in gross national income per capita (PPP int. $) (in thousands) in the African Region, 2005-2013 ............................. 159
Figure 6.4.2.4. Gross national income per capita (PPP int. $) (in thousands) in the African Region, 2000 and 2013 ...............................159
6.4.3. Poverty and income inequality
Figure 6.4.3.1. Population living under $1 (PPP int. $) a day (i.e. in absolute poverty) (%) in the African Region, 2007-2013 ...................160
Figure 6.4.3.2. Population living under $1 (PPP int. $) a day (i.e. in absolute poverty) (%) by WHO region, 2007-2013 ...............................160
Figure 6.4.3.3. Population living under $1 (PPP int. $) a day (i.e. in absolute poverty) (%) by country in the African Region, 2007-2013 160
6.4.4. Gender equity
Figure 6.4.4.1. Net primary school enrolment ratio (%) by sex in the African Region, 2007-2012 .................................................................... 161
Figure 6.4.4.2. Seats held by women in national parliaments (%) in the African Region, 2000 and 2014 ............................................................ 161
6.4.5. Education
Figure 6.4.5.1. Adult literacy rate (aged 15 and older) (%) by WHO region, 2007-2012 ............................................................................................162
Figure 6.4.5.2. Adult literacy rate (aged 15 and older) (%) in the African Region, 2007-2012 ............................................................................ 162
Figure 6.4.5.3. Population aged 15-24 years who can both read and write (i.e. youth literacy rate) (%) in the African Region, 2005-2011 .......................................................................................................................162
6.4.6. Global partnerships and financial flows
Figure 6.4.6.1. Per capita official development assistance received (US$) in the African Region, 2000 and 2013 ........................................... 163
Figure 6.4.6.2. Official development assistance received as percentage of GNI in the African Region, 2000 and 2013 ................. 163
Figure 6.4.6.3. Total debt service as percentage of GNI in the African Region, 2000 and 2013 ................................................................... 164
Figure 6.4.6.4. Total external debt stocks (in millions of current US$) in the African Region, 2000 and 2013............................................. 164
6.4.7. Science and technology
Figure 6.4.7.1. Population who are cellular or mobile subscribers (%) in the African Region, 2000 and 2014 ............................................... 165
Figure 6.4.7.2. Population who are telephone (fixed and mobile) subscribers (%) in the African Region, 2000 and 2014........................ 165
Figure 6.4.7.3. Population who are internet users (%) in the African Region, 2000 and 2014 ...................................................................................166
6.4.8. Emergencies and disasters
Figure 6.4.8.1. Total number of refugees by country of origin in the African Region, 2005 and 2015 ................................................................... 167
Figure 6.4.8.2. Total number of refugees by country of asylum in the African Region, 2015 ............................................................................... 167
xiv
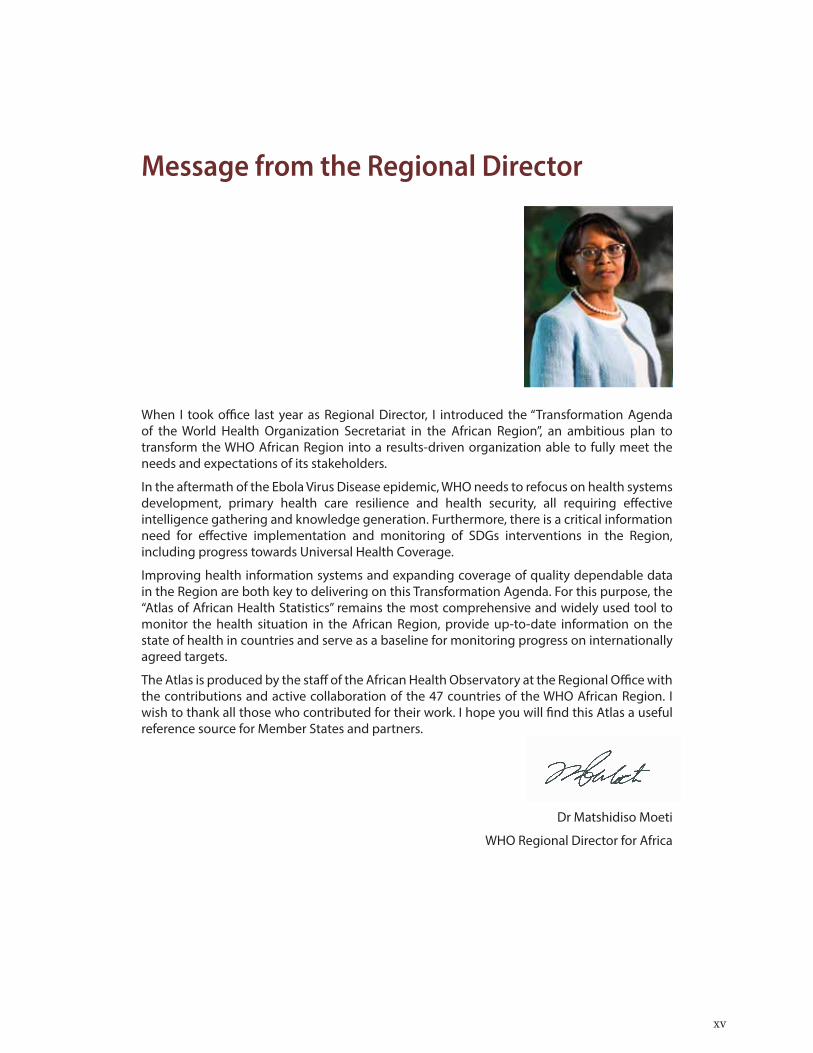
Message from the Regional Director
When I took office last year as Regional Director, I introduced the “Transformation Agenda of the World Health Organization Secretariat in the African Region”, an ambitious plan to transform the WHO African Region into a results-driven organization able to fully meet the needs and expectations of its stakeholders.
In the aftermath of the Ebola Virus Disease epidemic, WHO needs to refocus on health systems development, primary health care resilience and health security, all requiring effective intelligence gathering and knowledge generation. Furthermore, there is a critical information need for effective implementation and monitoring of SDGs interventions in the Region, including progress towards Universal Health Coverage.
Improving health information systems and expanding coverage of quality dependable data in the Region are both key to delivering on this Transformation Agenda. For this purpose, the “Atlas of African Health Statistics” remains the most comprehensive and widely used tool to monitor the health situation in the African Region, provide up-to-date information on the state of health in countries and serve as a baseline for monitoring progress on internationally agreed targets.
The Atlas is produced by the staff of the African Health Observatory at the Regional Office with the contributions and active collaboration of the 47 countries of the WHO African Region. I wish to thank all those who contributed for their work. I hope you will find this Atlas a useful reference source for Member States and partners.
Dr Matshidiso Moeti
WHO Regional Director for Africa
xv
Abbreviations and acronyms
AARR Average annual rate of reductionACT Artemisinin-based combination therapyAIDS Acquired immunodeficiency syndromeARI Acute respiratory infectionART Antiretroviral therapyARV AntiretroviralDALY Disability-adjusted life-yearGDP Gross domestic productHALE Health adjusted life expectancyHIV Human immunodeficiency virusHPV Human papillomavirusHSS Health system strengtheningICD International classification of diseasesIHP+ International Health PartnershipIHR International Health RegulationsIPTp Intermittent preventive treatment of malaria in pregnancyITN Insecticide treated netMDR-TB Multidrug-resultant tuberculosisMICS Multiple indicator cluster surveyNHA National health accountsNCD Noncommunicable diseaseNTD Neglected tropical diseaseODA Official development assistanceORT Oral rehydration therapyPPP Purchasing power parityTB TuberculosisWHO GBD WHO Global burden of diseaseWHO MCSS WHO Multi-country survey studyWHS World health statisticsYLL Years of life lost
xvi
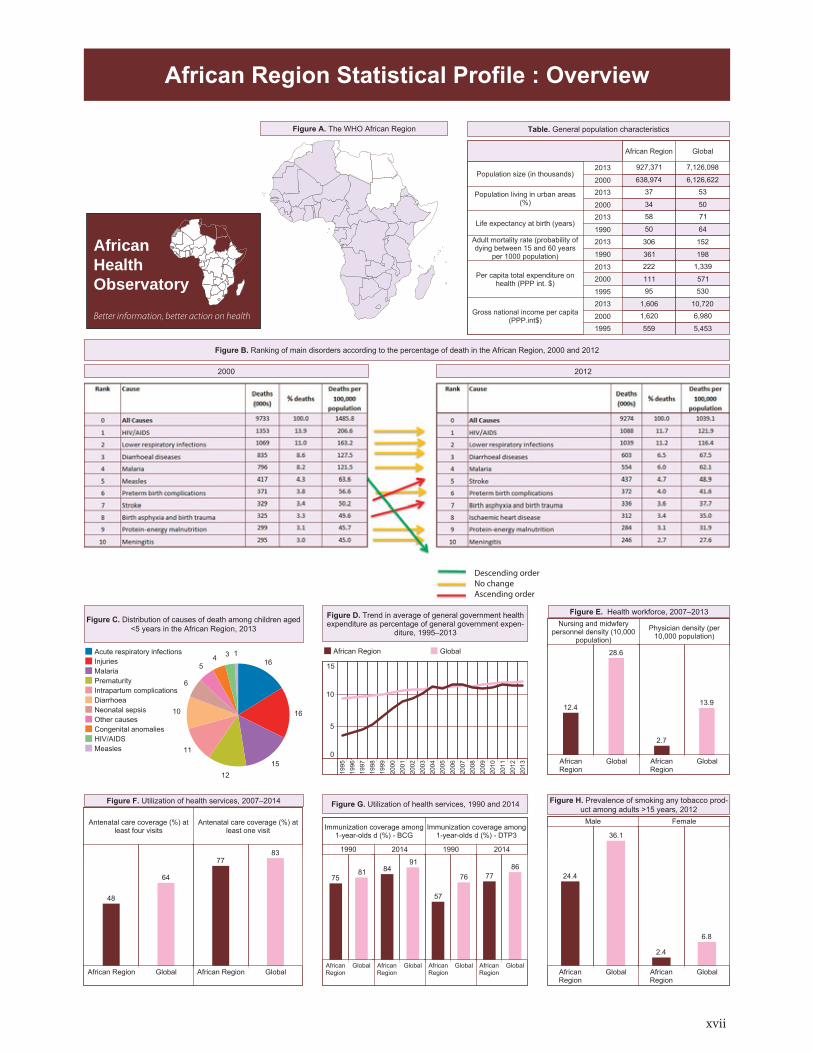
Descending orderNo changeAscending order
AfricanHealthObservatory
Better information, better action on health
xvii
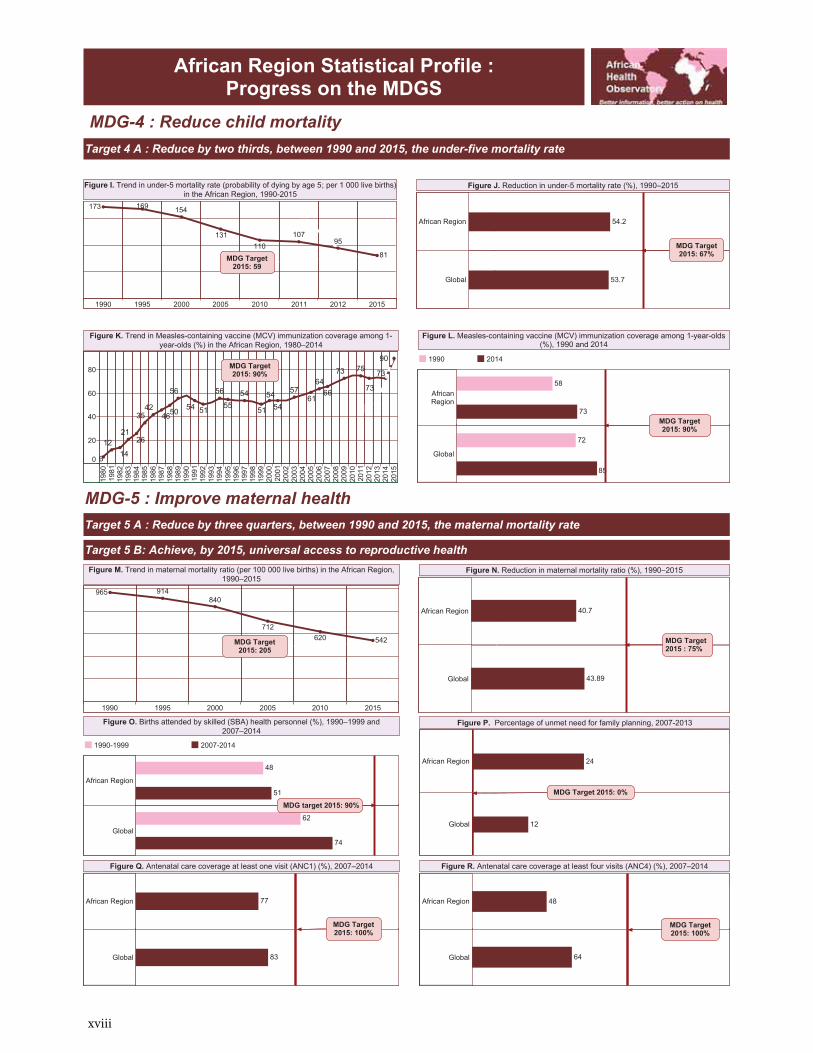
xviii

xix
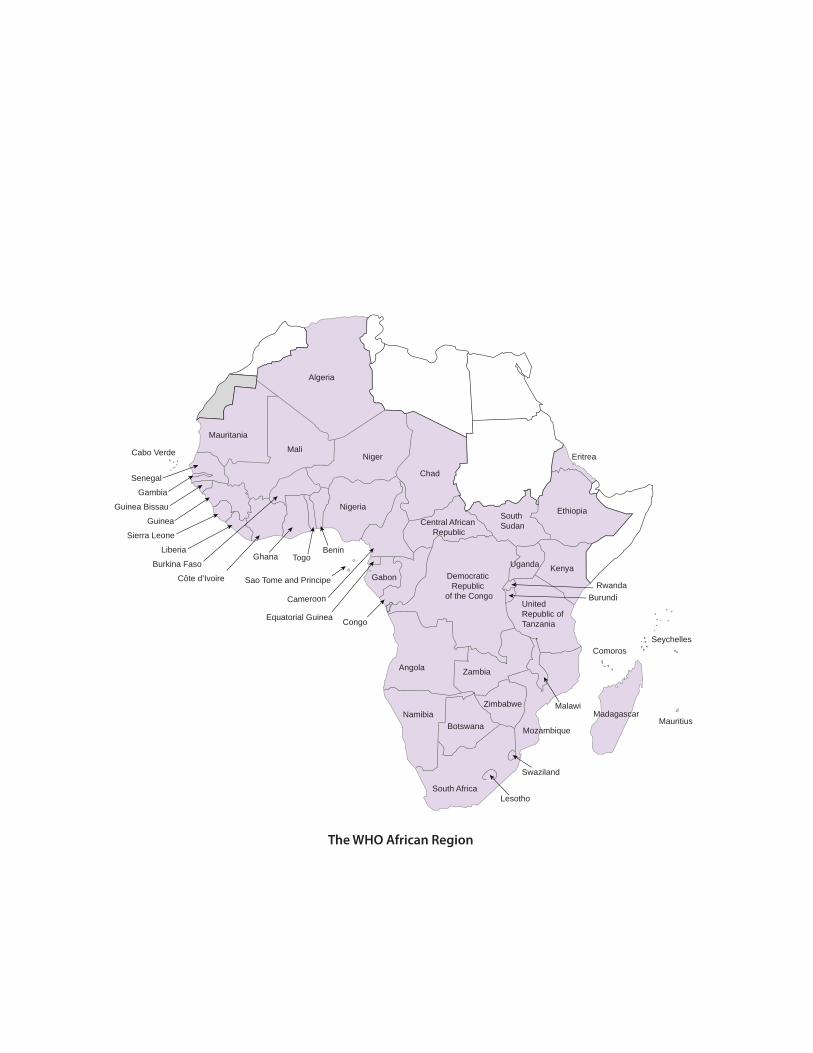
Togo
Sierra Leone
Senegal
Nigeria
Niger
Mauritania
Mali
Liberia
Guinea Bissau
Guinea
Ghana
Gambia
Côte d’Ivoire
Cabo Verde
Burkina Faso
Benin
Algeria
Zimbabwe
Zambia
Uganda
United Republic of Tanzania
Swaziland
SouthSudan
Seychelles
South Africa
Namibia
MozambiqueMauritius
MalawiMadagascar
Lesotho
Kenya
Ethiopia
Eritrea
Comoros
Botswana
Sao Tome and Principe RwandaGabon
Equatorial Guinea
Democratic Republic
of the Congo
Congo
Chad
Central African Republic
Cameroon Burundi
Angola
The WHO African Region
1
1. Introduction
The 2016 edition of the Atlas of African Health Statistics provides an up-to-date health situation analysis of the WHO African Region. It has been updated and its coverage expanded with new indicators, including nearly half of the 2015 Global reference list of 100 core health indicators recommended by the United Nations Interagency Working Group on Indicators and Reporting Burden, and a section on progress on the targets of the health and health-related Millennium Development Goals.
For its contents, the Atlas is primarily reliant on the data collected, cleaned, corrected, evaluated and assessed at country level in each of the 47 Member States of the WHO African Region. These data are further reviewed and refined by WHO country offices, the Regional Office in Brazzaville and by technical experts at WHO headquarters in Geneva. The results of this process are data computed by WHO to ensure comparability between countries. These may not necessarily correspond to the official statistics published by Member States, which may have been produced using valid alternative methods.
The Atlas also uses data from other sources, including United Nations sister agencies. The estimates used to monitor internationally agreed goals such as the MDGs, for example, are produced by inter-agency groups consisting of members from WHO, UNICEF and the World Bank, among others. When a figure in the Atlas is not based on WHO data, the source is credited in a footnote.
The quality, quantity, frequency of collection and timeliness of data used to produce the Atlas depends very much on the strength of the national health information systems, which include data collection at the district and peripheral levels. With some notable exceptions, this has been an area of weakness within most national health systems, whose development in the African Region has been slow and uneven, despite considerable effort over the years.
To overcome these weaknesses, WHO seeks to support countries in strengthening their national health information systems through the development of national knowledge platforms, which include health observatories. These platforms, with direct links to subnational or district levels, could also be linked to the Regional Office in a collaborative, bidirectional exchange of information, evidence and knowledge to foster monitoring and evaluation, which are essential components of the cycle of development and policy work. They would also be used to implement the assessment frameworks that will be put in place to evaluate the impact of the Sustainable Development Goals and progress towards Universal Health Coverage. It is hoped that these developments will lead to a decrease in the fragmentation of efforts so frequently found in public health policy and development work.
The WHO African Region
This atlas refers to the 47 Member States of the WHO African Region, which is one of the six WHO regions. The WHO African Region does not include all the countries on the African continent and is not limited to sub-Saharan Africa. In this atlas, “Region” is used when referring to the African Region as defined by WHO, while “Africa” is used when discussing the continent as a whole, including its islands. It should be noted that the World Bank divides the African continent into two regions: North Africa and sub-Saharan Africa, while UNICEF divides it into three regions: Eastern and South Africa, North Africa, and West and Central Africa.
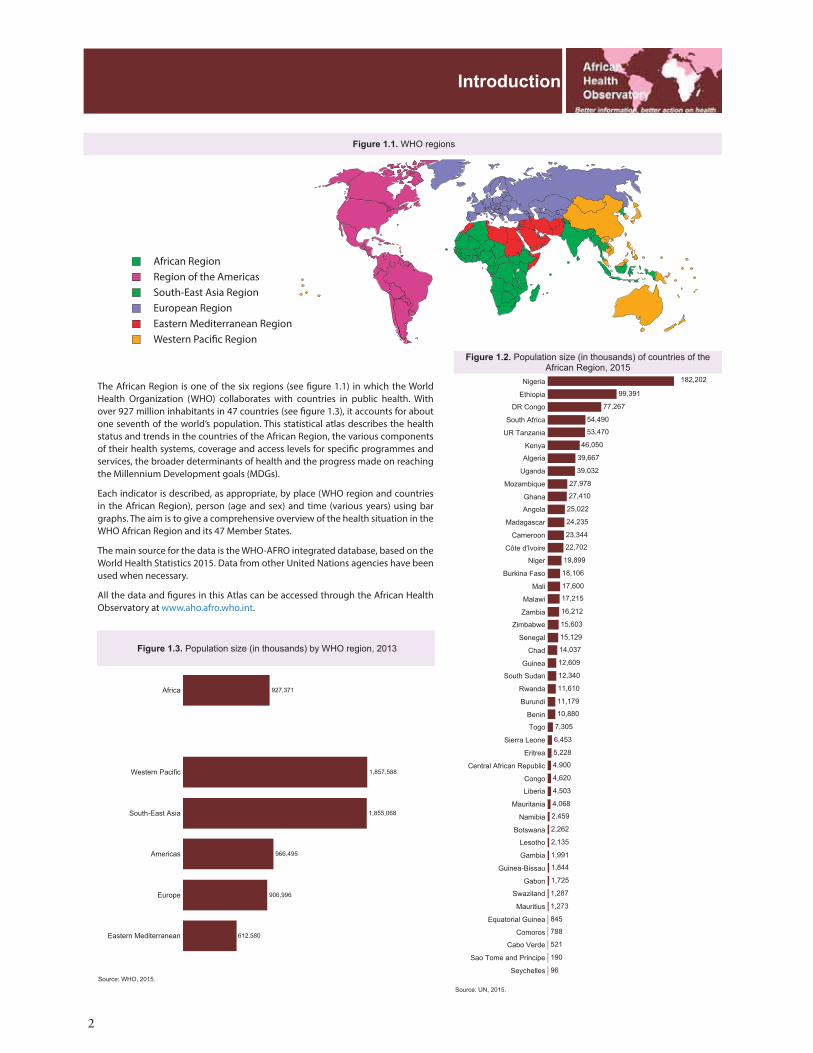
2
African RegionRegion of the AmericasSouth-East Asia RegionEuropean RegionEastern Mediterranean RegionWestern Pacific Region
The African Region is one of the six regions (see figure 1.1) in which the World Health Organization (WHO) collaborates with countries in public health. With over 927 million inhabitants in 47 countries (see figure 1.3), it accounts for about one seventh of the world’s population. This statistical atlas describes the health status and trends in the countries of the African Region, the various components of their health systems, coverage and access levels for specific programmes and services, the broader determinants of health and the progress made on reaching the Millennium Development goals (MDGs).
Each indicator is described, as appropriate, by place (WHO region and countries in the African Region), person (age and sex) and time (various years) using bar graphs. The aim is to give a comprehensive overview of the health situation in the WHO African Region and its 47 Member States.
The main source for the data is the WHO-AFRO integrated database, based on the World Health Statistics 2015. Data from other United Nations agencies have been used when necessary.
All the data and figures in this Atlas can be accessed through the African Health Observatory at www.aho.afro.who.int.
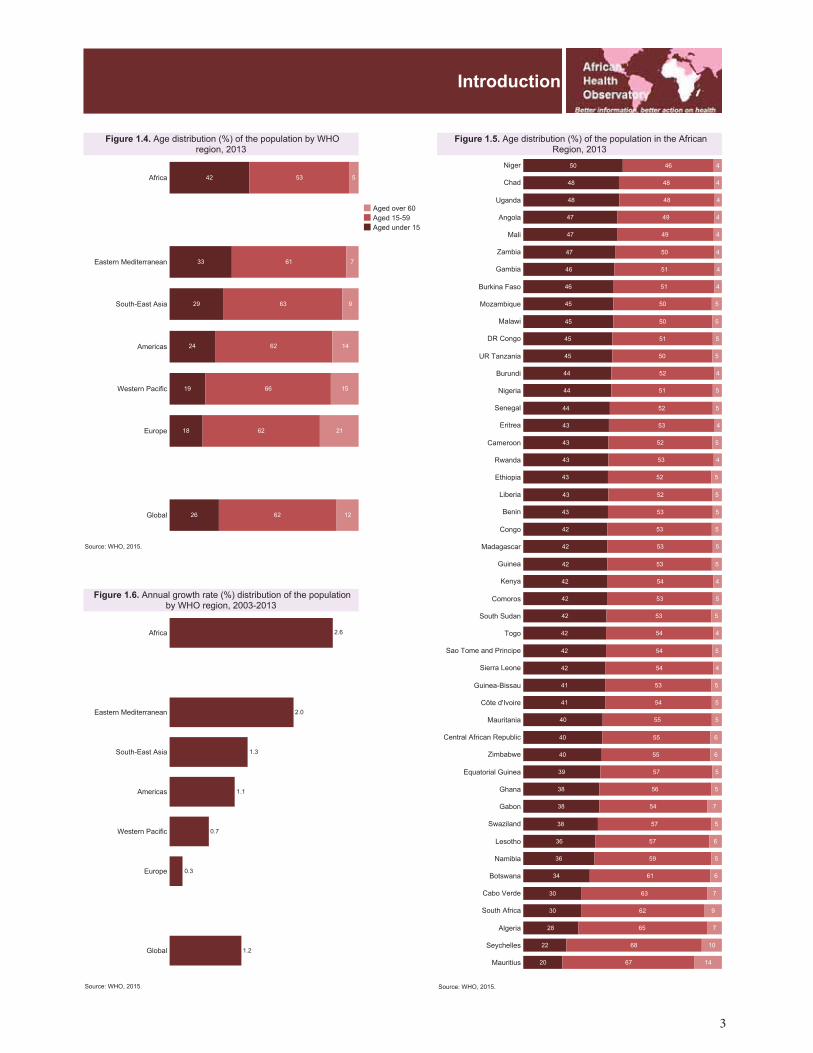
3

4
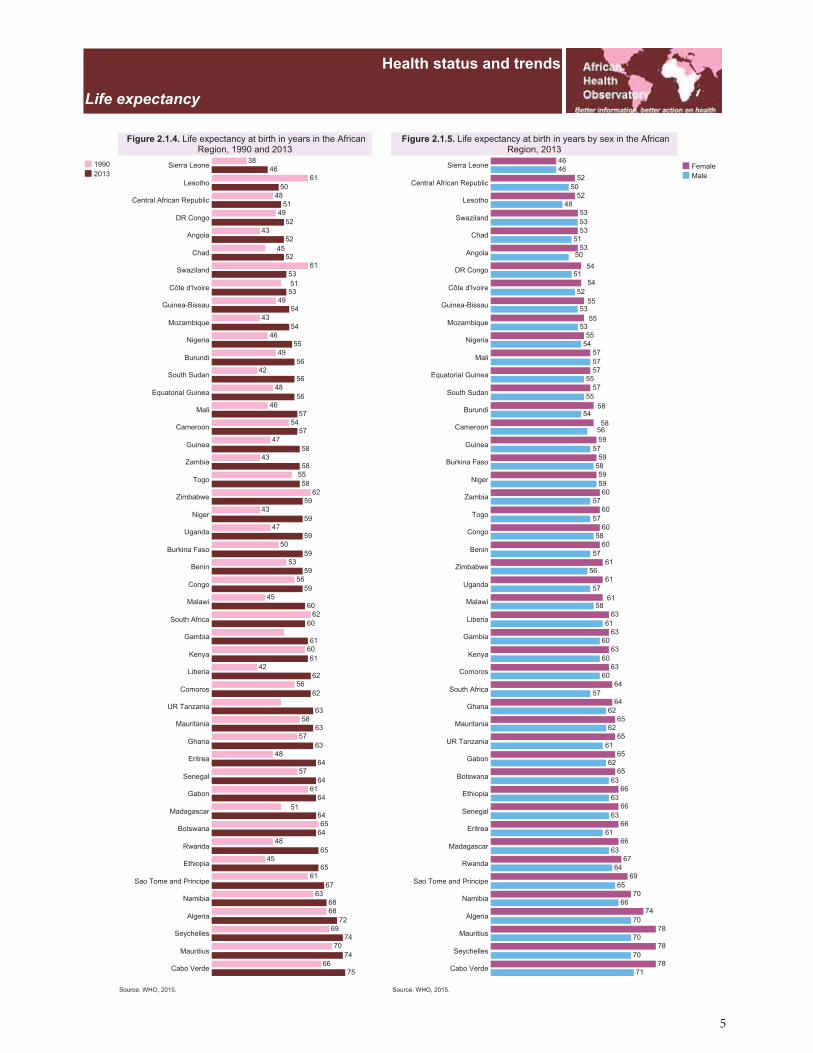
5
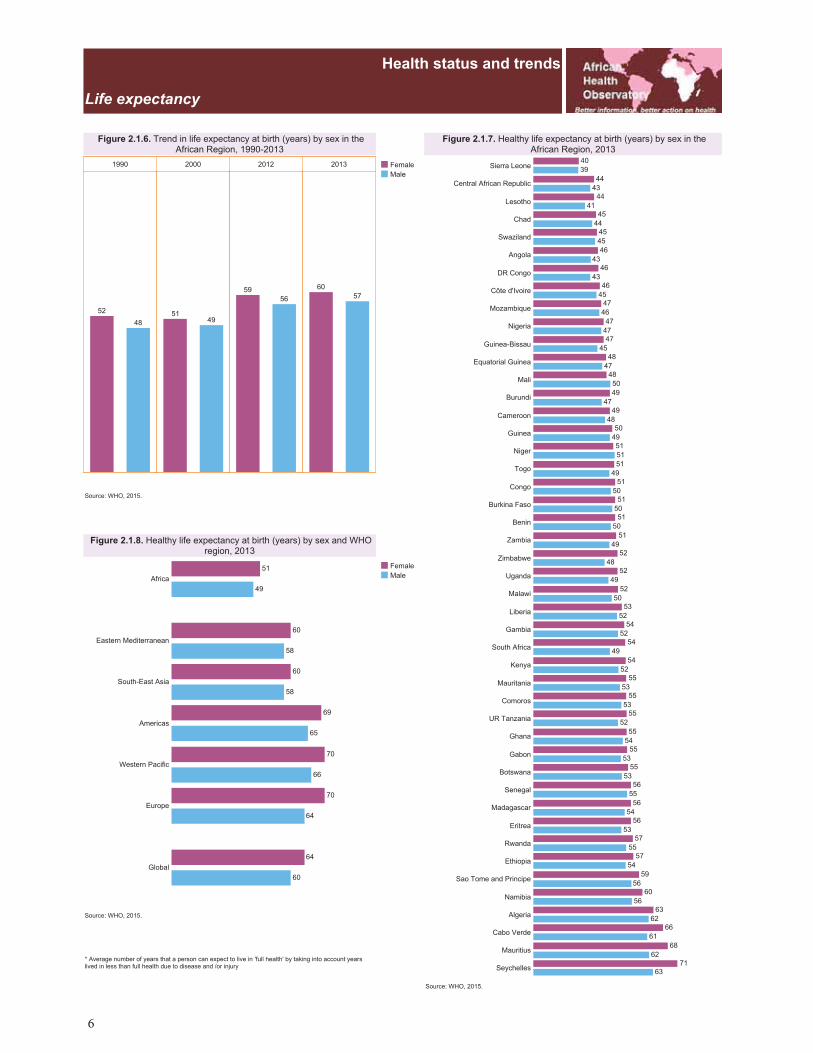
6
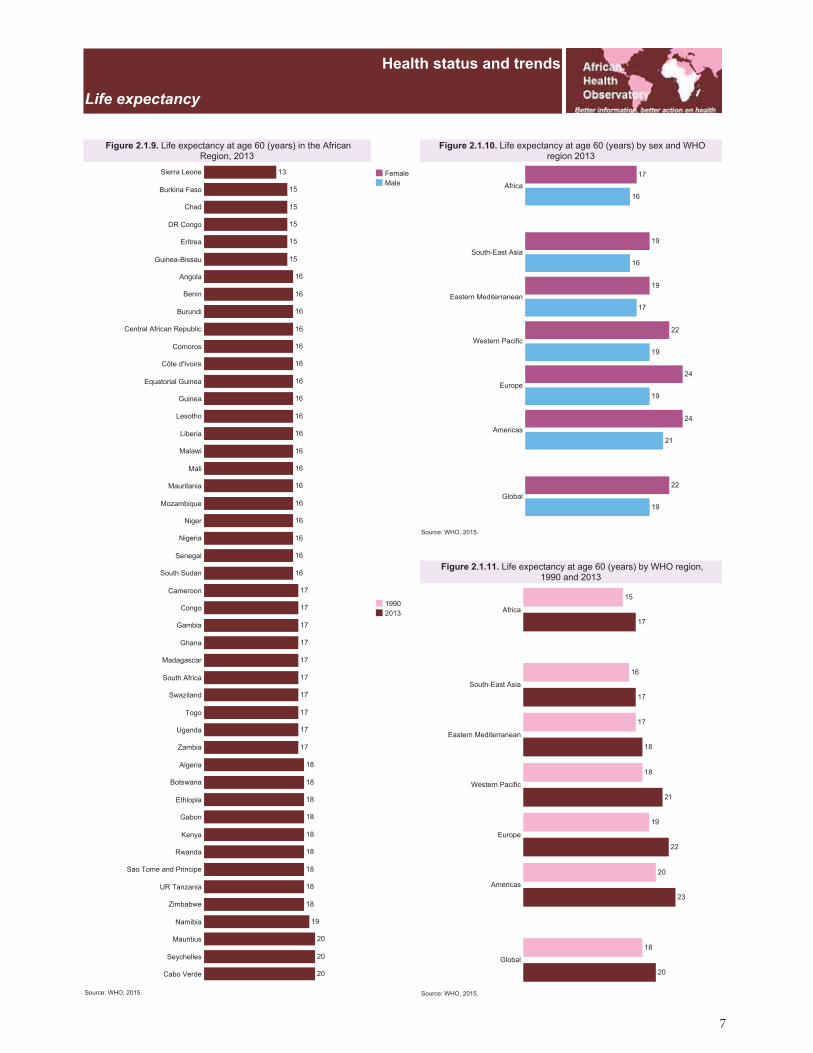
7
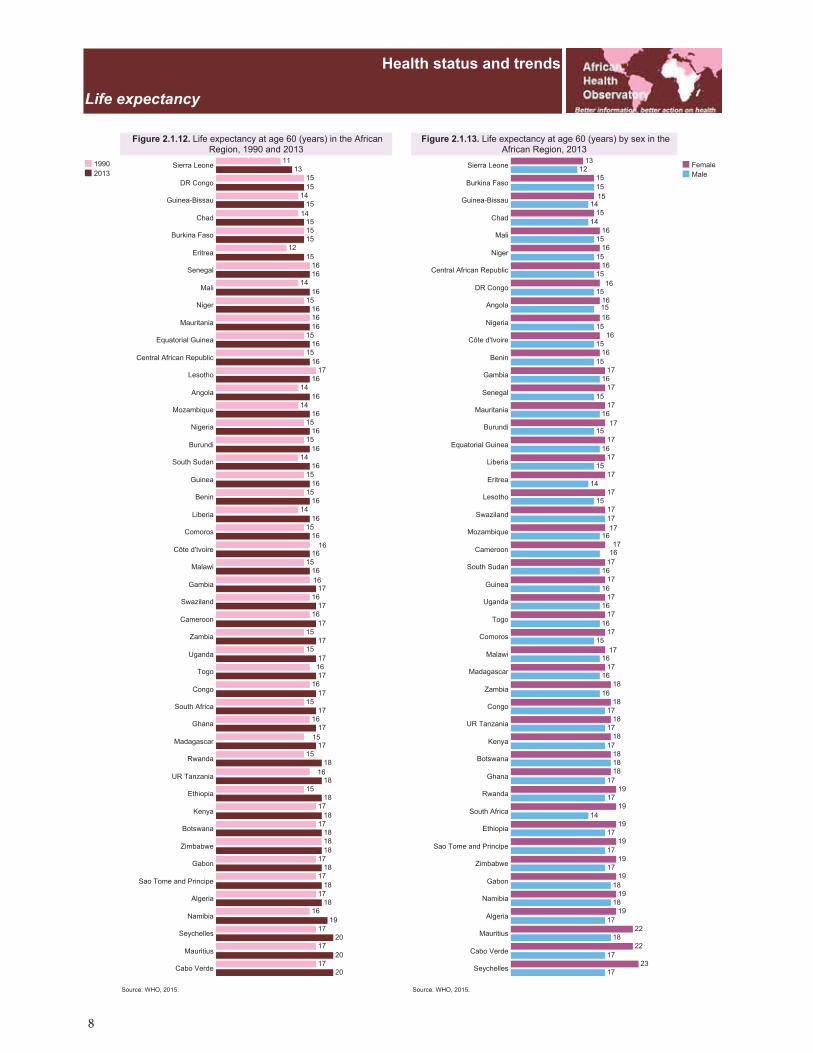
8
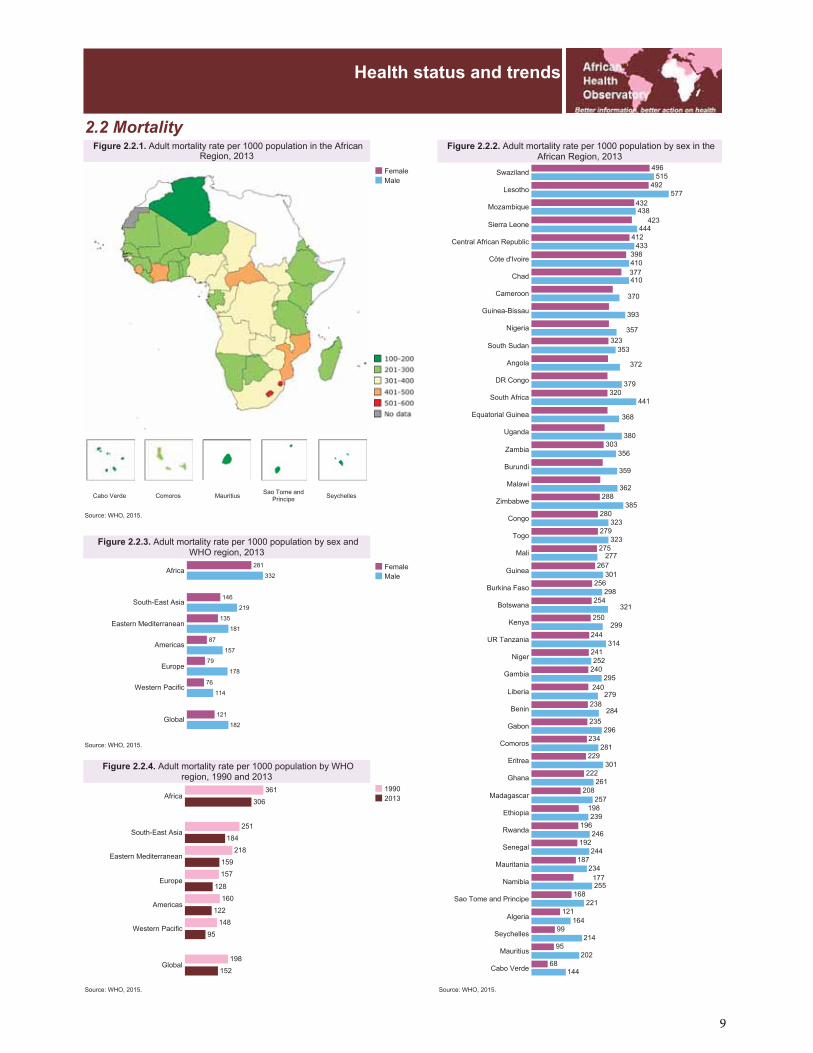
9
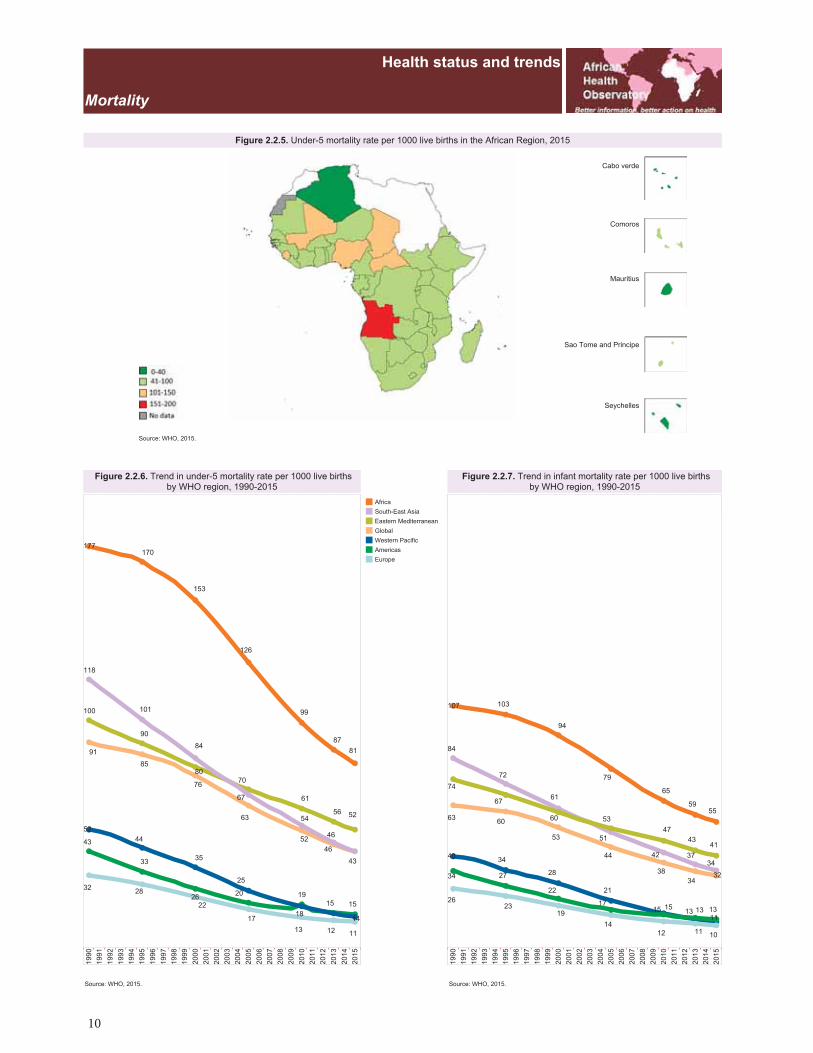
10
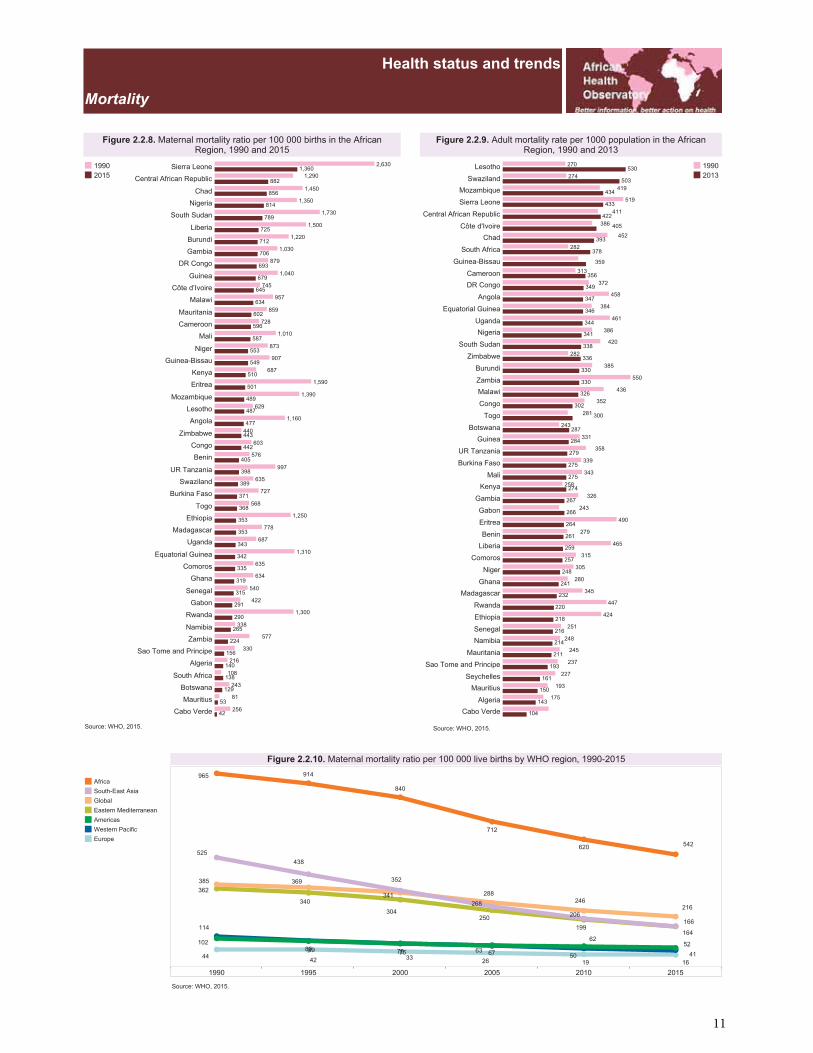
11
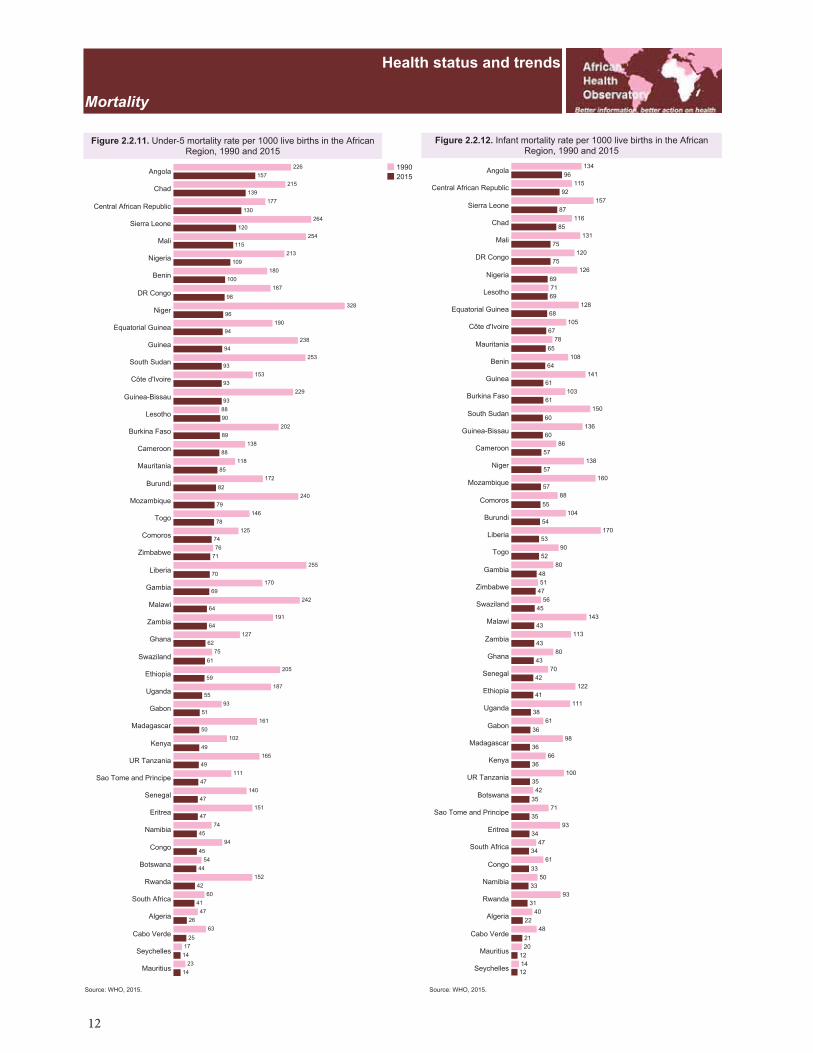
12
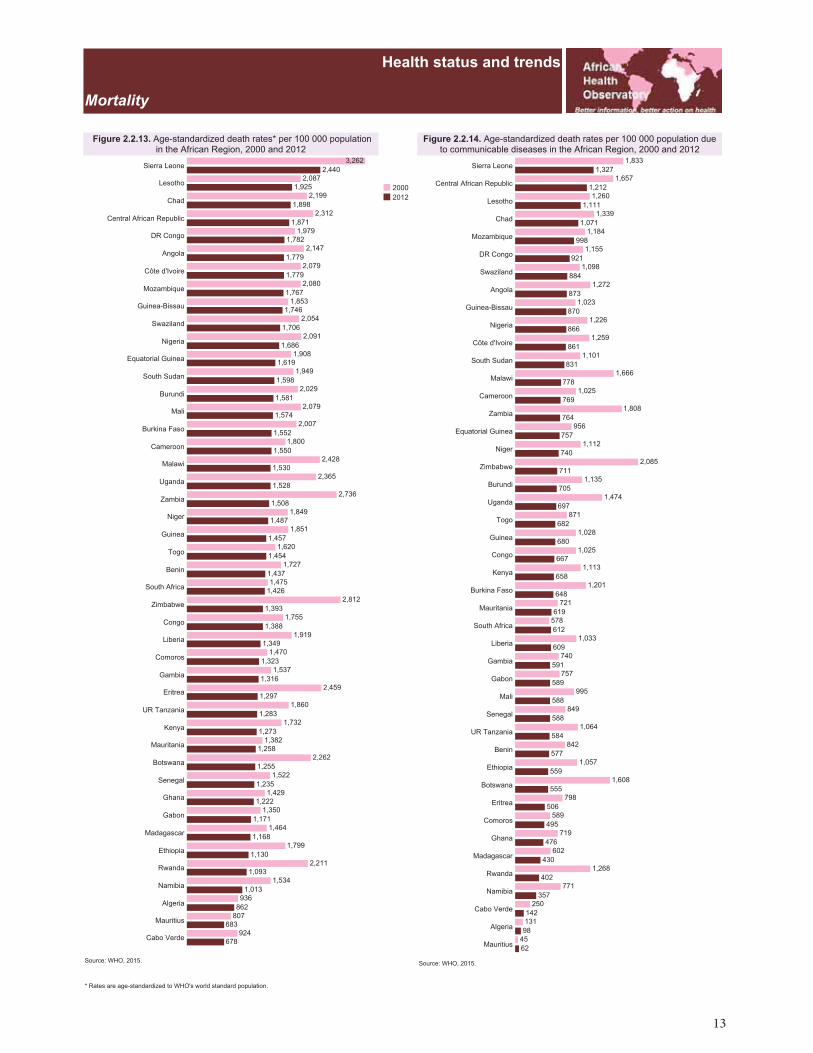
13
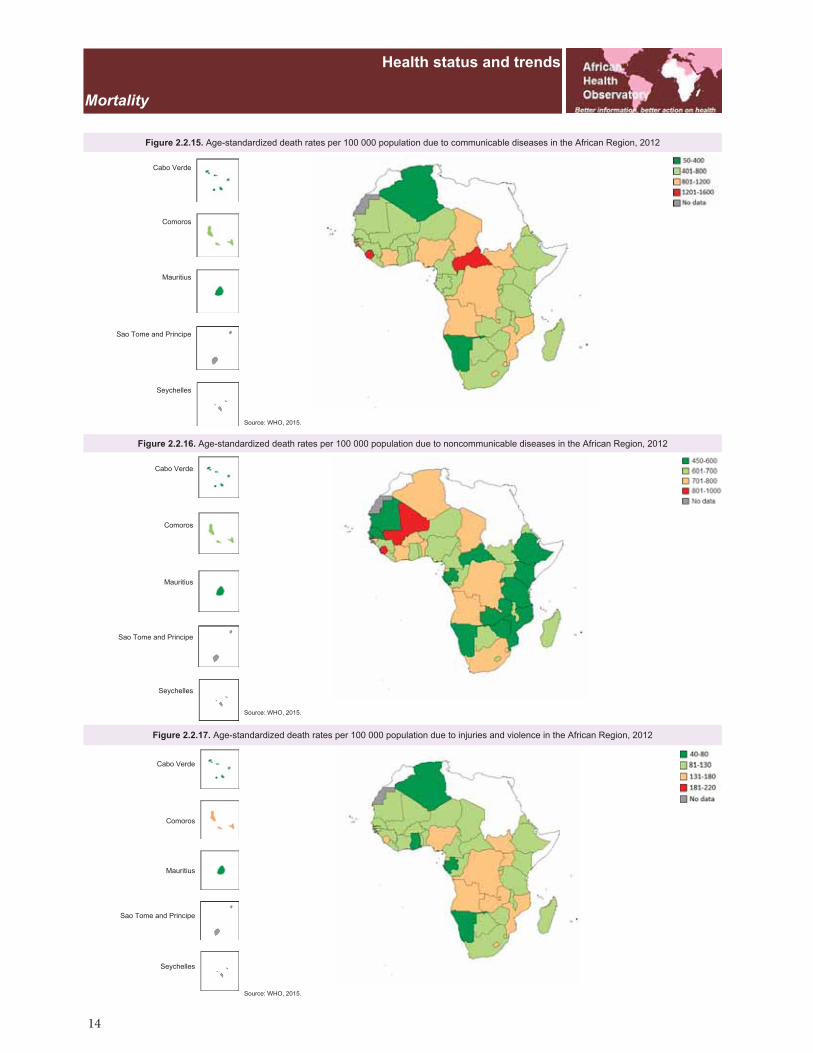
14
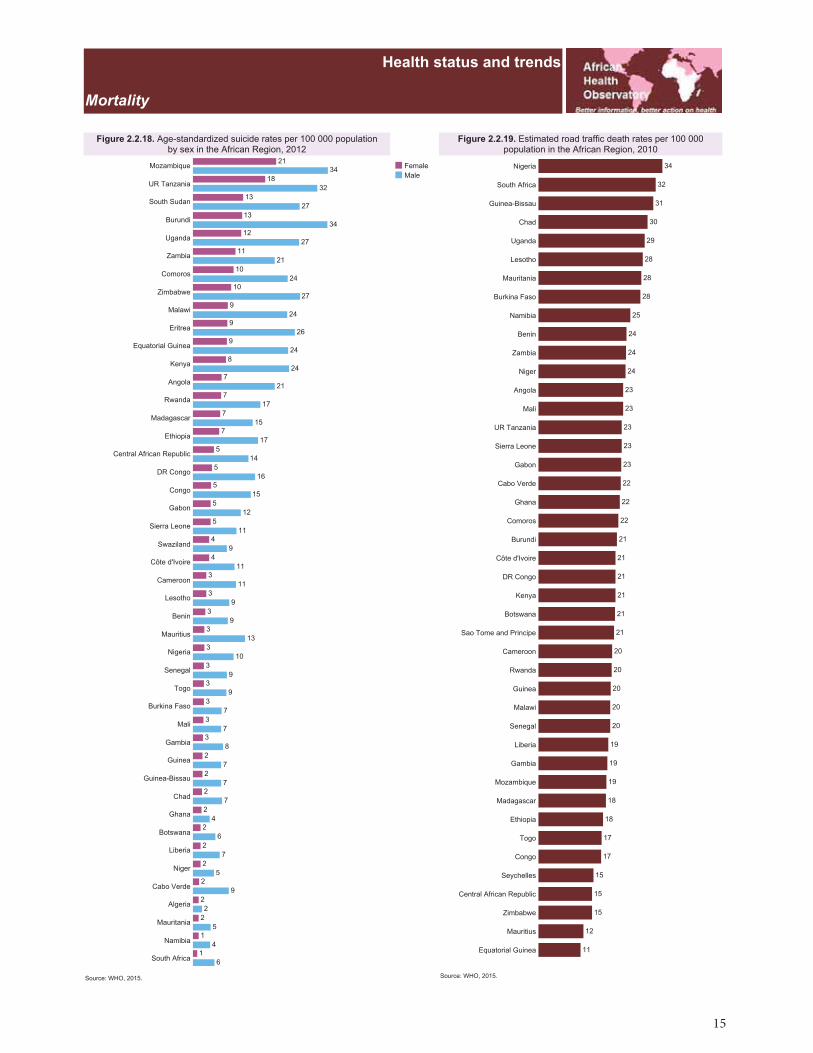
15
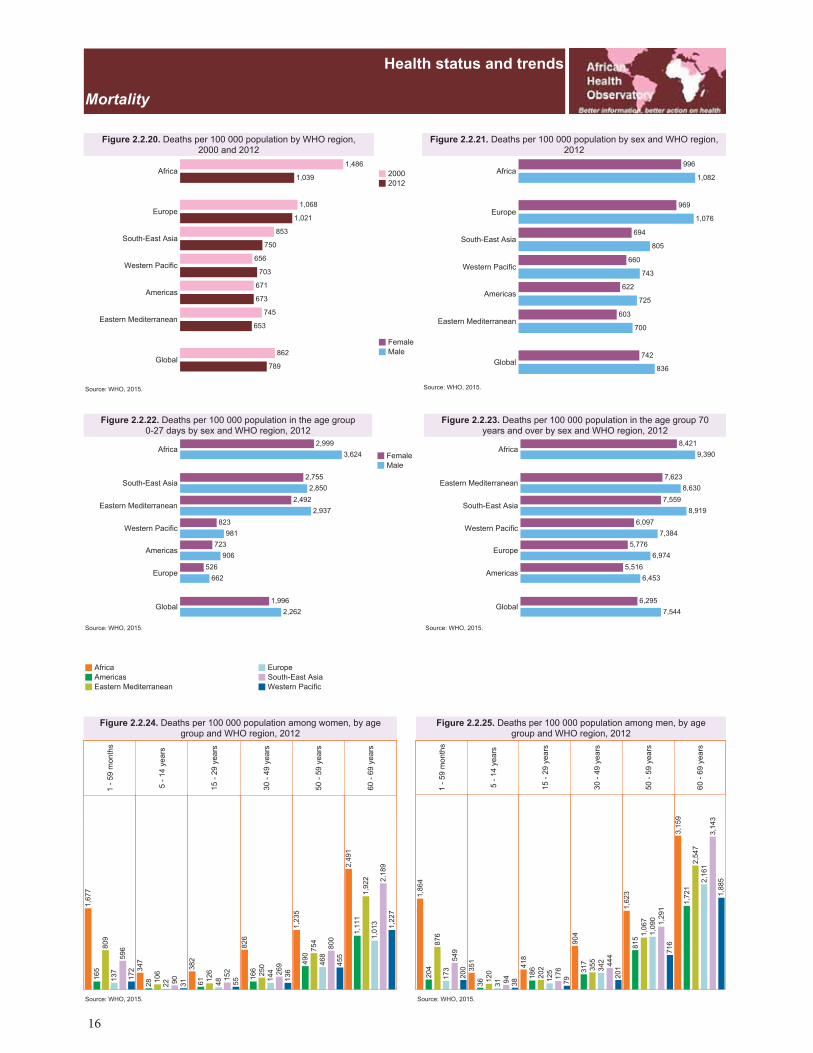
16

17
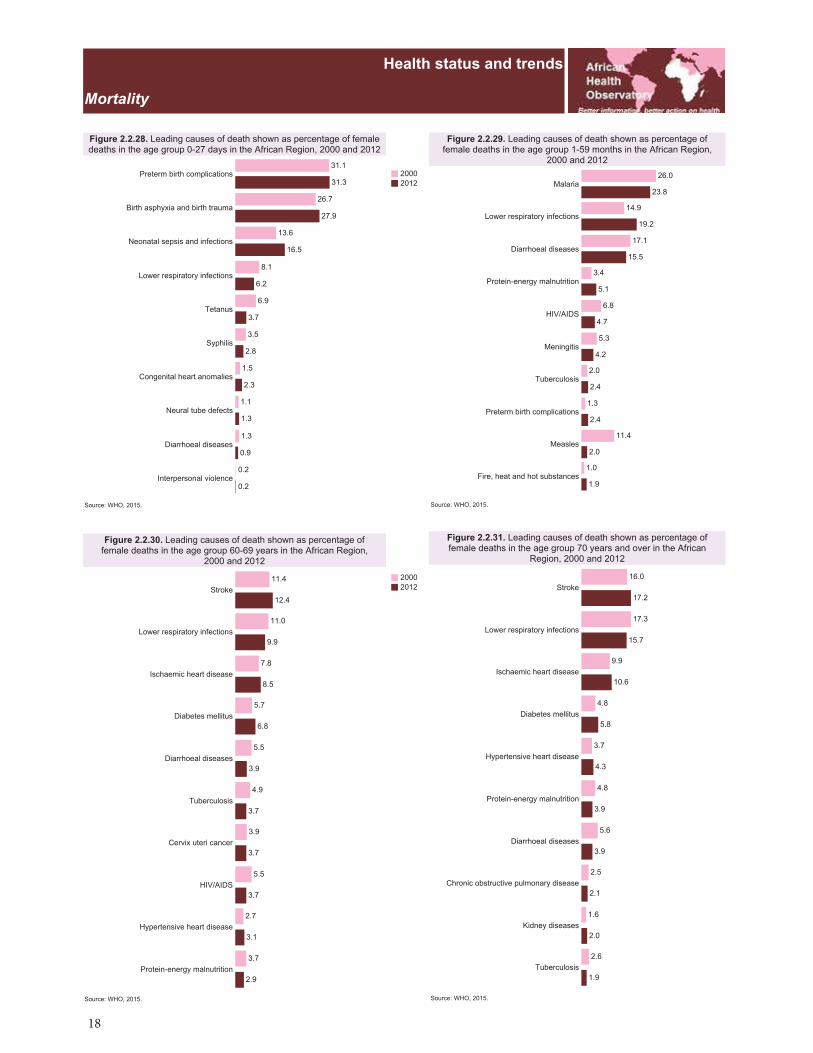
18
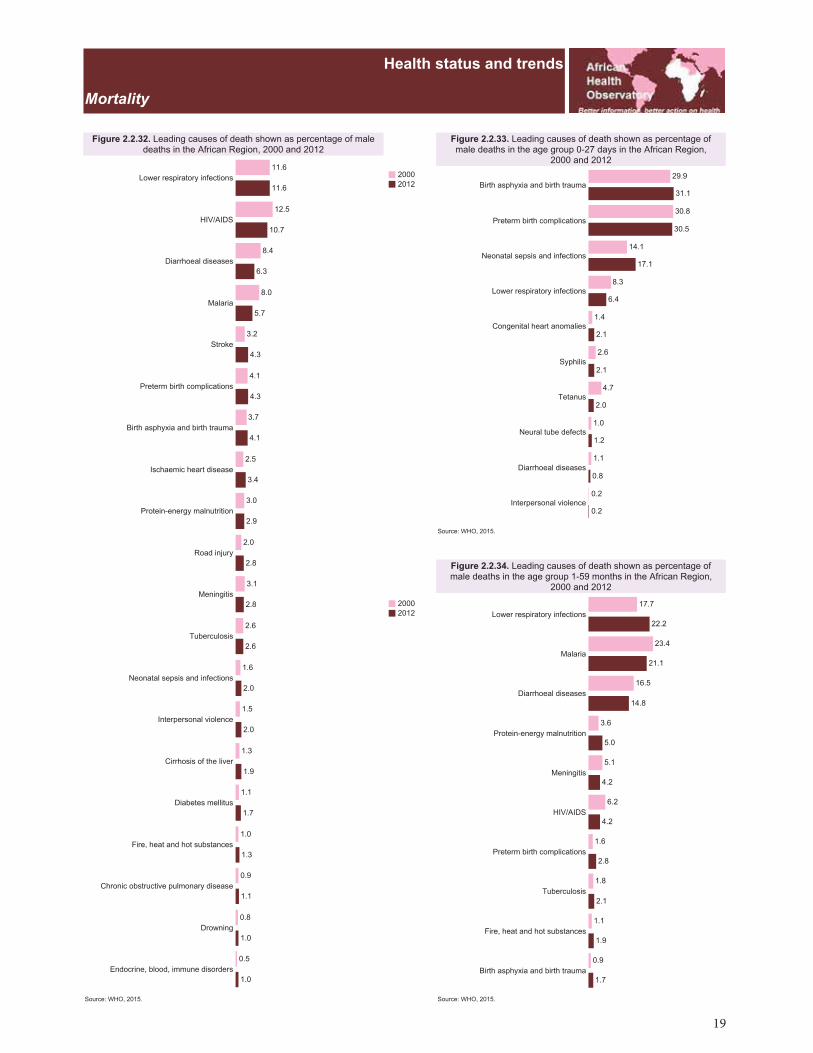
19
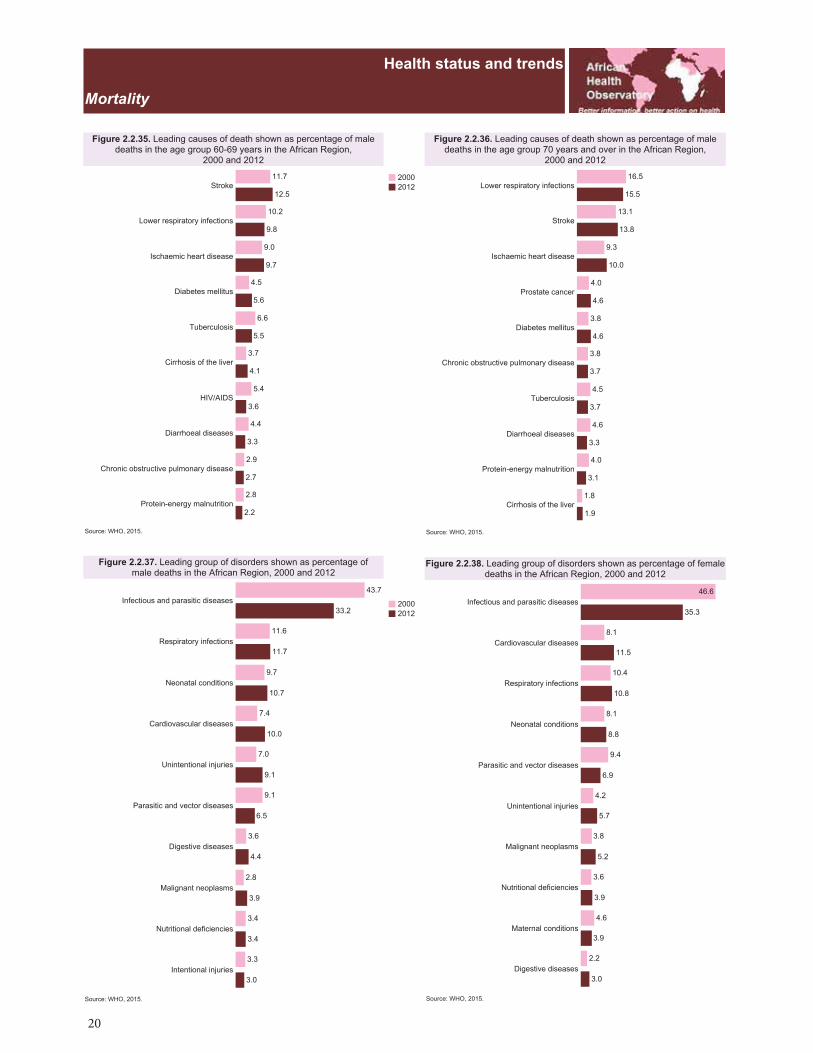
20

21
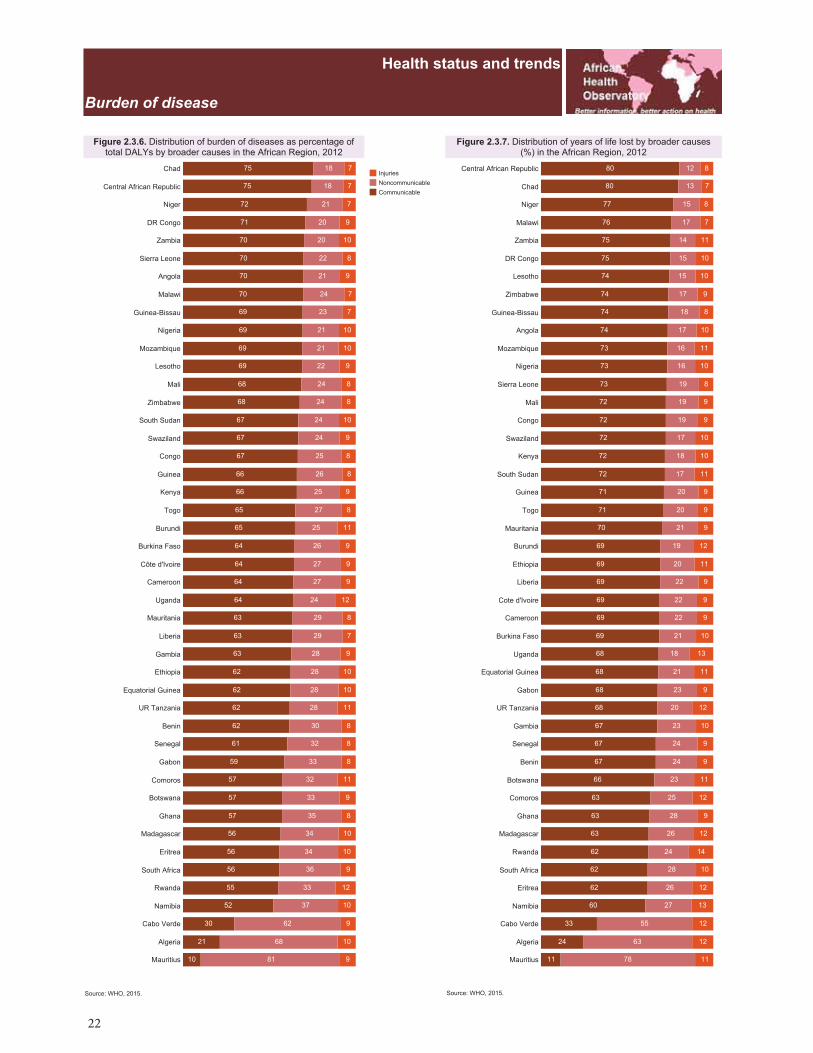
22
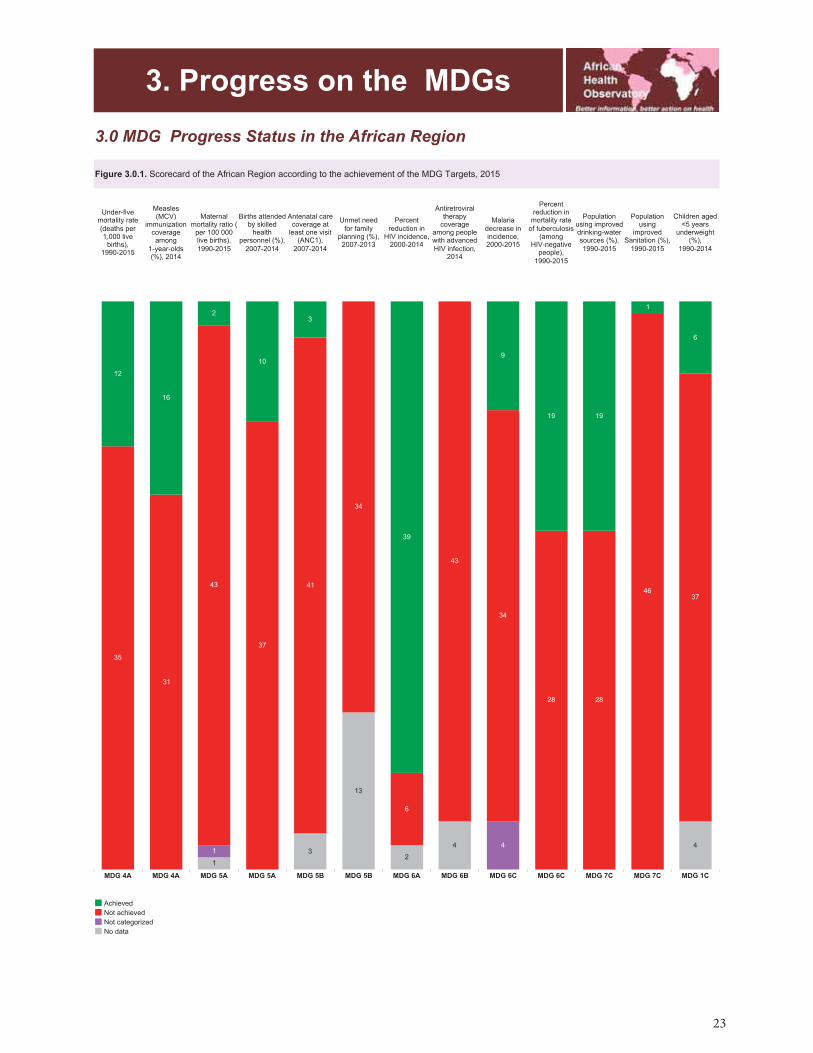
23

24

25

26
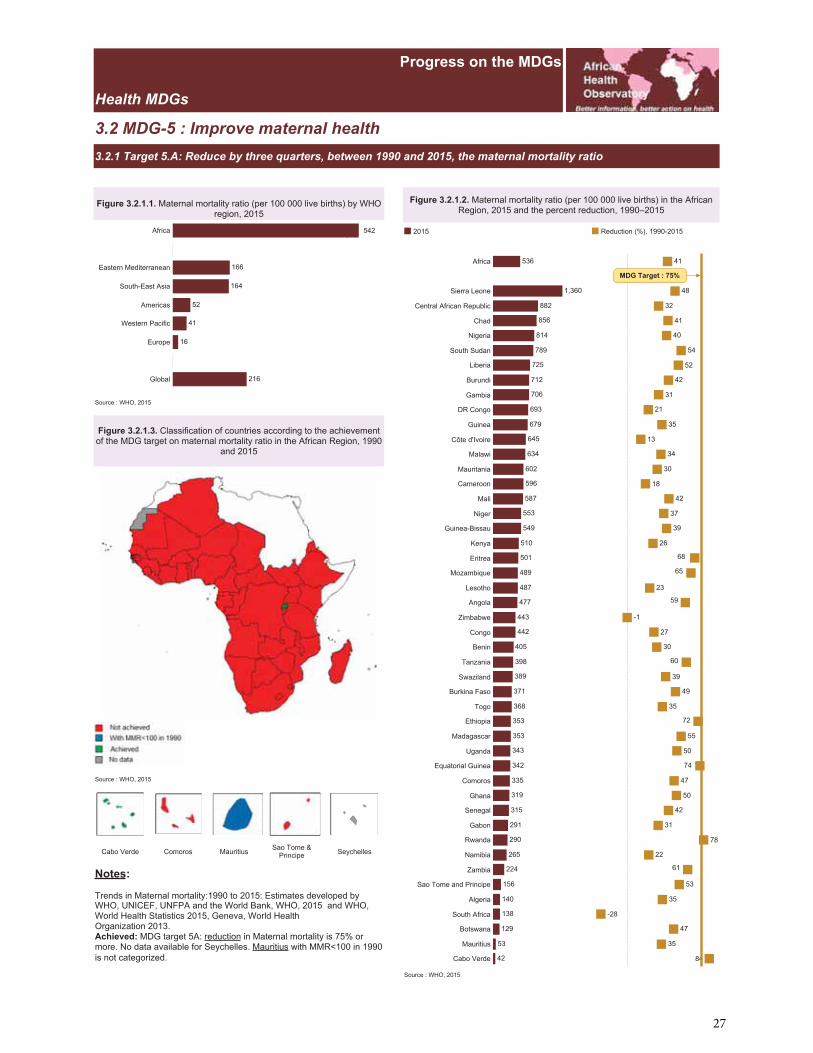
27
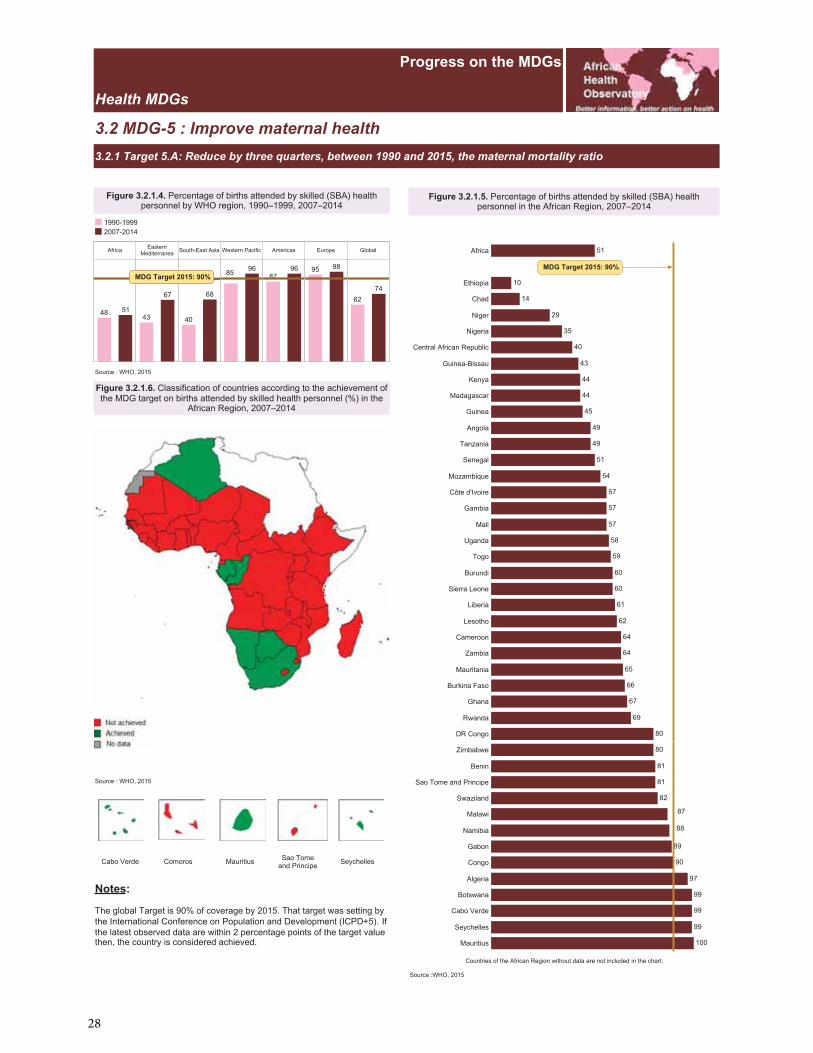
28
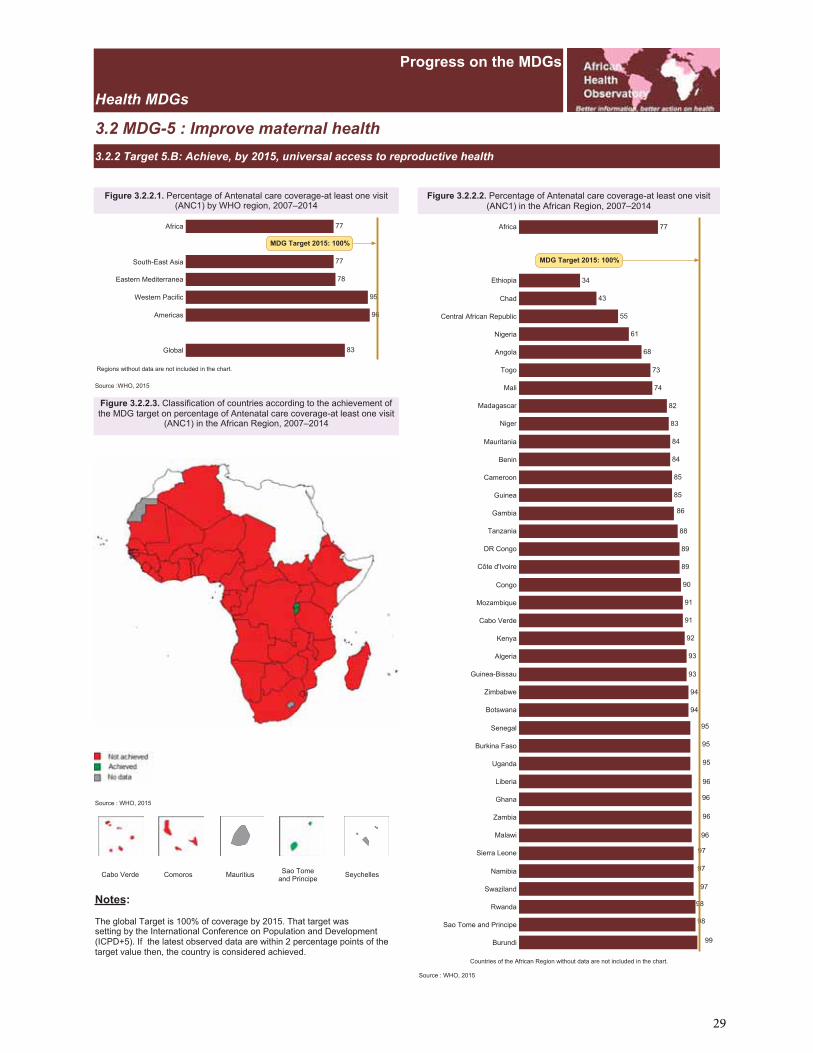
29
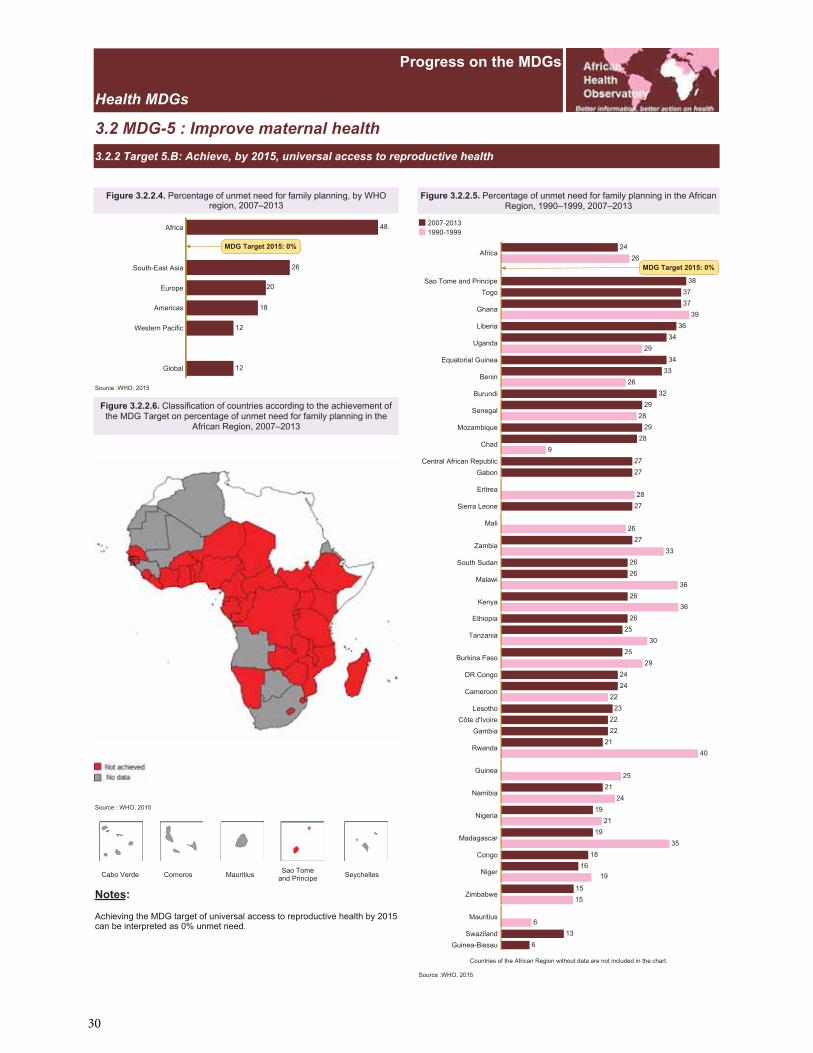
30
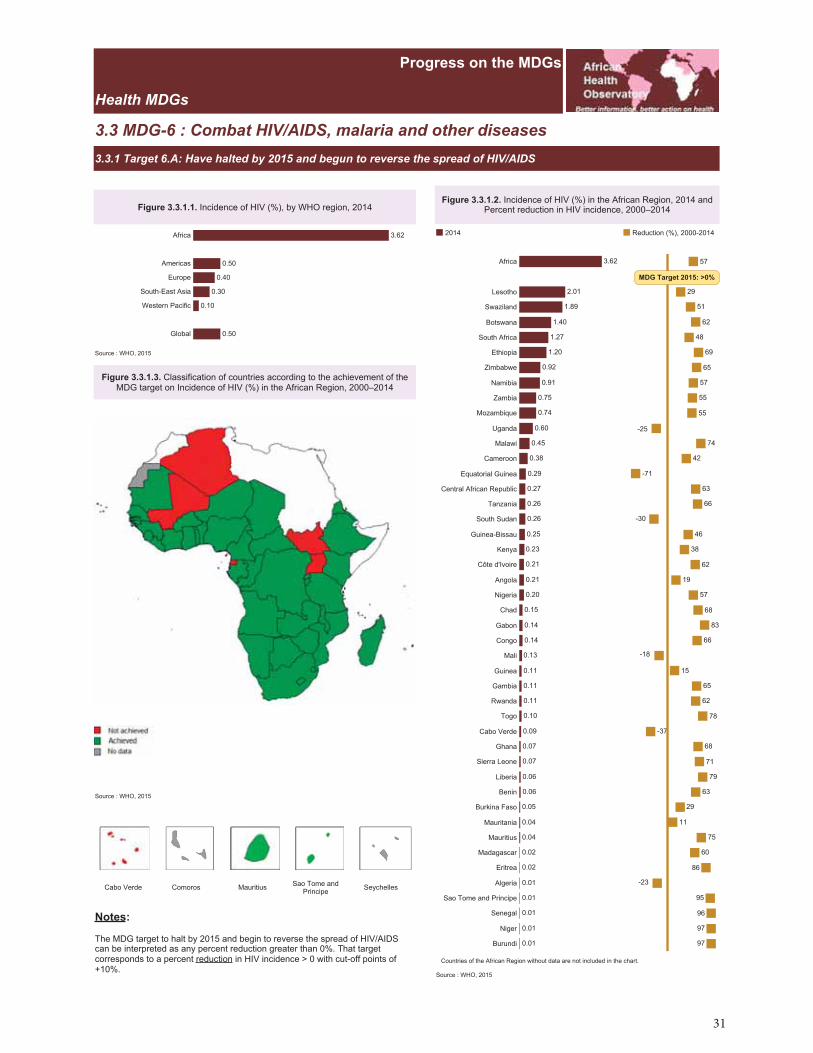
31
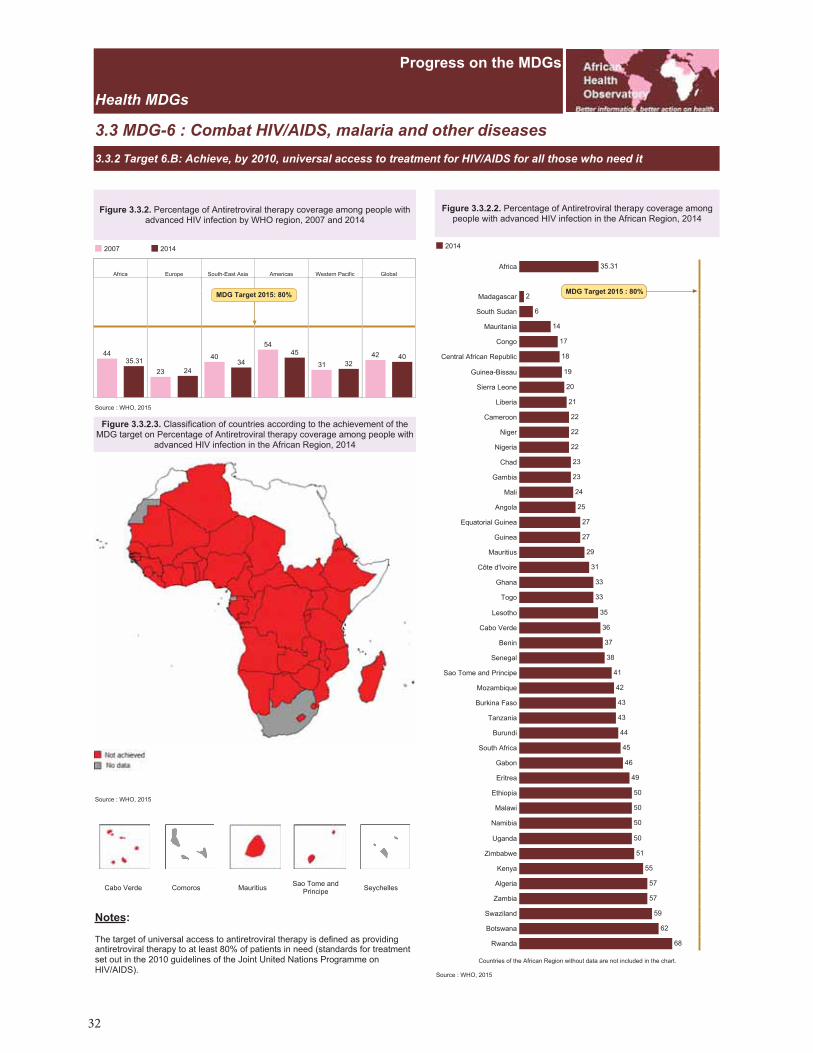
32
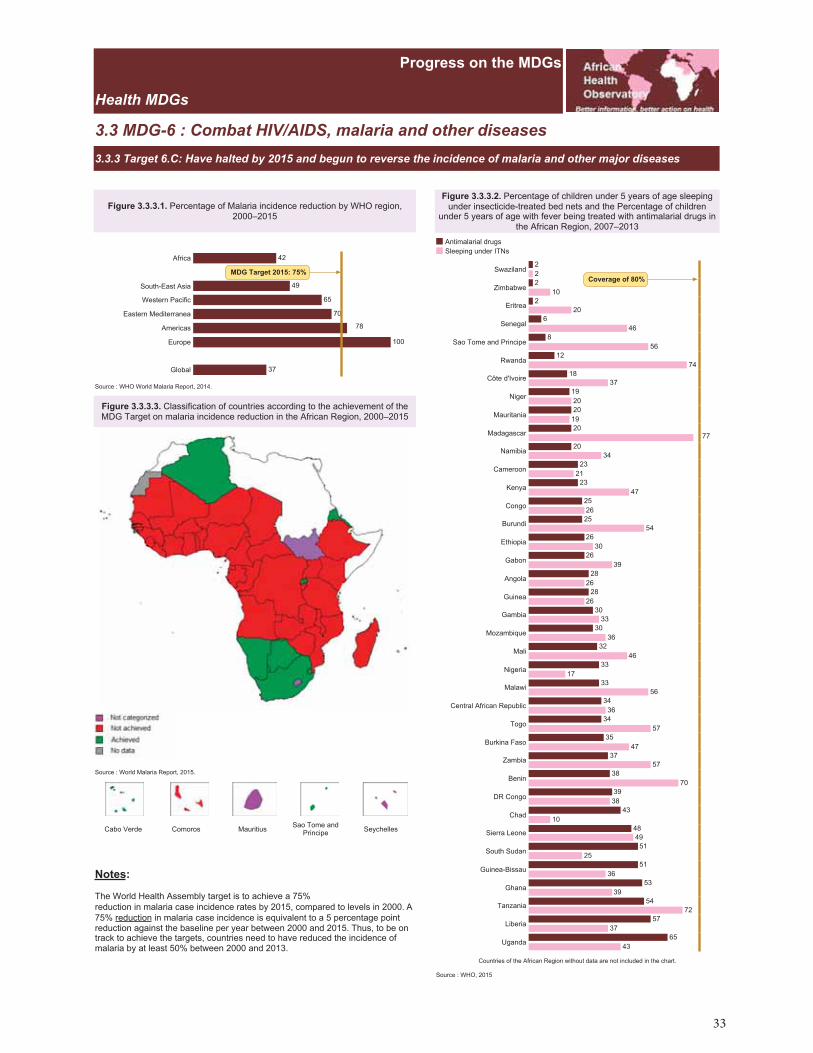
33

34
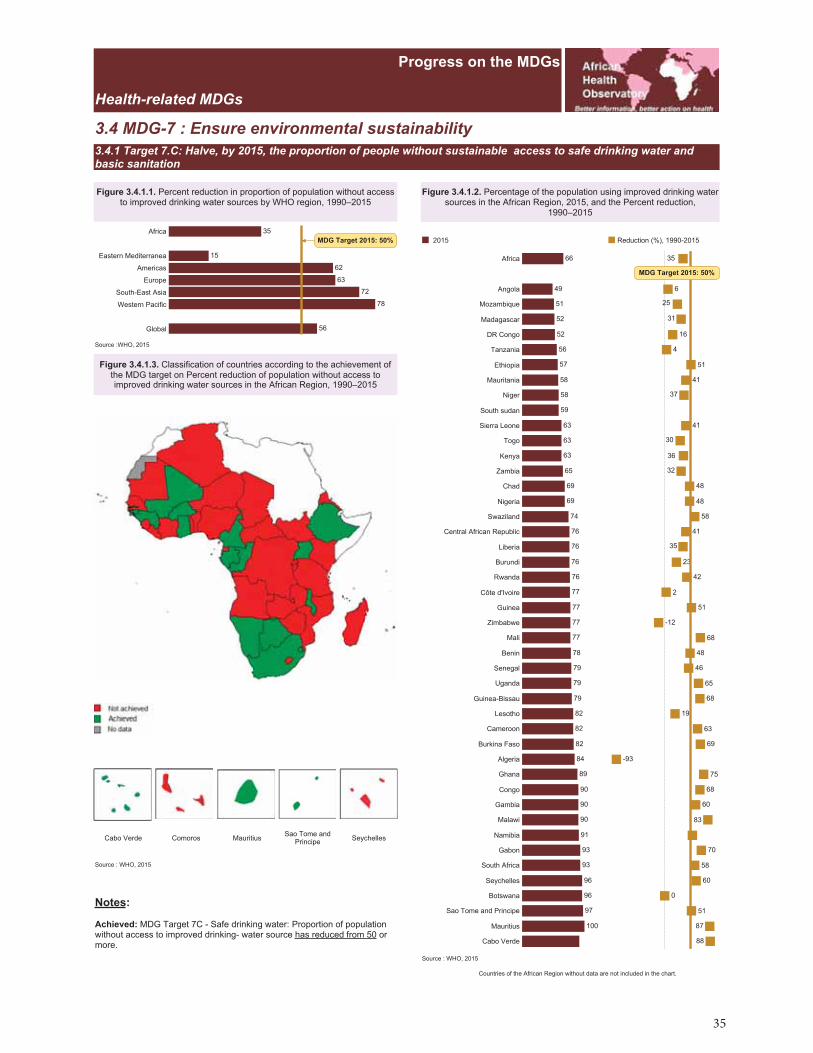
35

36
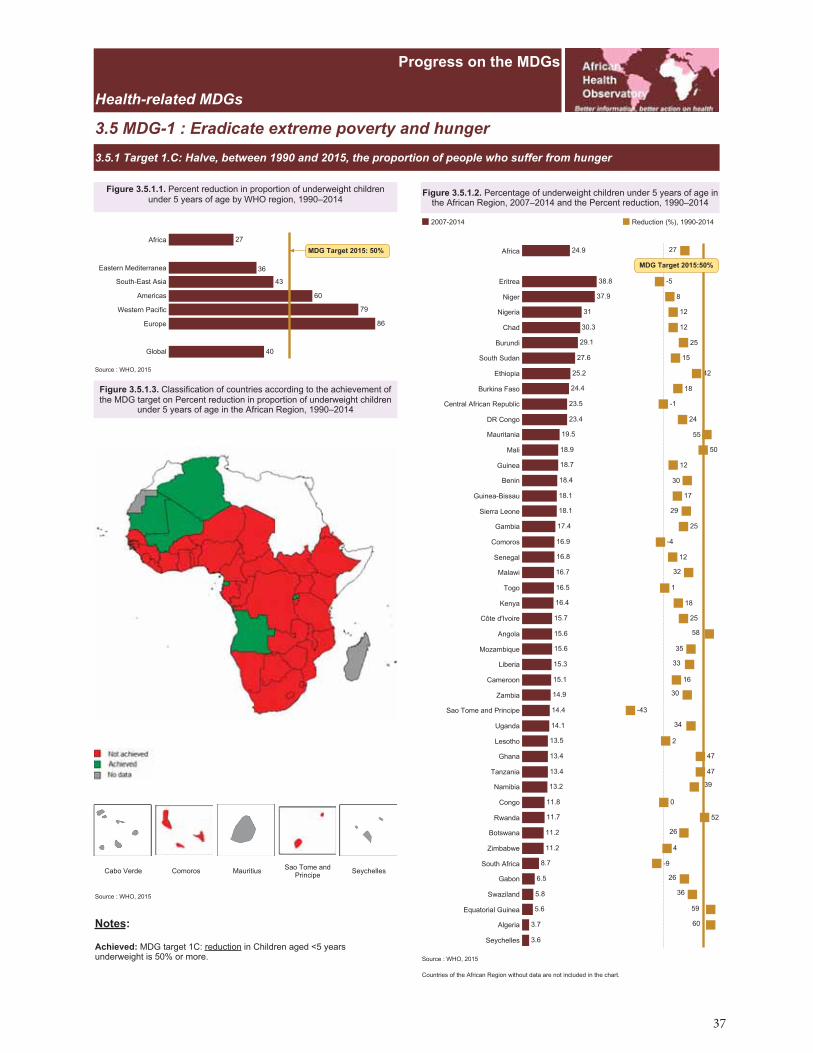
37
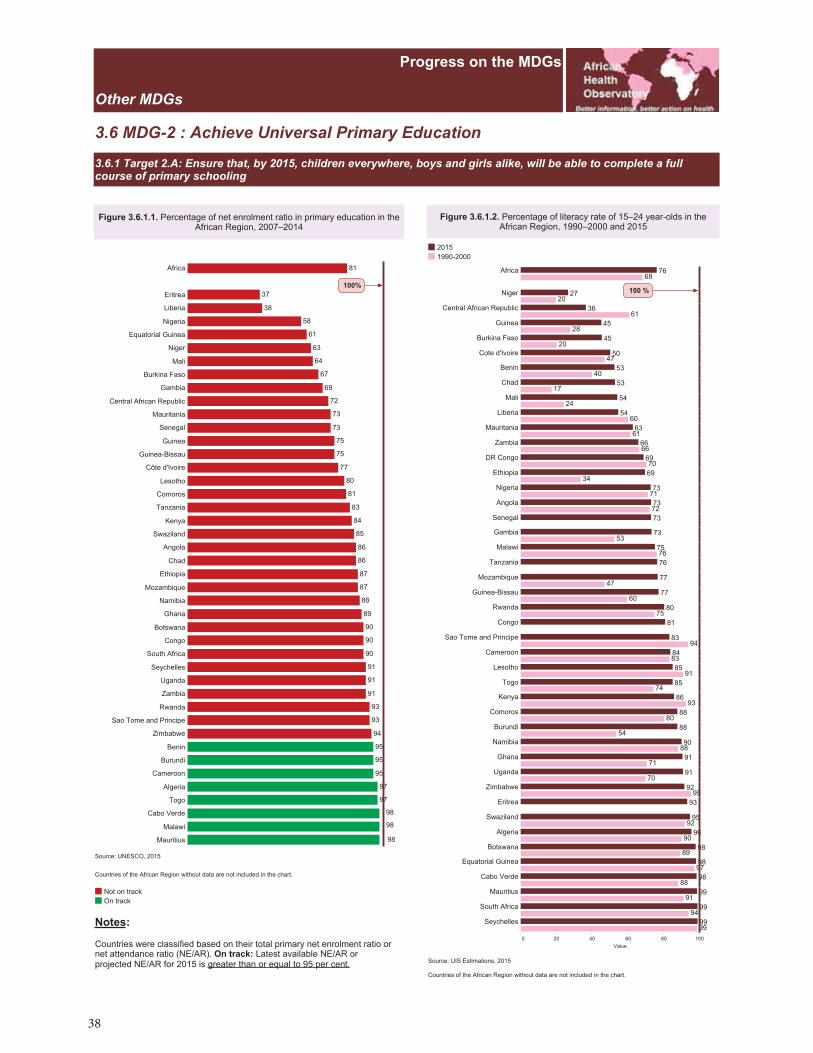
38
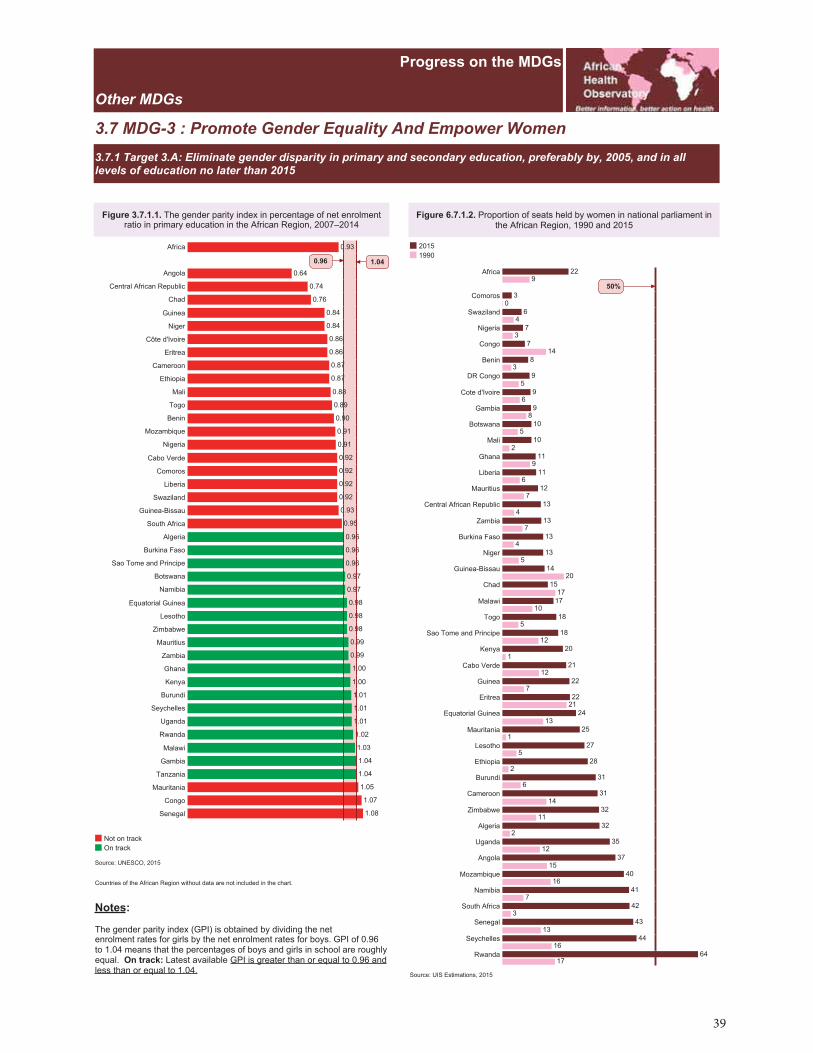
39

40
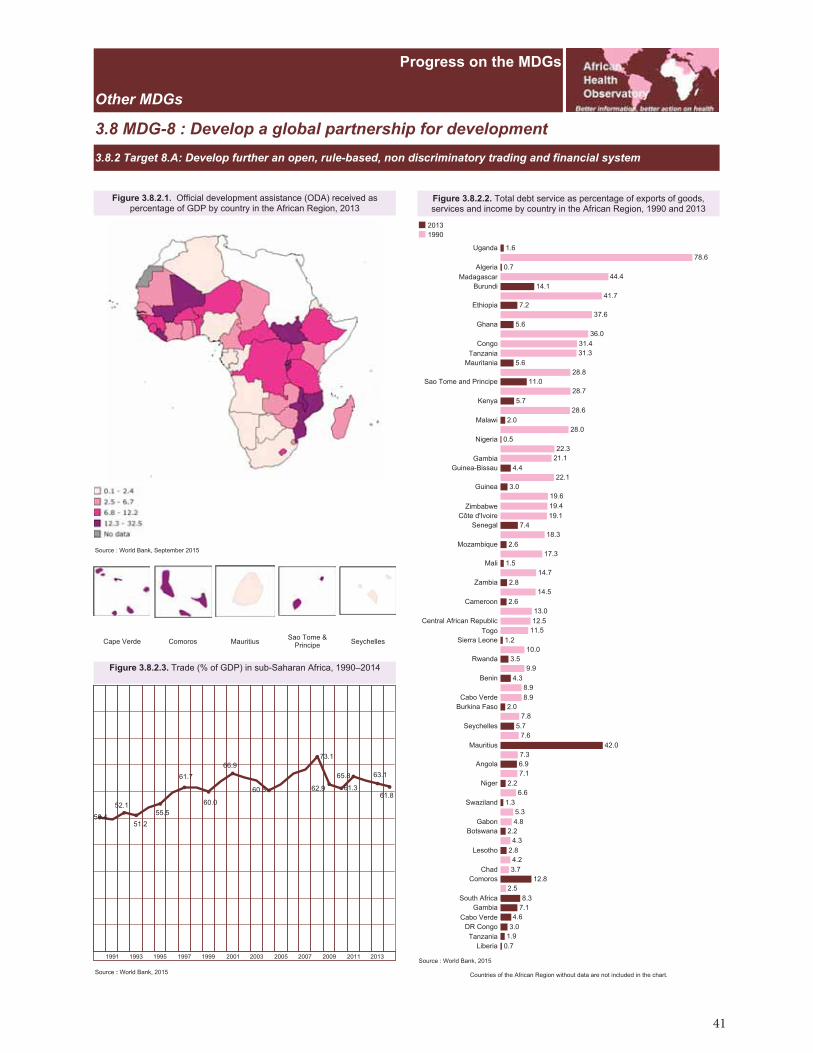
41

42
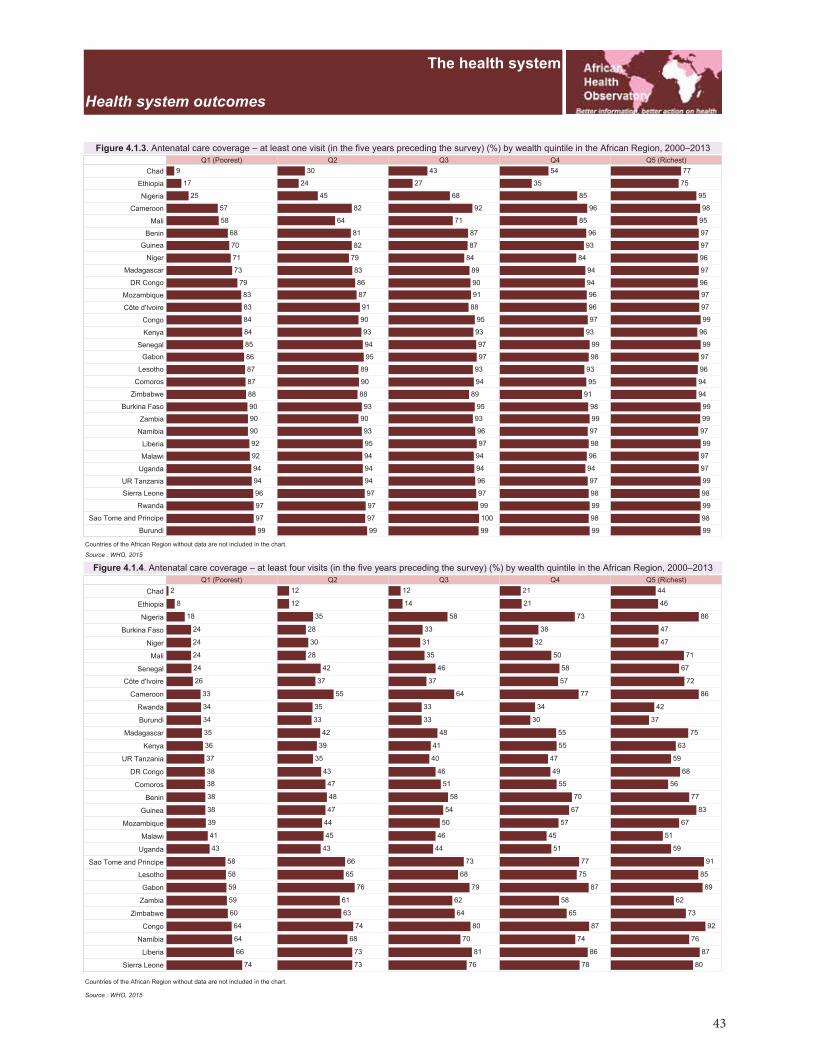
43
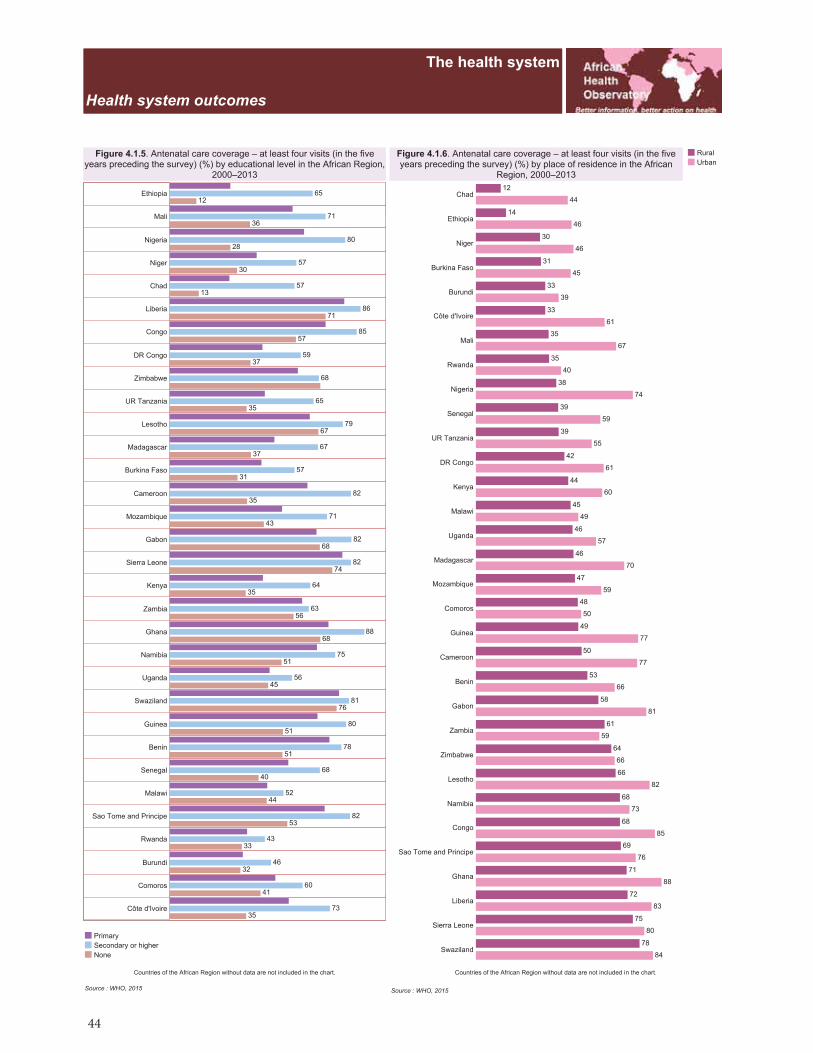
44
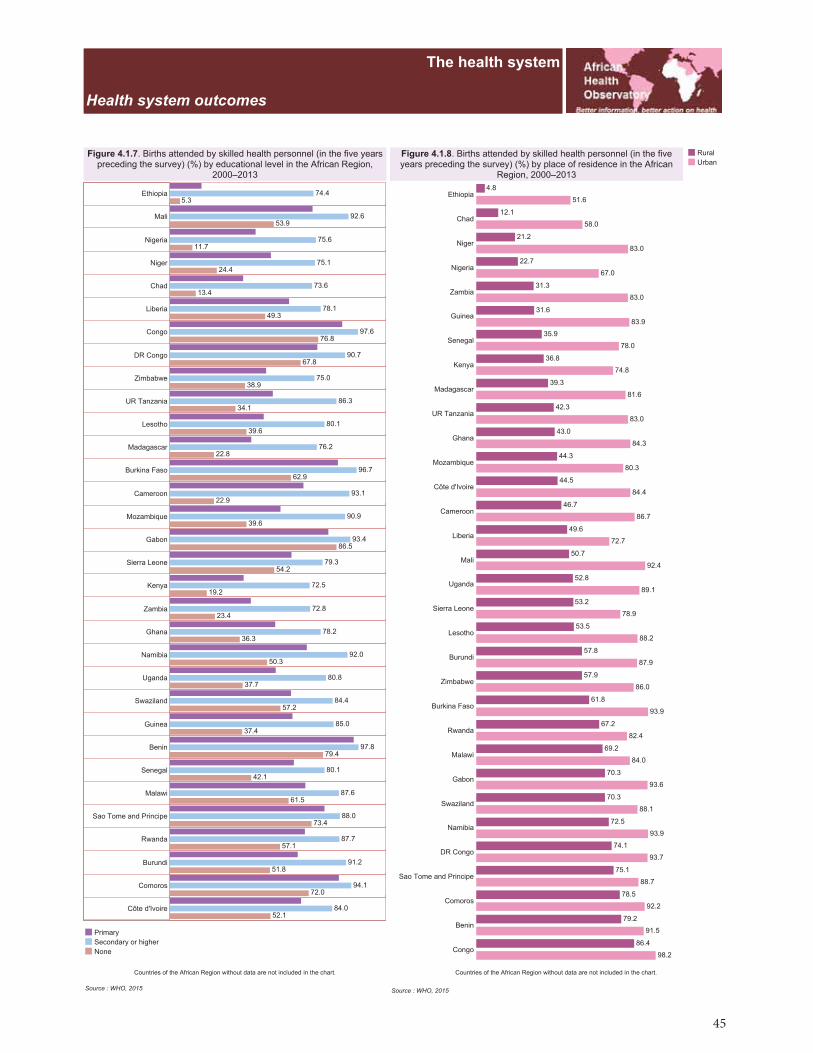
45
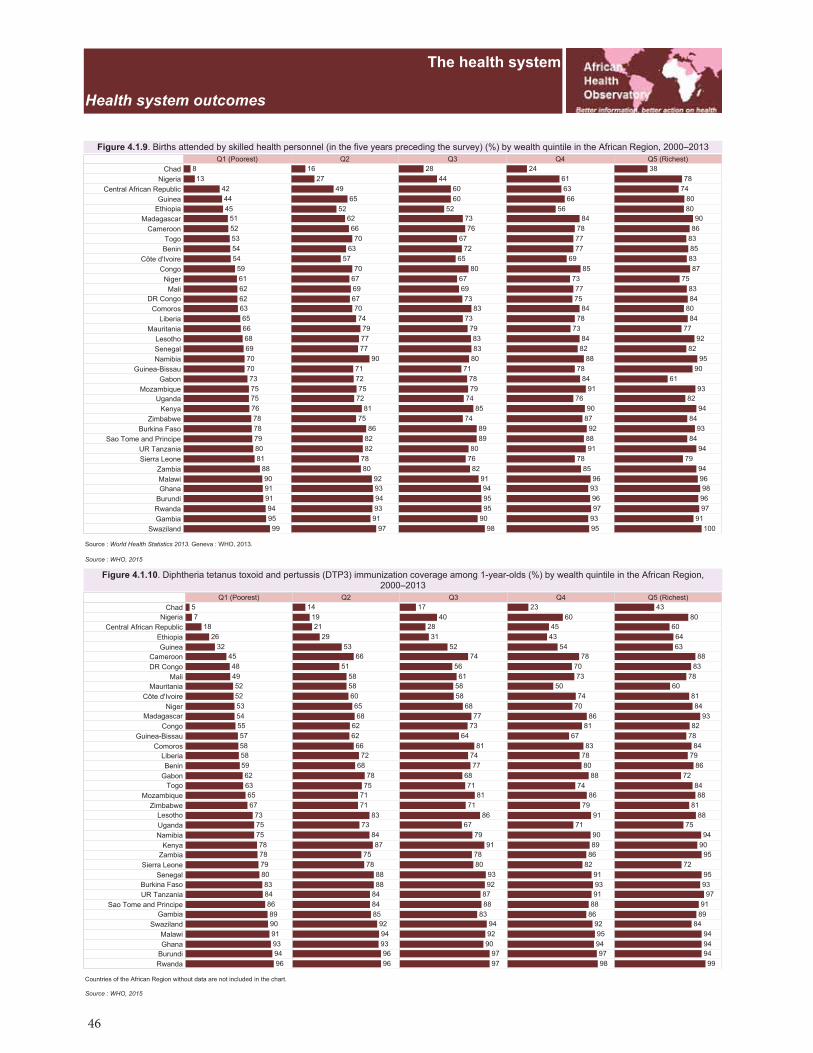
46
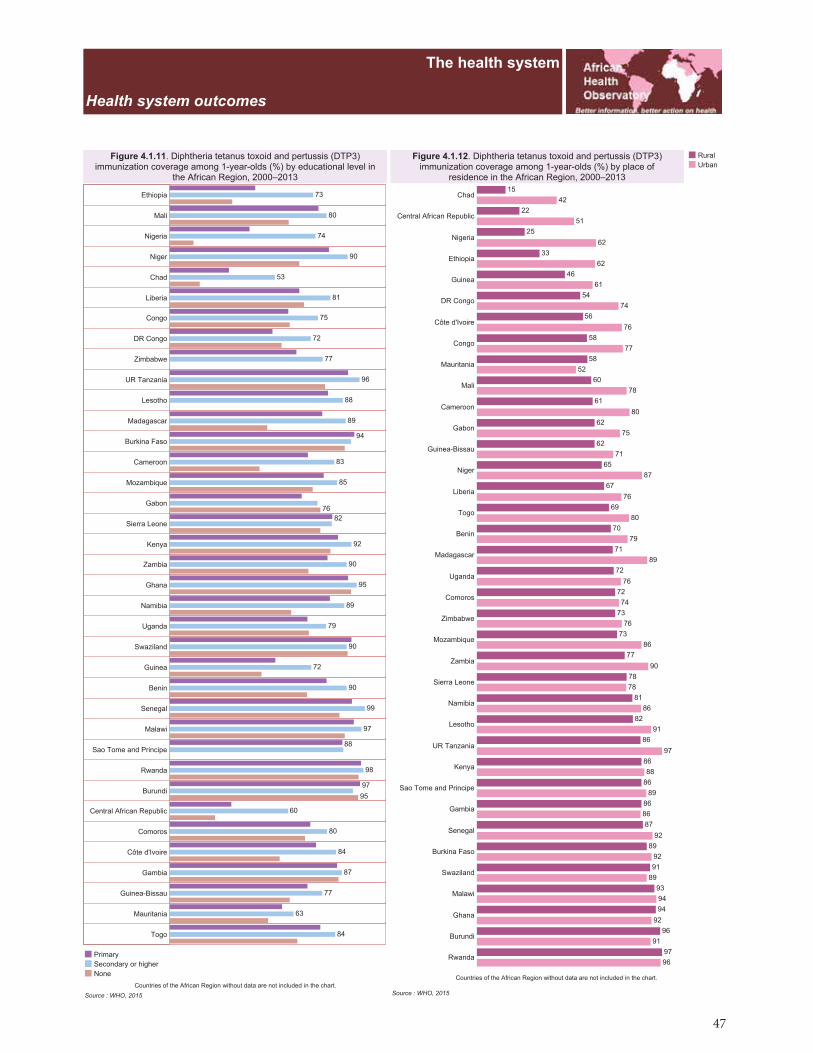
47
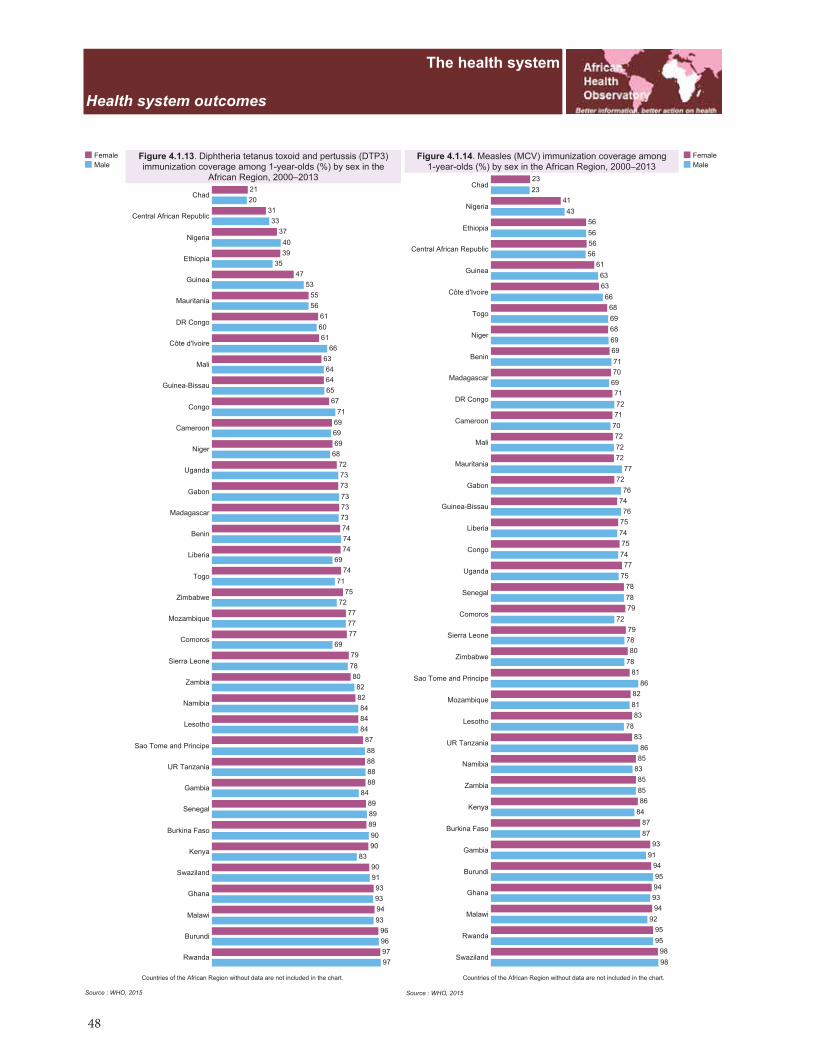
48

49

50
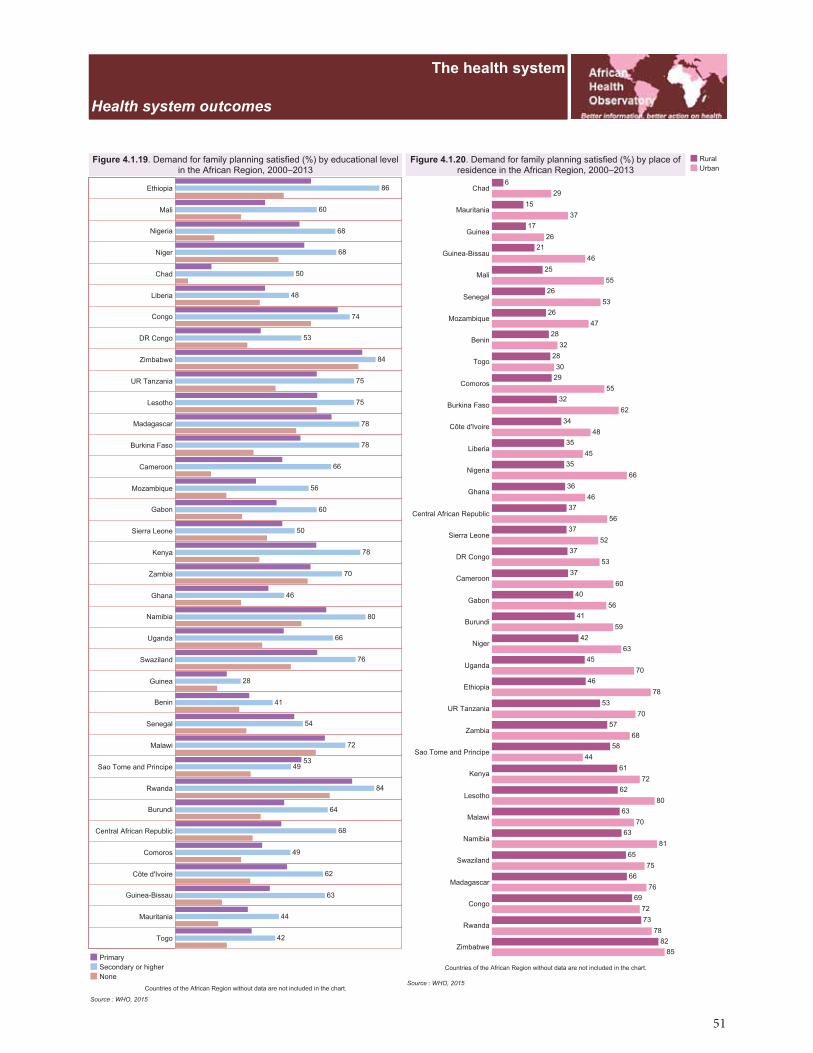
51

52
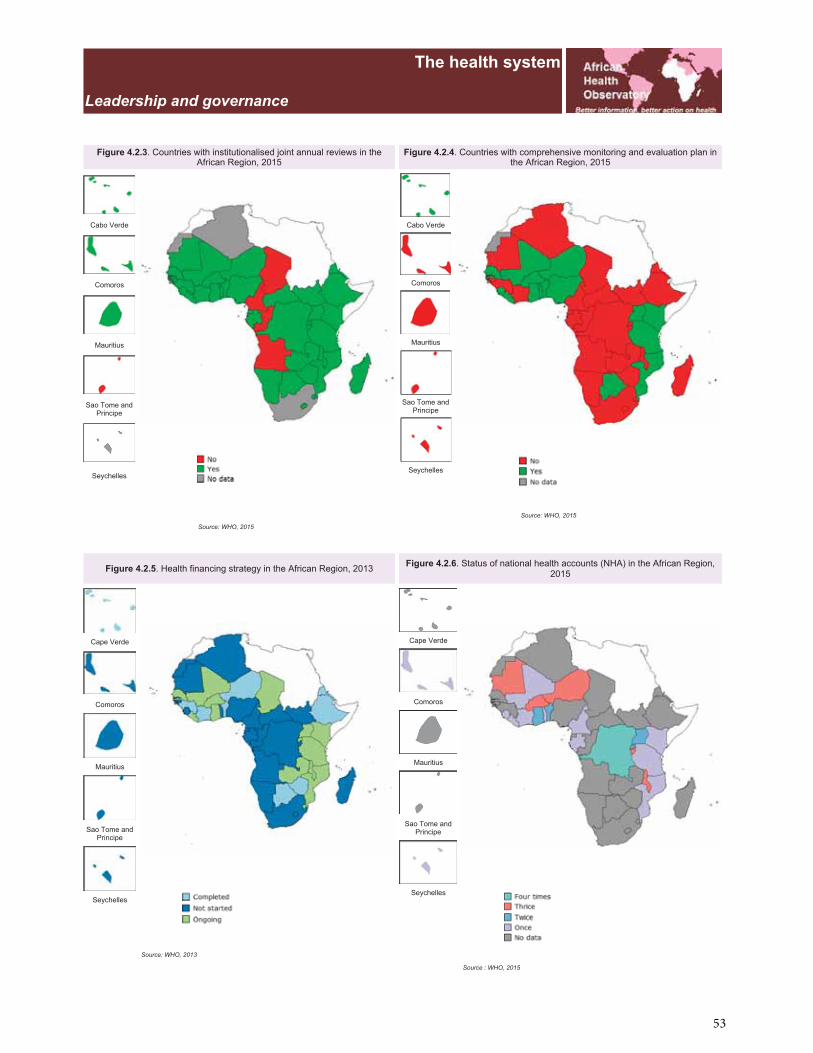
53

54
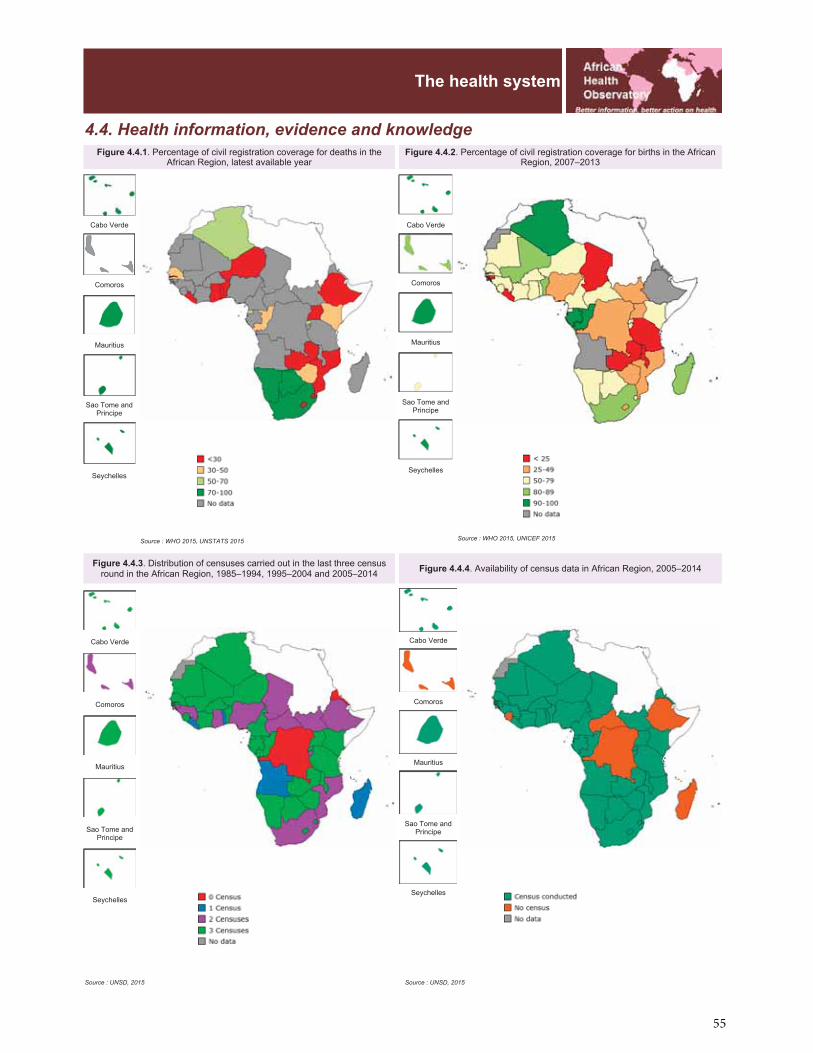
55
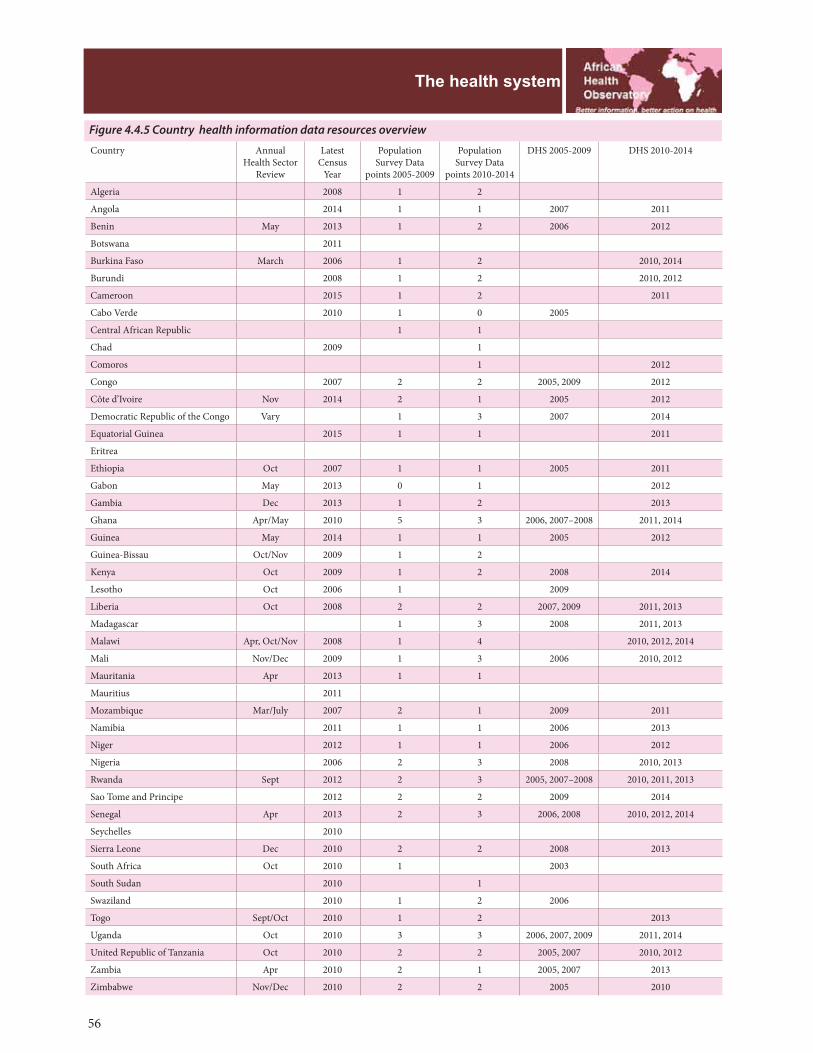
Country Annual Health Sector
Review
Latest Census
Year
Population Survey Data
points 2005-2009
Population Survey Data
points 2010-2014
DHS 2005-2009 DHS 2010-2014
Algeria 2008 1 2
Angola 2014 1 1 2007 2011
Benin May 2013 1 2 2006 2012
Botswana 2011
Burkina Faso March 2006 1 2 2010, 2014
Burundi 2008 1 2 2010, 2012
Cameroon 2015 1 2 2011
Cabo Verde 2010 1 0 2005
Central African Republic 1 1
Chad 2009 1
Comoros 1 2012
Congo 2007 2 2 2005, 2009 2012
Côte d’Ivoire Nov 2014 2 1 2005 2012
Democratic Republic of the Congo Vary 1 3 2007 2014
Equatorial Guinea 2015 1 1 2011
Eritrea
Ethiopia Oct 2007 1 1 2005 2011
Gabon May 2013 0 1 2012
Gambia Dec 2013 1 2 2013
Ghana Apr/May 2010 5 3 2006, 2007–2008 2011, 2014
Guinea May 2014 1 1 2005 2012
Guinea-Bissau Oct/Nov 2009 1 2
Kenya Oct 2009 1 2 2008 2014
Lesotho Oct 2006 1 2009
Liberia Oct 2008 2 2 2007, 2009 2011, 2013
Madagascar 1 3 2008 2011, 2013
Malawi Apr, Oct/Nov 2008 1 4 2010, 2012, 2014
Mali Nov/Dec 2009 1 3 2006 2010, 2012
Mauritania Apr 2013 1 1
Mauritius 2011
Mozambique Mar/July 2007 2 1 2009 2011
Namibia 2011 1 1 2006 2013
Niger 2012 1 1 2006 2012
Nigeria 2006 2 3 2008 2010, 2013
Rwanda Sept 2012 2 3 2005, 2007–2008 2010, 2011, 2013
Sao Tome and Principe 2012 2 2 2009 2014
Senegal Apr 2013 2 3 2006, 2008 2010, 2012, 2014
Seychelles 2010
Sierra Leone Dec 2010 2 2 2008 2013
South Africa Oct 2010 1 2003
South Sudan 2010 1
Swaziland 2010 1 2 2006
Togo Sept/Oct 2010 1 2 2013
Uganda Oct 2010 3 3 2006, 2007, 2009 2011, 2014
United Republic of Tanzania Oct 2010 2 2 2005, 2007 2010, 2012
Zambia Apr 2010 2 1 2005, 2007 2013
Zimbabwe Nov/Dec 2010 2 2 2005 2010
Figure 4.4.5 Country health information data resources overview
56

MICS 2005-2009
MICS 2010-2014
Developed eHealth Strategy
District Health Information
Software
Death Registration Coverage
Death Registration Year
Country
2006 2011, 2013 69% 2000 Algeria
Angola
2014 3% 1995 Benin
Yes 75% 2014 Botswana
2006 National Burkina Faso
2005 Partial Burundi
2006 2014 Yes Cameroon
Yes 100% 2012 Cabo Verde
2006 2010 Central African Republic
2010 Chad
Comoros
2014 Yes 41% 1994 Congo
2006 Yes Côte d’Ivoire
2010, 2014 Partial Democratic Republic of the Congo
2000 58% 1994 Equatorial Guinea
Eritrea
Yes 1.90% 2015 Ethiopia
Gabon
2006 2010 Yes National 10% 1994 Gambia
2006, 2007 2011 Yes National 25% 2014 Ghana
Guinea
2006 2010, 2014 Guinea-Bissau
2008, 2011 2014 Yes National 46% 2014 Kenya
20% 1994 Lesotho
National 5% 2014 Liberia
2012 Yes Madagascar
2006 2013 Yes Partial Malawi
2010 Mali
2007 2011 Mauritania
Yes 100% 2013 Mauritius
2008 Yes National 12% 2013 Mozambique
89% 2011 Namibia
2% 1995 Niger
2007 2011 Yes National Some registered Nigeria
Yes National 51% 1994 Rwanda
2006 2014 90% Sao Tome and Principe
Yes 39% 1994 Senegal
100% 2012 Seychelles
2005 2010 National Sierra Leone
Yes Partial 91% 2010 South Africa
2010 South Sudan
2010, 2014 26% 1994 Swaziland
2006 2010 Yes 15% 1994 Togo
Yes National 25% 1994 Uganda
Yes National United Republic of Tanzania
Yes National 10% 1994 Zambia
2009 2014 Yes National 30% 1994 Zimbabwe
57
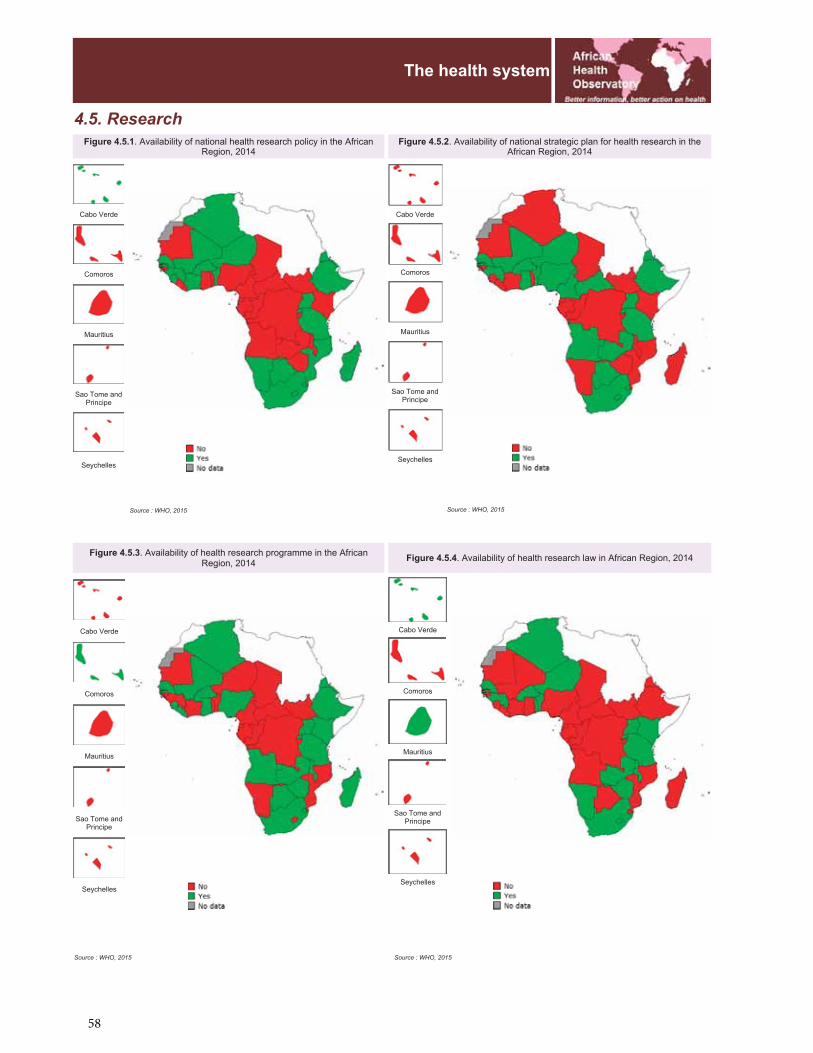
58
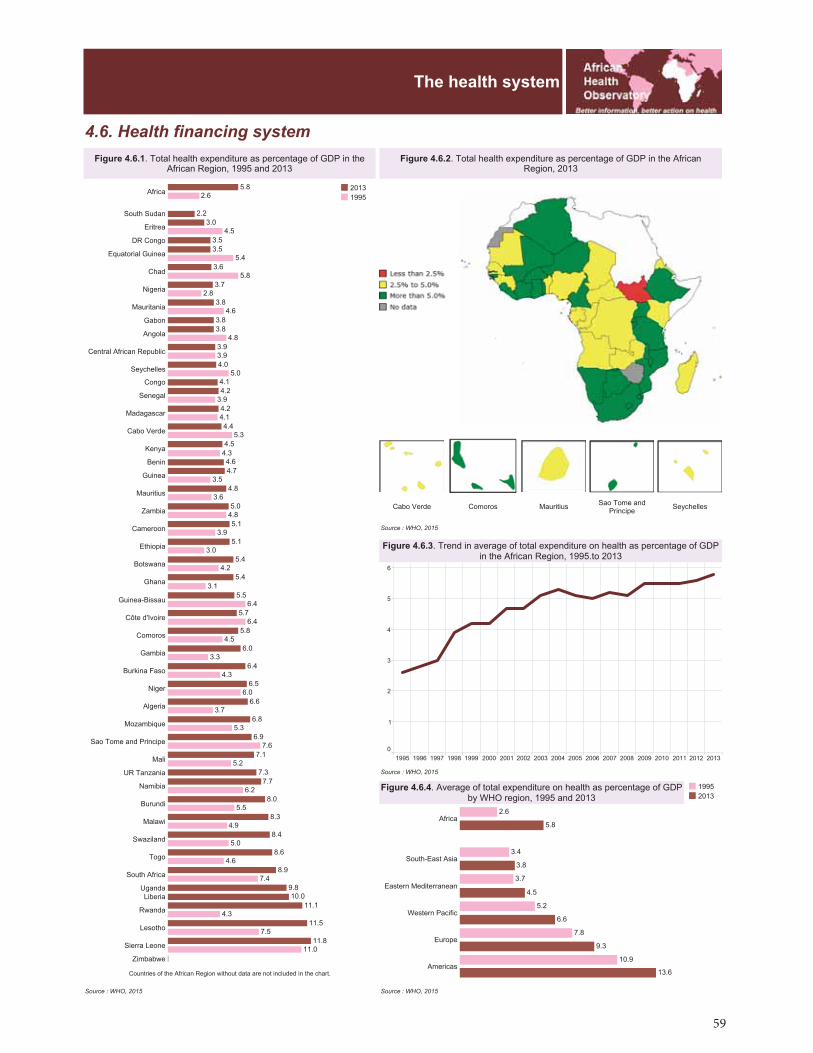
59
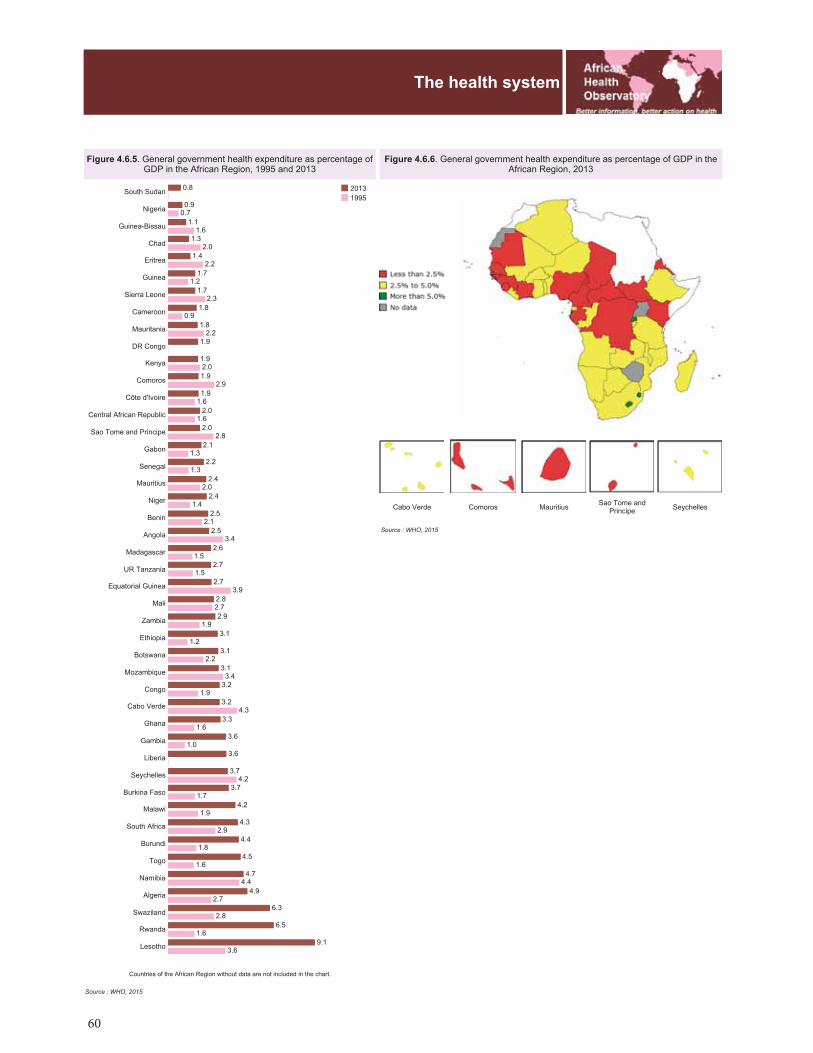
60
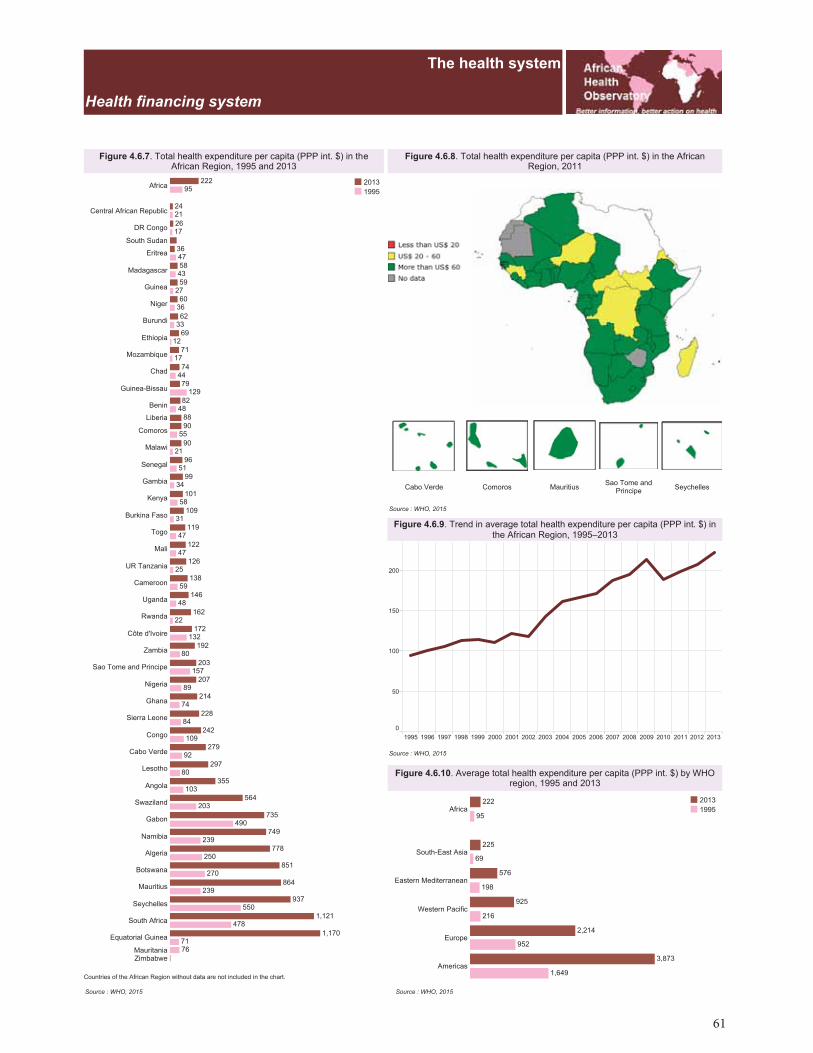
61
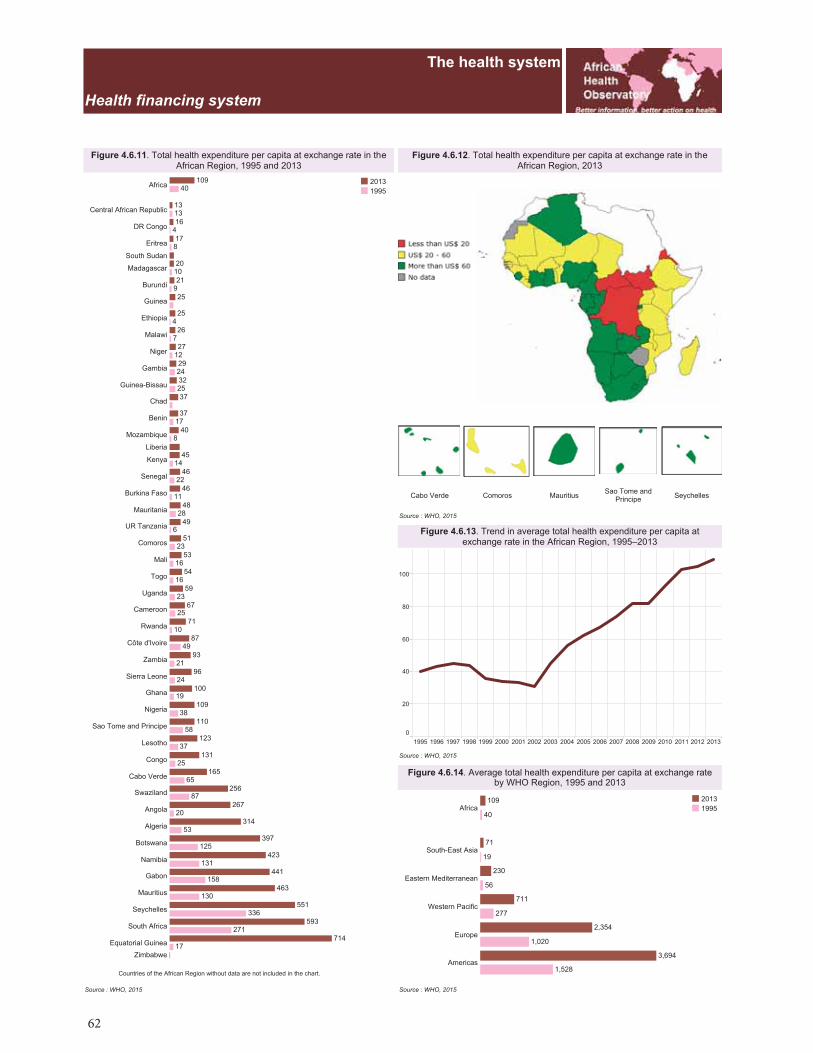
62
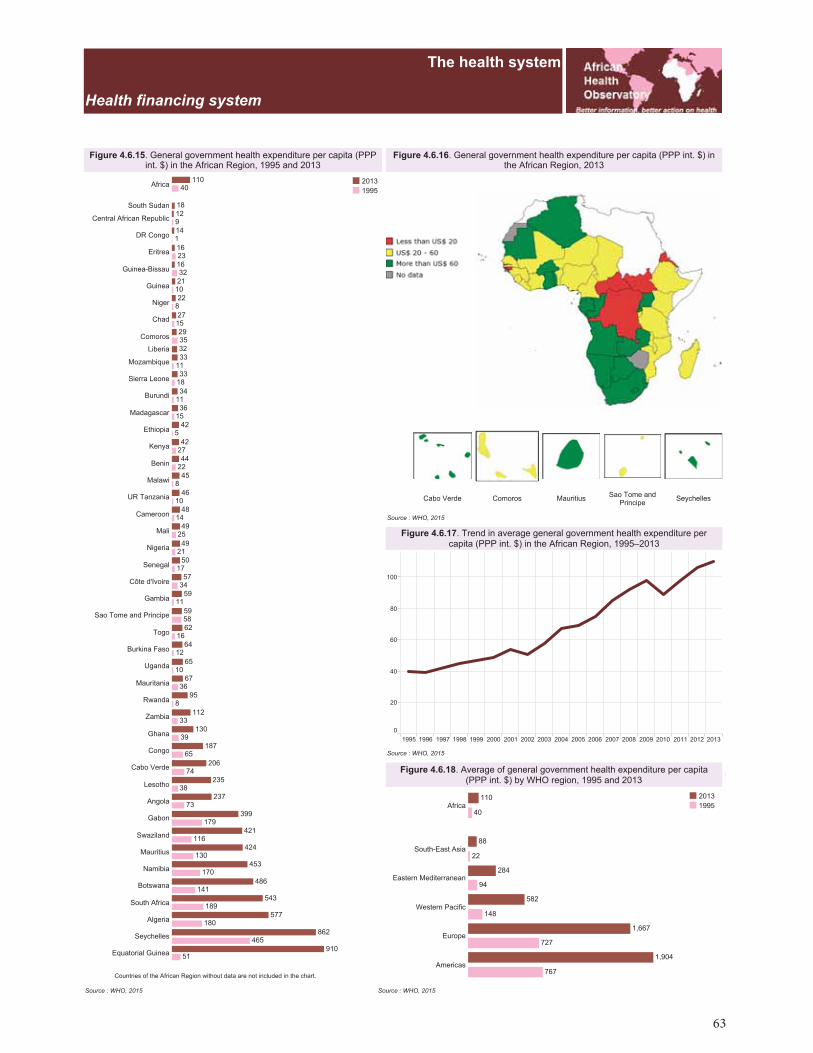
63
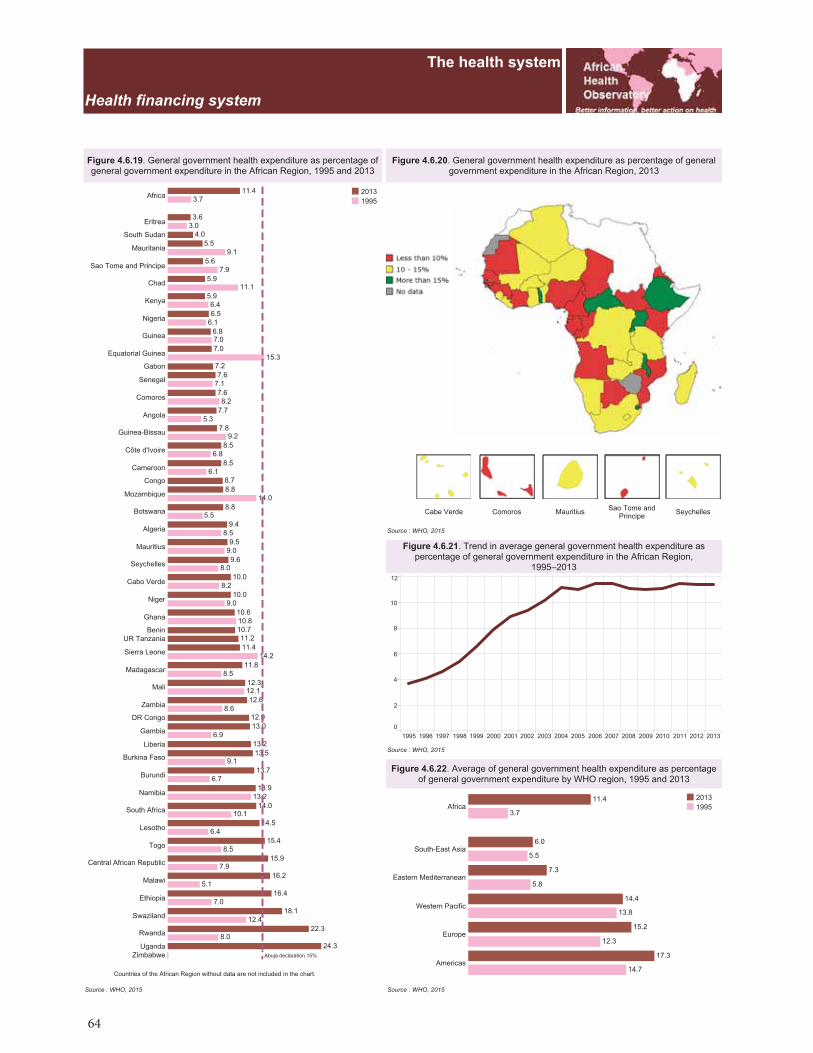
64

65
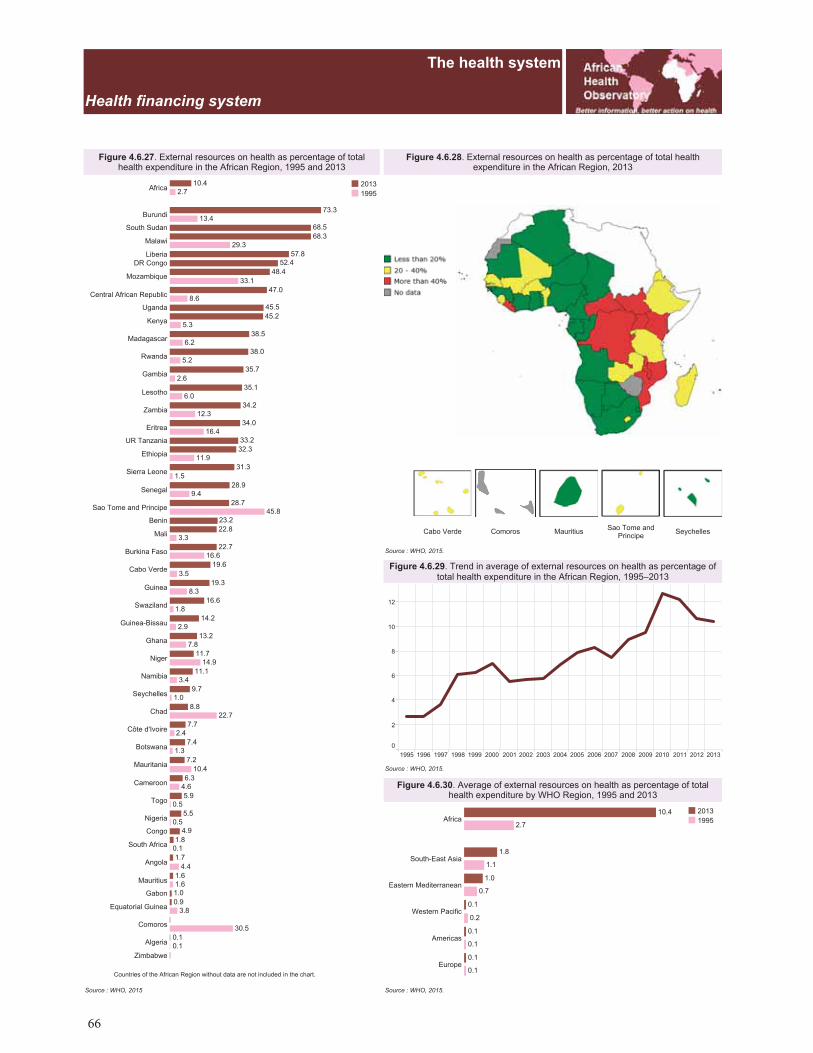
66
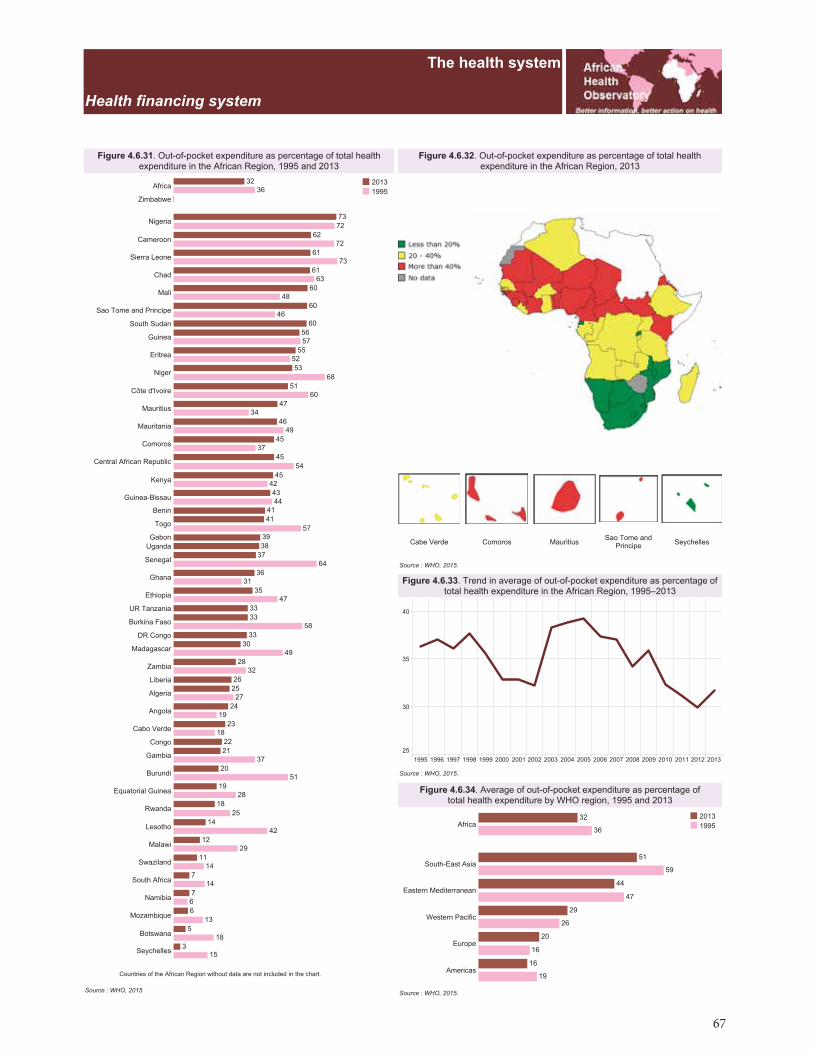
67
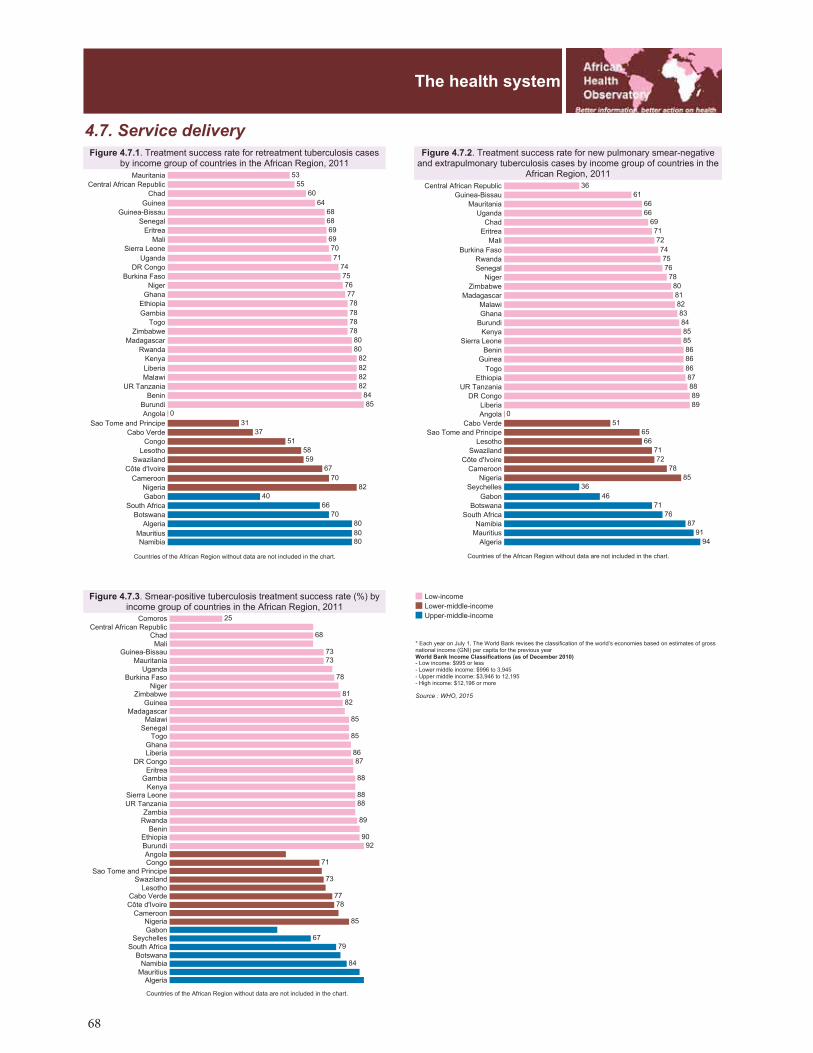
68
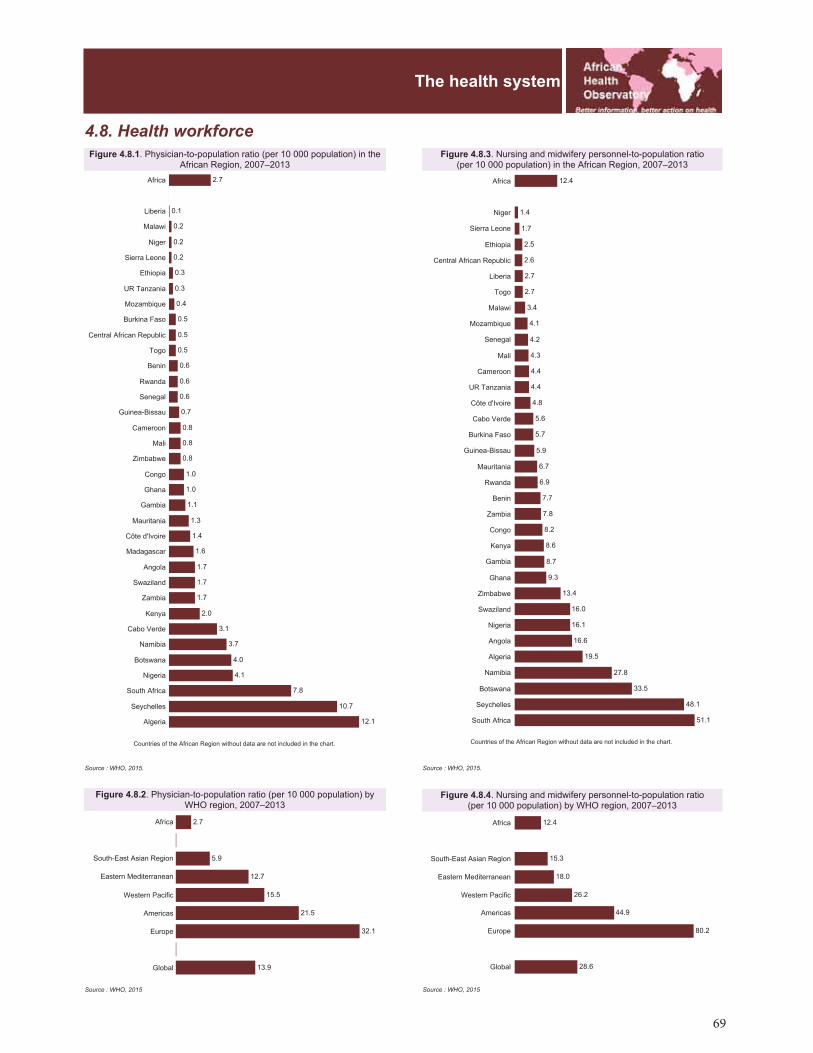
69
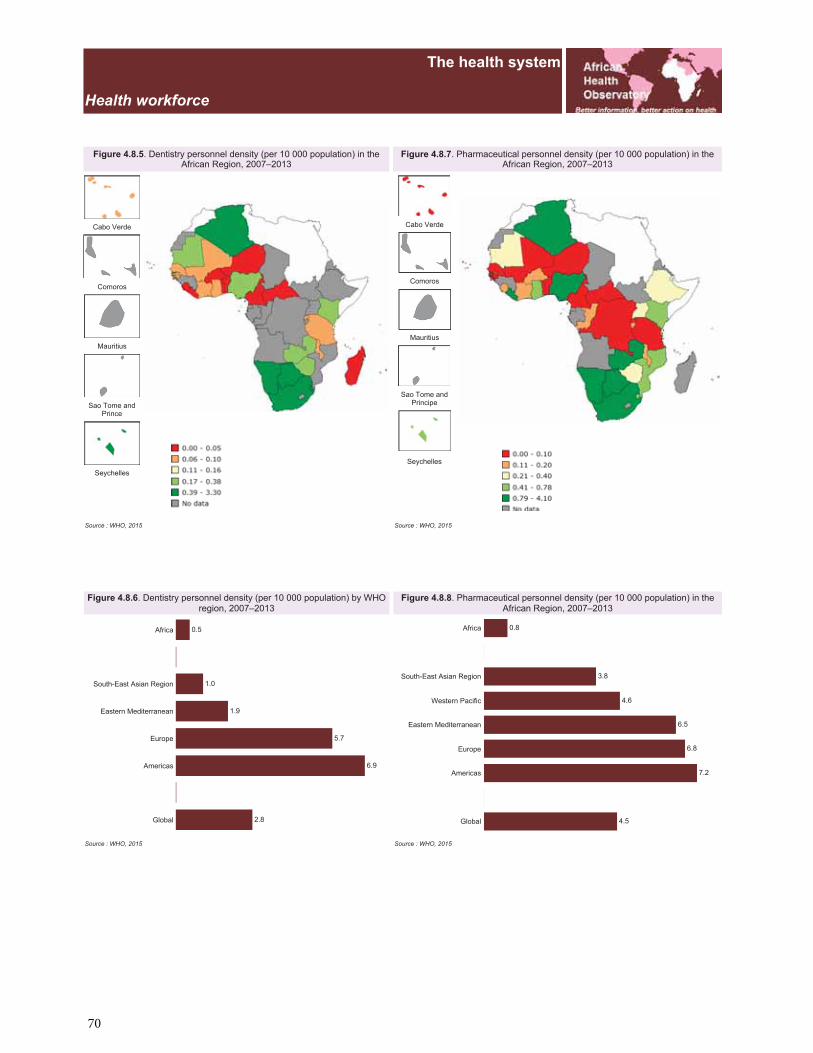
70
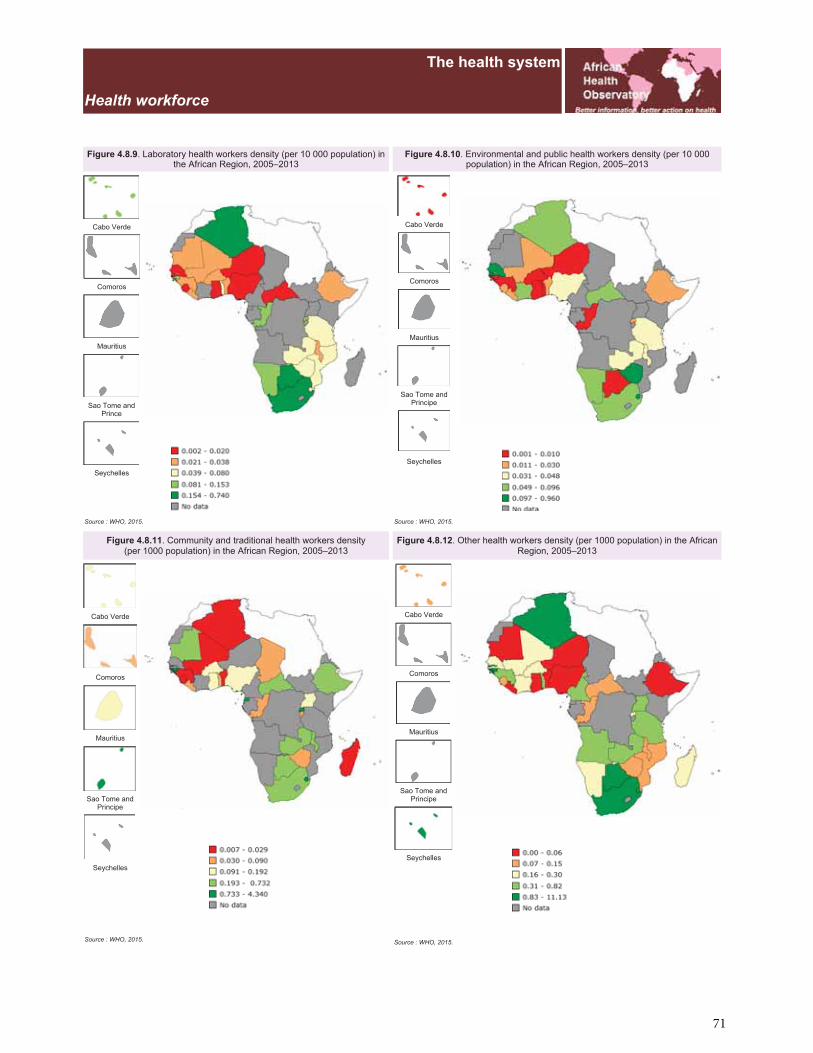
71
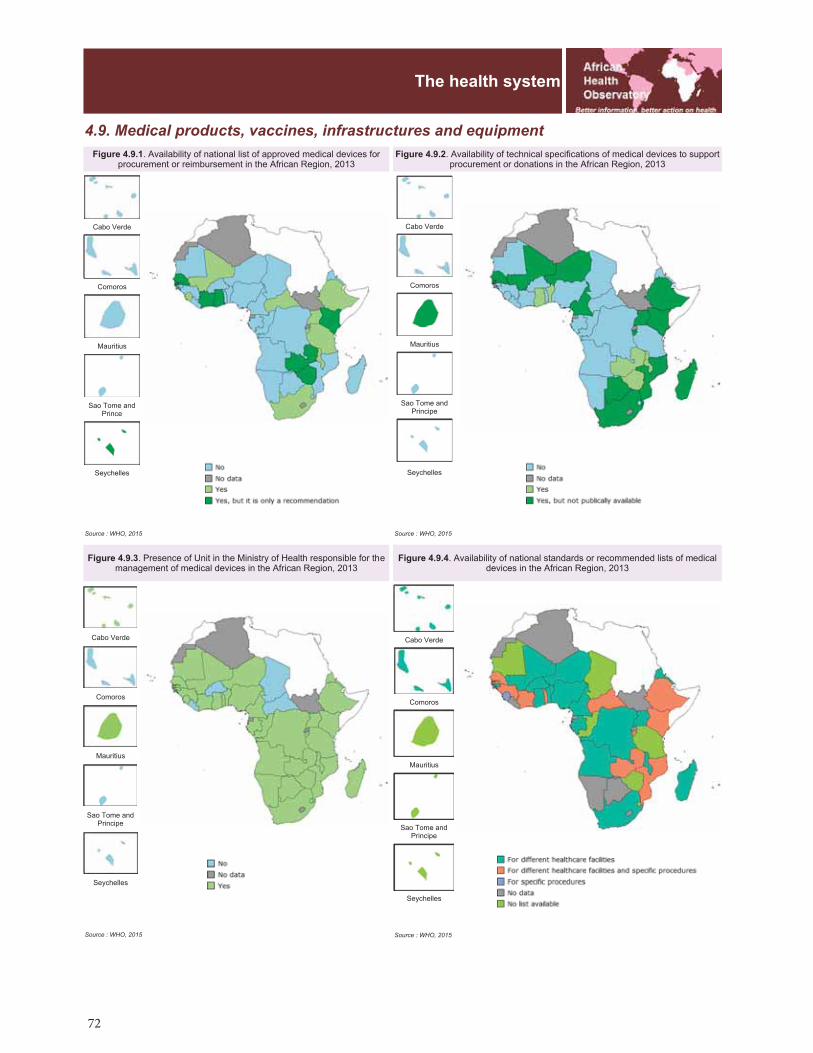
72
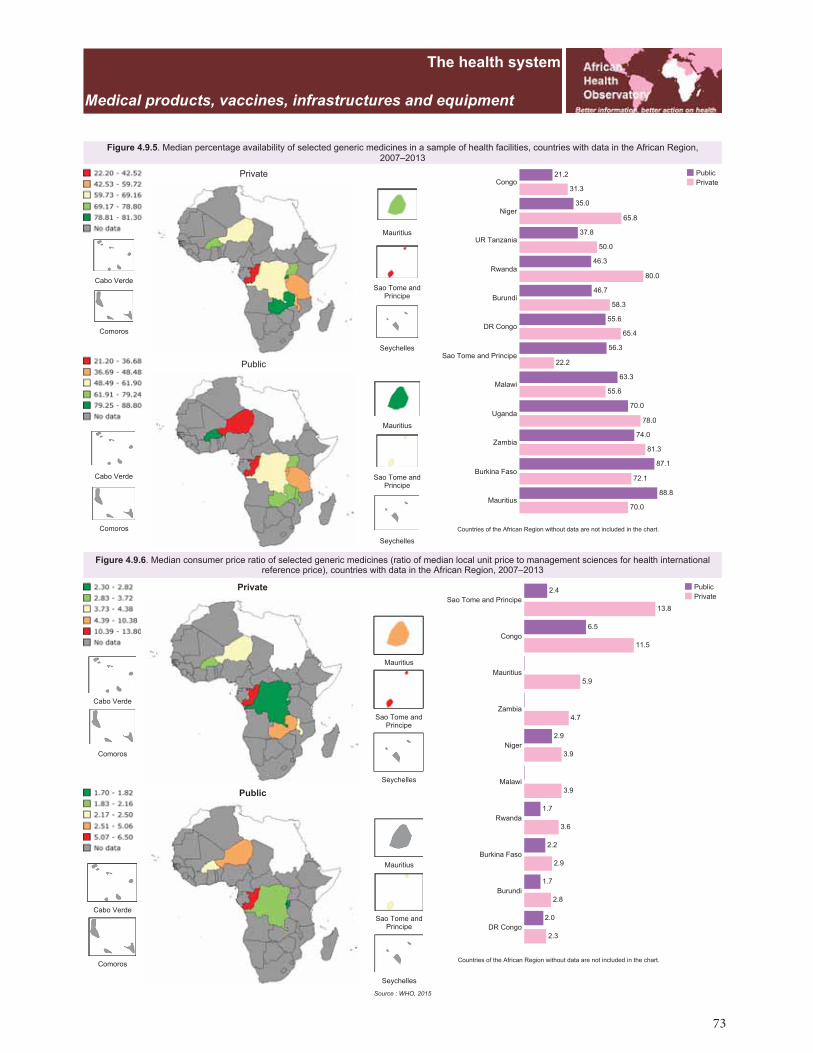
73
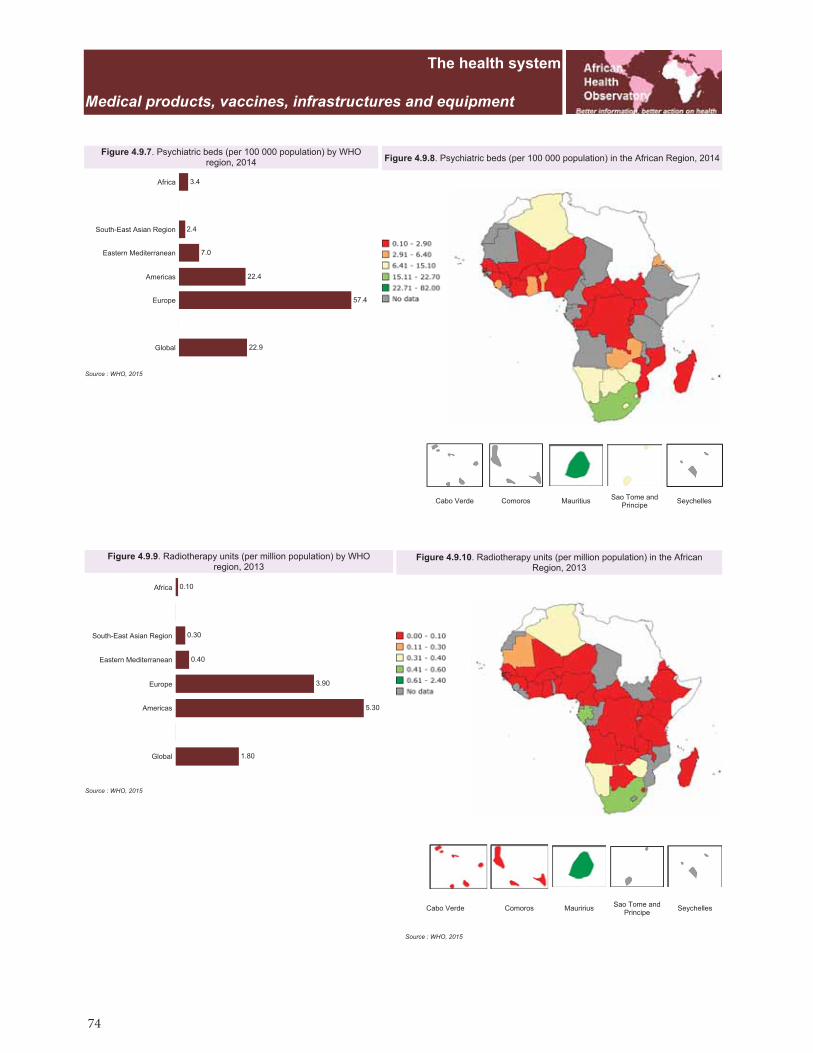
74
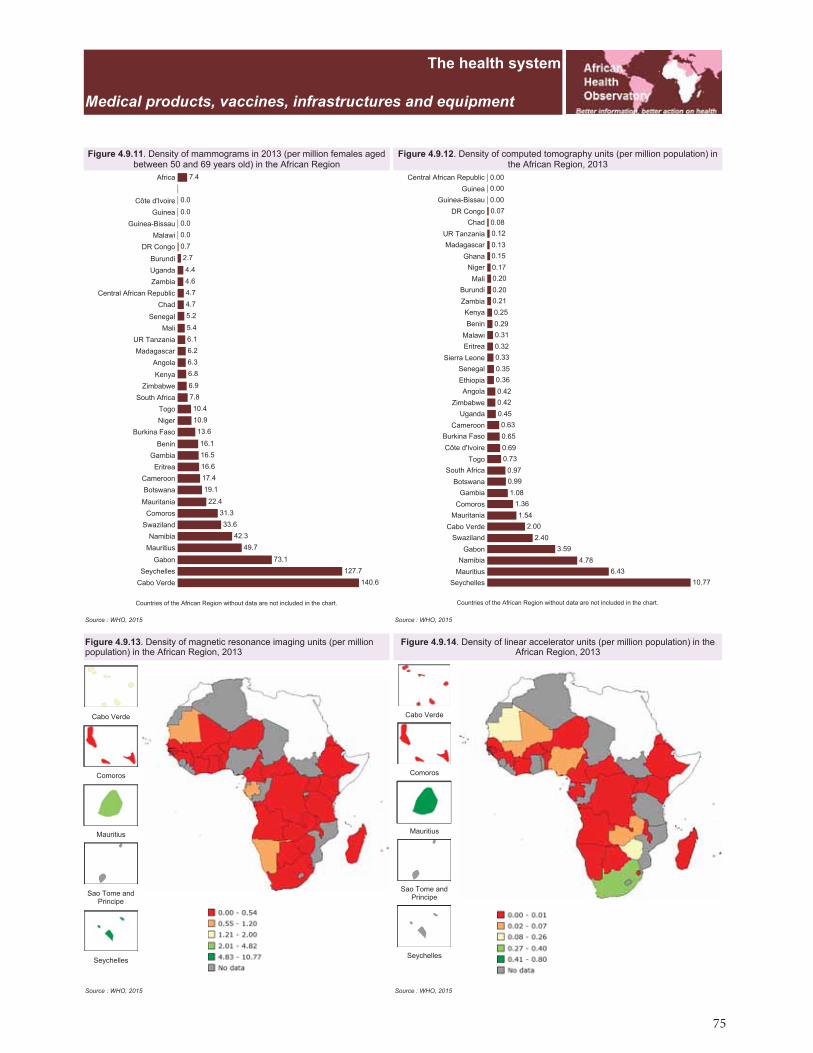
75
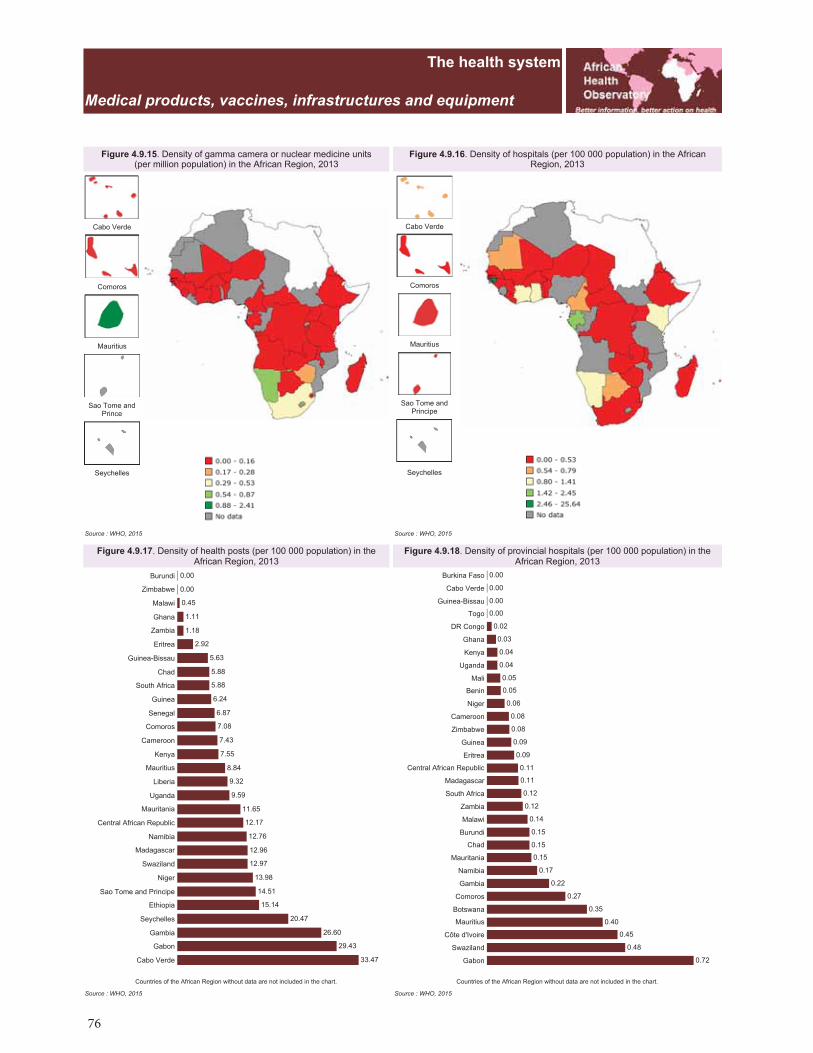
76
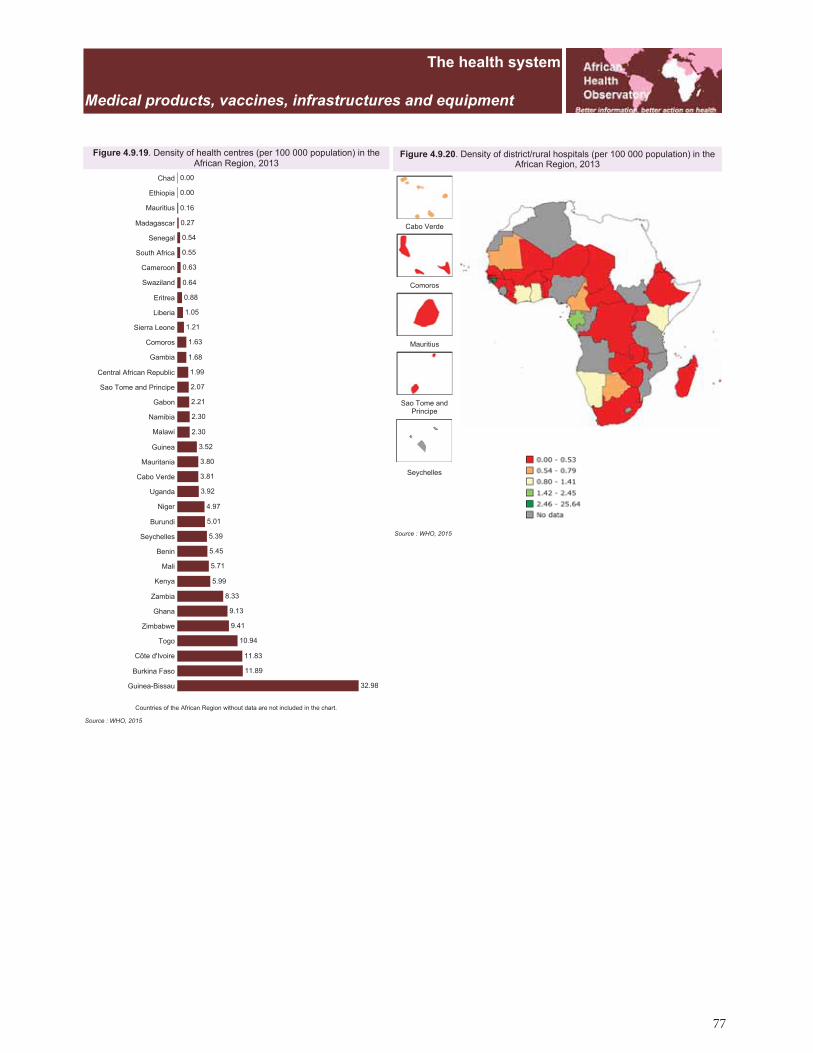
77
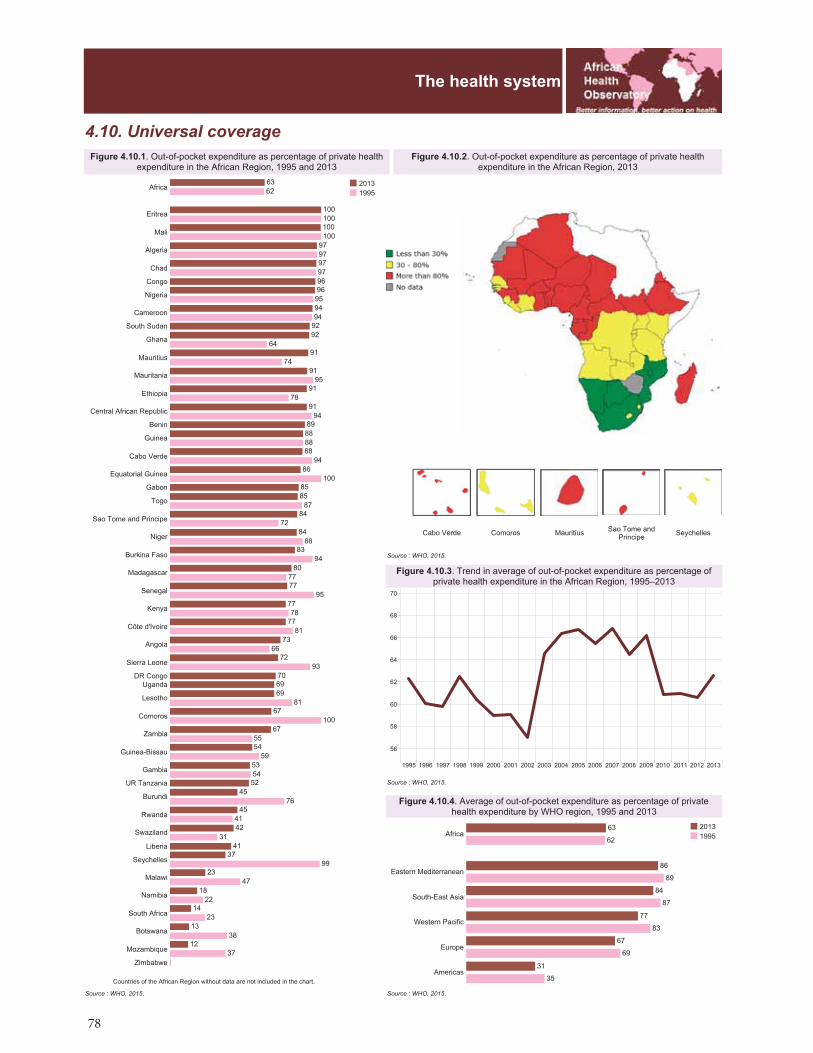
78
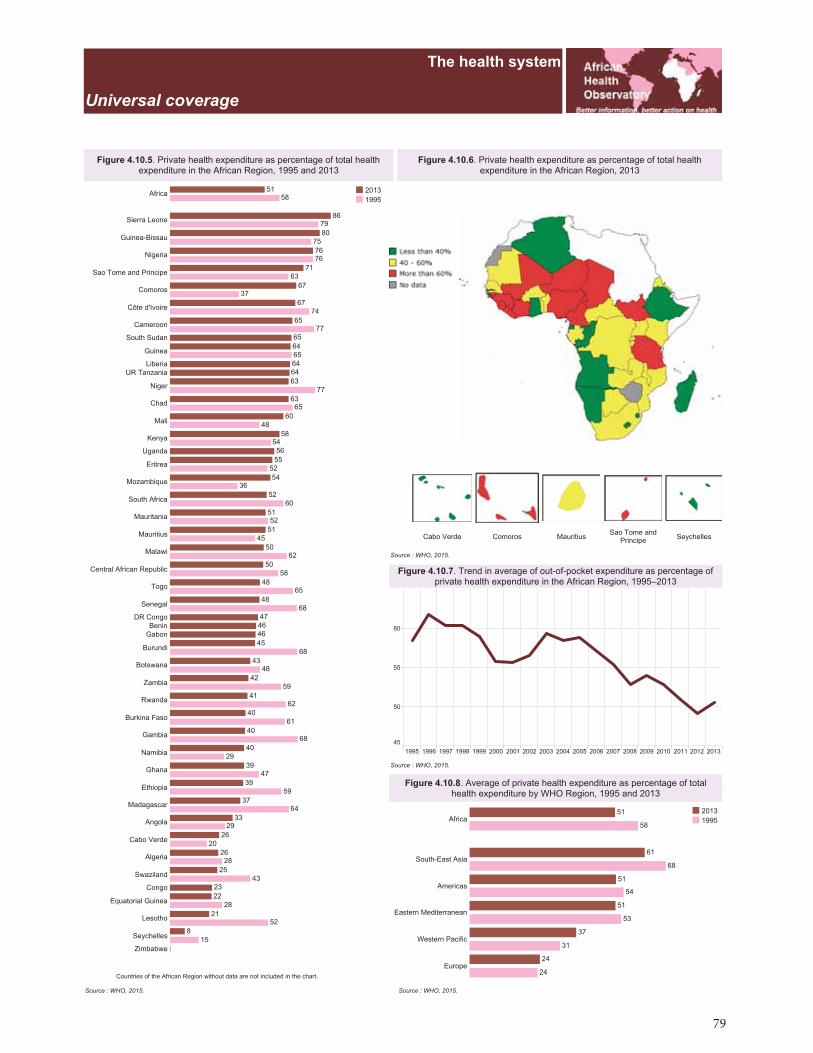
79

80
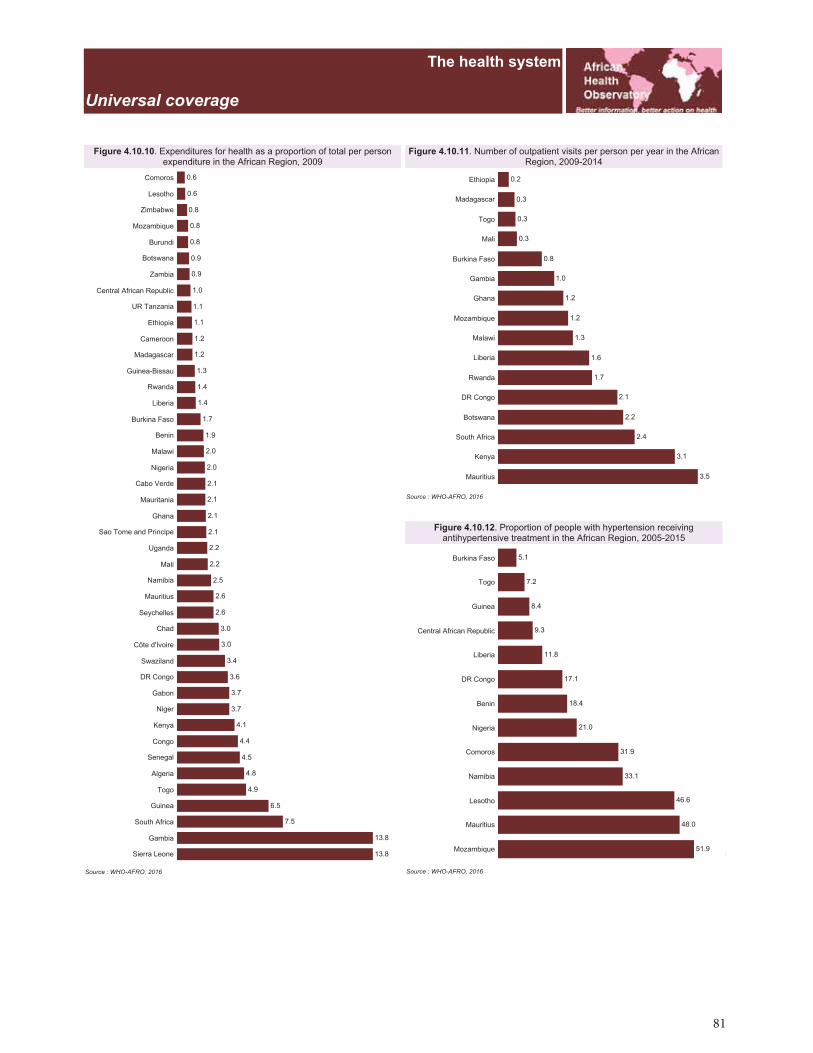
81

82
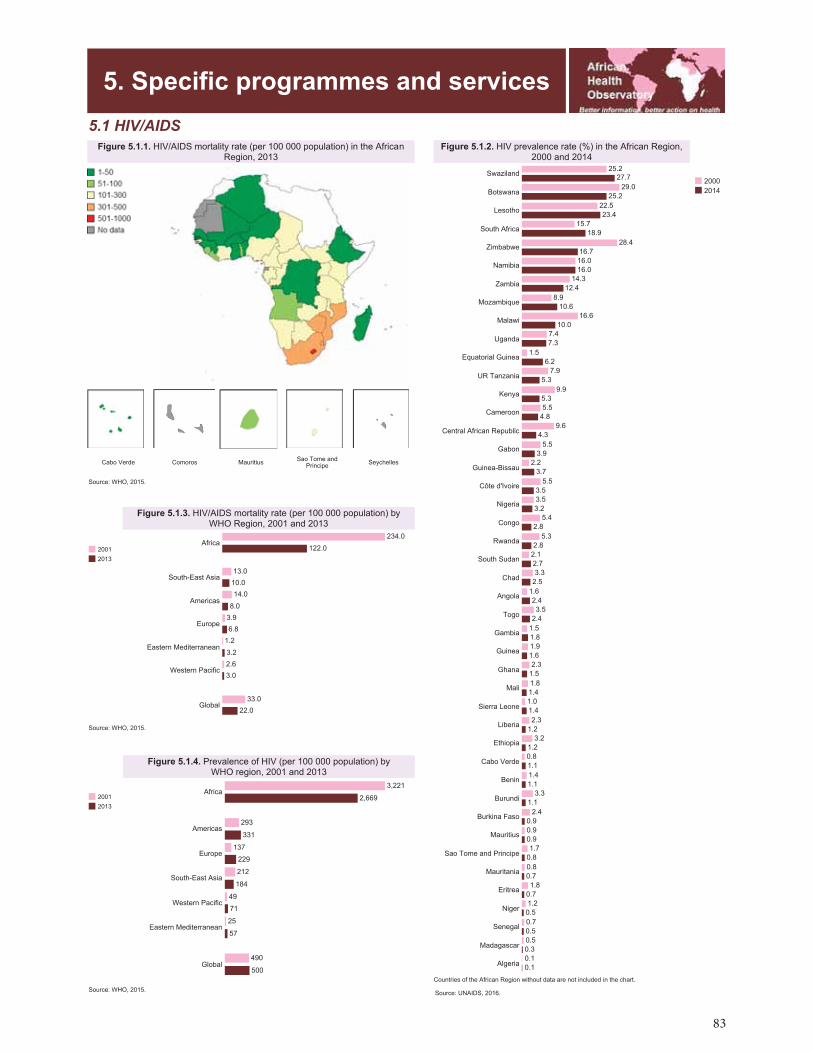
83
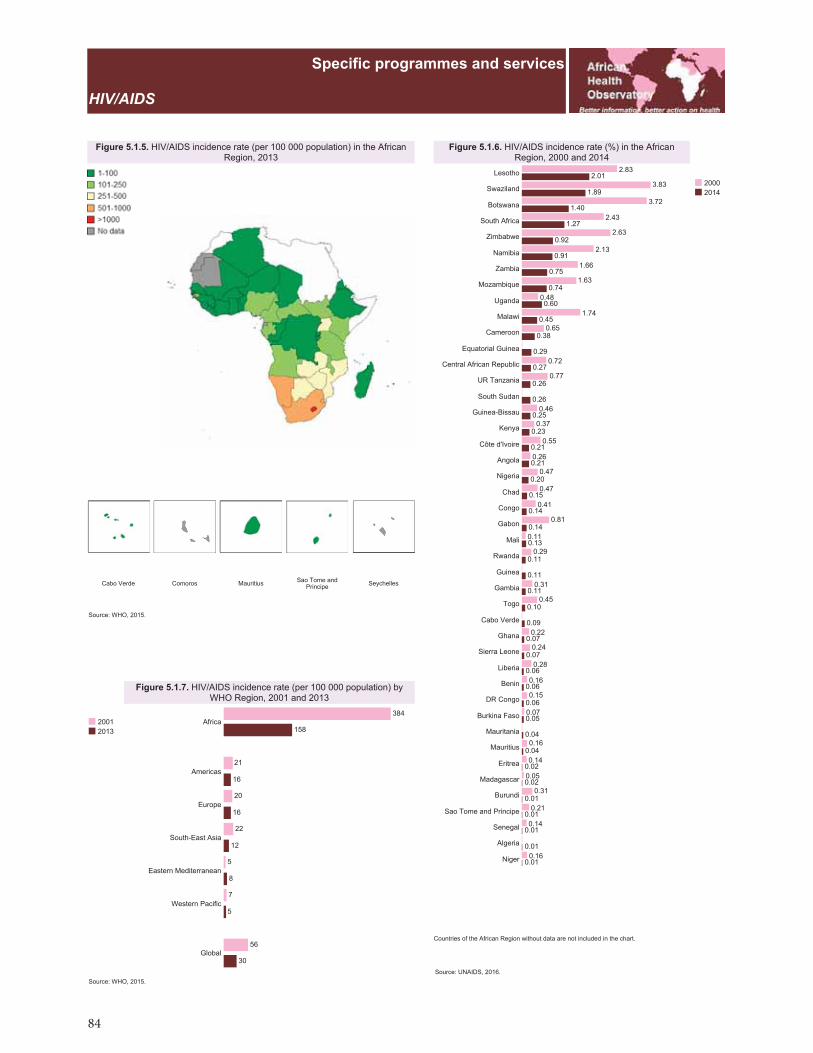
84
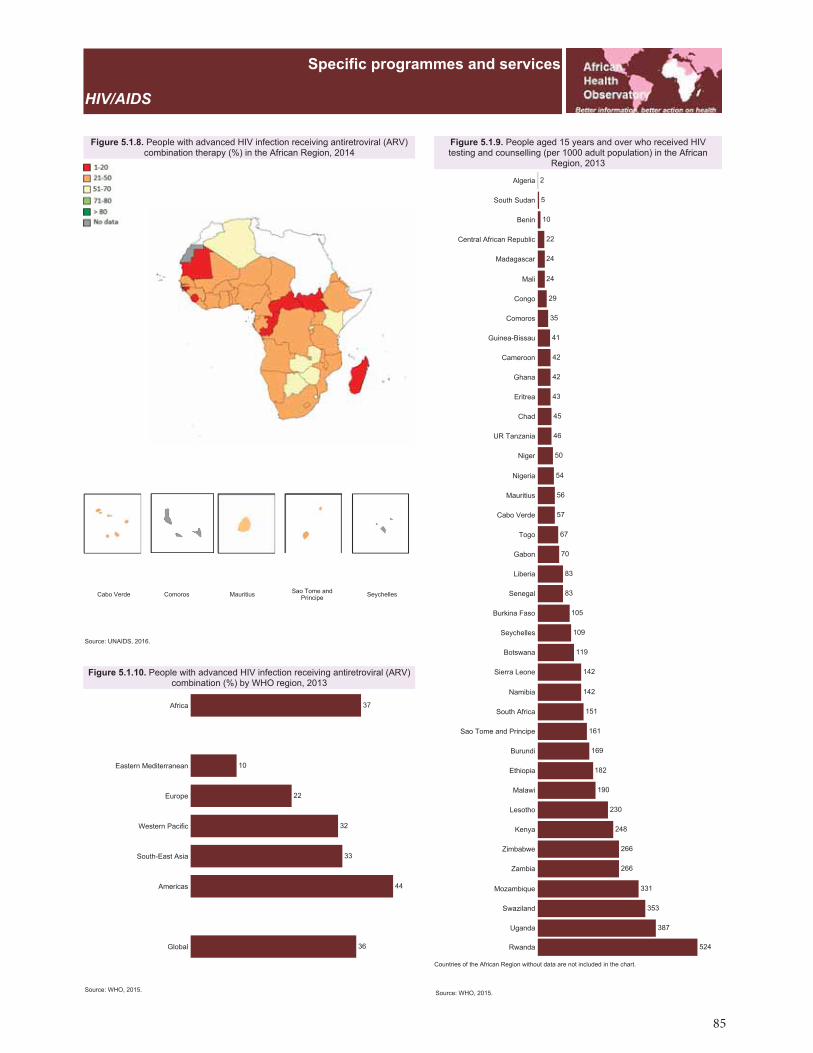
85
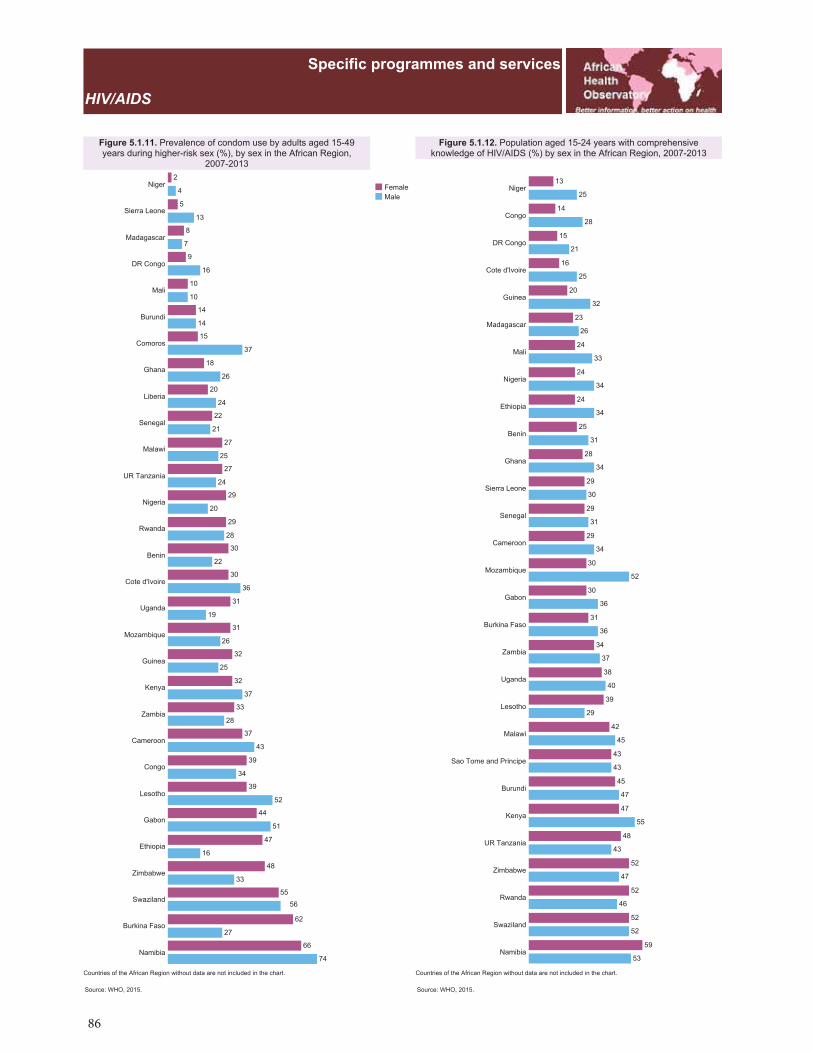
86
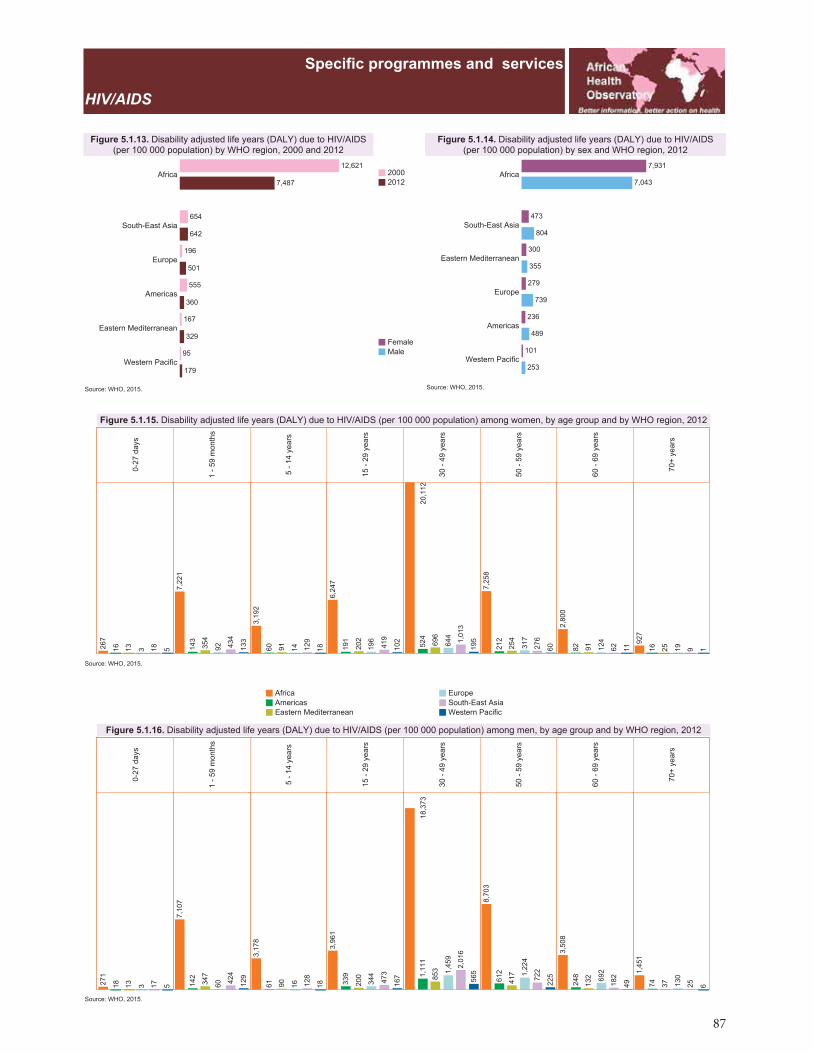
87
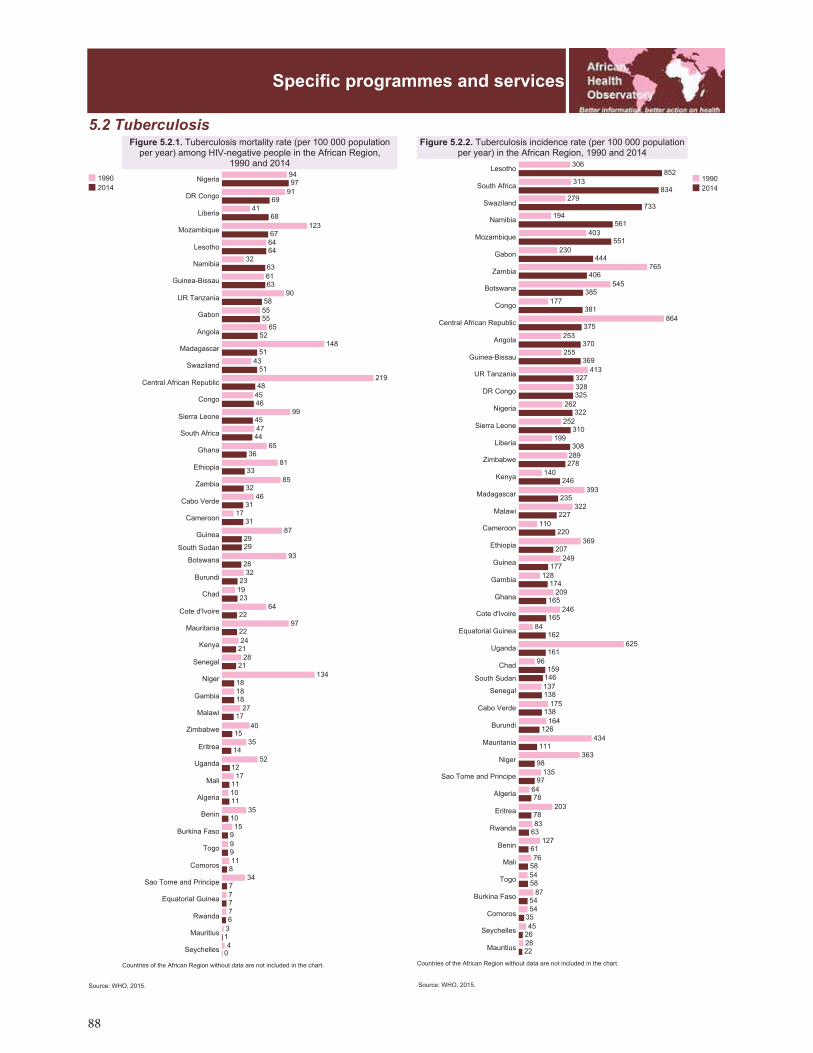
88
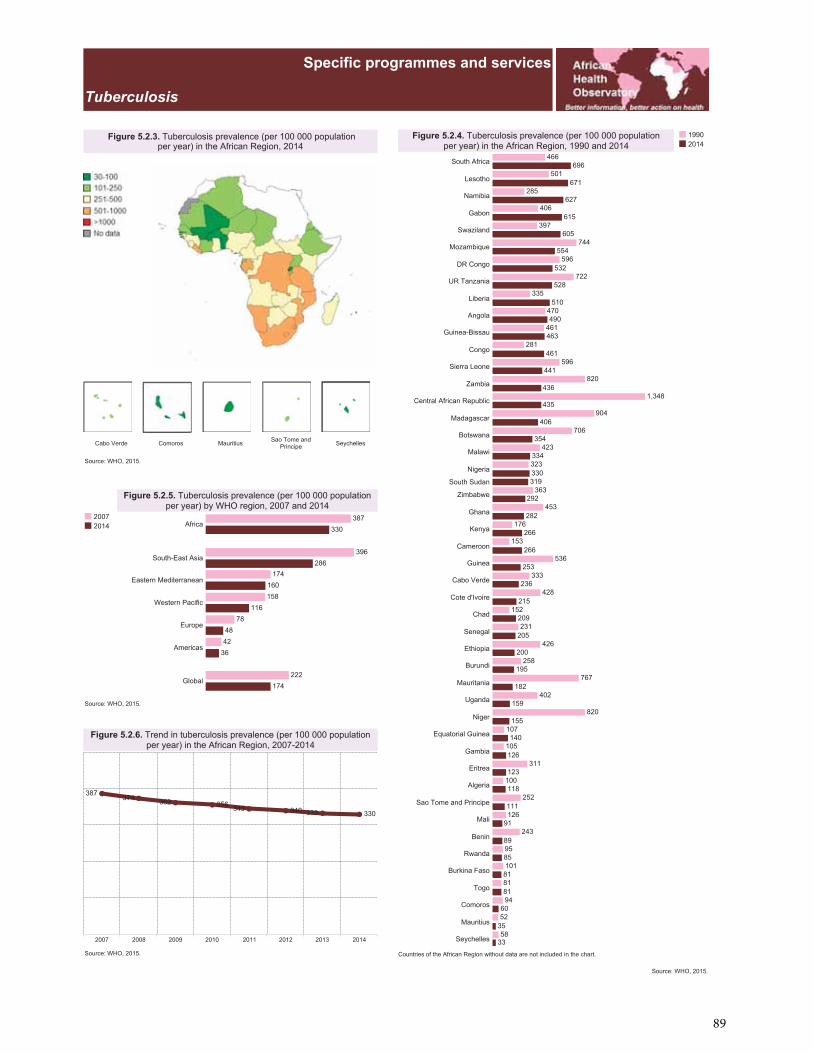
89
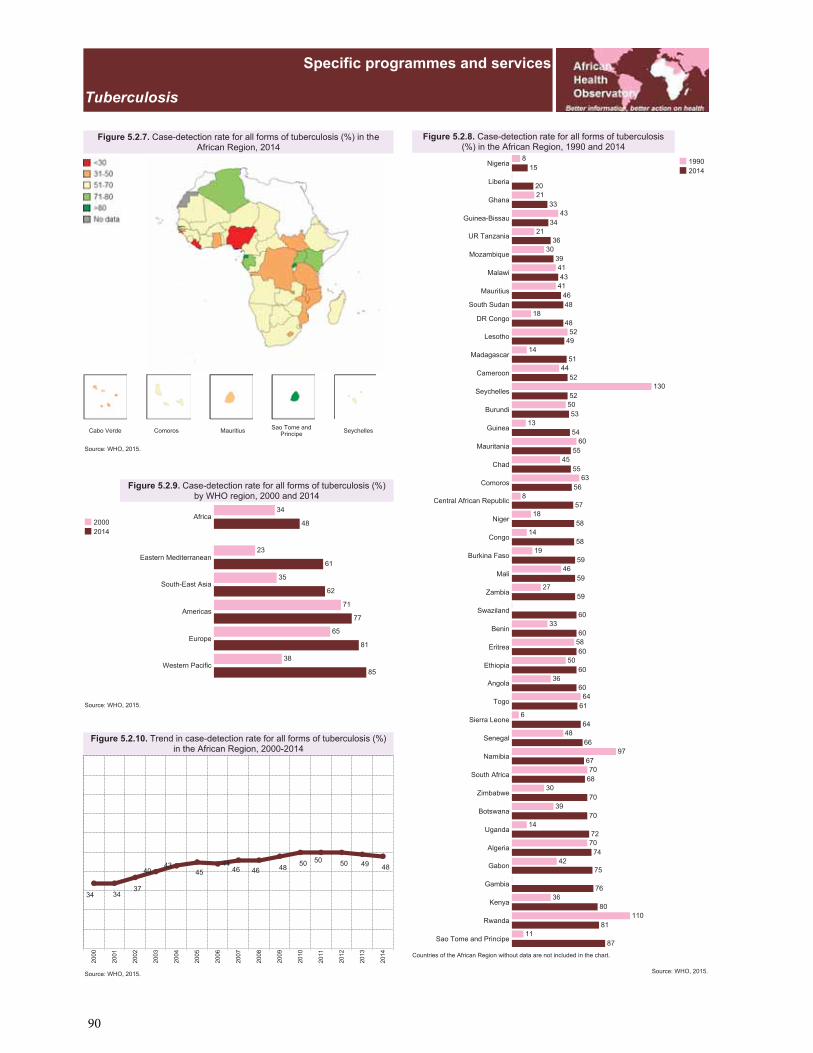
90
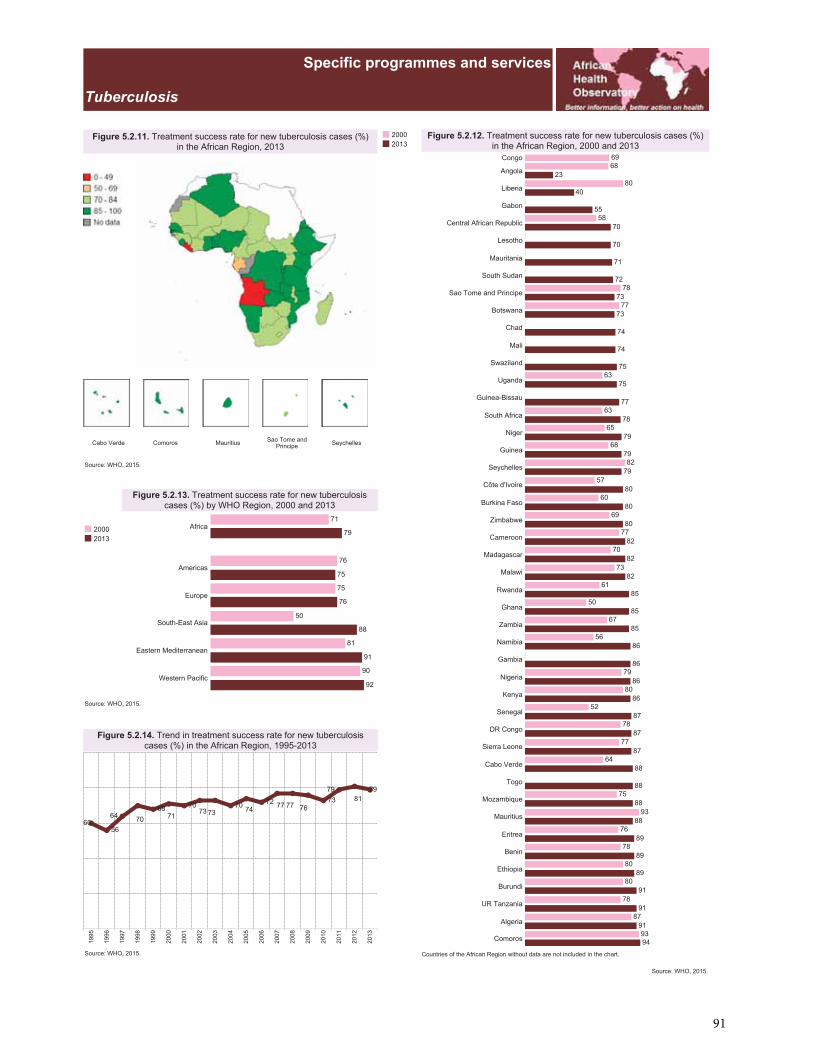
91
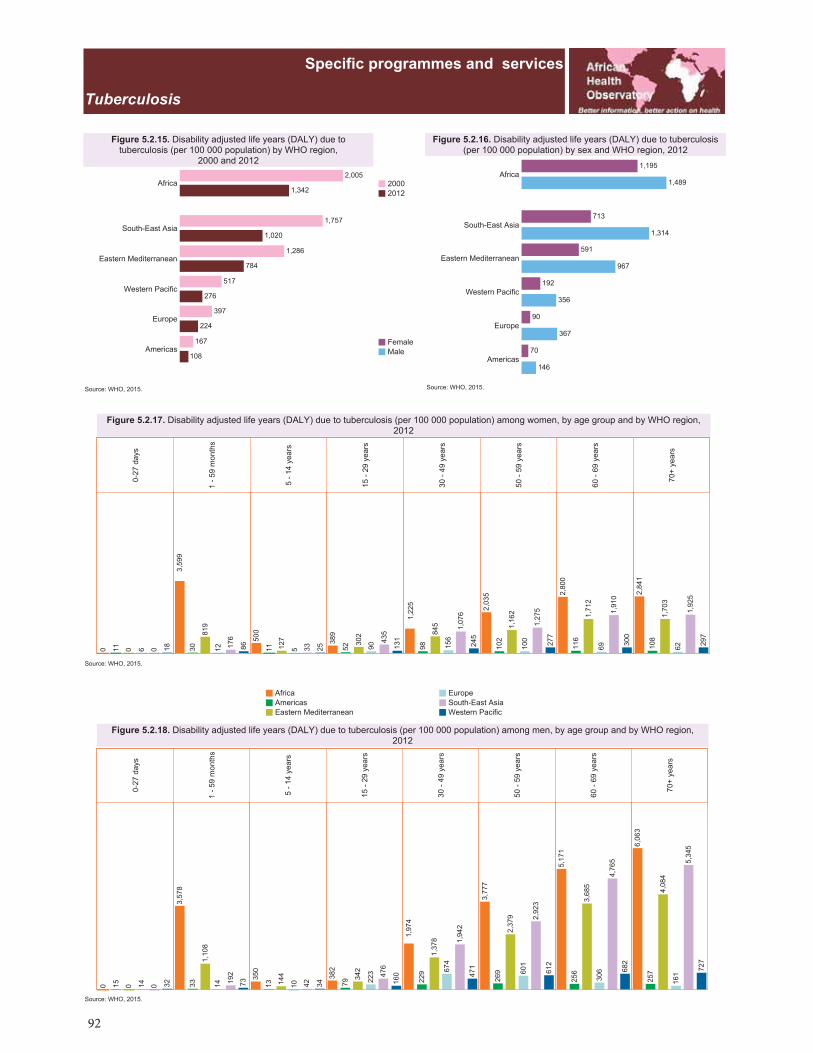
92
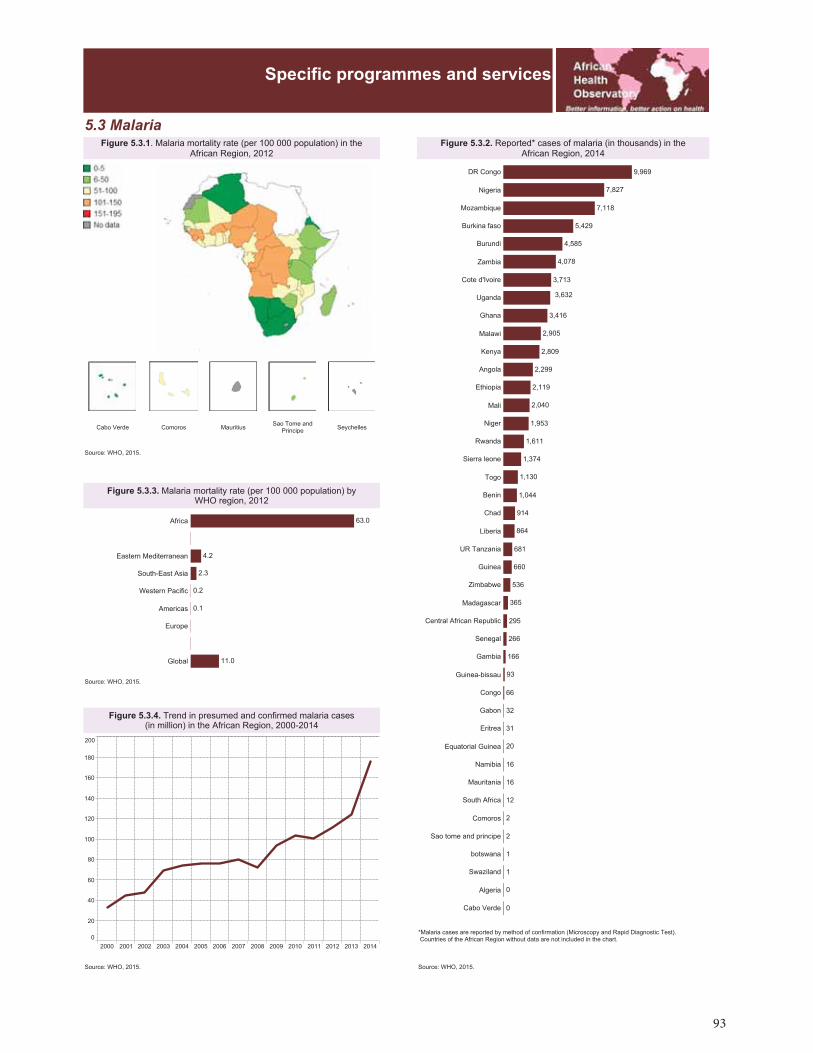
93
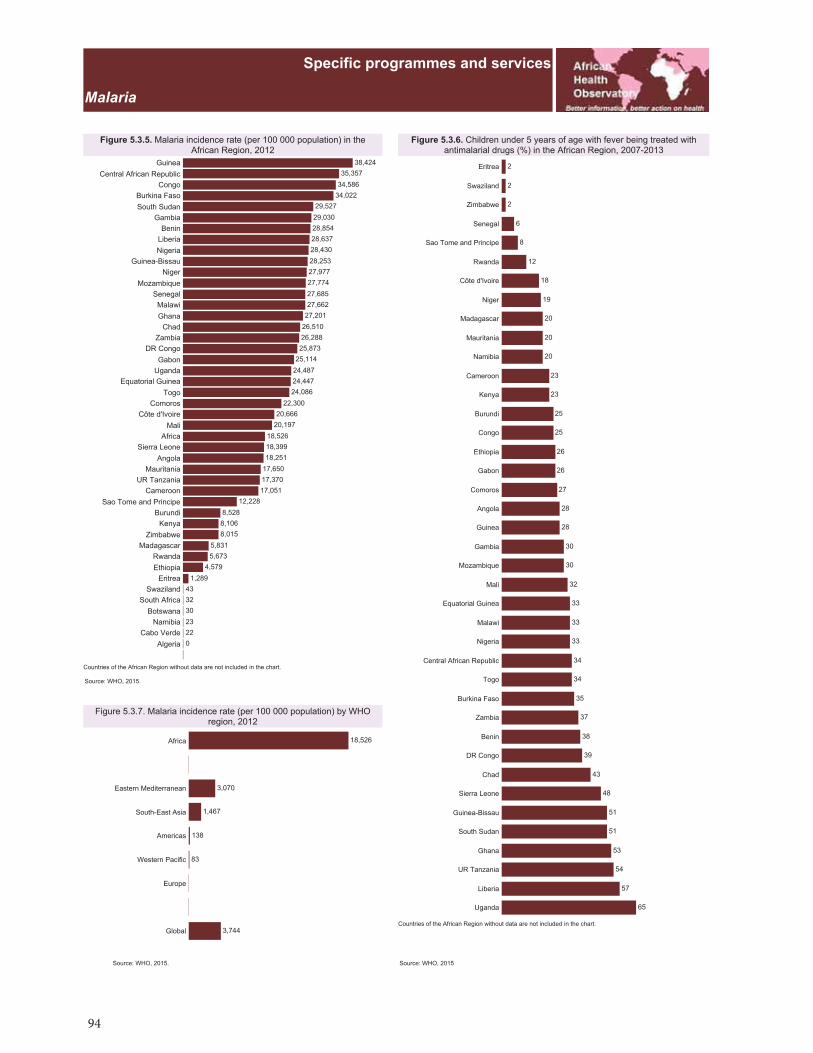
94
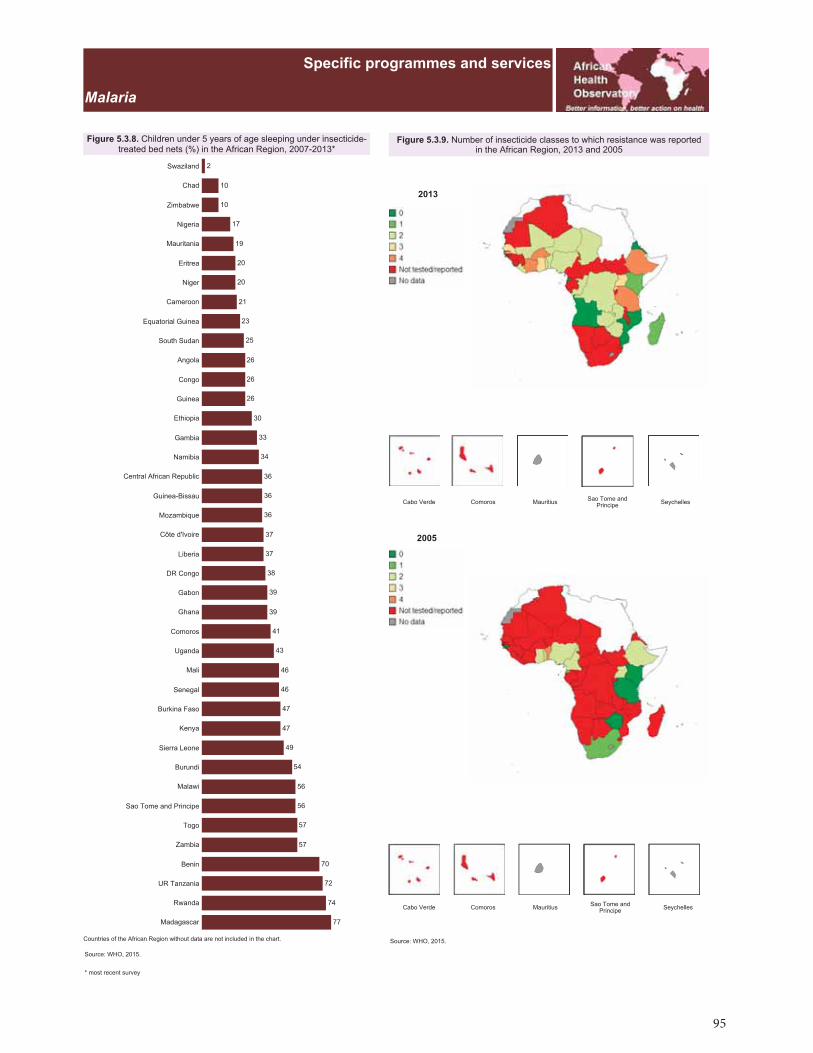
95
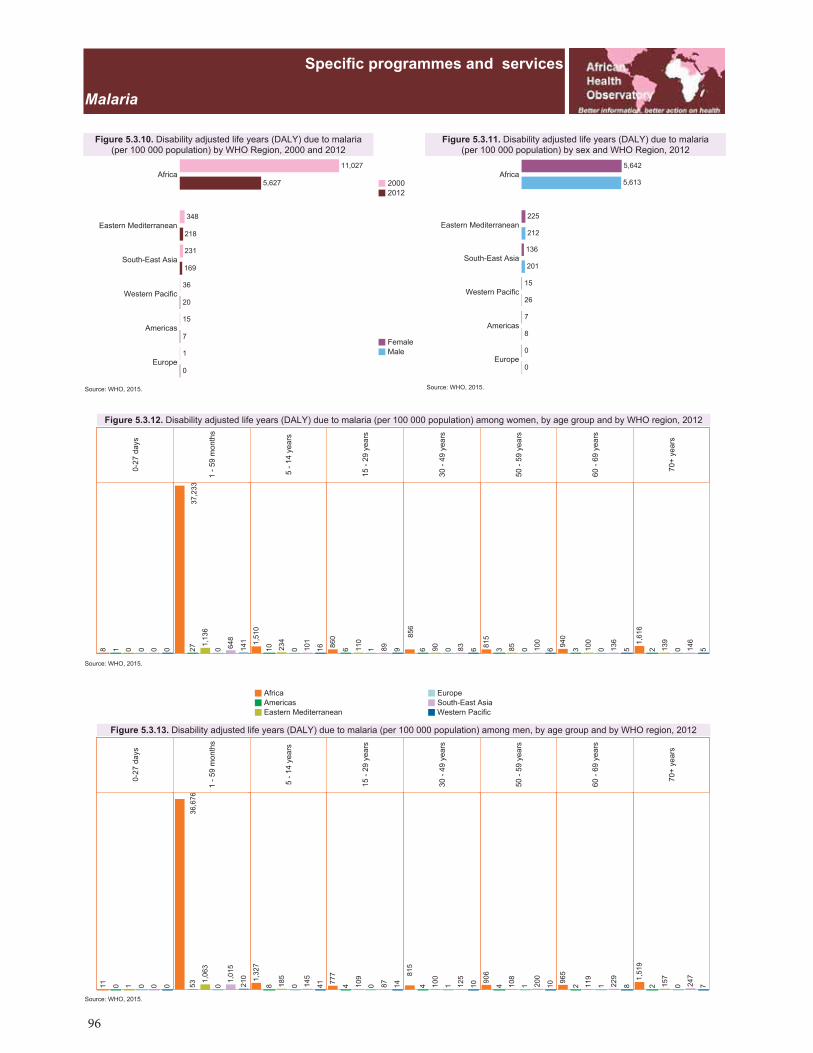
96
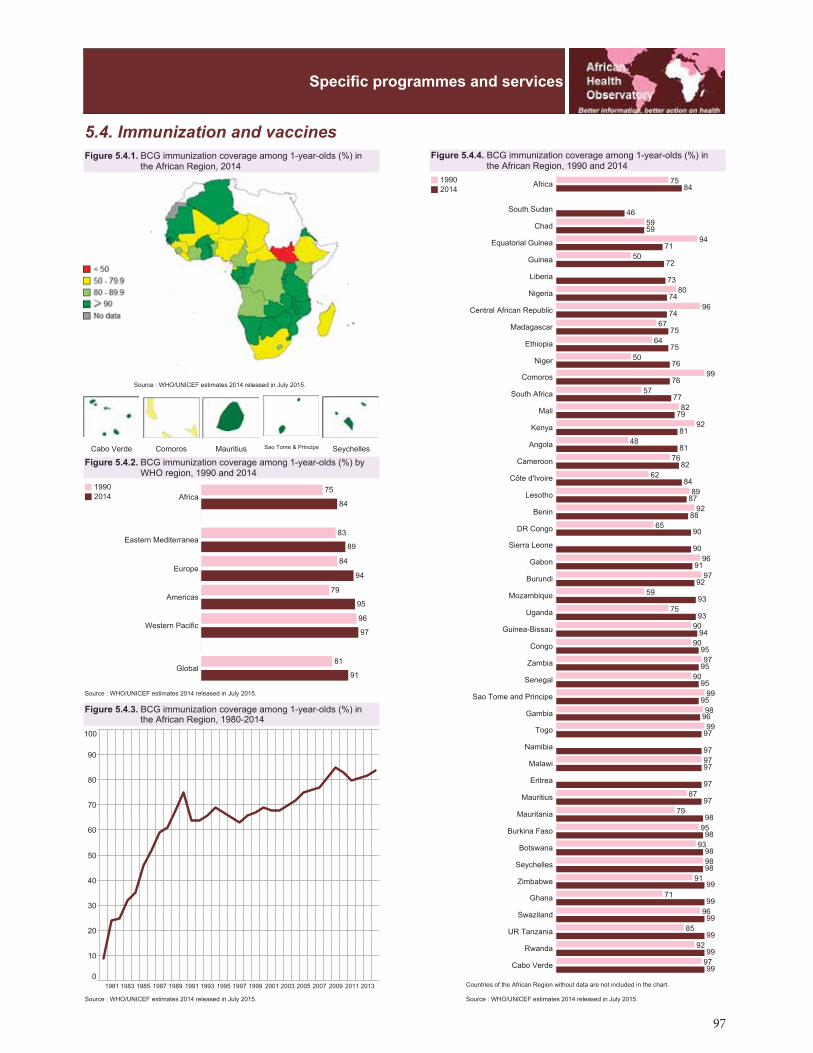
97

98

99
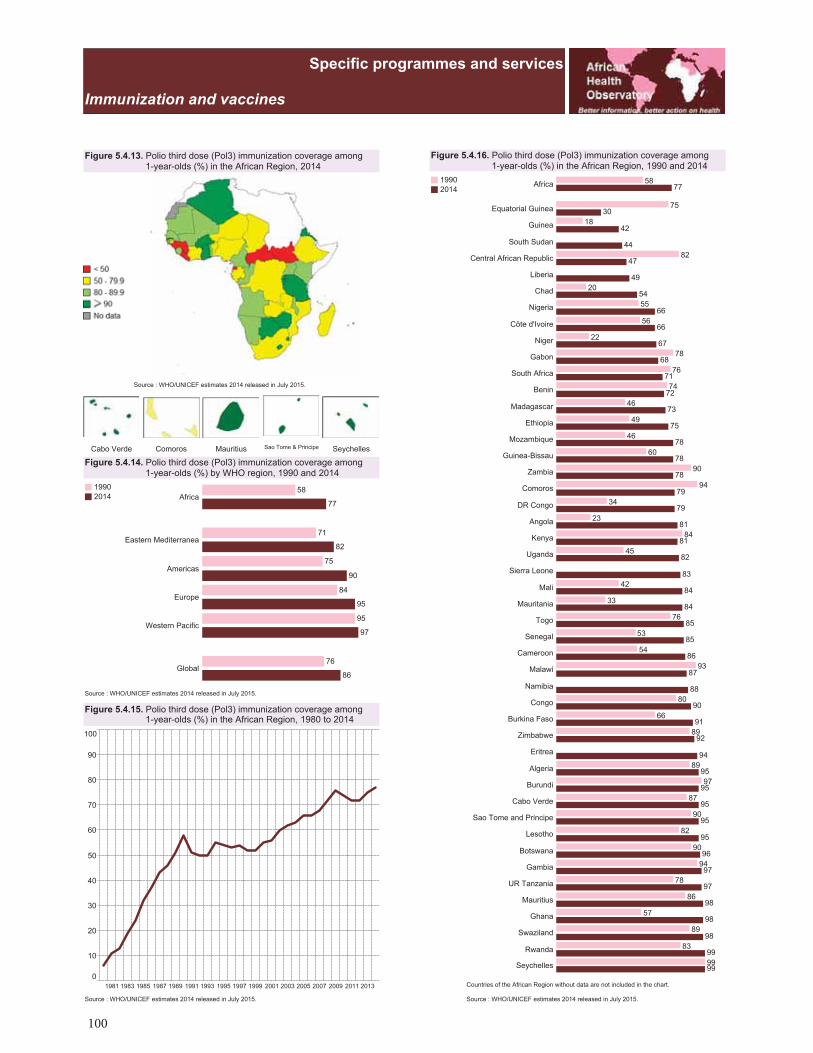
100
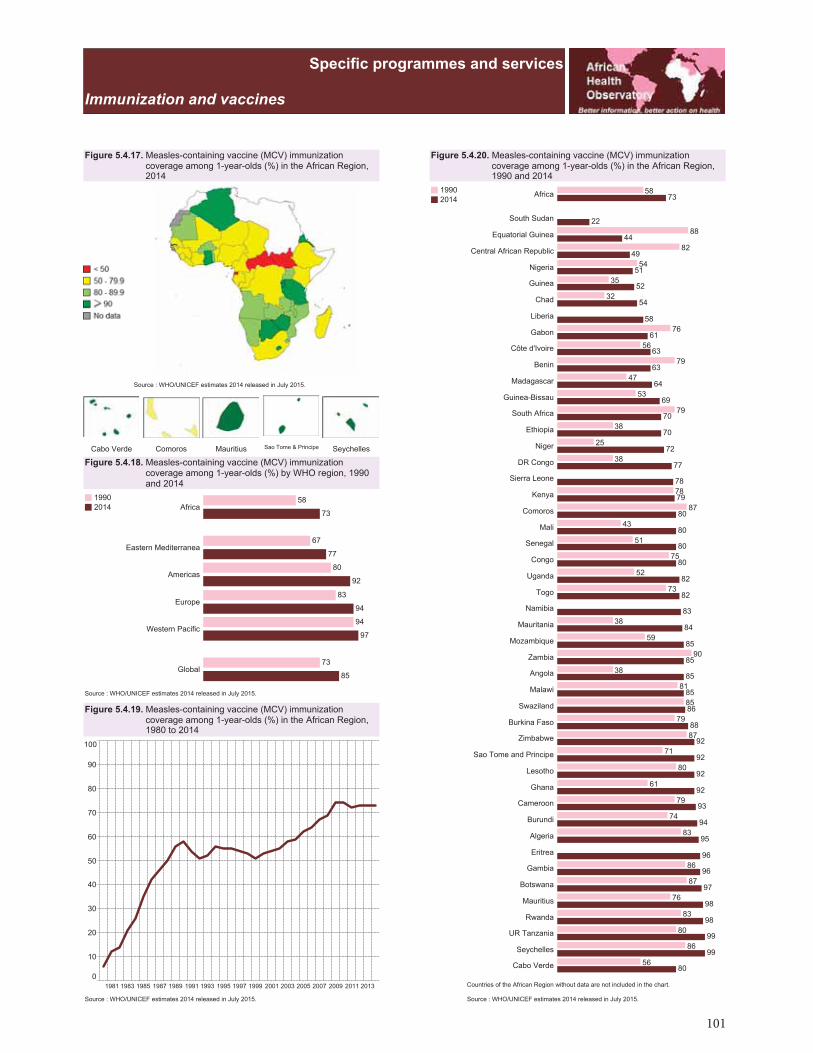
101
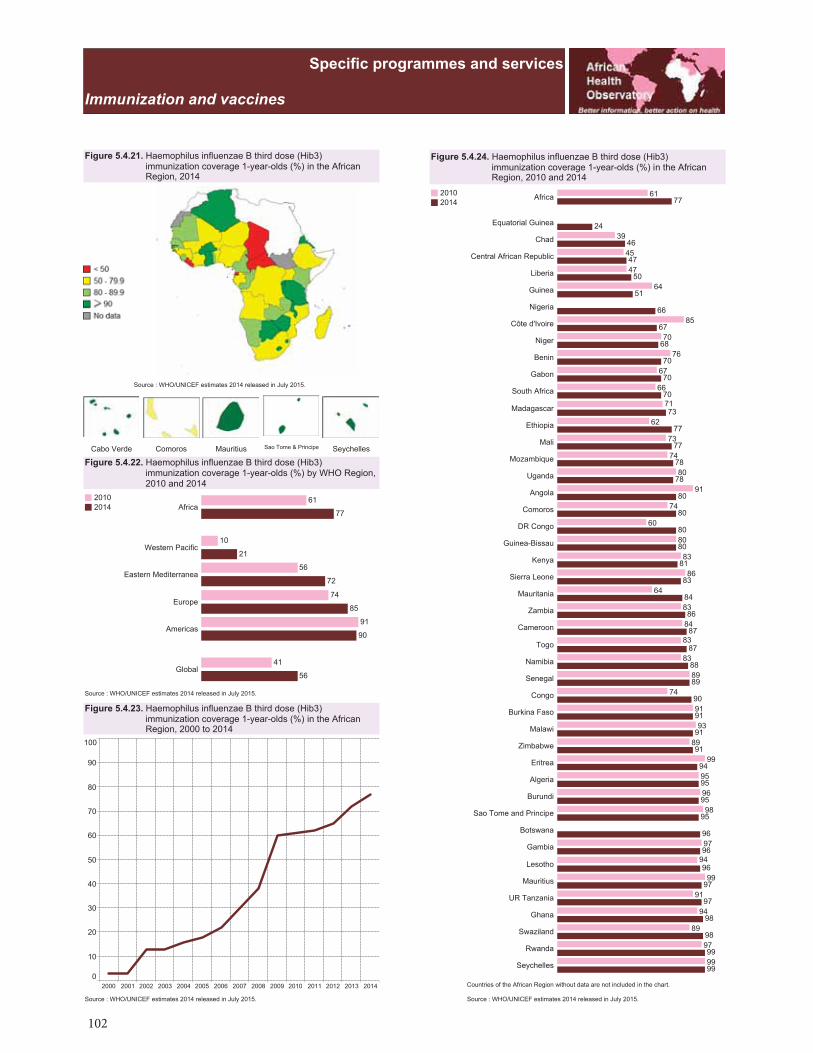
102
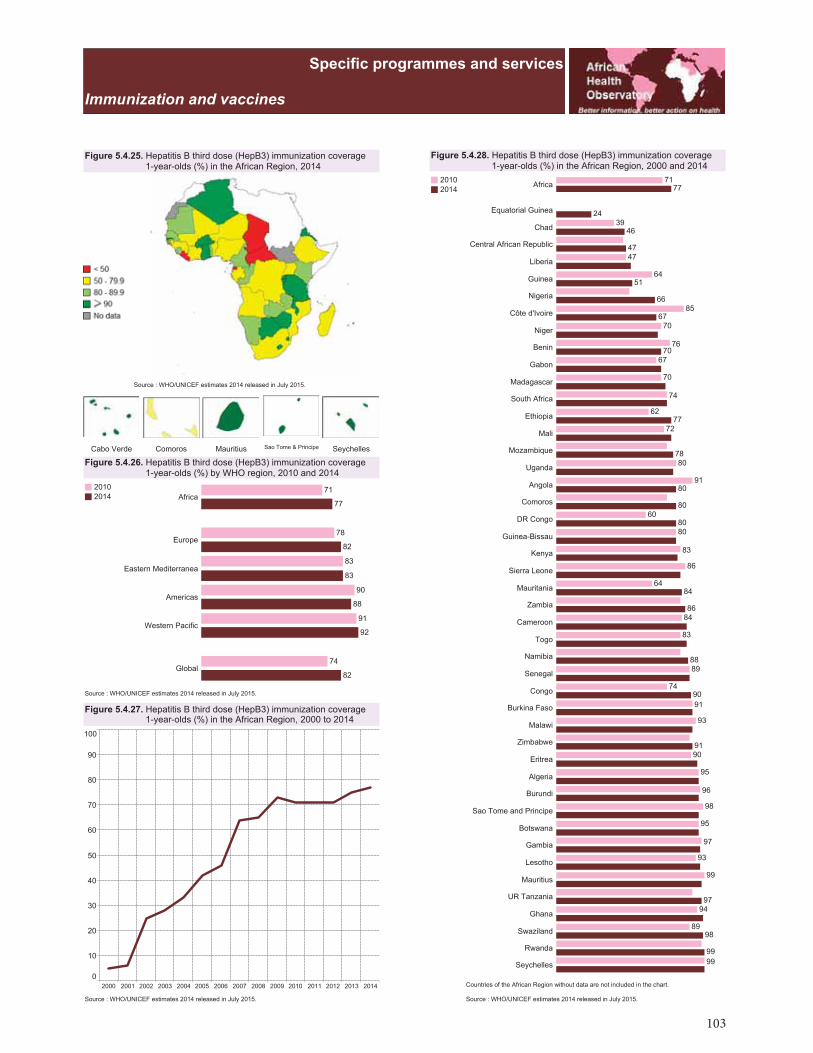
103
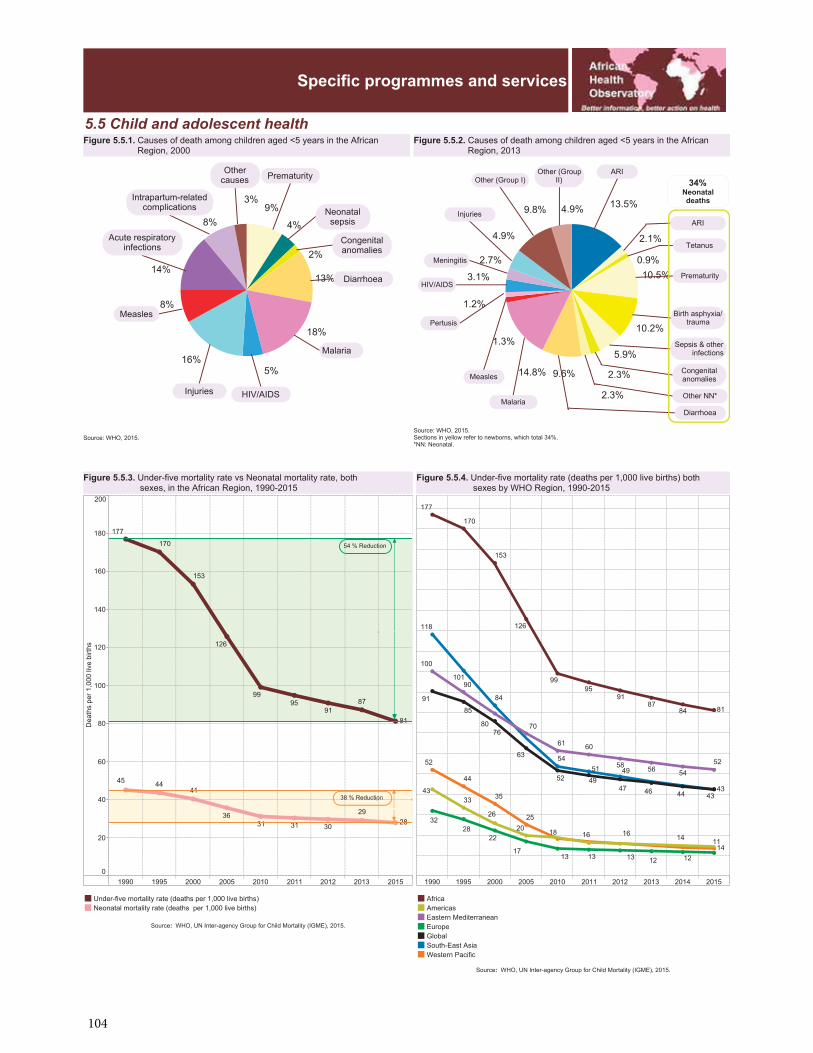
104
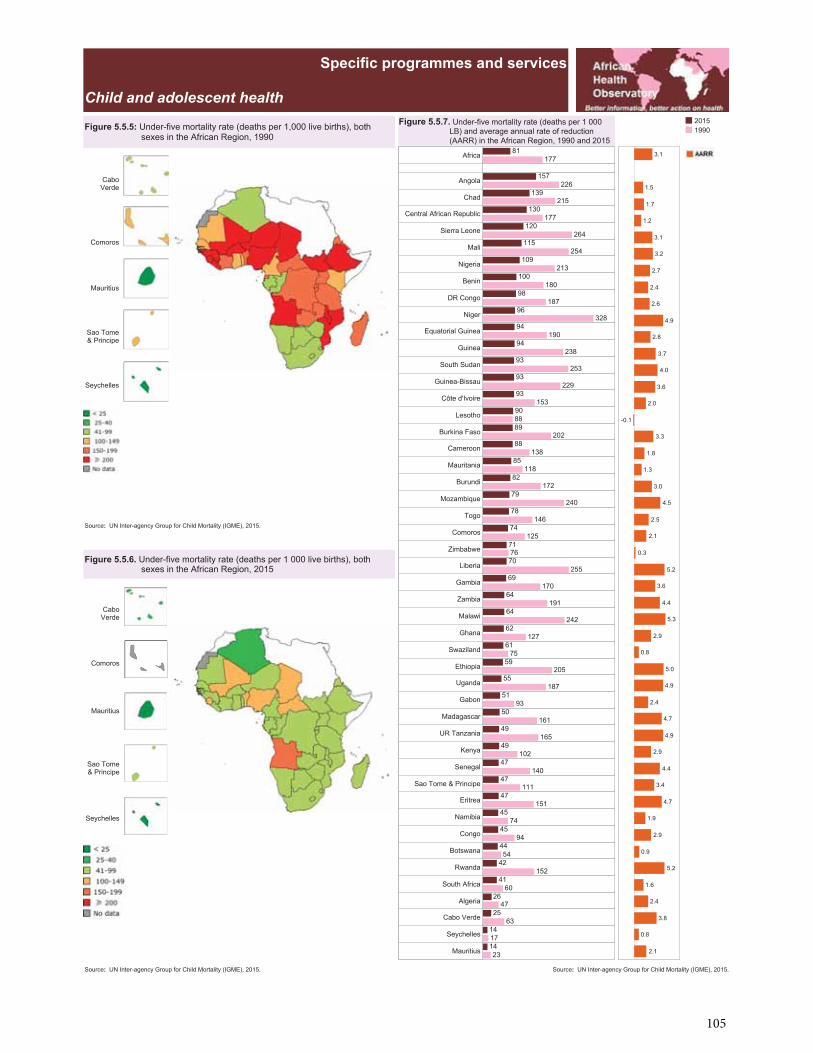
105
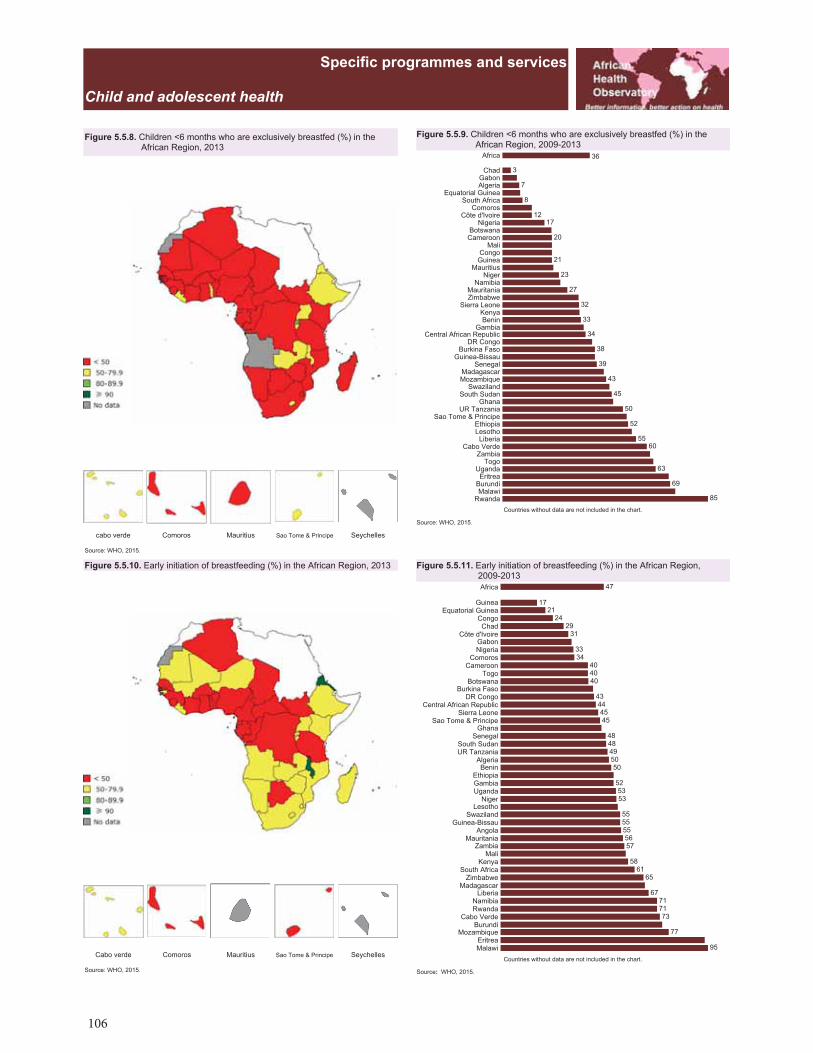
106
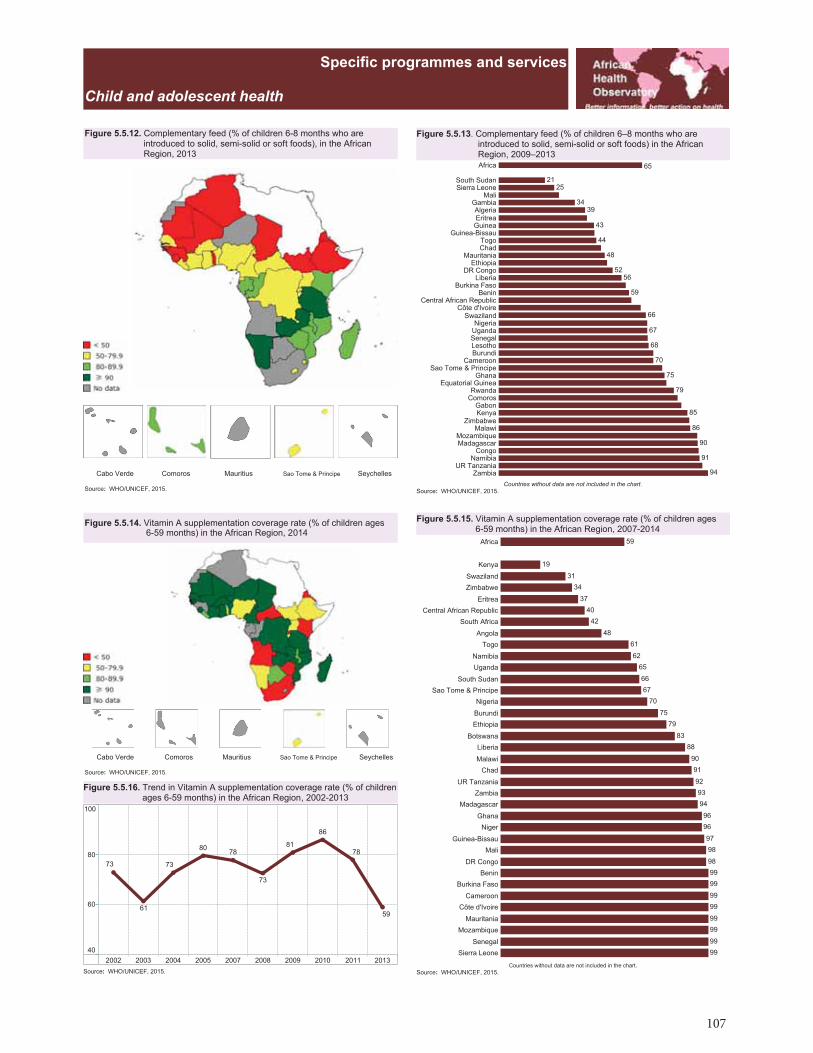
107
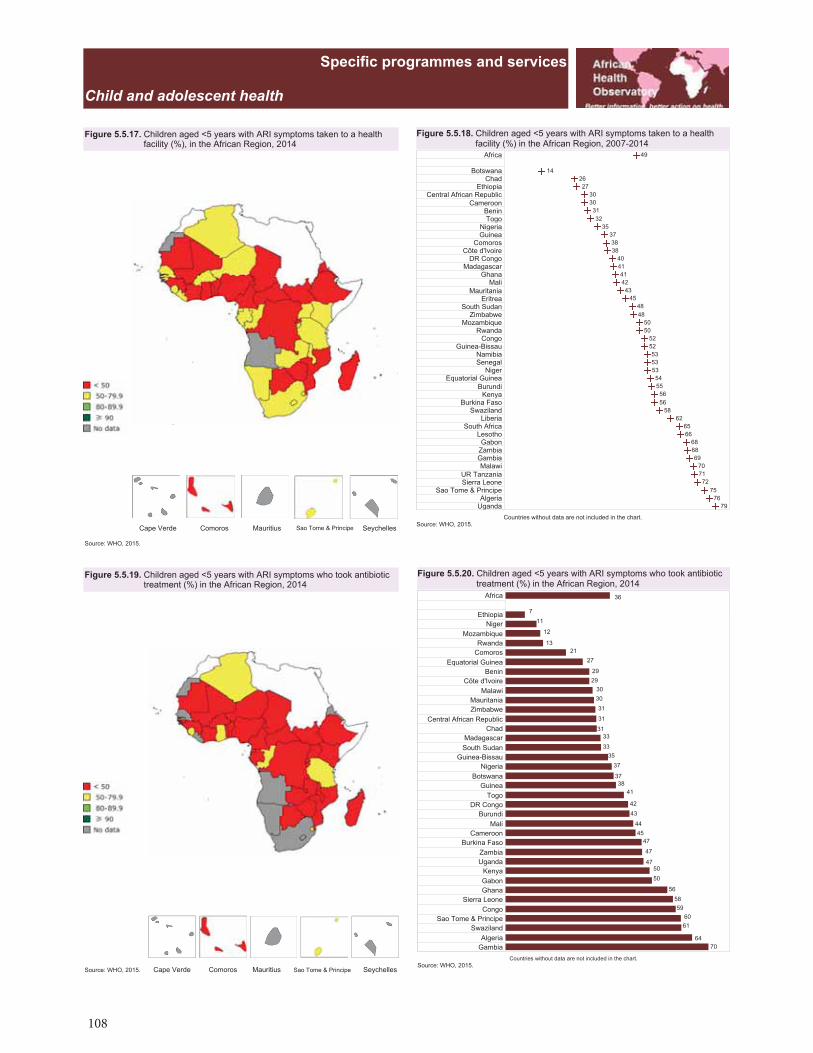
108
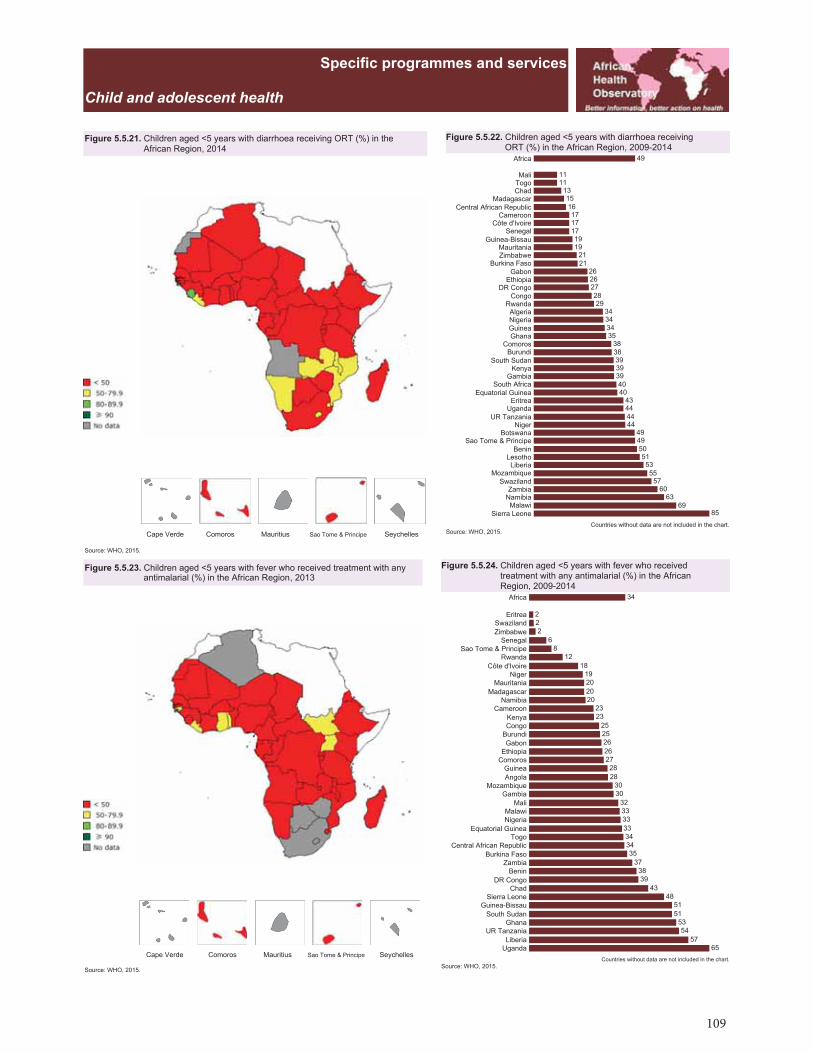
109
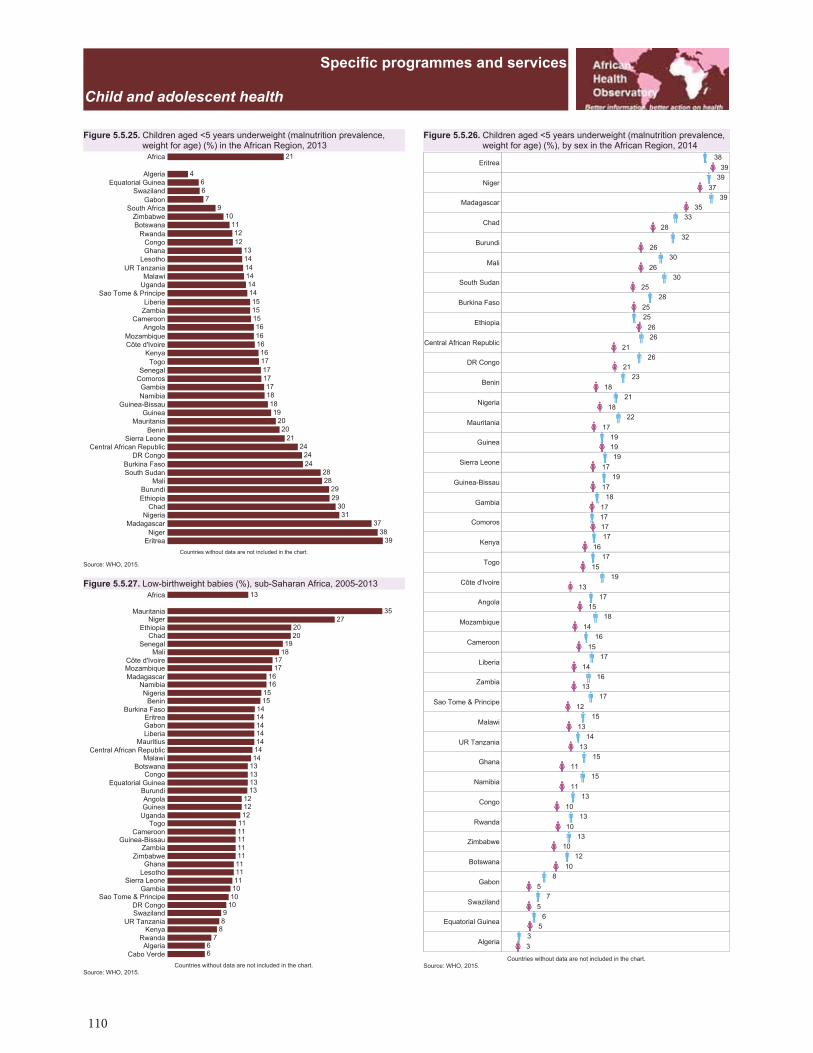
110
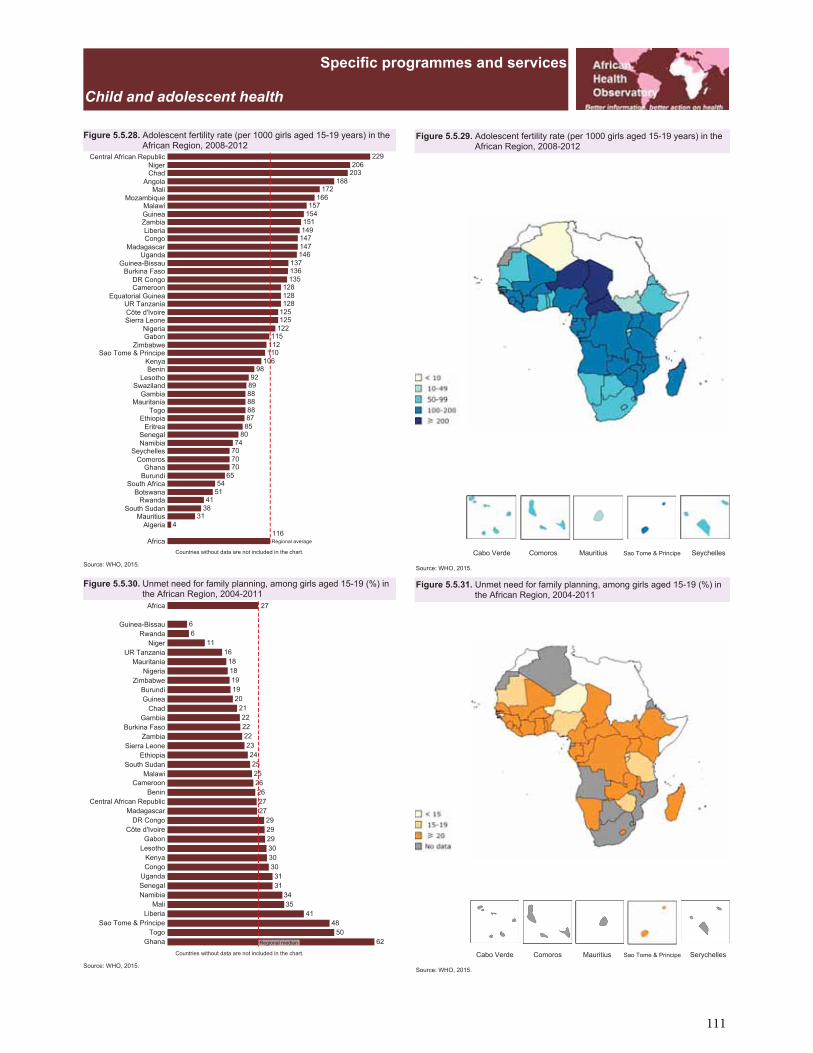
111
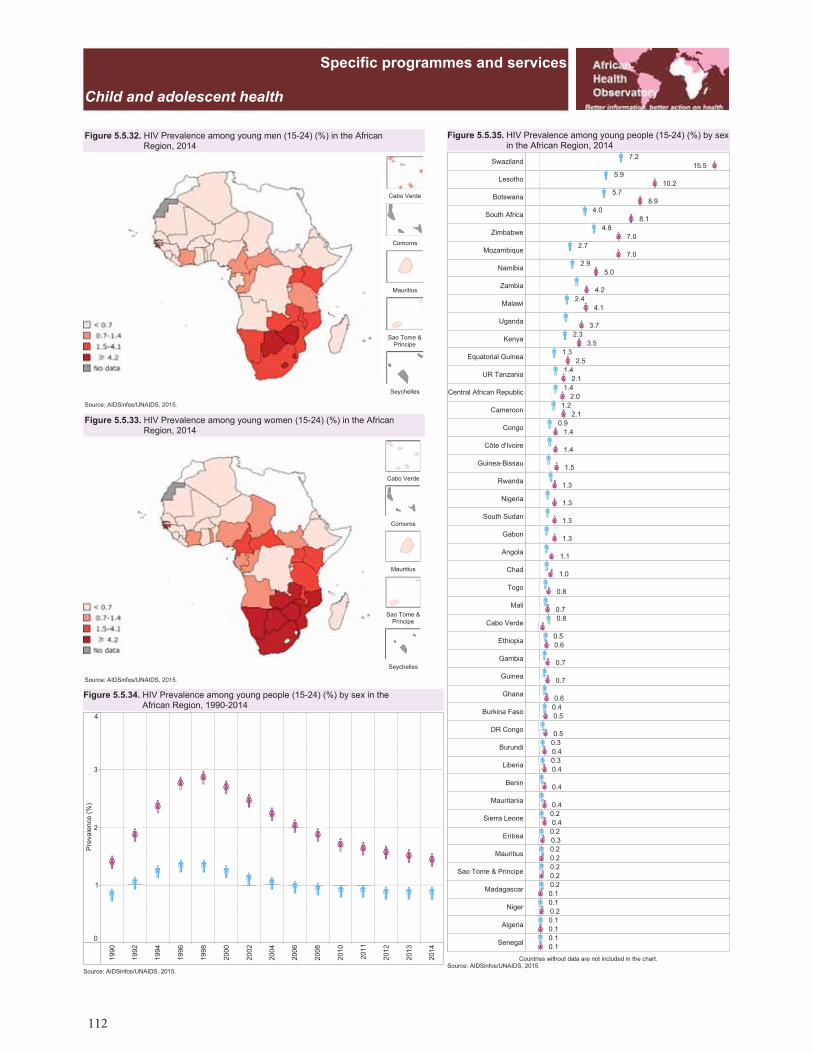
112
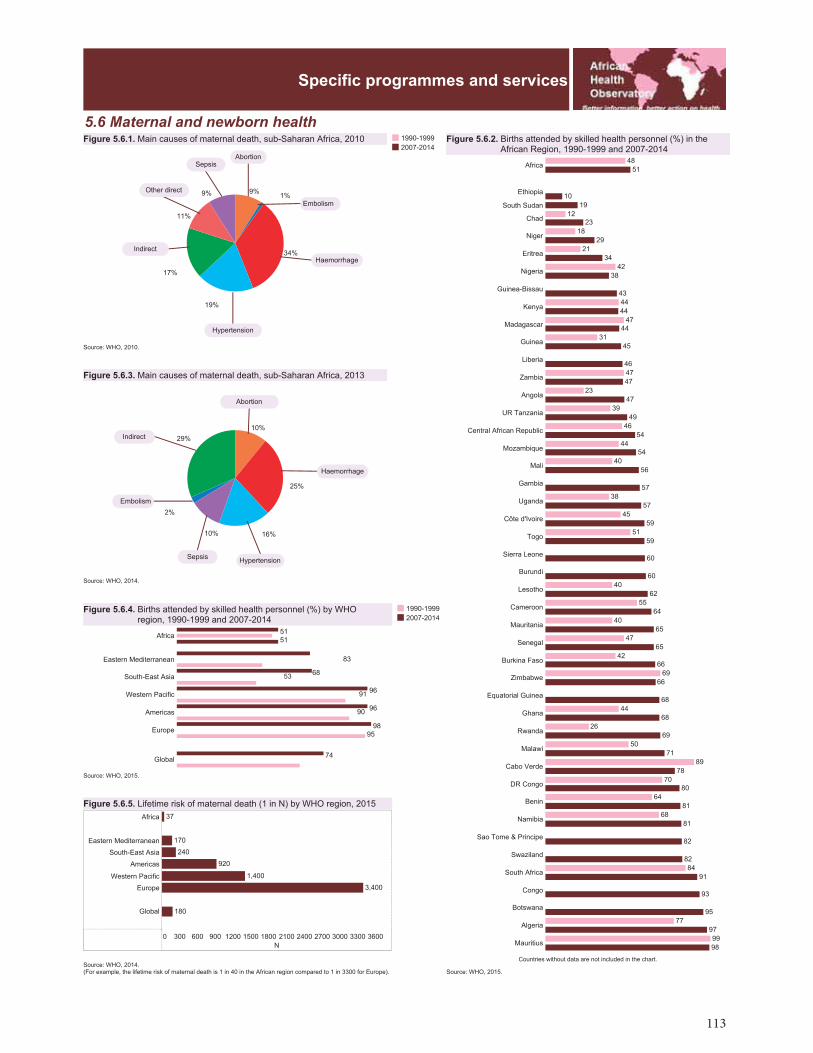
113
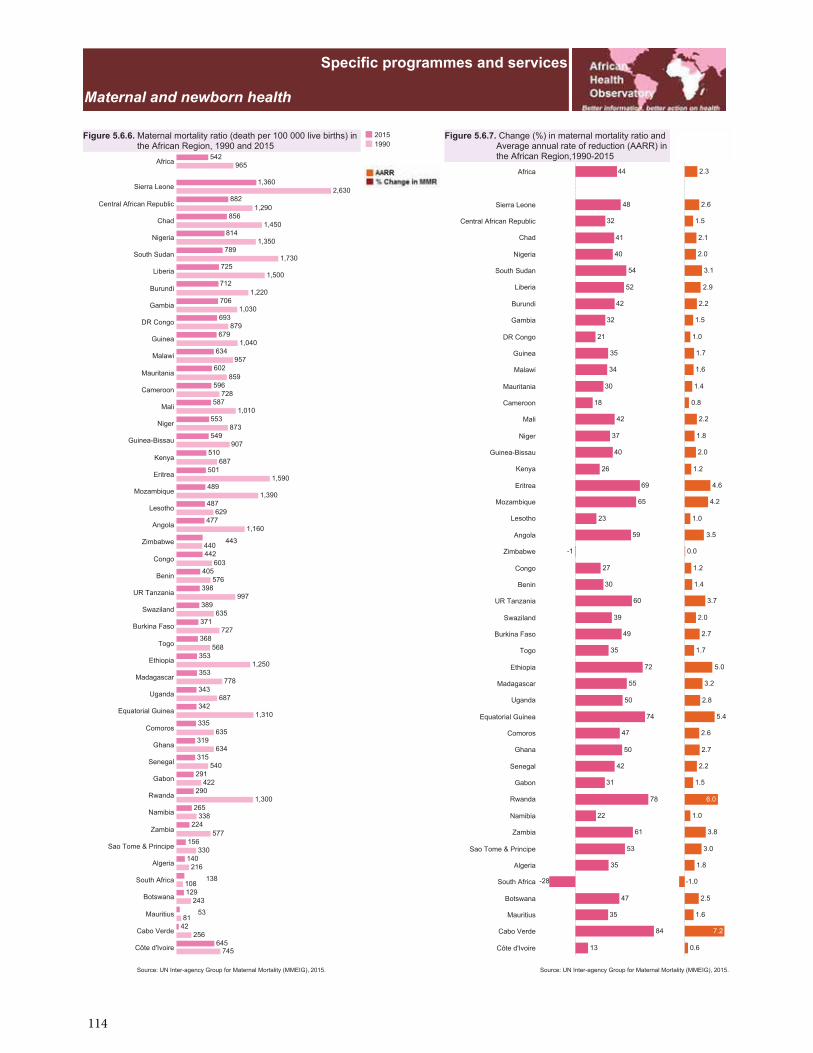
114
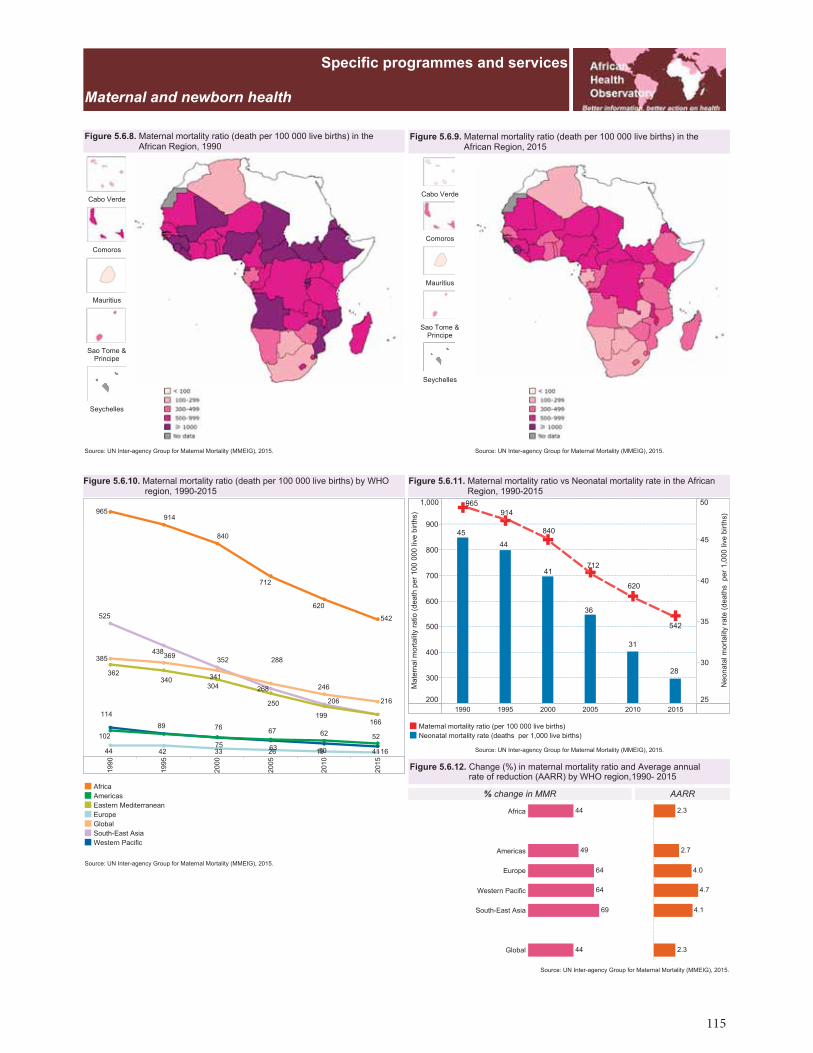
115

116
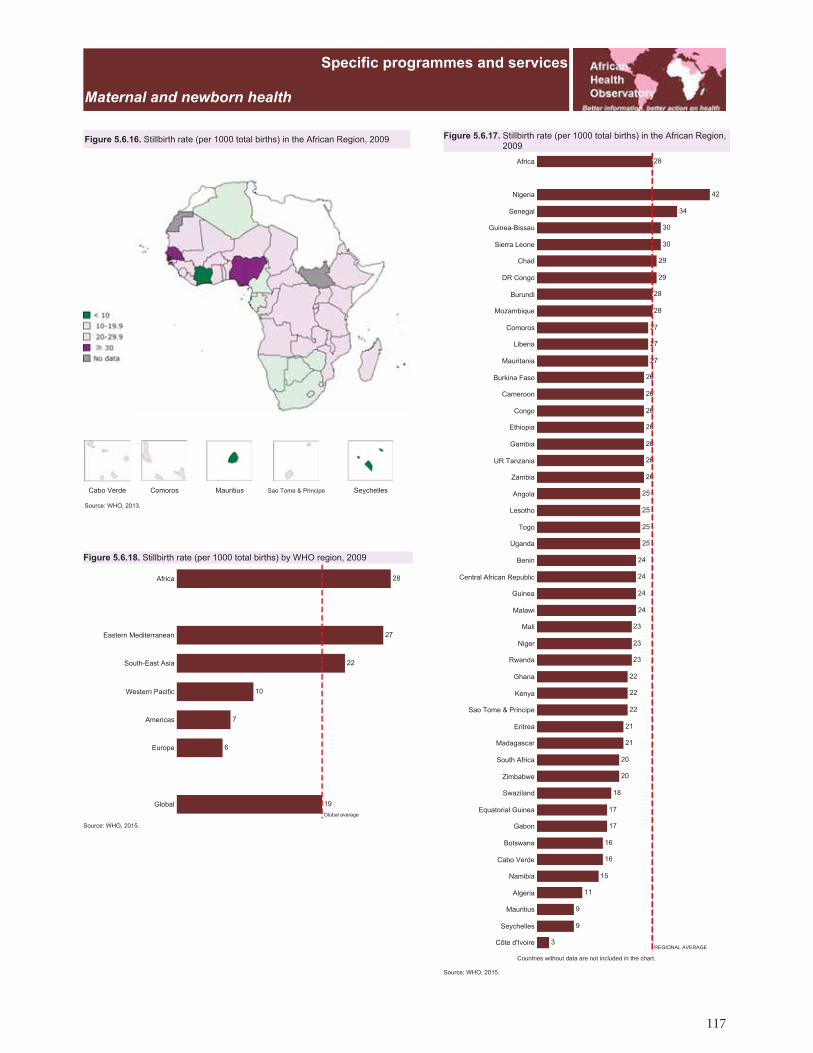
117
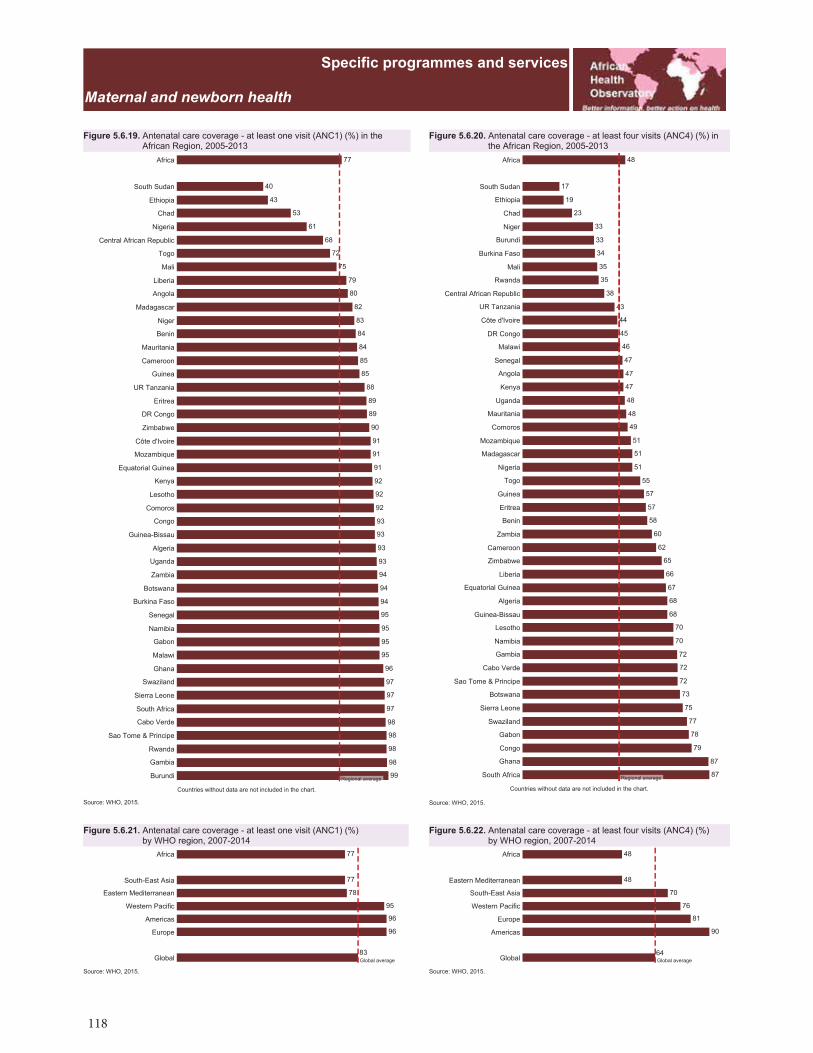
118
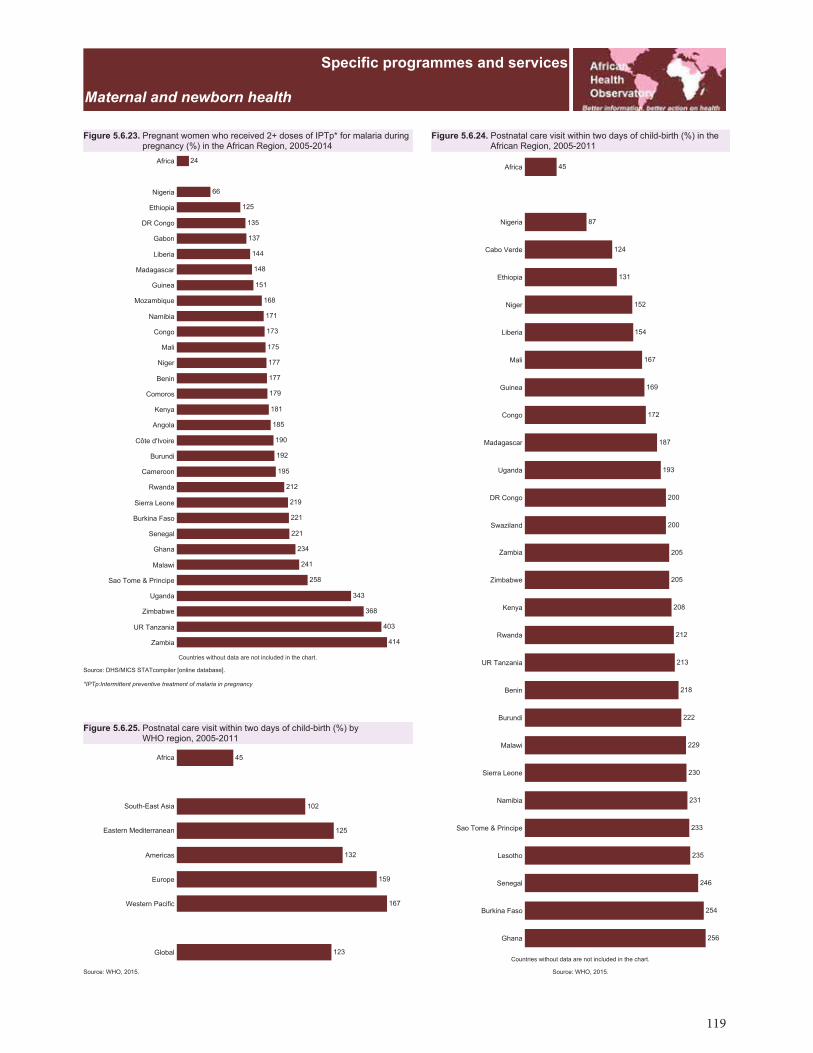
119
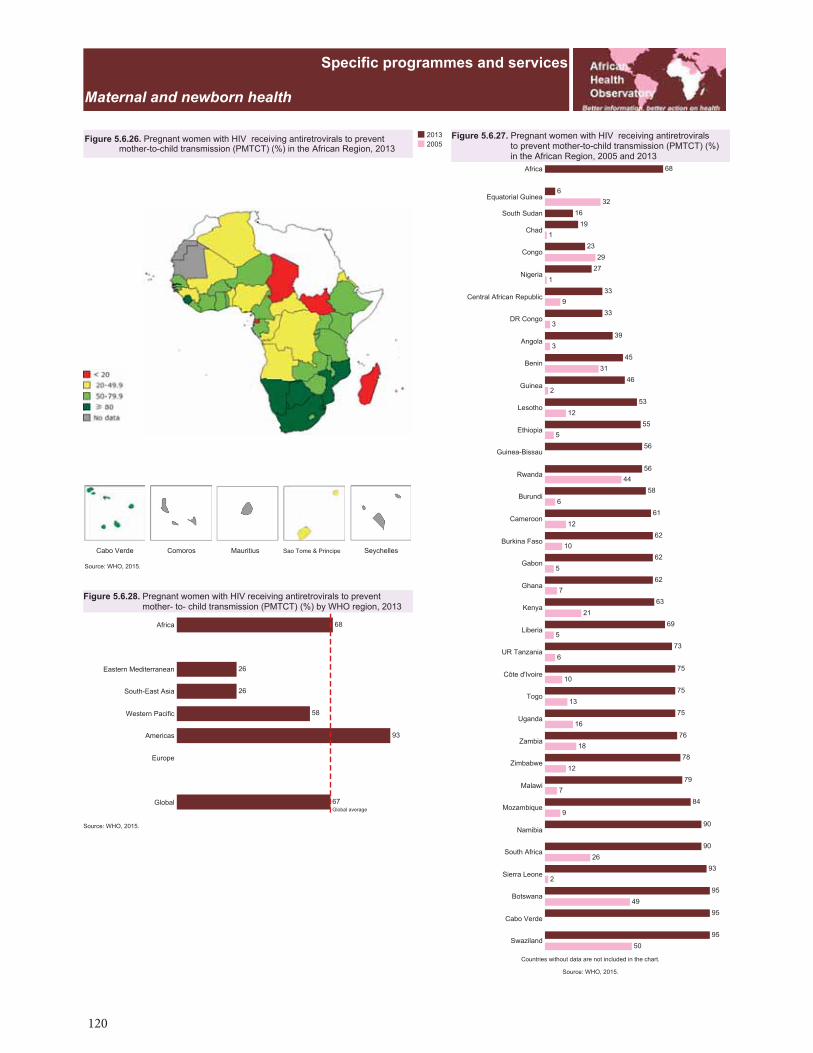
120

121

122
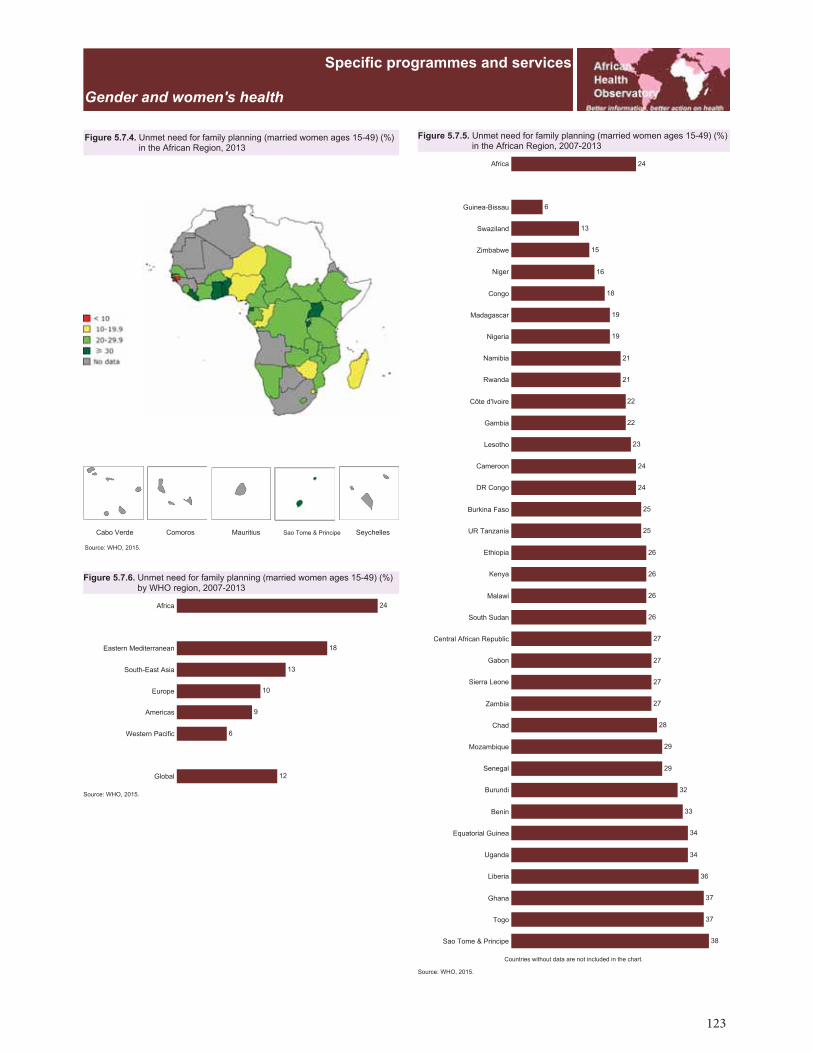
123
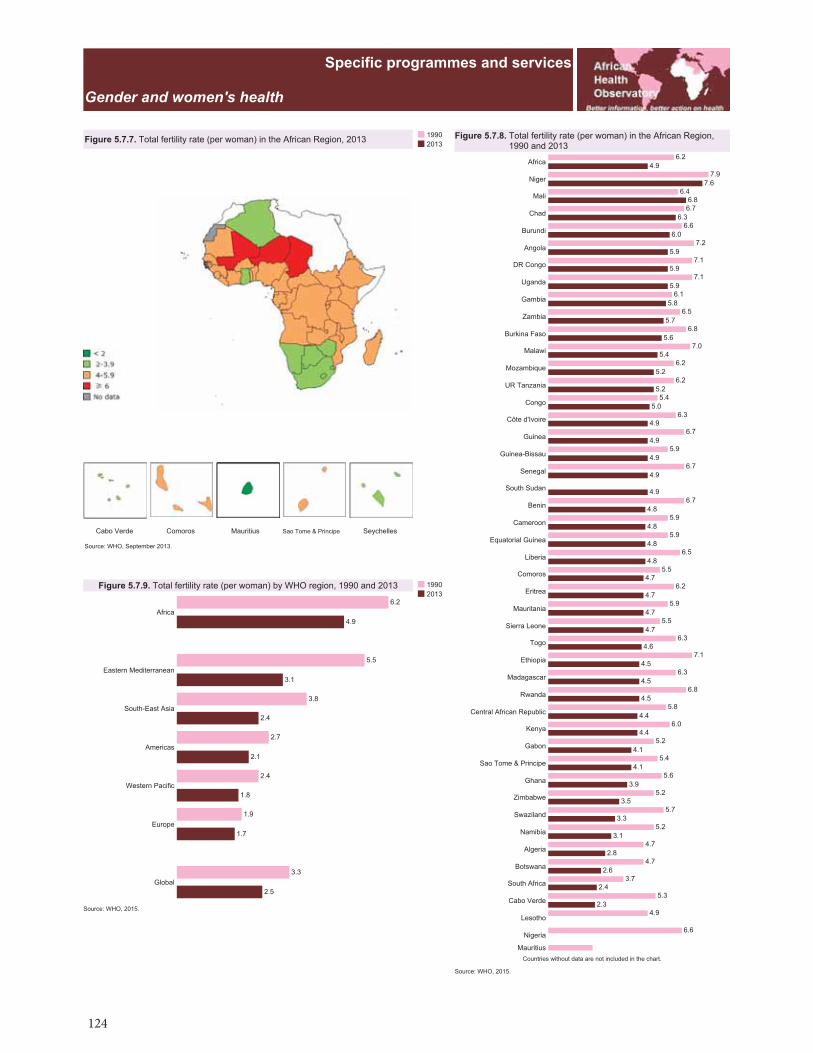
124
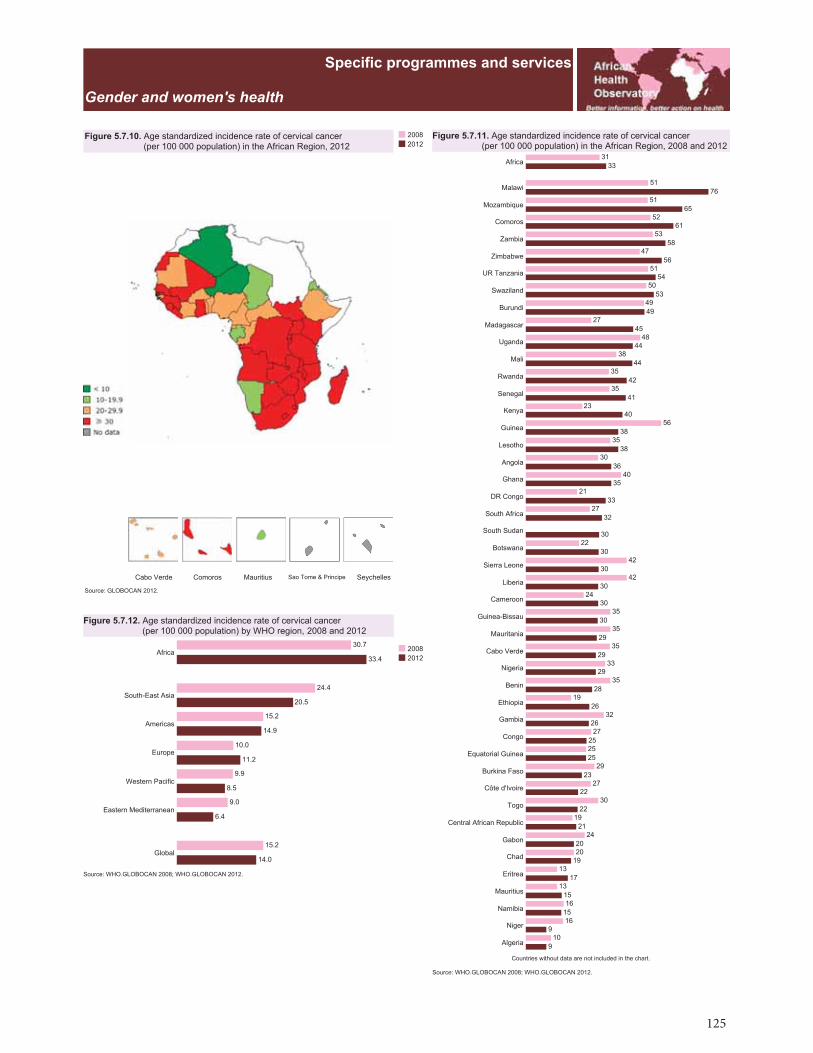
125
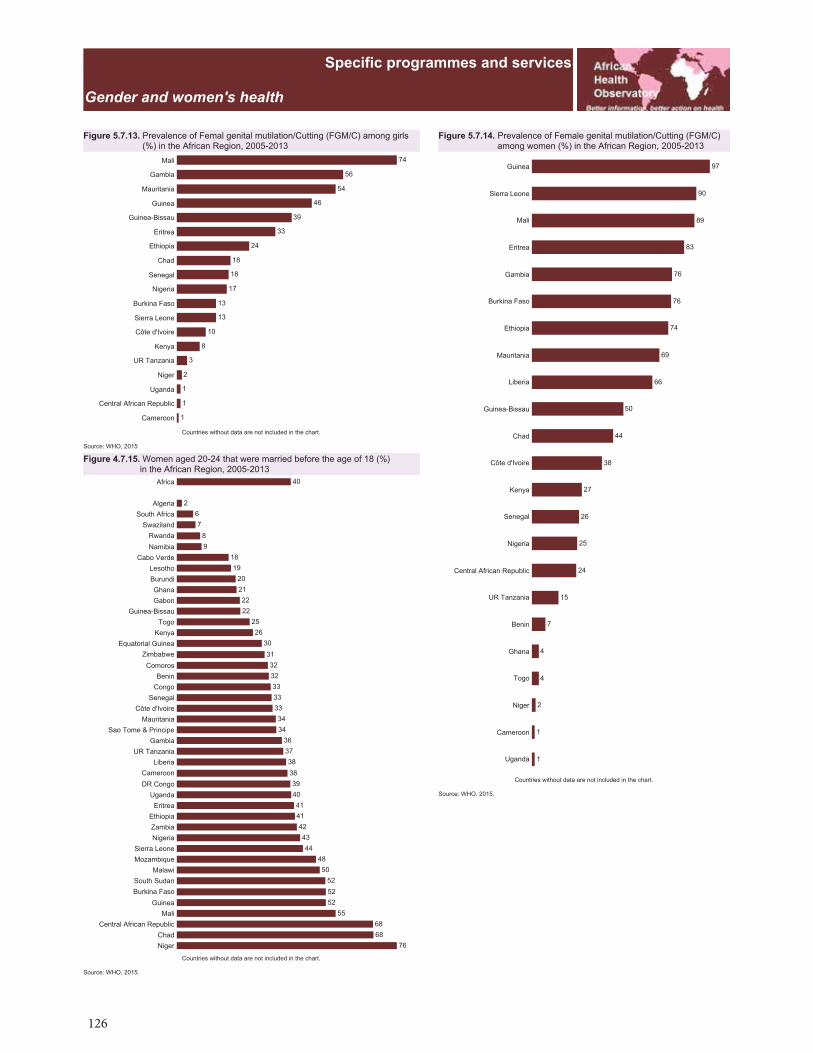
126
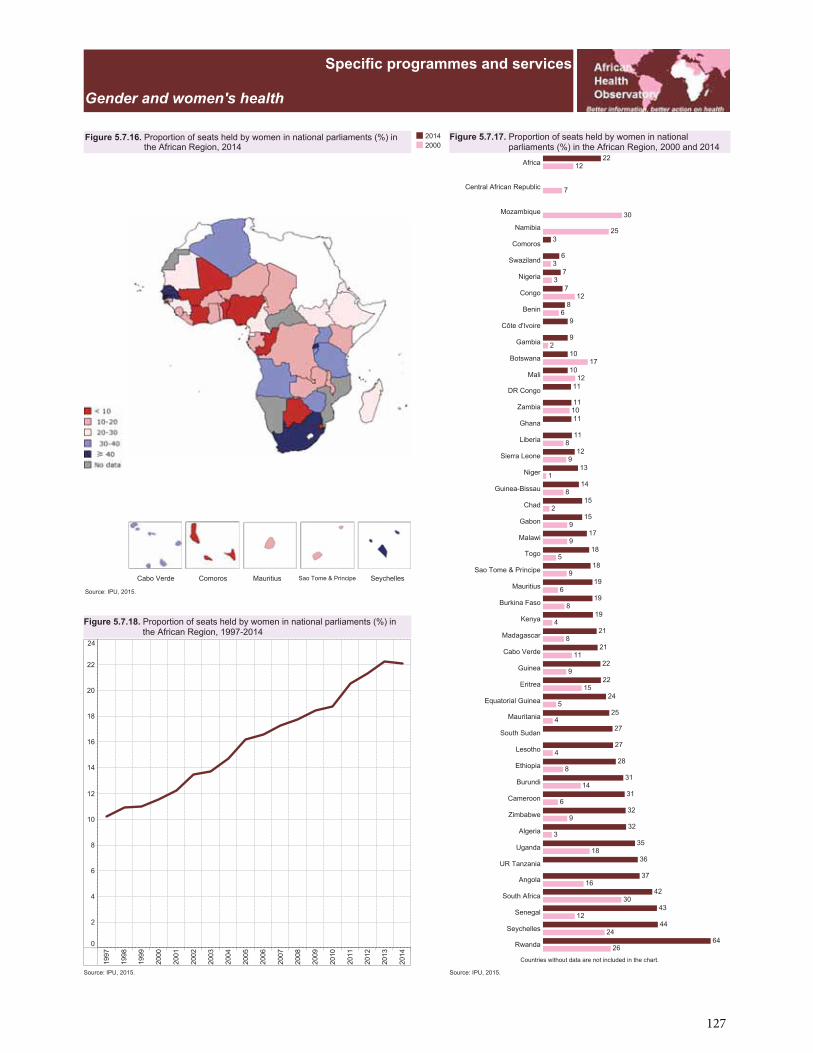
127
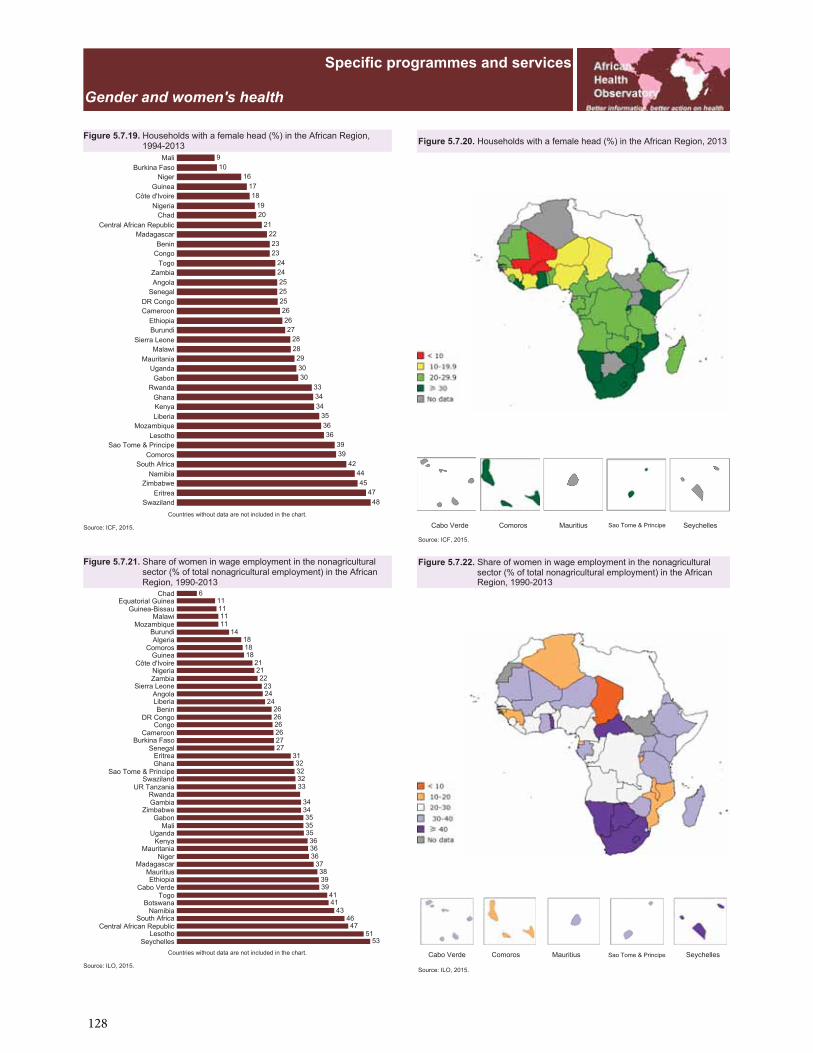
128

129
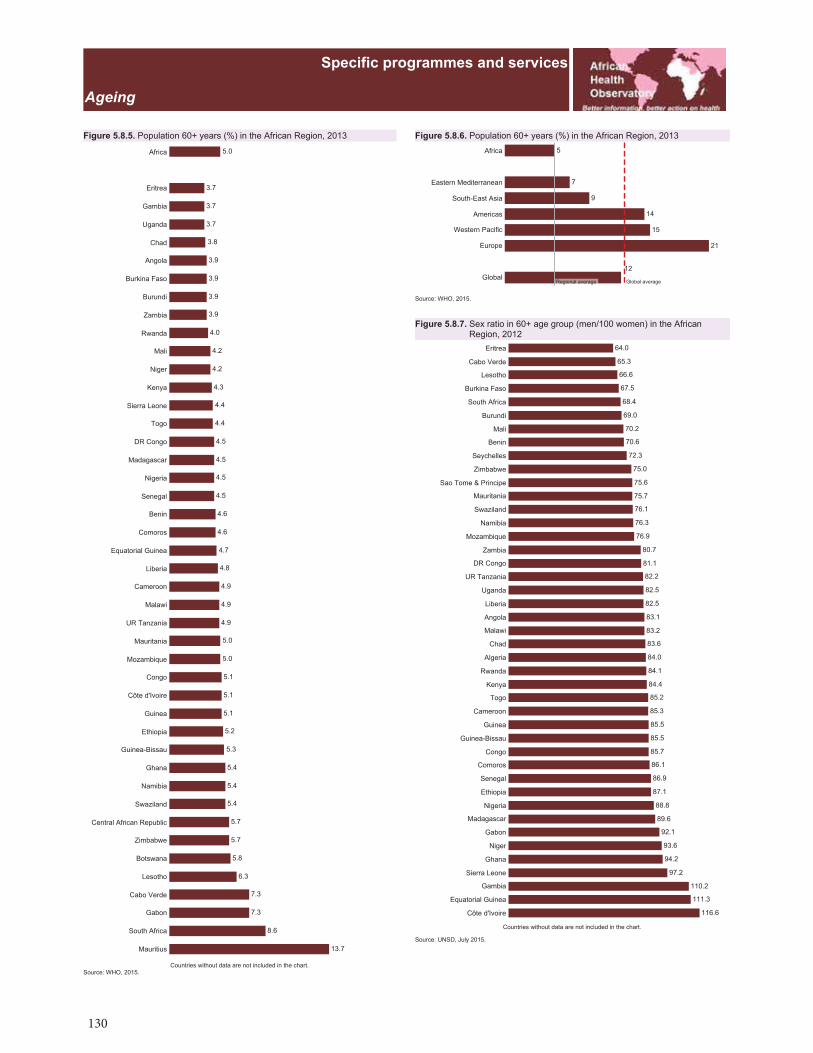
130

131
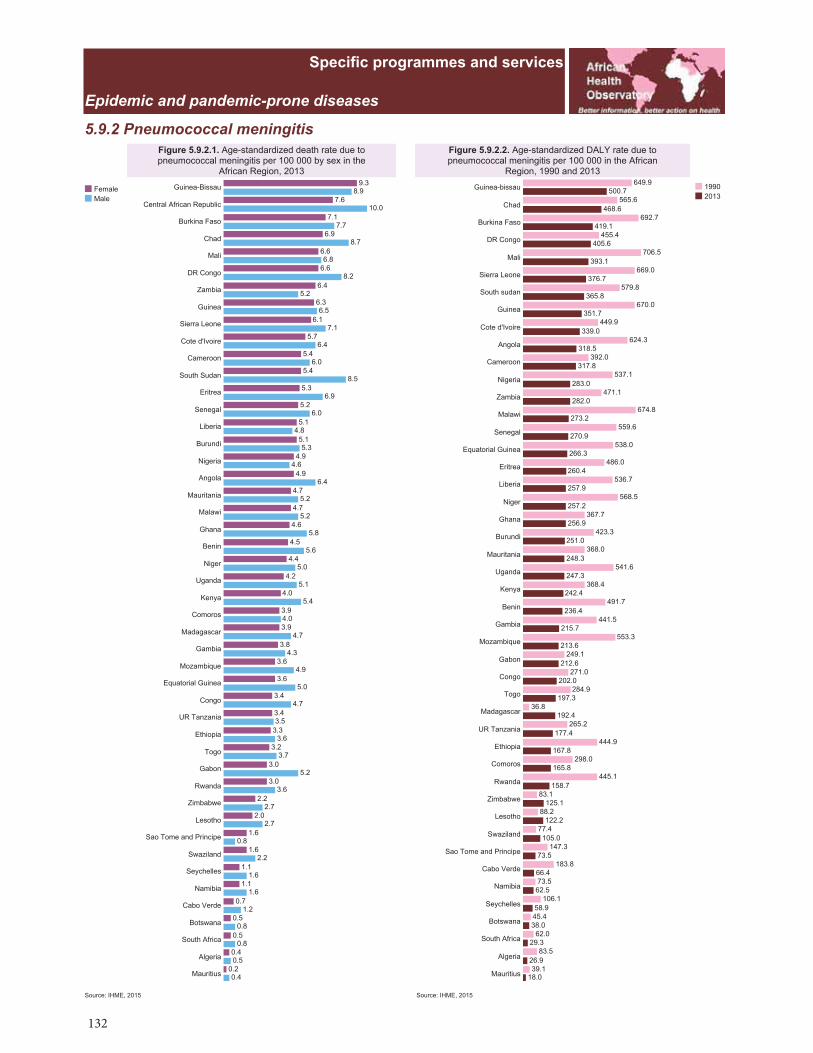
132

133
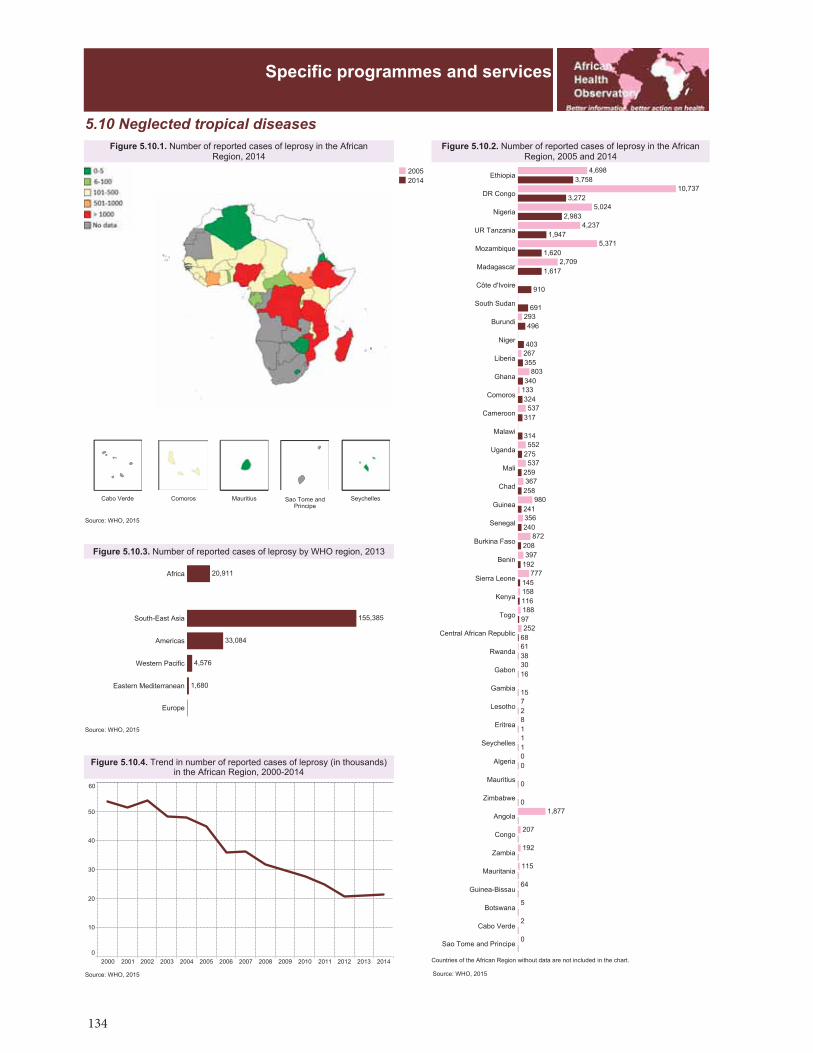
134
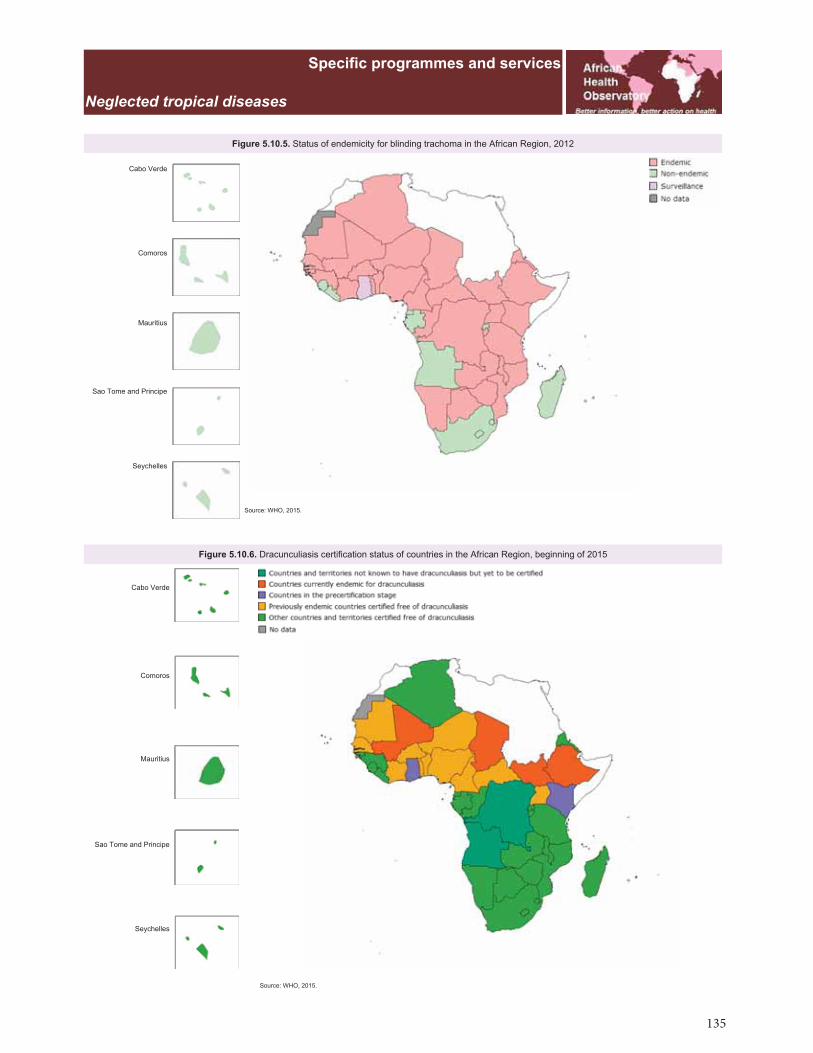
135
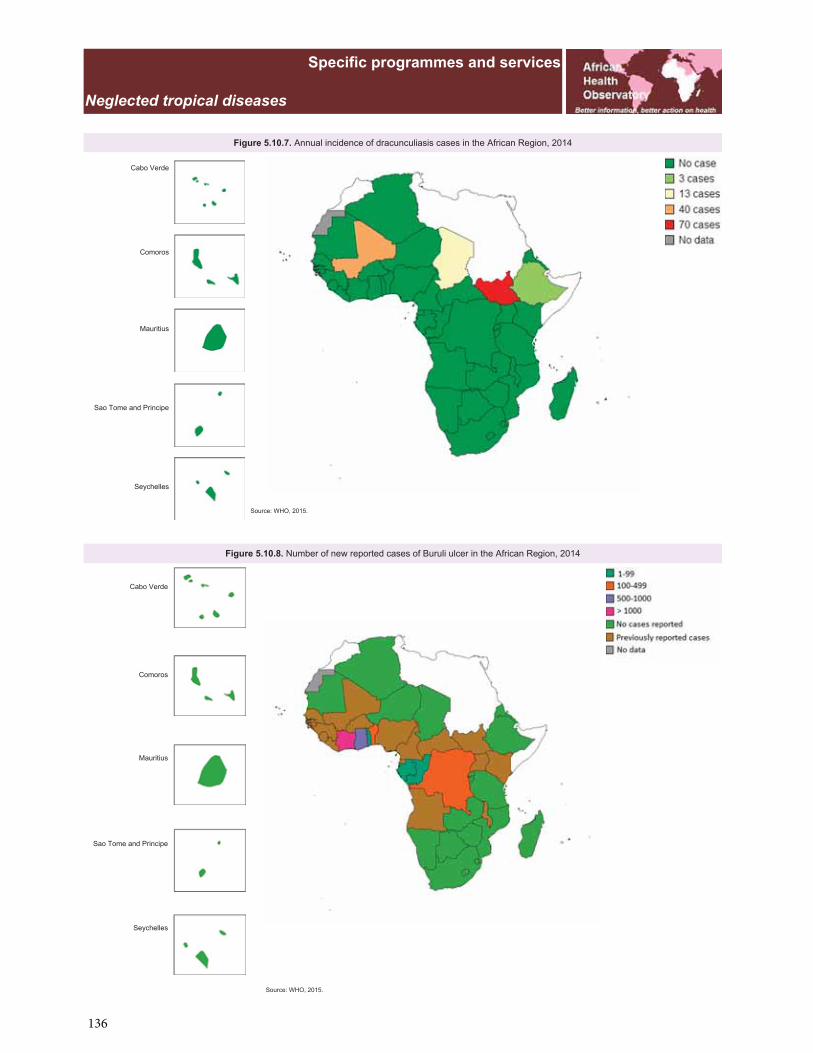
136
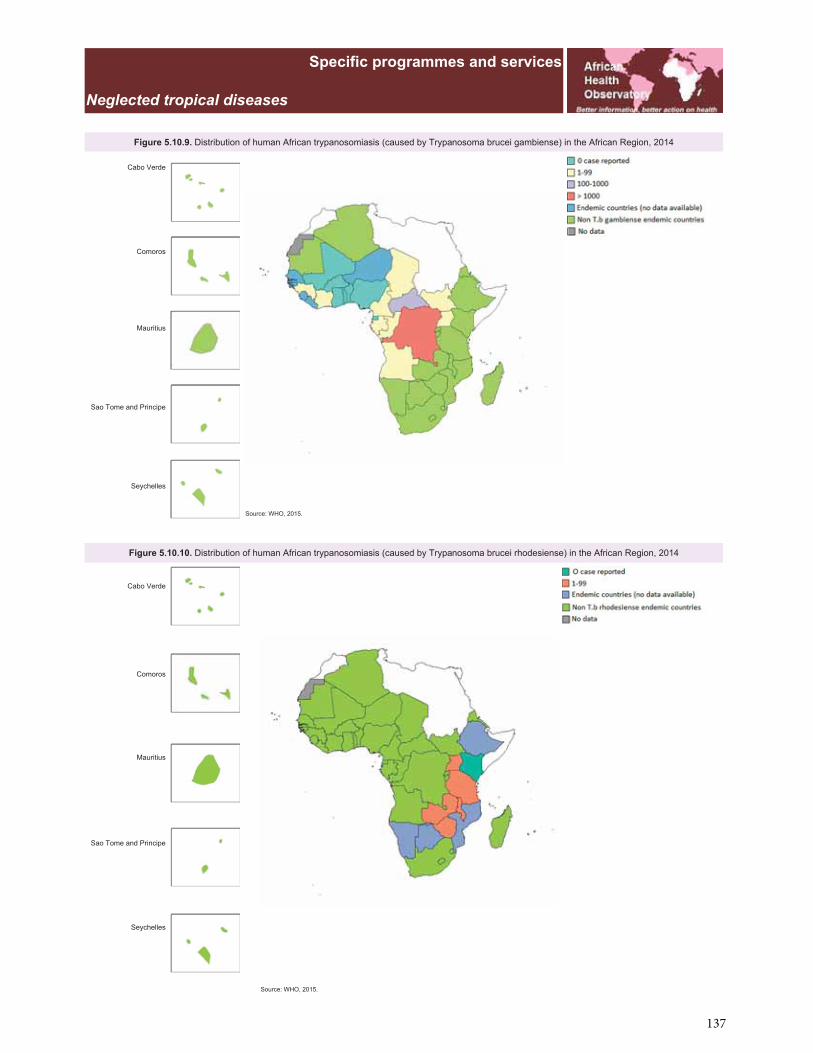
137

138
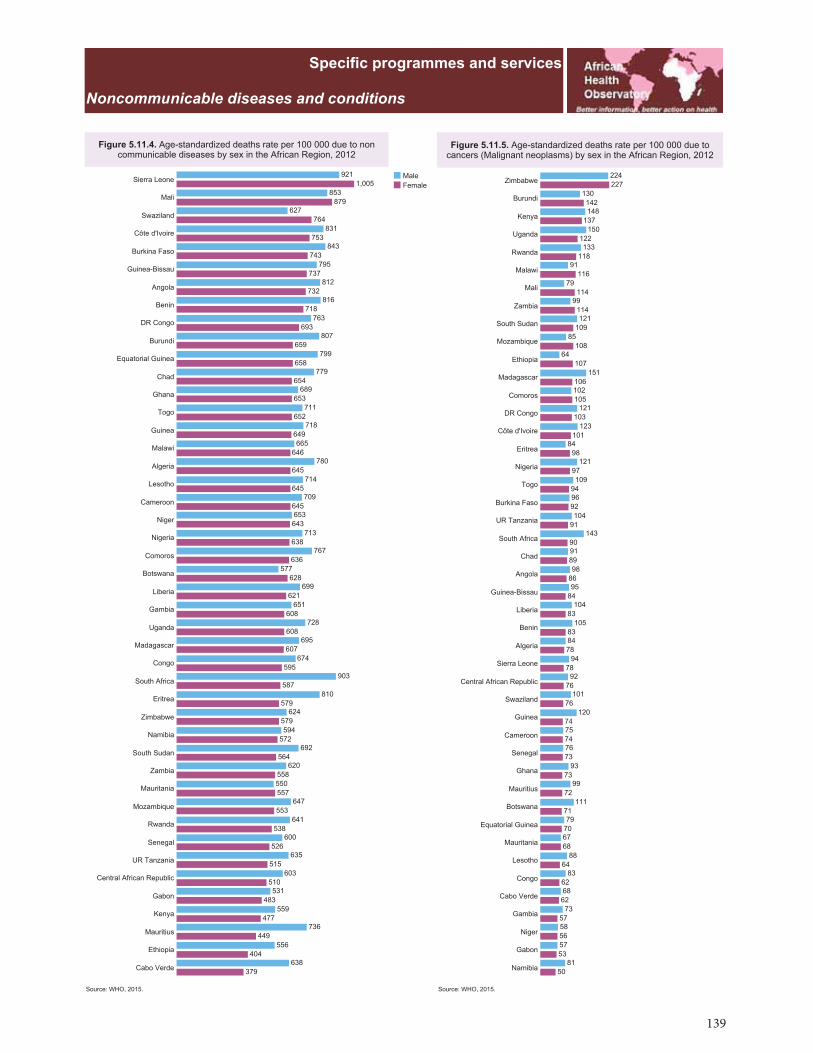
139
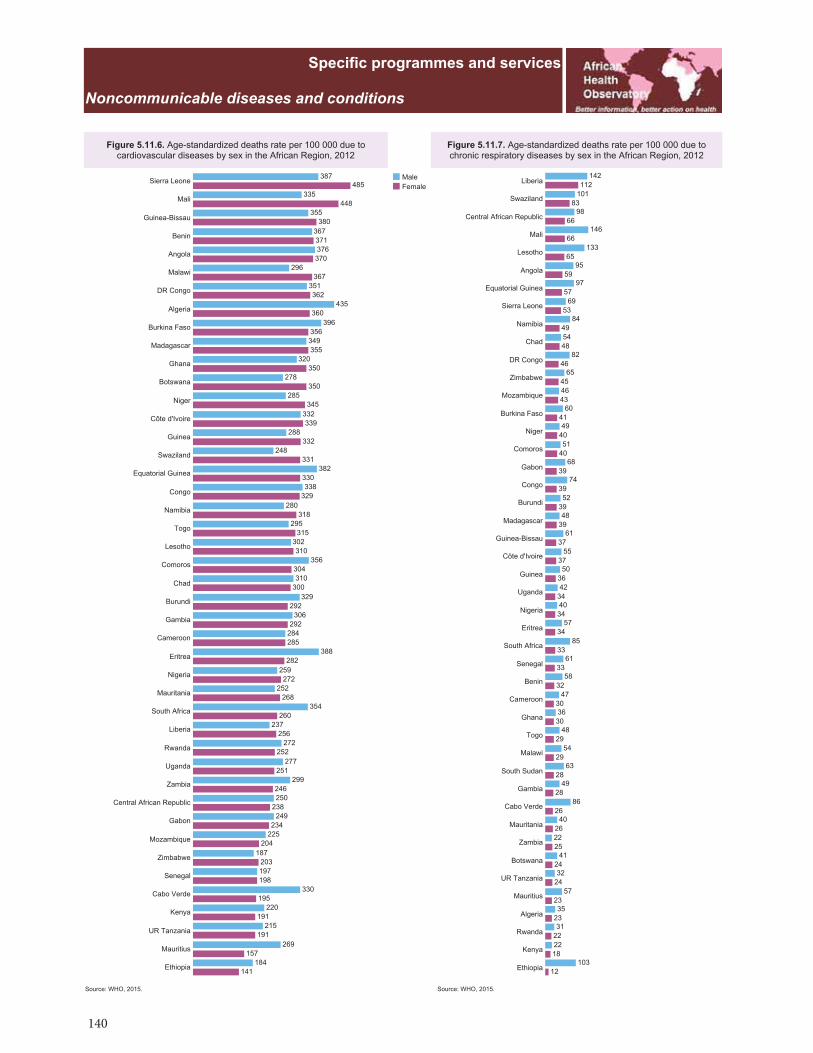
140
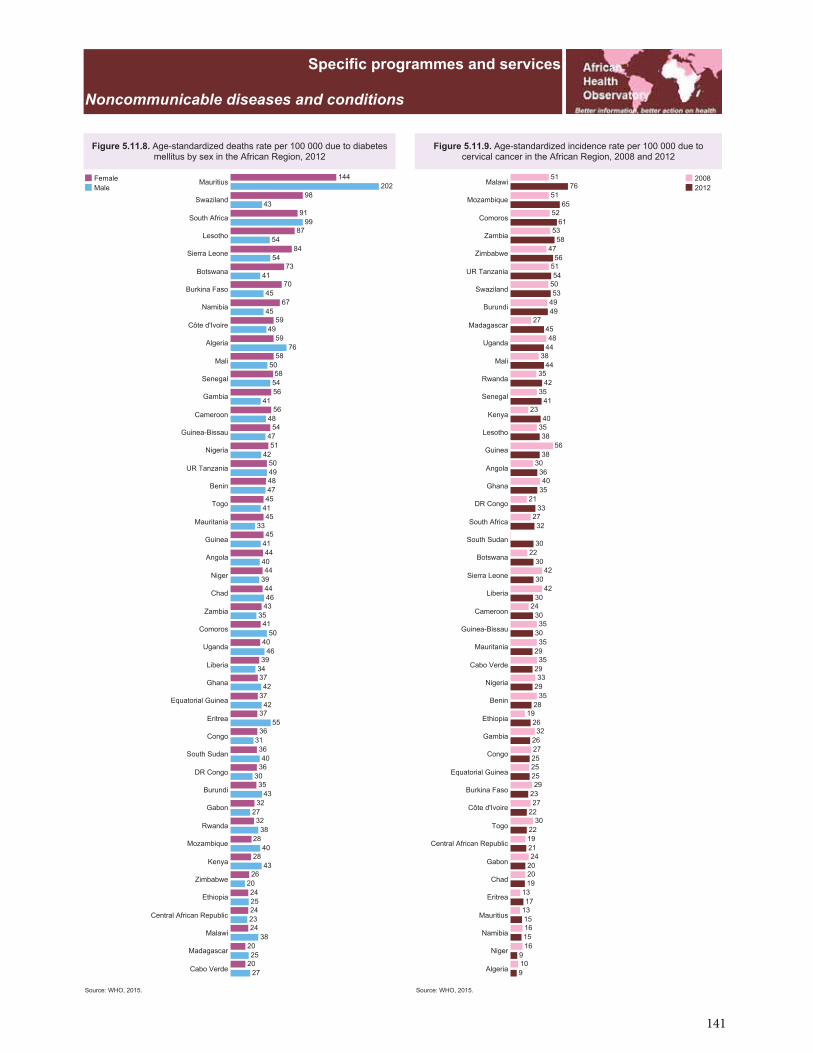
141
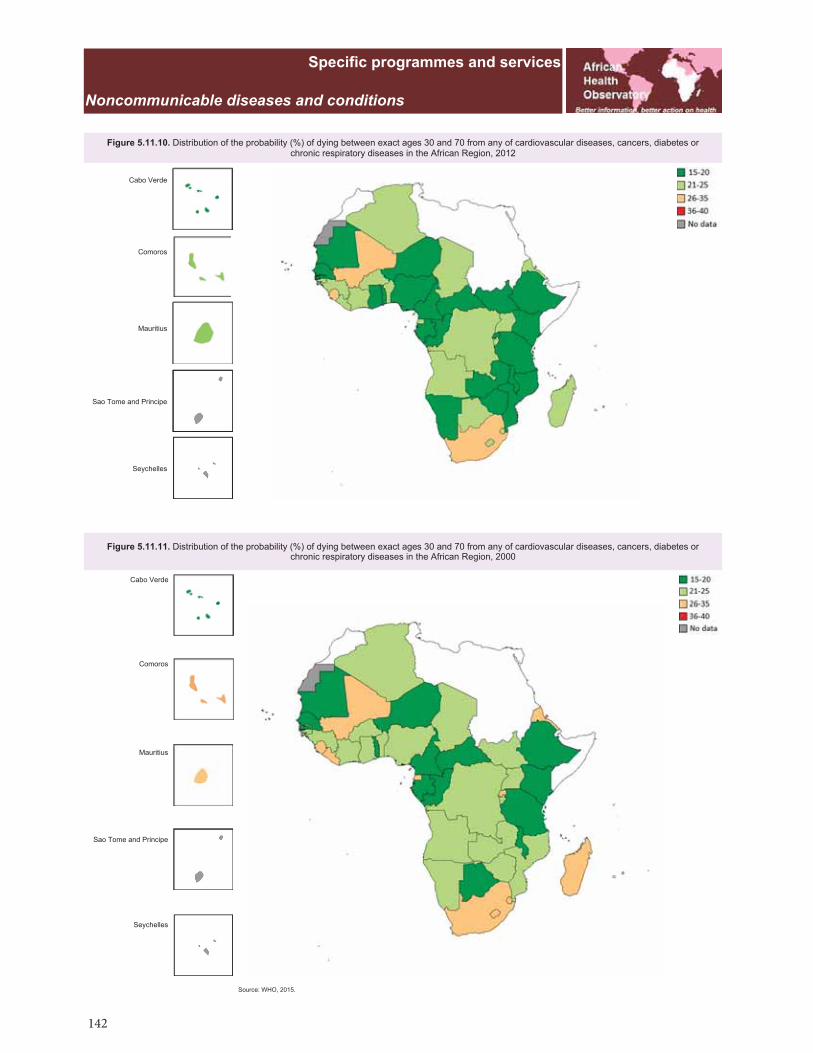
142

143

144
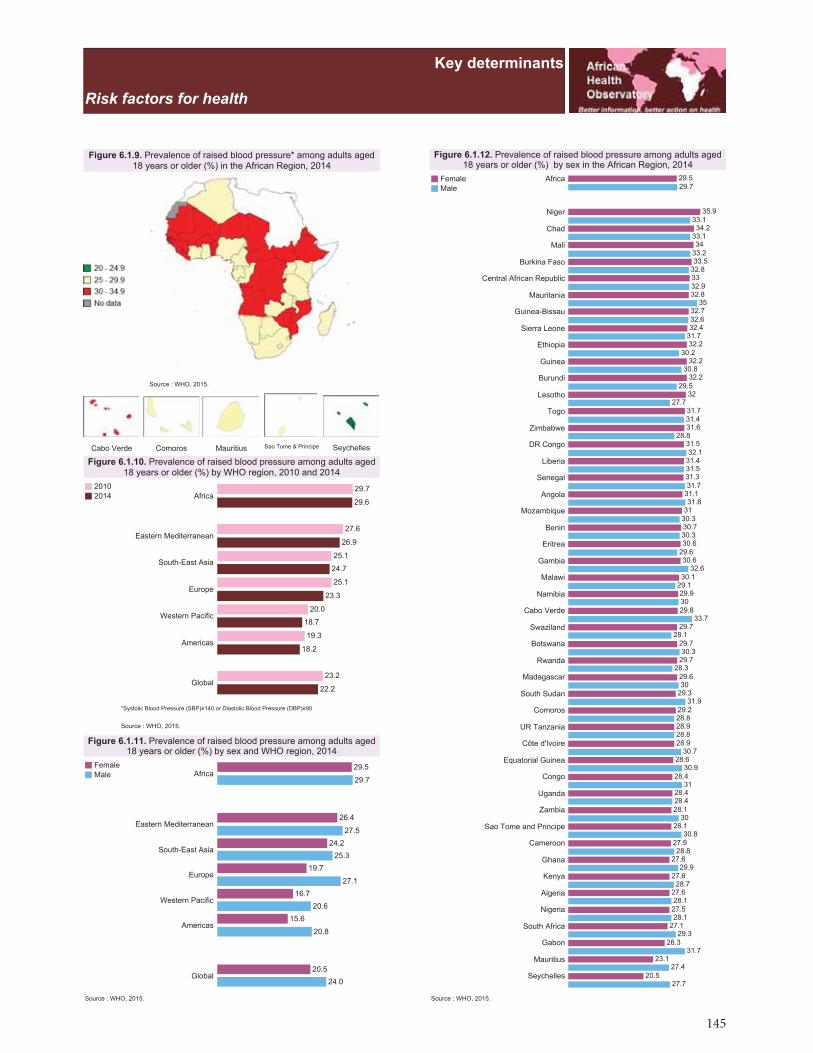
145
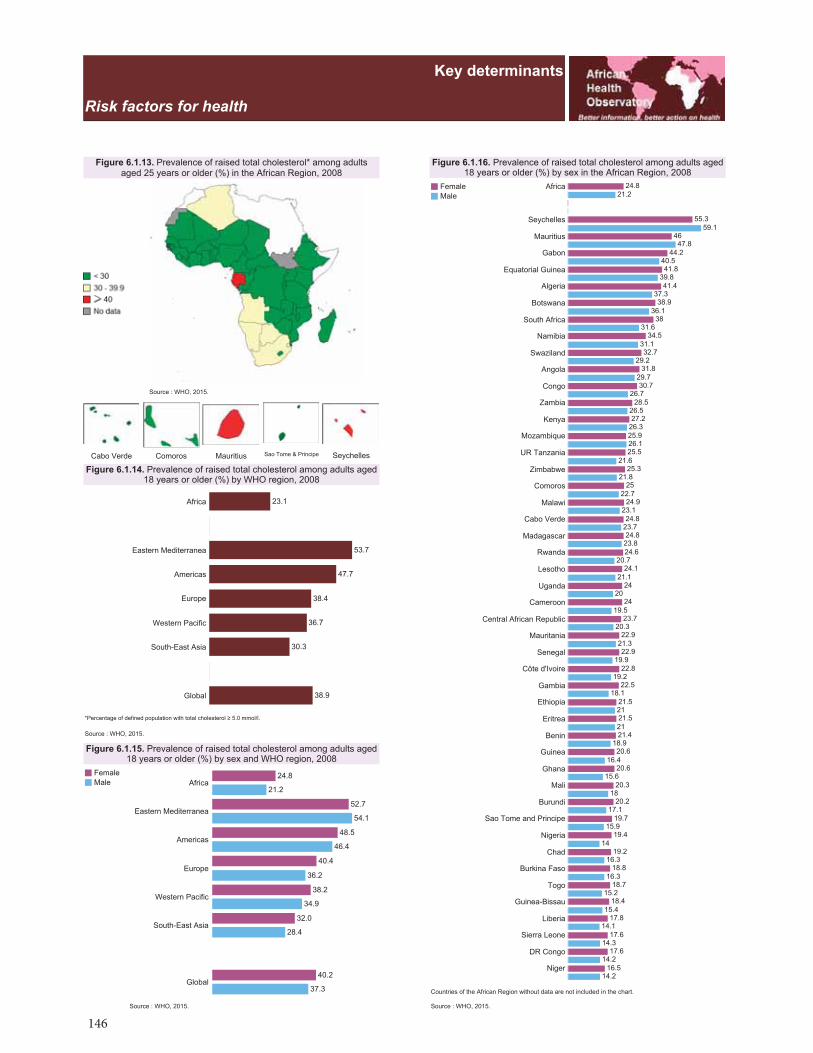
146
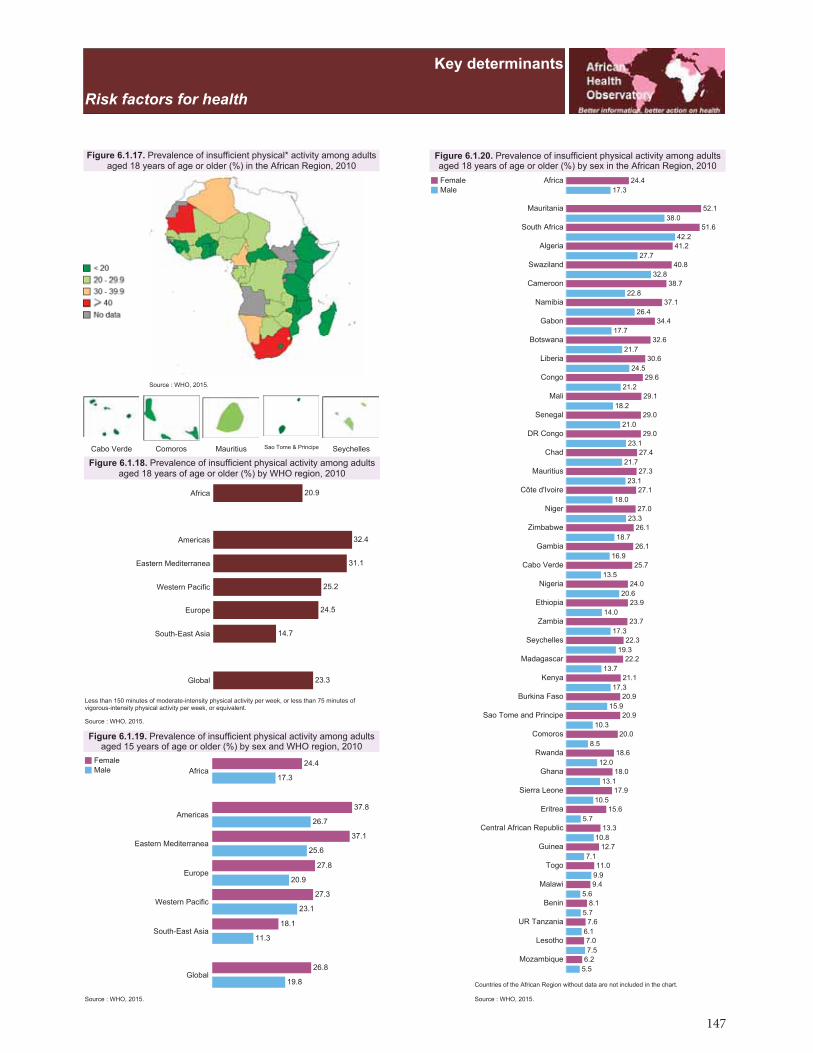
147
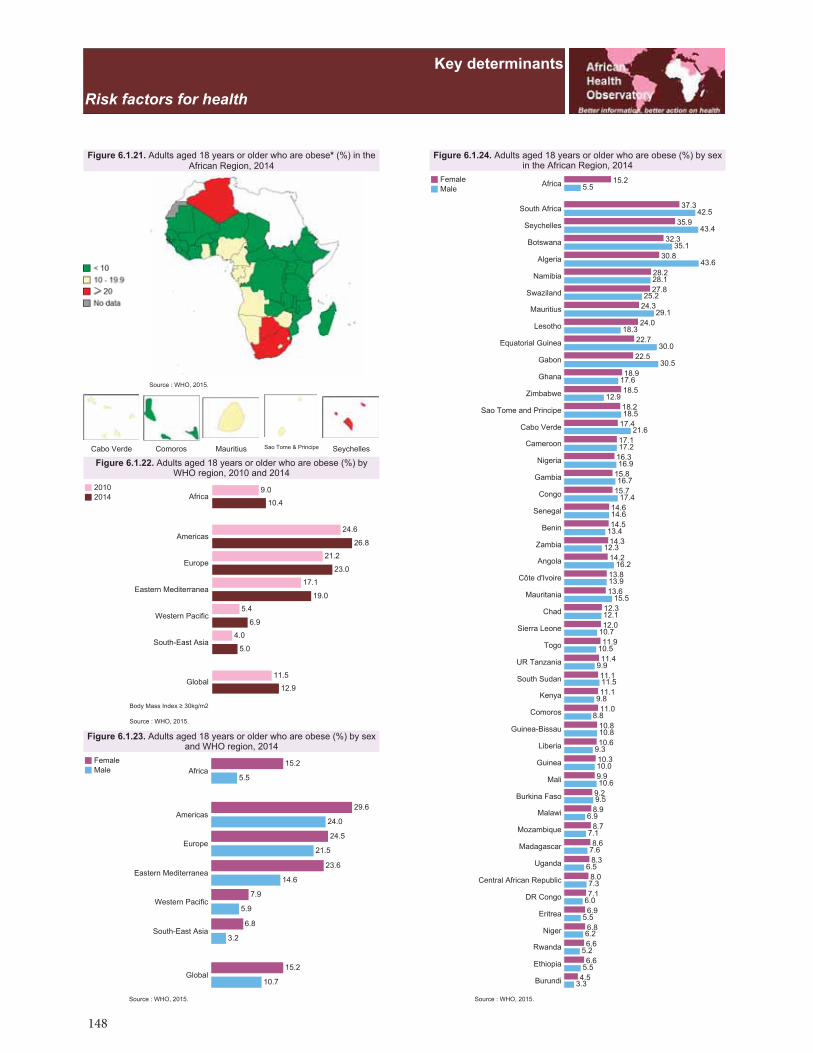
148
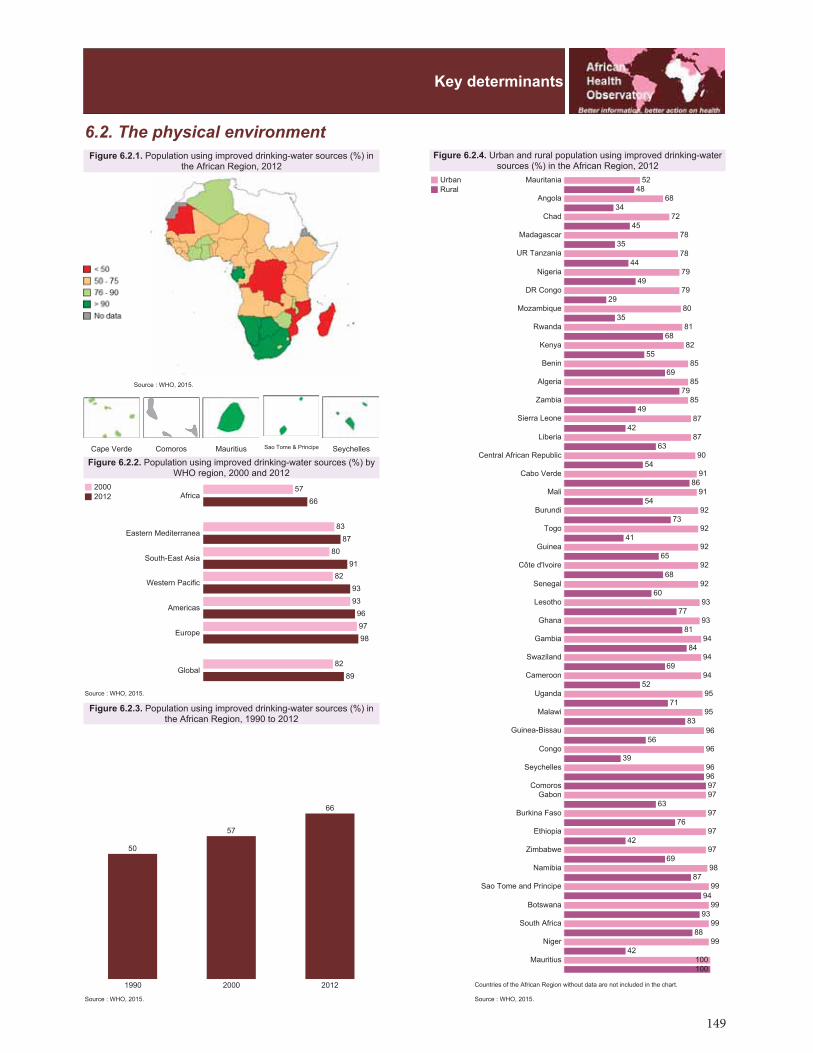
149
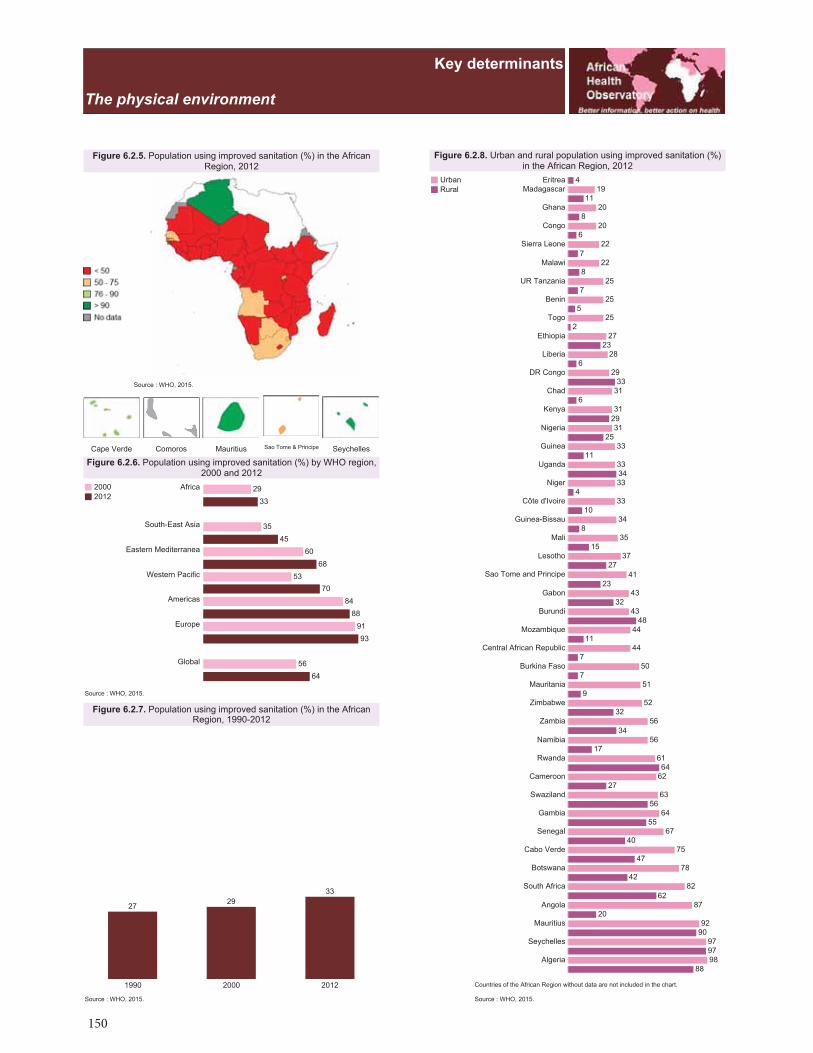
150
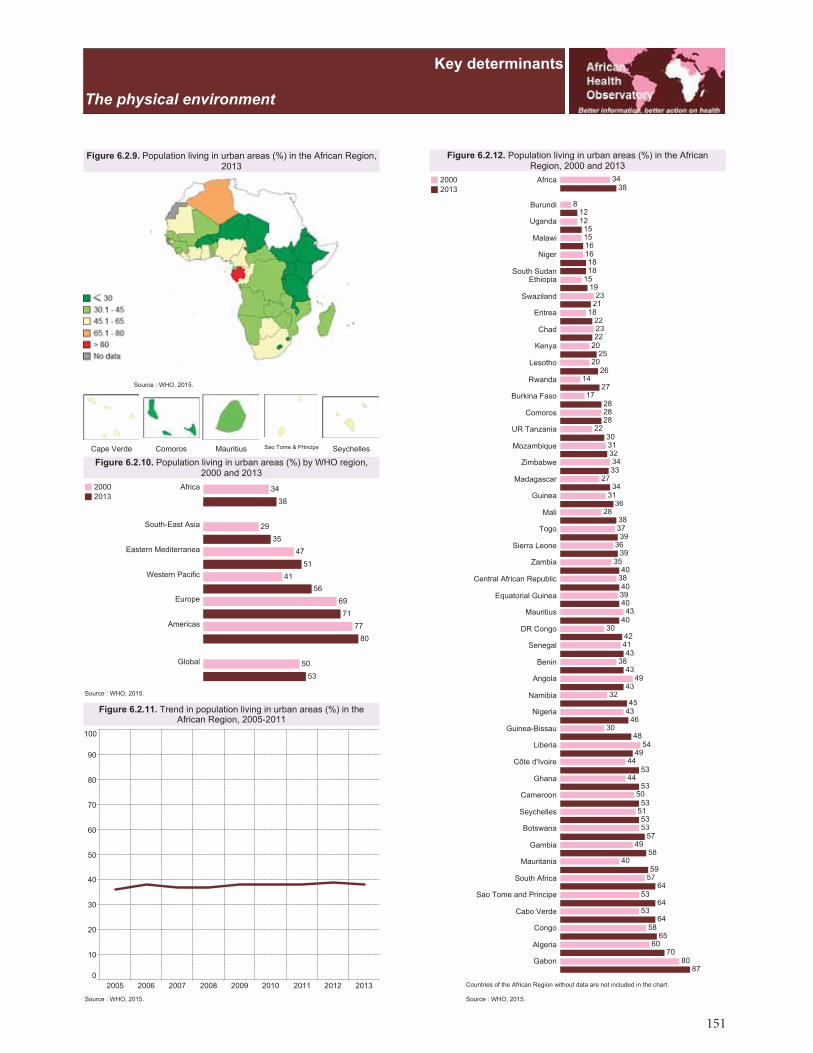
151

152
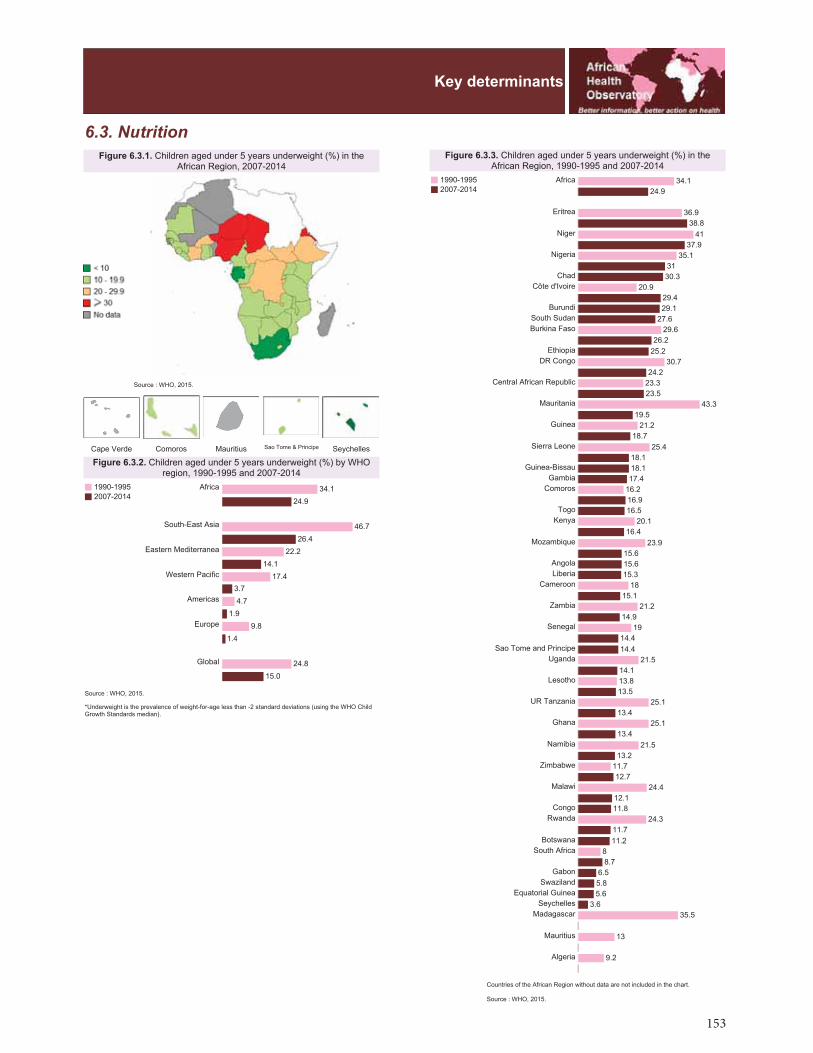
153
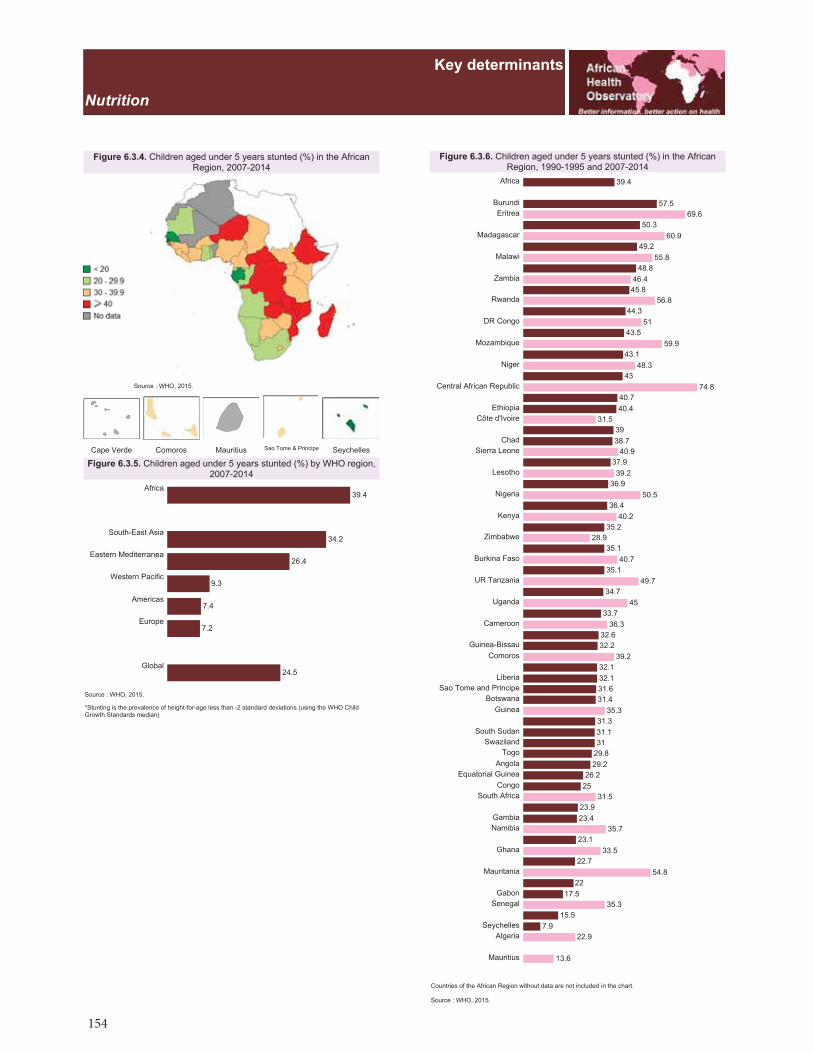
154
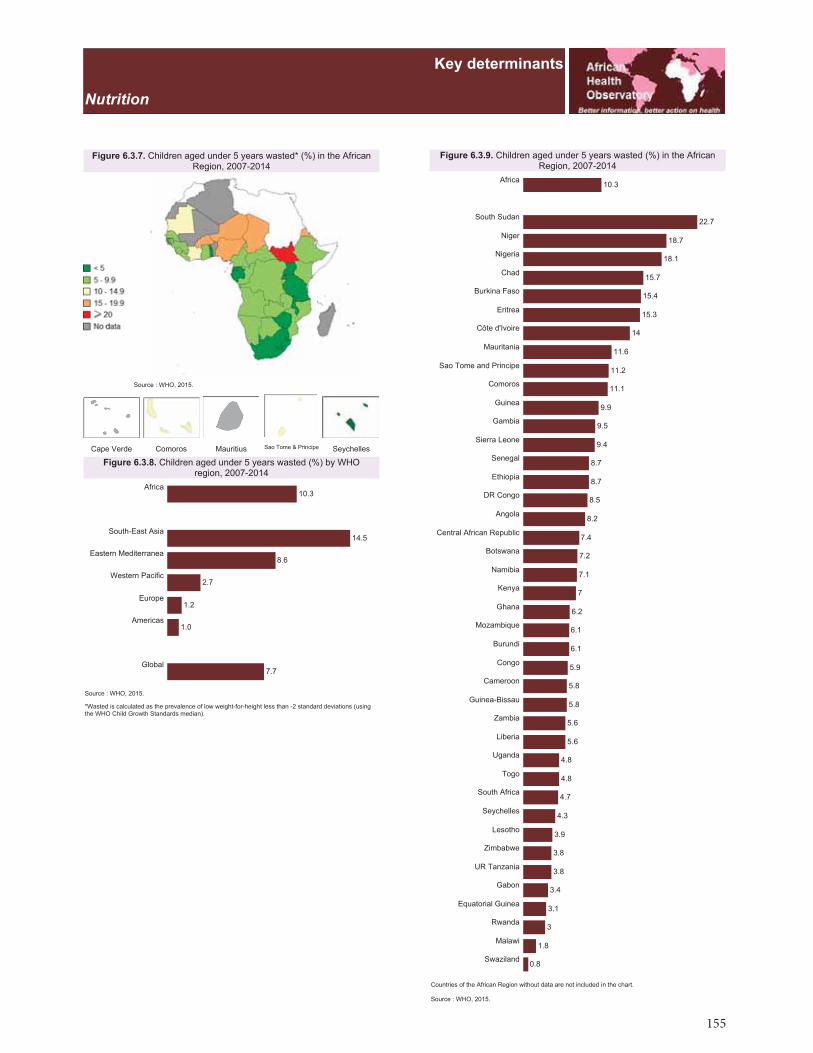
155
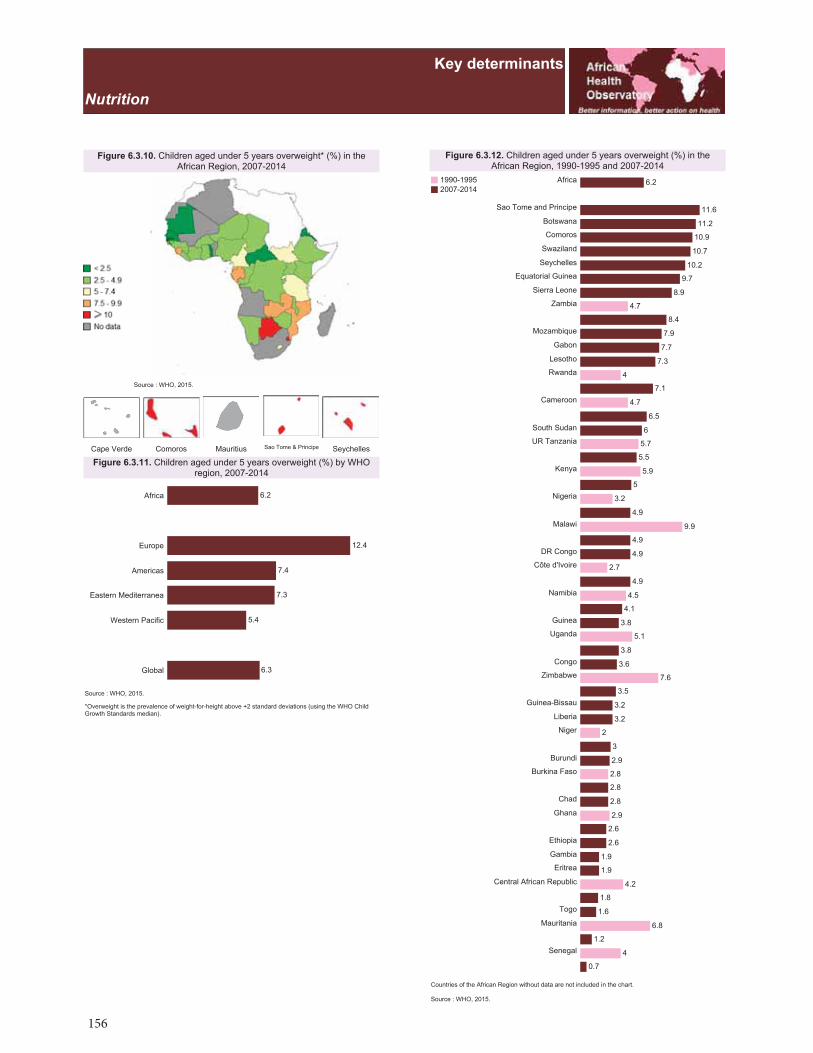
156
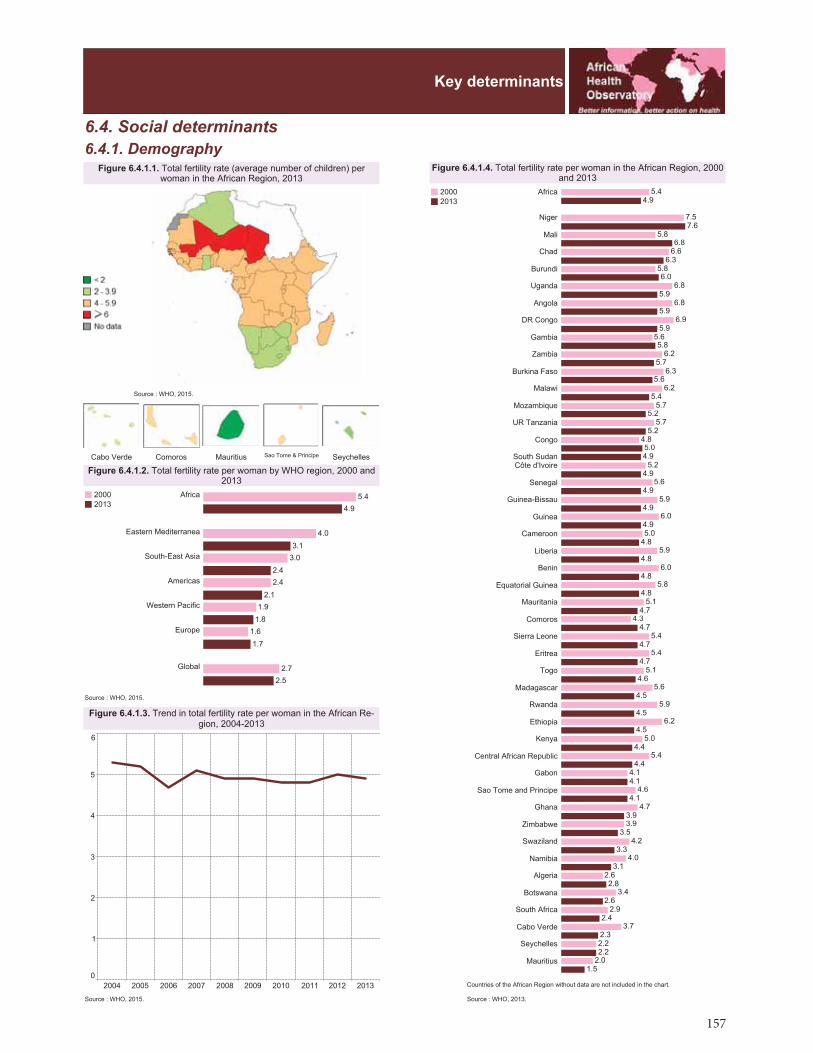
157
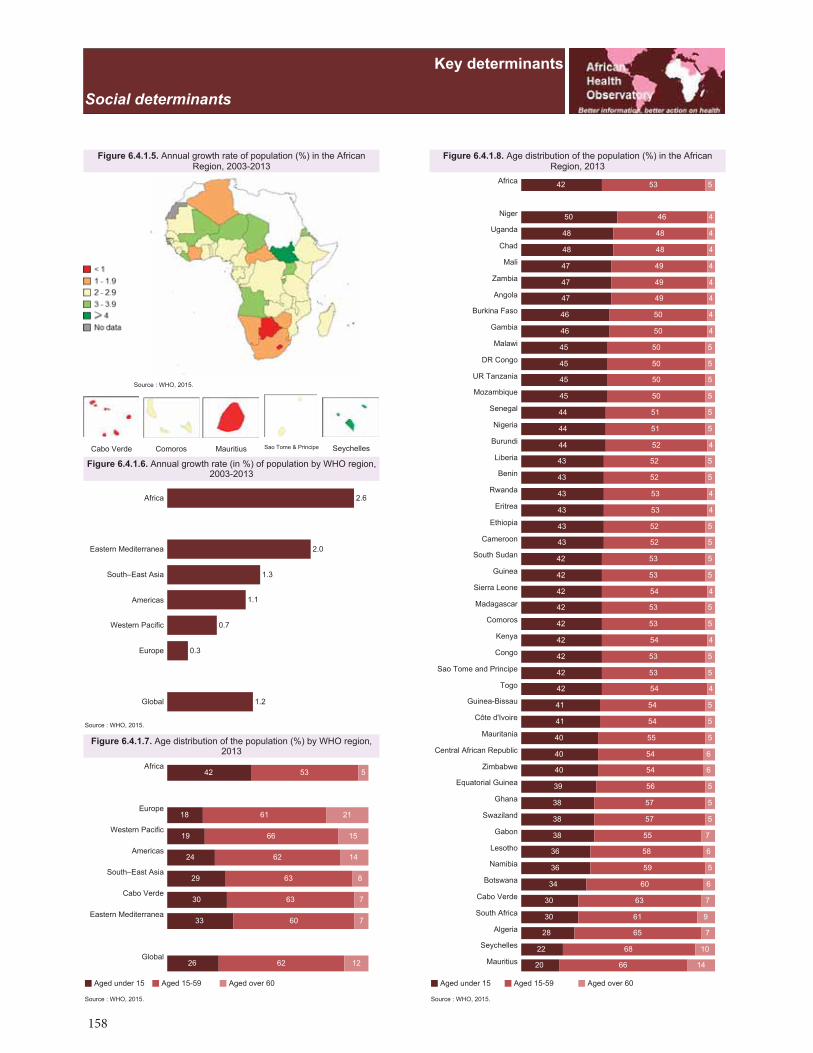
158
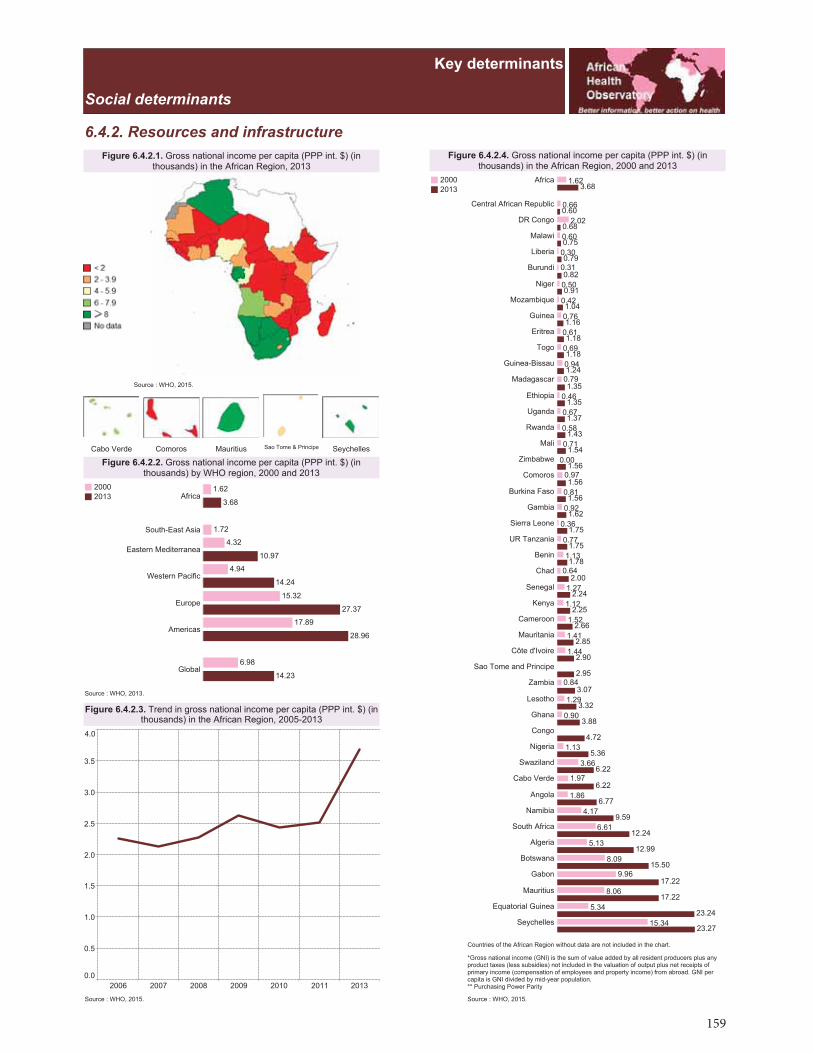
159
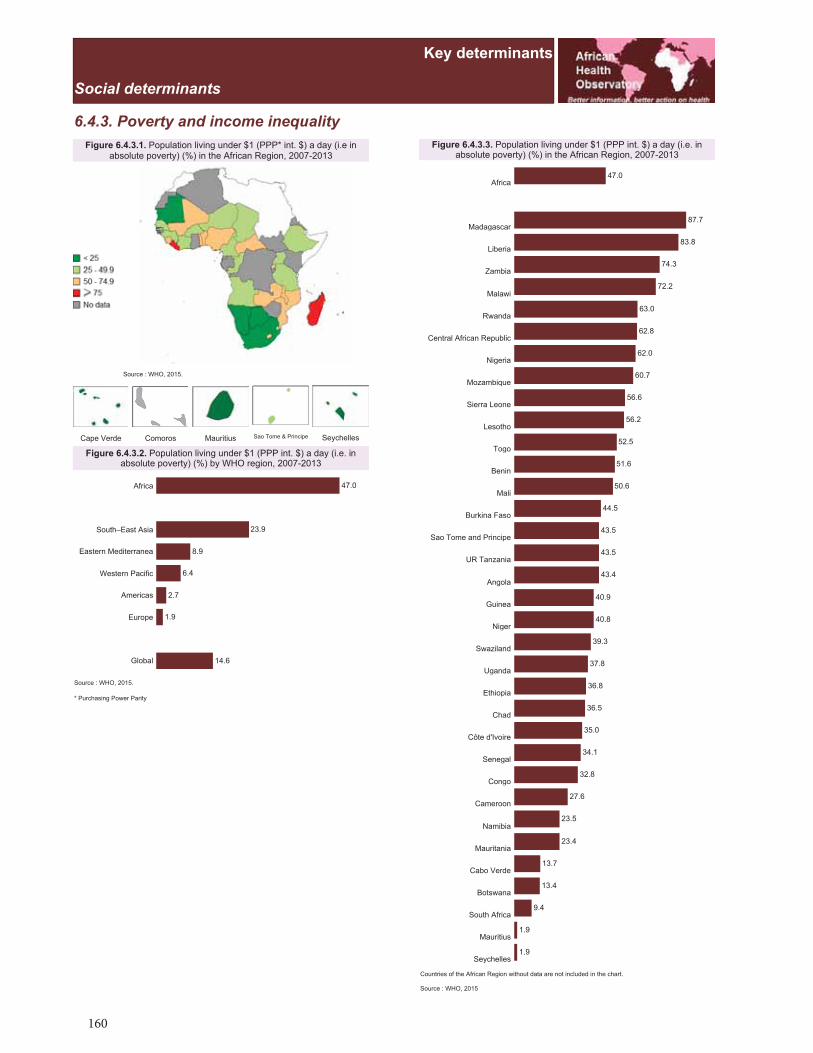
160
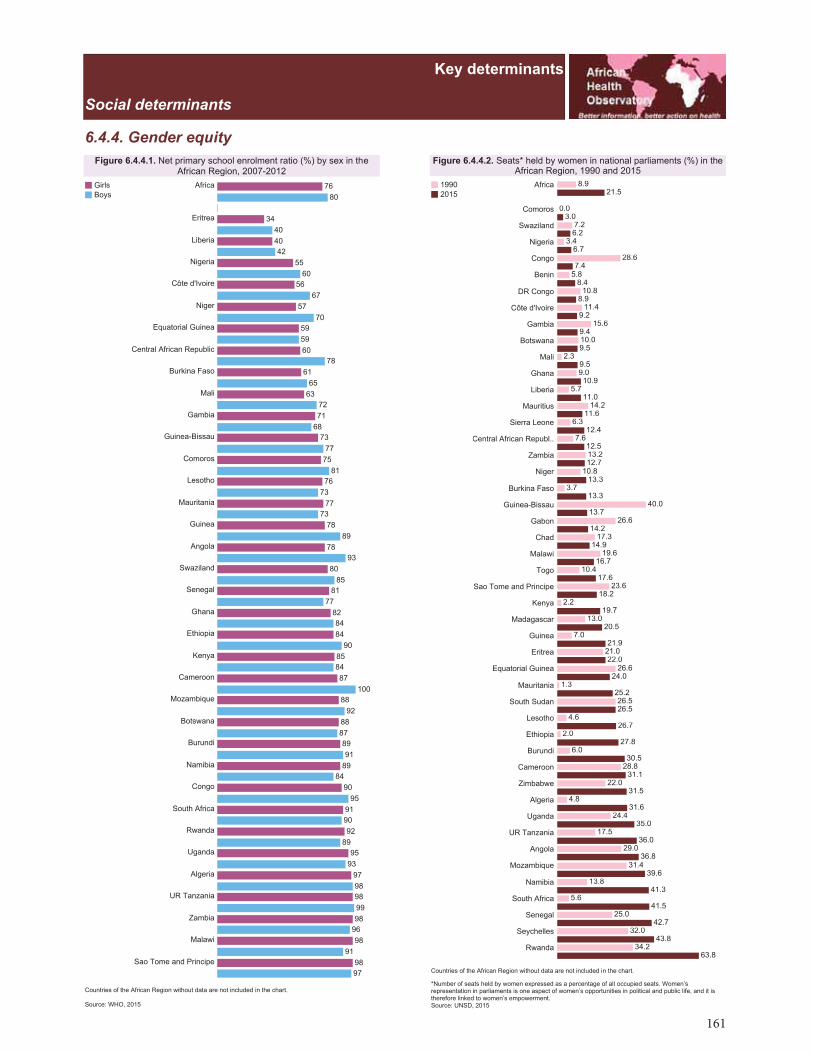
161
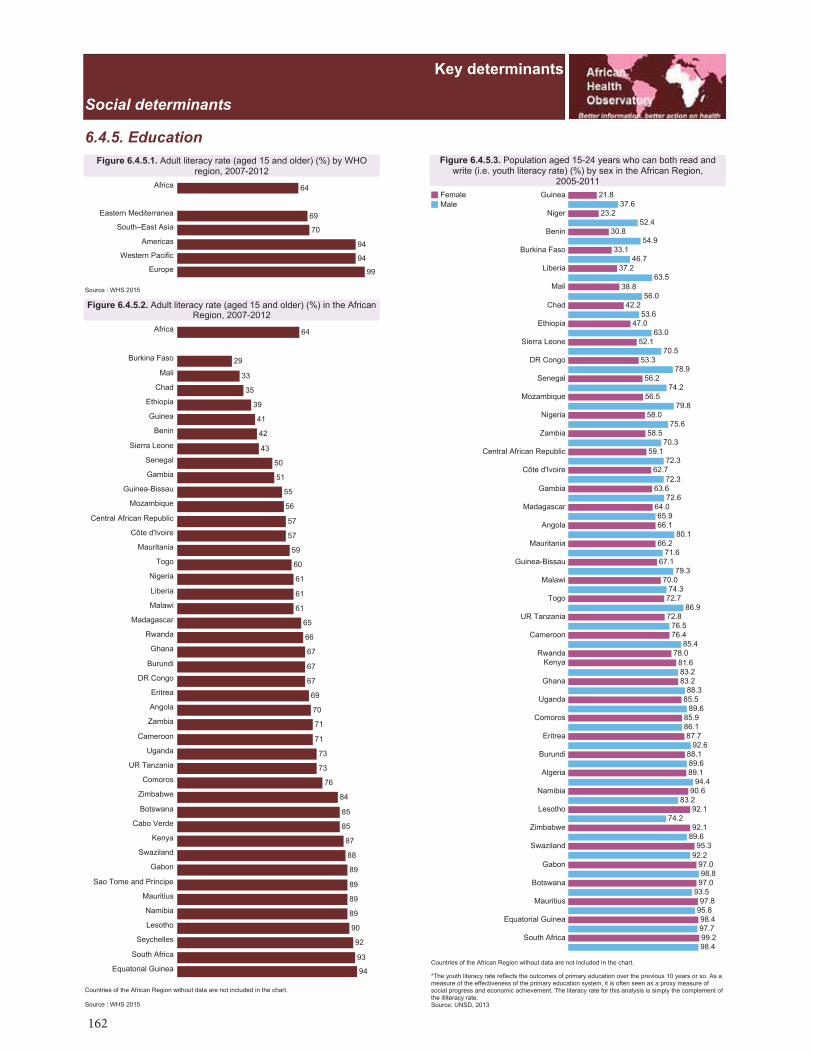
162
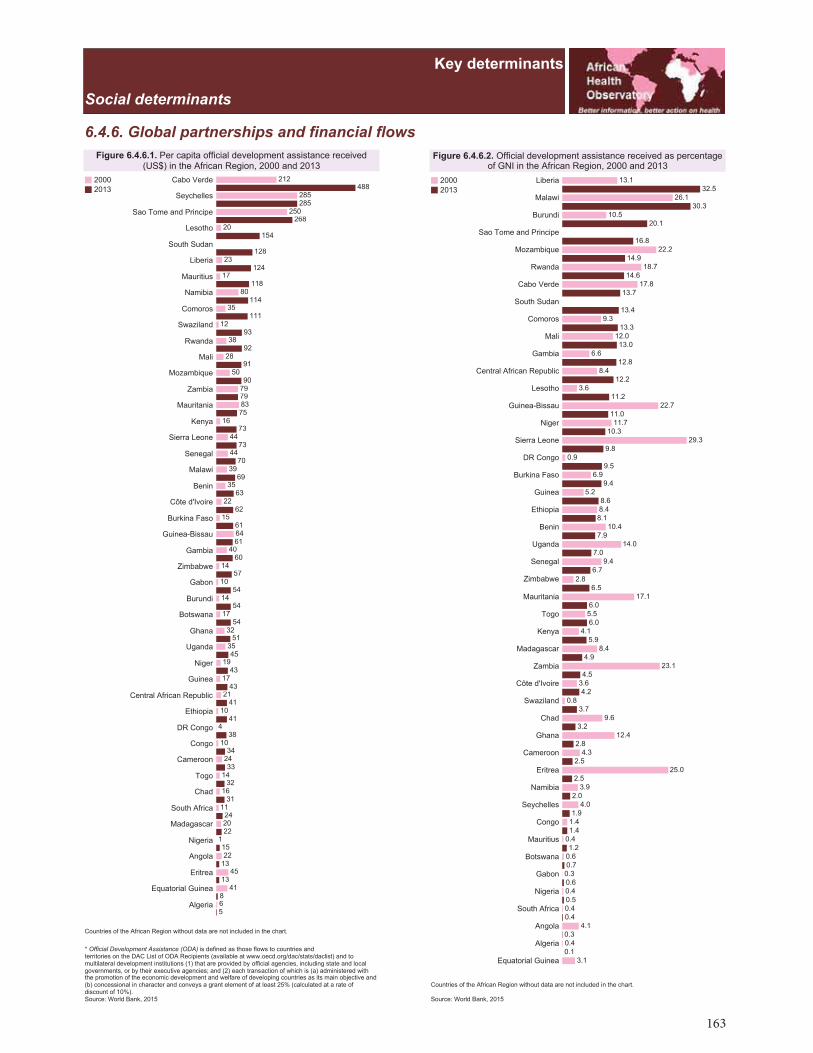
163
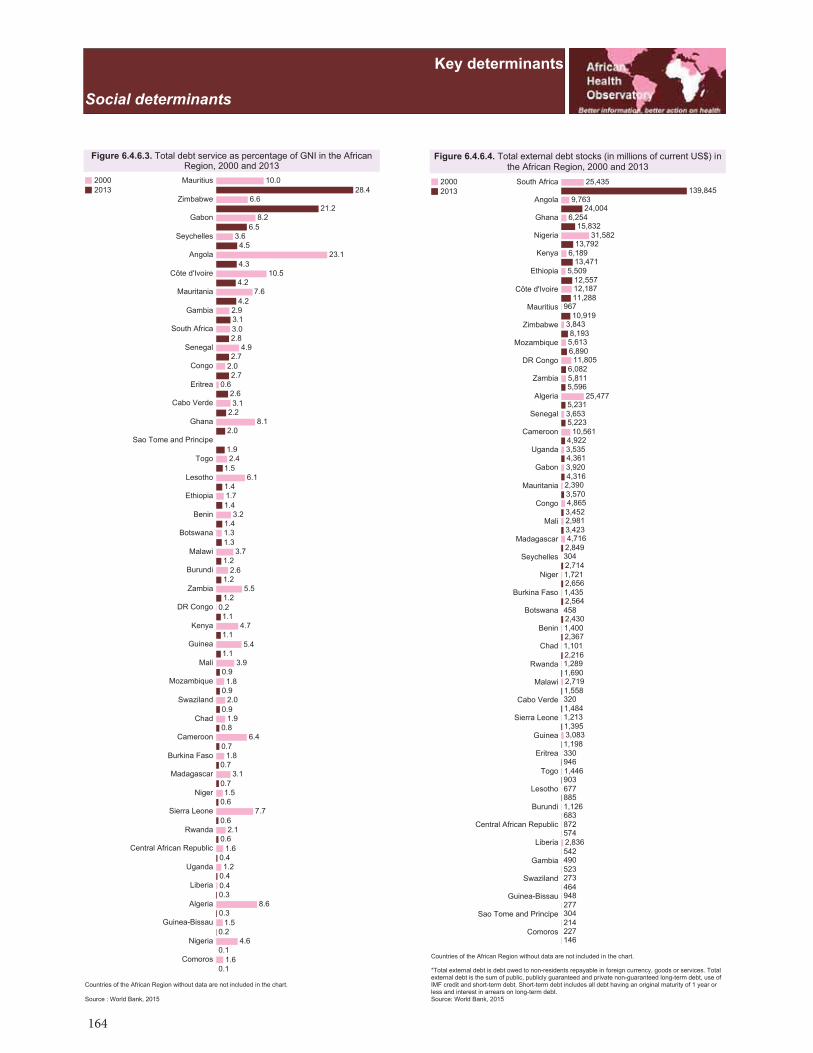
164
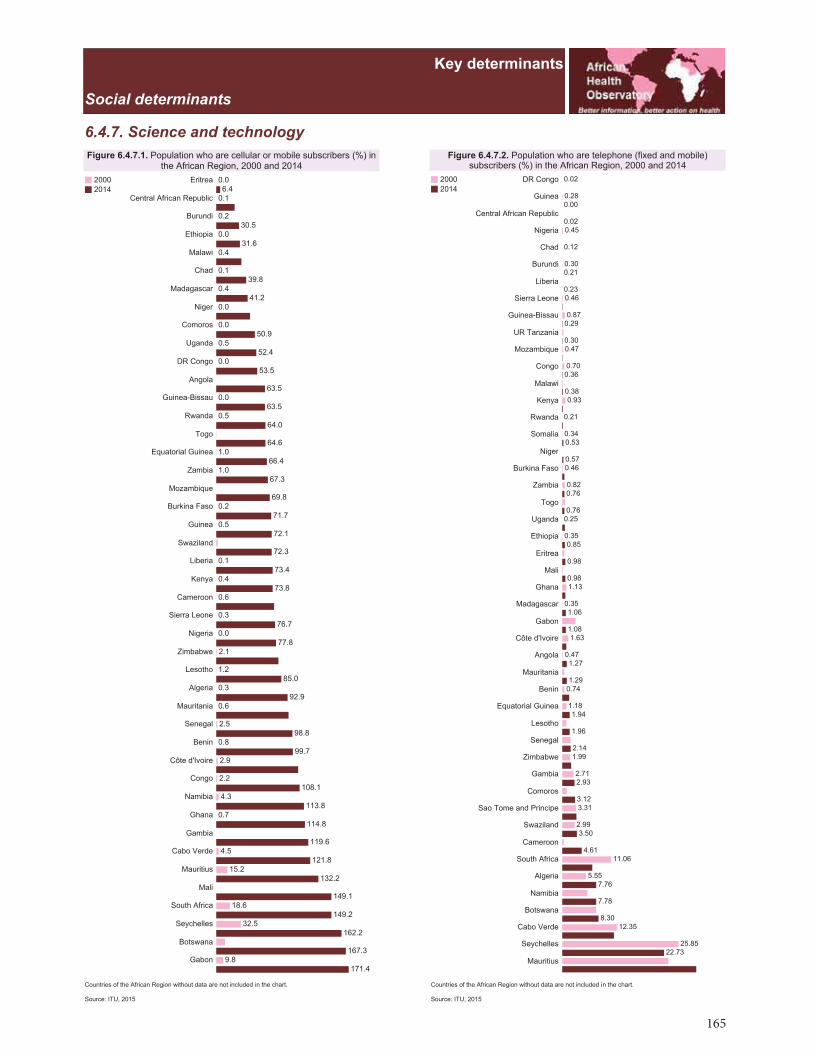
165

166
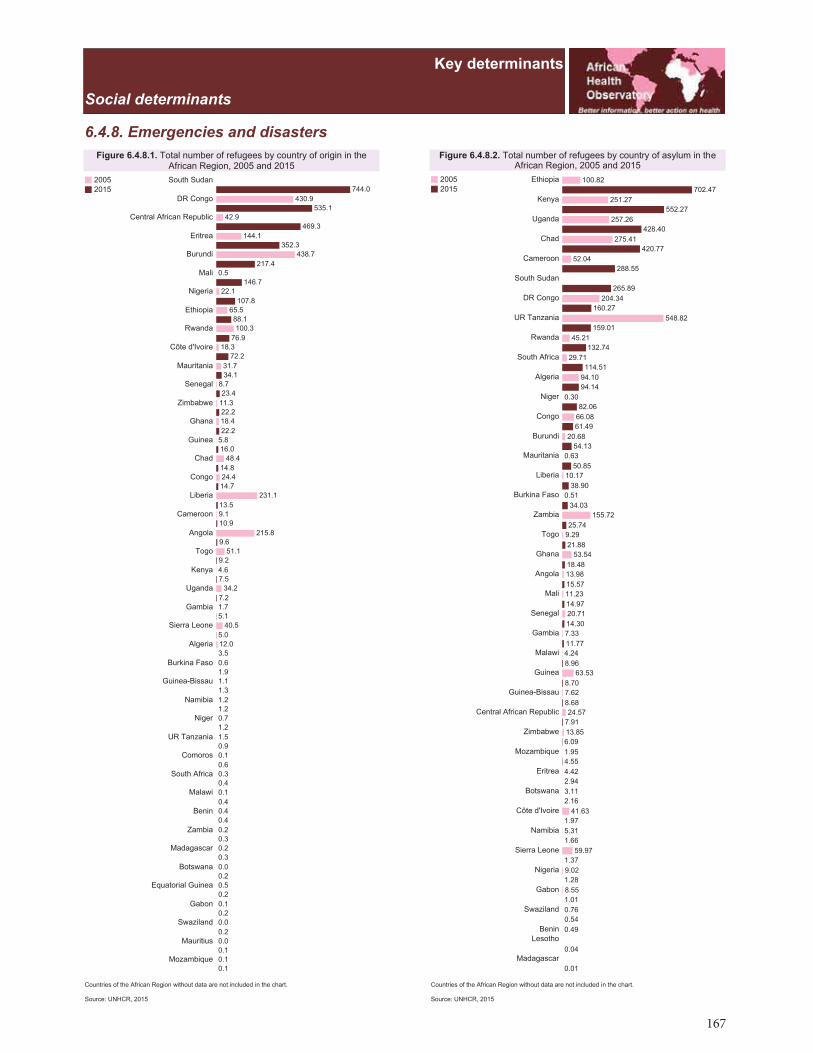
167
1. IntroductionPopulation size (in thousands)
Definition De facto population in a country, area or region as of 1 July of the year indicated. Figures are presented in thousands.
Metadata http://apps.who.int/gho/indicatorregistry/App_Main/view_indicator.aspx?iid=113
2. Health status and trends2.1. Life expectancy
http://www.aho.afro.who.int/en/data-statistics/life-expectancy
Healthy life expectancy (HALE) at birth
Definition Average number of years that a person can expect to live in “full health” by taking into account years lived in less than full health due to disease and/or injury.
Rationale Substantial resources are devoted to reducing the incidence, duration and severity of major diseases that cause morbidity but not mortality and to reducing their impact on people’s lives. It is important to capture both fatal and non-fatal health outcomes in a summary measure of average levels of population health. Healthy life expectancy (HALE) at birth adds up expectation of life for different health states, adjusted for severity distribution making it sensitive to changes over time or differences between countries in the severity distribution of health states.
Metadata http://apps.who.int/gho/indicatorregistry/App_Main/view_indicator.aspx?iid=66
Life expectancy at birth (years)
Definition The average number of years that a newborn could expect to live, if he or she were to pass through life ex-posed to the sex- and age-specific death rates prevailing at the time of his or her birth, for a specific year, in a given country, territory, or geographic area.
Rationale Life expectancy at birth reflects the overall mortality level of a population. It summarizes the mortality pattern that prevails across all age groups - children and adolescents, adults and the elderly.
Metadata http://apps.who.int/gho/indicatorregistry/App_Main/view_indicator.aspx?iid=65
Life expectancy at age 60 (years)
Definition The average number of years that a person of 60 years old could expect to live, if he or she were to pass through life exposed to the sex- and age-specific death rates prevailing at the time of his or her 60 years, for a specific year, in a given country, territory, or geographic area.
Rationale Life expectancy at age 60 reflects the overall mortality level of a population over 60 years. It summarizes the mortality pattern that prevails across all age groups above 60 years.
Metadata http://apps.who.int/gho/indicatorregistry/App_Main/view_indicator.aspx?iid=2977
2.2. Mortalityhttp://www.aho.afro.who.int/en/data-statistics/mortality
Adult mortality rate (probability of dying between 15 and 60 years per 1000 population)
Definition Probability that a 15 year old person will die before reaching his/her 60th birthday. The probability of dying between the ages of 15 and 60 years (per 1000 population) per year among a hypothetical cohort of 100 000 people that would experience the age-specific mortality rate of the reporting year.
Rationale Disease burden from non-communicable diseases among adults - the most economically productive age span - is rapidly increasing in developing countries due to ageing and health transitions. Therefore, the level of adult mortality is becoming an important indicator for the comprehensive assessment of the mortality pattern in a population.
Metadata http://apps.who.int/gho/indicatorregistry/App_Main/view_indicator.aspx?iid=64
Age-standardized mortality rate (per 100 000 population)
Definition The age-standardized mortality rate is a weighted average of the age-specific mortality rates per 100 000 persons, where the weights are the proportions of persons in the corresponding age groups of the WHO standard population.
Rationale The numbers of deaths per 100 000 population are influenced by the age distribution of the population. Two populations with the same age-specific mortality rates for a particular cause of death will have different overall death rates if the age distributions of their populations are different. Age-standardized mortality rates adjust for differences in the age distribution of the population by applying the observed age-specific mortality rates for each population to a standard population.
Metadata http://apps.who.int/gho/indicatorregistry/App_Main/view_indicator.aspx?iid=78
Explanatory notes
168
Estimated road traffic death rate (per 100 000 population)
Definition Estimated road traffic fatal injury deaths per 100 000 population.
Metadata http://apps.who.int/gho/indicatorregistry/App_Main/view_indicator.aspx?iid=198
Infant mortality rate (probability of dying between birth and age 1 per 1000 live births)
Definition Infant mortality rate is the probability of a child born in a specific year or period dying before reaching the age of one, if subject to age-specific mortality rates of that period. Infant mortality rate is strictly speaking not a rate (i.e. the number of deaths divided by the number of population at risk during a certain period of time) but a probability of death derived from a life table and expressed as rate per 1000 live births.
Rationale Infant mortality represents an important component of under-five mortality. Like under-five mortality, infant mortality rates measure child survival. They also reflect the social, economic and environmental conditions in which children (and others in society) live, including their health care. Since data on the incidence and prevalence of diseases (morbidity data) frequently are unavailable, mortality rates are often used to identify vulnerable populations. Infant mortality rate is an MDG indicator.
Metadata http://apps.who.int/gho/indicatorregistry/App_Main/view_indicator.aspx?iid=1
Maternal mortality ratio (per 100 000 live births)
Definition The maternal mortality ratio (MMR) is the annual number of female deaths from any cause related to or aggravated by pregnancy or its management (excluding accidental or incidental causes) during pregnan-cy and childbirth or within 42 days of termination of pregnancy, irrespective of the duration and site of the pregnancy, per 100,000 live births, for a specified year.
Rationale Complications during pregnancy, childbirth and post-partum are a leading cause of death and disability among women of reproductive age in developing countries. The maternal mortality ratio represents the risk associated with each pregnancy, i.e. the obstetric risk. It is also a Millennium Development Goal Indica-tor for monitoring Goal 5, improving maternal health.
The indicator monitors deaths related to pregnancy and childbirth. It reflects the capacity of the health systems to provide effective health care in preventing and addressing the complications occurring during pregnancy and childbirth
Metadata http://apps.who.int/gho/indicatorregistry/App_Main/view_indicator.aspx?iid=26
Under-five mortality rate (probability of dying by age 5 per 1000 live births)
Definition The probability of a child born in a specific year or period dying before reaching the age of five, if subject to age-specific mortality rates of that period. Under-five mortality rate as defined here is strictly speaking not a rate (i.e. the number of deaths divided by the number of population at risk during a certain period of time) but a probability of death derived from a life table and expressed as rate per 1000 live births.
Rationale Under-five mortality rate measures child survival. It also reflects the social, economic and environmental conditions in which children (and others in society) live, including their health care. Because data on the incidences and prevalence of diseases (morbidity data) frequently are unavailable, mortality rates are of-ten used to identify vulnerable populations. Under-five mortality rate is an MDG indicator (see 3.1. MDG-4: Reduce child mortality).
Metadata http://apps.who.int/gho/indicatorregistry/App_Main/view_indicator.aspx?iid=7
2.3. Burden of disease
http://www.aho.afro.who.int/en/data-statistics/burden-disease
Distribution of years of life lost by major cause group (%)
Definition Distribution of years of life lost by 3 major cause group (communicable, maternal, neonatal and nutritional conditions; noncommunicable diseases; injuries), expressed as percentage of total of years of life lost.
Rationale Years of life lost (YLLs) take into account the age at which deaths occur by giving greater weight to deaths occurring at younger ages and lower weight to deaths occurring at older ages. The YLLs (percentage of total) indicator measures the YLLs due to a particular cause of death as a proportion of the total YLLs lost due to premature mortality in the population.
Metadata http://apps.who.int/gho/indicatorregistry/App_Main/view_indicator.aspx?iid=90
169

3. Progress on the MDGs
3.0. MDG progress status in the African Region
3.1. MDG-4: Reduce child mortality
http://www.aho.afro.who.int/en/data-statistics/mdg-4-reduce-child-mortality
Measles (MCV) immunization coverage among 1-year-olds (%)
See under 5.4. Immunization and vaccines
Under-five mortality rate (probability of dying by age 5 per 1000 live births)
See under 2.2. Mortality
3.2. MDG-5: Improve maternal health
http://www.aho.afro.who.int/en/data-statistics/mdg-5-improve-maternal-health
Maternal mortality ratio (per 100 000 live births)
See under 5.6. Maternal and newborn health
Births attended par skilled health personnel (%)
See 5.6. Maternal and newborn health
Antenatal care coverage – at least one visit (%)
Definition The percentage of women aged 15-49 with a live birth in a given time period that received antenatal care provided by skilled health personnel (doctors, nurses, or midwives) at least once during pregnancy. Nu-merator: The number of women aged 15-49 with a live birth in a given time period that received antenatal care provided by skilled health personnel (doctors, nurses or midwives) at least once during pregnancy. Denominator: Total number of women aged 15-49 with a live birth in the same period.
Metadata http://www.aho.afro.who.int/en/data-statistics/antenatal-care-coverage-least-one-visit http://apps.who.int/gho/indicatorregistry/App_Main/view_indicator.aspx?iid=81
Unmet need for family planning (%)
See 5.7. Gender and women’s health
3.3. MDG-6: Combat HIV/AIDS, malaria and other diseases
http://www.aho.afro.who.int/en/data-statistics/mdg-6-combat-hivaids-malaria-and-other-diseases
Estimated incidence of tuberculosis (per 100 000 population)
See 5.2. Tuberculosis
Deaths due to malaria (per 100 000 population) - Number of reported malaria deaths
Definition The sum deaths from malaria from confirmed and probable cases.
Metadata http://apps.who.int/gho/indicatorregistry/App_Main/view_indicator.aspx?iid=2967
HIV prevalence among adults aged 15-49 years (%)
See 5.1. HIV/AIDS
3.4. MDG-7: Ensure environmental sustainability
http://www.aho.afro.who.int/en/data-statistics/mdg-7-ensure-environment-sustainability
Population using improved drinking-water sources (%)
Metadata http://www.aho.afro.who.int/en/data-statistics/population-using-improved-drinking-water-sources
Population using improved sanitation facilities
Metadata http://www.aho.afro.who.int/fr/data-statistics/population-using-improved-sanitation-facilities
See under 6.2. The physical environment
3.5. MDG-1: Eradicate extreme poverty and hunger
http://www.aho.afro.who.int/en/data-statistics/mdg-1-eradicate-extreme-poverty-and-hunger
Children aged <5 years underweight
See under 5.5. Child and adolescent health
170
3.6. MDG-2: Achieve universal primary education
http://www.aho.afro.who.int/en/data-statistics/mdg-2-achieve-universal-primary-education
Net primary school enrolment rate (%)
Metadata http://www.aho.afro.who.int/en/data-statistics/net-primary-school-enrolment-rate
3.7. MDG-3: Promote gender equality and empower womenhttp://www.aho.afro.who.int/en/data-statistics/mdg-3-promote-gender-equality-and-empower-women
Gender parity index in primary education
Definition Ratio of girls to boys (gender parity index) in primary, secondary and tertiary education is the ratio of the number of female students enrolled at primary, secondary and tertiary levels of education to the number of male students in each level. To standardise the effects of the population structure of the appropriate age groups, the Gender Parity Index (GPI) of the Gross Enrolment Ratio (GER) for each level of education is used. The GER is the number of pupils enrolled in a given level of education, regardless of age, expressed as a percentage of the population in the theoretical age group for the same level of education.
Rationale To calculate the Gross Enrolment Ratio one must first determine the population of official school age for each level of education by reference to the theoretical starting ages and durations of the International Standard Classification of Education (ISCED97) Level 1 (primary education) and Levels 2 and 3 (second-ary education) as reported by the country. The population of the official age for tertiary education is the 5-year age group immediately following the end of secondary education.
Then, the number of pupils or students enrolled in each level of education is divided by the population of official school age for that level of education, and the result is multiplied by 100. The Gross Enrolment Ratios for males and females are calculated separately.
The Gender Parity Index (GPI) is then calculated by dividing the female Gross Enrolment Ratio by the male Gross Enrolment Ratio for the given level of education.
This method requires information on the structure of education (i.e. theoretical entrance age and duration of ISCED97 Level 1 and Levels 2 and 3), enrolments in each level of education and the populations of the age-groups corresponding to the given levels of education. Separate figures for males and females are required.
Metadata http://mdgs.un.org/unsd/mdg/Metadata.aspx?IndicatorId=9
3.8. MDG-8: Develop a global partnership for development
In cooperation with pharmaceutical companies, provide access to affordable essential drugs
Definition Median percent availability of selected generic medicines in a sample of health facilities.
Metadata http://apps.who.int/gho/indicatorregistry/App_Main/view_indicator.aspx?iid=10 http://www.aho.afro.who.int/en/data-statistics/mdg-8-develop-global-partnership-development
Official development assistance (ODA) received as percentage of GDP
Metadata http://www.aho.afro.who.int/en/data-statistics/official-development-assistance-oda-received-percent-age-gdp
4. The health system4.1. Health system outcomes
http://www.aho.afro.who.int/en/data-statistics/health-system-outcomes
Antenatal care coverage – at least one visit (in the two years preceding the survey) (%)
Definition The percentage of women aged 15-49 with a live birth in a given time period that received antenatal care provided by skilled health personnel (doctors, nurses, or midwives) at least once during pregnancy. Nu-merator: the number of women aged 15-49 with a live birth in a given time period that received antenatal care provided by skilled health personnel (doctors, nurses or midwives) at least once during pregnancy. Denominator: total number of women aged 15-49 with a live birth in the same period.
Metadata http://www.aho.afro.who.int/en/data-statistics/antenatal-care-coverage-least-one-visit-two-years-preced-ing-survey
Antenatal care coverage – at least one visit (in the three years preceding the survey) (%)
Definition The percentage of women aged 15-49 with a live birth in a given time period that received antenatal care provided by skilled health personnel (doctors, nurses, or midwives) at least once during pregnancy. Nu-merator: The number of women aged 15-49 with a live birth in a given time period that received antenatal care provided by skilled health personnel (doctors, nurses or midwives) at least once during pregnancy. Denominator: Total number of women aged 15-49 with a live birth in the same period.
Metadata http://www.aho.afro.who.int/en/data-statistics/antenatal-care-coverage-least-one-visit-three-years-prece-ding-survey
171

Antenatal care coverage – at least one visit (in the five years preceding the survey) (%)
Definition The percentage of women aged 15-49 with a live birth in a given time period that received antenatal care provided by skilled health personnel (doctors, nurses, or midwives) at least once during pregnancy. Nu-merator: The number of women aged 15-49 with a live birth in a given time period that received antenatal care provided by skilled health personnel (doctors, nurses or midwives) at least once during pregnancy. Denominator: Total number of women aged 15-49 with a live birth in the same period.
Metadata http://www.aho.afro.who.int/en/data-statistics/antenatal-care-coverage-least-one-visit-five-years-preced-ing-survey-0
Antenatal care coverage – at least four visits (in the two years preceding the survey) (%)
Definition Percentage of women aged 15–49 with a live birth in a given time period, attended at least four times during pregnancy by any provider (skilled or unskilled) for reasons related to the pregnancy. Numerator: Number of women aged 15–49 with a live birth in a given time period, attended at least four times during pregnancy by any provider (skilled or unskilled) for reasons related to the pregnancy – only the last live-born child is considered. Denominator: Total number of women aged 15–49 who had a live birth occurring in the same period.
Metadata http://www.aho.afro.who.int/en/data-statistics/antenatal-care-coverage-least-four-visits-two-years-prece-ding-survey
Antenatal care coverage – at least four visits (in the three years preceding the survey) (%)
Definition Percentage of women aged 15–49 with a live birth in a given time period, attended at least four times during pregnancy by any provider (skilled or unskilled) for reasons related to the pregnancy. Numerator: Number of women aged 15–49 with a live birth in a given time period, attended at least four times during pregnancy by any provider (skilled or unskilled) for reasons related to the pregnancy – only the last live-born child is considered. Denominator: Total number of women aged 15–49 who had a live birth occurring in the same period.
Metadata http://www.aho.afro.who.int/en/data-statistics/antenatal-care-coverage-least-four-visits-three-years-preceding-survey
Antenatal care coverage - at least four visits (in the five years preceding the survey) (%)
Definition Percentage of women aged 15–49 with a live birth in a given time period, attended at least four times during pregnancy by any provider (skilled or unskilled) for reasons related to the pregnancy. Numerator: Number of women aged 15–49 with a live birth in a given time period, attended at least four times during pregnancy by any provider (skilled or unskilled) for reasons related to the pregnancy – only the last live-born child is considered. Denominator: Total number of women aged 15–49 who had a live birth occurring in the same period.
Metadata http://www.aho.afro.who.int/en/data-statistics/antenatal-care-coverage-least-four-visits-five-years-prece-ding-survey
Births attended by skilled health personnel (in the two years preceding the survey) (%)
Definition Percentage of live births attended during delivery by skilled health personnel. Skilled health personnel includes doctors, nurses, midwives and other medically trained personnel as defined according to each country. This is in line with the definition used by the Countdown to 2015 Collaboration, DHS and MICS. Numerator: Number of live births to women aged 15-49 years attended during delivery by skilled health personnel in the period prior to the survey. Denominator: Total number of live births to women aged 15-49 years occurring in the period prior to the survey.
Metadata http://www.aho.afro.who.int/en/data-statistics/births-attended-skilled-health-personnel-two-years-preceding-survey
Births attended by skilled health personnel (in the three years preceding the survey) (%)
Definition Percentage of live births attended during delivery by skilled health personnel. Skilled health personnel includes doctors, nurses, midwives and other medically trained personnel as defined according to each country. This is in line with the definition used by the Countdown to 2015 Collaboration, DHS and MICS. Numerator: Number of live births to women aged 15-49 years attended during delivery by skilled health personnel in the period prior to the survey. Denominator: Total number of live births to women aged 15-49 years occurring in the period prior to the survey.
Metadata http://www.aho.afro.who.int/en/data-statistics/births-attended-skilled-health-personnel-three-years-preceding-survey
Births attended by skilled health personnel (in the five years preceding the survey) (%)
Definition Percentage of live births attended during delivery by skilled health personnel. Skilled health personnel includes doctors, nurses, midwives and other medically trained personnel as defined according to each country. This is in line with the definition used by the Countdown to 2015 Collaboration, DHS and MICS. Numerator: Number of live births to women aged 15-49 years attended during delivery by skilled health personnel in the period prior to the survey. Denominator: Total number of live births to women aged 15-49 years occurring in the period prior to the survey.
Metadata http://www.aho.afro.who.int/en/data-statistics/births-attended-skilled-health-personnel-five-years-prece-ding-survey
172
Family planning needs satisfied (%)
Definition Percentage of women aged 15–49 years, married or in union, who are currently using any method of contraception, among those in need of contraception. Women in need of contraception include those who are fecund but report wanting to space their next birth or stop childbearing altogether. Numerator: Number of women aged 15–49 that are fecund and are married or in union and need contraception, who use any kind of contraceptive (modern or traditional). Denominator: Total number of women aged 15–49 that are fecund and are married / have a partner and need contraception.
Metadata http://www.aho.afro.who.int/en/data-statistics/family-planning-needs-satisfied
Diphtheria tetanus toxoid and pertussis (DTP3) immunization coverage among 1-year-olds (%)
See 5.4. Immunization and vaccines
Measles (MCV) immunization coverage among 1-year-olds (%)
See 5.4. Immunization and vaccines
4.2. Leadership and governance
4.3. Partnership for health development
4.4. Health information
http://www.aho.afro.who.int/en/data-statistics/health-information-evidence-and-knowledge
Civil registration at births (%)
Definition Estimated level of coverage of birth registration
Rationale Complete coverage, accuracy and timeliness of civil registration are essential for quality vital statistics.
Metadata http://www.aho.afro.who.int/en/data-statistics/civil-registration-births
Civil registration coverage of cause-of-death (%)
Definition Estimated level of coverage of deaths that are registered with cause-of-death information.
Metadata http://www.aho.afro.who.int/en/data-statistics/civil-registration-coverage-cause-death
4.5. Research
4.6. Health financing
http://www.aho.afro.who.int/en/data-statistics/health-financing
External resources for health as a percentage of total expenditure on health
Definition External resources for health expressed as a percentage of total expenditure on health.
Rationale This is a core indicator of health financing systems. Most indicators presented in NHA involve a measure-ment at the level of purchaser/payer of health services. This is, however, an indicator which refers to the origin of the resources used to purchase health services. It is the only information about the sources of funds provided in these tables. The other indicators - GGHE, PvtHE etc. - are financing agents, the entities where the use of the funds are controlled. Some of these external sources will be channeled through the government’s budget, some through insurance agencies, some through the private or NGO sectors. As such, these funds cannot simply be added to those reported in the earlier breakdowns. In the special case where external agencies act as domestic NGOs in providing or purchasing health care in a recipient coun-try, they would be included as financing agents as well as a source. We provide here only the source level measurement. The analysis of financing sources contributes to identify the distribution of the financing burden of health services. This indicator contributes to assess sustainability of financing.
Metadata http://www.aho.afro.who.int/en/data-statistics/external-resources-health-percentage-total-expendi-ture-health#overlay-context=en/health-financing
General government expenditure on health as a percentage of total expenditure on health
Definition Level of general government expenditure on health (GGHE) expressed as a percentage of total expendi-ture on health (THE)
Rationale This is a core indicator of health financing systems. This indicator contributes to understanding the relative weight of public entities in total expenditure on health. It includes not just the resources chan-neled through government budgets to providers of health services but also the expenditure on health by parastatals, extrabudgetary entities and notably the compulsory health insurance payments. It refers to resources collected and pooled by the above public agencies regardless of the source, so includes any donor (external) funding passing through these agencies.
Metadata http://www.aho.afro.who.int/en/data-statistics/general-government-expenditure-health-percentage-to-tal-expenditure-health#overlay-context=en/data-statistics/general-government-expenditure-health-per-centage-total-expenditure-health
173
General government expenditure on health as a percentage of total government expenditure
Definition Level of general government expenditure on health (GGHE) expressed as a percentage of total govern-ment expenditure.
Rationale This is a core indicator of health financing systems. This indicator contributes to understand the weight of public spending on health within the total value of public sector operations. It includes not just the resources channelled through government budgets but also the expenditure on health by parastatals, extrabudgetary entities and notably the compulsory health insurance. It refers to resources collected and pooled by public agencies including all the revenue modalities.
Metadata http://www.aho.afro.who.int/en/data-statistics/general-government-expenditure-health-percentage-to-tal-government-expenditure
Per capita government expenditure on health (PPP int. $)
Definition Per capita general government expenditure on health (GGHE) expressed in PPP international dollar
Rationale This is a core indicator of health financing systems. This indicator contributes to understand the relative level of public spending on health to the beneficiary population, expressed in international dollars to facil-itate international comparisons. It includes not just the resources channeled through government budg-ets but also the expenditure on health by parastatals, extrabudgetary entities and notably the compulsory health insurance. It refers to resources collected and polled by public agencies including all the revenue modalities.
Metadata http://www.aho.afro.who.int/en/data-statistics/capita-government-expenditure-health-ppp-int
Per capita government expenditure on health at average exchange rate (US$)
Definition Per capita general government expenditure on health (GGHE) expressed at average exchange rate for that year in US dollar. Current prices.
Rationale This is a core indicator of health financing systems. This indicator contributes to understand the relative level of public spending on health to the beneficiary population, expressed in US$ to facilitate internation-al comparisons. It includes not just the resources channeled through government budgets but also the ex-penditure on health by parastatals, extrabudgetary entities and notably the compulsory health insurance. It refers to resources collected and pooled by public agencies including all the revenue modalities.
Metadata http://www.aho.afro.who.int/en/data-statistics/capita-government-expenditure-health-average-ex-change-rate-us
Per capita total expenditure on health (PPP int. $)
Definition Per capita total expenditure on health (THE) expressed in PPP international dollar.
Rationale This is a core indicator of health financing systems. This indicator contributes to understand the total expenditure on health relative to the beneficiary population, expressed in Purchasing Power Parities (PPP) to facilitate international comparisons.
Metadata http://www.aho.afro.who.int/en/data-statistics/capita-total-expenditure-health-ppp-int
Per capita total expenditure on health at average exchange rate (US$)
Definition Per capita total expenditure on health (THE) expressed at average exchange rate for that year in US$. Cur-rent prices.
Rationale This is a core indicator of health financing systems. This indicator contributes to understand the total expenditure on health relative to the beneficiary population, expressed in USD to facilitate international comparisons.
Metadata http://www.aho.afro.who.int/en/data-statistics/capita-total-expenditure-health-average-exchange-rate-us
Private prepaid plans as a percentage of private expenditure on health
Definition Level of private prepaid plans expressed as a percentage of private expenditure on health.
Rationale This is a core indicator of health financing systems. This indicator contributes to understanding the relative weight of voluntary health insurance payments in total health expenditure.
Metadata http://www.aho.afro.who.int/en/data-statistics/private-prepaid-plans-percentage-private-expendi-ture-health
Social security expenditure on health as a percentage of general government expenditure on
health
Definition Level of social security funds expressed as a percentage of general government expenditure on health.
Rationale This is a core indicator of health financing systems. This indicator contributes to understanding the relative weight of prepaid pooled schemes in GGHE. This indicator refers to the health expenditures by govern-ment social security schemes and other schemes of compulsory health insurance. Any donor (external) funds channeled through these institutions are included.
Metadata http://www.aho.afro.who.int/en/data-statistics/social-security-expenditure-health-percentage-gener-al-government-expenditure-health
174
Total expenditure on health as a percentage of gross domestic product
Definition Level of total expenditure on health (THE) expressed as a percentage of gross domestic product (GDP).
Rationale This is a core indicator of health financing systems. It provides information on the level of resources chan-neled to health relative to a country’s wealth.
Metadata http://www.aho.afro.who.int/en/data-statistics/total-expenditure-health-percentage-gross-domes-tic-product
4.7. Service delivery
http://www.aho.afro.who.int/en/data-statistics/service-delivery
Treatment success rate for new pulmonary smear-positive tuberculosis cases
Definition The proportion of new smear-positive TB cases registered under a national TB control programme in a given year that successfully completed treatment, whether with or without bacteriological evidence of success (“cured” or “treatment completed” respectively). At the end of treatment, each patient is assigned one of the following six mutually exclusive treatment outcomes: cured; completed; died; failed; defaulted; and transferred out with outcome unknown. The proportions of cases assigned to these outcomes, plus any additional cases registered for treatment but not assigned to an outcome, add up to 100% of cases registered.
Rationale Treatment success is an indicator of the performance of national TB control programmes. In addition to the obvious benefit to individual patients, successful treatment of infectious cases of TB is essential to prevent the spread of the infection. Detecting and successfully treating a large proportion of TB cases should have an immediate impact on TB prevalence and mortality. By reducing transmission, successfully treating the majority of cases will also affect, with some delay, the incidence of disease. Indicator 6.10 of the Millenium development Goal is the “proportion of tuberculosis cases detected and cured under DOTS”. The Stop TB Partnership’s Global Plan to Stop TB 2011 - 2015 has set a target of smear-positive treatment success rate of 90%.
Metadata http://www.aho.afro.who.int/en/data-statistics/treatment-success-rate-new-pulmonary-smear-posi-tive-tuberculosis-cases
Treatment success rate for new pulmonary smear-negative and extrapulmonary tuberculosis cases
Definition The proportion of new smear-negative and extrapulmonary (or smear unknown/not done) TB cases registered under a national TB control programme in a given year that successfully completed treatment (without bacteriological evidence of success, ie “treatment completed”). At the end of treatment, each patient is assigned one of the following five mutually exclusive treatment outcomes: completed; died; failed; defaulted; and transferred out with outcome unknown. The proportions of cases assigned to these outcomes, plus any additional cases registered for treatment but not assigned to an outcome, add up to 100% of cases registered.
Rationale Treatment success is an indicator of the performance of national TB control programmes. In addition to the obvious benefit to individual patients, successful treatment of infectious cases of TB is essential to pre-vent the spread of the infection. Detecting and successfully treating a large proportion of TB cases should have an immediate impact on TB prevalence and mortality. By reducing transmission, successfully treating the majority of cases will also affect, with some delay, the incidence of disease.
Metadata http://www.aho.afro.who.int/en/data-statistics/treatment-success-rate-new-pulmonary-smear-nega-tive-and-extrapulmonary-tuberculosis
Treatment success rate for retreatment tuberculosis cases
Definition The proportion of cases with previous TB treatment history registered under a national TB control pro-gramme in a given year that successfully completed treatment, whether with or without bacteriological evidence of success (“cured” or “treatment completed” respectively). At the end of treatment, each patient is assigned one of the following six mutually exclusive treatment outcomes: cured; completed; died; failed; defaulted; and transferred out with outcome unknown. The proportions of cases assigned to these outcomes, plus any additional cases registered for treatment but not assigned to an outcome, add up to 100% of cases registered.
Rationale Treatment success is an indicator of the performance of national TB control programmes. In addition to the obvious benefit to individual patients, successful treatment of infectious cases of TB is essential to pre-vent the spread of the infection. Detecting and successfully treating a large proportion of TB cases should have an immediate impact on TB prevalence and mortality. By reducing transmission, successfully treating the majority of cases will also affect, with some delay, the incidence of disease.
Metadata http://www.aho.afro.who.int/en/data-statistics/treatment-success-rate-retreatment-tuberculosis-cases
175
4.8. Health workforce
http://www.aho.afro.who.int/en/data-statistics/health-workforce
Community and traditional health workers density (per 1000 population)
Definition Number of community and traditional health workers per 1 000 population.
Rationale Preparing the health workforce to work towards the attainment of a country’s health objectives represents one of the most important challenges for its health system. Methodologically, there are no gold standards for assessing the sufficiency of the health workforce to address the health care needs of a given popula-tion. It has been estimated however, in the World Health Report 2006, that countries with fewer than 23 physicians, nurses and midwives per 10 000 population generally fail to achieve adequate coverage rates for selected primary health care interventions as prioritized by the Millennium Development Goals frame-work.
Metadata http://www.aho.afro.who.int/en/data-statistics/community-and-traditional-health-workers-densi-ty-1000-population
Dentistry personnel density (per 1000 population)
Definition Number of dentistry personnel per 1 000 population.
Rationale Preparing the health workforce to work towards the attainment of a country’s health objectives represents one of the most important challenges for its health system. Methodologically, there are no gold standards for assessing the sufficiency of the health workforce to address the health care needs of a given popula-tion. It has been estimated however, in the World Health Report 2006, that countries with fewer than 23 physicians, nurses and midwives per 10 000 population generally fail to achieve adequate coverage rates for selected primary health care interventions as prioritized by the Millennium Development Goals frame-work.
Metadata http://www.aho.afro.who.int/en/data-statistics/dentistry-personnel-density-1000-population
Environmental and public health workers density (per 1000 population)
Definition Number of environment and public health workers per 1 000 population.
Rationale Preparing the health workforce to work towards the attainment of a country’s health objectives represents one of the most important challenges for its health system. Methodologically, there are no gold standards for assessing the sufficiency of the health workforce to address the health care needs of a given popula-tion. It has been estimated however, in the World Health Report 2006, that countries with fewer than 23 physicians, nurses and midwives per 10 000 population generally fail to achieve adequate coverage rates for selected primary health care interventions as prioritized by the Millennium Development Goals frame-work.
Metadata http://www.aho.afro.who.int/en/data-statistics/environmental-and-public-health-workers-densi-ty-1000-population
Laboratory health workers density (per 1 000 population)
Definition Number of laboratory health workers per 1 000 population.
Rationale Preparing the health workforce to work towards the attainment of a country’s health objectives represents one of the most important challenges for its health system. Methodologically, there are no gold standards for assessing the sufficiency of the health workforce to address the health care needs of a given popula-tion. It has been estimated however, in the World Health Report 2006, that countries with fewer than 23 physicians, nurses and midwives per 10 000 population generally fail to achieve adequate coverage rates for selected primary health care interventions as prioritized by the Millennium Development Goals frame-work.
Metadata http://www.aho.afro.who.int/en/data-statistics/nursing-and-midwifery-personnel-density-1000-population
Nursing and midwifery personnel density (per 1000 population)
Definition Number of nursing and midwifery personnel per 1 000 population.
Rationale Preparing the health workforce to work towards the attainment of a country’s health objectives represents one of the most important challenges for its health system. Methodologically, there are no gold standards for assessing the sufficiency of the health workforce to address the health care needs of a given popula-tion. It has been estimated however, in the World Health Report 2006, that countries with fewer than 23 physicians, nurses and midwives per 10 000 population generally fail to achieve adequate coverage rates for selected primary health care interventions as prioritized by the Millennium Development Goals frame-work.
Metadata http://www.aho.afro.who.int/en/data-statistics/nursing-and-midwifery-personnel-density-1000-popula-tion
176
Other health workers density (per 1000 population)
Definition Number of other health service providers (excepting physicians, nursing and midwifery personnel, dentist-ry personnel and community health workers) per 1 000 population.
Rationale Preparing the health workforce to work towards the attainment of a country’s health objectives represents one of the most important challenges for its health system. Methodologically, there are no gold standards for assessing the sufficiency of the health workforce to address the health care needs of a given population. It has been estimated however, in the World Health Report 2006, that countries with fewer than 23 physicians, nurses and midwives per 10 000 population generally fail to achieve adequate coverage rates for selected primary health care interventions as prioritized by the Millennium Development Goals framework.
Metadata http://www.aho.afro.who.int/en/data-statistics/other-health-workers-density-1000-population
Pharmaceutical personnel density (per 1000 population)
Definition Number of pharmaceutical personnel per 1 000 population
Rationale Preparing the health workforce to work towards the attainment of a country’s health objectives represents one of the most important challenges for its health system. Methodologically, there are no gold standards for assessing the sufficiency of the health workforce to address the health care needs of a given population. It has been estimated however, in the World Health Report 2006, that countries with fewer than 23 physicians, nurses and midwives per 10 000 population generally fail to achieve adequate coverage rates for selected primary health care interventions as prioritized by the Millennium Development Goals framework.
Metadata http://www.aho.afro.who.int/en/data-statistics/pharmaceutical-personnel-density-1000-population
Physicians density (per 1000 population)
Definition Number of medical doctors (physicians), including generalist and specialist medical practitioners, per 1 000 population.
Rationale Preparing the health workforce to work towards the attainment of a country’s health objectives represents one of the most important challenges for its health system. Methodologically, there are no gold standards for assessing the sufficiency of the health workforce to address the health care needs of a given population. It has been estimated however, in the World Health Report 2006, that countries with fewer than 23 physicians, nurses and midwives per 10 000 population generally fail to achieve adequate coverage rates for selected primary health care interventions as prioritized by the Millennium Development Goals framework.
Metadata http://www.aho.afro.who.int/en/data-statistics/physicians-density-1000-population
4.9. Medical products, vaccines, infrastructures and equipment
http://www.aho.afro.who.int/en/data-statistics/medical-products-vaccines-infrastructures-and-
equipment
Total density per million population: Computed tomography units
Definition Computed tomography (CT) scan units from the public and private sectors, per 1 000 000 population.
Metadata http://www.aho.afro.who.int/en/data-statistics/total-density-million-population-computed-tomogra-phy-units
Total density per 100 000 population: District/rural hospitals
Definition Number of district/rural hospitals from the public and private sectors, per 100,000 population.
Metadata http://www.aho.afro.who.int/en/data-statistics/total-density-100-000-population-districtrural-hospitals
Total density per million population: Gamma camera or Nuclear medicine
Definition Nuclear medicine units from the public and private sectors, per 1 000 000 population.
Metadata http://www.aho.afro.who.int/en/data-statistics/total-density-million-population-gamma-camera-or-nuclear-medicine
Total density per 100 000 population: Health centres
Definition Number of health centres from the public and private sectors, per 100,000 population.
Metadata http://www.aho.afro.who.int/en/data-statistics/total-density-100-000-population-health-centres
Total density per 100 000 population: Health posts
Definition Number of health posts from the public and private sectors, per 100,000 population. Health posts are ei-ther community centres or health environments with a very limited number of beds with limited curative and preventive care resources normally assisted by health workers or nurses.
Metadata http://www.aho.afro.who.int/en/data-statistics/total-density-100-000-population-health-posts
Hospital beds (per 10 000 population)
Definition The number of hospital beds available per every 10 000 inhabitants in a population.
Metadata http://www.aho.afro.who.int/en/data-statistics/hospital-beds-10-000-population
177
Total density per million population: Linear Accelerator
Definition Number of linear accelerators units from the public and private sectors, per 1 000 000 population.Metadata http://www.aho.afro.who.int/en/data-statistics/total-density-million-population-linear-accelerator
Total density per million population: Magnetic Resonance Imaging
Definition Number of Magnetic Resonance units from the public and private sectors, per 1 000 000 population.Metadata http://www.aho.afro.who.int/en/data-statistics/total-density-million-population-magnetic-resonance-im-
aging
Total density per million females aged from 50 to 69 years old: Mammography units
Definition Number of mammographs units from the public and private sectors, per million population of females aged between 50 and 69 years old .
Metadata http://www.aho.afro.who.int/en/data-statistics/total-density-million-females-aged-50-69-years-old-mam-mography-units
Median availability of selected generic medicines (%)
Definition Median percent availability of selected generic medicines in a sample of health facilities.Rationale Access to treatment is heavily dependent on the availability of affordable medicines. A regular, sustainable
supply of essential medicines is required to avoid medicine shortages that can cause avoidable suffering and death. This indicator is part of a series of 9 indicators proposed by WHO to measure MDG Target 8.E: In coopera-tion with pharmaceutical companies, provide access to affordable essential drugs in developing countries.
Metadata http://www.aho.afro.who.int/en/data-statistics/median-availability-selected-generic-medicines
Median consumer price ratio of selected generic medicines
Definition Median consumer price ratio (ratio of median local unit price to Management Sciences for Health interna-tional reference price) of selected originator medicines.
Rationale Medicines account for 20-60% of health spending in developing and transitional countries. Furthermore, up to 90% of the population in developing countries purchase medicines through out-of-pocket pay-ments, making medicines the largest family expenditure item after food. As a result, medicines are unaf-fordable for large sections of the global population and are a major burden on government budgets. This indicator is part of a series of 9 indicators proposed by WHO to measure MDG Target 8.E: In cooperation with pharmaceutical companies, provide access to affordable essential drugs in developing countries.
Metadata http://www.aho.afro.who.int/en/data-statistics/median-consumer-price-ratio-selected-generic-medicines
Total density per 100 000 population: Provincial hospitals
Definition Number of provincial hospitals from the public and private sectors, per 100,000 population.Metadata http://www.aho.afro.who.int/en/data-statistics/total-density-100-000-population-provincial-hospitals
Total density per million population: Radiotherapy units
Definition Number of radiotherapy units, including Linear Accelerators and Cobalt-60 from the public and private sectors, per 1 000 000 population.
Rationale In 2010, WHO launched a Baseline country survey on medical devices that allowed to identify the status of high cost medical devices in the Member States, including radiotherapy equipment, both linear accelera-tors and Cobalt-60. Cancer is a leading cause of death worldwide, killing nearly eight million people a year. Yet about one-third of these lives could be saved if cancer is detected and treated early. Three-quarters of cancer deaths occur in developing countries where the resources needed to prevent, diagnose and treat cancer are severely limited or nonexistent. Consequently, it is important to know the gaps in availability in order to find programmes to improve accessibility. As a result, WHO and the International Atomic Energy Agency (IAEA) have created a Joint Programme on Cancer Control focusing on the needs of radiotherapy equipment in developing countries.
Metadata http://www.aho.afro.who.int/en/data-statistics/total-density-million-population-computed-tomogra-phy-units
Total density per million population: Telecobalt Unit
Definition Number of telecobalt (Cobalt-60) units from the public and private sectors, per 1 000 000 population.Metadata http://www.aho.afro.who.int/en/data-statistics/total-density-million-population-telecobalt-unit
4.10. Universal coverage
http://www.aho.afro.who.int/en/data-statistics/universal-coverage
Out-of-pocket expenditure as a percentage of private expenditure on health
Definition Level of out-of-pocket expenditure expressed as a percentage of private expenditure on health
Rationale This is a core indicator of health financing systems. t contributes to understanding the relative weight of direct payments by households in total health expenditures. High out-of-pocket payments are strongly associated with catastrophic and impoverishing spending. Thus it represents a key support for equity and planning processes.
178
Private expenditure on health as a percentage of total expenditure on health
Definition Definition Level of private expenditure on health expressed as a percentage of total expenditure on health.
Rationale This is a core indicator of health financing systems. This indicator contributes to understanding the relative weight of private entities in total expenditure on health. It includes expenditure from pooled resources with no government control, such as voluntary health insurance, and the direct payments for health by corporations (profit, non-for-profit and NGOs) and households. As a financing agent classification, it in-cludes all sources of funding passing through these entities, including any donor (funding) they use to pay for health.
5. Specific programmes and services
5.1. HIV/AIDS
http://www.aho.afro.who.int/en/data-statistics/hivaids
Estimated antiretroviral therapy coverage among people living with HIV (%)
Definition The percentage of adults and children with HIV infection currently receiving antiretroviral combination therapy in accordance with the nationally approved treatment protocols (or WHO/UNAIDS standards) among the estimated number of adults and children with HIV infection. Numerator: Number of adults and children with HIV infection who are currently receiving antiretroviral combination therapy in accordance with the nationally approved treatment protocol (or WHO/UNAIDS standards) at the end of the reporting period. Denominator: Estimated number of adults and children with HIV infection.
Rationale Antiretroviral therapy (ART) has been shown to reduce mortality among those infected and efforts are being made to make it more affordable within low- and middle-income countries. This indicator assesses the progress in providing antiretroviral combination therapy to all people with HIV infection. As the HIV epidemic matures, increasing numbers of people are reaching advanced stages of HIV infection. Over recent years WHO has issued various updates in the ARV guidelines. Under the 2013 WHO consolidated guidelines, roughly 85% people living with HIV would be eligible for treatment in 2013. For reasons of comparability across countries and over time in the context of changing recommendations, this indicator relates to the number of people receiving ART as of proportion of the overall estimated number of people living with HIV. The ranges around the levels of people living with HIV who received ART are based on the uncertainty bounds around the estimates of people living with HIV.
Metadata http://apps.who.int/gho/indicatorregistry/App_Main/view_indicator.aspx?iid=4477
Estimated number of people aged 15 years and over who received HIV testing and counselling
during the last 12 months per 1000 adults
Definition Estimated number of people aged 15 years and over who received HIV testing and counselling during the last 12 months per 1000 adults.
Rationale In order to protect themselves and to prevent infecting others, it is important for individuals to know their HIV status. Knowledge of one’s status is also a critical factor in the decision to seek treatment.
Metadata http://apps.who.int/gho/indicatorregistry/App_Main/view_indicator.aspx?iid=2931
HIV prevalence among adults aged 15-49 years (%)
Definition The estimated number of adults aged 15-49 years with HIV infection, whether or not they have developed symptoms of AIDS, expressed as per cent of total population in that age group.
Rationale HIV and AIDS has become a major public health problem in many countries and monitoring the course of the epidemic and impact of interventions is crucial. Both the Millennium Development Goals (MDG) and the United Nations General Assembly Special Session on HIV and AIDS (UNGASS) have set goals of reduc-ing HIV prevalence.
Metadata http://apps.who.int/gho/indicatorregistry/App_Main/view_indicator.aspx?iid=334
Population aged 15-24 years with comprehensive correct knowledge of HIV/AIDS (%)
Definition Percentage of young people aged 15–24 who both correctly identify ways of preventing the sexual trans-mission of HIV and who reject major misconceptions about HIV transmission
Rationale HIV epidemics are perpetuated through primarily sexual transmission of infection to successive gen-erations of young people. Sound knowledge about HIV and AIDS is an essential pre-requisite — albeit, often an insufficient condition — for adoption of behaviours that reduce the risk of HIV transmission. The purpose of this indicator is to assess progress towards universal knowledge of the essential facts about HIV transmission.
Metadata http://apps.who.int/gho/indicatorregistry/App_Main/view_indicator.aspx?iid=21
179
Prevalence of condom use by adults (aged 15-49 years) during higher-risk sex (%)
Definition Percentage of women and men aged 15–49 who have had more than one sexual partner in the past 12 months who report the use of a condom during their last sexual intercourse
Rationale Condom use is an important measure of protection against HIV, especially among people with multiple sexual partners. The purpose of this indicator is to assess progress towards preventing exposure to HIV through unprotected sex with non-regular partners.
Metadata http://apps.who.int/gho/indicatorregistry/App_Main/view_indicator.aspx?iid=15
5.2. Tuberculosis
http://www.aho.afro.who.int/en/data-statistics/tuberculosis
Case detection rate for all forms of tuberculosis
Definition The proportion of estimated new and relapse tuberculosis (TB) cases detected in a given year under the inter-nationally recommended tuberculosis control strategy. The term “case detection”, as used here, means that TB is diagnosed in a patient and is reported within the national surveillance system, and then to WHO. The term “rate” is used for historical reasons; the indicator is actually a ratio (expressed as percentage) and not a rate.
Rationale It provides an indication of the effectiveness of national tuberculosis (TB) programmes in finding, diagnos-ing and treating people with TB. WHO does not recommend that countries set specific targets for the case detection rate for all forms of TB because the denominator (estimated number of incident TB cases during a calendar year) is not directly measureable and there is thus considerable uncertainty about its true value.
Metadata http://apps.who.int/gho/indicatorregistry/App_Main/view_indicator.aspx?iid=1422
Estimated deaths due to tuberculosis, excluding HIV (per 100 000 population)
Definition The estimated number of deaths attributable to tuberculosis (TB) in a given year, expressed as the rate per 100 000 population. Published values are rounded to three significant figures. Uncertainty bounds are provided in addition to best estimates.
Rationale Incidence, prevalence and mortality are the three main indicators used to assess the burden of disease caused by TB. Of the three, mortality is the only indicator that can be directly measured in all countries (provided vital registration systems are in place).Target 6.c of the Millennium development Goals is to “have halted by 2015 and begun to reverse the incidence of malaria and other major diseases”. Indicator 6.9 is defined as “incidence, prevalence and death rates associated with TB”. The Stop TB Partnership has set a target of halving the 1990 TB mortality rate by 2015.
Metadata http://apps.who.int/gho/indicatorregistry/App_Main/view_indicator.aspx?iid=17
Estimated prevalence of tuberculosis (per 100 000 population)
Definition The number of cases of tuberculosis (all forms) in a population at a given point in time (the middle of the calendar year), expressed as the rate per 100 000 population. It is sometimes referred to as “point preva-lence”. Estimates include cases of TB in people with HIV. Published values are rounded to three significant figures. Uncertainty bounds are provided in addition to best estimates. See Annex 1 of the WHO global tuberculosis control report http://www.who.int/tb/publications/global_report/en/
Rationale Incidence, prevalence and mortality are the three main indicators used to assess the burden of disease caused by TB. Target 6.c of the Millenium development Goals is to “have halted by 2015 and begun to reverse the incidence of malaria and other major diseases”. Indicator 6.9 is defined as “incidence, preva-lence and death rates associated with TB”. The Stop TB Partnership has set a target of halving the 1990 TB prevalence and mortality rates by 2015.
Metadata http://apps.who.int/gho/indicatorregistry/App_Main/view_indicator.aspx?iid=23
Estimated incidence of tuberculosis (per 100 000 population)
Definition The estimated number of new and relapse tuberculosis (TB) cases arising in a given year, expressed as the rate per 100 000 population. All forms of TB are included, including cases in people living with HIV. Published values are rounded to three significant figures. Uncertainty bounds are provided in addition to best estimates. See Annex 1 of the WHO global tuberculosis control report http://www.who.int/tb/publica-tions/global_report/en/
Rationale Incidence (cases arising in a given time period, usually one year) gives an indication of the burden of TB in a population, and of the size of the task faced by a national TB control programme. Incidence can change as the result of changes in transmission (the rate at which people become infected with Mycobacterium tuberculosis), or changes in the rate at which people infected with Mycobacterium tuberculosis develop TB disease (e.g. as a result of changes in nutritional status or of HIV infection). Because TB can develop in people who became infected many years previously, the effect of TB control on incidence is less rapid than the effect on prevalence or mortality.
Metadata http://apps.who.int/gho/indicatorregistry/App_Main/view_indicator.aspx?iid=20
180

Tuberculosis treatment success rate
Definition The proportion of cases registered in a given year (excluding cases placed on a second-line drug regimen) that successfully completed treatment whether with or without bacteriological evidence of success.
Rationale Treatment success is an indicator of the performance of national TB programmes.
Metadata http://apps.who.int/gho/indicatorregistry/App_Main/view_indicator.aspx?iid=4462
5.3. Malaria
http://www.aho.afro.who.int/en/data-statistics/malaria
Children aged <5 years with fever who received treatment with any antimalarial (%)
Definition Percentage of children aged < 5 years with fever in malaria-risk areas being treated with effective antima-larial drugs.
Rationale Prompt treatment with effective antimalarial drugs for children with fever in malaria-risk areas is a key intervention to reduce mortality. In addition to being listed as a global Millennium Development Goals Indicator under Goal 6, effective treatment for malaria is also identified by WHO, UNICEF, and the World Bank as one of the main interventions to reduce the burden of malaria in Africa. In areas of sub-Saharan Africa with stable levels of malaria transmission, it is essential that prompt access to treatment is ensured to prevent the degeneration of malaria from its onset to a highly lethal complicated picture. This requires drug availability at household or community level and, for complicated cases, availability of transport to the nearest equipped facility.
Metadata http://apps.who.int/gho/indicatorregistry/App_Main/view_indicator.aspx?iid=14
Children aged <5 years sleeping under insecticide-treated nets (%)
Definition Percentage of children under five years of age in malaria endemic areas who slept under an insecti-cide-treated nets (ITN) the previous night.
Rationale In areas of intense malaria transmission, malaria-related morbidity and mortality are concentrated in young children, and the use of insecticide-treated nets (ITN) by children under 5 has been demonstrated to considerably reduce malaria disease incidence, malaria-related anaemia and all cause under 5 mortality. In addition to being listed as an MDG indicator under Goal 6, the use of ITNs is identified by WHO as one of the main interventions to reduce the burden of malaria.
Metadata http://apps.who.int/gho/indicatorregistry/App_Main/view_indicator.aspx?iid=13
Number of insecticide classes to which resistance was reported
Definition Number of insecticide classes to which resistance was confirmed via standard bioassays for any malaria vector species collected from any site within the country and tested with any insecticide of that class during the year indicated.
Rationale This indicator belongs to a set of indicators whose purpose is to assess mosquito resistance to the insec-ticide classes recommended by WHO for malaria vector control, and also to facilitate implementation of the Global Plan for Insecticide Resistance Management in malaria vectors (GPIRM). WHO currently recommends four classes of insecticide for indoor residual spraying (pyrethroids, organochlorines, car-bamates and organophosphates) and one for insecticide-treated nets (pyrethroids). The increasing trend in resistance to one or more insecticides classes constitutes a major threat to the effectiveness of current malaria control efforts. Therefore, resistance testing and monitoring are required to support the formula-tion of comprehensive national insecticide resistance monitoring and management plans for all countries with ongoing malaria transmission. This indicator provides information about the presence of confirmed carbamate resistance across countries over time.
Metadata http://apps.who.int/gho/indicatorregistry/App_Main/view_indicator.aspx?iid=4557
5.4. Immunization and vaccines
http://www.aho.afro.who.int/en/data-statistics/immunization-vaccines-and-emergencies
BCG immunization coverage among 1-year-olds (%)
Definition The percentage of one-year-olds who have received one dose of bacille Calmette-Guérin (BCG) vaccine in a given year.
Rationale Immunization is an essential component for reducing under-five mortality. Immunization coverage estimates are used to monitor coverage of immunization services and to guide disease eradication and elimination efforts. It is a good indicator of health system performance.
Metadata http://www.aho.afro.who.int/en/data-statistics/bacille-calmette-gu%C3%A9rin-bcg-immunization-cover-age-among-1-year-olds
181
Diphtheria tetanus toxoid and pertussis (DTP3) immunization coverage among 1-year-olds (%)
Definition The percentage of one-year-olds who have received three doses of the combined diphtheria, tetanus toxoid and pertussis vaccine in a given year.
Rationale Immunization is an essential component for reducing under-five mortality. Immunization coverage estimates are used to monitor coverage of immunization services and to guide disease eradication and elimination efforts. It is a good indicator of health system performance.
Metadata http://www.aho.afro.who.int/en/data-statistics/diphtheria-tetanus-toxoid-and-pertussis-dtp3-immuniza-tion-coverage-among-1-year-ol-0
Hepatitis B (HepB3) immunization coverage among 1-year-olds (%)
Definition The percentage of one-year-olds who have received three doses of hepatitis B vaccine in a given year.
Rationale Immunization is an essential component for reducing under-five mortality. Immunization coverage estimates are used to monitor coverage of immunization services and to guide disease eradication and elimination efforts. It is a good indicator of health system performance.
Metadata http://www.aho.afro.who.int/en/data-statistics/hepatitis-b-hepb3-immunization-cover-age-among-1-year-olds
Hib (Hib3) immunization coverage among 1-year-olds (%)
Definition The percentage of one-year-olds who have received three doses of Haemophilus influenzae type B vac-cine in a given year.
Rationale Immunization is an essential component for reducing under-five mortality. Immunization coverage estimates are used to monitor coverage of immunization services and to guide disease eradication and elimination efforts. It is a good indicator of health system performance.
Metadata http://www.aho.afro.who.int/en/data-statistics/haemophilus-influenzae-type-b-hibb3-immunization-cov-erage-among
Measles (MCV) immunization coverage among 1-year-olds (%)
Definition The percentage of children under one year of age who have received at least one dose of measles-con-taining vaccine in a given year. For countries recommending the first dose of measles vaccine in children over 12 months of age, the indicator is calculated as the proportion of children less than 12-23 months of age receiving one dose of measles-containing vaccine.
Rationale Immunization is an essential component for reducing under-five mortality. Immunization coverage estimates are used to monitor coverage of immunization services and to guide disease eradication and elimination efforts. It is a good indicator of health system performance. Percentage of children under one year of age immunized against measles is one of MDG indicators (see 3.1. MDG-4: Reduce child mortality)
Metadata http://www.aho.afro.who.int/en/data-statistics/measles-containing-vaccine-mcv-immunization-cover-age-among-1-year-olds
Neonates protected at birth against neonatal tetanus (%)
Definition The proportion of neonates in a given year that can be considered as having been protected against teta-nus as a result of maternal immunization.
Rationale Immunization is an essential component for reducing under-five mortality. Immunization coverage estimates are used to monitor coverage of immunization services and to guide disease eradication and elimination efforts. It is a good indicator of health system performance.
Metadata http://www.aho.afro.who.int/en/data-statistics/neonates-protected-birth-against-neonatal-tetanus-pab
Pneumococcal conjuguate vaccine (PCV) immunization coverage among 1-year-olds (%)
Metadata http://www.aho.afro.who.int/en/data-statistics/pneumococcal-conjuguate-vaccine-pcv-immuniza-tion-coverage-among-1-year-olds
Polio (Pol3) immunization coverage among 1-year-olds (%)
Definition The percentage of one-year-olds who have received three doses of polio vaccine in a given year.
Rationale Immunization is an essential component for reducing under-five mortality. Immunization coverage estimates are used to monitor coverage of immunization services and to guide disease eradication and elimination efforts. It is a good indicator of health system performance.
Metadata http://www.aho.afro.who.int/en/data-statistics/polio-pol3-immunization-coverage-among-1-year-olds
Rotavirus-last immunization coverage among 1-year-olds (%)
Metadata http://www.aho.afro.who.int/en/data-statistics/rotavirus-last-immunization-coverage-among-1-year-olds
Yellow fever (Yfv) immunization coverage among 1-year-olds (%)
Metadata http://www.aho.afro.who.int/en/data-statistics/yellow-fever-yfv-immunization-cover-age-among-1-year-olds
182
5.5. Child and adolescent health
http://www.aho.afro.who.int/en/data-statistics/child-and-adolescent-health
Children aged <5 years sleeping under insecticide-treated nets (%)
Definition Percentage of children under five years of age in malaria endemic areas who slept under an insecti-cide-treated nets (ITN) the previous night.
Rationale In areas of intense malaria transmission, malaria-related morbidity and mortality are concentrated in young children, and the use of insecticide-treated nets (ITN) by children under 5 has been demonstrated to considerably reduce malaria disease incidence, malaria-related anaemia and all cause under 5 mortality. In addition to being listed as an MDG indicator under Goal 6, the use of ITNs is identified by WHO as one of the main interventions to reduce the burden of malaria.
Metadata http://apps.who.int/gho/indicatorregistry/App_Main/view_indicator.aspx?iid=13
Stunting prevalence in children aged < 5 years (%)
Definition Data are derived from re-analysis of Demographic and Health Surveys (DHS) and Multiple Indicator Cluster Surveys (MICS) micro-data which are publicly available using the standard indicator definitions as pub-lished in DHS or Unicef documentation. The analysis was done by the International Center for Analysis and Monitoring of Equity in Health and Nutrition based in the Federal University of Pelotas, Brazil.
Rationale The percentage of stunting (defined as more than two standard deviations below the median height-for-age of the WHO Child Growth Standards) among children aged five years or younger. Numerator: Number of children aged five years or younger that meet the criteria for stunting. Denominator: Total number of children aged five years or younger surveyed.
Metadata http://apps.who.int/gho/indicatorregistry/App_Main/view_indicator.aspx?iid=3328
Children aged < 5 years underweight (%)
Definition Percentage of underweight (weight-for-age less than -2 standard deviations of the WHO Child Growth Standards median) among children aged 0-5 years.
Rationale This indicator belongs to a set of indicators whose purpose is to measure nutritional imbalance and malnutrition resulting in undernutrition (assessed by underweight, stunting and wasting) and overweight. Child growth is the most widely used indicator of nutritional status in a community and is internationally recognized as an important public-health indicator for monitoring health in populations. In addition, chil-dren who suffer from growth retardation as a result of poor diets and/or recurrent infections tend to have a greater risk of suffering illness and death.
Metadata http://apps.who.int/gho/indicatorregistry/App_Main/view_indicator.aspx?iid=27
Wasting prevalence in children aged < 5 years (%)
Definition Data are derived from re-analysis of Demographic and Health Surveys (DHS) micro-data which are publicly available using the standard indicator definitions as published in DHS documentation. The analysis was done by the International Center for Analysis and Monitoring of Equity in Health and Nutrition based in the Federal University of Pelotas, Brazil.
Rationale The percentage of wasting (defined as more than two standard deviations below the median weight-for-height of the WHO Child Growth Standards) among children aged five years or younger. Numerator: Num-ber of children aged five years or younger that meet the criteria for wasting. Denominator: Total number of children aged five years or younger surveyed.
Metadata http://apps.who.int/gho/indicatorregistry/App_Main/view_indicator.aspx?iid=4488
Children aged < 5 years with ARI symptoms taken to a health facility (%)
Definition Proportion of children aged 0–59 months who had ‘presumed pneumonia’ (ARI) in the previous 2 weeks and were taken to an appropriate health-care provider. Strictly speaking, ‘ARI’ stands for ‘acute respiratory infection’. During the UNICEF/WHO Meeting on Child Survival Survey-based Indicators, held in New York, 17–18 June 2004, it was recommended that ARI be described as ‘presumed pneumonia’ to better reflect probable cause and the recommended interventions. The definition of ARI used in the Demographic and Health Surveys (DHS) and in the Multiple Indicator Cluster Surveys (MICS) was chosen by the group and is based on mothers’ perceptions of a child who has a cough, is breathing faster than usual with short, quick breaths or is having difficulty breathing, excluding children that had only a blocked nose. The definition of ‘appropriate’ care provider varies between countries.
Rationale Acute respiratory infections (ARI) are responsible for 15% of all deaths of children aged less than 5 years worldwide. Appropriate care of the sick child is defined as providers that can correctly diagnose and treat pneumonia. The proportion of under-fives with ARI that are taken to an appropriate health-care provider is therefore a key indicator for coverage of intervention and care-seeking, and provides critical inputs to the monitoring of progress towards child survival-related Millennium Development Goals and Strategies.
Metadata http://apps.who.int/gho/indicatorregistry/App_Main/view_indicator.aspx?iid=70
183

Children aged <5 years with ARI symptoms receiving antibiotics (%)
Definition Percentage of children ages 0–59 months with suspected pneumonia receiving antibiotics
Rationale Pneumonia accounts for an estimated 15% of deaths among children under five. Appropriate care of the sick child is defined as providers that can correctly diagnose and treat pneumonia. Antibiotics have an essential role in reducing deaths due to pneumonia. Pneumonia prevention and treatment is therefore essential to the achievement of MDG4.
Metadata http://apps.who.int/gho/indicatorregistry/App_Main/view_indicator.aspx?iid=2973
Children aged <5 years with diarrhoea receiving oral rehydration therapy (%)
Definition Proportion of children aged 0–59 months who had diarrhoea in the previous 2 weeks and were treated with oral rehydration salts or an appropriate household solution (ORT). According to DHS, the term(s) used for diarrhoea should encompass the expressions used for all forms of diarrhoea, including bloody stools (consistent with dysentery), watery stools, etc. It encompasses the mother`s definition as well as the ‘local term(s)’. The definition of “appropriate household solution” may vary between countries.
Rationale Diarrhoeal diseases remain one of the major causes of mortality among under-fives, accounting for more than 600 000 child deaths worldwide, despite all the progress in its management and the undeniable success of the oral rehydration therapy (ORT). Therefore monitoring of the coverage of this very cost-ef-fective intervention is crucial for the monitoring of progress towards the child survival-related Millennium Development Goals and Strategies.
Metadata http://apps.who.int/gho/indicatorregistry/App_Main/view_indicator.aspx?iid=71
Children aged <5 years with fever who received treatment with any antimalarial (%)
Definition Percentage of children aged < 5 years with fever in malaria-risk areas being treated with effective antima-larial drugs.
Rationale Prompt treatment with effective antimalarial drugs for children with fever in malaria-risk areas is a key intervention to reduce mortality. In addition to being listed as a global Millennium Development Goals Indicator under Goal 6, effective treatment for malaria is also identified by WHO, UNICEF, and the World Bank as one of the main interventions to reduce the burden of malaria in Africa. In areas of sub-Saharan Africa with stable levels of malaria transmission, it is essential that prompt access to treatment is ensured to prevent the degeneration of malaria from its onset to a highly lethal complicated picture. This requires drug availability at household or community level and, for complicated cases, availability of transport to the nearest equipped facility.
Metadata http://apps.who.int/gho/indicatorregistry/App_Main/view_indicator.aspx?iid=14
Children aged 6-59 months who received vitamin A supplementation (%)
Definition Proportion of children aged 6–59 months who received a high-dose vitamin A supplement within the last 6 months. High dose vitamin A, according to the International Vitamin A Consultative Group (IVACG) definition, refers to “doses equal or greater than 25 000 IU”.
Rationale Supplementation with vitamin A is considered to be an important intervention for child survival owing to the strong evidence that exists for its impact on reducing child mortality among populations where vita-min A deficiency is prevalent. Therefore, measuring the proportion of children who have received vitamin A within the last 6 months is crucial for monitoring coverage of interventions towards the child survival-re-lated Millennium Development Goals and Strategies.
Metadata http://apps.who.int/gho/indicatorregistry/App_Main/view_indicator.aspx?iid=69
Proportion of infants aged 6-8 months who receiving complementary food (solid, semi-solid or
soft foods) (%)
Definition Proportion of infants aged 6-8 months receiving breast milk and any food, whether home-prepared or industrially processed, suitable as a complement to breast milk to satisfy the nutritional requirements of the infant.
Rationale Breast milk alone does not provide all the nutrients needed by an infant over six months of age. UNICEF and WHO recommend that all women breastfeed their children exclusively for the first six months. After this age, the introduction of complementary foods is critical to meet the protein, energy, and micronu-trient needs of the child. Continuing to breastfeed with complementary feeding is also important as breastfeeding accounts for a substantial proportion of fat, vitamin A, calcium, and quality protein into the second year of life
Metadata http://apps.who.int/gho/indicatorregistry/App_Main/view_indicator.aspx?iid=3209
Distribution of causes of death among children aged <5 years (%)
Definition Distribution of main causes of death among children aged < 5 years, expressed as percentage of total deaths. The causes of death refers to the concept of the ‘underlying cause of death’ as defined by ICD-10 (WHO, 1992).
Rationale The target of Millennium Development Goal 4 is to “Reduce by two thirds, from 1990 to 2015, the un-der-five mortality rate”. Efforts to improve child survival can be effective only if they are based on reason-
184
ably accurate information about the causes of childhood deaths. Cause-of-death information is needed to prioritize interventions and plan for their delivery, to determine the effectiveness of disease-specific interventions, and to assess trends in disease burden in relation to national and international goals.
Metadata http://apps.who.int/gho/indicatorregistry/App_Main/view_indicator.aspx?iid=89
Early initiation of breastfeeding (%)
Definition Proportion of children born in the last 24 months who were put to the breast within one hour of birth
Rationale This indicator belong to a set of indicators whose purpose is to measure infant and young child feeding practices, policies and programmes. Early initiation of breastfeeding, within one hour of birth, protects the newborn from acquiring infection and reduces newborn mortality. It facilitates emotional bonding of the mother and the baby and has a positive impact on duration of exclusive breastfeeding. When a mother initiates breastfeeding within one hour after birth, production of breast milk is stimulated. The yellow or golden first milk produced in the first days, also called colostrum, is an important source of nutrition and immune protection for the newborn.
Metadata http://apps.who.int/gho/indicatorregistry/App_Main/view_indicator.aspx?iid=337
Exclusive breastfeeding under 6 months (%)
Definition Proportion of infants 0–5 months of age who are fed exclusively with breast milk.
Rationale This indicator belong to a set of indicators whose purpose is to measure infant and young child feeding practices, policies and programmes. Infant and young child feeding practices directly affect the nutri-tional status and survival of children. Exclusive breastfeeding is the single most effective intervention to improve the survival of children. Improving infant and young child feeding practices is therefore critical to improved nutrition, health and development of children.
Metadata http://apps.who.int/gho/indicatorregistry/App_Main/view_indicator.aspx?iid=130
Under-five mortality rate (probability of dying by age 5 per 1000 live births)
See under 2.2. Mortality
Average annual rate of reduction (AARR) (%) in under-five mortality rate
n/a
Neonatal mortality rate (per 1000 live births)
Definition Number of deaths during the first 28 completed days of life per 1000 live births in a given year or other period.
Rationale Mortality during the neonatal period accounts for a large proportion of child deaths, and is considered to be a useful indicator of maternal and newborn neonatal health and care. Generally, the proportion of neonatal deaths among child deaths under the age of five is expected to increase as countries continue to witness a decline in child mortality.
Metadata http://www.childmortality.org/
Low-birthweight babies/newborns (%)
Definition The percentage of live births that weigh less than 2,500 g out of the total of live births during the same time period.
Rationale At the population level, the proportion of babies with a low birth weight is an indicator of a multifacet-ed public-health problem that includes long-term maternal malnutrition, ill health, hard work and poor health care in pregnancy. On an individual basis, low birth weight is an important predictor of newborn health and survival.
Metadata http://apps.who.int/gho/indicatorregistry/App_Main/view_indicator.aspx?iid=76
5.6. Maternal and newborn health
http://www.aho.afro.who.int/en/data-statistics/maternal-and-newborn-health
Antenatal care coverage - at least four visits (%)
Definition The percentage of women aged 15-49 with a live birth in a given time period that received antenatal care four or more times. Due to data limitations, it is not possible to determine the type of provider for each visit. Numerator: The number of women aged 15-49 with a live birth in a given time period that received antenatal care four or more times. Denominator: Total number of women aged 15-49 with a live birth in the same period.
Rationale Antenatal care coverage is an indicator of access and use of health care during pregnancy. The antenatal period presents opportunities for reaching pregnant women with interventions that may be vital to their health and wellbeing and that of their infants. Receiving antenatal care at least four times, as recommend-ed by WHO, increases the likelihood of receiving effective maternal health interventions during antenatal visits. This is an MDG indicator.
Metadata http://apps.who.int/gho/indicatorregistry/App_Main/view_indicator.aspx?iid=80
185
Antiretroviral therapy coverage among HIV-infected pregnant women for PMTCT (%)
Definition The percentage of HIV-infected pregnant women who received antiretroviral medicines to reduce the risk of mother-to-child transmission, among the estimated number of HIV-infected pregnant women. Numer-ator: Number of HIV-infected pregnant women who received antiretroviral medicines to reduce the risk of mother-to-child transmission in the last 12 months. Denominator: Estimated number of HIV-infected pregnant women in the last 12 months
Rationale In the absence of any preventative interventions, infants born to and breastfed by HIV-infected women have roughly a one-in-three chance of acquiring infection themselves. This can happen during pregnancy, during labour and delivery or after delivery through breastfeeding. The risk of mother-to-child transmis-sion can be significantly reduced through the complementary approaches of antiretroviral regimens for the mother with or without prophylaxis to the infant, implementation of safe delivery practices and use of safer infant feeding practices. The purpose of this indicator is to assess progress in preventing mother-to-child transmission of HIV (PMTCT).
Metadata http://apps.who.int/gho/indicatorregistry/App_Main/view_indicator.aspx?iid=82
Births attended by skilled health personnel (%)
Definition The proportion of births attended by skilled health personnel. Numerator: The number of births attended by skilled health personnel (doctors, nurses or midwives) trained in providing life saving obstetric care, including giving the necessary supervision, care and advice to women during pregnancy, childbirth and the post-partum period; to conduct deliveries on their own; and to care for newborns. Denominator: The total number of live births in the same period.
Rationale All women should have access to skilled care during pregnancy and childbirth to ensure prevention, detection and management of complications. Assistance by properly trained health personnel with adequate equipment is key to lowering maternal deaths. As it is difficult to accurately measure maternal mortality, and model-based estimates of the maternal mortality ratio cannot be used for monitoring short-term trends, the proportion of births attended by skilled health personnel is used as a proxy indica-tor for this purpose. This is an MDG indicator.
Metadata http://apps.who.int/gho/indicatorregistry/App_Main/view_indicator.aspx?iid=25
Births by caesarean section (%)
Definition Percentage of births by caesarean section among all live births in a given time period.Rationale The percentage of births by caesarean section is an indicator of access to and use of health care during
childbirth.Metadata http://apps.who.int/gho/indicatorregistry/App_Main/view_indicator.aspx?iid=68
Distribution of main causes of maternal death (%)
Metadata http://www.aho.afro.who.int/en/data-statistics/distribution-main-causes-maternal-death
Infant mortality rate (deaths per 1,000 live births)
See under 2.2. Mortality
Lifetime risk of maternal death (1 in N)
Definition Lifetime risk of maternal death (1 in:)Rationale The importance of quantifying the loss of life caused by maternal mortality in a population is widely
recognized. In addition to the MMRatio and the MMRate, the lifetime risk, or probability, of maternal death in a population is another possible measure. Whereas the MMRatio and the MMRate are measures of the fre-quency of maternal death in relation to the number of live births or to the female population of reproductive age, the lifetime risk of maternal mortality describes the cumulative loss of human life due to maternal death over the female life course. Because it is expressed in terms of the female life course, the lifetime risk is often preferred to the MMRatio or MMRate as a summary measure of the impact of maternal mortality.
Metadata http://www.aho.afro.who.int/en/data-statistics/lifetime-risk-maternal-death-1-n
Maternal mortality ratio (per 100 000 live births)
Definition The maternal mortality ratio (MMR) is the annual number of female deaths from any cause related to or aggravated by pregnancy or its management (excluding accidental or incidental causes) during pregnan-cy and childbirth or within 42 days of termination of pregnancy, irrespective of the duration and site of the pregnancy, per 100,000 live births, for a specified year.
Rationale Complications during pregnancy, childbirth and post-partum are a leading cause of death and disabili-ty among women of reproductive age in developing countries. The maternal mortality ratio represents the risk associated with each pregnancy, i.e. the obstetric risk. It is also a Millennium Development Goal Indicator for monitoring Goal 5, improving maternal health (see 3.2. MDG-5: Improve maternal health). The indicator monitors deaths related to pregnancy and childbirth. It reflects the capacity of the health systems to provide effective health care in preventing and addressing the complications occurring during pregnancy and childbirth.
Metadata http://apps.who.int/gho/indicatorregistry/App_Main/view_indicator.aspx?iid=26
186
Average annual rate of reduction (AARR) (%) in maternal mortality ratio
n/a
Neonatal mortality rate (per 1000 live births)
See under 5.5. Child and adolescent health
Postnatal care visit within two days of childbirth (%)
Definition Percentage of mothers who received postnatal care within two days of childbirth. Numerator: Number of women who received postnatal care within two days of childbirth. Denominator: Total number of women ages 15-49 years with a last live birth in the x years prior to the survey (regardless of place of delivery).
Rationale The majority of maternal and newborn deaths occur within a few hours after birth, mostly within the first 48 hours. Deaths in the newborn period (first 28 days) are a growing proportion of all child deaths. Postna-tal care contacts, especially within the first few days following birth, are a critical opportunity for improv-ing maternal and newborn health and survival and for provision of information about birth spacing.
Metadata http://apps.who.int/gho/indicatorregistry/App_Main/view_indicator.aspx?iid=2972
Pregnant women who received 2+ doses of IPTp for malaria during pregnancy (%)
Definition Pregnant women who received 2+ doses of Intermittent preventive therapy in pregnancy IPTp (2+ doses of SP/fansidar) for malaria during pregnancy (%).
Rationale IPTp is a public health intervention aimed at treating and preventing malaria episodes for pregnant wom-en. The intervention builds on two tested malaria control strategies: to clear existing parasites and prevent new infections.
Metadata http://www.aho.afro.who.int/en/data-statistics/pregnant-women-who-received-2-doses-iptp-malaria-dur-ing-pregnancy
Stillbirth rate (per 1000 total births)
Definition For international comparison purposes, stillbirths are defined as third trimester fetal deaths (> or = 1000 grams or > or = 28 weeks).
Rationale Stillbirths can occur antepartum or intrapartum. In many cases, stillbirths reflect inadequacies in antena-tal care coverage or good quality intrapartum care.
Metadata http://apps.who.int/gho/indicatorregistry/App_Main/view_indicator.aspx?iid=2444
5.7. Gender and women’s health
http://www.aho.afro.who.int/en/data-statistics/gender-and-women%E2%80%99s-health
Adolescent fertility rate (per 1000 girls aged 15-19 years)
Definition The annual number of births to women aged 15-19 years per 1,000 women in that age group. It is also referred to as the age-specific fertility rate for women aged 15-19.
Rationale The adolescent birth rate, technically known as the age-specific fertility rate provides a basic measure of reproductive health focusing on a vulnerable group of adolescent women. There is substantial agreement in the literature that women who become pregnant and give birth very early in their reproductive lives are subject to higher risks of complications or even death during pregnancy and birth and their children are also more vulnerable. Therefore, preventing births very early in a woman’s life is an important measure to improve maternal health and reduce infant mortality. Furthermore, women having children at an early age experience a curtailment of their opportunities for socio-economic improvement, particularly because young mothers are unlikely to keep on studying and, if they need to work, may find it especially difficult to combine family and work responsibilities. The adolescent birth rate provides also indirect evidence on access to reproductive health since the youth, and in particular unmarried adolescent women, often experience difficulties in access to reproductive health care.
Metadata http://apps.who.int/gho/indicatorregistry/App_Main/view_indicator.aspx?iid=3
Age-standardized incidence rate of cervical cancer per 100 000 population
n/a
Contraceptive prevalence (%)
Definition The percentage of women aged 15-49 years, married or in-union, who are currently using, or whose sexual partner is using, at least one method of contraception, regardless of the method used.
Rationale Contraceptive prevalence rate is an indicator of health, population, development and women’s empow-erment. It also serves as a proxy measure of access to reproductive health services that are essential for meeting many of the Millennium Development Goals, especially those related to child mortality, maternal health, HIV/AIDS, and gender equality.
Metadata http://apps.who.int/gho/indicatorregistry/App_Main/view_indicator.aspx?iid=5
187
Female headed households (% of households with a female head)
Definition Female headed households shows the percentage of households with a female headRationale One of gender equity indicatorMetadata http://databank.worldbank.org/data/reports.aspx?source=2&type=metadata&series=SP.HOU.FEMA.ZS
Women aged 20-24 that were married before the age of 18 (%)
Definition Percentage of women aged 20 to 24 years who were first married or in union before they were 18 years.Rationale Marriage before the age of 18 is a fundamental violation of human rights. Yet among women aged 20 to 24
worldwide, one in four were child brides. Many factors interact to place a girl at risk of marriage, including pov-erty, the perception that marriage will provide ‘protection’, family honour, social norms, customary or religious laws that condone the practice, an inadequate legislative framework and the state of a country’s civil registra-tion system. Child marriage often compromises a girl’s development by resulting in early pregnancy and social isolation, interrupting her schooling, limiting her opportunities for career and vocational advancement and placing her at increased risk of domestic violence. Child marriage also affects boys, but to a lesser degree than girls. - See more at: http://data.unicef.org/child-protection/child-marriage.html#sthash.09FTxfD9.dpuf
Metadata http://data.unicef.org/child-protection/child-marriage.html
Prevalence of female genital mutilation/Cutting (FGM/C) among girls (%)
Definition Percentage of girls 0–14 years old who have undergone FGM/C (as reported by their mothers)Rationale The United Nations considers female genital mutilation a human rights violation because of the physical
and psychological impact this unnecessary procedure has on women. Obtaining timely, comparable and reliable information on Female genital mutilation/Cutting is key to efforts aimed at promoting its elimina-tion. This is important to protect child.
Metadata http://data.unicef.org/child-protection/fgmc.html#sthash.IPdgiJDB.dpuf
Prevalence of Female genital mutilation/Cutting (FGMC) among women (%)
Definition Percentage of women 15–49 years old who have undergone FGM/CRationale The United Nations considers female genital mutilation a human rights violation because of the physical
and psychological impact this unnecessary procedure has on women. Obtaining timely, comparable and reliable information on Female genital mutilation/Cutting is key to efforts aimed at promoting its elimina-tion. This is important to protect child.
Metadata http://data.unicef.org/child-protection/fgmc.html#sthash.IPdgiJDB.dpuf
Proportion of seats held by women in national parliaments (%)
Definition Number of seats held by women members in single or lower chambers of national parliaments, expressed as a percentage of all occupied seats. Seats refer to the number of parliamentary mandates, or the number of members of parliament.
Rationale This is one of MDG 3 indicator. The indicator covers the single chamber in unicameral parliaments and the lower chamber in bicameral parliaments. Women’s representation in parliaments is one aspect of women’s opportunities in political and public life, and it is therefore linked to women’s empowerment.
Metadata United Nations Population Division
Sex ratio (Women100 men)
Definition Number of females per 100 malesMetadata United Nations Population Division
Share of women in wage employment in the nonagricultural sector (%)
Definition Share of female workers in the non-agricultural sector expressed as a percentage of total employment in the sector.
Rationale This is one of MDG 3 indicator. The indicator measures the degree to which labour markets are open to women in industry and service sectors, which affects not only equal employment opportunity for women but also economic efficiency through flexibility of the labour market and, therefore, the economy’s ability to adapt to change.
Metadata http://data.worldbank.org/indicator/SL.EMP.INSV.FE.ZS
Total fertility rate (per woman)
Definition The average number of children a hypothetical cohort of women would have at the end of their reproduc-tive period if they were subject during their whole lives to the fertility rates of a given period and if they were not subject to mortality. It is expressed as children per woman.
Metadata http://apps.who.int/gho/indicatorregistry/App_Main/view_indicator.aspx?iid=123
Unmet need for family planning (%)
Definition The proportion of women of reproductive age (15-49 years) who are married or in union and who have an unmet need for family planning, i.e. who do not want any more children or want to wait at least two years before having a baby, and yet are not using contraception.
188
Rationale Unmet need for family planning provides a measurement of the ability of women in achieving their desired family size and birth spacing. It also provides an indication of the success of reproductive health programmes in addressing demand for services. Unmet need complements the contraceptive prevalence rate by indicating the additional extent of need to delay or limit births. Unmet need is a rights-based measure that helps determine how well a country’s health system and social conditions support the ability of women to realize their stated preference to delay or limit births.
Metadata http://www.aho.afro.who.int/en/data-statistics/unmet-need-family-planning-0
5.8. Ageing
http://www.aho.afro.who.int/en/data-statistics/ageing
Life expectancy at age 60 (years)
Definition The average number of years that a person of 60 years old could expect to live, if he or she were to pass through life exposed to the sex- and age-specific death rates prevailing at the time of his or her 60 years, for a specific year, in a given country, territory, or geographic area.
Rationale Life expectancy at age 60 reflects the overall mortality level of a population over 60 years. It summarizes the mortality pattern that prevails across all age groups above 60 years.
Metadata http://apps.who.int/gho/indicatorregistry/App_Main/view_indicator.aspx?iid=2977
Percentage of population 60+ years
Definition The percentage of de facto population aged 60 years and older in a country, area or region as of 1 July of the year indicated.
Metadata United Nations Population Division
Sex ratio in 60+ age group (men/100 women)
Definition Number of females per 100 males in 60+ age group
Metadata United Nations Population Division
5.9. Epidemic and pandemic-prone diseasesn/a
5.10. Neglected tropical diseaseshttp://www.aho.afro.who.int/en/data-statistics/neglected-tropical-diseases
Number of reported cases of leprosy (Number of newly detected cases of leprosy)
Definition Enumeration of clinically confirmed newly detected cases of leprosy. WHO operational definition of a case of leprosy: a person showing clinical signs of leprosy, with or without bacteriological confirmation of the diagnosis, and requiring chemotherapy. This definition excludes individuals cured of the infection but having residual disabilities due to leprosy.
Rationale WHA Resolution 44.9 on elimination of leprosy as a public health problem
Metadata http://apps.who.int/gho/indicatorregistry/App_Main/view_indicator.aspx?iid=47
Number of new reported cases of Buruli ulcer
Definition A case of Buruli ulcer is defined as a person living in or having travelled to an endemic area and present-ing with a painless lesion (nodule, plaque, oedema or ulcer) consistent with signs of the disease (with or without bacteriological confirmation).
Rationale WHA Resolution 57.1 on surveillance and control of Buruli ulcer.
Metadata http://apps.who.int/gho/indicatorregistry/App_Main/view_indicator.aspx?iid=2448
Dracunculiasis certification status of countries at the beginning of the year
Definition It defines the status of certification of countries. WHO classifies countries as: Endemic for dracunculiasis - coun-try or group of countries where dracunculiasis transmission occurs and where surveillance and control opera-tions are essential; Countries at the precertification stage - group of countries have reached zero reporting of indigenous cases and where a reliable and extensive surveillance system must be maintained until certification; Countries not known to have dracunculiasis but yet to be certified - group of countries where the information obtained is not sufficiently clear to ascertain that guinea worm transmission has been definitely interrupted; Certified free of dracunculiasis - group of countries verified as free of dracunculiasis transmission and certified by WHO following the recommendation of the International Commission for the Certification of Dracunculiasis Eradication (ICCDE). Surveillance should be maintained until global eradication of dracunculiasis is declared. A country will be considered to have re-established dracunculiasis endemicity if the country has not reported an indigenous case of the disease for >3years, and subsequently indigenous transmission of laboratory confirmed cases is shown to occur in that country for three or more consecutive calendar years.
Rationale WHA Resolutions 44.5, 50.35 and 57.9 on eradication of dracunculiasis.
Metadata http://apps.who.int/gho/indicatorregistry/App_Main/view_indicator.aspx?iid=2468
189
Annual incidence of dracunculiasis cases
Definition Enumeration of the new dracunculiasis cases. WHO operational definition of a case of dracunculiasis: An individual exhibiting a skin lesion or lesions with emergence of one or more guinea worms (each individu-al should be counted only once in a calendar year).
Rationale WHA Resolutions 44.5, 50.35 and 57.9 on eradication of dracunculiasis.
Metadata http://apps.who.int/gho/indicatorregistry/App_Main/view_indicator.aspx?iid=2464
Status of endemicity for blinding trachoma
Definition Presence or absence of blinding trachoma as a public health problem.
Rationale WHA 51.11 on the elimination of blinding trachoma as a public health problem.
Metadata http://apps.who.int/gho/indicatorregistry/App_Main/view_indicator.aspx?iid=2470
Number of new reported cases of human African trypanosomiasis (T.b. gambiense)
Definition Number of new cases of human African trypanosomiasis (T.b. gambiense) officially reported to WHO by the National Control Program.
Metadata http://apps.who.int/gho/indicatorregistry/App_Main/view_indicator.aspx?iid=2466
5.11. Noncommunicable diseases and conditionshttp://www.aho.afro.who.int/en/data-statistics/noncommunicable-diseases-and-conditions
Age-standardized mortality rate (per 100 000 population)
Definition The age-standardized mortality rate is a weighted average of the age-specific mortality rates per 100 000 persons, where the weights are the proportions of persons in the corresponding age groups of the WHO standard population.
Rationale The numbers of deaths per 100 000 population are influenced by the age distribution of the population. Two populations with the same age-specific mortality rates for a particular cause of death will have different overall death rates if the age distributions of their populations are different. Age-standardized mortality rates adjust for differences in the age distribution of the population by applying the observed age-specific mortality rates for each population to a standard population.
Metadata http://apps.who.int/gho/indicatorregistry/App_Main/view_indicator.aspx?iid=78
Probability of dying between exact ages 30 and 70 from any of cardiovascular disease, cancer,
diabetes, or chronic respiratory (%)
Definition Per cent of 30-year-old-people who would die before their 70th birthday from any of cardiovascular disease, cancer, diabetes, or chronic respiratory disease, assuming that s/he would experience current mortality rates at every age and s/he would not die from any other cause of death (e.g., injuries or HIV/AIDS).
Rationale Disease burden from non-communicable diseases (NCDs) among adults - the most economically produc-tive age span - is rapidly increasing in developing countries due to ageing and health transitions. Meas-uring the risk of dying from target NCDs is important to assess the extent of burden from mortality due NCDs in a population. This indicator has been selected to measure NCD mortality for the “25 by 25” NCD mortality target (see links below).
Metadata http://apps.who.int/gho/indicatorregistry/App_Main/view_indicator.aspx?iid=3354
6. Key determinants6.1. Risk factors for health
http://www.aho.afro.who.int/en/data-statistics/risk-factors-health-0
Prevalence of current tobacco use among adults aged ≥ 15 years (%)
Definition Current smoking of any tobacco product prevalence estimates, resulting from the latest adult tobacco use survey (or survey which asks tobacco use questions), which have been adjusted according to the WHO regression method for standardising described in the Method of Estimation below. “Tobacco smoking” includes cigarettes, cigars, pipes or any other smoked tobacco products. “Current smoking” includes both daily and non-daily or occasional smoking.
Rationale The prevalence of current tobacco smoking among adults is an important measure of the health and economic burden of tobacco, and provides a baseline for evaluating the effectiveness of tobacco control programmes over time. While a more general measure of tobacco use (including both smoked and smoke-less products) would be ideal, data limitations restrict the present indicator to smoked tobacco. Adjusted and age-standardized prevalence rates are constructed solely for the purpose of comparing tobacco use prevalence estimates across multiple countries or across multiple time periods for the same country. These rates should not be used to estimate the number of smokers in the population.
Metadata http://www.aho.afro.who.int/en/data-statistics/prevalence-current-tobacco-use-among-adults-aged-%E2%89%A5-15-years
190
Prevalence of raised total cholesterol (≥ 240 mg/dl)
Definition Percentage of defined population with total cholesterol ≥ 240 mg/dl (6.2 mmol/l).
Metadata http://www.aho.afro.who.int/en/data-statistics/prevalence-raised-total-cholesterol-among-adults-aged-%E2%89%A5-25-years
Prevalence of raised blood pressure (SBP≥140 OR DBP≥90)
Definition Percent of defined population with raised blood pressure (systolic blood pressure ≥ 140 OR diastolic blood pressure ≥ 90).
Metadata http://www.aho.afro.who.int/en/data-statistics/prevalence-raised-blood-pressure-among-adults-aged-%E2%89%A5-25-years
Prevalence of raised fasting blood glucose
Definition Percent of defined population with fasting glucose ≥126 mg/dl (7.0 mmol/l) or on medication for raised blood glucose.
Metadata http://www.aho.afro.who.int/en/data-statistics/prevalence-raised-fasting-blood-glucose-among-adults-aged-%E2%89%A5-25-years
Total alcohol per capita (15+ years) consumption of pure alcohol
Definition Total APC is defined as the total (sum of recorded APC three-year average and unrecorded APC) amount of alcohol consumed per adult (15+ years) over a calendar year, in litres of pure alcohol. Recorded alcohol con-sumption refers to official statistics (production, import, export, and sales or taxation data), while the unrecord-ed alcohol consumption refers to alcohol which is not taxed and is outside the usual system of governmental control. In circumstances in which the number of tourists per year is at least the number of inhabitants, the tourist consumption is also taken into account and is deducted from the country’s recorded APC.
Rationale The total APC comprises both the recorded and the unrecorded APC, which together provide a more ac-curate estimate of the level of alcohol consumption in a country, and as a result, portray trends of alcohol consumption in a more precise way.
Metadata http://www.aho.afro.who.int/en/data-statistics/prevalence-physical-inactivity-among-adults-aged-%E2%89%A5-15-years
Physical inactivity (WPRO)
Definition ADULTS: Prevalence of insufficiently physically active persons aged 18+ years (defined as less than 150 minutes of moderate-intensity activity per week, or equivalent). ADOLESCENTS: Prevalence of insufficient-ly physically active adolescents (defined as less than 60 minutes of moderate to vigorous intensity activity daily). Countries will select the relevant age group for adolescents as per their national context.
Rationale The cut-point of less than 150 minutes of moderate activity per week (or equivalent) was chosen since a vast and strong body of scientific evidence shows that people meeting this threshold have higher levels of health-related fitness, a lower risk profile for developing a number of disabling medical conditions, and lower rates of various chronic NCDs than people who are inactive. This indicator is calculated from age-specific prevalence values of insufficient physical activity. Age standardization is done in order to control differenc-es in population age structure over time and across countries. The lower age limit of 18 years was selected taking into consideration the nature and availability of the scientific evidence relevant to health outcomes.
Metadata http://www.aho.afro.who.int/en/data-statistics/prevalence-physical-inactivity-among-adults-aged-%E2%89%A5-15-years
6.2. The physical environmenthttp://www.aho.afro.who.int/en/data-statistics/physical-environment
Population using improved drinking-water sources (%)
Definition The percentage of population using an improved drinking water source. An improved drinking water source, by nature of its construction and design, is likely to protect the source from outside contamination, in par-ticular from faecal matter. Improved drinking water sources include: piped water into dwelling, plot or yard; public tap/stand pipe; tube well/borehole; protected dug well; protected spring and rainwater collection. On the other hand, unimproved drinking water sources are: unprotected drug well, unprotected spring, cart with small tank/drum, tanker truck, surface water (river, dam, lake, pond, stream, canal, irrigation channel ad any other surface water), and bottled water (if it is not accompanied by another improved source)
Rationale Access to drinking water and basic sanitation is a fundamental need and a human right vital for the dig-nity and health of all people. The health and economic benefits of improved water supply to households and individuals are well documented. Use of an improved drinking water source is a proxy for the use of safe drinking water.
Metadata http://www.aho.afro.who.int/en/data-statistics/population-using-improved-drinking-water-sources-0
191
Population using improved sanitation facilities (%)
Definition The percentage of population using an improved sanitation facility. An improved sanitation facility is one that likely hygienically separates human excreta from human contact. Improved sanitation facilities in-clude: flush or pour-flush to piped sewer system, septic tank or pit latrine, ventilated improved pit latrine, pit latrine with slab and composting toilet. However, sanitation facilities are not considered improved when shared with other households, or open to public use. while, unimproved sanitation include: flush or pour-flush to elsewhere, pit latrine without slab or open pit, bucket, hanging toilet or hanging latrine and no facilities or bush or field (open defecation) (WHO & UNICEF, 2010.)
Rationale Access to drinking water and basic sanitation is a fundamental need and a human right vital for the dignity and health of all people. The health and economic benefits of improved sanitation facilities to households and individuals are well documented. Use of an improved sanitation facility is a proxy for the use of basic sanitation.
Metadata http://www.aho.afro.who.int/en/data-statistics/population-using-improved-sanitation
Population living in urban areas (%)
Definition The percentage of de facto population living in areas classified as urban according to the criteria used by each area or country as of 1 July of the year indicated.
Metadata http://www.aho.afro.who.int/en/data-statistics/population-living-urban-areas
Population using solid fuels (%)
Definition The percentage of the population that relies on solid fuels as the primary source of domestic energy for cooking and heating.
Rationale The use of solid fuels in households is associated with increased mortality from pneumonia and other acute lower respiratory diseases among children, as well as increased mortality from chronic obstructive pulmonary disease, cerebrovascular and ischaemic heart diseases, and lung cancer among adults.
Metadata http://www.aho.afro.who.int/en/data-statistics/population-using-solid-fuels
6.3. Nutritionhttp://www.aho.afro.who.int/en/data-statistics/food-safety-and-nutrition
Children aged <5 years underweight (%)
Definition Percentage of underweight (weight-for-age less than -2 standard deviations of the WHO Child Growth Standards median) among children aged 0-5 years.
Rationale This indicator belongs to a set of indicators whose purpose is to measure nutritional imbalance and malnutrition resulting in undernutrition (assessed by underweight, stunting and wasting) and overweight. Child growth is the most widely used indicator of nutritional status in a community and is internationally recognized as an important public-health indicator for monitoring health in populations. In addition, chil-dren who suffer from growth retardation as a result of poor diets and/or recurrent infections tend to have a greater risk of suffering illness and death.
Metadata http://www.aho.afro.who.int/en/data-statistics/children-aged-under-5-years-underweight
Children aged <5 years stunted (%)
Definition Percentage of stunting (height-for-age less than -2 standard deviations of the WHO Child Growth Stand-ards median) among children aged 0-5 years
Rationale This indicator belongs to a set of indicators whose purpose is to measure nutritional imbalance and malnutrition resulting in undernutrition (assessed by underweight, stunting and wasting) and overweight. Child growth is the most widely used indicator of nutritional status in a community and is internationally recognized as an important public-health indicator for monitoring health in populations. In addition, chil-dren who suffer from growth retardation as a result of poor diets and/or recurrent infections tend to have a greater risk of suffering illness and death.
Metadata http://www.aho.afro.who.int/en/data-statistics/children-aged-under-5-years-stunted
Children aged <5 years wasted (%)
Definition Percentage of (weight-for-height less than -2 standard deviations of the WHO Child Growth Standards median) among children aged 0-5 years
Rationale This indicator belongs to a set of indicators whose purpose is to measure nutritional imbalance and mal-nutrition resulting in undernutrition (assessed by underweight, stunting and wasting) and overweight
Metadata http://apps.who.int/gho/data/node.main.55?lang=en
Children aged <5 years overweight (%)
Definition Percentage of overweight (weight-for-height above +2 standard deviations of the WHO Child Growth Standards median) among children aged 0-5 years
Rationale This indicator belongs to a set of indicators whose purpose is to measure nutritional imbalance and malnutrition resulting in undernutrition (assessed by underweight, stunting and wasting) and overweight. Child growth is the most widely used indicator of nutritional status in a community and is internationally
192

recognized as an important public-health indicator for monitoring health in populations. In addition, chil-dren who suffer from growth retardation as a result of poor diets and/or recurrent infections tend to have a greater risk of suffering illness and death.
Metadata http://www.aho.afro.who.int/en/data-statistics/children-aged-under-5-years-overweight
6.4. Social determinants
http://www.aho.afro.who.int/en/data-statistics/social-determinants
Demography
Total fertility rate (per woman)
Definition The average number of children a hypothetical cohort of women would have at the end of their reproduc-tive period if they were subject during their whole lives to the fertility rates of a given period and if they were not subject to mortality. It is expressed as children per woman.
Metadata http://www.aho.afro.who.int/en/data-statistics/annual-growth-rate-population
Annual population growth rate (%)
Definition Average exponential rate of annual growth of the population over a given period.
Metadata http://www.aho.afro.who.int/en/data-statistics/annual-growth-rate-population
Age distribution of the population (%)
Definition The percentage of de facto population aged 0-14 years in a country, area or region as of 1 July of the year indicated. The percentage of de facto population aged 15-59 years in a country, area or region as of 1 July of the year indicated. The percentage of de facto population aged 60 years and older in a country, area or region as of 1 July of the year indicated.
Metadata http://www.aho.afro.who.int/en/data-statistics/age-distribution-population
Resources and infrastructure
Gross national income per capita (PPP int. $)
Definition GNI is gross national income (GNI) converted to international dollars using purchasing power parity rates. An international dollar has the same purchasing power over GNI as a U.S. dollar has in the United States. GNI is the sum of value added by all resident producers plus any product taxes (less subsidies) not included in the valuation of output plus net receipts of primary income (compensation of employees and property income) from abroad. Data are in current international dollars based on the 2011 ICP round.
Metadata http://www.aho.afro.who.int/en/data-statistics/gross-national-income-capita-ppp-int
Poverty and income inequality
Population living on <$1 (PPP int. $) a day (%)
Definition The poverty rate at $1.25 a day is the proportion of the population living on less than $1.25 a day, meas-ured at 2005 international prices, adjusted for purchasing power parity (PPP). Purchasing power parities (PPP) conversion factor, private consumption, is the number of units of a country’s currency required to buy the same amount of goods and services in the domestic market as a U.S. dollar would buy in the Unit-ed States. This conversion factor is applicable to private consumption.
Rationale The $1.25 a day poverty line – the critical threshold value below which an individual or household is de-termined to be poor -- corresponds to the value of the poverty lines in the poorest countries (the poorest countries are determined by international rank of GNI per capita in PPP terms). This threshold is a measure of extreme poverty that allows for comparisons across countries when converted using PPP exchange rates for consumption. In addition, poverty measures based on an international poverty line attempt to hold the real value of the poverty line constant over time allowing for accurate assessments of progress toward meeting the goal of eradicating extreme poverty and hunger.
Metadata http://www.aho.afro.who.int/en/data-statistics/percentage-share-income-or-consumption
Gender equity
Female and male gross enrolment ratio by education level
Definition Number of students enrolled in primary, secondary and tertiary levels of education, regardless of age, as percentage of the population of official school age for the three levels. The gross enrolment ratio can be greater than 100% as a result of grade repetition and entry at ages younger or older than the typical age at that grade level (UNDP definition).
Metadata http://www.aho.afro.who.int/en/data-statistics/female-and-male-gross-enrolment-ratio-education-level
193
Percentage of seats held by women in national parliaments
Definition Percentage of parliamentary seats in Single or Lower chamber occupied by women
Rationale Gender indicator
Metadata http://www.aho.afro.who.int/en/data-statistics/percentage-seats-held-women-national-parliaments
Education
Adult literacy rate (percentage aged ≥ 15 years)
Definition The percentage of population aged 15 years and over who can both read and write with understanding a short simple statement on his/her everyday life. Generally, ‘literacy’ also encompasses ‘numeracy’, the ability to make simple arithmetic calculations.
Metadata http://www.aho.afro.who.int/en/data-statistics/adult-literacy-rate-percentage-aged-%E2%89%A5-15-years
Youth literacy rate (percentage aged 15-24 years)
Definition Population and number of literates (or illiterates) aged 15 to 24 years old. Percentage of people aged 15 to 24 years who can both read and write with understanding a short simple statement on their everyday life. Generally, ‘literacy’ also encompasses ‘numeracy’, the ability to make simple arithmetic calculations. A high literacy rate among the 15 to 24 years old suggests a high level of participation and retention in primary education, and its effectiveness in imparting the basic skills of reading and writing. Because persons belonging to this age group are entering adult life, monitoring their literacy levels is important with respect to national human resources policies, as well as for tracking and forecasting progress in adult literacy. Some countries apply definitions and criteria for literacy which are different from the international standards defined above, or equate persons with no schooling to illiterates, or change definitions between censuses. Practices for identifying literates and illiterates during actual census enumeration may also vary. Errors in literacy self-declaration can affect the reliability of the statistics.
Rationale The youth literacy rate reflects the outcomes of the primary education system over the previous 10 years, and is often seen as a proxy measure of social progress and economic achievement.
Metadata http://www.aho.afro.who.int/en/data-statistics/capita-official-development-received-us
Global partnerships and financial flows
Per capita official development received (US$)
Definition Net official development assistance (ODA) per capita consists of disbursements of loans made on conces-sional terms (net of repayments of principal) and grants by official agencies of the members of the Devel-opment Assistance Committee (DAC), by multilateral institutions, and by non-DAC countries to promote economic development and welfare in countries and territories in the DAC list of ODA recipients; and is calculated by dividing net ODA received by the midyear population estimate. It includes loans with a grant element of at least 25 percent (calculated at a rate of discount of 10 percent).
Metadata http://www.aho.afro.who.int/en/data-statistics/capita-official-development-received-us
Official development assistance received as percentage of GNI
Definition Net official development assistance (ODA) consists of disbursements of loans made on concessional terms (net of repayments of principal) and grants by official agencies of the members of the Development Assistance Committee (DAC), by multilateral institutions, and by non-DAC countries to promote economic development and welfare in countries and territories in the DAC list of ODA recipients. It includes loans with a grant element of at least 25 percent (calculated at a rate of discount of 10 percent).
Metadata http://www.aho.afro.who.int/en/data-statistics/official-development-assistance-received-percentage-gni
Total debt service as percentage of GNI
Definition Total debt service is the sum of principal repayments and interest actually paid in currency, goods, or services on long-term debt, interest paid on short-term debt, and repayments (repurchases and charges) to the IMF.
Metadata http://www.aho.afro.who.int/en/data-statistics/total-external-debt-stocks-current-us
Total external debt stocks (Current US$)
Definition Total external debt is debt owed to nonresidents repayable in currency, goods, or services. Total external debt is the sum of public, publicly guaranteed, and private nonguaranteed long-term debt, use of IMF credit, and short-term debt. Short-term debt includes all debt having an original maturity of one year or less and interest in arrears on long-term debt. Data are in current U.S. dollars.
Metadata http://www.aho.afro.who.int/en/data-statistics/total-external-debt-stocks-current-us
194
Science and technology
Percentage of population who are cellular or mobile subscribers
Definition The number of mobile cellular subscriptions is divided by the country’s population and multiplied by 100. A mobile cellular subscription refers to the subscription to a public mobile cellular service which provides access to the Public Switched Telephone Network (PSTN) using cellular technology. It includes postpaid and prepaid subscriptions and includes analogue and digital cellular systems. This should also include subscriptions to IMT-2000 (Third Generation, 3G) networks.
Metadata http://www.aho.afro.who.int/en/data-statistics/percentage-population-who-are-cellular-or-mobile-sub-scribers
Population who are telephone (fixed and mobile) subscribers (%)
Definition Fixed telephone lines refer to telephone lines connecting a customer’s terminal equipment (e.g. telephone set, facsimile machine) to the public switched telephone network (PSTN) and which have a dedicated port on a telephone exchange. A fixed line has traditionally referred to the connection - typically a copper wire - from a subscriber to the telephone company’s switching exchange.
Metadata http://www.aho.afro.who.int/en/data-statistics/population-who-are-telephone-fixed-and-mobile-sub-scribers
Percentage of the population who are Internet users
Definition An Internet user is someone who access to the Internet (a TCP/IP connection).
Metadata http://www.aho.afro.who.int/en/data-statistics/percentage-population-who-are-internet-users
Emergencies and disasters
Total number of refugees
Metadata http://www.unhcr.org/statistics/Ref_1960_2013.zip
195
References
The following data sources have been used in the compilation of the Atlas:
Institute for Health Metrics and Evaluation (IHME)
GHDx, the Global Health Data Exchange
http://ghdx.healthdata.org/
Global Burden of Disease Study 2013 (GBD 2013) – Data Downloads
http://ghdx.healthdata.org/global-burden-disease-study-2013-gbd-2013-data-downloads
International Agency for Research on Cancer (IARC)
Cancer mondial
http://www-dep.iarc.fr/
GLOBOCAN 2012: Estimated cancer incidence, mortality and prevalence worldwide in 2012
http://globocan.iarc.fr
International Health Partnership (ihp+)
The IHP+ Global Compact for achieving the health Millennium Development Goals
http://www.internationalhealthpartnership.net/en/tools/global-compact/
International Telecommunication Union (ITU)
Statistics
http://www.itu.int/en/ITU-D/Statistics/Pages/stat/default.aspx
Office of the United Nations High Commissioner for Refugees (UNHCR)
UNHCR Population Statistics Database
http://popstats.unhcr.org/en/overview
UNAIDS
AIDSinfo
http://aidsinfo.unaids.org/
UNICEF
UNICEF Statistics and Monitoring
http://www.unicef.org/statistics/
UNICEF data: monitoring the situation of women and children
http://data.unicef.org/index-2.html
The State of the World’s Children 2015
http://data.unicef.org/resources/the-state-of-the-worlds-children-report-2015.html
United Nations. Department of Economic and Social Affairs. Population Division
World population prospects, the 2015 revision – Data files
http://esa.un.org/unpd/wpp/Download/Standard/Population/
United Nations Inter-agency Group for Child Mortality Estimation (IGME)
Child Mortality Estimates (CME Info)
http://www.childmortality.org/
United Nations Maternal Mortality Estimation Inter-agency Group (MMEIG)
http://www.maternalmortalitydata.org/
196
The World Bank
World Bank Open Data
http://data.worldbank.org/
World Health Organization (WHO)
Global Health Observatory (GHO) – Data repository
http://apps.who.int/gho/data/view.main ; http://apps.who.int/gho/data/node.
main.1?lang=en
Global Reference List of 100 Core Health Indicators, 2015
http://www.who.int/entity/healthinfo/indicators/2015/en/index.html
Malaria – Data and statistics
http://www.who.int/malaria/data/en/
WHO country offices in the WHO African Region
http://www.afro.who.int/en/countries.html
WHO global health estimates
http://www.who.int/healthinfo/global_burden_disease/en/
WHO global TB database
http://www.who.int/tb/country/data/download/en/
197