Embed Size (px)
Citation preview

Draft version 10
ATLAS CSC NOTE 10
August 14, 2008
Sensitivity to an invisibly decaying Higgs boson with ATLAS data
P. Gagnon, R. Goncalo, G. Hanninger, A. Ludwig, W. Mader, G. Oakham, M. Schram, S. Subramania
Abstract
Many extensions of the Standard Model include Higgs bosons decaying predominantlyor partially to non-interacting particles such as the SUSY Lightest Supersymmetric Particle(LSP). To set limits on the production cross-section times the branching fraction to invisibledecay products of such Higgs bosons with the ATLAS detector requires an examination ofspecific production modes such as the associated production(ZH) or the vector boson fu-sion (VBF) process. The predominant Standard Model backgrounds for these processes areZZ → ℓℓνν for the ZH channel and jets from QCD processes andW± or Z bosons pro-duced in association with jets for the VBF channel. The sensitivity to an invisibly decayingHiggs boson is investigated in this paper using fully simulated ATLAS data for both signaland background. The ATLAS potential for triggering these events is also discussed.
August 14, 2008 – 10 : 30 DRAFT 2
1 Introduction
Some extensions of the Standard Model predict that Higgs bosons could decay into stable neutral weaklyinteracting particles, leading to invisible Higgs boson decays. The Higgs boson decay products couldbe for example neutralinos, gravitinos, gravitons or Majorons [1-3]. In the case of the Minimal Su-persymmetric Standard Model (MSSM), if R-parity is conserved, Higgs bosons decaying into a pair ofneutralinos may in some cases even dominate [1]. Being the lightest supersymmetric particles, neutrali-nos would be stable and would leave the detector without decaying, remaining invisible. If R-parity isviolated, then Higgs bosons could decay into Majorons, which would interact too weakly to allow detec-tion [2]. Some theories with extra dimensions also predict invisible Higgs boson decays, and have theadded advantage of generating neutrino masses [3]. This search is sensitive to any boson coupling to Zor W and decaying invisibly. The combined LEP Higgs boson mass limit in this channel is 114.4 GeV[4].
At the Large Hadron Collider, Higgs boson production could occur through several mechanisms.To select and identify events with an invisibly decaying Higgs boson one must be able to trigger on asignature that is visible in the event. This is possible for channels such as Vector Boson Fusion (VBF)qqH [5], ttH [6] and the associated production processes,ZH andW±H [7, 8]. Although gluon fusionhas a much higher Higgs boson production cross-section thanthese modes [9], it is not possible to triggeron these events when the Higgs boson decays invisibly.
In this paper, the ATLAS sensitivity to an invisibly decaying Higgs boson is determined in a way thatdoes not depend on a specific extension of the Standard Model.The analysis uses the variableξ 2 whichis defined as,
ξ 2 = BR(H → inv.)σBSM
σSM(1)
whereσBSM represents the “Beyond the Standard Model” cross-section and σSM represents the StandardModel cross-section. In the case for which the Higgs boson decays entirely to the invisible mode,ξ 2
is the ratio between the non-Standard Model cross-section and the Standard Model cross-section. Onlytwo of the three possible production modes are considered inthis paper, VBF and associated production.In addition, for associated production, only theZH mode is considered as the background to theW±Hsignal is overwhelming [10].
In this paper, the Monte Carlo samples, for both the VBF and the ZH channels, the trigger, the eventselection, the systematic uncertainties and the results are discussed. We conclude by summarizing thelimits on ξ 2 for an invisibly decaying Higgs boson.
This analysis compares signals and backgrounds that have been generated using Standard Modelprocesses. The Higgs boson signal events are simulated to beinvisible by changing the properties of theHiggs boson decay chain. In reality an invisibly decaying Higgs boson would be expected to result froma process not contained within the Standard Model, and in this case backgrounds associated with this newphysics would be important. However, consideration of “Beyond the Standard Model” backgrounds isbeyond the scope of this paper as they would have to be considered in the context of each specific model.This analysis assumes Standard Model backgrounds and serves as a limiting case for the indication of aparticle that behaves like a Higgs boson that is not consistent with the Standard Model.
2 The Vector Boson Fusion qqH production channel
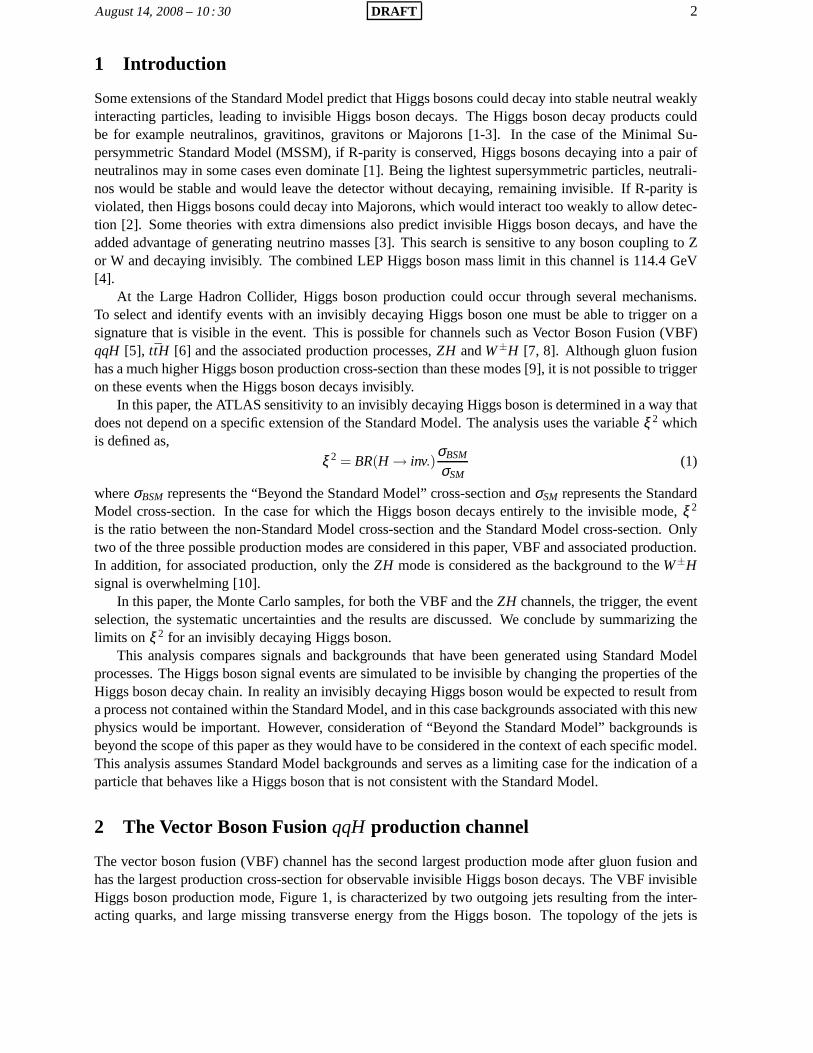
The vector boson fusion (VBF) channel has the second largestproduction mode after gluon fusion andhas the largest production cross-section for observable invisible Higgs boson decays. The VBF invisibleHiggs boson production mode, Figure 1, is characterized by two outgoing jets resulting from the inter-acting quarks, and large missing transverse energy from theHiggs boson. The topology of the jets is
August 14, 2008 – 10 : 30 DRAFT 3
particularly useful in selecting the events as the jets are preferentially separated in pseudo-rapidity (η)and are correlated in the azimuthal angleφ . In addition, the lack of colour flow between the two jets leadsto minimal jet activity between the two tagging jets which ispotentially useful for selecting events. Athigh luminosity however, central jet activity resulting from overlapping events may become problematicfor cuts based on this event characteristic.
Figure 1: Feynman diagram of the VBF process. The V represents either a Z or W boson.
The study of the VBF channel for this paper includes a mass scan with an estimate of the sensitivity toHiggs boson masses between 110 to 250 GeV. This is based on fully reconstructed signal and backgroundevents. In addition to the sensitivity, the trigger acceptance for this channel has been investigated.
2.1 Monte Carlo generation for the VBF analysis
Signal and background samples were generated using the standard version of ATLAS software used forthis set of papers. The samples were used to determine the sensitivity of ATLAS to an invisible Higgsboson, taking into account the trigger and analysis efficiencies. A number of backgrounds with signaturessimilar to the signal have been studied and are listed here. In all cases,ℓ representse or µ .
1. Dijet production from QCD processes form a major background due to the very large cross-sectionfor these processes. Fake missing energy measurements can arise from poorly instrumented re-gions or inefficiencies in the detector.
2. W+jet processes withW → ℓν mimic the signal when the lepton is outside the detector acceptance.The neutrino provides the missing energy signature.
3. Z+jet processes withZ → νν constitute an irreducible background.
4. Z+jet withZ → ℓℓ forms a background to the signal when the leptons are not within the acceptanceof the detector.
Event generation for the VBF channel has proved challenginggiven that the predictedη distributionsof tagging jets differ greatly according to the event simulation model used. The HERWIG-JIMMYpackage [11], [12], [13] represents an average response of the available models and has been used togenerate data for the Higgs boson mass scan. Signal events have been generated with both HERWIGand PYTHIA [14] at a Higgs boson mass of 130 GeV to estimate thecontribution of this effect to thesystematic uncertainty. To generate an invisible Higgs boson sample, the Higgs boson is forced to decayinto two Z bosons which are subsequently forced to decay intoneutrinos. The set of data samplesproduced for this analysis is summarized in Table 1. The VBF signal Monte-Carlo was produced toleading order. The difference between LO and NLO cross-section is negligible,∼ 1%[9], therefore the
August 14, 2008 – 10 : 30 DRAFT 4
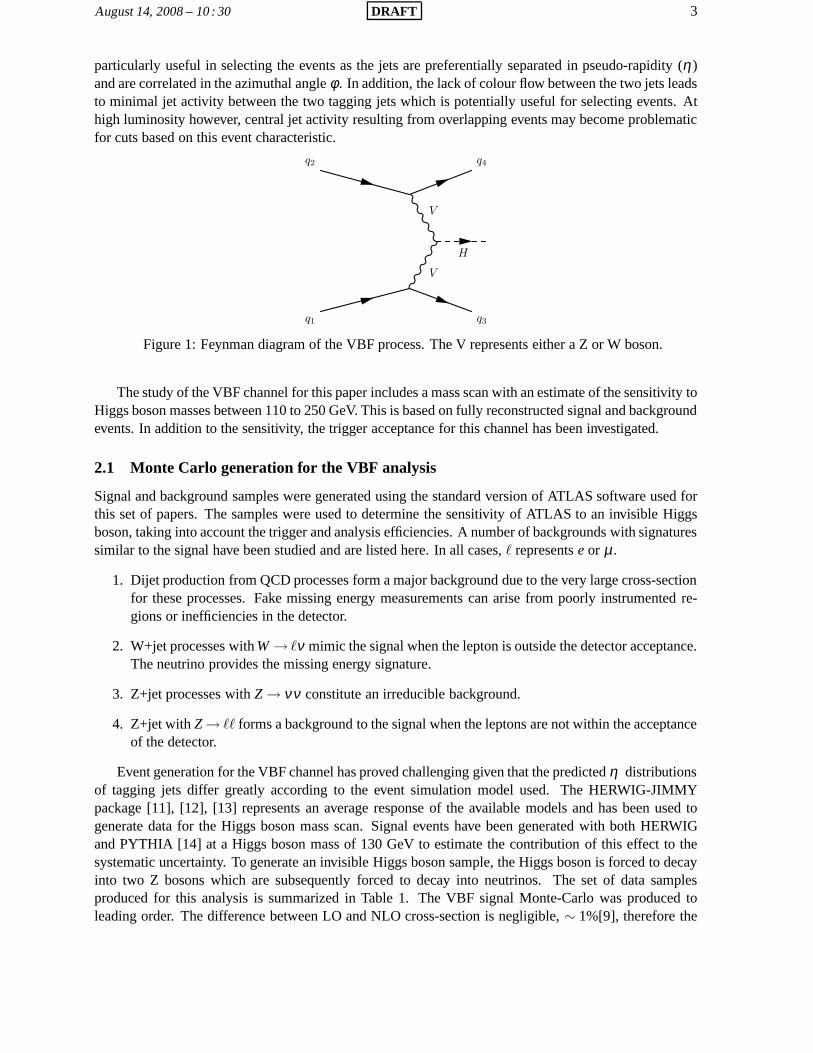
Higgs boson Mass [GeV ] Cross-section [pb] # Events Generator
110 4.63 10k JIMMY130 3.96 30k JIMMY130 3.93 10k PYTHIA6.4200 2.41 10k JIMMY250 1.79 10k JIMMY
Table 1: Invisible Higgs boson samples generated for this analysis. Leading-order cross-sectionsfor the Higgs boson produced via Vector Boson Fusion were evaluated by the ATLAS HiggsWorking group [15].
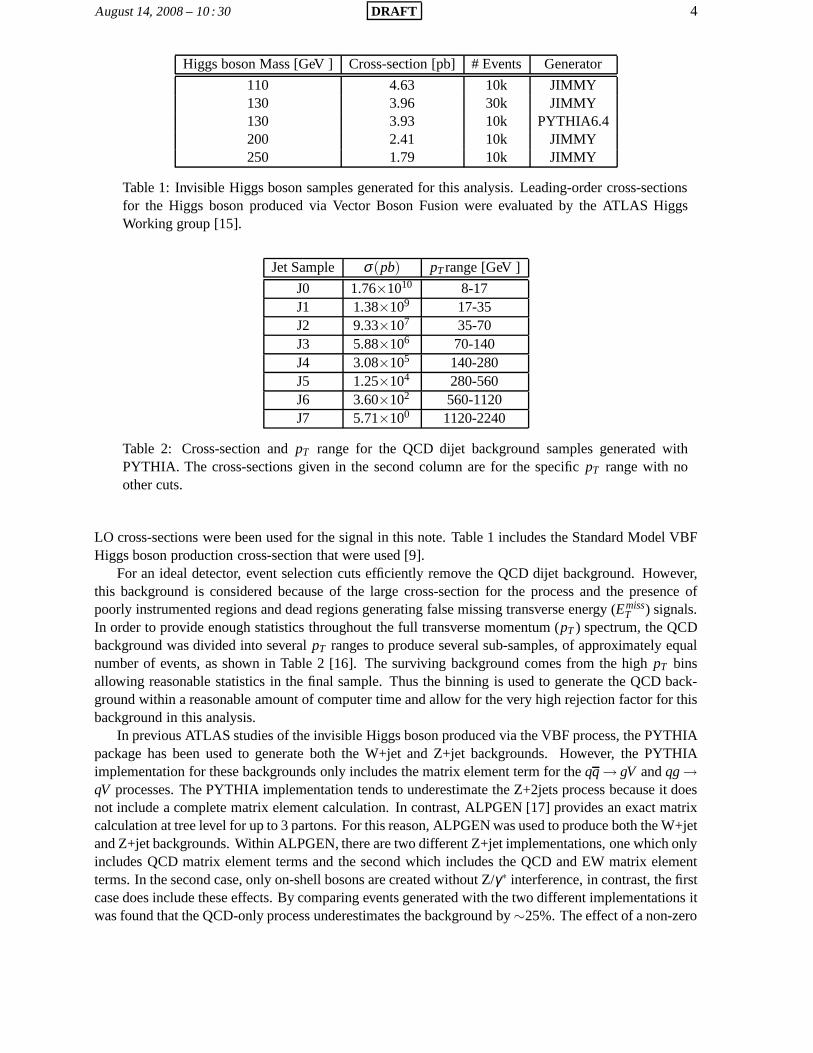
Jet Sample σ(pb) pT range [GeV ]
J0 1.76×10¹⁰ 8-17J1 1.38×10⁹ 17-35J2 9.33×10⁷ 35-70J3 5.88×10⁶ 70-140J4 3.08×10⁵ 140-280J5 1.25×10⁴ 280-560J6 3.60×10² 560-1120J7 5.71×100 1120-2240
Table 2: Cross-section andpT range for the QCD dijet background samples generated withPYTHIA. The cross-sections given in the second column are for the specificpT range with noother cuts.
LO cross-sections were been used for the signal in this note.Table 1 includes the Standard Model VBFHiggs boson production cross-section that were used [9].
For an ideal detector, event selection cuts efficiently remove the QCD dijet background. However,this background is considered because of the large cross-section for the process and the presence ofpoorly instrumented regions and dead regions generating false missing transverse energy (Emiss
T ) signals.In order to provide enough statistics throughout the full transverse momentum (pT ) spectrum, the QCDbackground was divided into severalpT ranges to produce several sub-samples, of approximately equalnumber of events, as shown in Table 2 [16]. The surviving background comes from the highpT binsallowing reasonable statistics in the final sample. Thus thebinning is used to generate the QCD back-ground within a reasonable amount of computer time and allowfor the very high rejection factor for thisbackground in this analysis.
In previous ATLAS studies of the invisible Higgs boson produced via the VBF process, the PYTHIApackage has been used to generate both the W+jet and Z+jet backgrounds. However, the PYTHIAimplementation for these backgrounds only includes the matrix element term for theqq → gV andqg →qV processes. The PYTHIA implementation tends to underestimate the Z+2jets process because it doesnot include a complete matrix element calculation. In contrast, ALPGEN [17] provides an exact matrixcalculation at tree level for up to 3 partons. For this reason, ALPGEN was used to produce both the W+jetand Z+jet backgrounds. Within ALPGEN, there are two different Z+jet implementations, one which onlyincludes QCD matrix element terms and the second which includes the QCD and EW matrix elementterms. In the second case, only on-shell bosons are created without Z/γ∗ interference, in contrast, the firstcase does include these effects. By comparing events generated with the two different implementations itwas found that the QCD-only process underestimates the background by∼25%. The effect of a non-zero
August 14, 2008 – 10 : 30 DRAFT 5
Z boson width was checked by varying the Z boson mass. This showed that the result was insensitive tothe use of on-shell bosons. Therefore, all ALPGEN samples used in this study were generated using theoption that included both QCD+EW terms.
For the Z+jet background, three samples were produced for each of the two decay modes,Z → νν andZ → ℓℓ. Two exclusive samples were produced for the one and two parton final states and one inclusivesample was produced for three or more partons. Default ALPGEN settings were used to generate eventsexcept for a cut to remove very lowEmiss
T events by settingEmissT > 10 GeV and a change in acceptance
to ensure completeη coverage by opening the phase space setting for both jets andleptons (|η j|< 6 and|ηℓ| < 6).
In this study, only the leptonic decay of the W boson from the W+jet background was considered.TheEmiss
T arises from a combination of theEmissT associated with the neutrino and the lepton energy in
the case where the lepton escapes detection. The W+jet background was generated in the same manneras for the Z+jet background.
2.2 Trigger
The major challenge for triggering candidate events for theVBF invisible Higgs boson analysis is toretain signal events whilst reducing the very large QCD background to an acceptable level. These prob-lems are particularly acute with the first level trigger (L1)which can easily be overwhelmed by the QCDbackground. A trigger for these signal events is possible using a relatively highEmiss
T cut while selectingone or two jets of moderate transverse energy. For triggers of this type, QCD backgrounds dominate.In order to produce an acceptable rate for the High Level Trigger (HLT), the trigger menu items used toselect invisible Higgs boson events should add no more than afew Hz of trigger rate, even at the highestluminosities.
The trigger study of this note is based on the standard full ATLAS simulation of the L1 trigger.The HLT has not been considered, as at the time of the study HLTalgorithms forEmiss
T had not beenfully implemented and there had been no simulation of forward jets. Jets are classified into central jets|η | < 3.2 and forward jets 3.2 < |η | < 5.
Data for the trigger study consisted of the sample of VBF Invisible Higgs boson events with a Higgsboson mass of 130 GeV produced using HERWIG and a sample of QCDdijet produced using PYTHIAas described in Section 2.1. The results of this study are shown in Table 3 for 1031 cm−2 s−1 luminosity.The acceptances shown in Table 3 give the effect of the trigger on the VBF Higgs boson samples usedin the VBF analysis. As such the acceptance is defined as the number of signal events that survive boththe trigger and the data selection cuts described in Section2.3.1, divided by the number of events thatsurvive the selection cuts alone. The trigger rates in Table3 are the expected raw rates for the specifictrigger. One expects an overlap with other trigger signatures such that the additional rate produced bythese signatures will be less than the calculated raw rates.
The numbers given in Table 3 are the best estimation we currently have of the trigger rates. In realitybeam conditions and detector effects could lead to much higher values. It is clear that the trigger strategywill depend on these background effects and on the luminosity. At low luminosities, (1031 cm−2 s−1) itis likely that a simple trigger based onEmiss
T alone such asEmissT > 70 GeV (L1XE70) will be sufficient.
However if the trigger rate for this item is higher than expected, VBF invisible Higgs boson eventscould still be triggered using a higherEmiss
T trigger such asEmissT > 80 GeV (L1XE80) orEmiss
T > 100GeV (L1 XE100) whichever one can be used without pre-scaling. As theluminosity increases or ifbackgrounds are worse than expected, it will be necessary touse a combined trigger for this channel.The numbers in Table 3 suggest that triggers based onEmiss
T and either a forward or central jet would besufficient. However the addition of a single jet to anEmiss
T trigger provides a relatively small reduction inrate due to correlations that can occur when high energy jetsare mis-measured. There is concern that thiscould be amplified by pile-up effects. Requiring a forward jet plus a central jet plusEmiss
T is expected to
August 14, 2008 – 10 : 30 DRAFT 6
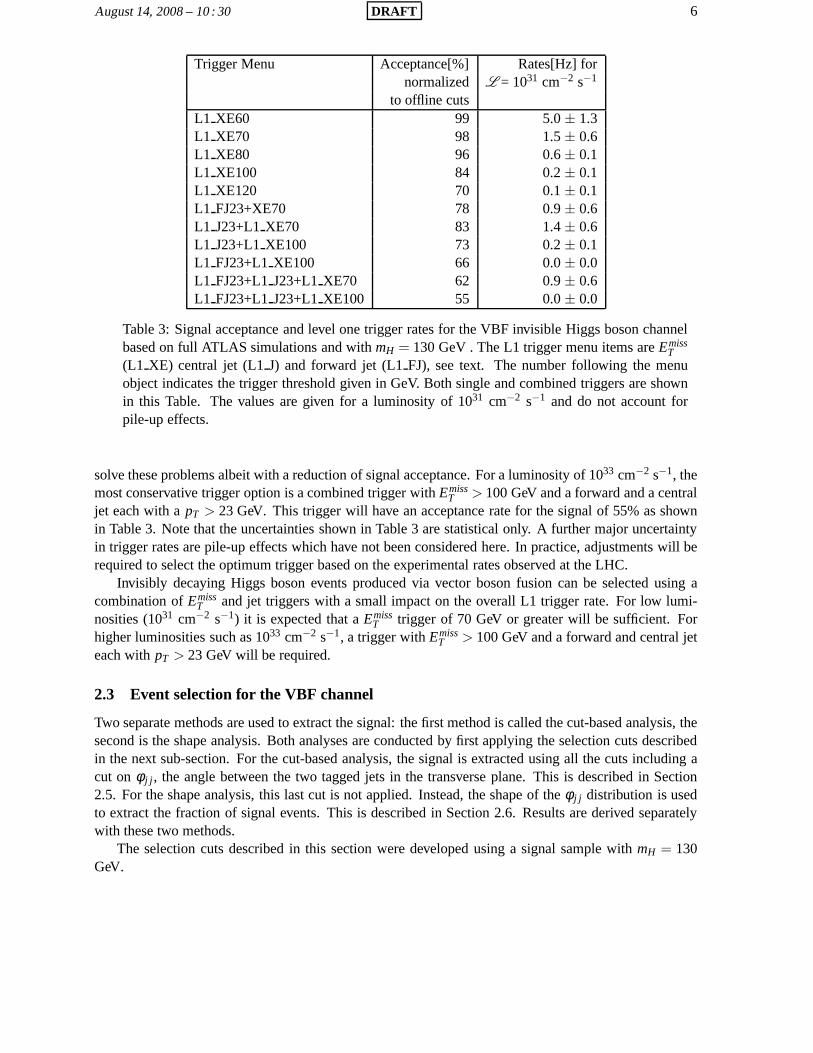
Trigger Menu Acceptance[%] Rates[Hz] fornormalized L = 1031 cm−2 s−1
to offline cutsL1 XE60 99 5.0± 1.3L1 XE70 98 1.5± 0.6L1 XE80 96 0.6± 0.1L1 XE100 84 0.2± 0.1L1 XE120 70 0.1± 0.1L1 FJ23+XE70 78 0.9± 0.6L1 J23+L1XE70 83 1.4± 0.6L1 J23+L1XE100 73 0.2± 0.1L1 FJ23+L1XE100 66 0.0± 0.0L1 FJ23+L1J23+L1XE70 62 0.9± 0.6L1 FJ23+L1J23+L1XE100 55 0.0± 0.0
Table 3: Signal acceptance and level one trigger rates for the VBF invisible Higgs boson channelbased on full ATLAS simulations and withmH = 130 GeV . The L1 trigger menu items areEmiss
T(L1 XE) central jet (L1J) and forward jet (L1FJ), see text. The number following the menuobject indicates the trigger threshold given in GeV. Both single and combined triggers are shownin this Table. The values are given for a luminosity of 1031 cm−2 s−1 and do not account forpile-up effects.
solve these problems albeit with a reduction of signal acceptance. For a luminosity of 1033 cm−2 s−1, themost conservative trigger option is a combined trigger withEmiss
T > 100 GeV and a forward and a centraljet each with apT > 23 GeV. This trigger will have an acceptance rate for the signal of 55% as shownin Table 3. Note that the uncertainties shown in Table 3 are statistical only. A further major uncertaintyin trigger rates are pile-up effects which have not been considered here. In practice, adjustments will berequired to select the optimum trigger based on the experimental rates observed at the LHC.
Invisibly decaying Higgs boson events produced via vector boson fusion can be selected using acombination ofEmiss
T and jet triggers with a small impact on the overall L1 triggerrate. For low lumi-nosities (1031 cm−2 s−1) it is expected that aEmiss
T trigger of 70 GeV or greater will be sufficient. Forhigher luminosities such as 1033 cm−2 s−1, a trigger withEmiss
T > 100 GeV and a forward and central jeteach withpT > 23 GeV will be required.
2.3 Event selection for the VBF channel
Two separate methods are used to extract the signal: the firstmethod is called the cut-based analysis, thesecond is the shape analysis. Both analyses are conducted byfirst applying the selection cuts describedin the next sub-section. For the cut-based analysis, the signal is extracted using all the cuts including acut onφ j j, the angle between the two tagged jets in the transverse plane. This is described in Section2.5. For the shape analysis, this last cut is not applied. Instead, the shape of theφ j j distribution is usedto extract the fraction of signal events. This is described in Section 2.6. Results are derived separatelywith these two methods.
The selection cuts described in this section were developedusing a signal sample withmH = 130GeV.
August 14, 2008 – 10 : 30 DRAFT 7
2.3.1 Selection cuts
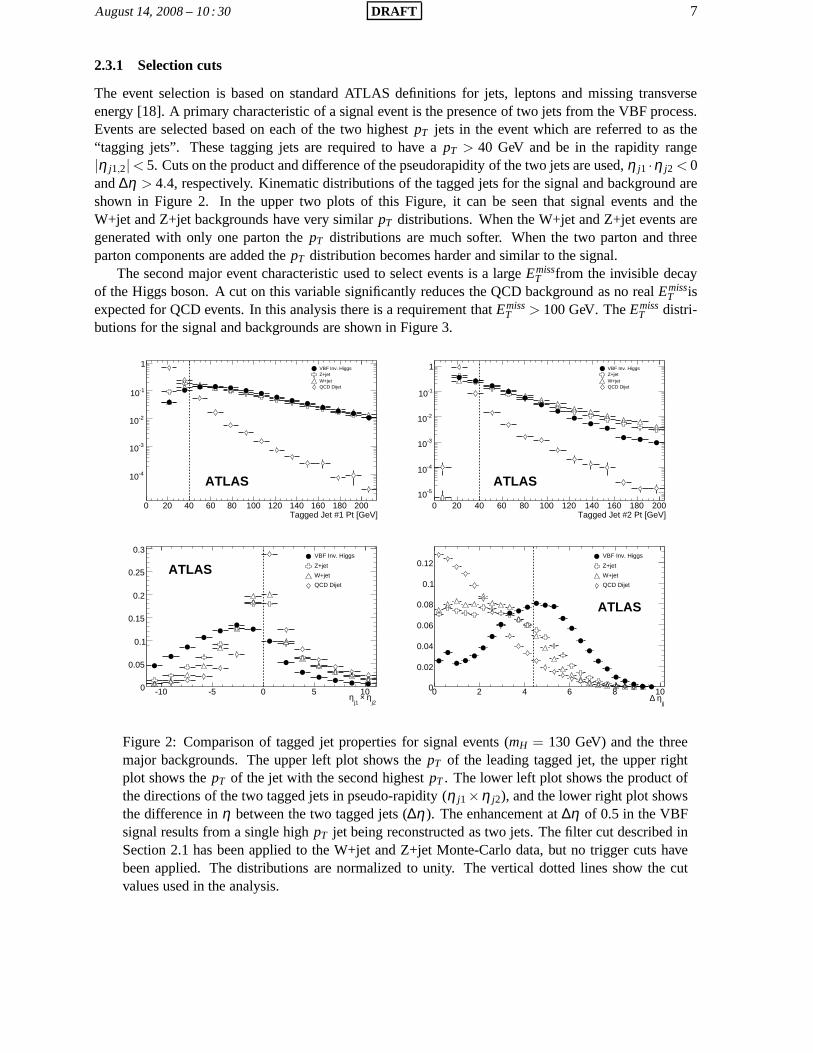
The event selection is based on standard ATLAS definitions for jets, leptons and missing transverseenergy [18]. A primary characteristic of a signal event is the presence of two jets from the VBF process.Events are selected based on each of the two highestpT jets in the event which are referred to as the“tagging jets”. These tagging jets are required to have apT > 40 GeV and be in the rapidity range|η j1,2|< 5. Cuts on the product and difference of the pseudorapidity of the two jets are used,η j1 ·η j2 < 0and∆η > 4.4, respectively. Kinematic distributions of the tagged jets for the signal and background areshown in Figure 2. In the upper two plots of this Figure, it canbe seen that signal events and theW+jet and Z+jet backgrounds have very similarpT distributions. When the W+jet and Z+jet events aregenerated with only one parton thepT distributions are much softer. When the two parton and threeparton components are added thepT distribution becomes harder and similar to the signal.
The second major event characteristic used to select eventsis a largeEmissT from the invisible decay
of the Higgs boson. A cut on this variable significantly reduces the QCD background as no realEmissT is
expected for QCD events. In this analysis there is a requirement thatEmissT > 100 GeV. TheEmiss
T distri-butions for the signal and backgrounds are shown in Figure 3.
Tagged Jet #1 Pt [GeV]0 20 40 60 80 100 120 140 160 180 200
-410
-310
-210
-110
1 VBF Inv. Higgs Z+jet W+jet QCD Dijet
ATLAS
Tagged Jet #2 Pt [GeV]0 20 40 60 80 100 120 140 160 180 200
-510
-410
-310
-210
-110
1 VBF Inv. Higgs Z+jet W+jet QCD Dijet
ATLAS
j2η ×
j1η
-10 -5 0 5 100
0.05
0.1
0.15
0.2
0.25
0.3 VBF Inv. Higgs
Z+jet
W+jet
QCD Dijet
ATLAS
jjη ∆
0 2 4 6 8 100
0.02
0.04
0.06
0.08
0.1
0.12 VBF Inv. Higgs
Z+jet
W+jet
QCD Dijet
ATLAS
Figure 2: Comparison of tagged jet properties for signal events (mH = 130 GeV) and the threemajor backgrounds. The upper left plot shows thepT of the leading tagged jet, the upper rightplot shows thepT of the jet with the second highestpT . The lower left plot shows the product ofthe directions of the two tagged jets in pseudo-rapidity (η j1×η j2), and the lower right plot showsthe difference inη between the two tagged jets (∆η). The enhancement at∆η of 0.5 in the VBFsignal results from a single highpT jet being reconstructed as two jets. The filter cut describedinSection 2.1 has been applied to the W+jet and Z+jet Monte-Carlo data, but no trigger cuts havebeen applied. The distributions are normalized to unity. The vertical dotted lines show the cutvalues used in the analysis.
August 14, 2008 – 10 : 30 DRAFT 8
Invariant Tagged Jet Mass [GeV]0 200 400 600 800 1000 1200 1400 1600 1800 2000
-410
-310
-210
-110
1
VBF Inv. Higgs Z+jet W+jet QCD Dijet
ATLAS
Missing Transverse Energy [GeV]0 20 40 60 80 100 120 140 160 180 200
-910
-810
-710
-610
-510
-410
-310
-210
-110
1
VBF Inv. Higgs Z+jet W+jet QCD Dijet
ATLAS
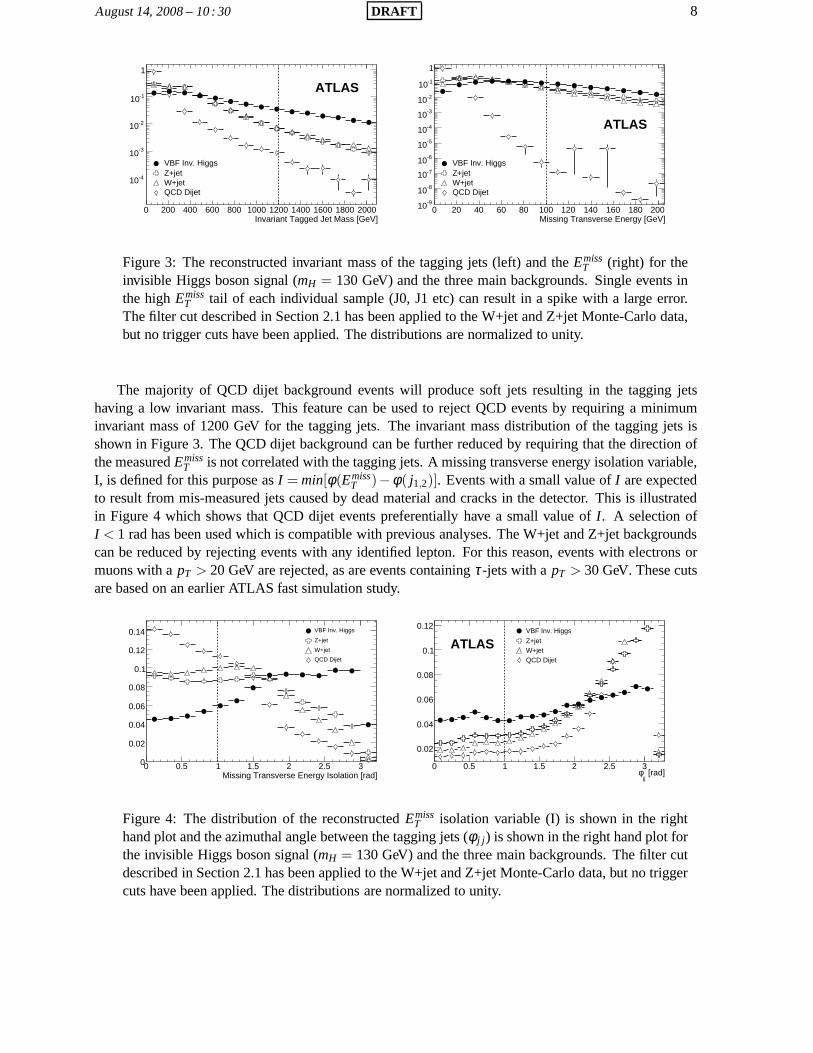
Figure 3: The reconstructed invariant mass of the tagging jets (left) and theEmissT (right) for the
invisible Higgs boson signal (mH = 130 GeV) and the three main backgrounds. Single events inthe highEmiss
T tail of each individual sample (J0, J1 etc) can result in a spike with a large error.The filter cut described in Section 2.1 has been applied to theW+jet and Z+jet Monte-Carlo data,but no trigger cuts have been applied. The distributions arenormalized to unity.
The majority of QCD dijet background events will produce soft jets resulting in the tagging jetshaving a low invariant mass. This feature can be used to reject QCD events by requiring a minimuminvariant mass of 1200 GeV for the tagging jets. The invariant mass distribution of the tagging jets isshown in Figure 3. The QCD dijet background can be further reduced by requiring that the direction ofthe measuredEmiss
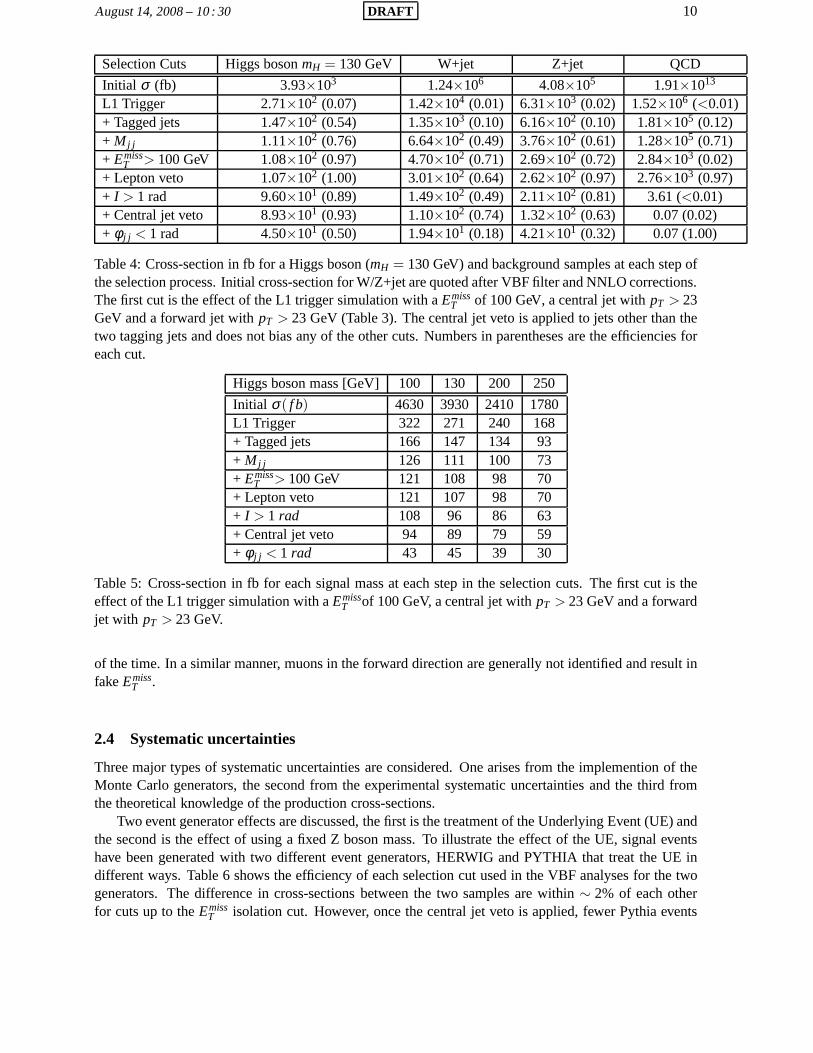
T is not correlated with the tagging jets. A missing transverse energy isolation variable,I, is defined for this purpose asI = min[φ(Emiss
T )−φ( j1,2)]. Events with a small value ofI are expectedto result from mis-measured jets caused by dead material andcracks in the detector. This is illustratedin Figure 4 which shows that QCD dijet events preferentiallyhave a small value ofI. A selection ofI < 1 rad has been used which is compatible with previous analyses. The W+jet and Z+jet backgroundscan be reduced by rejecting events with any identified lepton. For this reason, events with electrons ormuons with apT > 20 GeV are rejected, as are events containingτ-jets with apT > 30 GeV. These cutsare based on an earlier ATLAS fast simulation study.
Missing Transverse Energy Isolation [rad]0 0.5 1 1.5 2 2.5 30
0.02
0.04
0.06
0.08
0.1
0.12
0.14 VBF Inv. Higgs
Z+jet
W+jet
QCD Dijet
[rad]jj
φ0 0.5 1 1.5 2 2.5 3
0.02
0.04
0.06
0.08
0.1
0.12 VBF Inv. Higgs
Z+jet W+jet QCD Dijet
ATLAS
Figure 4: The distribution of the reconstructedEmissT isolation variable (I) is shown in the right
hand plot and the azimuthal angle between the tagging jets (φ j j) is shown in the right hand plot forthe invisible Higgs boson signal (mH = 130 GeV) and the three main backgrounds. The filter cutdescribed in Section 2.1 has been applied to the W+jet and Z+jet Monte-Carlo data, but no triggercuts have been applied. The distributions are normalized tounity.

August 14, 2008 – 10 : 30 DRAFT 9
A key aspect of the VBF Higgs boson search is the electroweak nature of the signal,and this can beused to suppress backgrounds by using the fact that the signal has no color flow between the interact-ing quarks at tree level. Although the W+jet and Z+jet backgrounds include both electroweak and QCDterms, the cross-section is dominated by the QCD contribution. Therefore, unlike the signal, the majorityof background events have QCD activity in the central region. The presence of this extra QCD radiationbetween the two tagging jets provides, in principle, a powerful tool to suppress this background. In prac-tice the difference is diluted both by the underlying event and pile-up. The Underlying Event (UE) arisesfrom interactions of the spectator partons and is not consistently modeled by the available event gener-ators. For example, the ratio of the average jet multiplicity from the UE between HERWIG/PYTHIA isbetween 1.38 and 1.85. Therefore PYTHIA generates events with fewer jets from the UE, but these jetshave on average a higherpT . If a cut is applied to remove events that have a central jet that exceed aspecificpT value, the so called Central Jet Veto (CJV) cut, fewer PYTHIAevents will survive than HER-WIG events. Although there is a clear difference in the topology between the signal and background, theadded contribution from the UE has a large effect on the efficiency of this cut. In the same way pile-up,which results from central activity unrelated to the event of interest can also reduce the effectiveness ofthis CJV cut. The effect of pile-up has not been studied, as suitable data samples were not available. Forthis analysis, a central jet veto is used requiring that there are no additional jets withpT > 30 GeV for|η |< 3.2. It should be stressed that this cut is applied after the selection of the two tagging jets which canbe located anywhere within the fullη range including|η | < 3.2. So this cut does not bias the selectionof the tagging jets, nor does it introduce a bias with respectto the trigger which has elements that allowjets to be located within an|η | < 3.2.
Unlike the signal which is uniquely produced via Vector Boson Fusion, the W+jet and Z+jet back-grounds can be produced by theqq → gV andqg → qV processes in which the second jet comes froma radiative process. Therefore, the difference inφ between the two tagged jets is different for the signaland the radiative background as can be seen in Figure 4. This difference provides additional discriminat-ing power and is used in the analysis presented in Section 2.5requiringφ j j < 1 rad. Moreover, theφ j j
variable motivates the shape analysis presented in Section2.6.The selection cuts along with the surviving cross-sectionsafter each cut are shown in Table 4 for
a Higgs boson massmH = 130 GeV and the three main backgrounds. Table 5 shows the effect ofthe cuts for the four Higgs boson mass values considered in this study. The cross-sections for W+jetand Z+jet processes were calculated to LO but have been normalized to the results calculated with thegenerator FEWZ at NNLO which results in a value for the total cross-section which is known to within∼ 10%1) [19].
The first cut applied to the data simulates the effect of the L1trigger with the most conservative menuoption given in Table 3 and discussed in the previous sectionnamely, aEmiss
T > 100 GeV, a central jetwith pT > 23 GeV and a forward jet withpT > 23 GeV. This cut reduces the QCD dijet background rateby approximately 7 orders of magnitude. The effect of the trigger on the W+jet and Z+jet backgroundsis smaller with a reduction of two orders of magnitude, by contrast the signal is reduced by about 50%.The jet tagging cuts reduces all three backgrounds by a factor of 10. Although a L1Emiss
T is applied alarge fraction of events still survive because of the the L1Emiss
T resolution. The other cuts that have alarge impact on the QCD rate are theEmiss
T cut and theEmissT isolation cut. Together they reduce this
background to a negligible level. The effect of these selection cuts on the Z+jet and W+jet backgroundsare less dramatic. The lepton veto reduces the W+jet and Z+jet by ∼ 36% and∼ 3%, respectively. Thelepton veto cut removes few events in the Z+jet channel as theEmiss
T cut removes most of the Z→ ℓℓ de-cay mode. The remaining Z+jet events are dominated by the Z→ νν mode. Leptons are only identifiedfor |η | < 2.5, so the lepton veto cut does not remove all the W+jet background events due to this limitedη range. Therefore, electrons andτ-jet in the forward region (|η | > 2.5) are mis-identified as jets most
1)This includes the PDF and QCD scale uncertainties.
August 14, 2008 – 10 : 30 DRAFT 10
Selection Cuts Higgs bosonmH = 130 GeV W+jet Z+jet QCD
Initial σ (fb) 3.93×10³ 1.24×10⁶ 4.08×10⁵ 1.91×10¹³
L1 Trigger 2.71×10² (0.07) 1.42×10⁴ (0.01) 6.31×10³ (0.02) 1.52×10⁶ (<0.01)+ Tagged jets 1.47×10² (0.54) 1.35×10³ (0.10) 6.16×10² (0.10) 1.81×10⁵ (0.12)+ M j j 1.11×10² (0.76) 6.64×10² (0.49) 3.76×10² (0.61) 1.28×10⁵ (0.71)+ Emiss
T > 100 GeV 1.08×10² (0.97) 4.70×10² (0.71) 2.69×10² (0.72) 2.84×10³ (0.02)+ Lepton veto 1.07×10² (1.00) 3.01×10² (0.64) 2.62×10² (0.97) 2.76×10³ (0.97)+ I > 1 rad 9.60×101 (0.89) 1.49×10² (0.49) 2.11×10² (0.81) 3.61 (<0.01)+ Central jet veto 8.93×101 (0.93) 1.10×10² (0.74) 1.32×10² (0.63) 0.07 (0.02)+ φ j j < 1 rad 4.50×101 (0.50) 1.94×101 (0.18) 4.21×101 (0.32) 0.07 (1.00)
Table 4: Cross-section in fb for a Higgs boson (mH = 130 GeV) and background samples at each step ofthe selection process. Initial cross-section for W/Z+jet are quoted after VBF filter and NNLO corrections.The first cut is the effect of the L1 trigger simulation with aEmiss
T of 100 GeV, a central jet withpT > 23GeV and a forward jet withpT > 23 GeV (Table 3). The central jet veto is applied to jets otherthan thetwo tagging jets and does not bias any of the other cuts. Numbers in parentheses are the efficiencies foreach cut.
Higgs boson mass [GeV] 100 130 200 250
Initial σ( f b) 4630 3930 2410 1780L1 Trigger 322 271 240 168+ Tagged jets 166 147 134 93+ M j j 126 111 100 73+ Emiss
T > 100 GeV 121 108 98 70+ Lepton veto 121 107 98 70+ I > 1 rad 108 96 86 63+ Central jet veto 94 89 79 59+ φ j j < 1 rad 43 45 39 30
Table 5: Cross-section in fb for each signal mass at each stepin the selection cuts. The first cut is theeffect of the L1 trigger simulation with aEmiss
T of 100 GeV, a central jet withpT > 23 GeV and a forwardjet with pT > 23 GeV.
of the time. In a similar manner, muons in the forward direction are generally not identified and result infakeEmiss
T .
2.4 Systematic uncertainties
Three major types of systematic uncertainties are considered. One arises from the implemention of theMonte Carlo generators, the second from the experimental systematic uncertainties and the third fromthe theoretical knowledge of the production cross-sections.
Two event generator effects are discussed, the first is the treatment of the Underlying Event (UE) andthe second is the effect of using a fixed Z boson mass. To illustrate the effect of the UE, signal eventshave been generated with two different event generators, HERWIG and PYTHIA that treat the UE indifferent ways. Table 6 shows the efficiency of each selection cut used in the VBF analyses for the twogenerators. The difference in cross-sections between the two samples are within∼ 2% of each otherfor cuts up to theEmiss
T isolation cut. However, once the central jet veto is applied, fewer Pythia events
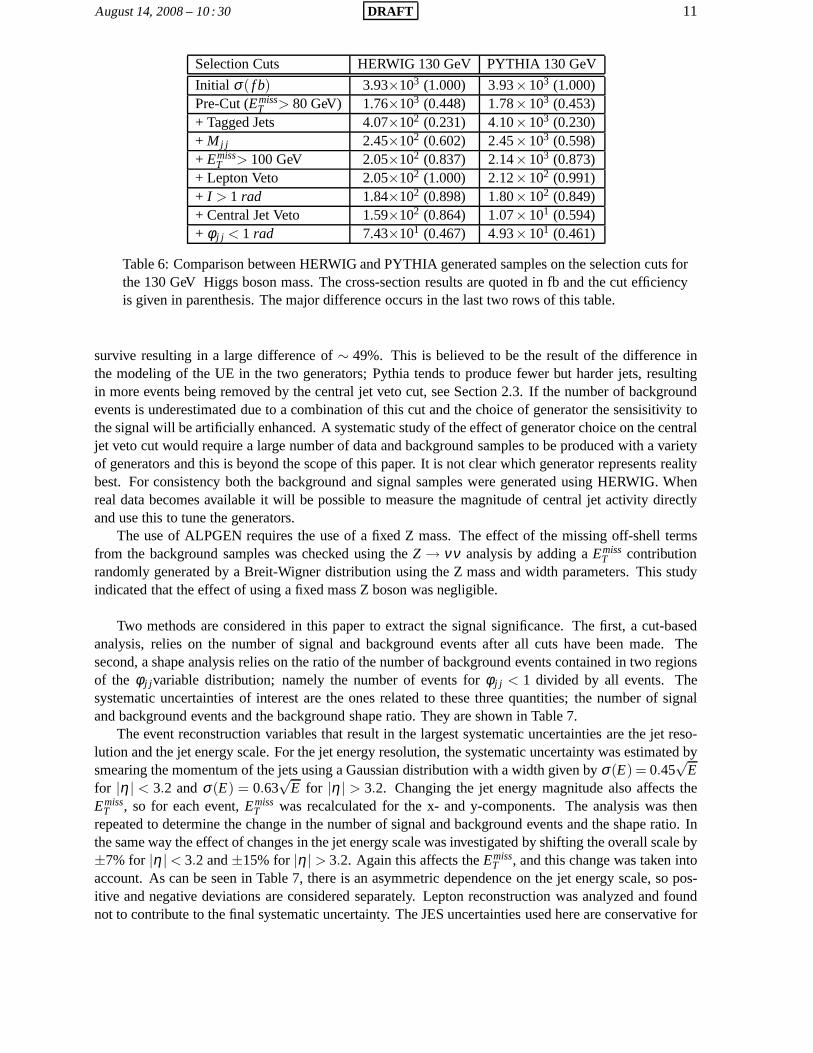
August 14, 2008 – 10 : 30 DRAFT 11
Selection Cuts HERWIG 130 GeV PYTHIA 130 GeV
Initial σ( f b) 3.93×10³ (1.000) 3.93×10³ (1.000)Pre-Cut (Emiss
T > 80 GeV) 1.76×10³ (0.448) 1.78×10³ (0.453)+ Tagged Jets 4.07×10² (0.231) 4.10×10³ (0.230)+ M j j 2.45×10² (0.602) 2.45×10³ (0.598)+ Emiss
T > 100 GeV 2.05×10² (0.837) 2.14×10³ (0.873)+ Lepton Veto 2.05×10² (1.000) 2.12×10² (0.991)+ I > 1 rad 1.84×10² (0.898) 1.80×10² (0.849)+ Central Jet Veto 1.59×10² (0.864) 1.07×101 (0.594)+ φ j j < 1 rad 7.43×101 (0.467) 4.93×101 (0.461)
Table 6: Comparison between HERWIG and PYTHIA generated samples on the selection cuts forthe 130 GeV Higgs boson mass. The cross-section results are quoted in fb and the cut efficiencyis given in parenthesis. The major difference occurs in the last two rows of this table.
survive resulting in a large difference of∼ 49%. This is believed to be the result of the difference inthe modeling of the UE in the two generators; Pythia tends to produce fewer but harder jets, resultingin more events being removed by the central jet veto cut, see Section 2.3. If the number of backgroundevents is underestimated due to a combination of this cut andthe choice of generator the sensisitivity tothe signal will be artificially enhanced. A systematic studyof the effect of generator choice on the centraljet veto cut would require a large number of data and background samples to be produced with a varietyof generators and this is beyond the scope of this paper. It isnot clear which generator represents realitybest. For consistency both the background and signal samples were generated using HERWIG. Whenreal data becomes available it will be possible to measure the magnitude of central jet activity directlyand use this to tune the generators.
The use of ALPGEN requires the use of a fixed Z mass. The effect of the missing off-shell termsfrom the background samples was checked using theZ → νν analysis by adding aEmiss
T contributionrandomly generated by a Breit-Wigner distribution using the Z mass and width parameters. This studyindicated that the effect of using a fixed mass Z boson was negligible.
Two methods are considered in this paper to extract the signal significance. The first, a cut-basedanalysis, relies on the number of signal and background events after all cuts have been made. Thesecond, a shape analysis relies on the ratio of the number of background events contained in two regionsof the φ j jvariable distribution; namely the number of events forφ j j < 1 divided by all events. Thesystematic uncertainties of interest are the ones related to these three quantities; the number of signaland background events and the background shape ratio. They are shown in Table 7.
The event reconstruction variables that result in the largest systematic uncertainties are the jet reso-lution and the jet energy scale. For the jet energy resolution, the systematic uncertainty was estimated bysmearing the momentum of the jets using a Gaussian distribution with a width given byσ(E) = 0.45
√E
for |η | < 3.2 andσ(E) = 0.63√
E for |η | > 3.2. Changing the jet energy magnitude also affects theEmiss
T , so for each event,EmissT was recalculated for the x- and y-components. The analysis was then
repeated to determine the change in the number of signal and background events and the shape ratio. Inthe same way the effect of changes in the jet energy scale was investigated by shifting the overall scale by±7% for |η | < 3.2 and±15% for|η | > 3.2. Again this affects theEmiss
T , and this change was taken intoaccount. As can be seen in Table 7, there is an asymmetric dependence on the jet energy scale, so pos-itive and negative deviations are considered separately. Lepton reconstruction was analyzed and foundnot to contribute to the final systematic uncertainty. The JES uncertainties used here are conservative for
August 14, 2008 – 10 : 30 DRAFT 12
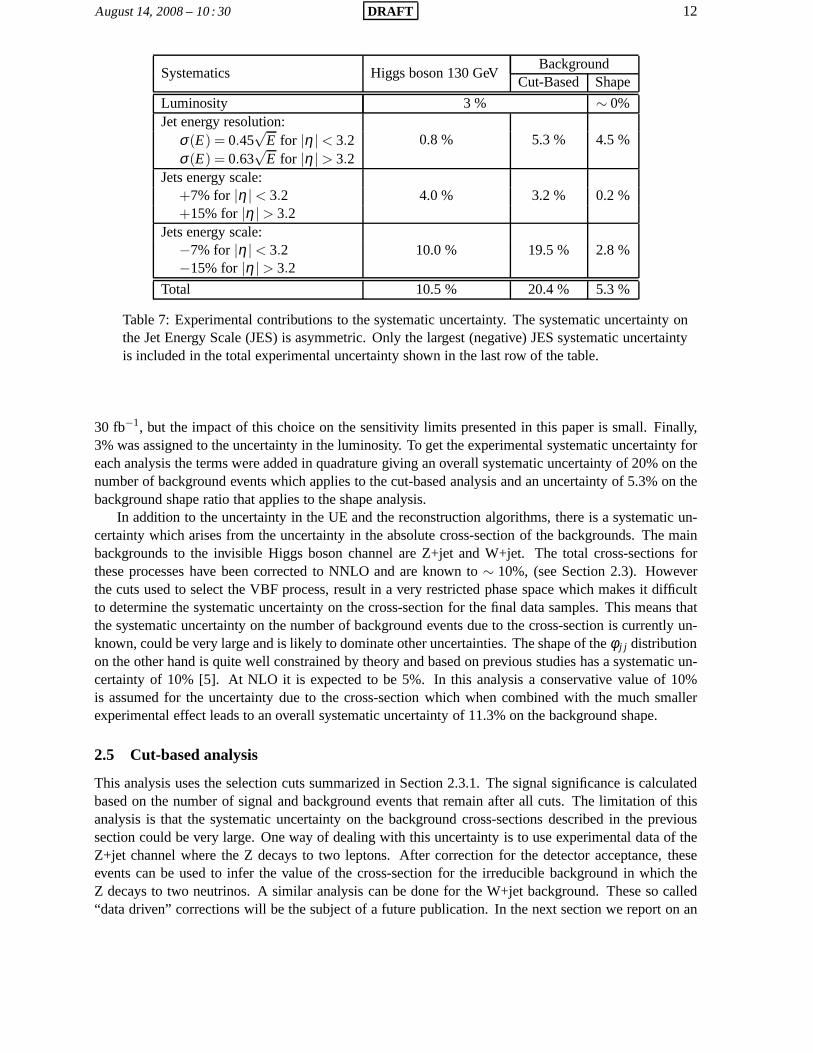
Systematics Higgs boson 130 GeVBackground
Cut-Based Shape
Luminosity 3 % ∼ 0%Jet energy resolution:
0.8 % 5.3 % 4.5 %σ(E) = 0.45√
E for |η | < 3.2σ(E) = 0.63
√E for |η | > 3.2
Jets energy scale:4.0 % 3.2 % 0.2 %+7% for |η | < 3.2
+15% for |η | > 3.2Jets energy scale:
10.0 % 19.5 % 2.8 %−7% for |η | < 3.2−15% for |η | > 3.2
Total 10.5 % 20.4 % 5.3 %
Table 7: Experimental contributions to the systematic uncertainty. The systematic uncertainty onthe Jet Energy Scale (JES) is asymmetric. Only the largest (negative) JES systematic uncertaintyis included in the total experimental uncertainty shown in the last row of the table.
30 fb−1, but the impact of this choice on the sensitivity limits presented in this paper is small. Finally,3% was assigned to the uncertainty in the luminosity. To get the experimental systematic uncertainty foreach analysis the terms were added in quadrature giving an overall systematic uncertainty of 20% on thenumber of background events which applies to the cut-based analysis and an uncertainty of 5.3% on thebackground shape ratio that applies to the shape analysis.
In addition to the uncertainty in the UE and the reconstruction algorithms, there is a systematic un-certainty which arises from the uncertainty in the absolutecross-section of the backgrounds. The mainbackgrounds to the invisible Higgs boson channel are Z+jet and W+jet. The total cross-sections forthese processes have been corrected to NNLO and are known to∼ 10%, (see Section 2.3). Howeverthe cuts used to select the VBF process, result in a very restricted phase space which makes it difficultto determine the systematic uncertainty on the cross-section for the final data samples. This means thatthe systematic uncertainty on the number of background events due to the cross-section is currently un-known, could be very large and is likely to dominate other uncertainties. The shape of theφ j j distributionon the other hand is quite well constrained by theory and based on previous studies has a systematic un-certainty of 10% [5]. At NLO it is expected to be 5%. In this analysis a conservative value of 10%is assumed for the uncertainty due to the cross-section which when combined with the much smallerexperimental effect leads to an overall systematic uncertainty of 11.3% on the background shape.
2.5 Cut-based analysis
This analysis uses the selection cuts summarized in Section2.3.1. The signal significance is calculatedbased on the number of signal and background events that remain after all cuts. The limitation of thisanalysis is that the systematic uncertainty on the background cross-sections described in the previoussection could be very large. One way of dealing with this uncertainty is to use experimental data of theZ+jet channel where the Z decays to two leptons. After correction for the detector acceptance, theseevents can be used to infer the value of the cross-section forthe irreducible background in which theZ decays to two neutrinos. A similar analysis can be done for the W+jet background. These so called“data driven” corrections will be the subject of a future publication. In the next section we report on an
August 14, 2008 – 10 : 30 DRAFT 13
alternative method which uses the shape of the azimuthal angle distribution between the jets to reducethe dependence of the systematic error on the cross-section. In the current section the sensitivity toan invisible Higgs boson without systematic errors are calculated to provide baseline numbers for thesensitivity to an invisible Higgs boson produced via the VBFprocess.
The number of signal and background events after theφ j j cut is shown in Tables 4 and 5. Thesenumbers can be used to calculate the 95 % CL sensitivity ofξ 2 for the invisible Higgs boson, given theassumed backgrounds. This is done by calculating the numberof signal events required to increase thetotal event count by a factor 1.64 times the uncertainty on the number of background events as shown inEquation 2.
1.64σB = NSξ 2 (2)
HereNS is the number of signal events after the selection cuts andσB =√
NB . The results of this analysisgives aξ 2 for an integrated luminosity of 30 fb−1at 95 % C.L. for Higgs mass between 110 GeV and 250GeV of∼ 5−8% in the case when systematic uncertainties are not included. An additional 6% statisticaluncertainty2) arises from the limited number of events in the data samples.
2.6 Shape analysis
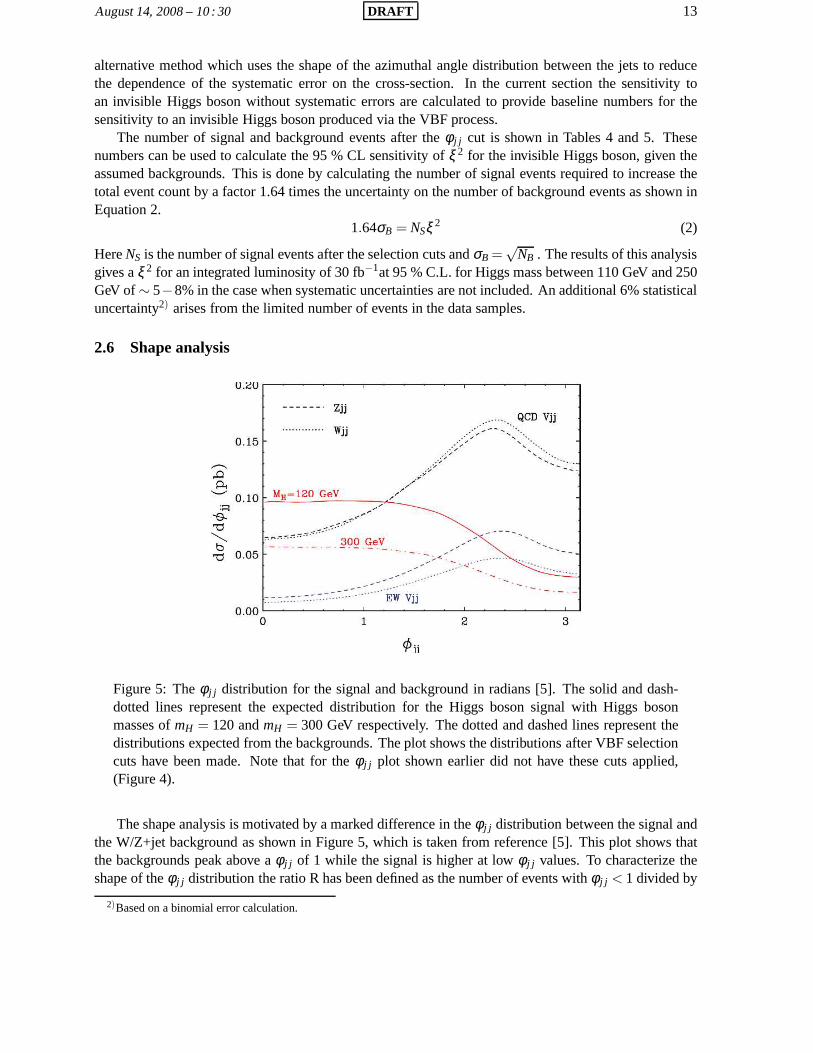
Figure 5: Theφ j j distribution for the signal and background in radians [5]. The solid and dash-dotted lines represent the expected distribution for the Higgs boson signal with Higgs bosonmasses ofmH = 120 andmH = 300 GeV respectively. The dotted and dashed lines representthedistributions expected from the backgrounds. The plot shows the distributions after VBF selectioncuts have been made. Note that for theφ j j plot shown earlier did not have these cuts applied,(Figure 4).
The shape analysis is motivated by a marked difference in theφ j j distribution between the signal andthe W/Z+jet background as shown in Figure 5, which is taken from reference [5]. This plot shows thatthe backgrounds peak above aφ j j of 1 while the signal is higher at lowφ j j values. To characterize theshape of theφ j j distribution the ratio R has been defined as the number of events withφ j j < 1 divided by
2)Based on a binomial error calculation.
August 14, 2008 – 10 : 30 DRAFT 14
the total number of events as shown in Equation 3. As the proportion of signal in the sample increasesthe value of R increases.
R =
∫ 10
dσdφ j j
∫ π0
dσdφ j j
(3)
The advantage of the shape analysis described in this section over other analyses is that it doesnot require a knowledge of the absolute cross-section but rather the ratio of the number of events for(φ j j < 1) to all events. As such, the systematic error associated with the absolute cross-section is reducedto a negligible amount. However, as discussed in Section 2.4, there is a systematic uncertainty associatedwith the knowledge of theφ j j distribution which is known to∼10% or better. In addition, the systematicuncertainties due to detector effects are much smaller for this ratio than they are for the number ofbackground events, which is the relevant variable for a purecut-based analysis (Table 7). The overallsystematic uncertainty on the ratio R has been calculated tobe 11.3%.
Equation 3 can be re-written in the context of this analysis and expanded to provide a background-only term, as shown in Equation 4.
R =N1
B
NπB
[
1+ ξ 2(
N1S
N1B
− NπS
NπB
)
+ · · ·]
(4)
Here N1B and N1
S are the number of events withinφ j j < 1 andNπB and Nπ
S are the number of eventswithin the entireφ j j range. The first term of Equation 4 provides the expected ratio for the backgroundcontribution. However, since the ratio between the signal and background are not the same in the presenceof a signal, a non-zero value is expected in the second term. The variation from the ‘background only’ratio dictates the sensitivity to new physics. The ratioN1
B/NπB can be determined using the Stndard Model
theoretical prediction or by a data driven technique.
Higgs Mass [GeV]100 120 140 160 180 200 220 240 260
[%]
2 ξ
0
10
20
30
40
50
60
70
80
90
100
ATLAS
Full Simulation Using Shape Analysis No Systematics
Full Simulation Using Shape Analysis With Systematics
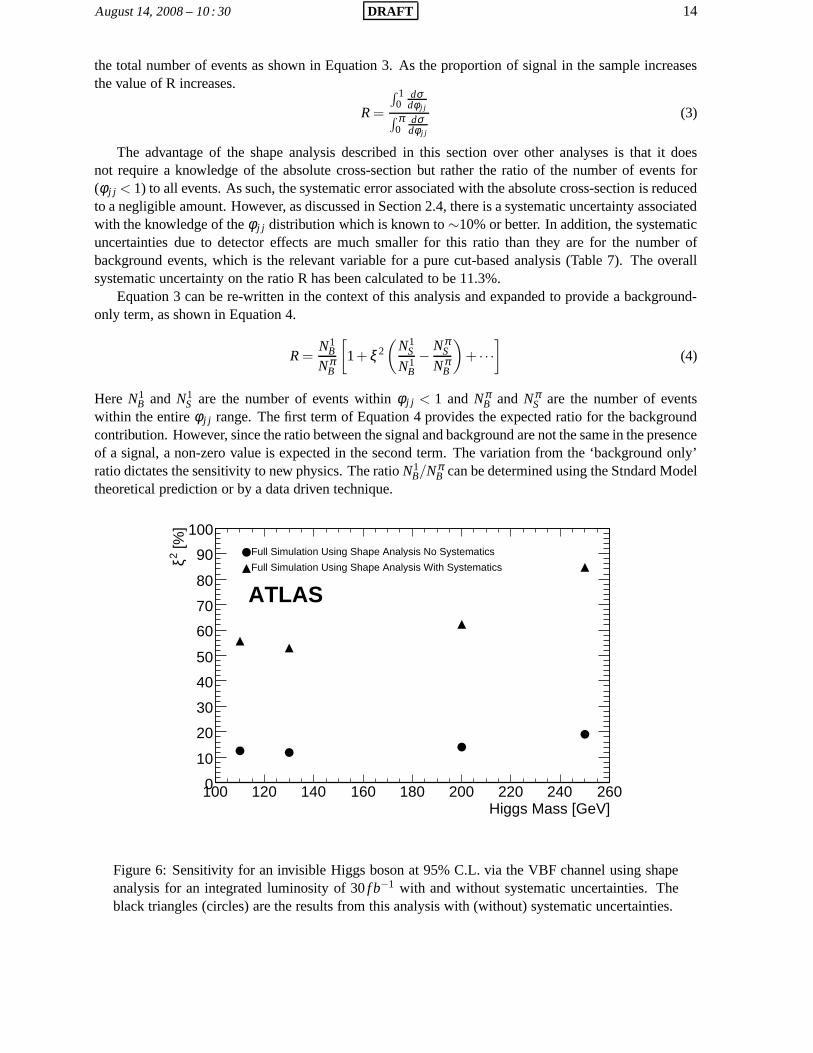
Figure 6: Sensitivity for an invisible Higgs boson at 95% C.L. via the VBF channel using shapeanalysis for an integrated luminosity of 30f b−1 with and without systematic uncertainties. Theblack triangles (circles) are the results from this analysis with (without) systematic uncertainties.
August 14, 2008 – 10 : 30 DRAFT 15
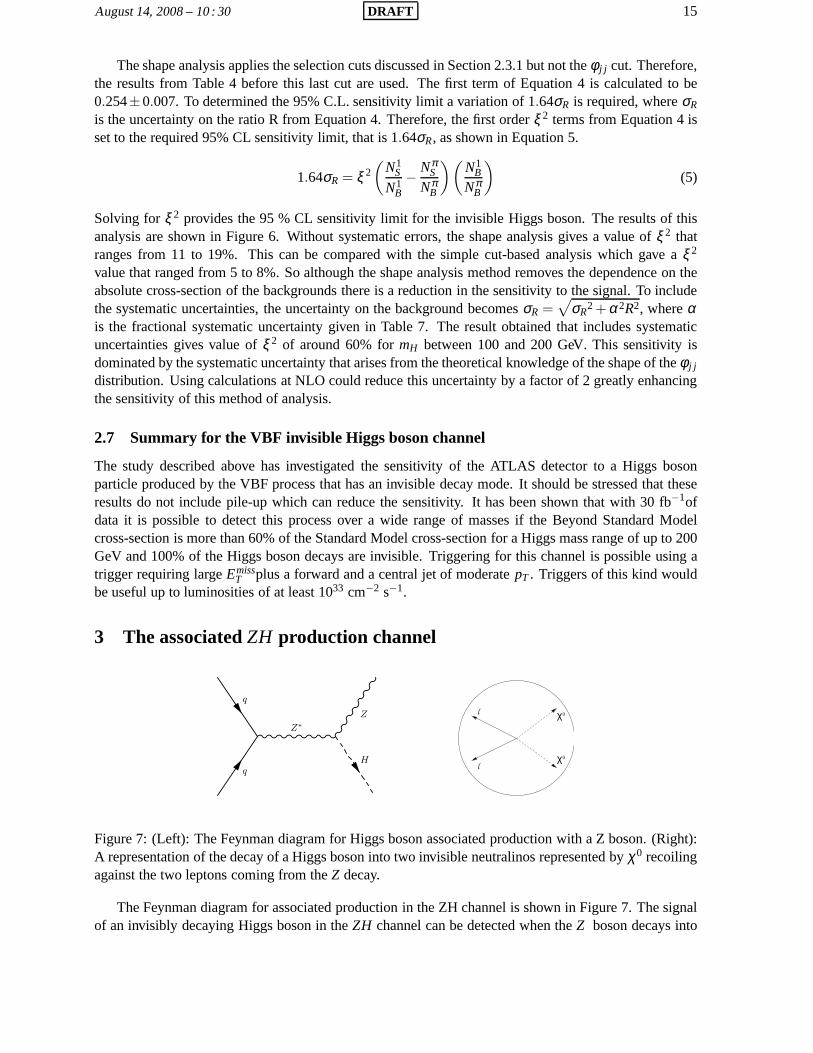
The shape analysis applies the selection cuts discussed in Section 2.3.1 but not theφ j j cut. Therefore,the results from Table 4 before this last cut are used. The first term of Equation 4 is calculated to be0.254±0.007. To determined the 95% C.L. sensitivity limit a variation of 1.64σR is required, whereσR
is the uncertainty on the ratio R from Equation 4. Therefore,the first orderξ 2 terms from Equation 4 isset to the required 95% CL sensitivity limit, that is 1.64σR, as shown in Equation 5.
1.64σR = ξ 2(
N1S
N1B
− NπS
NπB
)(
N1B
NπB
)
(5)
Solving forξ 2 provides the 95 % CL sensitivity limit for the invisible Higgs boson. The results of thisanalysis are shown in Figure 6. Without systematic errors, the shape analysis gives a value ofξ 2 thatranges from 11 to 19%. This can be compared with the simple cut-based analysis which gave aξ 2
value that ranged from 5 to 8%. So although the shape analysismethod removes the dependence on theabsolute cross-section of the backgrounds there is a reduction in the sensitivity to the signal. To includethe systematic uncertainties, the uncertainty on the background becomesσR =
√
σR2 + α2R2, whereα
is the fractional systematic uncertainty given in Table 7. The result obtained that includes systematicuncertainties gives value ofξ 2 of around 60% formH between 100 and 200 GeV. This sensitivity isdominated by the systematic uncertainty that arises from the theoretical knowledge of the shape of theφ j j
distribution. Using calculations at NLO could reduce this uncertainty by a factor of 2 greatly enhancingthe sensitivity of this method of analysis.
2.7 Summary for the VBF invisible Higgs boson channel
The study described above has investigated the sensitivityof the ATLAS detector to a Higgs bosonparticle produced by the VBF process that has an invisible decay mode. It should be stressed that theseresults do not include pile-up which can reduce the sensitivity. It has been shown that with 30 fb−1ofdata it is possible to detect this process over a wide range ofmasses if the Beyond Standard Modelcross-section is more than 60% of the Standard Model cross-section for a Higgs mass range of up to 200GeV and 100% of the Higgs boson decays are invisible. Triggering for this channel is possible using atrigger requiring largeEmiss
T plus a forward and a central jet of moderatepT . Triggers of this kind wouldbe useful up to luminosities of at least 1033 cm−2 s−1.
3 The associated ZH production channel
χ0
χ0
l
l
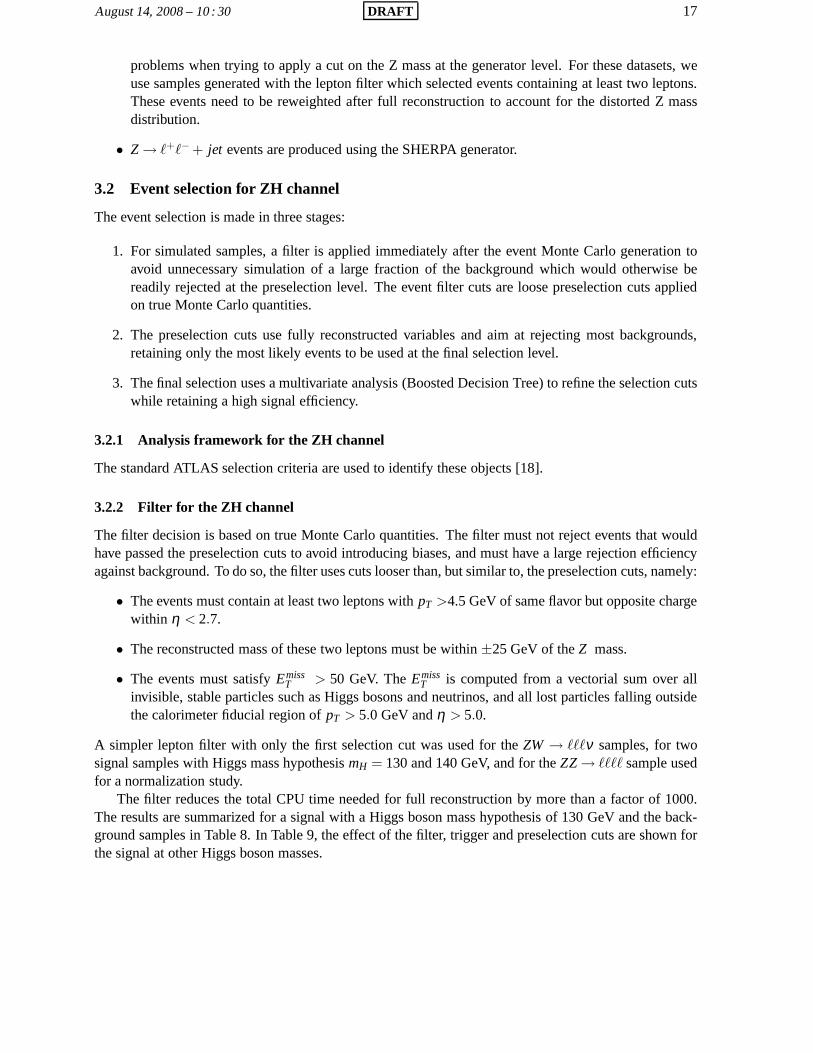
Figure 7: (Left): The Feynman diagram for Higgs boson associated production with a Z boson. (Right):A representation of the decay of a Higgs boson into two invisible neutralinos represented byχ0 recoilingagainst the two leptons coming from theZ decay.
The Feynman diagram for associated production in the ZH channel is shown in Figure 7. The signalof an invisibly decaying Higgs boson in theZH channel can be detected when theZ boson decays into

August 14, 2008 – 10 : 30 DRAFT 16
two leptons, which can be used for triggering the event. The presence of an invisibly decaying Higgsboson is detected from the missing transverse energy.
Various backgrounds with signatures similar to the signal have been studied and are listed here. Inall cases, unless otherwise specified,ℓ representse or µ .
1. TheZZ → ℓℓνν final state gives the same signature as the signal (irreducible background) and isthe main background;
2. Thett → bℓ+ν bℓ−ν process mimics the signal when the twob-jets are not reconstructed, or whena second lepton results from a b quark decay;
3. TheW +W− → ℓνℓν process mimics the signal but can be greatly reduced by cutting on theZmass;
4. TheZZ → ννττ andτ → ℓνν can also mimic the signal.
5. TheZZ → ℓℓττ andτ → ℓνν can pass the selection criteria if some particles are missed;
6. TheZW → ℓℓℓν decay mode also simulates the signal when one lepton is not detected;
7. TheZ plus jets background, withZ → ℓℓ (Drell-Yan process) final state can be mistaken for thesignal when poor jet reconstruction leads to missing transverse energy.
3.1 Monte Carlo generation for the ZH channel
The signal and the background events have been generated using different particle generators chosenaccording to which process they simulate best. The events are fully simulated then reconstructed usingATHENA. The diboson production cross-sections are taken from Ref. [19]. All events were passedthrough a filter immediately after generation. The two filters used are described in detail in Section3.2.2. Only the few samples generated with the simpler lepton filter will be mentioned here. All othersamples were generated with the filter containingmZ andEmiss
T cuts.Details on the generated events and pre-defined parameters are given below. All generators use the
CTEQ6M structure functions to generate the processes.
• Seven signal samples were generated using PYTHIA, withmH = 110, 120, 130, 140, 150, 200 and250 GeV. Only the samples withmH = 130 and 140 GeV used the lepton filter. To generate theinvisibility of the Higgs boson, theH is produced as a stable particle, which goes undetected.
• ZZ → ℓ+ℓ−νν is generated using PYTHIA. This is the main and irreducible background. OneZdecays to a lepton pair while the other is allowed to decay to any flavor of neutrino pairs.
• tt is produced with the MC@NLO generator with all top quark decay modes allowed. The filterdescribed in detail in Section 3.2.2 retains mostlytt → bℓ+ν bℓ−ν events withℓ = e or µ only.Hadronic top quark decays with a subsequentb → cℓν decay are also included.
• W +W− → ℓ+νℓ−ν is generated with MC@NLO.
• ZZ → τ+τ−νν andZZ → ℓℓτ+τ− events are generated with PYTHIA. Theτ was allowed to decayhadronically and leptonically in both samples.
• ZW± → ℓ+ℓ−ℓ±ν samples are produced with the MC@NLO generator. Since the cross-sectionsfor ZW+ andZW− production are different, two different datasets were generated. The ZW sam-ples were not filtered since MC@NLO does not include the Z width at generation, leading to
August 14, 2008 – 10 : 30 DRAFT 17
problems when trying to apply a cut on the Z mass at the generator level. For these datasets, weuse samples generated with the lepton filter which selected events containing at least two leptons.These events need to be reweighted after full reconstruction to account for the distorted Z massdistribution.
• Z → ℓ+ℓ− + jet events are produced using the SHERPA generator.
3.2 Event selection for ZH channel
The event selection is made in three stages:
1. For simulated samples, a filter is applied immediately after the event Monte Carlo generation toavoid unnecessary simulation of a large fraction of the background which would otherwise bereadily rejected at the preselection level. The event filtercuts are loose preselection cuts appliedon true Monte Carlo quantities.
2. The preselection cuts use fully reconstructed variablesand aim at rejecting most backgrounds,retaining only the most likely events to be used at the final selection level.
3. The final selection uses a multivariate analysis (BoostedDecision Tree) to refine the selection cutswhile retaining a high signal efficiency.
3.2.1 Analysis framework for the ZH channel
The standard ATLAS selection criteria are used to identify these objects [18].
3.2.2 Filter for the ZH channel
The filter decision is based on true Monte Carlo quantities. The filter must not reject events that wouldhave passed the preselection cuts to avoid introducing biases, and must have a large rejection efficiencyagainst background. To do so, the filter uses cuts looser than, but similar to, the preselection cuts, namely:
• The events must contain at least two leptons withpT >4.5 GeV of same flavor but opposite chargewithin η < 2.7.
• The reconstructed mass of these two leptons must be within±25 GeV of theZ mass.
• The events must satisfyEmissT > 50 GeV. TheEmiss
T is computed from a vectorial sum over allinvisible, stable particles such as Higgs bosons and neutrinos, and all lost particles falling outsidethe calorimeter fiducial region ofpT > 5.0 GeV andη > 5.0.
A simpler lepton filter with only the first selection cut was used for theZW → ℓℓℓν samples, for twosignal samples with Higgs mass hypothesismH = 130 and 140 GeV, and for theZZ → ℓℓℓℓ sample usedfor a normalization study.
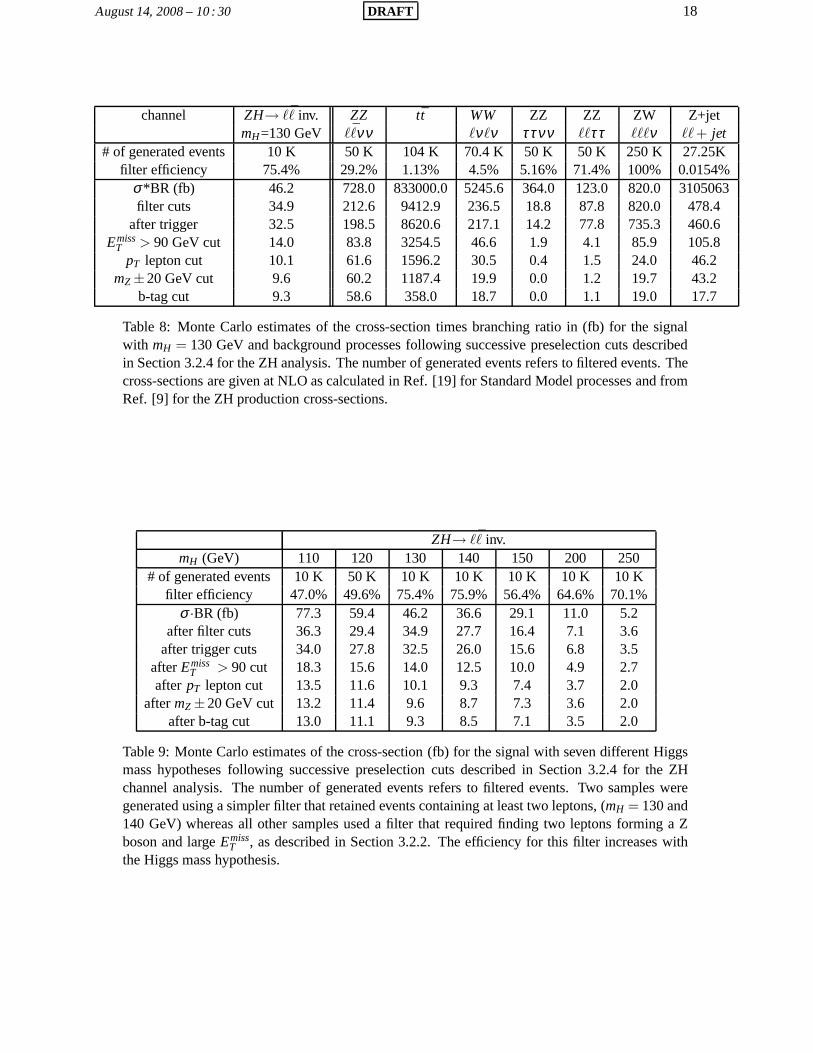
The filter reduces the total CPU time needed for full reconstruction by more than a factor of 1000.The results are summarized for a signal with a Higgs boson mass hypothesis of 130 GeV and the back-ground samples in Table 8. In Table 9, the effect of the filter,trigger and preselection cuts are shown forthe signal at other Higgs boson masses.
August 14, 2008 – 10 : 30 DRAFT 18
channel ZH→ ℓℓ inv. ZZ tt WW ZZ ZZ ZW Z+jetmH=130 GeV ℓℓνν ℓνℓν ττνν ℓℓττ ℓℓℓν ℓℓ+ jet
# of generated events 10 K 50 K 104 K 70.4 K 50 K 50 K 250 K 27.25Kfilter efficiency 75.4% 29.2% 1.13% 4.5% 5.16% 71.4% 100% 0.0154%
σ*BR (fb) 46.2 728.0 833000.0 5245.6 364.0 123.0 820.0 3105063filter cuts 34.9 212.6 9412.9 236.5 18.8 87.8 820.0 478.4
after trigger 32.5 198.5 8620.6 217.1 14.2 77.8 735.3 460.6Emiss
T > 90 GeV cut 14.0 83.8 3254.5 46.6 1.9 4.1 85.9 105.8pT lepton cut 10.1 61.6 1596.2 30.5 0.4 1.5 24.0 46.2
mZ ±20 GeV cut 9.6 60.2 1187.4 19.9 0.0 1.2 19.7 43.2b-tag cut 9.3 58.6 358.0 18.7 0.0 1.1 19.0 17.7
Table 8: Monte Carlo estimates of the cross-section times branching ratio in (fb) for the signalwith mH = 130 GeV and background processes following successive preselection cuts describedin Section 3.2.4 for the ZH analysis. The number of generatedevents refers to filtered events. Thecross-sections are given at NLO as calculated in Ref. [19] for Standard Model processes and fromRef. [9] for the ZH production cross-sections.
ZH→ ℓℓ inv.mH (GeV) 110 120 130 140 150 200 250
# of generated events 10 K 50 K 10 K 10 K 10 K 10 K 10 Kfilter efficiency 47.0% 49.6% 75.4% 75.9% 56.4% 64.6% 70.1%
σ ·BR (fb) 77.3 59.4 46.2 36.6 29.1 11.0 5.2after filter cuts 36.3 29.4 34.9 27.7 16.4 7.1 3.6
after trigger cuts 34.0 27.8 32.5 26.0 15.6 6.8 3.5afterEmiss
T > 90 cut 18.3 15.6 14.0 12.5 10.0 4.9 2.7after pT lepton cut 13.5 11.6 10.1 9.3 7.4 3.7 2.0
aftermZ ±20 GeV cut 13.2 11.4 9.6 8.7 7.3 3.6 2.0after b-tag cut 13.0 11.1 9.3 8.5 7.1 3.5 2.0
Table 9: Monte Carlo estimates of the cross-section (fb) forthe signal with seven different Higgsmass hypotheses following successive preselection cuts described in Section 3.2.4 for the ZHchannel analysis. The number of generated events refers to filtered events. Two samples weregenerated using a simpler filter that retained events containing at least two leptons, (mH = 130 and140 GeV) whereas all other samples used a filter that requiredfinding two leptons forming a Zboson and largeEmiss
T , as described in Section 3.2.2. The efficiency for this filterincreases withthe Higgs mass hypothesis.
August 14, 2008 – 10 : 30 DRAFT 19
3.2.3 Trigger for ZH channel
An invisibly decaying Higgs boson in theZH channel can be detected when theZ decays into twoleptons. We trigger on such events using the full simulationof the trigger and by requiring either one ortwo isolated, highpT leptons satisfying any of the following trigger signatures:
• single electron trigger: one isolated lepton withpT > 22 GeV.
• single muon trigger: one muon withpT > 20 GeV.
• di-electron trigger: two isolated electrons withpT > 15 GeV.
• missing transverse energy trigger:EmissT > 100 GeV.
The di-muon trigger with a lowerpT momentum cut was not implemented in this analysis but willbe used in the future. The overall trigger efficiency of 92.8%compares well with what is retainedwhen applying cuts on fully reconstructed variables, selecting events containing either one electron withpT > 25 GeV, two electrons withpT > 15 GeV or one muon withpT > 20 GeV. The effect of the triggeron all samples studied is given in Table 8.
3.2.4 Event preselection
A first preselection is applied to reject most backgrounds, in particular thett and (Z+jet) backgrounds.The following cuts are applied:
• the event must satisfy one of the trigger signatures described in the previous section;
• large missing transverse energy, i.e.EmissT > 90 GeV.
• the event must contain exactly two leptons of the same flavor but opposite charge withpT > 15GeV;
• an anti-b-tag is applied to further suppress thett background.
• a loose cut on the invariant mass of the two leptons, namely|mℓℓ −mZ| < 20 GeV, is applied toreject somett background without reducing the signal efficiency.
Theσ ·BR for the signal and the background processes listed in Section 3 are shown in Table 8. Theeffects of the filter and preselection cuts are also shown in this table.
3.2.5 Final event selection
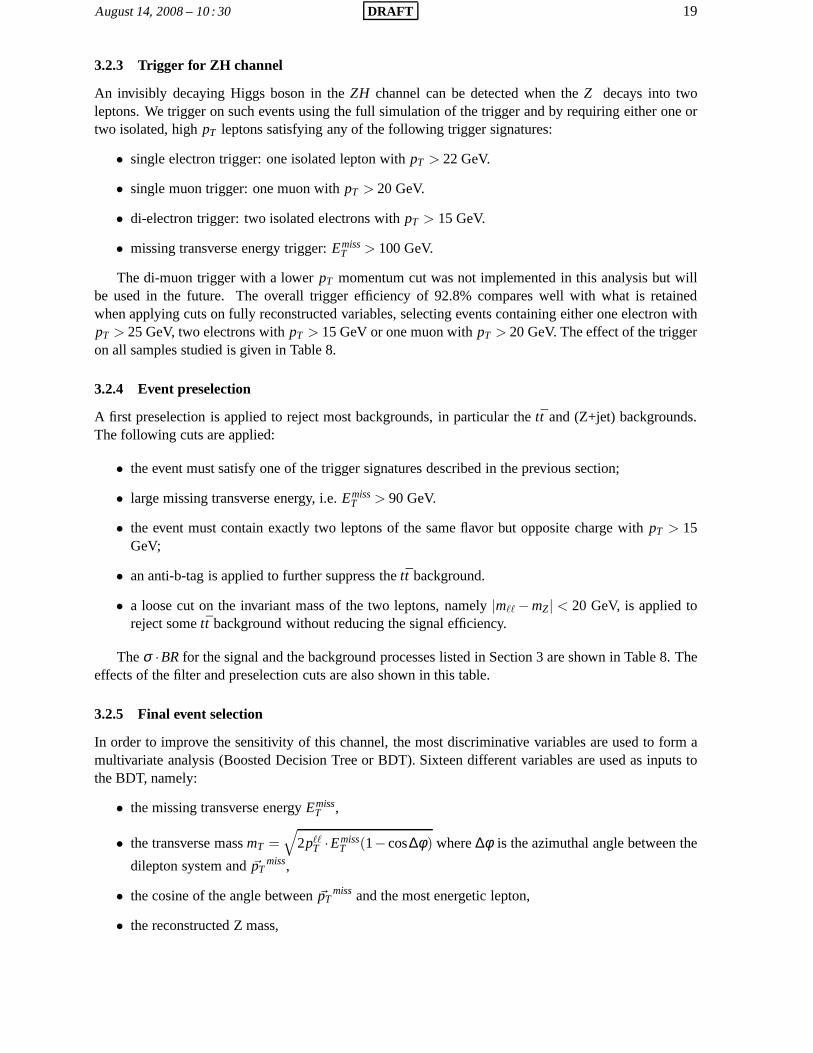
In order to improve the sensitivity of this channel, the mostdiscriminative variables are used to form amultivariate analysis (Boosted Decision Tree or BDT). Sixteen different variables are used as inputs tothe BDT, namely:
• the missing transverse energyEmissT ,
• the transverse massmT =√
2pℓℓT ·Emiss
T (1−cos∆φ) where∆φ is the azimuthal angle between the
dilepton system and~pTmiss,
• the cosine of the angle between~pTmiss and the most energetic lepton,
• the reconstructed Z mass,
August 14, 2008 – 10 : 30 DRAFT 20
• the transverse momentum of each lepton,
• the cosine of the angle between the two leptons in the transverse plane and in 3-dimensions,
• the cosine of the angle between~pTmiss and ~pT
Z,
• the cosine of the angle between the most energetic jet and~pTmiss,
• the energy found in a cone∆R = 0.1 rad around each lepton; the lepton isolation variableis partic-ularly useful for muons where very little energy is found around isolated muons but not so muchfor electrons where the energy deposit is much wider,
• the energy of each of the three most energetic jets, and
• the total number of jets.
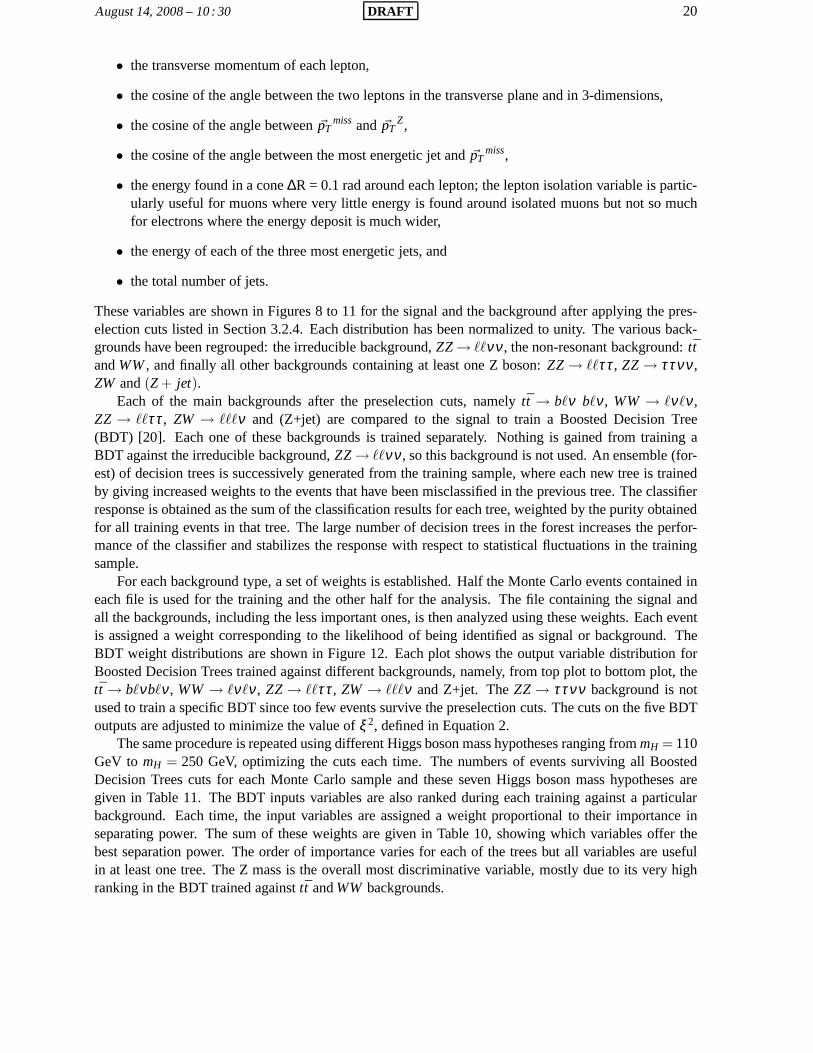
These variables are shown in Figures 8 to 11 for the signal andthe background after applying the pres-election cuts listed in Section 3.2.4. Each distribution has been normalized to unity. The various back-grounds have been regrouped: the irreducible background,ZZ → ℓℓνν , the non-resonant background:ttandWW , and finally all other backgrounds containing at least one Z boson: ZZ → ℓℓττ , ZZ → ττνν ,ZW and(Z + jet).
Each of the main backgrounds after the preselection cuts, namely tt → bℓν bℓν , WW → ℓνℓν ,ZZ → ℓℓττ , ZW → ℓℓℓν and (Z+jet) are compared to the signal to train a Boosted Decision Tree(BDT) [20]. Each one of these backgrounds is trained separately. Nothing is gained from training aBDT against the irreducible background,ZZ → ℓℓνν , so this background is not used. An ensemble (for-est) of decision trees is successively generated from the training sample, where each new tree is trainedby giving increased weights to the events that have been misclassified in the previous tree. The classifierresponse is obtained as the sum of the classification resultsfor each tree, weighted by the purity obtainedfor all training events in that tree. The large number of decision trees in the forest increases the perfor-mance of the classifier and stabilizes the response with respect to statistical fluctuations in the trainingsample.
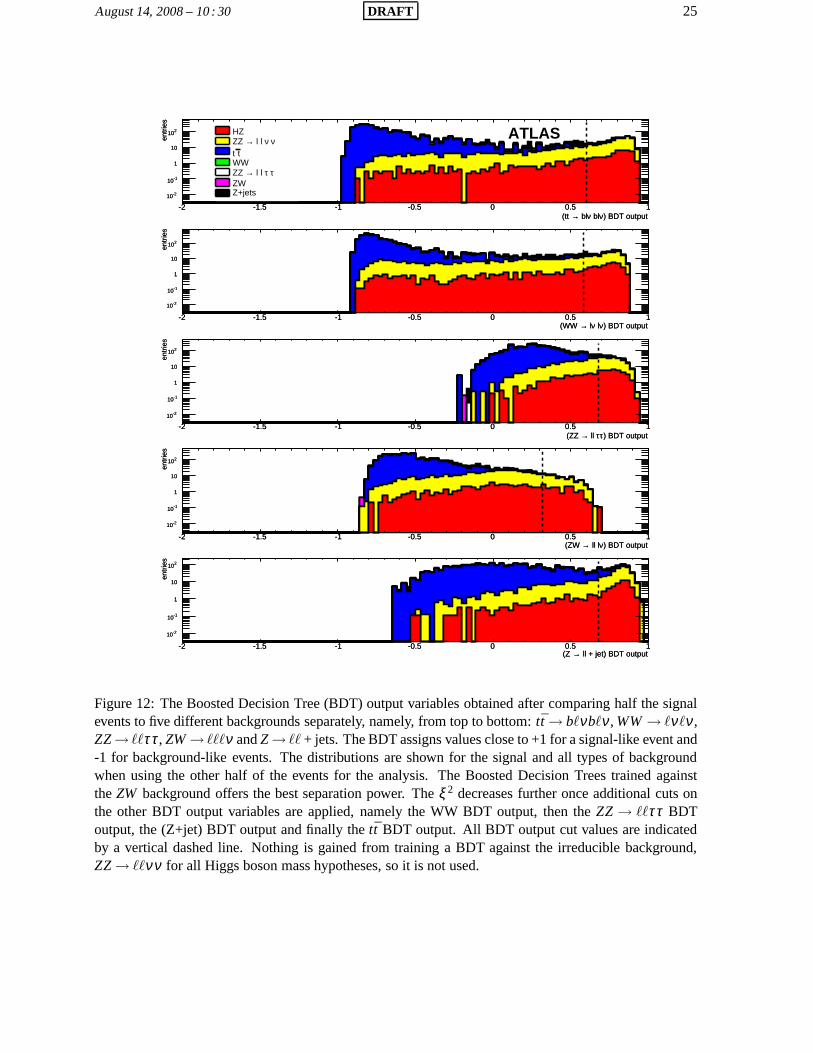
For each background type, a set of weights is established. Half the Monte Carlo events contained ineach file is used for the training and the other half for the analysis. The file containing the signal andall the backgrounds, including the less important ones, is then analyzed using these weights. Each eventis assigned a weight corresponding to the likelihood of being identified as signal or background. TheBDT weight distributions are shown in Figure 12. Each plot shows the output variable distribution forBoosted Decision Trees trained against different backgrounds, namely, from top plot to bottom plot, thett → bℓνbℓν , WW → ℓνℓν , ZZ → ℓℓττ , ZW → ℓℓℓν and Z+jet. TheZZ → ττνν background is notused to train a specific BDT since too few events survive the preselection cuts. The cuts on the five BDToutputs are adjusted to minimize the value ofξ 2, defined in Equation 2.
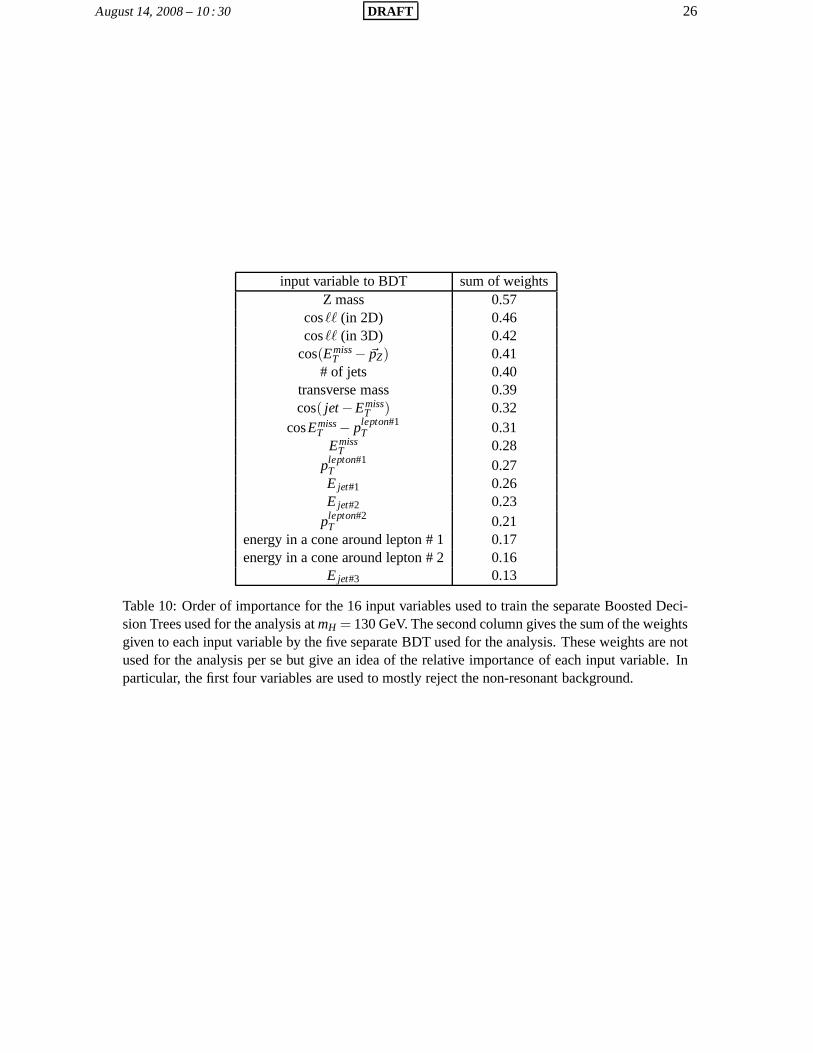
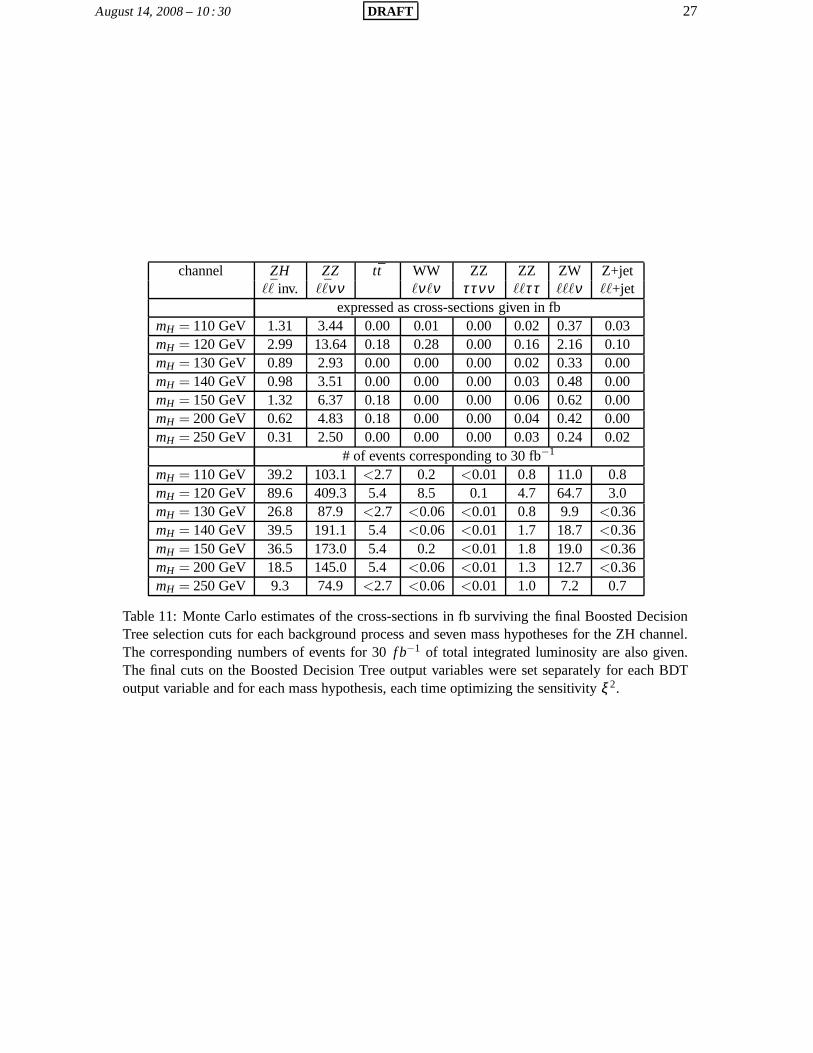
The same procedure is repeated using different Higgs boson mass hypotheses ranging frommH = 110GeV to mH = 250 GeV, optimizing the cuts each time. The numbers of eventssurviving all BoostedDecision Trees cuts for each Monte Carlo sample and these seven Higgs boson mass hypotheses aregiven in Table 11. The BDT inputs variables are also ranked during each training against a particularbackground. Each time, the input variables are assigned a weight proportional to their importance inseparating power. The sum of these weights are given in Table10, showing which variables offer thebest separation power. The order of importance varies for each of the trees but all variables are usefulin at least one tree. The Z mass is the overall most discriminative variable, mostly due to its very highranking in the BDT trained againsttt andWW backgrounds.
August 14, 2008 – 10 : 30 DRAFT 21
)lepton 1
T - pmiss
Tcos(E
-1 -0.5 0 0.5 1
arb
itra
ry u
nit
s
-310
-210
-110
)lepton 1
T - pmiss
Tcos(E
-1 -0.5 0 0.5 1
arb
itra
ry u
nit
s
-310
-210
-110
cosMETPtlep
(GeV)Zm75 80 85 90 95 100 105 110
arb
itra
ry u
nit
s
0
0.02
0.04
0.06
0.08
0.1
(GeV)Zm75 80 85 90 95 100 105 110
arb
itra
ry u
nit
s
0
0.02
0.04
0.06
0.08
0.1
mZll
(GeV)missTE
50 100 150 200 250 300 350 400 450 500
arb
itra
ry u
nit
s
0
0.02
0.04
0.06
0.08
0.1
0.12
0.14
0.16
0.18
0.2
(GeV)missTE
50 100 150 200 250 300 350 400 450 500
arb
itra
ry u
nit
s
0
0.02
0.04
0.06
0.08
0.1
0.12
0.14
0.16
0.18
0.2
HZ
ν ν l l → ZZ
t WW, t
, ZW, Z + jetτ τ l l → ZZ
MET
(GeV)Tm0 100 200 300 400 500 600 700
arb
itra
ry u
nit
s0
0.01
0.02
0.03
0.04
0.05
0.06
0.07
0.08
0.09
(GeV)Tm0 100 200 300 400 500 600 700
arb
itra
ry u
nit
s0
0.01
0.02
0.03
0.04
0.05
0.06
0.07
0.08
0.09
mt
ATLAS
Figure 8: Input variables used by the Boosted Decision Tree for the signal withmH = 130 GeV and themain backgrounds. Top left: MissingET . Top right: transverse mass, defined as the reconstructed massin the transverse plane, namelym2
T = E2T − p2
T . Bottom left: cosine of the angle between the missingET
and highest momentum lepton in the transverse plane. Bottomright: reconstructed Z mass. Each plothas been normalized to unity. The combined samples had first been scaled to the same luminosity.

August 14, 2008 – 10 : 30 DRAFT 22
) in 2D2 - l1
cos(l-1 -0.5 0 0.5 1
arb
itra
ry u
nit
s
0
0.02
0.04
0.06
0.08
0.1
0.12
0.14
) in 2D2 - l1
cos(l-1 -0.5 0 0.5 1
arb
itra
ry u
nit
s
0
0.02
0.04
0.06
0.08
0.1
0.12
0.14
cosll2D
) in 3D2 - l1
cos(l-1 -0.5 0 0.5 1
arb
itra
ry u
nit
s
0
0.01
0.02
0.03
0.04
0.05
0.06
0.07
0.08
0.09
) in 3D2 - l1
cos(l-1 -0.5 0 0.5 1
arb
itra
ry u
nit
s
0
0.01
0.02
0.03
0.04
0.05
0.06
0.07
0.08
0.09
cosll3D
(GeV)lepton 1
Tp
0 50 100 150 200 250 300
arb
itra
ry u
nit
s
0
0.02
0.04
0.06
0.08
0.1
(GeV)lepton 1
Tp
0 50 100 150 200 250 300
arb
itra
ry u
nit
s
0
0.02
0.04
0.06
0.08
0.1 HZ
ν ν l l → ZZ
t WW, t
, ZW, Z + jetτ τ l l → ZZ
pt_lepton 1
(GeV)lepton 2
Tp
0 10 20 30 40 50 60 70 80 90 100ar
bit
rary
un
its
0
0.01
0.02
0.03
0.04
0.05
0.06
0.07
(GeV)lepton 2
Tp
0 10 20 30 40 50 60 70 80 90 100ar
bit
rary
un
its
0
0.01
0.02
0.03
0.04
0.05
0.06
0.07
pt_lepton 2
ATLAS
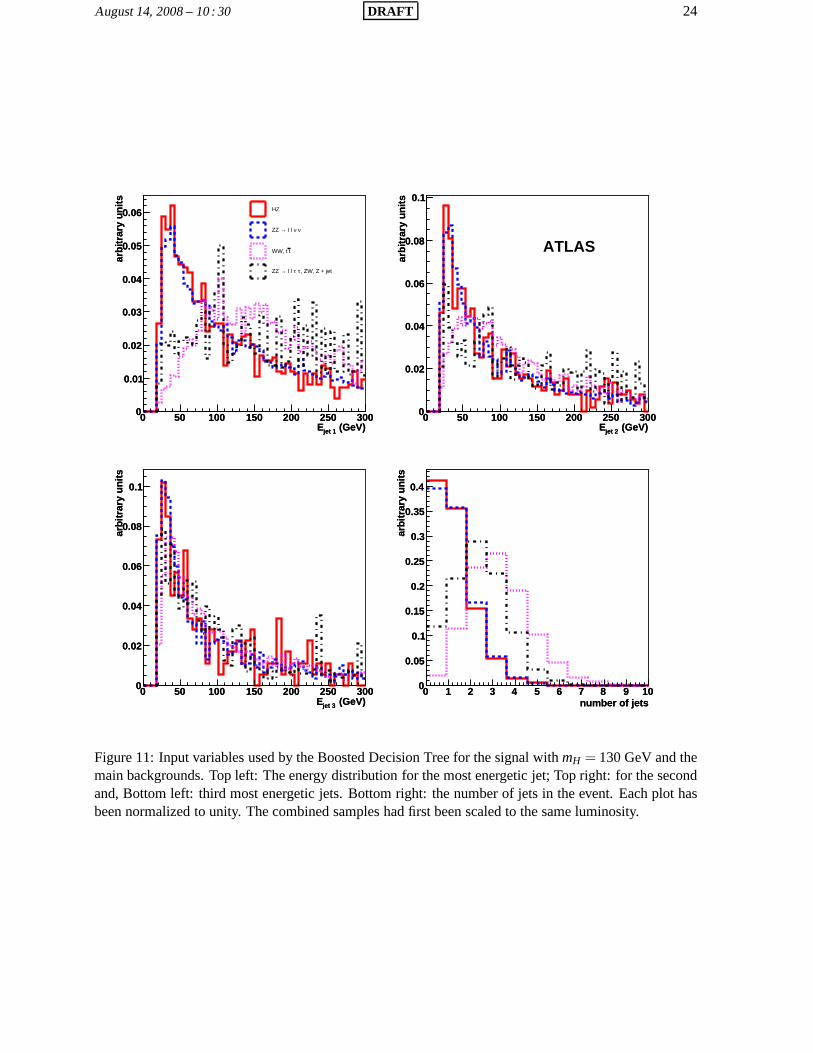
Figure 9: Input variables used by the Boosted Decision Tree for the signal withmH = 130 GeV and themain backgrounds. Top left: Transverse momentum of the mostenergetic lepton. Top right: Transversemomentum of the second lepton. Bottom left: Cosine of the angle between the two leptons in thetransverse plane and, Bottom right: in 3-dimensions. Each plot has been normalized to unity. Thecombined samples had first been scaled to the same luminosity.
August 14, 2008 – 10 : 30 DRAFT 23
energy in cone around lepton 1 (GeV)0 50 100 150 200 250 300
arb
itra
ry u
nit
s
-510
-410
-310
-210
-110
energy in cone around lepton 1 (GeV)0 50 100 150 200 250 300
arb
itra
ry u
nit
s
-510
-410
-310
-210
-110
cone1
energy in cone around lepton 2 (GeV)0 50 100 150 200 250 300
arb
itra
ry u
nit
s
-410
-310
-210
-110
energy in cone around lepton 2 (GeV)0 50 100 150 200 250 300
arb
itra
ry u
nit
s
-410
-310
-210
-110
cone2
)Z
- pmiss
Tcos(E
-1 -0.5 0 0.5 1
arb
itra
ry u
nit
s
-310
-210
-110
1
)Z
- pmiss
Tcos(E
-1 -0.5 0 0.5 1
arb
itra
ry u
nit
s
-310
-210
-110
1 HZ
ν ν l l → ZZ
t WW, t
, ZW, Z + jetτ τ l l → ZZ
cos Phi
)missT - E
1cos(jet
-1 -0.5 0 0.5 1ar
bit
rary
un
its
-210
-110
)missT - E
1cos(jet
-1 -0.5 0 0.5 1ar
bit
rary
un
its
-210
-110
cosJetMET
ATLAS
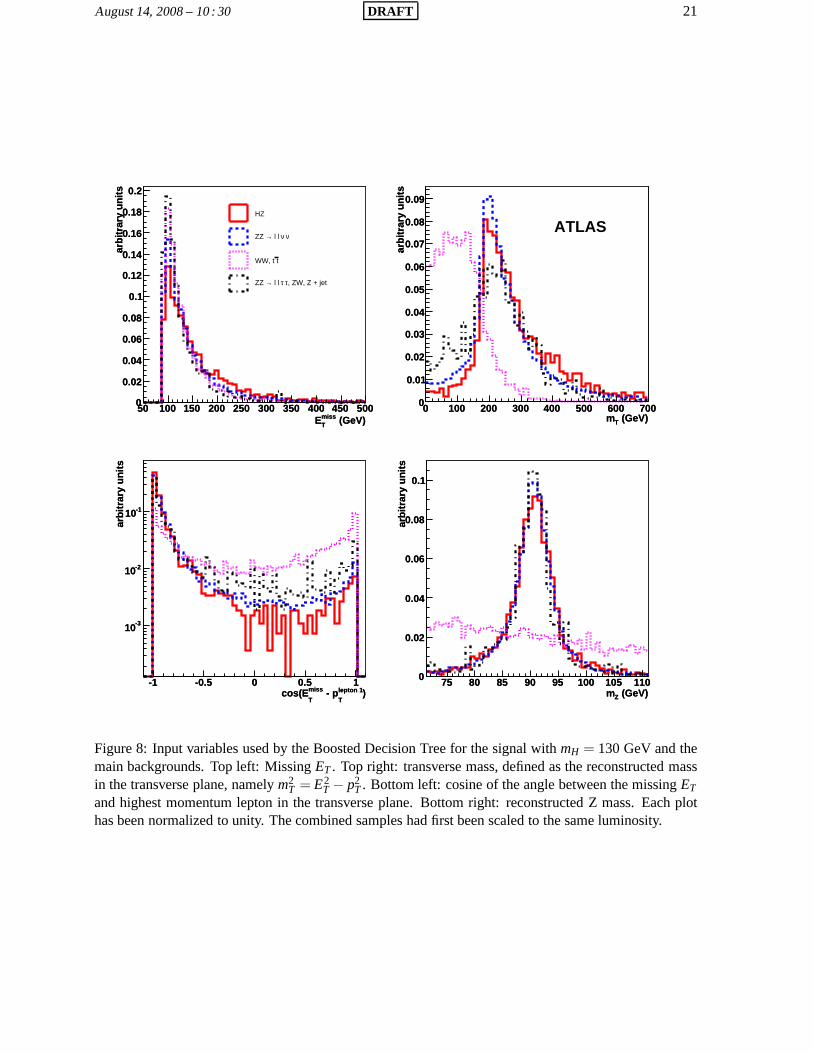
Figure 10: Input variables used by the Boosted Decision Treefor the signal withmH = 130 GeV andthe main backgrounds. Top left: The cosine of the angle between the direction of missingET and thereconstructed Z transverse momentum. Top right: The cosineof the angle between the most energeticjet and the direction of missingET . Bottom left: The energy contained in a cone of 0.10 rad aroundthe most energetic lepton. Bottom right: The energy contained in a cone of 0.10 rad around the secondlepton. Each plot has been normalized to unity. The combinedsamples had first been scaled to the sameluminosity.
August 14, 2008 – 10 : 30 DRAFT 24
(GeV)jet 3E0 50 100 150 200 250 300
arb
itra
ry u
nit
s
0
0.02
0.04
0.06
0.08
0.1
(GeV)jet 3E0 50 100 150 200 250 300
arb
itra
ry u
nit
s
0
0.02
0.04
0.06
0.08
0.1
ejet3
number of jets0 1 2 3 4 5 6 7 8 9 10
arb
itra
ry u
nit
s
0
0.05
0.1
0.15
0.2
0.25
0.3
0.35
0.4
number of jets0 1 2 3 4 5 6 7 8 9 10
arb
itra
ry u
nit
s
0
0.05
0.1
0.15
0.2
0.25
0.3
0.35
0.4
njet
(GeV)jet 1E0 50 100 150 200 250 300
arb
itra
ry u
nit
s
0
0.01
0.02
0.03
0.04
0.05
0.06
(GeV)jet 1E0 50 100 150 200 250 300
arb
itra
ry u
nit
s
0
0.01
0.02
0.03
0.04
0.05
0.06 HZ
ν ν l l → ZZ
t WW, t
, ZW, Z + jetτ τ l l → ZZ
ejet1
(GeV)jet 2E0 50 100 150 200 250 300
arb
itra
ry u
nit
s0
0.02
0.04
0.06
0.08
0.1
(GeV)jet 2E0 50 100 150 200 250 300
arb
itra
ry u
nit
s0
0.02
0.04
0.06
0.08
0.1
ejet2
ATLAS
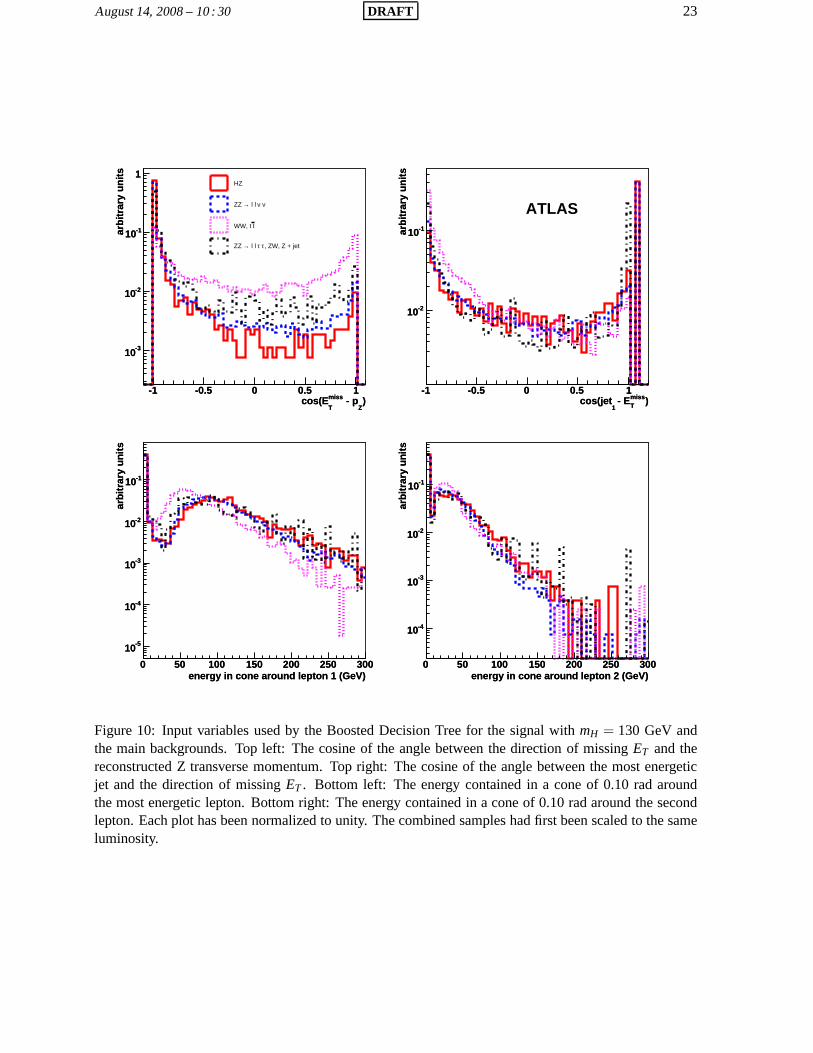
Figure 11: Input variables used by the Boosted Decision Treefor the signal withmH = 130 GeV and themain backgrounds. Top left: The energy distribution for themost energetic jet; Top right: for the secondand, Bottom left: third most energetic jets. Bottom right: the number of jets in the event. Each plot hasbeen normalized to unity. The combined samples had first beenscaled to the same luminosity.
August 14, 2008 – 10 : 30 DRAFT 25
ll + jet) BDT output→(Z -2 -1.5 -1 -0.5 0 0.5 1
entr
ies
-210
-110
1
10
210
ll + jet) BDT output→(Z -2 -1.5 -1 -0.5 0 0.5 1
entr
ies
-210
-110
1
10
210
) BDT outputν ll l→(ZW -2 -1.5 -1 -0.5 0 0.5 1
entr
ies
-210
-110
1
10
210
) BDT outputν ll l→(ZW -2 -1.5 -1 -0.5 0 0.5 1
entr
ies
-210
-110
1
10
210
) BDT outputττ ll →(ZZ -2 -1.5 -1 -0.5 0 0.5 1
entr
ies
-210
-110
1
10
210
) BDT outputττ ll →(ZZ -2 -1.5 -1 -0.5 0 0.5 1
entr
ies
-210
-110
1
10
210
) BDT outputν lν l→(WW -2 -1.5 -1 -0.5 0 0.5 1
entr
ies
-210
-110
1
10
210
) BDT outputν lν l→(WW -2 -1.5 -1 -0.5 0 0.5 1
entr
ies
-210
-110
1
10
210
) BDT outputν blν bl→(tt -2 -1.5 -1 -0.5 0 0.5 1
entr
ies
-210
-110
1
10
210
) BDT outputν blν bl→(tt -2 -1.5 -1 -0.5 0 0.5 1
entr
ies
-210
-110
1
10
210 HZν ν l l →ZZ
ttWW
τ τ l l →ZZ ZWZ+jets
ATLAS
Figure 12: The Boosted Decision Tree (BDT) output variablesobtained after comparing half the signalevents to five different backgrounds separately, namely, from top to bottom:tt → bℓνbℓν , WW → ℓνℓν ,ZZ → ℓℓττ , ZW → ℓℓℓν andZ → ℓℓ + jets. The BDT assigns values close to +1 for a signal-like event and-1 for background-like events. The distributions are shownfor the signal and all types of backgroundwhen using the other half of the events for the analysis. The Boosted Decision Trees trained againsttheZW background offers the best separation power. Theξ 2 decreases further once additional cuts onthe other BDT output variables are applied, namely the WW BDToutput, then theZZ → ℓℓττ BDToutput, the (Z+jet) BDT output and finally thett BDT output. All BDT output cut values are indicatedby a vertical dashed line. Nothing is gained from training a BDT against the irreducible background,ZZ → ℓℓνν for all Higgs boson mass hypotheses, so it is not used.
August 14, 2008 – 10 : 30 DRAFT 26
input variable to BDT sum of weightsZ mass 0.57
cosℓℓ (in 2D) 0.46cosℓℓ (in 3D) 0.42
cos(EmissT − ~pZ) 0.41
# of jets 0.40transverse mass 0.39cos( jet −Emiss
T ) 0.32cosEmiss
T − plepton#1T 0.31
EmissT 0.28
plepton#1T 0.27E jet#1 0.26E jet#2 0.23
plepton#2T 0.21
energy in a cone around lepton # 1 0.17energy in a cone around lepton # 2 0.16
E jet#3 0.13
Table 10: Order of importance for the 16 input variables usedto train the separate Boosted Deci-sion Trees used for the analysis atmH = 130 GeV. The second column gives the sum of the weightsgiven to each input variable by the five separate BDT used for the analysis. These weights are notused for the analysis per se but give an idea of the relative importance of each input variable. Inparticular, the first four variables are used to mostly reject the non-resonant background.
August 14, 2008 – 10 : 30 DRAFT 27
channel ZH ZZ tt WW ZZ ZZ ZW Z+jetℓℓ inv. ℓℓνν ℓνℓν ττνν ℓℓττ ℓℓℓν ℓℓ+jet
expressed as cross-sections given in fbmH = 110 GeV 1.31 3.44 0.00 0.01 0.00 0.02 0.37 0.03mH = 120 GeV 2.99 13.64 0.18 0.28 0.00 0.16 2.16 0.10mH = 130 GeV 0.89 2.93 0.00 0.00 0.00 0.02 0.33 0.00mH = 140 GeV 0.98 3.51 0.00 0.00 0.00 0.03 0.48 0.00mH = 150 GeV 1.32 6.37 0.18 0.00 0.00 0.06 0.62 0.00mH = 200 GeV 0.62 4.83 0.18 0.00 0.00 0.04 0.42 0.00mH = 250 GeV 0.31 2.50 0.00 0.00 0.00 0.03 0.24 0.02
# of events corresponding to 30 fb−1
mH = 110 GeV 39.2 103.1 <2.7 0.2 <0.01 0.8 11.0 0.8mH = 120 GeV 89.6 409.3 5.4 8.5 0.1 4.7 64.7 3.0mH = 130 GeV 26.8 87.9 <2.7 <0.06 <0.01 0.8 9.9 <0.36mH = 140 GeV 39.5 191.1 5.4 <0.06 <0.01 1.7 18.7 <0.36mH = 150 GeV 36.5 173.0 5.4 0.2 <0.01 1.8 19.0 <0.36mH = 200 GeV 18.5 145.0 5.4 <0.06 <0.01 1.3 12.7 <0.36mH = 250 GeV 9.3 74.9 <2.7 <0.06 <0.01 1.0 7.2 0.7
Table 11: Monte Carlo estimates of the cross-sections in fb surviving the final Boosted DecisionTree selection cuts for each background process and seven mass hypotheses for the ZH channel.The corresponding numbers of events for 30f b−1 of total integrated luminosity are also given.The final cuts on the Boosted Decision Tree output variables were set separately for each BDToutput variable and for each mass hypothesis, each time optimizing the sensitivityξ 2.

August 14, 2008 – 10 : 30 DRAFT 28
3.3 Systematic uncertainties
3.3.1 Background cross-section
Since this is a counting experiment, one is looking for events in excess of what is expected by theStandard Model. However, exactly what is expected from Standard Model backgrounds is not wellknown, given the theoretical uncertainties on the StandardModel production cross-sections and this leadsto the main source of systematic uncertainty. The current best estimates for each of these cross-sectionsfrom the next-to-leading order calculation is about 6% forZZ and 5% forZW [21]. The uncertainty onthe (Z+jet) cross-section has no impact on the final results since this background is negligible. Severalcontrol samples can be used to constrain the ZZ and ZW cross-sections. ForZZ, one can use the fourlepton final state (even includingτ) but this will require a large data sample (of the order of at least30 f b−1) to reduce the statistical uncertainty. For the ZW cross-section, one can use a ZW controlsample with events containing three identified leptons. Both these cross-sections will be measured inATLAS data. Uncertainties associated with kinematic distributions have not been taken into account atthis point. A combined theoretical uncertainty of 5.8% obtained from a weighted average is assigned tothe background production cross-section.
One could in principle useZZ → ℓℓℓℓ events from data to calibrate the number of events comingfrom ZZ → ℓℓνν decays. Such an approach was proposed in [22] where one wouldfirst select a puresample ofZZ → ℓℓℓℓ events by finding two Z bosons, then declaring one Z to decay invisibly. Thiswould work in the absence of other backgrounds but it is not possible to completely eliminate theZW →ℓℓℓν background. More importantly, such a technique has a very low efficiency: about 1.8% of allZZ → ℓℓℓℓ survive the preselection cuts, withℓ here beinge,µ or τ . Only a dozen of events wouldsurvive all of the BDT selection cuts for 30 fb−1 of data. Hence, it is deemed impossible to calibratequantitatively theZZ → ℓℓℓℓ cross-section using this technique. However, one could still check the effectof the preselection cuts onZZ → ℓℓℓℓ events with two leptons declared invisible as described above toensure that the main and irreducible background,ZZ → ℓℓνν , behaves as expected under these cuts.About 85ZZ → ℓℓℓℓ events are expected to pass the preselection cuts, as opposed to 163ZZ → ℓℓννevents for 30 fb−1 of integrated luminosity. After the preselection cuts, theZZ → ℓℓνν backgroundcorresponds to about 36% of the total number of selected events in the absence of non Standard Modelcontributions, as seen from Table 8. This method would provide a normalization of the cross-sectionusing data at about 11% uncertainty level.
3.3.2 Effect related to the training of the Boosted Decision Tree
Since half the events are used for training the BDT, and the other half for testing, this arbitrary choicehas a slight effect on the outcome. For the central value of this analysis, we used every other event forthe training. To estimate the effect of this choice, the analysis was redone using the first half of the eventsfor training, and the second half for testing. Since we are only using Monte Carlo events, this secondchoice does not introduce additional time-dependent effects that one would expect with real data. Thedifference in the results, namely+0.2% signal events and+0.7% background events, is ascribed as acontribution to the systematic uncertainty.
3.3.3 Lepton momentum resolution effect and energy scale effect
Different tests are done to assess the contributions to the systematic uncertainty from the lepton momen-tum resolution and the uncertainty on the lepton energy scale. Each time, new modified input variablesare used to retrain the BDT and assess the overall effect by comparing the new number of selected signaland background events to the original numbers of events selected. All contributions to the systematicuncertainty are summarized in Table 12.

August 14, 2008 – 10 : 30 DRAFT 29
signal backgroundelectron reconstruction efficiency ±0.2% ±0.2%electronpT resolution (±0.73%) +0.5% +1.7%electron energy scale (±0.5%) +1.1% +2.1%
sub-total for electrons (43% of events) +1.2% -0.2% +2.7% - 0.2%muon reconstruction efficiency ±1.0% ±1.0%
muonpT resolution (see formula in text) +1.1% +1.9%muon energy scale (±1%) +1.0% +2.2%
sub-total for muons (57% of events) +1.8% - 1.0% +3.1% - 1.0%
combined contributions for leptons +1.5% - 0.7% +2.9% - 0.7%jet energy scale (±7% or±15%) +0.8% +0.2% - 2.2%
jet energy resolution effect onEmissT -2.2% -0.4%
luminosity - ±3.0%cross-section - ±5.8%filter effects ±1.4% ±1.4%
Boosted Decision Tree training effects ±0.2% ±0.7%total +2.2% - 2.6 % +7.3% - 7.1%
Table 12: Contributions to the systematic uncertainties. The Higgs boson mass was set to 130GeV to assess these uncertainties. The final background uncertainty is rounded-off to±7.2%.
The tests performed are:
• The lepton momenta are smeared using a Gaussian distribution. A constant sigma of 0.73% isused for electrons. For muons, the sigma is calculated usingthe following formula: σ(pT ) =[(0.011· pT )2 + (0.00017· p2
T )2]1/2/pT with pT in GeV. The smearing is applied to one type ofleptons at a time.
• For each type of lepton, a multiplicative scaling factor is applied to simulate an energy scaleuncertainty of±0.5% for electrons and±1.0% for muons.
3.3.4 Jet momentum resolution effect and energy scale effect
Three different modifications are done in turn to the jet energy to evaluate the contributions from thejet energy scale and jet energy resolution to the missing energy evaluation. After each modification, themissingET is recalculatedEach contribution is shown in Table 12. The three modifications made to thejet energy are:
• Jet energy scale: the jet energy is increased by±7% for jets withinη ≤ 3.2 and±15% for jetswithin η > 3.2.
• Jet energy resolution: the jet energy is smeared using a Gaussian by 0.45·√
E for jets withinη ≤ 3.2 and 0.63·
√E for η > 3.2.
3.4 Results for the ZH channel
The sensitivity with 30 fb−1 of data is evaluated in terms ofξ 2 with ξ 2 = 1.64σB/NS for a 95% CL as forthe VBF analysis whereσB is the combined statistical and systematic uncertainty as detailed in Section2.5. The values ofξ 2 are summarized in Table 13.

August 14, 2008 – 10 : 30 DRAFT 30
mH # signal # background σB ξ 2
110 GeV 39.2 115.9 13.6 56.7%120 GeV 82.5 449.4 38.3 76.2%130 GeV 26.8 98.6 12.2 74.4%140 GeV 39.5 217.0 21.3 88.5%150 GeV 36.5 199.4 20.0 89.9%200 GeV 18.5 164.4 17.3 153.4%250 GeV 9.3 83.8 10.9 191.6%
Table 13: The sensitivity with 30 fb−1 at 95% confidence level calculated in terms ofξ 2 for sevendifferent mass hypotheses for the ZH channel.
3.5 Cross-checks with a cut-based analysis
To ensure that the Boosted Decision Tree performed as expected, we used the same cuts as used in aprevious ATLAS analysis performed using a simple cuts approach [22]. The same cuts as in Ref. [22]were applied to our current Monte Carlo samples after the filter and trigger cuts of this analysis, andusing the signal generated withmH = 130 GeV. The cuts applied are:
1. Filter cuts as in this analysis
2. Trigger cuts as in this analysis
3. Lepton cuts: select events containing no more than two leptons withpT > 7 GeV. Electrons musthavepT > 15 GeV within|η | < 2.5 and muons are selected ifpT > 10 GeV and|η | < 2.4. Twoleptons of the same flavor but opposite charge are required.
4. Z mass: the recontructedZ mass must be within 10 GeV from the pole mass.
5. EmissT > 100 GeV.
6. Jet veto: all events containing a jet havingpT > 30 GeV within|η | < 4.9 are rejected.
7. b-jet veto: all events containing a b-tagged jet having atpT > 15 GeV within|η |< 4.9 are rejected.
8. Transverse mass:mT > 200 GeV.
The two analyses can be compared after the MET cut. The sensitivity with 30 fb−1 at 95% confidencelevel calculated in terms ofξ 2 for this cut-based analysis is 87.9% formH = 130 GeV. This compareswell with what was obtained with the BDT technique (ξ 2 = 74.4% for the same mass value with the BDTapproach). The difference in sensitivity increases further for higher Higgs mass hypotheses. The resultsare given in Table 14.
4 Comparison of results and summary
The sensitivity of ATLAS to an invisibly decaying Higgs boson produced via the VBF andZH channelhas been examined. A comparison between the sensitivities of the two channels can be seen in Figure 13.This plot shows that the channels have a similar sensitivityfor low Higgs boson masses. It is possibleto look at combined statistics for the ZH analysis and the VBFshape analyses although the analysistechniques are different. Clearly the improvement in sensitivity by combining statistics is not large. Of

August 14, 2008 – 10 : 30 DRAFT 31
channel ZH ZZ tt WW ZZ ZZ ZW Z+jetℓℓ inv. ℓℓνν ℓνℓν ττνν ℓℓττ ℓℓℓν ℓℓ+jet
σ*BR in fb 46.2 728.0 833000.0 5245.6 364.0 123.0 820.0 3105062.8after filter 34.9 212.6 9412.9 236.5 18.8 87.8 820.0 478.4
after trigger 32.5 198.5 8620.6 217.1 14.2 77.8 735.3 460.6pT lepton +ID + charge cut 23.8 148.1 4451.2 158.4 2.7 37.6 177.5 221.6
aftermZ ±10 GeV cut 20.7 133.0 1654.7 51.1 0.0 28.8 125.4 192.9afterEmiss
T > 100 cut 7.4 44.9 460.7 7.3 0.0 0.8 13.7 27.9no jet with pT > 30 GeV 4.2 23.7 5.8 0.8 0.0 0.3 4.2 0.1
b-tag cut for jet withpT > 15 GeV 4.2 23.6 4.8 0.8 0.0 0.3 4.1 0.1aftermT > 200 GeV cut 3.9 21.3 0.5 0.4 0.0 0.3 3.4 0.1
Table 14: Monte Carlo estimates of the cross-sections in fb after applying simple cuts for eachbackground process and one mass hypothesis ofmH = 130 GeV for the ZH channel. The corre-spondingξ 2 would be 87.9%.
far greater significance in the analysis of real ATLAS data would be the observation of a significantexcess of events in two different and distinct channels. An observation of this kind would give credibilityto the hypothesis that a particle is being generated that behaves like a Higgs boson and decays invisibly.
In summary, a study using fully simulated ATLAS data has shown that the ATLAS experiment willbe sensitive to an invisibly decaying Higgs boson in both theVBF andZH production channels assumingonly Standard Model backgrounds. It is clear that the analysis will require a good understanding of theexperimental systematic uncertainties. If the decay of a Higgs boson was entirely in the invisible mode,this analysis has shown that with 30 fb−1of data, ATLAS will be sensitive to a situation in which thebeyond the Standard Model cross-section is of the order of 80% the Standard Model Higgs boson cross-sections for a Higgs Boson mass of less than 150 GeV. The VBF analysis has a sensitivity of better than90% up to a Higgs Boson mass of 250 GeV.
References
[1] K. Greist, H. E. Haber, Phys. Rev.D37 (1988) 719; A. Djouadi, J. Kalinowski, P. M. Zerwas, Z.Phys.C57 (1993) 569; A. Djouadi, P. Janot, J. Kalinowski, P. M. Zerwas, Phys. Lett.B376(1996)220; I. Antoniadis, M. Tuckmantel, F. Zwirner, Nucl. Phys.B707 (2005) 215.
[2] J. C. Romao, F. de Campos, J. W. F. Valle, Phys. Lett.B292 (1992) 329; M. Hirsch, J. C. Romao,J. W. F. Valle; A. V. Moral,Invisible Higgs Boson Decays in Spontaneously Broken R-Parity, hep-ph/0407269.
[3] N. Arkani-Hamed, S. Dimopoulos, G. Dvali, J. March-Russell, Phys. Rev.D024032 (2002) 1264;A. Datta, K. Huitu, J. Laamanen, B. Mukhopadhyaya, Phys. Rev. D70 (2004) 075003; K. M. Be-lotsky, V. A. Khoze, A. D. Martin, M. G. Ryskin, Eur. Phys. J.C36 (2004) 503; D. Dominici, hep-ph/0408087 (2004); J. Laamanen, hep-ph/0505104 (2005); D.Dominici, hep-ph/0503216 (2005);M. Battaglia, D. Dominici, J. F. Gunion, J. D. Wells, hep-ph/0402062 (2004); A. Datta, K. Huitu,J. Laamanen, B. Mukhopadhyaya, Phys. Rev.D70 (2004) 075003.
[4] LEP Higgs Working Group,Searches for invisible Higgs bosons: Preliminary combined resultsusing LEP data collected at energies up to 209 GeV, hep-ex/0107032 (2001).
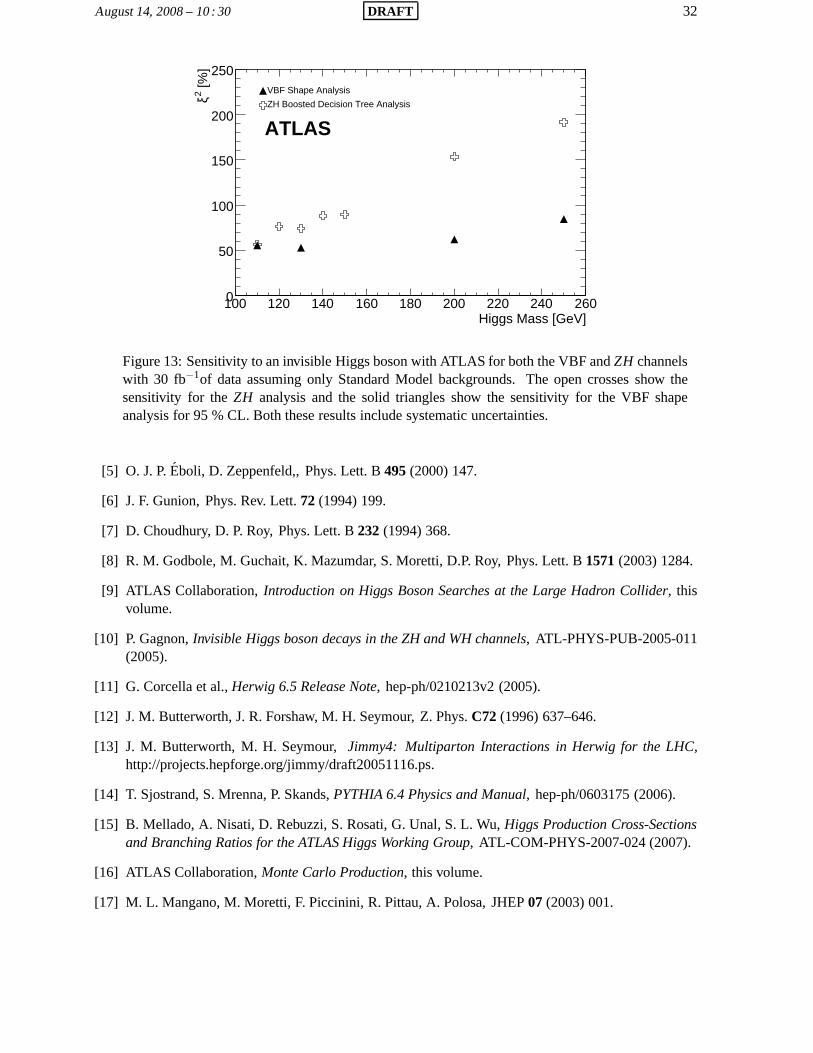
August 14, 2008 – 10 : 30 DRAFT 32
Higgs Mass [GeV]100 120 140 160 180 200 220 240 260
[%]
2 ξ
0
50
100
150
200
250
ATLAS
VBF Shape Analysis
ZH Boosted Decision Tree Analysis
Figure 13: Sensitivity to an invisible Higgs boson with ATLAS for both the VBF andZH channelswith 30 fb−1of data assuming only Standard Model backgrounds. The open crosses show thesensitivity for theZH analysis and the solid triangles show the sensitivity for the VBF shapeanalysis for 95 % CL. Both these results include systematic uncertainties.
[5] O. J. P.Eboli, D. Zeppenfeld,, Phys. Lett. B495 (2000) 147.
[6] J. F. Gunion, Phys. Rev. Lett.72 (1994) 199.
[7] D. Choudhury, D. P. Roy, Phys. Lett. B232 (1994) 368.
[8] R. M. Godbole, M. Guchait, K. Mazumdar, S. Moretti, D.P. Roy, Phys. Lett. B1571 (2003) 1284.
[9] ATLAS Collaboration,Introduction on Higgs Boson Searches at the Large Hadron Collider, thisvolume.
[10] P. Gagnon,Invisible Higgs boson decays in the ZH and WH channels, ATL-PHYS-PUB-2005-011(2005).
[11] G. Corcella et al.,Herwig 6.5 Release Note, hep-ph/0210213v2 (2005).
[12] J. M. Butterworth, J. R. Forshaw, M. H. Seymour, Z. Phys.C72 (1996) 637–646.
[13] J. M. Butterworth, M. H. Seymour,Jimmy4: Multiparton Interactions in Herwig for the LHC,http://projects.hepforge.org/jimmy/draft20051116.ps.
[14] T. Sjostrand, S. Mrenna, P. Skands,PYTHIA 6.4 Physics and Manual, hep-ph/0603175 (2006).
[15] B. Mellado, A. Nisati, D. Rebuzzi, S. Rosati, G. Unal, S.L. Wu, Higgs Production Cross-Sectionsand Branching Ratios for the ATLAS Higgs Working Group, ATL-COM-PHYS-2007-024 (2007).
[16] ATLAS Collaboration,Monte Carlo Production, this volume.
[17] M. L. Mangano, M. Moretti, F. Piccinini, R. Pittau, A. Polosa, JHEP07 (2003) 001.

August 14, 2008 – 10 : 30 DRAFT 33
[18] ATLAS Collaboration,Jet and Missing Et Combined Performance CSC Chapter, this volume; AT-LAS Collaboration,b-Tagging CSC Chapter, this volume; ATLAS Collaboration,Electron/PhotonCSC Chapter, this volume; ATLAS Collaboration,Muon CSC Chapter, this volume.
[19] ATLAS Collaboration,Cross-sections for Standard Model processes to be used in the ATLAS CSCnotes, this volume.
[20] A. Hocker et al.,TMVA - Toolkit for Multivariate Data Analysis, CERN-OPEN-2007-007, ACAT040, 2007, arXiv: physics/0703039, http://tmva.sf.net/.
[21] ATLAS Collaboration,Diboson Physics Studies With the ATLAS Detector, this volume.
[22] F. Meisel, M. Duhrssen, M. Heldmann, K. Jakobs,Study of the discovery potential for an invisiblydecaying Higgs boson via the associated ZH production in the ATLAS experiment, ATL-PHYS-PUB-2006-009 (2006).