Embed Size (px)
Citation preview
UNITED STATESSECURITIES AND EXCHANGE COMMISSION
WASHINGTON, D.C. 20549
Form 6-K
REPORT OF FOREIGN PRIVATE ISSUERPURSUANT TO RULE 13a-16 OR 15d-16
OF THE SECURITIES EXCHANGE ACT OF 1934
For the quarterly period ended June 30, 2021
Commission File Number 001-39237
ATLAS CORP.(Exact name of Registrant as specified in its Charter)
23 Berkeley SquareLondon, United Kingdom
W1J 6HE(Address of principal executive office)
Indicate by check mark whether the registrant files or will file annual reports under cover of Form 20-F or Form 40-F.Form 20-F ☒ Form 40-F ☐
Indicate by check mark if the registrant is submitting the Form 6-K in paper as permitted by Regulation S-T Rule 101 (b)(1). Yes ☐ No ☒
Indicate by check mark if the registrant is submitting the Form 6-K in paper as permitted by Regulation S-T Rule 101 (b)(7). Yes ☐ No ☒
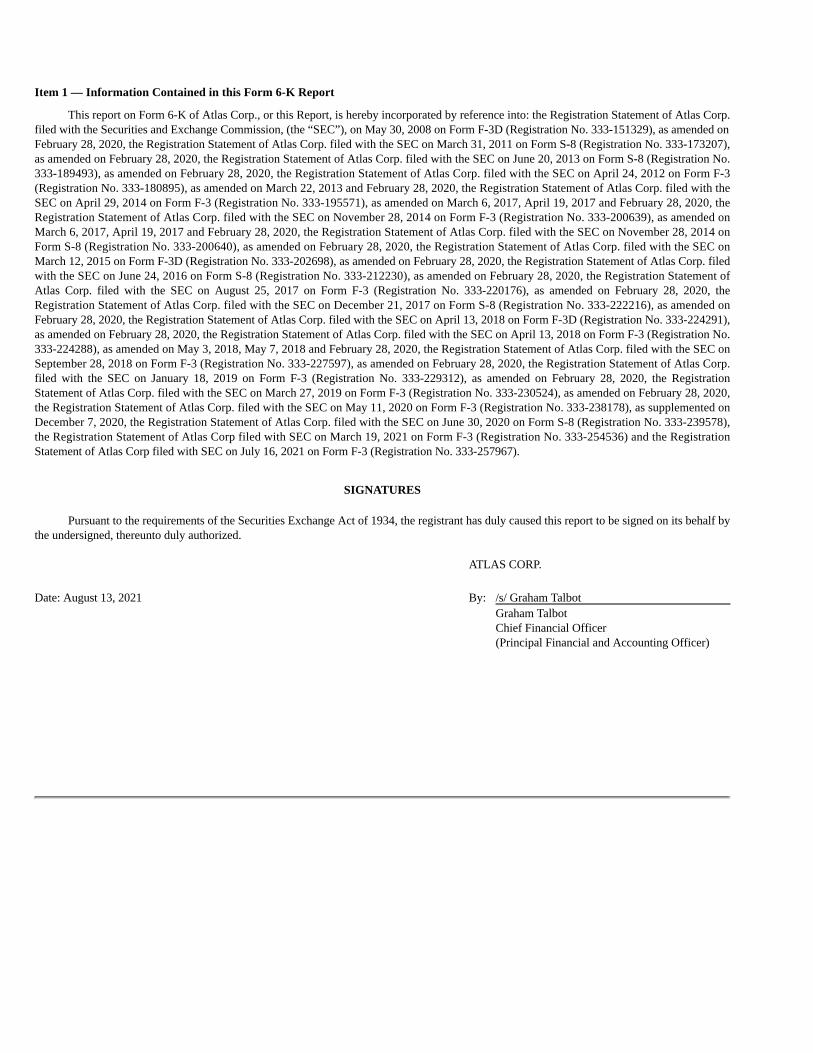
Item 1 — Information Contained in this Form 6-K Report
This report on Form 6-K of Atlas Corp., or this Report, is hereby incorporated by reference into: the Registration Statement of Atlas Corp.filed with the Securities and Exchange Commission, (the “SEC”), on May 30, 2008 on Form F-3D (Registration No. 333-151329), as amended onFebruary 28, 2020, the Registration Statement of Atlas Corp. filed with the SEC on March 31, 2011 on Form S-8 (Registration No. 333-173207),as amended on February 28, 2020, the Registration Statement of Atlas Corp. filed with the SEC on June 20, 2013 on Form S-8 (Registration No.333-189493), as amended on February 28, 2020, the Registration Statement of Atlas Corp. filed with the SEC on April 24, 2012 on Form F-3(Registration No. 333-180895), as amended on March 22, 2013 and February 28, 2020, the Registration Statement of Atlas Corp. filed with theSEC on April 29, 2014 on Form F-3 (Registration No. 333-195571), as amended on March 6, 2017, April 19, 2017 and February 28, 2020, theRegistration Statement of Atlas Corp. filed with the SEC on November 28, 2014 on Form F-3 (Registration No. 333-200639), as amended onMarch 6, 2017, April 19, 2017 and February 28, 2020, the Registration Statement of Atlas Corp. filed with the SEC on November 28, 2014 onForm S-8 (Registration No. 333-200640), as amended on February 28, 2020, the Registration Statement of Atlas Corp. filed with the SEC onMarch 12, 2015 on Form F-3D (Registration No. 333-202698), as amended on February 28, 2020, the Registration Statement of Atlas Corp. filedwith the SEC on June 24, 2016 on Form S-8 (Registration No. 333-212230), as amended on February 28, 2020, the Registration Statement ofAtlas Corp. filed with the SEC on August 25, 2017 on Form F-3 (Registration No. 333-220176), as amended on February 28, 2020, theRegistration Statement of Atlas Corp. filed with the SEC on December 21, 2017 on Form S-8 (Registration No. 333-222216), as amended onFebruary 28, 2020, the Registration Statement of Atlas Corp. filed with the SEC on April 13, 2018 on Form F-3D (Registration No. 333-224291),as amended on February 28, 2020, the Registration Statement of Atlas Corp. filed with the SEC on April 13, 2018 on Form F-3 (Registration No.333-224288), as amended on May 3, 2018, May 7, 2018 and February 28, 2020, the Registration Statement of Atlas Corp. filed with the SEC onSeptember 28, 2018 on Form F-3 (Registration No. 333-227597), as amended on February 28, 2020, the Registration Statement of Atlas Corp.filed with the SEC on January 18, 2019 on Form F-3 (Registration No. 333-229312), as amended on February 28, 2020, the RegistrationStatement of Atlas Corp. filed with the SEC on March 27, 2019 on Form F-3 (Registration No. 333-230524), as amended on February 28, 2020,the Registration Statement of Atlas Corp. filed with the SEC on May 11, 2020 on Form F-3 (Registration No. 333-238178), as supplemented onDecember 7, 2020, the Registration Statement of Atlas Corp. filed with the SEC on June 30, 2020 on Form S-8 (Registration No. 333-239578),the Registration Statement of Atlas Corp filed with SEC on March 19, 2021 on Form F-3 (Registration No. 333-254536) and the RegistrationStatement of Atlas Corp filed with SEC on July 16, 2021 on Form F-3 (Registration No. 333-257967).
SIGNATURES
Pursuant to the requirements of the Securities Exchange Act of 1934, the registrant has duly caused this report to be signed on its behalf bythe undersigned, thereunto duly authorized. ATLAS CORP. Date: August 13, 2021 By: /s/ Graham Talbot Graham Talbot Chief Financial Officer (Principal Financial and Accounting Officer)
EXHIBIT I
ATLAS CORP.REPORT ON FORM 6-K FOR THE QUARTER ENDED JUNE 30, 2021
INDEX PART I — FINANCIAL INFORMATION 1
Item 1 — Interim Consolidated Financial Statements (Unaudited) 1
Item 2 — Management’s Discussion and Analysis of Financial Condition and Results of Operations 30
Item 3 — Quantitative and Qualitative Disclosures About Market Risk 46
PART II — OTHER INFORMATION 47
Item 1 — Legal Proceedings 47
Item 1A — Risk Factors 47
Item 2 — Unregistered Sales of Equity Securities and Use of Proceeds 47
Item 3 — Defaults Upon Senior Securities 47
Item 4 — Mine Safety Disclosures 47
Item 5 — Other Information 47
Item 6 — Exhibits 47
Unless we otherwise specify, when used in this Report, (i) the terms “Atlas”, the “Company”, “we”, “our” and “us” refer to Atlas Corp. andits subsidiaries, (ii) the term “Seaspan” refers to Seaspan Corporation and its subsidiaries and (iii) the term “APR Energy” refers to Apple BidcoLimited, its subsidiary APR Energy Ltd., and APR Energy Ltd.’s subsidiaries.
ATLAS CORP.
PART I — FINANCIAL INFORMATION
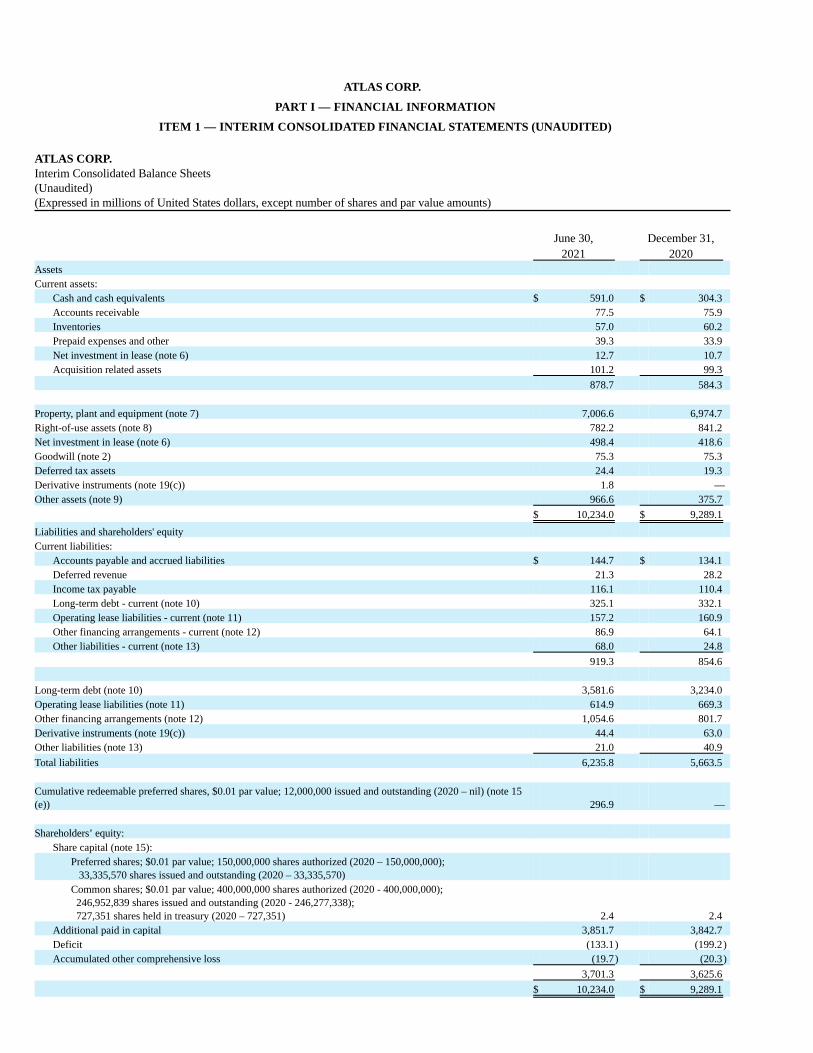
ITEM 1 — INTERIM CONSOLIDATED FINANCIAL STATEMENTS (UNAUDITED) ATLAS CORP.Interim Consolidated Balance Sheets(Unaudited)(Expressed in millions of United States dollars, except number of shares and par value amounts)
June 30, December 31,
2021 2020 Assets Current assets:
Cash and cash equivalents $ 591.0 $ 304.3 Accounts receivable 77.5 75.9 Inventories 57.0 60.2 Prepaid expenses and other 39.3 33.9 Net investment in lease (note 6) 12.7 10.7 Acquisition related assets 101.2 99.3
878.7 584.3 Property, plant and equipment (note 7) 7,006.6 6,974.7 Right-of-use assets (note 8) 782.2 841.2 Net investment in lease (note 6) 498.4 418.6 Goodwill (note 2) 75.3 75.3 Deferred tax assets 24.4 19.3 Derivative instruments (note 19(c)) 1.8 — Other assets (note 9) 966.6 375.7
$ 10,234.0 $ 9,289.1
Liabilities and shareholders' equity Current liabilities:
Accounts payable and accrued liabilities $ 144.7 $ 134.1 Deferred revenue 21.3 28.2 Income tax payable 116.1 110.4 Long-term debt - current (note 10) 325.1 332.1 Operating lease liabilities - current (note 11) 157.2 160.9 Other financing arrangements - current (note 12) 86.9 64.1 Other liabilities - current (note 13) 68.0 24.8
919.3 854.6 Long-term debt (note 10) 3,581.6 3,234.0 Operating lease liabilities (note 11) 614.9 669.3 Other financing arrangements (note 12) 1,054.6 801.7 Derivative instruments (note 19(c)) 44.4 63.0 Other liabilities (note 13) 21.0 40.9
Total liabilities 6,235.8 5,663.5 Cumulative redeemable preferred shares, $0.01 par value; 12,000,000 issued and outstanding (2020 – nil) (note 15(e)) 296.9 — Shareholders’ equity:
Share capital (note 15): Preferred shares; $0.01 par value; 150,000,000 shares authorized (2020 – 150,000,000); 33,335,570 shares issued and outstanding (2020 – 33,335,570) Common shares; $0.01 par value; 400,000,000 shares authorized (2020 - 400,000,000); 246,952,839 shares issued and outstanding (2020 - 246,277,338); 727,351 shares held in treasury (2020 – 727,351) 2.4 2.4
Additional paid in capital 3,851.7 3,842.7 Deficit (133.1) (199.2)Accumulated other comprehensive loss (19.7) (20.3)
3,701.3 3,625.6
$ 10,234.0 $ 9,289.1

Commitments and contingencies (note 18)Subsequent events (note 20)
See accompanying notes to interim consolidated financial statements.
1
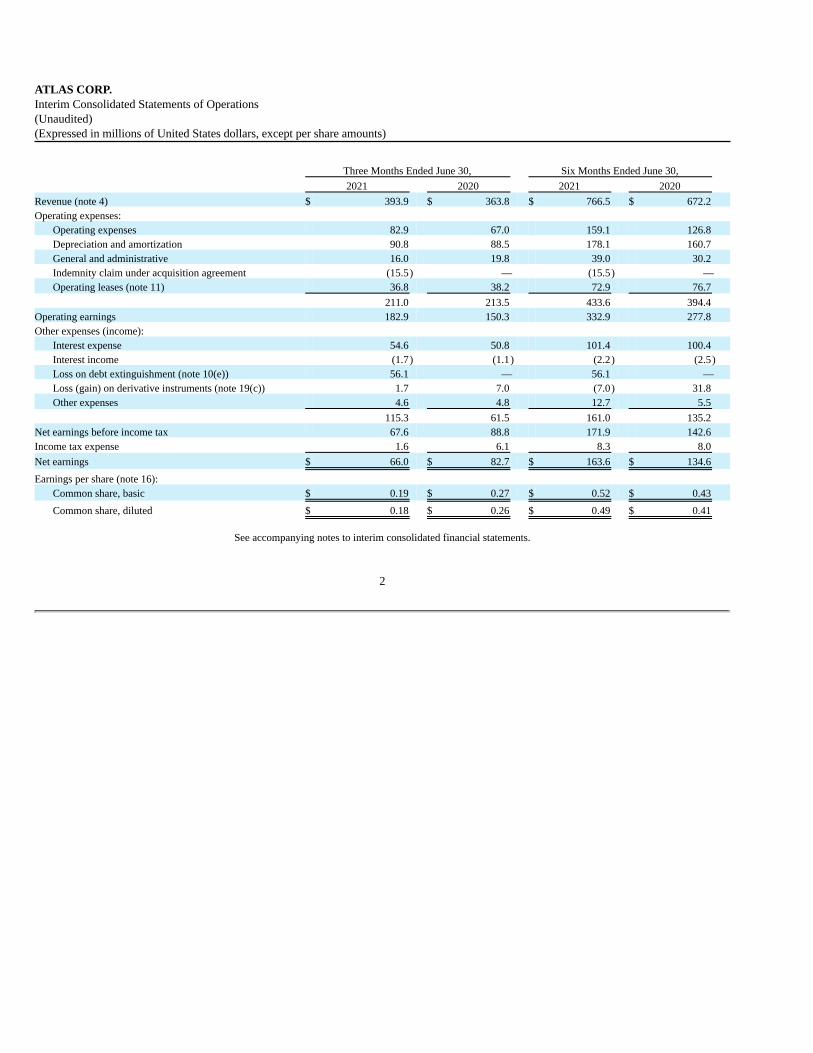
ATLAS CORP.Interim Consolidated Statements of Operations(Unaudited)(Expressed in millions of United States dollars, except per share amounts)
Three Months Ended June 30, Six Months Ended June 30, 2021 2020 2021 2020
Revenue (note 4) $ 393.9 $ 363.8 $ 766.5 $ 672.2 Operating expenses:
Operating expenses 82.9 67.0 159.1 126.8 Depreciation and amortization 90.8 88.5 178.1 160.7 General and administrative 16.0 19.8 39.0 30.2 Indemnity claim under acquisition agreement (15.5) — (15.5) — Operating leases (note 11) 36.8 38.2 72.9 76.7
211.0 213.5 433.6 394.4 Operating earnings 182.9 150.3 332.9 277.8 Other expenses (income):
Interest expense 54.6 50.8 101.4 100.4 Interest income (1.7) (1.1) (2.2) (2.5) Loss on debt extinguishment (note 10(e)) 56.1 — 56.1 — Loss (gain) on derivative instruments (note 19(c)) 1.7 7.0 (7.0) 31.8 Other expenses 4.6 4.8 12.7 5.5
115.3 61.5 161.0 135.2 Net earnings before income tax 67.6 88.8 171.9 142.6 Income tax expense 1.6 6.1 8.3 8.0
Net earnings $ 66.0 $ 82.7 $ 163.6 $ 134.6
Earnings per share (note 16): Common share, basic $ 0.19 $ 0.27 $ 0.52 $ 0.43
Common share, diluted $ 0.18 $ 0.26 $ 0.49 $ 0.41
See accompanying notes to interim consolidated financial statements.
2

ATLAS CORP.Interim Consolidated Statements of Comprehensive Income(Unaudited) (Expressed in millions of United States dollars)
Three Months Ended June 30, Six Months Ended June 30,
2021 2020 2021 2020 Net earnings $ 66.0 $ 82.7 $ 163.6 $ 134.6 Other comprehensive income:
Amounts reclassified to net earnings during the period relating to cash flow hedging instruments (note 19(c)) 0.3 0.4 0.6 0.7
Comprehensive income $ 66.3 $ 83.1 $ 164.2 $ 135.3
See accompanying notes to interim consolidated financial statements.
3

ATLAS CORP.Interim Consolidated Statements of Shareholders’ Equity and Cumulative Redeemable Preferred Shares(Unaudited)
(Expressed in millions of United States dollars, except number of shares and per share amounts)
Three months ended June 30, 2021
Series J redeemable Number of Number of Additional Accumulated
other Total preferred shares common preferred Common Preferred paid-in comprehensive shareholders’
Shares Amount shares shares shares shares capital Deficit loss equity
Balance, March 31,2021 carried forward — $ — 246,811,376 33,335,570 $ 2.1 $ 0.3 $ 3,846.2 $ (150.3) $ (20.0) $ 3,678.3 Net earnings — — — — — — — 66.0 — 66.0 Other comprehensiveincome — — — — — — — — 0.3 0.3 Issuance of commonshares from unissuedacquisition relatedequity consideration(note 2) — — 120,445 — — — — — — — Series J preferredshares issued (note10(e) and 15(e)) 12,000,000 296.9 — — — — — — — — Warrants for FairfaxNotes — — — — — — 3.0 — — 3.0 Dividends oncommon shares($0.125 per share) — — — — — — — (31.6) — (31.6)Dividends onpreferred shares(Series D - $0.50 pershare;Series E - $0.52 pershare;Series G - $0.51 pershare;Series H - $0.49 pershare;Series I - $0.50 pershare) — — — — — — — (16.8) — (16.8)Shares issued throughdividendreinvestmentprogram — — 5,781 — — — — — — — Share-basedcompensationexpense — — 15,237 — — — 2.5 (0.4) — 2.1
Balance, June 30,2021 12,000,000 $ 296.9 246,952,839 33,335,570 $ 2.1 $ 0.3 $ 3,851.7 $ (133.1) $ (19.7) $ 3,701.3
See accompanying notes to interim consolidated financial statements.
4

ATLAS CORP.Interim Consolidated Statements of Shareholders’ Equity(Unaudited)
(Expressed in millions of United States dollars, except number of shares and per share amounts)
Three months ended June 30, 2020
Accumulated
Number of Number of Additional other Total
common preferred Common Preferred paid-in comprehensive shareholders'
shares shares shares shares capital Deficit loss equity
Balance, March 31, 2020, carriedforward 246,742,534 33,335,570 $ 2.1 $ 0.3 $ 3,845.8 $ (242.1) $ (21.3) $ 3,584.8 Net earnings — — — — — 82.7 — 82.7 Other comprehensive income — — — — — — 0.4 0.4 Dividends on common shares ($0.13per share) — — — — — (30.8) — (30.8)Dividends on preferred shares(Series D - $0.50 per share;Series E - $0.52 per share;Series G - $0.51 per share;Series H - $0.49 per share;Series I - $0.50 per share) — — — — — (16.7) — (16.7)Shares issued through dividendreinvestment program 5,854 — — — 0.1 — — 0.1 Share-based compensationexpense 43,744 — — — 1.0 — — 1.0 Cancellation of unissuedacquisition related equity — — — — (1.3) — — (1.3)Other — — — — — (0.6) — (0.6)
Balance, June 30, 2020 246,792,132 33,335,570 $ 2.1 $ 0.3 $ 3,845.6 $ (207.5) $ (20.9) $ 3,619.6
See accompanying notes to interim consolidated financial statements.
5
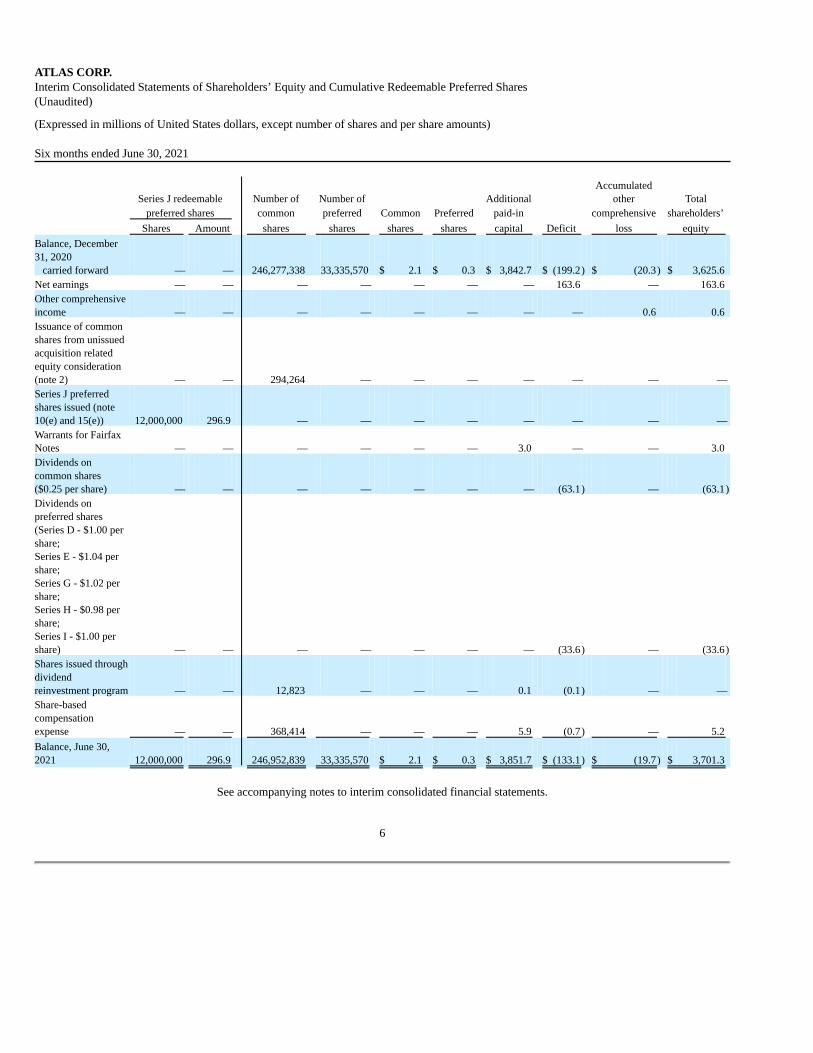
ATLAS CORP.Interim Consolidated Statements of Shareholders’ Equity and Cumulative Redeemable Preferred Shares(Unaudited)
(Expressed in millions of United States dollars, except number of shares and per share amounts) Six months ended June 30, 2021
Series J redeemable Number of Number of Additional Accumulated
other Total preferred shares common preferred Common Preferred paid-in comprehensive shareholders’
Shares Amount shares shares shares shares capital Deficit loss equity
Balance, December31, 2020 carried forward — — 246,277,338 33,335,570 $ 2.1 $ 0.3 $ 3,842.7 $ (199.2) $ (20.3) $ 3,625.6 Net earnings — — — — — — — 163.6 — 163.6 Other comprehensiveincome — — — — — — — — 0.6 0.6 Issuance of commonshares from unissuedacquisition relatedequity consideration(note 2) — — 294,264 — — — — — — — Series J preferredshares issued (note10(e) and 15(e)) 12,000,000 296.9 — — — — — — — — Warrants for FairfaxNotes — — — — — — 3.0 — — 3.0 Dividends oncommon shares($0.25 per share) — — — — — — — (63.1) — (63.1)Dividends onpreferred shares(Series D - $1.00 pershare;Series E - $1.04 pershare;Series G - $1.02 pershare;Series H - $0.98 pershare;Series I - $1.00 pershare) — — — — — — — (33.6) — (33.6)Shares issued throughdividendreinvestment program — — 12,823 — — — 0.1 (0.1) — — Share-basedcompensationexpense — — 368,414 — — — 5.9 (0.7) — 5.2
Balance, June 30,2021 12,000,000 296.9 246,952,839 33,335,570 $ 2.1 $ 0.3 $ 3,851.7 $ (133.1) $ (19.7) $ 3,701.3
See accompanying notes to interim consolidated financial statements.
6

ATLAS CORP.Interim Consolidated Statements of Shareholders’ Equity(Unaudited)
(Expressed in millions of United States dollars, except number of shares and per share amounts)
Six months ended June 30, 2020
Accumulated Number of Number of Additional other Total common preferred Common Preferred Treasury paid-in comprehensive shareholders' shares shares shares shares shares capital Deficit loss equity
Balance, December 31,2019, carried forward 215,675,599 33,335,570 $ 2.2 $ 0.3 $ (0.4) $ 3,452.9 $ (200.7) $ (21.6) $ 3,232.7 Impact of accountingpolicy change — — — — — — (2.3) — (2.3)
Adjusted balance,December 31, 2019 215,675,599 33,335,570 $ 2.2 $ 0.3 $ (0.4) $ 3,452.9 $ (203.0) $ (21.6) $ 3,230.4 Net earnings — — — — — — 134.6 — 134.6 Other comprehensiveincome — — — — — — — 0.7 0.7 Common shares issuedon acquisition 29,891,266 — 0.2 — — 316.6 — — 316.8 Common shares issuedon loan settlement 775,139 — 0.1 — — 8.2 — — 8.3 Dividends on commonshares ($0.38 pershare) — — — — — — (88.5) — (88.5)Dividends on preferredshares(Series D - $1.49 pershare;Series E - $1.55 pershare;Series G - $1.54 pershare;Series H - $1.48 pershare;Series I - $1.50 pershare) — — — — — — (50.3) — (50.3)Shares issued throughdividend reinvestmentprogram 13,797 — — — — 0.2 — — 0.2 Share-basedcompensation expense 398,553 — — — — 3.2 — — 3.2 Treasury shares 37,778 — (0.4) — 0.4 — — — — Unissued acquisitionrelated equityconsideration — — — — — 65.8 — — 65.8 Cancellation ofunissued acquisitionrelated equity — — — — — (1.3) — — (1.3)Other — — — — — — (0.3) — (0.3)
Balance, June 30, 2020 246,792,132 33,335,570 $ 2.1 $ 0.3 $ — $ 3,845.6 $ (207.5) $ (20.9) $ 3,619.6
See accompanying notes to interim consolidated financial statements.
7

ATLAS CORP.Interim Consolidated Statements of Cash Flows(Unaudited)(Expressed in millions of United States dollars)
Three Months Ended June 30, Six Months Ended June 30,
2021 2020 2021 2020
Cash from (used in): Operating activities:
Net earnings $ 66.0 $ 82.7 $ 163.6 $ 134.6 Items not involving cash:
Depreciation and amortization 90.8 88.5 178.1 160.7 Change in right-of-use asset 31.6 29.6 62.4 58.8 Non-cash interest expense and accretion 11.6 10.0 23.5 18.9 Unrealized change in derivative instruments (5.0) 2.1 (20.5) 22.9 Amortization of acquired revenue contracts 3.9 4.2 8.1 8.1 Loss on debt extinguishment 56.1 — 56.1 — Other (4.7) 2.2 2.0 2.0
Change in other operating assets and liabilities (note 17) (34.9) (60.6) (77.3) (116.6)
Cash from operating activities 215.4 158.7 396.0 289.4
Investing activities:
Expenditures for property, plant and equipment (249.9) (203.9) (257.3) (453.1)Prepayment on vessel purchase (272.6) — (464.7) (35.8)Payment on settlement of interest swap agreements (8.1) (5.3) (13.4) (8.1)Cash and restricted cash acquired from APR Energy acquisition — — — 50.6 Loss on foreign currency repatriation (3.2) (4.6) (9.2) (4.6)Receipt from contingent consideration asset 6.4 — 13.3 — Other assets and liabilities (122.5) (7.8) (119.9) (9.6)
Cash used in investing activities (649.9) (221.6) (851.2) (460.6)
Financing activities:
Repayments of long-term debt and other financing arrangements (542.6) (132.7) (972.8) (791.3)Issuance of long-term debt and other financing arrangements 1,304.5 238.2 1,839.0 1,036.9 Fairfax Notes issued — — — 100.0 Financing fees (25.8) (6.1) (28.3) (19.0)Share issuance cost (0.1) — (0.1) — Dividends on common shares (31.2) (30.8) (62.3) (57.7)Dividends on preferred shares (16.8) (16.7) (33.6) (33.5)
Cash from financing activities 688.0 51.9 741.9 235.4
Increase (decrease) in cash and cash equivalents 253.5 (11.0) 286.7 64.2 Cash and cash equivalents and restricted cash, beginning of period 375.7 272.5 342.5 197.3
Cash and cash equivalents and restricted cash, end of period $ 629.2 $ 261.5 $ 629.2 $ 261.5
Supplemental cash flow information (note 17)
See accompanying notes to interim consolidated financial statements.
8

ATLAS CORP.Notes to Interim Consolidated Financial Statements(Unaudited)(Tabular amounts in millions of United States dollars, except per share amount and number of shares)
1. Significant accounting policies:
(a) Basis of presentation:
Except for the changes described in note 1(b), the accompanying interim financial information of Atlas Corp. (the “Company” or“Atlas”) has been prepared in accordance with accounting principles generally accepted in the United States of America (“U.S.GAAP”), on a basis consistent with those followed in the December 31, 2020 audited annual consolidated financial statements ofAtlas. The accompanying interim financial information is unaudited and reflects all adjustments, consisting of normal recurringadjustments, which, in the opinion of management, are necessary for a fair presentation of results for the interim periods presented.The unaudited interim consolidated financial statements do not include all the disclosures required under U.S. GAAP for annualfinancial statements and should be read in conjunction with the December 31, 2020 annual consolidated financial statements ofAtlas filed with the U.S. Securities and Exchange Commission in the Company’s 2020 Annual Report on Form 20-F.
The outbreak of COVID-19 has had a negative effect on the global economy and has adversely impacted the industries that Atlasoperates in. During the initial onset of COVID-19 in the first half of 2020, the containership industry experienced decreasedcontainer trade and reduced charter rates. Since then, trade and charter rates have rebounded markedly due to increased demandand lack of capacity. In the power generation industry, while COVID-19 continues to impact developing countries, which reducesgeneral power demand in some areas, it has not materially impacted the Company's ability to execute contracts in the peakingpower and emergency power segments of the market in which it operates. The duration and full effects of this global healthemergency and related disruptions are uncertain, although expected to continue for the near future as the success and timing ofCOVID-19 vaccination programs and containment strategies are also uncertain. The Company continues to monitor the impact ofthe new variants of COVID-19, any increase in cases and/or the reinstatement of lockdowns and other restrictions, each of whichcould negatively impact the recovery from COVID-19. Negative impacts of COVID-19 are expected to reverberate beyond theduration of the pandemic itself. As a result, this increases the uncertainties and the degree of judgment associated with many of theCompany’s estimates and assumptions. As events develop and additional information becomes available, the Company’s estimatesmay change in future periods.
(b) Recent accounting pronouncements
Discontinuation of LIBOR
In March 2020, FASB issued ASU 2020-04, “Reference Rate Reform (Topic 848)”, which provides optional relief for thediscontinuation of LIBOR resulting from rate reform. Contract terms that are modified due to the replacement of a reference rateare not required to be remeasured or reassessed under FASB’s relevant U.S. GAAP Topic. The election is available by Topic. Thisguidance is effective for all entities as of March 12, 2020 through December 31, 2022 and may be applied from the beginning of aninterim period that includes the issuance date of the ASU. The Company is currently evaluating the impact of this guidance.
Debt with conversion and other options
In August 2020, FASB issued ASU 2020-06, “Debt – Debt with Conversion and Other Options (Subtopic 470-20)”, whichsimplifies the accounting for convertible debt instruments by reducing the number of accounting models and circumstances whenembedded conversion features are separately recognized. This update also revises the method in which diluted earnings per shareis calculated related to certain instruments with conversion features, among other clarifications. The guidance is effective forannual reporting periods beginning after December 15, 2021, including interim periods within those fiscal years. The Company iscurrently evaluating the impact of this guidance.
(c) Comparative information:
Certain prior period information has been reclassified to conform with current financial statement presentation.
9

ATLAS CORP.Notes to Interim Consolidated Financial Statements(Unaudited)(Tabular amounts in millions of United States dollars, except per share amount and number of shares)
2. Acquisition of Apple Bidco Limited:
On February 28, 2020, the Company acquired 100.0% of the share capital of APR Energy from Fairfax Financial Holdings Ltd. and itsaffiliates (“Fairfax”) and certain other minority shareholders (collectively, the “Sellers”). Fairfax held 67.8% of APR Energy’s commonshares. APR Energy owns and operates a fleet of capital-intensive assets, including aero-derivative gas turbines and other powergeneration equipment, and provides power solutions to customers through medium to long-term contracts. The financial results of APREnergy have been included in the Company’s consolidated financial statements from February 29, 2020, after the date of acquisition.
At closing, Atlas issued 29,891,266 common shares and reserved 6,664,270 common shares for future issuance (the “HoldbackShares”). The Holdback Shares are issuable over a period of 90 days to five years after the date of acquisition and are subject to settlementof purchase price adjustments, indemnification arrangements and other future compensable events. These arrangements may be settled, atthe Sellers’ option, by either cancellation of Holdback Shares or cash. In the case of purchase price adjustments, if Holdback Shares areinsufficient, Sellers may choose to compensate the Company in cash or cancel previously issued common shares. Any Holdback Sharesthat are not cancelled after the expiry of their respective holdback periods, will be issued to the Sellers, plus any accrued distributions ordividends.
The net purchase price of $287,700,000 was comprised of:29,891,266 common shares issued (1) $ 316.8 6,664,270 Holdback Shares (1) 70.6 Less: Contingent consideration asset (2) (95.2)Less: Purchase price adjustment (3) (4.5)
Net purchase price $ 287.7
(1) The fair value was determined based on the closing market price of common shares on February 28, 2020, the acquisition date. (2) Pursuant to the acquisition agreement, the Sellers are required to compensate the Company for losses on cash repatriation from a
foreign jurisdiction related to specified contracts. Losses on cash repatriation is recognized in other expenses in the period incurred.In February 2021, Fairfax agreed, subject to definitive documentation, to compensate the Company for future losses realized on saleor disposal of certain property, plant and equipment and inventory items (note 9(c)). The definitive documentation was executed onApril 30, 2021.
(3) In 2020, the Sellers forfeited their rights to receive 577,139 Holdback Shares and returned 1,849,641 previously issued commonshares to the Company. Of this number, 1,122,290 shares were permanently forfeited as part of post-closing purchase priceadjustments. The remaining 727,351 shares are held in reserve as treasury shares. The shares held in reserve are issuable to theSellers at a future date, subject to settlement of potential indemnified events. In February 2021, the Company agreed to issue 5-yearwarrants to purchase 5,000,000 common shares at an exercise price of $13.00 per share to Fairfax, subject to definitivedocumentation. The definitive documentation was executed on April 30, 2021 and the warrants were issued in April 2021. Duringthe three and six months ended June 30, 2021, 120,445 and 294,264 (2020 – nil) common shares, respectively, were released fromholdback and issued to the Sellers.
The following table summarizes the fair values of the assets acquired and liabilities assumed at the acquisition date.Cash and cash equivalents $ 36.7 Inventory 40.9 Acquisition related assets (1) 96.4 Accounts receivable (2) 49.1 Other current assets 9.1 Property, plant and equipment 447.2 Intangible assets 27.4 Deferred tax assets 16.6 Other assets 13.9 Goodwill 117.9
Total assets acquired 855.2 Accounts payable and accrued liabilities 92.5 Income tax payable 106.5 Other current liabilities 17.2 Long-term debt (including current and non-current portions) (3) 311.6 Deferred tax liabilities 1.0 Other long-term liabilities 38.7
Net assets acquired $ 287.7
(1) Consists of indemnification assets recognized on acquisition. The Sellers are required to indemnify the Company for certain legal and tax matters through cancellation
of the Holdback Shares or in cash, at the Sellers’ option. For certain of these arrangements, if the Holdback Shares are insufficient, Fairfax may be required to

compensate the Company in cash. The amount to be indemnified is subject to the aggregate losses incurred at settlement of these legal and tax matters. The amountrecognized is equal to the liabilities accrued for such legal and tax matters, based on the Company’s best estimates. For certain other indemnification arrangements,Fairfax is required to compensate the Company in cash, without minority shareholders.
(2) The gross contractual accounts receivables acquired is $57.0 million. The amount not expected to be collected is $7.9 million. (3) Concurrent with the acquisition, the Company refinanced the debt facilities acquired.
10

ATLAS CORP.Notes to Interim Consolidated Financial Statements(Unaudited)(Tabular amounts in millions of United States dollars, except per share amount and number of shares)
2. Acquisition of Apple Bidco Limited (continued): The carrying amounts of cash and cash equivalents, accounts receivable and other current assets (consisting of prepaid expenses),accounts payable and accrued liabilities, income taxes payable and other current liabilities approximate their fair values due to theshort-term maturity of the instruments. The fair value of long-term debt and other assets are categorized within Level 2 of the fair valuehierarchy and determined based on expected payments. The fair values of contingent consideration assets, inventory, property, plant andequipment, intangible assets and asset retirement obligation included in other long-term liabilities were categorized within Level 3 of thefair value hierarchy and were determined using relevant market assumptions, including comparable sales and cost data, discount rates andfuture cash flows.
As part of the acquisition, the Company recorded $117,900,000 of goodwill resulting from expected synergies in congruence with APR’sunique position in the power generation market, which is not deductible for tax purposes and has been assigned to the power generationsegment. Subsequent to the acquisition, it was determined that the carrying value of the mobile power generation reporting unit exceededits fair value, as a result of potential strategic repositioning contemplated by the Company. As a result, the balance of the goodwill of$117,900,000 was written-off as of December 31, 2020.
During the three and six months ended June 30, 2020, the Company recognized $431,000 and $1,408,000, respectively, of acquisitionrelated costs that were included in general and administrative expense.
Pro forma financial information
The following table presents unaudited pro forma results for the three and six months ended June 30, 2020. The unaudited pro formafinancial information combines the results of operations of the Company and APR Energy as though the acquisition had occurred as ofJanuary 1, 2020. The pro forma results contain adjustments that are directly attributable to the transaction, including depreciation of thefair value of property, plant and equipment, amortization of acquired intangible assets, and refinancing of debt. Additionally, pro forma netearnings were adjusted to exclude acquisition-related costs incurred. Three months ended Six months ended Pro forma information June 30, 2020 June 30, 2020
Revenue $ 364.7 $ 715.7 Net earnings 79.6 130.5
3. Segment reporting:
For management purposes, the Company is organized based on its two leasing businesses and has two reportable segments, containershipleasing and mobile power generation. The Company’s containership leasing segment owns and operates a fleet of containerships whichare chartered primarily pursuant to long-term, fixed-rate time charters. The Company’s mobile power generation segment owns andoperates a fleet of power generation assets, including aero-derivative gas turbines and other equipment, and provides power solutions tocustomers.
The Company’s chief operating decision makers monitor the operating results of the leasing businesses separately for the purpose ofmaking decisions about resource allocation and performance assessment based on Adjusted EBITDA, which is computed as net earningsbefore interest expense, income tax expense, depreciation and amortization expense, impairments, write-down and gains/losses on sale,gains/losses on derivative instruments, loss on foreign currency repatriation, change in contingent consideration asset, loss on debtextinguishment, other expenses and certain other items that the Company believes are not representative of its operating performance.
11
ATLAS CORP.Notes to Interim Consolidated Financial Statements(Unaudited)(Tabular amounts in millions of United States dollars, except per share amount and number of shares)
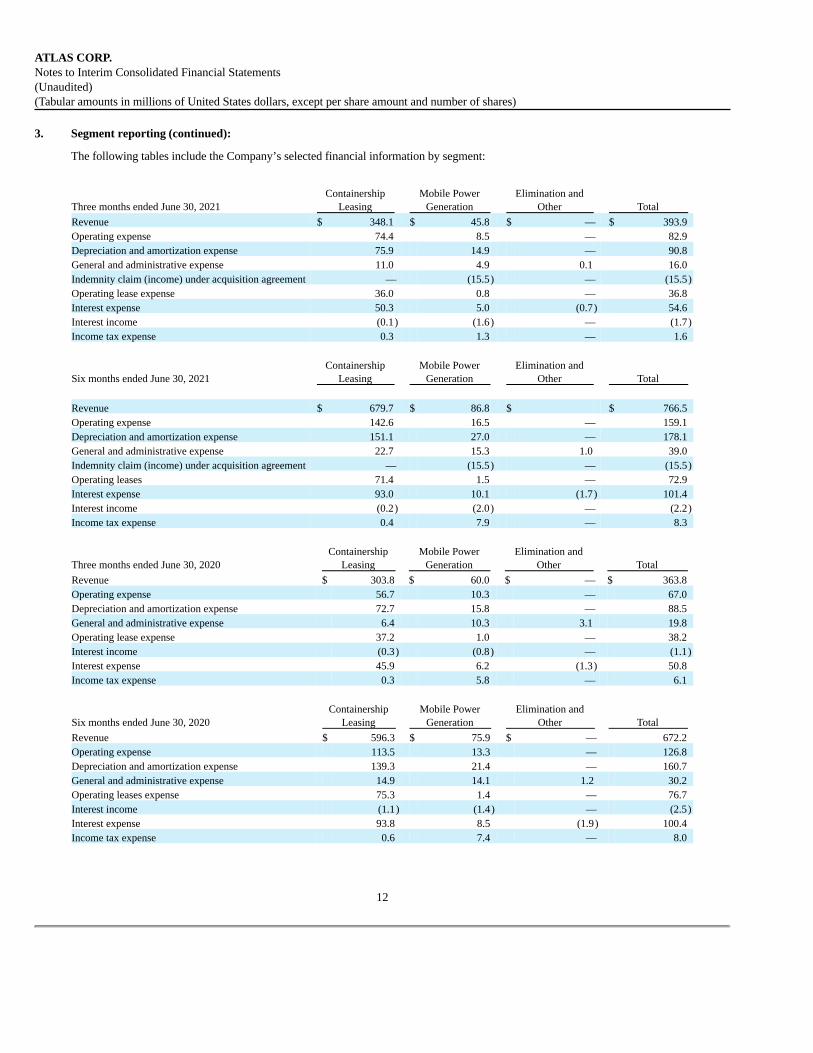
3. Segment reporting (continued):
The following tables include the Company’s selected financial information by segment:
Three months ended June 30, 2021 Containership
Leasing Mobile Power
Generation Elimination and
Other Total
Revenue $ 348.1 $ 45.8 $ — $ 393.9 Operating expense 74.4 8.5 — 82.9 Depreciation and amortization expense 75.9 14.9 — 90.8 General and administrative expense 11.0 4.9 0.1 16.0 Indemnity claim (income) under acquisition agreement — (15.5) — (15.5)Operating lease expense 36.0 0.8 — 36.8 Interest expense 50.3 5.0 (0.7) 54.6 Interest income (0.1) (1.6) — (1.7)Income tax expense 0.3 1.3 — 1.6
Six months ended June 30, 2021 Containership
Leasing Mobile Power
Generation Elimination and
Other Total
Revenue $ 679.7 $ 86.8 $ $ 766.5 Operating expense 142.6 16.5 — 159.1 Depreciation and amortization expense 151.1 27.0 — 178.1 General and administrative expense 22.7 15.3 1.0 39.0 Indemnity claim (income) under acquisition agreement — (15.5) — (15.5)Operating leases 71.4 1.5 — 72.9 Interest expense 93.0 10.1 (1.7) 101.4 Interest income (0.2) (2.0) — (2.2)Income tax expense 0.4 7.9 — 8.3
Three months ended June 30, 2020 Containership
Leasing Mobile Power
Generation Elimination and
Other Total
Revenue $ 303.8 $ 60.0 $ — $ 363.8 Operating expense 56.7 10.3 — 67.0 Depreciation and amortization expense 72.7 15.8 — 88.5 General and administrative expense 6.4 10.3 3.1 19.8 Operating lease expense 37.2 1.0 — 38.2 Interest income (0.3) (0.8) — (1.1)Interest expense 45.9 6.2 (1.3) 50.8 Income tax expense 0.3 5.8 — 6.1
Six months ended June 30, 2020 Containership
Leasing Mobile Power
Generation Elimination and
Other Total
Revenue $ 596.3 $ 75.9 $ — 672.2 Operating expense 113.5 13.3 — 126.8 Depreciation and amortization expense 139.3 21.4 — 160.7 General and administrative expense 14.9 14.1 1.2 30.2 Operating leases expense 75.3 1.4 — 76.7 Interest income (1.1) (1.4) — (2.5)Interest expense 93.8 8.5 (1.9) 100.4 Income tax expense 0.6 7.4 — 8.0
12

ATLAS CORP.Notes to Interim Consolidated Financial Statements(Unaudited)(Tabular amounts in millions of United States dollars, except per share amount and number of shares)
3. Segment reporting (continued):
Three months ended
June 30, 2021 Six months ended
June 30, 2021 Containership leasing adjusted EBITDA $ 226.7 $ 443.0 Mobile power generation adjusted EBITDA(1) 45.3 66.7
Total segment adjusted EBITDA 272.0 509.7 Eliminations and other (0.5) (0.7)Depreciation and amortization 90.8 178.1 Interest expense 54.6 101.4 Interest income (1.7) (2.2)Loss / (gain) on derivative instruments 1.7 (7.0)Loss on debt extinguishment 56.1 56.1 Other (income) / expenses — 2.1 Loss on contingent consideration asset 0.6 1.7 Loss on foreign currency repatriation 3.2 9.2 Gain on sale (0.4) (0.9)
Consolidated net earnings before tax $ 67.6 $ 171.9 (1) The calculation of adjusted EBITDA does not include the Indemnity claim under acquisition agreement as an adjustment for the mobile power generation
segment. Although the revenue reported for this segment is lower due to an injunction at one of the sites, the losses are recoverable through anindemnification agreement (note 2).
Three months ended
June 30, 2020 Six months ended June
30, 2020 Containership leasing adjusted EBITDA $ 203.3 $ 392.4 Mobile power generation adjusted EBITDA 38.0 46.7 Total segment adjusted EBITDA 241.3 439.1 Eliminations and other 2.4 3.8 Depreciation and amortization 88.5 160.7 Interest expense 50.8 100.4 Interest income (1.1) (2.5) Loss on derivative instruments 7.0 31.8 Other expenses 4.8 5.5 Loss / (gain) on contingent consideration asset 0.7 (2.6) Gain on sale (0.6) (0.6) Consolidated net earnings before taxes $ 88.8 $ 142.6
Total Assets June 30, 2021 December 31, 2020 Containership Leasing $ 9,395.8 $ 8,475.4 Mobile Power Generation 873.1 829.9 Elimination and Other (34.9) (16.2)Total $ 10,234.0 $ 9,289.1
Three months ended June 30, Six months ended June 30,
Cash expenditures by segment 2021 2020 2021 2020
Containership leasing $ 507.3 $ 186.7 $ 706.0 $ 433.4 Mobile power generation 15.2 17.2 16.0 19.7
13

ATLAS CORP.Notes to Interim Consolidated Financial Statements(Unaudited)(Tabular amounts in millions of United States dollars, except per share amount and number of shares)
4. Revenue
Revenue disaggregated by segment and by type for the three and six months ended June 30, 2021 and June 30, 2020 is as follows:
Three months ended June 30, 2021 Six months ended June 30, 2021
Containership
Leasing(1) Mobile Power
Generation Total Containership
Leasing(1) Mobile Power
Generation Total
Operating lease revenue $ 336.2 $ 44.1 $ 380.3 $ 656.7 $ 82.4 $ 739.1 Interest income from leasing 11.0 — 11.0 21.0 — 21.0 Other 0.9 1.7 2.6 2.0 4.4 6.4
$ 348.1 $ 45.8 $ 393.9 $ 679.7 $ 86.8 $ 766.5
Three months ended June 30, 2020 Six months ended June 30, 2020
Containership
Leasing(1) Mobile Power
Generation Total Containership
Leasing(1) Mobile Power
Generation Total
Operating lease revenue $ 293.6 $ 54.8 $ 348.4 $ 575.0 $ 69.7 $ 644.7 Interest income from leasing 9.3 — 9.3 21.6 — 21.6 Other 0.9 5.2 6.1 (0.3) 6.2 5.9
$ 303.8 $ 60.0 $ 363.8 $ 596.3 $ 75.9 $ 672.2
(1) Containership leasing revenue includes both bareboat charter and time charter revenue.
As at June 30, 2021, the minimum future revenues to be received on committed operating leases, service arrangements and interest incometo be earned from direct financing leases are as follows:
Operating lease (1) Finance lease (2) Other Total committed
revenue
Remainder of 2021 $ 838.6 $ 21.5 $ 4.1 $ 864.2 2022 1,518.3 41.5 4.1 1,563.9 2023 1,254.0 39.4 0.7 1,294.1 2024 886.2 37.0 — 923.2 2025 481.0 34.5 — 515.5 Thereafter 389.3 240.6 — 629.9
$ 5,367.4 $ 414.5 $ 8.9 $ 5,790.8
(1) Minimum future operating lease revenue includes payments from signed charter agreements on operating vessels that have not yet commenced.
(2) Minimum future interest income includes direct financing leases currently in effect.
As at June 30, 2021, the minimum future revenues to be received based on each segment are as follows:
Containership Leasing(1)(2) Mobile Power Generation Total committed revenue
Remainder of 2021 $ 733.4 $ 130.8 $ 864.2 2022 1,475.2 88.7 1,563.9 2023 1,256.0 38.1 1,294.1 2024 923.2 — 923.2 2025 515.5 — 515.5 Thereafter 629.9 — 629.9
$ 5,533.2 $ 257.6 $ 5,790.8
(1) Minimum future operating lease revenue includes payments from signed charter agreements on operating vessels that have not yet commenced.
(2) Minimum future interest income includes direct financing leases currently in effect.
Minimum future revenues assume 100% utilization, extensions only at the Company’s unilateral option and no renewals. It does notinclude signed charter agreements on undelivered vessels.
The Company’s revenue during the periods was derived from the following customers: Three months ended June 30, Six months ended June 30,
2021 2020 2021 2020
COSCO $ 114.5 $ 100.1 $ 221.3 $ 204.8

Yang Ming Marine 62.8 63.4 126.2 126.1 ONE 64.5 60.5 128.9 108.0 Other 152.1 139.8 290.1 233.3
$ 393.9 $ 363.8 $ 766.5 $ 672.2
14

ATLAS CORP.Notes to Interim Consolidated Financial Statements(Unaudited)(Tabular amounts in millions of United States dollars, except per share amount and number of shares)
5. Related party transactions:
a) As at June 30, 2021, Fairfax held approximately 40.5% of the Company’s issued and outstanding common shares and has designatedtwo members to the Company’s board of directors.
b) For the three and six months ended June 30, 2021, 120,445 and 294,264 common shares, respectively, were issued to Fairfax out ofHoldback Shares. For the three and six months ended June 30, 2021, interest expense related to Seaspan’s notes held by certainaffiliates of Fairfax (the “Fairfax Holders”), including the $250,000,000 of 5.5% senior notes due 2025 (the “2025 Fairfax Notes”),the $250,000,000 of 5.5% senior notes due 2026 (the “2026 Fairfax Notes”) and $100,000,000 of the 5.5% senior notes due 2027(the 2027 Fairfax Notes”, together with the 2025 Fairfax Notes and the 2026 Fairfax Notes, the “Fairfax Notes”), excluding
amortization of the debt discount, was $8,441,000 and $16,691,000, respectively (2020 – $8,250,000 and $15,643,000,respectively). For the three and six months ended June 30, 2021, amortization of debt discount was $5,038,000 and $10,532,000,respectively (2020 – $5,042,000 and $9,878,000, respectively).
c) In June 2021, the Company and Seaspan exchanged and amended the Fairfax Notes. Pursuant to this transaction, the Company
exchanged $200,000,000 aggregate principal amount of the 2026 Fairfax Notes and all $100,000,000 aggregate principal amount ofthe 2027 Fairfax Notes for (i) 12,000,000 Series J 7.00% Cumulative Redeemable Perpetual Preferred Shares of the Company (the“Series J Preferred Shares”), representing total liquidation value of $300,000,000, and (ii) 1,000,000 five year warrants to purchasean equal number of Atlas common shares at an exercise price of $13.71 per share (the “Fairfax Exchange”) (note 15(e)). Theexchanged 2026 Fairfax Notes and 2027 Fairfax Notes were subsequently cancelled.
In connection with the Fairfax Exchange, the Fairfax Holders also agreed to amend the terms of the $300,000,000 aggregateprincipal amount of the Fairfax Notes that remain outstanding following the Fairfax Exchange (the “Amendment”), which includesall $250,000,000 aggregate principal amount of the 2025 Fairfax Notes and $50,000,000 aggregate principal amount of the 2026Fairfax Notes. The Amendment, among other things, eliminated the Fairfax Holders’ mandatory redemption and put rights andreleased and discharged all outstanding guarantees and liens on collateral thereunder. The Fairfax Holders also agreed to terminateSeaspan’s Amended and Restated Pledge and Collateral Agent Agreement and to release and discharge all liens on collateral thereof(note 10(e)). The Company may redeem the amended notes at its option, in whole or in part, at any time at a redemption price equalto 100% of the principal amount plus any accrued and unpaid interest.
6. Net investment in lease:
June 30, 2021 December 31, 2020 Undiscounted lease receivable $ 928.4 $ 773.2 Unearned interest income (417.3) (343.9)
Net investment in lease $ 511.1 $ 429.3
June 30, 2021 December 31, 2020 Lease receivables $ 504.5 $ 429.3 Unguaranteed residual value 6.6 —
Net investment in lease 511.1 429.3 Current portion of net investment in lease (12.7) (10.7)
Net investment in lease $ 498.4 $ 418.6
In February 2021, the Company commenced a fixed rate bareboat charter with a term of 18 years on a recently acquired 12,000 TEUvessel, which has been classified as a sales-type lease. No gain or loss was recognized on commencement date.
At June 30, 2021, the minimum lease receivable from finance leases are as follows:
Remainder of 2021 $ 26.6 2022 52.9 2023 52.9 2024 53.0 2025 52.9 Thereafter 690.1
$ 928.4

7. Property, plant and equipment:
Accumulated Net book June 30, 2021 Cost depreciation value
Vessels $ 9,315.9 $ (2,707.8) $ 6,608.1 Equipment and other 510.5 (112.0) 398.5
Property, plant and equipment $ 9,826.4 $ (2,819.8) $ 7,006.6
15

ATLAS CORP.Notes to Interim Consolidated Financial Statements(Unaudited)(Tabular amounts in millions of United States dollars, except per share amount and number of shares)
7. Property, plant and equipment (continued):
Accumulated Net book December 31, 2020 Cost depreciation value
Vessels $ 9,148.9 $ (2,571.3) $ 6,577.6 Equipment and other 543.1 (146.0) 397.1
Property, plant and equipment $ 9,692.0 $ (2,717.3) $ 6,974.7
Upon commencement of a fixed rate bareboat charter in February 2021, $88,060,575 was reclassified to net investment in lease fromproperty, plant and equipment (note 6).
In April and May 2021, the Company took delivery of two 8,500 TEU vessels, for an aggregate purchase price of $104,500,000. In May 2021, the Company took delivery of one 15,000 TEU vessel for an aggregate purchase price of $127,000,000. During the three and six months ended June 30, 2021, depreciation and amortization expense relating to property, plant and equipmentwas $82,347,000 and $162,353,000, respectively (2020 – $88,923,000 and $155,024,000, respectively).
8. Right-of-use assets:
June 30, 2021 Cost Accumulatedamortization Net book value
Vessel operating leases $ 1,060.9 $ (288.3) $ 772.6 Other operating leases 16.9 (7.3) 9.6
Right-of-use assets $ 1,077.8 $ (295.6) $ 782.2
December 31, 2020 Cost Accumulatedamortization Net book value
Vessel operating leases $ 1,060.9 $ (228.0) $ 832.9 Office operating leases 13.6 (5.3) 8.3 Right-of-use assets $ 1,074.5 $ (233.3) $ 841.2
During the three and six months ended June 30, 2021, the change in right-of-use assets were $31,557,000 and $62,434,000, respectively(2020 - $30,040,000 and $59,446,000, respectively).
9. Other assets:
June 30, 2021 December 31, 2020 Intangible assets (a) $ 96.5 $ 104.8 Deferred dry-dock (b) 68.2 63.8 Restricted cash 38.2 38.2 Contingent consideration asset (c) 63.9 84.0 Vessels under construction (d) 510.8 42.0 Other (e) 189.0 42.9
Other assets $ 966.6 $ 375.7
(a) Intangible assets:
June 30, 2021 Cost Accumulated Amortization Net book value
Customer contracts $ 129.9 $ (67.5) $ 62.4 Trademark 27.4 (1.8) 25.6 Other 13.1 (4.6) 8.5
$ 170.4 $ (73.9) $ 96.5

16
ATLAS CORP.Notes to Interim Consolidated Financial Statements(Unaudited)(Tabular amounts in millions of United States dollars, except per share amount and number of shares)
9. Other assets (continued): (a) Intangible assets (continued):
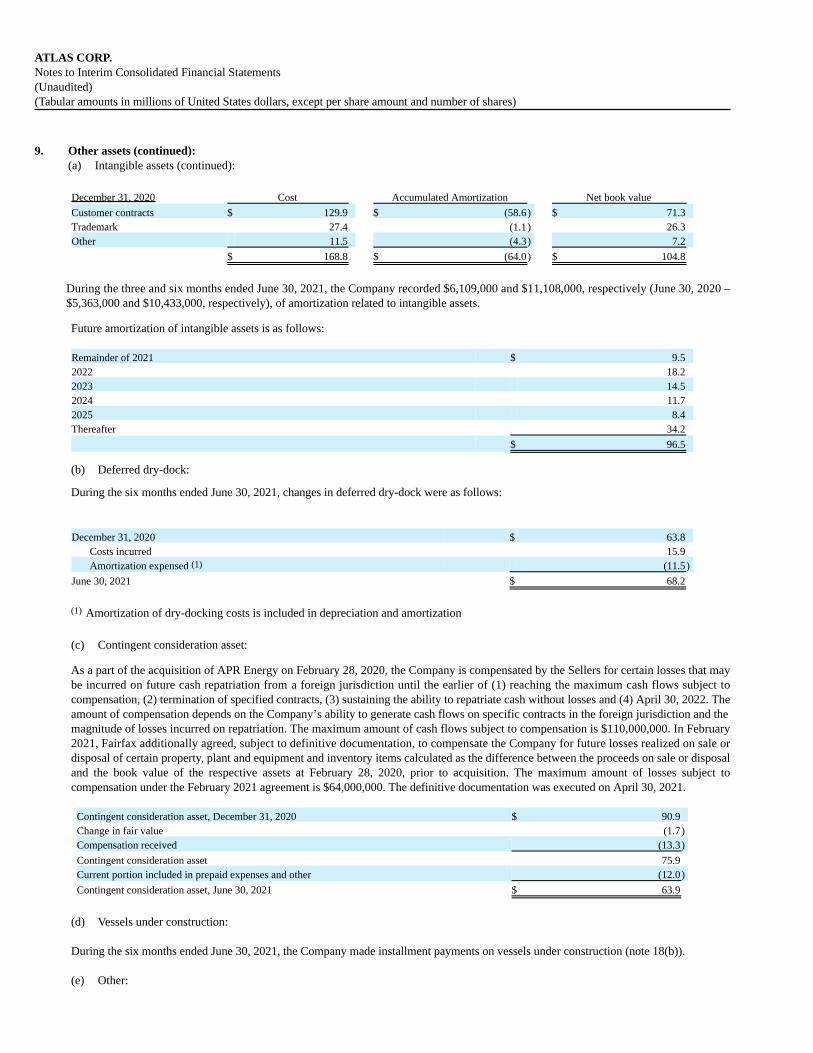
December 31, 2020 Cost Accumulated Amortization Net book value
Customer contracts $ 129.9 $ (58.6) $ 71.3 Trademark 27.4 (1.1) 26.3 Other 11.5 (4.3) 7.2
$ 168.8 $ (64.0) $ 104.8
During the three and six months ended June 30, 2021, the Company recorded $6,109,000 and $11,108,000, respectively (June 30, 2020 –$5,363,000 and $10,433,000, respectively), of amortization related to intangible assets.
Future amortization of intangible assets is as follows:
Remainder of 2021 $ 9.5 2022 18.2 2023 14.5 2024 11.7 2025 8.4 Thereafter 34.2 $ 96.5
(b) Deferred dry-dock:
During the six months ended June 30, 2021, changes in deferred dry-dock were as follows:
December 31, 2020 $ 63.8
Costs incurred 15.9 Amortization expensed (1) (11.5)
June 30, 2021 $ 68.2
(1) Amortization of dry-docking costs is included in depreciation and amortization
(c) Contingent consideration asset:
As a part of the acquisition of APR Energy on February 28, 2020, the Company is compensated by the Sellers for certain losses that maybe incurred on future cash repatriation from a foreign jurisdiction until the earlier of (1) reaching the maximum cash flows subject tocompensation, (2) termination of specified contracts, (3) sustaining the ability to repatriate cash without losses and (4) April 30, 2022. Theamount of compensation depends on the Company’s ability to generate cash flows on specific contracts in the foreign jurisdiction and themagnitude of losses incurred on repatriation. The maximum amount of cash flows subject to compensation is $110,000,000. In February2021, Fairfax additionally agreed, subject to definitive documentation, to compensate the Company for future losses realized on sale ordisposal of certain property, plant and equipment and inventory items calculated as the difference between the proceeds on sale or disposaland the book value of the respective assets at February 28, 2020, prior to acquisition. The maximum amount of losses subject tocompensation under the February 2021 agreement is $64,000,000. The definitive documentation was executed on April 30, 2021.
Contingent consideration asset, December 31, 2020 $ 90.9 Change in fair value (1.7)Compensation received (13.3)
Contingent consideration asset 75.9 Current portion included in prepaid expenses and other (12.0)
Contingent consideration asset, June 30, 2021 $ 63.9
(d) Vessels under construction:
During the six months ended June 30, 2021, the Company made installment payments on vessels under construction (note 18(b)).
(e) Other:

During the six months ended June 30, 2021, the Company paid the remaining purchase price of $126,000,000 on a vessel that wasdelivered in July 2021 (note 20 (b)).
17

ATLAS CORP.Notes to Interim Consolidated Financial Statements(Unaudited)(Tabular amounts in millions of United States dollars, except per share amount and number of shares)
10. Long-term debt: June 30, 2021 December 31, 2020 Long-term debt: Revolving credit facilities (a) (c) $ 614.1 $ 772.1 Term loan credit facilities (b) (c) 1,892.1 2,094.7 Senior unsecured notes (d) 80.0 80.0 Fairfax Notes (e) 300.0 600.0 Exchangeable Notes 201.3 201.3 Bonds (f) 500.0 — Sustainability-linked Senior Secured Notes (g) 450.0 —
4,037.5 3,748.1 Fair value adjustment on term loan credit facilities — (0.1)Debt discount on Fairfax Notes (69.5) (130.9)Debt discount on Exchangeable Notes (5.6) (6.1)Deferred financing fees (55.7) (44.9)
Long-term debt 3,906.7 3,566.1 Current portion of long-term debt (325.1) (332.1)
Long-term debt $ 3,581.6 $ 3,234.0
(a) Revolving credit facilities:
In May 2021, the Company refinanced one revolving credit facility which increased the aggregate commitments by $100,000,000and extended the maturity by two years.
As at June 30, 2021, the Company had five revolving credit facilities available (December 31, 2020 – five revolving creditfacilities) which provided for aggregate borrowings of up to $1,064,126,000 (December 31, 2020 – $989,119,000), of which$450,000,000 (December 31, 2020 - $217,000,000) was undrawn.
As at June 30, 2021, the three month and six month average LIBOR on the Company’s revolving credit facilities was 0.1% and0.2%, respectively (December 31, 2020 – three months average LIBOR of 0.2% and six months average LIBOR of 0.3%) and themargins ranged between 0.5% and 2.3% as at June 30, 2021 (December 31, 2020 – 0.5% and 2.3%). The weighted average rate ofinterest, including the margin, for the Company’s revolving credit facilities was 1.1% as at June 30, 2021 (December 31, 2020 –1.4%). Interest payments are made monthly, quarterly and semi-annually.
The following is a schedule of future minimum repayments under the Company’s revolving facilities as of June 30, 2021:
Remainder of 2021 $ 25.7 2022 530.2 2023 58.2 $ 614.1
18

ATLAS CORP.Notes to Interim Consolidated Financial Statements(Unaudited)(Tabular amounts in millions of United States dollars, except per share amount and number of shares)
10. Long-term debt (continued):
(b) Term loan credit facilities:
In May 2021, the Company amended and restated three term loan credit facilities which increased the aggregate commitments by$79,540,000 and extended maturities by two years.
As at June 30, 2021, the Company had $2,071,635,000 (December 31, 2020 - $2,344,730,000) of term loan credit facilitiesavailable, of which $179,540,000 (December 31, 2020 - $250,000,000) was undrawn. Three of the term loan credit facilities have arevolving loan component, all of which have been included in the revolving credit facilities above.
For all of the Company’s term loan credit facilities, except for one, interest is calculated based on three month or six month LIBORplus a margin per annum, dependent on the interest period selected by the Company. The three month and six month averageLIBOR was 0.1% and 0.2%, respectively (December 31, 2020 – 0.2% and 0.3%) and the margins ranged between 0.4% and 3.5%as at June 30, 2021 (December 31, 2020 – 0.4% and 4.3%).
For one of our term loan credit facilities with a total principal amount outstanding of $33,584,000 (December 31, 2020 -$39,970,000), interest is calculated based on the Export-Import Bank of Korea (“KEXIM”) rate plus 0.7% per annum.
The weighted average rate of interest, including the applicable margin, was 2.1% as at June 30, 2021 (December 31, 2020 – 2.7%)for the Company’s term loan credit facilities. One of the Company’s term loan credit facilities bears interest at a fixed rate of 7.7%.Interest payments are made in monthly, quarterly or semi-annual payments.
The following is a schedule of future minimum repayments of the Company’s term loan credit facilities as of June 30, 2021.
Remainder of 2021 $ 168.6 2022 161.6 2023 302.4 2024 133.6 2025 132.4 Thereafter 993.5 $ 1,892.1
(c) Credit facilities – other:
As at June 30, 2021, the Company’s credit facilities were secured by first-priority mortgages granted on most of its powergeneration assets and 67 of its vessels together with other related security. The security for each of the Company’s current securedcredit facilities includes:
• A first priority mortgage on collateral assets;
• An assignment of the Company’s lease agreements and earnings related to the related collateral assets;
• An assignment of the insurance policies covering each of the collateral assets that are subject to a related mortgage and/orsecurity interest;
• An assignment of the Company’s related shipbuilding contracts and the corresponding refund guarantees and;
• A pledge over the related retention accounts.
As at June 30, 2021, $1,392,050,000 principal amount of indebtedness under the Company’s term loan and revolving creditfacilities was secured by a portfolio of 50 vessels, the composition of which can be changed, and is subject to a borrowing base andportfolio concentration requirements, as well as compliance with financial covenants and certain negative covenants.
19

ATLAS CORP.Notes to Interim Consolidated Financial Statements(Unaudited)(Tabular amounts in millions of United States dollars, except per share amount and number of shares)
10. Long-term debt (continued):
(c) Credit facilities – other (continued):
The Company may prepay certain amounts outstanding without penalty, other than breakage costs in certain circumstances, withthe exception of one term loan credit facility, where the Company may prepay borrowings up to March 6, 2023 with penalties andthereafter without penalty. A prepayment may be required as a result of certain events, including change of control and, whereapplicable, the sale or loss of assets or a termination or expiration of certain lease agreements (and the inability to enter into a leasereplacing the terminated or expired lease suitable to lenders within a specified period of time). The amount that must be prepaidmay be calculated based on the loan to market value. In these circumstances, valuations of the Company’s assets are conducted ona “without lease” and/or “orderly liquidation” basis as required under the credit facility agreement. Each credit facility contains a mix of financial covenants requiring the borrower and/or guarantor of the facility to maintainminimum liquidity, tangible net worth, interest and principal coverage ratios, and debt-to-assets ratios, as defined. Each of Atlasand Seaspan are guarantors under certain facilities. Some of the facilities also have an interest and principal coverage ratio, debt service coverage and vessel value requirement for thesubsidiary borrower. The Company was in compliance with these covenants as at June 30, 2021.
(d) Senior unsecured notes
In May 2021, the Company exchanged an aggregate principal amount of $52,198,825 7.125% senior notes due 2027 of its whollyowned subsidiary, Seaspan Corporation (the “Seaspan Notes”), for an equivalent amount of its 7.125% senior notes due 2027 (the“Atlas Notes”), registered under the Securities Act of 1933, as amended, and listed on the Nasdaq Global Market. In July 2021, theCompany exchanged an additional $151,000 of Seaspan Notes for Atlas Notes, and redeemed all remaining Seaspan Notes (note20).
(e) Fairfax Notes:
Pursuant to the Fairfax Exchange as described in note 5(c), the Company exchanged $200,000,000 aggregate principal amount ofthe 2026 Fairfax Notes and all $100,000,000 aggregate principal amount of the 2027 Fairfax Notes for (i) 12,000,000 Series J7.00% Cumulative Redeemable Perpetual Preferred Shares, and (ii) 1,000,000 five year warrants to purchase an equal number ofAtlas common shares at an exercise price of $13.71 per share. The exchanged 2026 Fairfax Notes and 2027 Fairfax Notes weresubsequently cancelled.
In connection with the Fairfax Exchange, the Fairfax Holders also agreed to amend the terms of the $300,000,000 aggregateprincipal amount of the Fairfax Notes that remain outstanding following the Fairfax Exchange, which includes all $250,000,000aggregate principal amount of the 2025 Fairfax Notes and $50,000,000 aggregate principal amount of the 2026 Fairfax Notes. TheAmendment, among other things, eliminated the Fairfax Holders’ mandatory redemption and put rights and released anddischarged all outstanding guarantees and liens on collateral thereunder. The Fairfax Holders also agreed to terminate Seaspan’sAmended and Restated Pledge and Collateral Agent Agreement and to release and discharge all liens on collateral thereof. TheCompany may redeem the amended notes at its option, in whole or in part, at any time at a redemption price equal to 100% of theprincipal amount plus any accrued and unpaid interest.
As a result of the Fairfax Exchange, the Company recorded a loss on debt extinguishment of $51,500,000 for the three and sixmonths ended June 30, 2021 (June 30, 2020 - $nil and $nil, respectively), representing the write-off of the existing associated debtdiscount and deferred financing fees.
(f) Bonds:
In February 2021, the Company issued $200,000,000 of 6.5% senior unsecured sustainability-linked bonds in the Nordic bondmarket (“2024 Bonds”). In April 2021, the Company issued a further $300,000,000 of senior unsecured sustainability-linkedbonds in the Nordic bond market (the “2026 Bonds” and together with the 2024 Bonds, the “Bonds”). The Bonds mature inFebruary 2024 and April 2026, respectively, and bear interest at 6.5% per annum. If the sustainability performance targets are notmet during the term of the Bonds, the Bonds will be settled at maturity at 100.5% of the initial principal. The Bonds are listed onthe Oslo Stock Exchange.
(g) Sustainability-linked Senior Secured Notes:
In May 2021, the Company entered into a note purchase agreement to issue $500,000,000 of sustainability-linked, senior securednotes (the “Senior Secured Notes”) in a US private placement. The Senior Secured Notes comprise four series, each ranking paripassu with the Company’s existing and future debt financing program. The Series A, Series C and Series D Senior Secured Noteswere issued in May 2021, with interest rates ranging from 3.91% to 4.26% and maturities from May 2031 to May 2036. The Series

B Senior Secured Notes, which bear interest at 3.91% per annum and mature in 2031, were issued in August 2021 (note 20). TheSenior Secured Notes contain certain sustainability features, and are subject to adjustment based on Seaspan’s achievementsrelative to certain key performance indicators.
20

ATLAS CORP.Notes to Interim Consolidated Financial Statements(Unaudited)(Tabular amounts in millions of United States dollars, except per share amount and number of shares)
11. Operating lease liabilities:
June 30, 2021 December 31, 2020 Operating lease commitments $ 856.7 $ 927.0 Impact of discounting (123.3) (141.5)Impact of changes in variable rates 38.7 44.7
Operating lease liabilities 772.1 830.2 Current portion of operating lease liabilities (157.2) (160.9)
Operating lease liabilities $ 614.9 $ 669.3
Operating lease costs related to vessel sale-leaseback transactions are summarized as follows:
Three months ended June 30, Six months ended June 30, 2021 2020 2021 2020
Lease costs: Operating lease costs $ 40.6 $ 40.0 $ 80.5 $ 80.1 Variable lease adjustments (3.8) (2.2) (7.6) (3.8) Other information: Operating cash outflow used for operating leases 35.5 37.1 71.0 75.0 Weighted average discount rate 4.8% 4.8% 4.8% 4.8% Weighted average remaining lease term 6 years 7 years 6 years 7 years
21

ATLAS CORP.Notes to Interim Consolidated Financial Statements(Unaudited)(Tabular amounts in millions of United States dollars, except per share amount and number of shares)
12. Other financing arrangements:
June 30, 2021 December 31, 2020 Other financing arrangements $ 1,160.8 $ 879.5 Deferred financing fees (19.3) (13.7)
Other financing arrangements 1,141.5 865.8 Current portion of other financing arrangements (86.9) (64.1)
Other financing arrangements $ 1,054.6 $ 801.7
In January 2021, the Company made a payment of $69,166,000 to early terminate a sale-leaseback financing arrangement securedby one 11,000 TEU vessel. In March 2021, the Company entered into a new sale-leaseback financing arrangement of $83,700,000,secured by the same 11,000 TEU vessel.
In April 2021, the Company entered into $235,000,000 in sale-lease back finance arrangements to refinance three separate vessels, thefunding of which was completed in May 2021. In May 2021, the Company repaid $59,300,000 upon early termination of a sale-leaseback financing arrangement secured by a 13,100TEU vessel. In April through June 2021, the Company entered into $1,300,320,000 in sale-leaseback financing arrangements (the “NewbuildSale-Leasebacks”) related to 13 newbuild containerships, subject to satisfaction of customary closing conditions. The NewbuildSale-Leasebacks partially fund pre-delivery payments related to the 13 newbuild containerships. During the three and six months endedJune 30, 2021, $63,000,000 was funded under the Newbuild Sale-Leasebacks.
Based on amounts funded for other financing arrangements, payments due to lessors would be as follows: Remainder of 2021 $ 43.2 2022 89.0 2023 89.7 2024 89.7 2025 82.5 Thereafter 766.7
$ 1,160.8
13. Other liabilities:
June 30, 2021 December 31, 2020 Asset retirement obligations(a) $ 50.8 $ 42.3 Other 38.2 23.4
Other long-term liabilities 89.0 65.7 Current portion of other long-term liabilities (68.0) (24.8)
Other long-term liabilities $ 21.0 $ 40.9
(a) Asset retirement obligations:
Asset retirement obligations, December 31, 2020 $ 42.3 Liabilities acquired 7.9
Liabilities incurred 0.6 Asset retirement obligations, June 30, 2021 $ 50.8
14. Income tax:
The effective tax rate for the three and six months ended June 30, 2021 was 2.4% and 4.8% (2020 – 6.9% and 5.6%). The tax rate wassignificantly lower than the United Kingdom statutory rate of 19% primarily due to international shipping reciprocal exemptions.
22

ATLAS CORP.Notes to Interim Consolidated Financial Statements(Unaudited)(Tabular amounts in millions of United States dollars, except per share amount and number of shares)
15. Share capital:
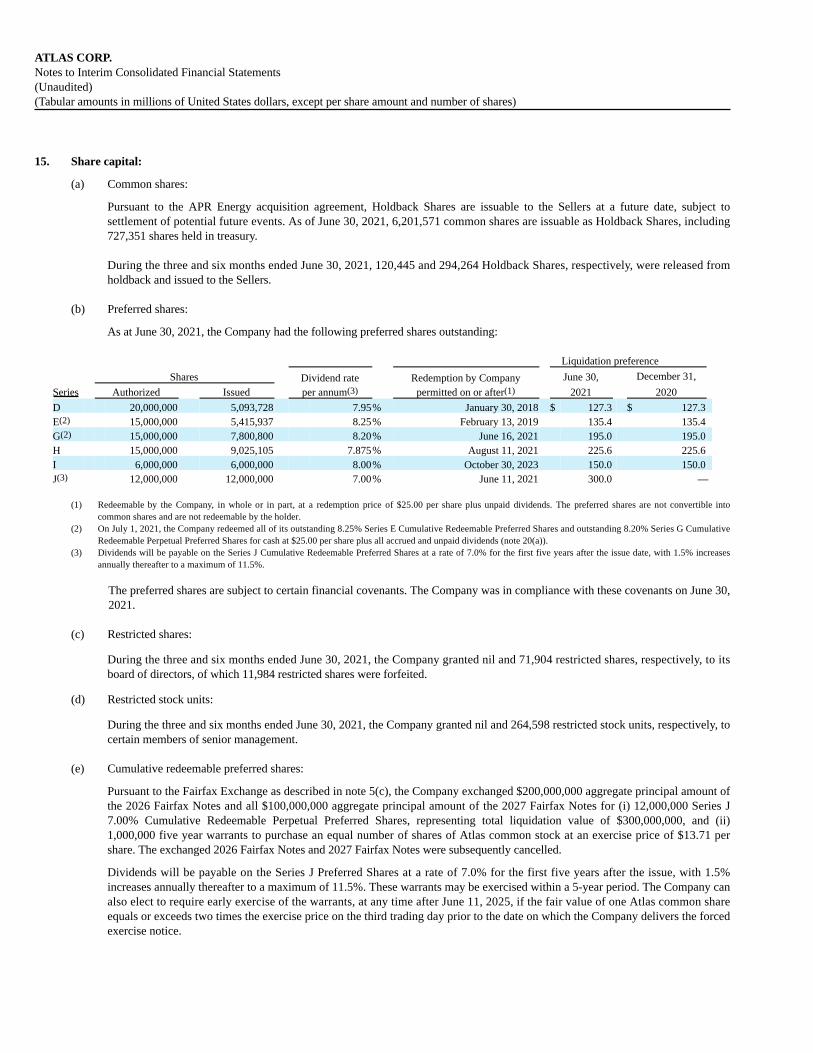
(a) Common shares:
Pursuant to the APR Energy acquisition agreement, Holdback Shares are issuable to the Sellers at a future date, subject tosettlement of potential future events. As of June 30, 2021, 6,201,571 common shares are issuable as Holdback Shares, including727,351 shares held in treasury. During the three and six months ended June 30, 2021, 120,445 and 294,264 Holdback Shares, respectively, were released fromholdback and issued to the Sellers.
(b) Preferred shares:
As at June 30, 2021, the Company had the following preferred shares outstanding:
Liquidation preference
Shares Dividend rate Redemption by Company June 30, December 31, Series Authorized Issued per annum(3) permitted on or after(1) 2021 2020
D 20,000,000 5,093,728 7.95% January 30, 2018 $ 127.3 $ 127.3 E(2) 15,000,000 5,415,937 8.25% February 13, 2019 135.4 135.4 G(2) 15,000,000 7,800,800 8.20% June 16, 2021 195.0 195.0 H 15,000,000 9,025,105 7.875% August 11, 2021 225.6 225.6 I 6,000,000 6,000,000 8.00% October 30, 2023 150.0 150.0 J(3) 12,000,000 12,000,000 7.00% June 11, 2021 300.0 —
(1) Redeemable by the Company, in whole or in part, at a redemption price of $25.00 per share plus unpaid dividends. The preferred shares are not convertible into
common shares and are not redeemable by the holder.
(2) On July 1, 2021, the Company redeemed all of its outstanding 8.25% Series E Cumulative Redeemable Preferred Shares and outstanding 8.20% Series G CumulativeRedeemable Perpetual Preferred Shares for cash at $25.00 per share plus all accrued and unpaid dividends (note 20(a)).
(3) Dividends will be payable on the Series J Cumulative Redeemable Preferred Shares at a rate of 7.0% for the first five years after the issue date, with 1.5% increasesannually thereafter to a maximum of 11.5%.
The preferred shares are subject to certain financial covenants. The Company was in compliance with these covenants on June 30,2021.
(c) Restricted shares:
During the three and six months ended June 30, 2021, the Company granted nil and 71,904 restricted shares, respectively, to itsboard of directors, of which 11,984 restricted shares were forfeited.
(d) Restricted stock units:
During the three and six months ended June 30, 2021, the Company granted nil and 264,598 restricted stock units, respectively, tocertain members of senior management.
(e) Cumulative redeemable preferred shares:
Pursuant to the Fairfax Exchange as described in note 5(c), the Company exchanged $200,000,000 aggregate principal amount ofthe 2026 Fairfax Notes and all $100,000,000 aggregate principal amount of the 2027 Fairfax Notes for (i) 12,000,000 Series J7.00% Cumulative Redeemable Perpetual Preferred Shares, representing total liquidation value of $300,000,000, and (ii)1,000,000 five year warrants to purchase an equal number of shares of Atlas common stock at an exercise price of $13.71 pershare. The exchanged 2026 Fairfax Notes and 2027 Fairfax Notes were subsequently cancelled.
Dividends will be payable on the Series J Preferred Shares at a rate of 7.0% for the first five years after the issue, with 1.5%increases annually thereafter to a maximum of 11.5%. These warrants may be exercised within a 5-year period. The Company canalso elect to require early exercise of the warrants, at any time after June 11, 2025, if the fair value of one Atlas common shareequals or exceeds two times the exercise price on the third trading day prior to the date on which the Company delivers the forcedexercise notice.

23

ATLAS CORP.Notes to Interim Consolidated Financial Statements(Unaudited)(Tabular amounts in millions of United States dollars, except per share amount and number of shares)
16. Earnings per share (“EPS”): Three months ended June 30, 2021 Three months ended June 30, 2020
Earnings
(numerator) Shares
(denominator) Per shareamount
Earnings(numerator)
Shares(denominator)
Per shareamount
Net earnings 66.0 82.7 Less preferred share dividends:
Series D (2.5) (2.5) Series E (2.8) (2.8) Series G (4.0) (4.0) Series H (4.4) (4.4) Series I (3.0) (3.0) Series J (1.2) —
Basic EPS: Earnings attributable to commonshareholders $ 48.1 246,303,000 $ 0.19 $ 66.0 247,209,000 $ 0.27
Effect of dilutive securities: Share-based compensation — 2,351,000 — 69,000 Fairfax warrants — 10,697,000 — — Holdback shares — 6,242,000 — 6,087,000 Exchangeable Notes — 972,000 — —
Diluted EPS(1): Earnings attributable to commonshareholders $ 48.1 266,565,000 $ 0.18 $ 66.0 253,365,000 $ 0.26
Six months ended June 30, 2021 Six months ended June 30, 2020
Earnings
(numerator) Shares
(denominator) Per shareamount
Earnings(numerator)
Shares(denominator)
Per shareamount
Net earnings 163.6 134.6 Less preferred share dividends:
Series D (5.0) (5.1) Series E (5.6) (5.6) Series G (8.0) (8.0) Series H (8.9) (8.8) Series I (6.0) (6.0) Series J (1.2) —
Basic EPS: Earnings attributable to commonshareholders $ 128.9 246,169,000 $ 0.52 $ 101.1 237,187,000 $ 0.43
Effect of dilutive securities: Share-based compensation — 2,192,000 — 146,000 Fairfax warrants — 9,990,000 — 2,975,000 Holdback shares — 6,282,000 — 4,114,000 Exchangeable Notes — 486,000 — —
Diluted EPS(1): Earnings attributable to commonshareholders $ 128.9 265,119,000 $ 0.49 $ 101.1 244,422,000 $ 0.41
24

ATLAS CORP.Notes to Interim Consolidated Financial Statements(Unaudited)(Tabular amounts in millions of United States dollars, except per share amount and number of shares)
17. Supplemental cash flow information:
Three Months Ended June 30, Six Months Ended June 30,
2021 2020 2021 2020
Interest paid $ 37.0 $ 37.9 $ 69.6 $ 79.9 Interest received 1.8 0.7 2.3 2.6 Undrawn credit facility fee paid 0.4 0.2 0.8 0.5 Income taxes paid 4.8 (2.9) 6.8 (5.2)Non-cash investing and financing transactions:
Dividend reinvestment — — — 0.1 Commencement of sales-type lease — — 88.1 57.0 APR Energy loans settled in shares — — — 8.3 Common shares issued on APR Energy acquisition — — — 316.8 Holdback Shares reserved on APR Energy acquisition — — — 70.6 Purchase price adjustment related to APR Energy acquisition — (33.1) — 19.4 Reclassification on lease modification — — — 377.4 Contingent consideration asset related to APR Energyacquisition — (0.3) — 41.2 Prepayments transferred to vessels upon vessel delivery 6.4 — 6.4 — Interest capitalized on vessels under construction 4.1 — 4.9 — Net assets acquired on acquisition — 33.4 — 326.8 Asset retirement obligations liabilities incurred — 5.3 — 5.3 Asset retirement obligations provision re-assessment — (0.8) — (0.8)
Changes in operating assets and liabilities (34.9) (60.6) (77.3) (116.6)Accounts receivable (22.4) — (28.5) (25.1)Inventories 1.1 (5.4) 0.7 (6.3)Prepaids expenses and other, and other assets (23.1) (6.8) (30.3) (10.7)Net investment in lease 3.0 2.6 6.2 7.7 Accounts payable and accrued liabilities 36.0 (3.6) 22.5 6.5 Settlement of decommissioning provisions 8.0 (2.6) 7.6 (2.9)Deferred revenue (6.9) 0.5 (7.1) (2.9)Income tax payable 0.5 2.5 5.6 2.0 Major maintenance (9.3) (24.4) (14.9) (36.2)Other liabilities (4.3) (0.1) (4.4) (0.7)Operating lease liabilities (30.1) (28.2) (60.1) (56.9)Derivative instruments 6.6 4.9 13.4 8.9 Contingent consideration asset 6.0 — 12.0 —
The following table provides a reconciliation of cash, cash equivalents and restricted cash reported within the consolidated balance sheetsthat sum to the amounts shown in the consolidated statements of cash flows:
June 30, 2021 2020 Cash and cash equivalents $ 591.0 $ 221.8 Restricted cash included in prepaid expenses and other — 1.5 Restricted cash included in other assets (note 9) 38.2 38.2
Total cash, cash equivalents and restricted cash shown in the consolidated statements of cash flows $ 629.2 $ 261.5
25

ATLAS CORP.Notes to Interim Consolidated Financial Statements(Unaudited)(Tabular amounts in millions of United States dollars, except per share amount and number of shares)
18. Commitments and contingencies:
(a) Operating leases:
At June 30, 2021, the commitment under operating leases for vessels was $844,737,000 for the remainder of 2021 to 2029, and forother leases was $11,963,000 for the remainder of 2021 to 2024. Total commitments under these leases are as follows: Remainder of 2021 $ 73.5 2022 143.2 2023 145.1 2024 148.2 2025 125.9 Thereafter 220.8
$ 856.7
For operating leases indexed to three-months LIBOR, commitments under these leases are calculated using the LIBOR in place asat June 30, 2021 for the Company.
(b) Vessel commitment:
As at June 30, 2021, the Company had entered into agreements to acquire 45 vessels (December 31, 2020 – 5 vessels). TheCompany has outstanding commitments for the remaining installment payments as follows: Remainder of 2021 $ 527.0 2022 1,033.5 2023 2,385.7 2024 796.7
Total $ 4,742.9
(c) Letter of credit:
As at June 30, 2021, the Company had $10,707,525 (December 31, 2020 - $11,686,000) in letters of credit outstanding in supportof its mobile power generation business, all of which are unused.
19. Financial instruments:
(a) Fair value: The carrying values of cash and cash equivalents, short-term investments, restricted cash, accounts receivable and accountspayable, income tax payable and accrued liabilities approximate their fair values because of their short term to maturity. As of June 30, 2021, the fair value of the Company’s revolving credit facilities and term loan credit facilities, excluding deferredfinancing fees was $2,466,357,000 (December 31, 2020 - $2,827,984,000) and the carrying value was $2,506,222,000 (December31, 2020 - $2,866,850,000). As of June 30, 2021, the fair value of the Company’s operating lease liabilities was $770,052,000(December 31, 2020 - $828,111,000) and the carrying value was $772,170,000 (December 31, 2020 - $830,200,000). As of June30, 2021, the fair value of the Company’s other financing arrangements, excluding deferred financing fees, was $1,186,588,000(December 31, 2020 - $891,710,000) and the carrying value was $1,160,750,000 (December 31, 2020 - $879,468,000). The fairvalue of the revolving and term loan credit facilities, operating lease liabilities and other financing arrangements, excludingdeferred financing fees, was estimated based on expected principal repayments and interest, discounted by relevant forward ratesplus a margin appropriate to the credit risk of the Company. Therefore, the Company categorized the fair value of these financialinstruments as Level 2 in the fair value hierarchy.
26

ATLAS CORP.Notes to Interim Consolidated Financial Statements(Unaudited)(Tabular amounts in millions of United States dollars, except per share amount and number of shares)
19. Financial instruments (continued):
(a) Fair value (continued): As of June 30, 2021, the fair value of the Company’s senior unsecured notes was $86,167,000 (December 31, 2020 – $89,207,000)and the carrying value was $80,000,000 (December 31, 2020 – $80,000,000). The aggregate fair value of the 2025 Fairfax Notesand 2026 Fairfax Notes was $308,007,000 (December 31, 2020 – $640,058,000) and the aggregate carrying value was$300,000,000 (December 31, 2020 - $600,000,000) or $230,530,000 (December 31, 2020 – $469,100,000), net of discount. Thefair value of the Company’s Exchangeable Notes was $196,967,000 (December 31, 2020 - $195,232,000) and the carrying valuewas $201,250,000 (December 31, 2020 - $201,250,000) or $195,604,000 (December 31, 2020 - $195,000,000), net of debtdiscount. The fair value of the Company’s Bonds was $534,339,000 and the carrying value was $500,000,000. The fair value ofthe Company’s Sustainability-linked Senior Secured Notes was $415,125,000 and the carrying value was $450,000,000. The fairvalue was calculated using the present value of expected principal repayments and interest discounted by relevant forward ratesplus a margin appropriate to the credit risk of the Company. As a result, these amounts were categorized as Level 2 in the fair valuehierarchy.
The Company’s interest rate derivative financial instruments are re-measured to fair value at the end of each reporting period. Thefair values of the interest rate derivative financial instruments have been calculated by discounting the future cash flow of both thefixed rate and variable rate interest rate payments. The discount rate is derived from a yield curve created by nationally recognizedfinancial institutions adjusted for the associated credit risk. The fair values of the interest rate derivative financial instruments aredetermined based on inputs that are readily available in public markets or can be derived from information available in publiclyquoted markets. Therefore, the Company categorized the fair value of these derivative financial instruments as Level 2 in the fairvalue hierarchy.
As part of the acquisition of APR Energy, the Company obtained a contingent consideration asset related to compensation theCompany will receive from the Sellers on losses that may be generated from cash repatriation from a foreign jurisdiction. The fairvalue of the contingent consideration asset is calculated as the present value of expected future compensable losses fromconversion of cash from foreign currency to US dollars, derived from the discount expected to be realized on repatriation of cashfrom the foreign jurisdiction over a specified period of time, which is a significant unobservable input. As such, the Companycategorized the fair value of the contingent consideration asset as Level 3 in the fair value hierarchy. The discount expected to berealized on future repatriation of cash as of June 30, 2021 is 40%. An increase or decrease of 5% on the discount would result in anincrease or decrease in the fair value of approximately $2,088,000, respectively.
As part of the acquisition of APR Energy, the Company also obtained, a contingent consideration asset related to compensation theCompany expects to receive from Fairfax on losses realized on future sale or disposal of certain property, plant and equipment andinventory items. The fair value of the contingent consideration asset is determined based on the present value of expected futurecompensation, calculated as the difference between the book value of the respective assets at acquisition and the realizable value ofthe asset obtained from market quotes, which is a significant unobservable input. As such, the Company categorized the fair valueof the contingent consideration asset as Level 3 in the fair value hierarchy.
Unobservable inputs for recurring and non-recurring Level 3 disclosures are obtained from third parties whenever possible andreviewed by the Company for reasonableness.
27
ATLAS CORP.Notes to Interim Consolidated Financial Statements(Unaudited)(Tabular amounts in millions of United States dollars, except per share amount and number of shares)
19. Financial instruments (continued):
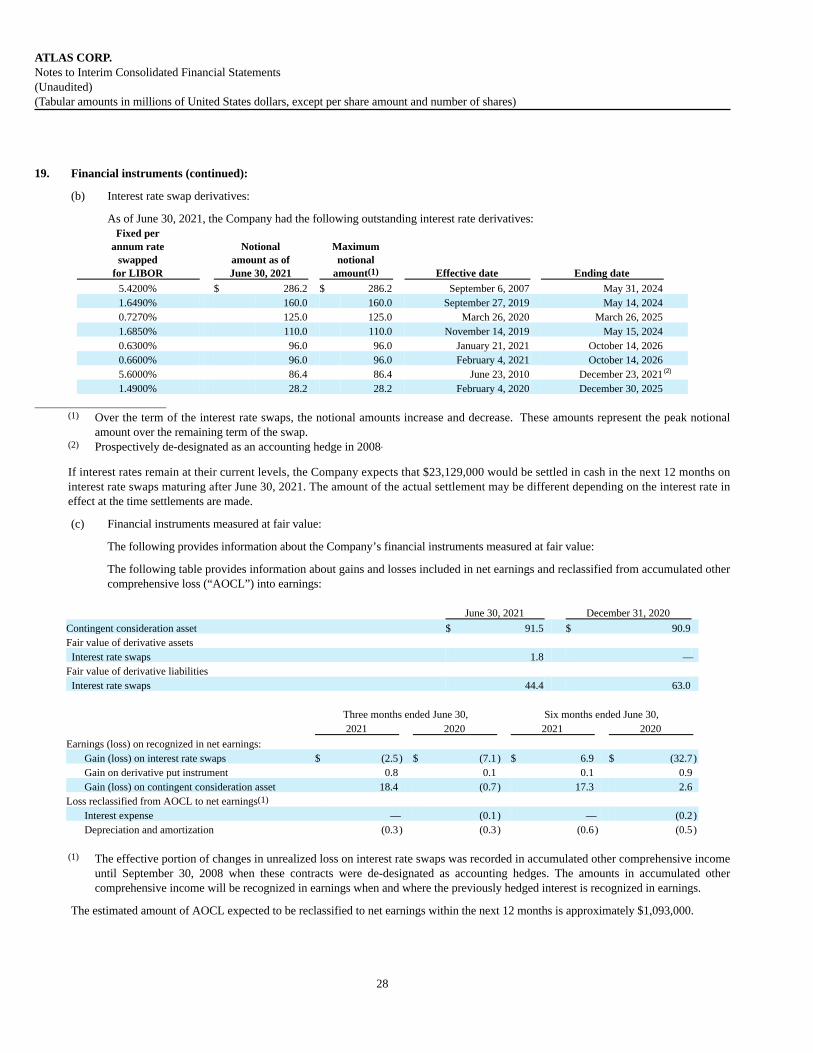
(b) Interest rate swap derivatives:
As of June 30, 2021, the Company had the following outstanding interest rate derivatives:Fixed per
annum rateswapped
for LIBOR
Notionalamount as ofJune 30, 2021
Maximumnotional
amount(1) Effective date Ending date
5.4200% $ 286.2 $ 286.2 September 6, 2007 May 31, 2024
1.6490% 160.0 160.0 September 27, 2019 May 14, 2024
0.7270% 125.0 125.0 March 26, 2020 March 26, 2025
1.6850% 110.0 110.0 November 14, 2019 May 15, 2024
0.6300% 96.0 96.0 January 21, 2021 October 14, 2026 0.6600% 96.0 96.0 February 4, 2021 October 14, 2026 5.6000% 86.4 86.4 June 23, 2010 December 23, 2021 (2)
1.4900% 28.2 28.2 February 4, 2020 December 30, 2025
______________________ (1) Over the term of the interest rate swaps, the notional amounts increase and decrease. These amounts represent the peak notional
amount over the remaining term of the swap. (2) Prospectively de-designated as an accounting hedge in 2008.
If interest rates remain at their current levels, the Company expects that $23,129,000 would be settled in cash in the next 12 months oninterest rate swaps maturing after June 30, 2021. The amount of the actual settlement may be different depending on the interest rate ineffect at the time settlements are made.
(c) Financial instruments measured at fair value:
The following provides information about the Company’s financial instruments measured at fair value:
The following table provides information about gains and losses included in net earnings and reclassified from accumulated othercomprehensive loss (“AOCL”) into earnings:
June 30, 2021 December 31, 2020
Contingent consideration asset $ 91.5 $ 90.9 Fair value of derivative assets Interest rate swaps 1.8 — Fair value of derivative liabilities Interest rate swaps 44.4 63.0
Three months ended June 30, Six months ended June 30,
2021 2020 2021 2020
Earnings (loss) on recognized in net earnings: Gain (loss) on interest rate swaps $ (2.5) $ (7.1) $ 6.9 $ (32.7)Gain on derivative put instrument 0.8 0.1 0.1 0.9 Gain (loss) on contingent consideration asset 18.4 (0.7) 17.3 2.6
Loss reclassified from AOCL to net earnings(1) Interest expense — (0.1) — (0.2)Depreciation and amortization (0.3) (0.3) (0.6) (0.5)
(1) The effective portion of changes in unrealized loss on interest rate swaps was recorded in accumulated other comprehensive income
until September 30, 2008 when these contracts were de-designated as accounting hedges. The amounts in accumulated othercomprehensive income will be recognized in earnings when and where the previously hedged interest is recognized in earnings.
The estimated amount of AOCL expected to be reclassified to net earnings within the next 12 months is approximately $1,093,000.
28


ATLAS CORP.Notes to Interim Consolidated Financial Statements(Unaudited)(Tabular amounts in millions of United States dollars, except per share amount and number of shares)
20. Subsequent events:
a) On July 1, 2021, the Company redeemed all of its outstanding 8.25% Series E Cumulative Redeemable Preferred Shares andoutstanding 8.20% Series G Cumulative Redeemable Perpetual Preferred Shares for cash.
b) On July 2, 2021, the Company accepted delivery of one 15,000 TEU secondhand vessel and its attached charter agreement.
c) On July 7, 2021, the Company declared quarterly dividends of $0.496875, $0.492188, $0.500000, and $0.238194 per Series D, SeriesH, Series I and Series J preferred share, respectively, representing a total distribution of $12,831,000. The dividends were paid onJuly 30, 2021.
d) On July 7, 2021, the Company declared quarterly dividends of $0.125 per common share to all shareholders of record as of July 20,2021. The dividends were paid on July 30, 2021.
e) On July 9 and 12, 2021, the Company exchanged an additional $151,000 of Seaspan Notes for Atlas Notes. On July 12, 2021, theCompany redeemed the remaining $27,650,000 Seaspan Notes plus accrued and unpaid interest.
f) On July 14, 2021, the Company issued $750,000,000 of senior unsecured notes. These notes mature in 2029 and accrue interest at5.5% per annum.
g) In July 2021, the Company entered into agreements to acquire ten 7,000 TEU vessels.
h) In August 2021, the Company entered into $661,826,000 in sale-leaseback financing arrangements related to six newbuildcontainership vessels, subject to satisfaction of customary closing conditions
i) On August 12, 2021, the Company issued $50,000,000 of Senior Secured Notes, Series B. The Series B Senior Secured Notes maturein 2031 and bear interest at 3.91% per annum.
29

ITEM 2 — MANAGEMENT’S DISCUSSION AND ANALYSIS OF FINANCIAL CONDITION ANDRESULTS OF OPERATIONS
The following should be read in conjunction with the unaudited consolidated financial statements and related notes included in this Reportand the audited consolidated financial statements, related notes and Management’s Discussion and Analysis of Financial Condition and Results ofOperations included in our Annual Report on Form 20-F for the year ended December 31, 2020. The Annual Report was filed with the U.S.Securities and Exchange Commission on March 19, 2021. Unless otherwise indicated, all amounts are presented in U.S. dollars, or USD. Weprepare our consolidated financial statements in accordance with U.S. GAAP.
Overview
General
We are Atlas Corp., a global asset manager and the parent company of Seaspan Corporation (“Seaspan”) and APR Energy Ltd (togetherwith Apple Bidco Limited, “APR Energy”).
Atlas was incorporated in the Republic of the Marshall Islands in October 2019 for the purpose of facilitating, and to become the successorpublic company of Seaspan pursuant to, the Reorganization. Atlas is a holding company and its sole assets are its interests in Seaspan and APREnergy and their respective subsidiaries.
Segment Reporting
For management purposes, the Company is organized based on its two leasing businesses and has two reportable segments, containershipleasing and power generation. The Company’s containership leasing segment, which is conducted through Seaspan, owns and operates a fleet ofcontainerships which are chartered primarily pursuant to long-term, fixed-rate, time charters with major container liner companies. TheCompany’s mobile power generation segment, which is conducted through APR Energy, owns and operates a fleet of power generation assets,including gas turbines and other equipment, and provides power solutions to customers, through medium to long-term contracts.
Containership leasing
Through Seaspan, we are a leading independent charter owner and manager of containerships, which we charter primarily pursuant tolong-term, fixed-rate time charters with major container liner companies. We primarily deploy our vessels on long-term, fixed-rate time chartersto take advantage of the stable cash flow and high utilization rates that are typically associated with long-term time charters. As at June 30, 2021,we operated a fleet of 130 vessels that have an average age of approximately eight years, on a TEU weighted basis.
Customers for our operating fleet as at June 30, 2021 are as follows:
Customer for Current Fleet Number of vessels under charter TEUs under charter CMA CGM 18 158,700
COSCO 37 267,500 Hapag-Lloyd 13 109,250
Maersk 13 69,500 MSC 6 67,000 ONE 25 204,750
Yang Ming Marine 16 220,000 ZIM 2 8,500
Our primary objective for Seaspan is to continue to grow our containership leasing business through accretive vessel acquisitions as marketconditions allow. Most of our customers’ containership business revenues are derived from the shipment of goods from the Asia Pacific region,primarily China, to various overseas export markets in the United States and in Europe.
We use the term “twenty-foot equivalent unit”, or TEU, the international standard measure of containers, in describing the capacity of ourcontainerships, which are also referred to as our “vessels”.
The following table summarizes key facts regarding Seaspan’s fleet as of June 30, 2021:
Vessel Class(TEU)
# Vessels (TotalFleet)
# Vessels (ofwhich are
unencumbered) Average Age
(Years)(7)
AverageRemaining
Charter Period(Years)(1)(7)
Average DailyCharter Rate (in
thousands ofUSD) Days Off-Hire(5)
TotalOwnership
Days(6) 2500-3500 14 6 13.1 2.7 16.2 51 1,274 4250-5100 33 18 14.1 3.3 17.9 90 3,003
8500-9600(2) 18 3 11.4 4.6 38.8 7 1,564 10000-11000(3) 33 3 5.7 4.9 32.1 19 3,003 12000-13100(4) 16 - 7.4 4.1 45.8 - 1,456
14000+ 16 3 5.3 4.6 48.1 4 1,401 Total/Average 130 33 8.1 4.4 31.4 171 11,701
(1) Excludes options to extend charter.

(2) Includes 3 vessels on bareboat charter.
(3) Includes 8 vessels on bareboat charter.
(4) Includes 1 vessel on bareboat charter.
(5) Days Off-Hire includes scheduled and unscheduled days related to vessels being off-charter during the quarter ended June 30, 2021.
(6) Total Ownership Days for the quarter ended June 30, 2021 includes time charters and bareboat charters and excludes days prior to the initial charter hire date.
(7) Averages shown are weighted by TEU
30

Power Generation
Through APR Energy, we also operate a fleet of power generation assets, providing power generation to customers including largecorporations and public and private utilities. Our mobile, turnkey power plants are deployed in cities, countries, and industries around the world inboth developed and developing markets. As of June 30, 2021, we operated a fleet of 30 aero-derivative gas turbines and 439 diesel generators. Theaverage age of our turbines is approximately eight years and the average age of our diesel generators is approximately eleven years.
Our primary objective is to drive sustained growth and optimize cash flow by delivering operational excellence and providing a broadrange of innovated technologies and offerings to generate customer value. Our revenues are primarily derived through power generation and ourturnkey services include plant design, fast-tracked installation of generating equipment and balance of plant, plant operation, and around-the-clock service and maintenance.
We use the term “megawatts”, or MW, in describing the capacity of our power generation equipment.
Asset Type Fleet Size (MW) Contracted Fleet (MW) Contracted Revenue
(USD millions) Average Remaining Contract Term
(Years)(1) Mobile Power Fleet 1,360 1,246 $ 257.6 1.6
(1) Average remaining contract term excludes extensions; weighted by MW installed.
Significant Developments During the Quarter ended June 30, 2021
Fairfax Exchange and Amendment Transaction
In June 2021, Atlas and Seaspan completed an exchange and amendment of $600.0 million aggregate principal amount of Seaspan’s seniornotes, including $250.0 million of Seaspan’s 5.5% Senior Notes due 2025 (the “2025 Fairfax Notes”), $250.0 million of Seaspan’s 5.5% SeniorNotes due 2026 (the “2026 Fairfax Notes”) and $100.0 million of Seaspan’s 5.5% Senior Notes due 2027 (the “2027 Fairfax Notes” and togetherwith the 2025 Fairfax Notes and the 2026 Fairfax Notes, the “Fairfax Notes”). The outstanding Fairfax Notes are held by certain affiliates ofFairfax Financial Holding Limited (the “Fairfax Holders”).
Pursuant to this transaction, the Company exchanged $200.0 million aggregate principal amount of the 2026 Fairfax Notes and all $100.0million aggregate principal amount of the 2027 Fairfax Notes for (i) 12,000,000 Series J 7.00% Cumulative Redeemable Perpetual PreferredShares of the Company (the “Series J Preferred Shares”), representing total liquidation value of $300.0 million and (ii) 1,000,000 five yearwarrants to purchase an equal number of common shares of the Company at an exercise price of $13.71 per share (the “Fairfax Exchange”). Theexchanged 2026 Fairfax Notes and 2027 Fairfax Notes were subsequently cancelled.
In connection with the Fairfax Exchange, the Fairfax Holders agreed to amend the terms of the $300.0 million aggregate principal amountof the Fairfax Notes that remain outstanding following the Fairfax Exchange (the “Amendment”), which includes all $250.0 million aggregateprincipal amount of the 2025 Fairfax Notes and $50.0 million aggregate principal amount of the 2026 Fairfax Notes. The Amendment, amongother things, eliminated the Fairfax Holders mandatory redemption and puts rights and released and discharged all outstanding guarantees andliens on collateral thereunder. The Fairfax Holders also agreed to terminate the Amended and Restated Pledge and Collateral Agent Agreementand to release and discharge all liens on collateral thereunder. The Company may redeem the amended notes at its option, in whole, or in part, atany time at a redemption price equal to 100% of the principal amount plus any accrued and unpaid interest.
New Asset Financings
In April through June 2021, the Company entered into $1.3 billion in sale-leaseback financing arrangements (the “NewbuildSale-Leasebacks”) related to 13 newbuild containerships, subject to satisfaction of customary closing conditions. The Newbuild Sale-Leasebackspartially fund pre-delivery payments related to the 13 newbuild containerships. As of June 30, 2021, the Company received aggregate funding of$63.0 million from these financings.
Enhancement of the Company’s Vessel Portfolio Financing Program
In May 2021, the Company entered into amendments and restatements (the “Amendment and Restatement”) of the senior secured loanfacilities and intercreditor and proceeds agreement that compromise its vessel portfolio financing program (the “Program”) to, among otherthings, (i) increase the capacity under the Program to $2.5 billion, including the Sustainability-Linked Notes, (ii) increase the size of the revolvingcredit facility from $300.0 million to $400.0 million, (iii) increase the commitments under the bank loan facilities by $180.0 million and (iv)extend the maturities of tranches due to 2024 and 2025 by approximately two years.
31

$500 million Sustainability-linked Senior Secured Notes
In May 2021, the Company entered into a note purchase agreement to issue, in a private placement (the “Private Placement”), $500.0million aggregate principal amount of fixed rate, sustainability-linked senior secured notes (the “Senior Secured Notes”). On May 21, 2021, theCompany issued $450.0 million of such notes, comprised of $150.0 million aggregate principal amount of 3.91% Series A Senior Secured Notesdue 2031, $170.0 million aggregate principal amount of 4.06% Series C Senior Secured Notes due 2033 and $130.0 million aggregate principal of4.26% Series D Senior Secured Notes due 2036. The Company issued the remaining $50.0 million aggregate principal amount of 3.91% Series BSenior Secured Notes due to 2031 in August 2021. The Private Placement was completed as part of an amendment and upsize of the Program.
Refinancings
In April 2021, the Company entered into $235.0 million in sale-leaseback financing arrangements (the “Sale-Leasebacks”) to refinancethree operating vessels, the funding of which was completed in May 2021.
Issuance of $300 million Sustainability Linked Senior Unsecured Bonds
In April 2021, the Company issued $300.0 million aggregate principal amount of our 6.5% senior unsecured sustainability-linked bondsdue 2026 (the “2026 Bonds”). The 2026 Bonds will mature in April 2026 and bear interest at 6.5% per annum. If the sustainability linked targetsare met, the 2026 Bonds are to be redeemed at maturity at 100.0% of the initial principal amount. If the sustainability linked targets are not met,the 2026 Bonds are to be settled at maturity at 100.5% of the initial principal amount. The 2026 Bonds are listed on the Oslo Stock Exchange.
Notes Exchange Offer
In May 2021, Atlas completed an offer to exchange (the “Exchange Transaction”) up to $80.0 million aggregate principal amount of7.125% senior unsecured notes due 2027 (the “Atlas Notes”) for any and all outstanding $80.0 million aggregate principal amount of Seaspan’ssubstantially similar 7.125% senior unsecured notes due 2027 (the “Seaspan Notes”). The Seaspan Notes were originally issued in October 2017.Pursuant to the Exchange Transaction, Atlas issued approximately $52.2 million aggregate principal amount of the Atlas Notes in exchange for anequal principal amount of the Seaspan Notes. In July 2021, Atlas exchanged an additional $0.2 million of Atlas Notes to Seaspan Notes. Seaspansubsequently redeemed all remaining Seaspan Notes at par, plus accrued and unpaid interest in July 2021.
Early Termination of Secured Credit Facilities
In June 2021, the Company voluntarily prepaid four secured credit facilities (“June Pre-Payments”) representing approximately $199.8million aggregate principal amount of borrowings. As a result, four vessels became unencumbered.
In May 2021, the Company made a prepayment of $59.3 million to early terminate a financing arrangement secured by a 13,100 TEUvessel. This vessel was subsequently refinanced under a sale-leaseback as described under “Refinancings”.
Shipbuilding Contracts for Newbuild Containerships
During the quarter ended June 30, 2021, Seaspan entered into agreements with shipyards to build eight newbuild containerships that aresummarized below. Newbuilds Total TEU Month Acquired12000 TEU 2 24,000 June 202115000 TEU 6 90,000 June 2021
Total 8 114,000
Upon delivery, these vessels will commence long-term charters with leading global liner companies.
New Contracts in Mexico and California
In April 2021, APR entered into contracts to provide 330MW utilizing 10 aero-derivative gas turbines to provide peaking power inMexicali, Mexico. APR also entered into contracts for three aero-derivative gas turbines in California. Impact of COVID-19 on our Business
The spread of the COVID-19 virus has caused substantial disruptions in the global economy and the shipping and energy industries, as wellas significant volatility in the financial markets. The duration and full effects of this global health emergency and related disruptions are uncertain,although expected to continue for the near future as the success and timing of COVID-19 vaccination programs and containment strategies arealso uncertain. Negative impacts of COVID-19 are expected to reverberate beyond the duration of the pandemic itself.
Notwithstanding the foregoing, some of the negative impacts of COVID-19 on the container shipping industry have reversed. Following a
period of reduced container trade and associated charter rates in the first half of 2020, container trade and charter rates have since reboundedmarkedly due to increased demand and lack of capacity. We believe future significant downside risk to Seaspan’s business is mitigated by ourlongstanding business relationships and the long-term contracts securing the majority of our fleet, including the 58 forward fixtures executedsince the beginning of 2021.
32

For Seaspan, the costs of operations have increased due to COVID-19’s impact on supply chains, on workers’, surveyors’ and other
specialists’ access to the shipyards to complete repairs and inspections, and on the ability to conduct crew transfers. Accordingly, we have madelogistical changes and worked with vendors to ensure continued access to equipment and supplies and mitigate costs. We have also intentionallydelayed or altered plans for repairs and vessel projects where practicable. For our crew, we have developed and implemented extended onboardmanagement procedures and we have prepared response plans should any crew member fall ill onboard. In addition, although embarkation anddisembarkation of seafarers remains challenging and there are increased costs associated, we are conducting crew changes at ports where transfersare permitted. Management has obtained agreements from certain charterers to alter trading routes to facilitate crew changes.
In contrast to the container shipping industry, COVID-19 continues to impact demand in the energy sector and has accelerated increased
demand for renewable energy sources. APR Energy continues to be challenged by the effective shutdown of government institutions in somejurisdictions, which have impacted procurement processes for certain prospective projects. Nevertheless, APR Energy was able to securecontracts in the emergency and peaking power markets in which it operates and where the decline in energy demand was less visible. To mitigatethe continued impact of COVID-19 on the energy sector, APR Energy focuses on developing existing customer relationships to ensure it is able toextend and expand current contractual relationships wherever possible. As at June 30, 2021, APR Energy has 11 turbines and a number of dieselpower modules off contract, together representing 364 megawatt capacity and 27% of the overall fleet capacity. There can be no assurance that wewill be able to secure employment for our idle turbines or buyers for the diesel power modules in the near term.
Many of our office staff continue to work remotely. We have instituted enhanced safety protocols including suspending all nonessential
travel, mandatory self-isolation of personnel returning from travel and substitution of physical meetings with virtual meetings. To the extentemployees have returned to our physical offices, the return to office is being done on a gradual basis to ensure social distancing can be maintainedand additional protective measures have been implemented in line with local health authority directives.
We continuously monitor the developing situation, as well as our customers’ response thereto, and make all necessary preparations to
address and mitigate, to the extent possible, the impact of COVID-19 to our company.
Subsequent Events
Recent changes to Directors and Senior Management
In July 2021, we announced the appointment of a non-executive board member, Katie Wade, who will join us effective September 1, 2021.
Dividends
On July 7, 2021, our Board of Directors declared the following quarterly cash dividends on outstanding common and preferred shares for atotal distribution of $43.6 million paid on July 30, 2021.
Security Ticker Dividend per
Share Period Record Date Payment DateCommon shares ATCO $ 0.125 April 1, - June 30, 2021 7/20/2021 7/30/2021Series D preferred shares ATCO-PD $ 0.496875 April 30, - July 29, 2021 7/29/2021 7/30/2021Series H preferred shares ATCO-PH $ 0.492188 April 30, - July 29, 2021 7/29/2021 7/30/2021Series I preferred shares ATCO-PI $ 0.50 April 30, - July 29, 2021 7/29/2021 7/30/2021Series J preferred shares N/A $ 0.238194 June 11, - July 29, 2021 7/29/2021 7/30/2021
Vessel Delivery and Acquisition
In July 2021, Seaspan accepted delivery of one 15000 TEU scrubber-fitted vessel. Also, in July 2021, the Company entered intoagreements to acquire ten 7000 TEU LNG dual-fuel containerships for an aggregate price of $1.05 billion. The vessels are expected to bedelivered between the fourth quarter of 2023 through 2024.
Private Placement of Notes
In July 2021, the Company issued $750 million aggregate principal amount of 5.50% senior unsecured notes due 2029. The notes are ablue transition bond and Seaspan's senior unsecured obligations and accrue interest at a rate of 5.50% per year, payable semi-annually in arrearson February 1 and August 1 of each year, beginning on February 1, 2022. The notes are not guaranteed by Atlas or any of its or Seaspan'srespective subsidiaries. The notes will mature on August 1, 2029, unless earlier repurchased or redeemed.
Preferred Share and Note Redemptions
In July 2021, the Company redeemed all of its outstanding 8.25% Series E Cumulative Redeemable Preferred Shares and outstanding8.20% Series G Cumulative Redeemable Perpetual Preferred Shares for cash. The Company also redeemed all of the $27.8 million SeaspanNotes.
Senior Secured Notes Issuance
In August 2021, the Company issued $50.0 million of Senior Secured Notes, Series B. The Series B Senior Secured Notes mature in 2031and bear interest at 3.91% per annum.
33

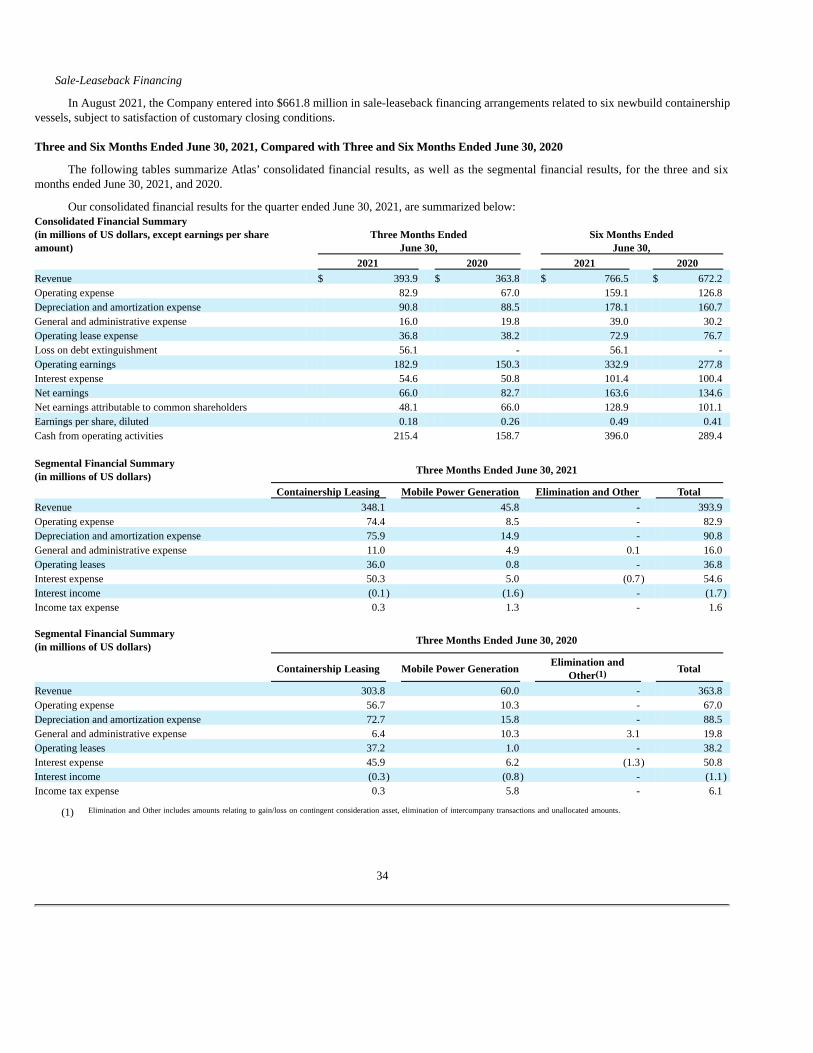
Sale-Leaseback Financing
In August 2021, the Company entered into $661.8 million in sale-leaseback financing arrangements related to six newbuild containershipvessels, subject to satisfaction of customary closing conditions. Three and Six Months Ended June 30, 2021, Compared with Three and Six Months Ended June 30, 2020
The following tables summarize Atlas’ consolidated financial results, as well as the segmental financial results, for the three and sixmonths ended June 30, 2021, and 2020.
Our consolidated financial results for the quarter ended June 30, 2021, are summarized below:Consolidated Financial Summary(in millions of US dollars, except earnings per shareamount)
Three Months EndedJune 30,
Six Months EndedJune 30,
2021 2020 2021 2020 Revenue $ 393.9 $ 363.8 $ 766.5 $ 672.2 Operating expense 82.9 67.0 159.1 126.8 Depreciation and amortization expense 90.8 88.5 178.1 160.7 General and administrative expense 16.0 19.8 39.0 30.2 Operating lease expense 36.8 38.2 72.9 76.7 Loss on debt extinguishment 56.1 - 56.1 - Operating earnings 182.9 150.3 332.9 277.8 Interest expense 54.6 50.8 101.4 100.4 Net earnings 66.0 82.7 163.6 134.6 Net earnings attributable to common shareholders 48.1 66.0 128.9 101.1 Earnings per share, diluted 0.18 0.26 0.49 0.41 Cash from operating activities 215.4 158.7 396.0 289.4
Segmental Financial Summary(in millions of US dollars)
Three Months Ended June 30, 2021
Containership Leasing Mobile Power Generation Elimination and Other Total Revenue 348.1 45.8 - 393.9 Operating expense 74.4 8.5 - 82.9 Depreciation and amortization expense 75.9 14.9 - 90.8 General and administrative expense 11.0 4.9 0.1 16.0 Operating leases 36.0 0.8 - 36.8 Interest expense 50.3 5.0 (0.7) 54.6 Interest income (0.1) (1.6) - (1.7)Income tax expense 0.3 1.3 - 1.6
Segmental Financial Summary(in millions of US dollars)
Three Months Ended June 30, 2020
Containership Leasing Mobile Power Generation
Elimination andOther(1) Total
Revenue 303.8 60.0 - 363.8 Operating expense 56.7 10.3 - 67.0 Depreciation and amortization expense 72.7 15.8 - 88.5 General and administrative expense 6.4 10.3 3.1 19.8 Operating leases 37.2 1.0 - 38.2 Interest expense 45.9 6.2 (1.3) 50.8 Interest income (0.3) (0.8) - (1.1)Income tax expense 0.3 5.8 - 6.1
(1) Elimination and Other includes amounts relating to gain/loss on contingent consideration asset, elimination of intercompany transactions and unallocated amounts.
34

Operating Results - Containership Leasing Segment
Ownership Days are the number of days a vessel is owned and available for charter. Ownership Days On-Hire are the number of days avessel is available to the charterer for use. The primary driver of Ownership Days is the increase or decrease in the number of vessels in our fleet.
Total Ownership Days increased by 562 days for the six months ended June 30, 2021, compared with the same period in 2020. Theincrease for the six months ended June 30, 2021, was primarily due to the delivery of the seven vessels after June 2020, which contributed 543days.
Vessel Utilization represents the number of Ownership Days On-Hire as a percentage of Total Ownership Days. The following tablesummarizes Seaspan’s Vessel Utilization for the last eight consecutive quarters:
2019 2020 2021 Q3 Q4 Q1 Q2 Q3 Q4 Q1 Q2 Vessel Utilization: Time Charter Ownership Days(1) 9,844 9,791 9,646 10,047 10,284 10,520 10,318 10,609 Bareboat Ownership Days(1) 460 523 1,069 1,092 1,104 1,104 1,112 1,092
Total Ownership Days 10,304 10,314 10,715 11,139 11,388 11,624 11,430 11,701 Less Off-Hire Days:
Scheduled Dry-Docking (36) (59) (131) (195) (89) (20) (63) (111)Unscheduled Off-Hire(2) (3) (36) (90) (90) (68) (29) (25) (60)
Ownership Days On-Hire 10,265 10,219 10,494 10,854 11,231 11,575 11,342 11,530
Vessel Utilization 99.6% 99.1% 97.9% 97.4% 98.6% 99.6% 99.2% 98.5%
(1) Ownership Days for time charters and bareboat charters exclude days prior to the initial charter hire date
(2) Unscheduled off-hire includes days related to vessels being off-charter.
Vessel utilization increased for the three and six months ended June 30, 2021, compared with the same periods in 2020. The increase wasprimarily due to a decrease in the number of Scheduled Dry-Docking days.
New Vessels Contracts.
The following table summarizes key facts regarding our secondhand vessels acquired in 2021:
Vessel Name Vessel Class
(TEU) Delivery Date Charterer Length ofCharter(1) Charter Type
Mediterranean Bridge (2) 8500 Apr-21 ZIM 6 years Time CharterGulf Bridge (3) 8500 May-21 ZIM 6 years Time CharterCMA CGM Chile (4) 15000 May-21 CMA CGM 6 years Time CharterCMA CGM Mexico (4) 15000 Jul-21 CMA CGM 6 years Time Charter
(1) All options to extend the term are exercisable at the charterer’s option unless otherwise noted.
(2) Existing time charter on acquired vessel ends September 2021 and long-term charter commences thereafter.
(3) Existing time charter on acquired vessel ends June 2023 and long-term charter commences thereafter.
(4) Remaining length of charter from acquisition date.
35
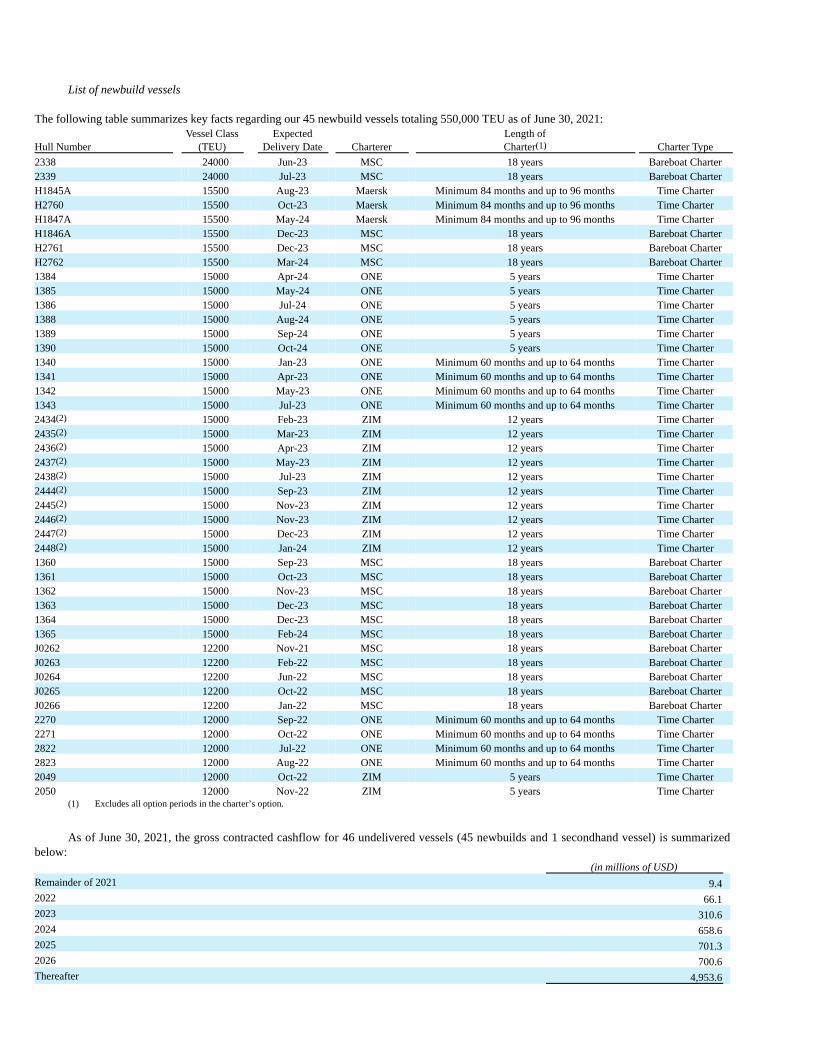
List of newbuild vessels
The following table summarizes key facts regarding our 45 newbuild vessels totaling 550,000 TEU as of June 30, 2021:
Hull Number Vessel Class
(TEU) Expected
Delivery Date Charterer Length ofCharter(1) Charter Type
2338 24000 Jun-23 MSC 18 years Bareboat Charter2339 24000 Jul-23 MSC 18 years Bareboat CharterH1845A 15500 Aug-23 Maersk Minimum 84 months and up to 96 months Time CharterH2760 15500 Oct-23 Maersk Minimum 84 months and up to 96 months Time CharterH1847A 15500 May-24 Maersk Minimum 84 months and up to 96 months Time CharterH1846A 15500 Dec-23 MSC 18 years Bareboat CharterH2761 15500 Dec-23 MSC 18 years Bareboat CharterH2762 15500 Mar-24 MSC 18 years Bareboat Charter1384 15000 Apr-24 ONE 5 years Time Charter1385 15000 May-24 ONE 5 years Time Charter1386 15000 Jul-24 ONE 5 years Time Charter1388 15000 Aug-24 ONE 5 years Time Charter1389 15000 Sep-24 ONE 5 years Time Charter1390 15000 Oct-24 ONE 5 years Time Charter1340 15000 Jan-23 ONE Minimum 60 months and up to 64 months Time Charter1341 15000 Apr-23 ONE Minimum 60 months and up to 64 months Time Charter1342 15000 May-23 ONE Minimum 60 months and up to 64 months Time Charter1343 15000 Jul-23 ONE Minimum 60 months and up to 64 months Time Charter2434(2) 15000 Feb-23 ZIM 12 years Time Charter2435(2) 15000 Mar-23 ZIM 12 years Time Charter2436(2) 15000 Apr-23 ZIM 12 years Time Charter2437(2) 15000 May-23 ZIM 12 years Time Charter2438(2) 15000 Jul-23 ZIM 12 years Time Charter2444(2) 15000 Sep-23 ZIM 12 years Time Charter2445(2) 15000 Nov-23 ZIM 12 years Time Charter2446(2) 15000 Nov-23 ZIM 12 years Time Charter2447(2) 15000 Dec-23 ZIM 12 years Time Charter2448(2) 15000 Jan-24 ZIM 12 years Time Charter1360 15000 Sep-23 MSC 18 years Bareboat Charter1361 15000 Oct-23 MSC 18 years Bareboat Charter1362 15000 Nov-23 MSC 18 years Bareboat Charter1363 15000 Dec-23 MSC 18 years Bareboat Charter1364 15000 Dec-23 MSC 18 years Bareboat Charter1365 15000 Feb-24 MSC 18 years Bareboat CharterJ0262 12200 Nov-21 MSC 18 years Bareboat CharterJ0263 12200 Feb-22 MSC 18 years Bareboat CharterJ0264 12200 Jun-22 MSC 18 years Bareboat CharterJ0265 12200 Oct-22 MSC 18 years Bareboat CharterJ0266 12200 Jan-22 MSC 18 years Bareboat Charter2270 12000 Sep-22 ONE Minimum 60 months and up to 64 months Time Charter2271 12000 Oct-22 ONE Minimum 60 months and up to 64 months Time Charter2822 12000 Jul-22 ONE Minimum 60 months and up to 64 months Time Charter2823 12000 Aug-22 ONE Minimum 60 months and up to 64 months Time Charter2049 12000 Oct-22 ZIM 5 years Time Charter2050 12000 Nov-22 ZIM 5 years Time Charter (1) Excludes all option periods in the charter’s option.
As of June 30, 2021, the gross contracted cashflow for 46 undelivered vessels (45 newbuilds and 1 secondhand vessel) is summarized
below: (in millions of USD) Remainder of 2021 9.4 2022 66.1 2023 310.6 2024 658.6 2025 701.3 2026 700.6 Thereafter 4,953.6

7,400.2
36

In July 2021, we entered into contracts to acquire 10 7,000 TEU vessels and the gross contracted cashflow for these vessels is $1.8 billion. Operating Results – Mobile Power Generation
Average Megawatt Capacity is the average maximum megawatts that can be generated by the power fleet. The primary driver of AverageMegawatt Capacity is the increase or decrease in the number of power generating units in the power fleet. Average Megawatt On-Hire is theamount of capacity that is under contract and available to the customer for use. Power Fleet Utilization represents Average Megawatt On-Hire as apercentage of Average Megawatt Capacity.
The following table summarizes the Power Fleet Utilization, for the last eight consecutive quarters: 2019 2020(1) 2021 Q3 Q4 Q1 Q2 Q3 Q4 Q1 Q2 Power Fleet Average Megawatt On-Hire(2) 1,300 1,075 934 966 1,131 866 866 1,063 Average Megawatt Capacity(3) 1,604 1,536 1,428 1,413 1,414 1,402 1,360 1,360
Power Fleet Utilization(4) 81.0% 70.0% 65.4% 68.4% 80.0% 61.8% 63.7% 78.2%
(1) Atlas acquired APR Energy on February 28, 2020. For periods prior to this, APR Energy was not controlled by Atlas.
(2) Average Megawatt On-Hire is the amount of capacity that is under contract and available to the customer for use post COD.
(3) Average Megawatt Capacity is the average maximum megawatts that can be generated by the power fleet.
(4) Power fleet utilization in comparative periods has been adjusted to reflect average utilization during the quarter.
Power Fleet Utilization increased for the quarter ended June 30, 2021, compared with the same period in 2020. The increase was primarilydue to APR entering into contracts to provide 330MW utilizing 10 aero-derivative gas turbines to provide peaking power in Mexicali, Mexico.APR also entered into contracts for three aero-derivative gas turbines in California in Q2 2021. Financial Results Summary
Revenue
Revenue increased by 8.3% to $393.9 million and by 14.0% to $766.5 million for the three and six months ended June 30, 2021,respectively, compared with the same period in 2020. The increase in revenue was primarily due to revenue contribution from the delivery ofseven vessels between June 2020 and June 2021.
Operating Expense
Operating expense increased by 23.7% to $82.9 million and by 25.5% to $159.1 million for the three and six months ended June 30, 2021,respectively, compared with the same period in 2020. The increase was primarily due to additional expenses related to supplying higher powergeneration capacity and growth in the Seaspan operating fleet.
Depreciation and Amortization Expense
Depreciation and amortization expense increased by 2.6% to $90.8 million and by 10.8% to $178.1 million for the three and six monthsended June 30, 2021, respectively, compared with the same period in 2020. The increase was primarily due to the delivery of seven vesselsbetween June 2020 and June 2021.
General and Administrative Expense
General and administrative expense decreased by 19.2% to $16.0 million and increased by 29.1% to $39.0 million for the three and sixmonths ended June 30, 2021, respectively, compared with the same period in 2020. The increase for the six months ended June 30, 2021 wasprimarily due to the inclusion of APR Energy general and administrative expenses for a full period in 2021 compared to a partial period in 2020.
Loss on debt extinguishment
During the three months ended June 30, 2021, there was a $56.1 million non-cash charge for loss on debt extinguishment related to earlydebt settlement.
Operating Lease Expense
Operating lease expense decreased by 3.7% to $36.8 million and by 5.0% to $72.9 million for the three and six months ended June 30,2021, respectively, compared with the same period in 2020. The decrease was primarily due to a decrease in LIBOR.
37

Interest Expense and Amortization of Deferred Financing Fees
The following table summarizes our borrowings:(in millions of US dollars) June 30, Change
2021 2020 $ % Long-term debt, excluding deferred financing fees:
Revolving credit facilities $ 614.1 $ 852.3 $ (238.2) (27.9)%Term loan credit facilities 1,892.1 2,195.6 (303.5) (13.8)%7.125% senior unsecured notes due 2027 80.0 80.0 - 0.0%Fairfax Notes 300.0 600.0 (300.0) (50.0)%Exchangeable Notes 201.3 - 201.3 100.0%Bonds 500.0 - 500.0 100.0%Senior Secured Notes 450.0 - 450.0 100.0%Debt discount and fair value adjustment (75.1) (141.1) 66.0 46.8%
Other financing arrangements, excluding deferred financing fees 1,160.8 681.7 479.1 70.3%
Total borrowings (1) 5,123.2 4,268.5 854.7 20.0%Vessels under construction (510.8) - (510.8) 100.0%
Operating borrowings (1) $ 4,612.4 $ 4,268.5 $ 343.9 8.1%
(1) Total borrowings is a non-GAAP financial measure which comprises of long-term debt and other financing arrangements, excluding deferred financing fees. TheCompany’s total borrowings include amounts related to vessels under construction, consisting primarily of amounts borrowed to pay installments to shipyards. Theinterest incurred on borrowings related to the vessels under construction are capitalized during the construction period. Total borrowings and operating borrowings arenon-GAAP financial measures that are not defined under or prepared in accordance with U.S. GAAP. Disclosure of total borrowings and operating borrowings isintended to provide additional information and should not be considered a substitute for financial measures prepared in accordance with U.S. GAAP.
Interest expense increased by $3.8 million to $54.6 million and by $1.0 million to $101.4 million to for the three and six months endedJune 30, 2021, respectively, compared with the same period in 2020. The increase is primarily due to the issuance of the Exchangeable Notes andBonds, partially offset by the decrease in LIBOR rates.
Loss on Derivative Instruments
The change in fair value of derivative instruments resulted in a loss of $1.7 million and a gain of $7.0 million for the three and six monthsended June 30, 2021, respectively. The loss for this period was primarily due to a decrease in the LIBOR forward curve and the impact of swapsettlements.
The fair value of our interest rate swaps and our Fairfax derivative put instruments are subject to change based on our company specificcredit risk included in the discount factor and current swap curve, including its relative steepness. In determining the fair value, these factors arebased on current information available to us. These factors are expected to change through the life of the instruments, causing the fair value tofluctuate significantly due to the large notional amounts and long-term nature of our derivative instruments. As these factors may change, the fairvalue of the instruments is an estimate and may deviate significantly from the actual cash settlements realized during the term of the instruments.Our valuation techniques have not changed, and we believe that such techniques are consistent with those followed by other valuationpractitioners.
The fair value of our interest rate swaps is most significantly impacted by changes in the yield curve. Based on the current notional amountand tenor of our interest rate swap portfolio, a one percent parallel shift in the overall yield curve is expected to result in a change in the fair valueof our interest rate swaps of approximately $24.5 million. Actual changes in the yield curve are not expected to occur equally at all points andchanges to the curve may be isolated to periods of time. This steepening or flattening of the yield curve may result in greater or lesser changes tothe fair value of our financial instruments in a particular period than would occur had the entire yield curve changed equally at all points.
The fair value of our interest rate swaps is also impacted by changes in our company-specific credit risk included in the discount factor. Wediscount our derivative instruments with reference to the corporate Bloomberg industry yield curves. Based on the current notional amount andtenor of our swap portfolio, a one percent change in the discount factor is expected to result in a change in the fair value of our interest rate swapsof approximately $0.6 million.
The fair value of the Fairfax derivative put instruments at each reporting period is subject to changes in our company specific credit riskand the risk-free yield curve. With the Amendment of the Fairfax Notes in June 2021, the put option was eliminated.
Our fair value instruments, including interest rate swaps and put instruments were marked to market with all changes in the fair value ofthese instruments recorded in “Change in fair value of financial instruments” in our Interim Consolidated Statement of Operations.
Please read “Item 11. Quantitative and Qualitative Disclosures About Market Risk” in our 2020 Annual Report on Form 20-F foradditional information.
38

Effects of Hyperinflation
APR Energy operates in Argentina, where repatriation of cash generated from operations is subject to the country’s historicallyunpredictable currency regulations, resulting in the creation of a two-tiered currency market. Under current currency controls, the amount of cashin pesos convertible to US dollars using the rate available at the central bank (the “Central Bank rate”) is limited. Thus, the remaining pesos areconverted using the Blue-Chip swap market, at approximately a 43.6% discount to the Central Bank rate as at June 30, 2021.
Losses realized on repatriation is included in “Other Expenses” in our Interim Consolidated Statement of Operations when incurred.
To compensate us for losses being incurred by APR Energy on repatriation of Argentinian Pesos, the Sellers of APR Energy agreed toindemnify Atlas for repatriation losses incurred, until the earlier of (1) reaching the maximum cash flows subject to compensation, (2) terminationof specified contracts, (3) sustaining the ability to repatriate cash without losses and (4) April 30, 2022. The maximum amount of cash flowssubject to compensation is $110,000,000. This indemnity arrangement is included as a contingent consideration asset in “Other Assets” on ourInterim Consolidated Balance Sheet, measured at fair value at the end of each reporting period with gains or losses reflected in the InterimConsolidated Statement of Operations.
The fair value of the contingent consideration asset is subject to fluctuations in the difference between the Central Bank rate and Blue-Chipswap market rate, as well as our estimate of the amount of cash we expect to repatriate. These factors are estimates and are expected to changethrough the life of the indemnity arrangement, causing the fair value to fluctuate significantly. Based on current expectations of cash repatriation,an increase of 5% in the discount on the Central Bank rate will result in an approximately $2.1 million increase in the fair value of the contingentconsideration asset. As these factors may change, the fair value of the contingent consideration asset is an estimate and may deviate significantlyfrom the actual cash settlements realized from the Sellers.
Liquidity and Capital Resources
Liquidity
As of June 30, 2021, we have total liquidity of $1.27 billion, consisting of $591.0 million of cash and cash equivalents and $679.5 millionof undrawn commitments under available revolving credit facilities, term loan and Senior Secured Notes. Our primary short-term liquidity needsare to fund our operating expenses, investments in assets including vessels under construction, debt repayments, lease payments, swapsettlements, payment of quarterly dividends and payments on our other financing arrangements. Our medium-term liquidity needs primarily relateto debt repayments, vessel purchase commitments, lease payments, potential early redemption of our Fairfax Notes and payments on our otherfinancing arrangements. Our long-term liquidity needs primarily relate to potential future acquisitions, lease payments, debt repayments includingrepayment of our notes, the potential future redemption of our preferred shares and payments on our other financing arrangements. Please readnote 10 “Long-term debt”, note 11 “Operating lease liabilities”, note 12 “Other financing arrangements” and note 15 “Share capital” in ourInterim Consolidated Financial Statements for additional information.
We anticipate that our primary sources of funds for our short-term liquidity needs will be cash from operations, and existing and new creditfacilities and other financing arrangements. We anticipate our medium and long-term sources of funds will be from cash from operations, newcredit facilities, lease facilities and capital markets financings to the extent available.
The following table summarizes our liquidity as of June 30, 2021, and 2020:(in millions of US dollars) June 30, 2021 2020 Cash and cash equivalents $ 591.0 $ 221.8 Undrawn Seaspan revolving credit facilities 400.0 150.0 Undrawn Seaspan term loan facilities 179.5 - Undrawn Senior Secured Notes 50.0 - Undrawn APR revolving credit facilities 50.0 11.1 Total liquidity $ 1,270.5 $ 382.9
Our Credit Facilities
We primarily use our credit facilities to finance the construction and acquisition of assets. As at June 30, 2021, our credit facilities aresecured by first-priority mortgages granted on 67 of our vessels and substantially all of our power generation assets, together with other relatedsecurity, such as assignments of lease contracts, earnings for our assets, assignments of insurances and management agreements for vessels.
As of June 30, 2021, we had $2.5 billion outstanding under our revolving credit facilities and term loan credit facilities excluding deferredfinancing fees. In addition, there is $450.0 million available to be drawn under our revolving credit facilities.
Interest payments on our revolving credit facilities are based on LIBOR plus margins, which ranged between 0.5% and 2.3% as of June 30,2021.
Interest payments on our term loan credit facilities are based on LIBOR plus margins, which ranged between 0.4% and 2.3% as of June 30,2021. For a portion of one of our term loans, interest is calculated based on the reference rate of KEXIM plus a margin, which was 0.7% as ofJune 30, 2021. One of our term loan credit facilities bears interest at a fixed rate of 7.7%.
39

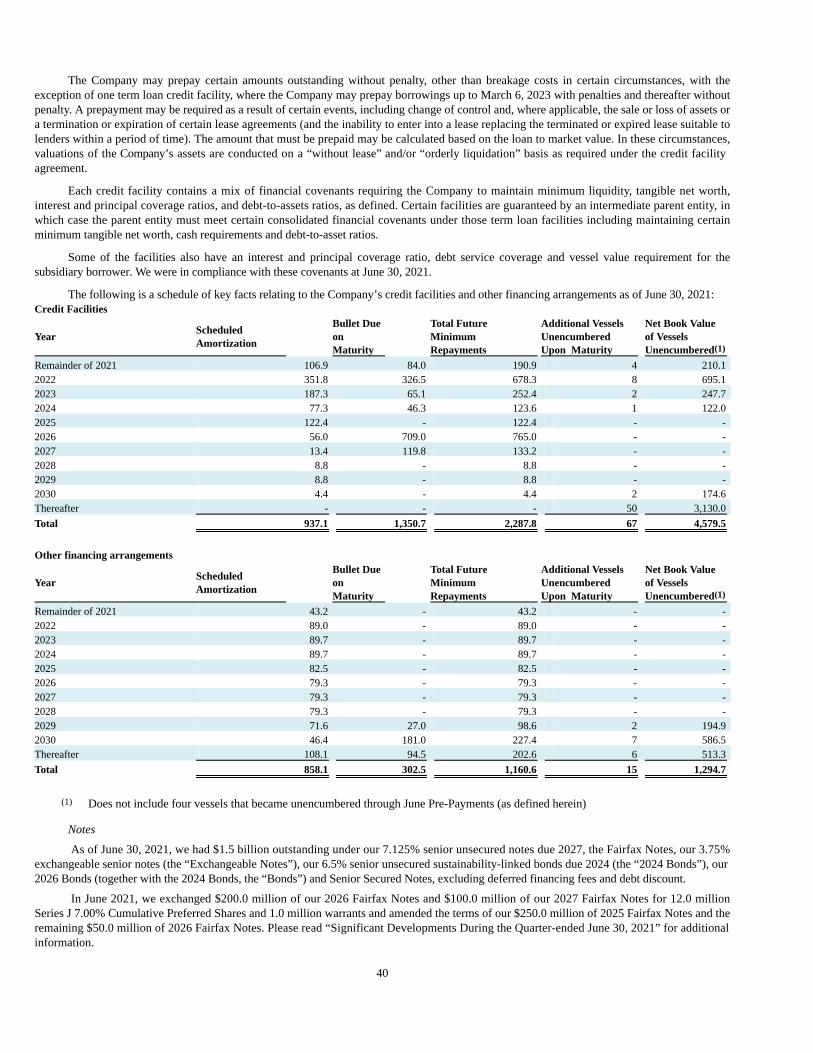
The Company may prepay certain amounts outstanding without penalty, other than breakage costs in certain circumstances, with theexception of one term loan credit facility, where the Company may prepay borrowings up to March 6, 2023 with penalties and thereafter withoutpenalty. A prepayment may be required as a result of certain events, including change of control and, where applicable, the sale or loss of assets ora termination or expiration of certain lease agreements (and the inability to enter into a lease replacing the terminated or expired lease suitable tolenders within a period of time). The amount that must be prepaid may be calculated based on the loan to market value. In these circumstances,valuations of the Company’s assets are conducted on a “without lease” and/or “orderly liquidation” basis as required under the credit facilityagreement.
Each credit facility contains a mix of financial covenants requiring the Company to maintain minimum liquidity, tangible net worth,interest and principal coverage ratios, and debt-to-assets ratios, as defined. Certain facilities are guaranteed by an intermediate parent entity, inwhich case the parent entity must meet certain consolidated financial covenants under those term loan facilities including maintaining certainminimum tangible net worth, cash requirements and debt-to-asset ratios.
Some of the facilities also have an interest and principal coverage ratio, debt service coverage and vessel value requirement for thesubsidiary borrower. We were in compliance with these covenants at June 30, 2021.
The following is a schedule of key facts relating to the Company’s credit facilities and other financing arrangements as of June 30, 2021:Credit Facilities
YearScheduledAmortization
Bullet DueonMaturity
Total FutureMinimumRepayments
Additional VesselsUnencumberedUpon Maturity
Net Book Valueof VesselsUnencumbered(1)
Remainder of 2021 106.9 84.0 190.9 4 210.1 2022 351.8 326.5 678.3 8 695.1 2023 187.3 65.1 252.4 2 247.7 2024 77.3 46.3 123.6 1 122.0 2025 122.4 - 122.4 - - 2026 56.0 709.0 765.0 - - 2027 13.4 119.8 133.2 - - 2028 8.8 - 8.8 - - 2029 8.8 - 8.8 - - 2030 4.4 - 4.4 2 174.6 Thereafter - - - 50 3,130.0
Total 937.1 1,350.7 2,287.8 67 4,579.5
Other financing arrangements
YearScheduledAmortization
Bullet DueonMaturity
Total FutureMinimumRepayments
Additional VesselsUnencumberedUpon Maturity
Net Book Valueof VesselsUnencumbered(1)
Remainder of 2021 43.2 - 43.2 - - 2022 89.0 - 89.0 - - 2023 89.7 - 89.7 - - 2024 89.7 - 89.7 - - 2025 82.5 - 82.5 - - 2026 79.3 - 79.3 - - 2027 79.3 - 79.3 - - 2028 79.3 - 79.3 - - 2029 71.6 27.0 98.6 2 194.9 2030 46.4 181.0 227.4 7 586.5 Thereafter 108.1 94.5 202.6 6 513.3
Total 858.1 302.5 1,160.6 15 1,294.7
(1) Does not include four vessels that became unencumbered through June Pre-Payments (as defined herein)
Notes
As of June 30, 2021, we had $1.5 billion outstanding under our 7.125% senior unsecured notes due 2027, the Fairfax Notes, our 3.75%exchangeable senior notes (the “Exchangeable Notes”), our 6.5% senior unsecured sustainability-linked bonds due 2024 (the “2024 Bonds”), our2026 Bonds (together with the 2024 Bonds, the “Bonds”) and Senior Secured Notes, excluding deferred financing fees and debt discount.
In June 2021, we exchanged $200.0 million of our 2026 Fairfax Notes and $100.0 million of our 2027 Fairfax Notes for 12.0 millionSeries J 7.00% Cumulative Preferred Shares and 1.0 million warrants and amended the terms of our $250.0 million of 2025 Fairfax Notes and theremaining $50.0 million of 2026 Fairfax Notes. Please read “Significant Developments During the Quarter-ended June 30, 2021” for additionalinformation.
40

Our 2025 Fairfax Notes and 2026 Fairfax Notes mature on February 14, 2025 and January 15, 2026, respectively. These notes bear interestat a fixed rate of 5.5% per year, payable quarterly in arrears. At any time, we may elect to redeem all or any portion of the Fairfax Notes at aredemption price of 100.0% of the principal amount being redeemed, plus accrued and unpaid interest, if any, to the redemption date and anycertain additional amounts.
The indentures relating to the Fairfax Notes provide Fairfax with the right to designate (and Fairfax has so designated in the case of theAtlas board of directors) (i) two members of the Atlas board of directors and one member of the Seaspan board of directors if at least $125.0million aggregate principal amount of the Fairfax Notes remains outstanding, or (ii) one member of the Atlas board of directors if at least $50.0million but less than $125.0 million aggregate principal amount of the 2025 Notes and 2026 Notes remains outstanding. Notwithstanding theforegoing, in no event shall the rights under the indentures governing the Fairfax Notes allow Fairfax to designate more than two members to theAtlas board of directors and one member to the Seaspan board of directors if the thresholds described in clause (i) of the preceding sentence isreached, or to designate more than one member to the Atlas board of directors if the thresholds described in clause (ii) of the preceding sentence isreached.
Our 7.125% senior unsecured notes due 2027 are callable at par plus accrued and unpaid interest, if any, any time. In the event of certainchanges in withholding taxes, at our option, we may redeem our 7.125% senior unsecured notes due 2027 and Fairfax Notes, in each case inwhole, but not in part, at a redemption price equal to 100.0% of the outstanding principal amount, plus accrued and unpaid interest, if any. Uponthe occurrence of a Change of Control (as defined in the applicable notes), each holder of such notes will have the right to require us to purchaseall or a portion of such holder’s notes at a purchase price equal to 101.0% of the principal amount thereof plus accrued and unpaid interest, if any.For recent updates on the 7.125% senior unsecured notes due 2027, please read “Subsequent Events —7.125% Notes Exchange Offer”.
Our Exchangeable Notes are exchangeable at the holders’ option into an aggregate 15,474,817 Atlas common shares at an initial exchangeprice of $13.005 per share, the cash equivalent or a combination thereof, as elected by us, at any time on or after September 15, 2025, or earlierupon the occurrence of certain market price triggers, significant corporate events, or in response to early redemption elected by us. The holdersmay require us to redeem the Exchangeable Notes upon the occurrence of certain corporate events qualifying as a fundamental change in thebusiness. We may redeem the Exchangeable Notes in connection with certain tax-related events or on any business day on or after December 20,2023 and prior to September 15, 2025, if the last reported sale price of Atlas shares is at least 130.0% of the exchange price during a specifiedmeasurement period. A redemption of the Exchangeable Notes is made at 100.0% of the principal amount, plus accrued and unpaid interest. Inconnection with the Exchangeable Notes, we entered into capped call transactions using $15.5 million in proceeds from the issuance of theExchangeable Notes to reduce the potential dilution to Atlas shares and/or offset any cash payments that are required upon an exchange, up to amaximum share price.
In February and April 2021, we issued $200.0 million and $300.0 million of Bonds, respectively. The Bonds bear interest at 6.5% perannum and mature in February 2024 and April 2026, respectively. Upon maturity, 100.0% of the principal balance is due or 100.5% if certainsustainability-linked targets are not achieved, except in the event of certain eligible changes in tax law. Upon the occurrence of a Change inControl or a De-Listing event (as defined in the relevant Bond Terms), each holder of Bonds will have the right to require us to purchase all or aportion of such holder’s Bonds at a purchase price equal to 101.0% of the principal amount thereof plus accrued and unpaid interest, if any.
On May 21 and August 12, 2021, we issued an aggregate $500.0 million of Senior Secured Notes, which bear interest between 3.91% and4.26% and mature between 2031 and 2036. The Senior Secured Notes are secured by the same portfolio of vessels as our Program.
Operating Leases
As of June 30, 2021, we had 14 vessel operating lease arrangements. Under 13 of the operating lease arrangements, we may purchase thevessels for a predetermined fair value purchase price. For the remaining lease, we may purchase the vessel at the end of the lease term for thegreater of the fair market value and a predetermined amount. As of June 30, 2021, we had total commitments, excluding purchase options, undervessel operating leases from 2021 to 2029 of approximately $844.7 million.
Under our operating lease arrangements, subject to payment of a specified termination sum, we may voluntarily terminate the arrangementin certain circumstances. We may also be required to terminate and pay a termination sum as specified in the agreements in certain circumstances,such as a termination or expiry of a charter (where we do not enter into a charter suitable to the counterparties within a required period of time).
Other Financing Arrangements
We enter into financing arrangements consisting of financing sale-leaseback and failed sales arrangements with special purpose entities,which are consolidated by us as primary beneficiaries. These leases are provided by bank financial leasing owners who legally own our vesselsthrough special purpose entities and are also granted other related security, such as assignments of time charters, earnings for the vessels,insurances for the vessels and management agreements for the vessels. We use these arrangements to finance the construction and acquisition ofvessels, as well as certain of our operating vessels.
As of June 30, 2021, we have 20 vessels under these financing arrangements, which provided for borrowings of approximately $1.16billion excluding deferred financing fees. Under these agreements, we may voluntarily terminate a lease agreement, subject to payment of atermination fee in certain circumstances. We are also required to prepay rental amounts, broken funding costs and other costs to the lessor incertain circumstances, such as a termination or expiry of a charter (where we do not enter into a charter acceptable to the lessors within a requiredperiod of time). If we default under these financing arrangements, our lessors could declare all outstanding amounts to be immediately due andpayable and realize on the security granted under these arrangements.
41

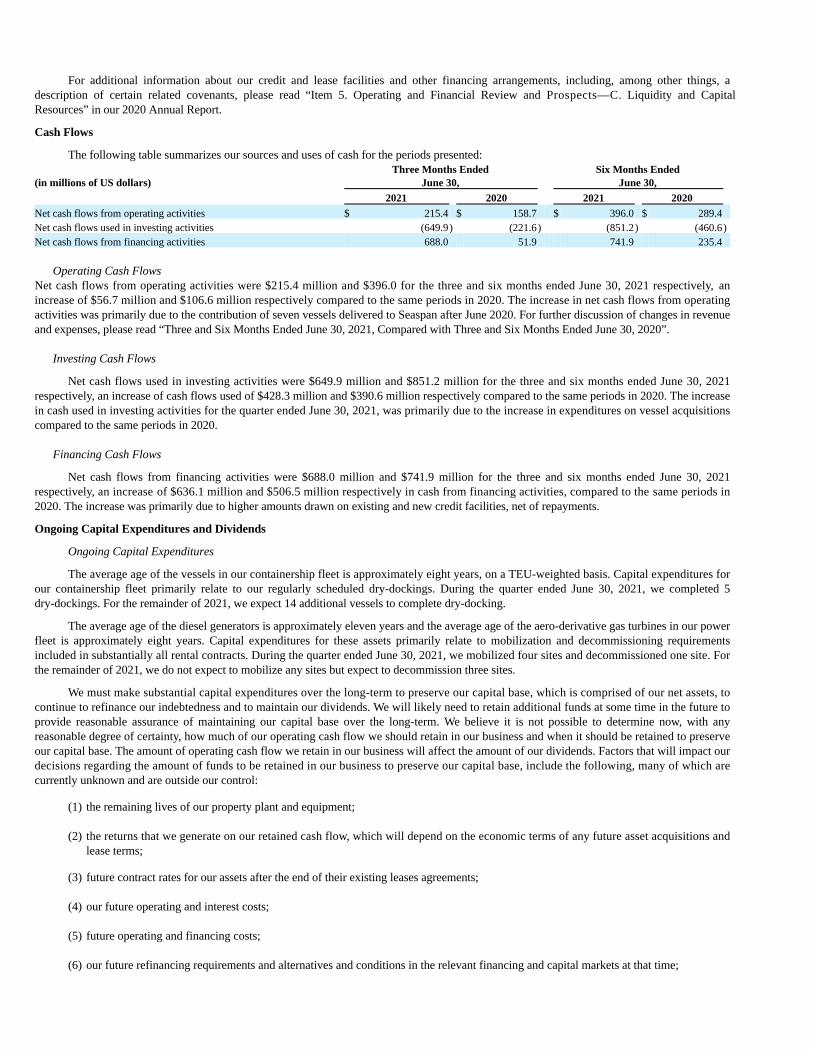
For additional information about our credit and lease facilities and other financing arrangements, including, among other things, adescription of certain related covenants, please read “Item 5. Operating and Financial Review and Prospects—C. Liquidity and CapitalResources” in our 2020 Annual Report.
Cash Flows
The following table summarizes our sources and uses of cash for the periods presented:
(in millions of US dollars)Three Months Ended
June 30, Six Months Ended
June 30, 2021 2020 2021 2020
Net cash flows from operating activities $ 215.4 $ 158.7 $ 396.0 $ 289.4 Net cash flows used in investing activities (649.9) (221.6) (851.2) (460.6)Net cash flows from financing activities 688.0 51.9 741.9 235.4
Operating Cash Flows
Net cash flows from operating activities were $215.4 million and $396.0 for the three and six months ended June 30, 2021 respectively, anincrease of $56.7 million and $106.6 million respectively compared to the same periods in 2020. The increase in net cash flows from operatingactivities was primarily due to the contribution of seven vessels delivered to Seaspan after June 2020. For further discussion of changes in revenueand expenses, please read “Three and Six Months Ended June 30, 2021, Compared with Three and Six Months Ended June 30, 2020”.
Investing Cash Flows
Net cash flows used in investing activities were $649.9 million and $851.2 million for the three and six months ended June 30, 2021respectively, an increase of cash flows used of $428.3 million and $390.6 million respectively compared to the same periods in 2020. The increasein cash used in investing activities for the quarter ended June 30, 2021, was primarily due to the increase in expenditures on vessel acquisitionscompared to the same periods in 2020.
Financing Cash Flows
Net cash flows from financing activities were $688.0 million and $741.9 million for the three and six months ended June 30, 2021respectively, an increase of $636.1 million and $506.5 million respectively in cash from financing activities, compared to the same periods in2020. The increase was primarily due to higher amounts drawn on existing and new credit facilities, net of repayments.
Ongoing Capital Expenditures and Dividends
Ongoing Capital Expenditures
The average age of the vessels in our containership fleet is approximately eight years, on a TEU-weighted basis. Capital expenditures forour containership fleet primarily relate to our regularly scheduled dry-dockings. During the quarter ended June 30, 2021, we completed 5dry-dockings. For the remainder of 2021, we expect 14 additional vessels to complete dry-docking.
The average age of the diesel generators is approximately eleven years and the average age of the aero-derivative gas turbines in our powerfleet is approximately eight years. Capital expenditures for these assets primarily relate to mobilization and decommissioning requirementsincluded in substantially all rental contracts. During the quarter ended June 30, 2021, we mobilized four sites and decommissioned one site. Forthe remainder of 2021, we do not expect to mobilize any sites but expect to decommission three sites.
We must make substantial capital expenditures over the long-term to preserve our capital base, which is comprised of our net assets, tocontinue to refinance our indebtedness and to maintain our dividends. We will likely need to retain additional funds at some time in the future toprovide reasonable assurance of maintaining our capital base over the long-term. We believe it is not possible to determine now, with anyreasonable degree of certainty, how much of our operating cash flow we should retain in our business and when it should be retained to preserveour capital base. The amount of operating cash flow we retain in our business will affect the amount of our dividends. Factors that will impact ourdecisions regarding the amount of funds to be retained in our business to preserve our capital base, include the following, many of which arecurrently unknown and are outside our control:
(1) the remaining lives of our property plant and equipment;
(2) the returns that we generate on our retained cash flow, which will depend on the economic terms of any future asset acquisitions andlease terms;
(3) future contract rates for our assets after the end of their existing leases agreements;
(4) our future operating and interest costs;
(5) future operating and financing costs;
(6) our future refinancing requirements and alternatives and conditions in the relevant financing and capital markets at that time;

42

(7) capital expenditures to comply with environmental regulations and asset retirement obligations; and
(8) unanticipated future events and other contingencies.
Please read “Item 3. Key Information – D. Risk Factors” in our 2020 Annual Report for factors that may affect our future capitalexpenditures and results.
Dividends
The following table reflects dividends paid and accrued by us for the periods indicated:
(in millions of US dollars, except per share amounts) Three Months Ended
June 30, Six Months Ended
June 30, 2021 2020 2021 2020 Dividends on Common shares
Declared, per share $ 0.125 $ 0.125 $ 0.250 $ 0.375 Paid in cash 31.2 30.8 62.3 57.7 Accrued — 30.9 — 30.9
$ 31.2 61.7 $ 62.3 88.6
Dividends on preferred shares (paid in cash) Series D $ 2.5 $ 2.5 $ 5.1 $ 5.1
Series E $ 2.8 $ 2.8 $ 5.6 $ 5.6
Series G $ 4.0 $ 4.0 $ 8.0 $ 8.0
Series H $ 4.5 $ 4.4 $ 8.9 $ 8.9
Series I $ 3.0 $ 3.0 $ 6.0 $ 6.0
On July 7, 2021, the board of directors declared the cash dividends on our common and preferred shares as indicated above under“Subsequent Events —Dividends”.
Critical Accounting Policies and Estimates
We prepare our consolidated financial statements in accordance with U.S. GAAP, which requires us to make estimates in the application ofour accounting policies based on our best assumptions, judgments and opinions. Our estimates affect the reported amounts of assets, liabilities,revenue and expenses, and related disclosures. We base our estimates on historical experience and anticipated results and trends and on variousother assumptions that we believe are reasonable under the circumstances. However, because future events and their effects cannot be determinedwith certainty, actual results could differ from our assumptions and estimates, and such differences could be material. For more information aboutour critical accounting estimates, please read “Item 5. Operating and Financial Review and Prospects—D. Critical Accounting Estimates” in our2020 Annual Report.
Recent accounting pronouncements
Discontinuation of LIBOR
In March 2020, FASB issued ASU 2020-04, “Reference Rate Reform (Topic 848)”, which provides optional relief for the discontinuationof LIBOR resulting from rate reform. Contract terms that are modified due to the replacement of a reference rate are not required to be remeasuredor reassessed under FASB’s relevant U.S. GAAP Topic. The election is available by Topic. This guidance is effective for all entities as of March12, 2020, through December 31, 2022 and may be applied from the beginning of an interim period that includes the issuance date of the ASU. TheCompany is currently evaluating the impact of this guidance.
Debt with conversion and other options
In August 2020, FASB issued ASU 2020-06, “Debt – Debt with Conversion and Other Options (Subtopic 470-20)”, which simplifies theaccounting for convertible debt instruments by reducing the number of accounting models and circumstances when embedded conversion featuresare separately recognized. This update also revises the method in which diluted earnings per share is calculated related to certain instruments withconversion features, among other clarifications. The guidance is effective for annual reporting periods beginning after December 15, 2021,including interim periods within those fiscal years. The Company is currently evaluating the impact of this guidance.
Off-Balance Sheet Arrangements
At June 30, 2021, we do not have any off-balance sheet arrangements.
43

FORWARD-LOOKING STATEMENTS
This Report on Form 6-K for the quarter ended June 30, 2021, contains forward-looking statements (as such term is defined in Section 21Eof the Securities Exchange Act of 1934, as amended, or the Exchange Act) concerning our operations, cash flows, and financial position,including, in particular, the likelihood of our success in developing and expanding our business, include forward-looking statements (as such termis defined in Section 21E of the Securities Exchange Act of 1934, as amended, or the Exchange Act). Statements that are predictive in nature, thatdepend upon or refer to future events or conditions, or that include words such as “continue,” “expects,” “anticipates,” “intends,” “plans,”“believes,” “estimates,” “projects,” “forecasts,” “will,” “may,” “potential,” “should” and similar expressions are forward-looking statements.Although these statements are based upon assumptions we believe to be reasonable based upon available information, including projections ofrevenues, operating margins, earnings, cash flow, working capital and capital expenditures, they are subject to risks and uncertainties that aredescribed more fully in this Report in the section titled “Risk Factors.”
These forward-looking statements represent our estimates and assumptions only as of the date of this Report and are not intended to giveany assurance as to future results. As a result, you are cautioned not to rely on any forward-looking statements. Forward-looking statementsappear in a number of places in this Report. These statements include, among others:
• future operating or financial results;
• future growth prospects;
• our business strategy and capital allocation plans, and other plans and objectives for future operations;
• our primary sources of funds for our short, medium and long-term liquidity needs;
• our expectations as to impairments of our vessels and power generation assets, including the timing and amount of potentialimpairments;
• the future valuation of our vessels, power generation assets and goodwill;
• potential acquisitions, financing arrangements and other investments, and our expected benefits from such transactions;
• future time charters and vessel deliveries, including replacement charters and future long-term charters for certain existingvessels;
• estimated future capital expenditures needed to preserve the operating capacity of our containership fleet and power generationassets and to comply with regulatory standards, our expectations regarding future operating expenses, including dry-docking andother ship operating expenses and expenses related to performance under our contracts for the supply of power generationcapacity, and general and administrative expenses;
• availability of crew for our containerships, number of off-hire days and dry-docking requirements;
• global economic and market conditions and shipping and energy market trends, including charter rates and factors affectingsupply and demand for our containership and power generation solutions;
• disruptions in global credit and financial markets as the result of the COVID-19 pandemic or otherwise;
• conditions in the public equity market and the price of our shares;
• our financial condition and liquidity, including our ability to realize the benefits of recent financing activities, borrow and repayfunds under our credit facilities, our ability to obtain waivers or secure acceptable replacement charters under certain of ourcredit facilities, our ability to refinance our existing facilities and notes and to obtain additional financing in the future to fundcapital expenditures, acquisitions and other general corporate activities;
• our continued ability to maintain, enter into or renew primarily long-term, fixed-rate time charters and leases of our powergeneration assets with our existing customers or new customers;
• the potential for early termination of long-term contracts and our potential inability to enter into, renew or replace long-termcontracts;
• changes in governmental rules and regulations or actions taken by regulatory authorities, and the effect of governmentalregulations on our business;
• our continued ability to meet specified restrictive covenants in our financing and lease arrangements, our notes and our preferredshares;
• the length and severity of the ongoing novel coronavirus (COVID-19) pandemic, including as a result of the new variants of the

virus, and its impact on our business;
44
• the financial condition of our customers, lenders and other counterparties and their ability to perform their obligations under theiragreements with us;
• our ability to leverage to our advantage our relationships and reputation in the containership industry;
• changes in technology, prices, industry standards, environmental regulation and other factors which could affect our competitiveposition, revenues and asset values;
• disruptions and security threats to our technology systems;
• taxation of our company, including our exemption from tax on our U.S. source international transportation income, and taxationof distributions to our shareholders;
• the continued availability of services, equipment and software from subcontractors or third-party suppliers required to provideour power generation solutions;
• our ability to protect our intellectual property and defend against possible third-party infringement claims relating to our powergeneration solutions;
• our ability to achieve or realize expected benefits from ESG initiatives;
• potential liability from future litigation;
• other factors detailed in this Report and from time to time in our periodic reports; and
• other risks that are not currently material or known to us.
Forward-looking statements in this Report are estimates and assumptions reflecting the judgment of senior management and involveknown and unknown risks and uncertainties. These forward-looking statements are based upon a number of assumptions and estimates that areinherently subject to significant uncertainties and contingencies, many of which are beyond our control. Actual results may differ materially fromthose expressed or implied by such forward-looking statements. Accordingly, all forward-looking statements should be considered in light ofvarious important factors, including, but not limited to, those set forth in “Item 3. Key Information—D. Risk Factors” in our Annual Report forthe year ended December 31, 2020.
We do not intend to revise any forward-looking statements in order to reflect any change in our expectations or events or circumstancesthat may subsequently arise. We expressly disclaim any obligation to update or revise any of these forward-looking statements, whether becauseof future events, new information, a change in our views or expectations, or otherwise. You should carefully review and consider the variousdisclosures included in this Report and in our other filings made with the Securities and Exchange Commission, or the SEC, that attempt to adviseinterested parties of the risks and factors that may affect our business, prospects and results of operations.
45
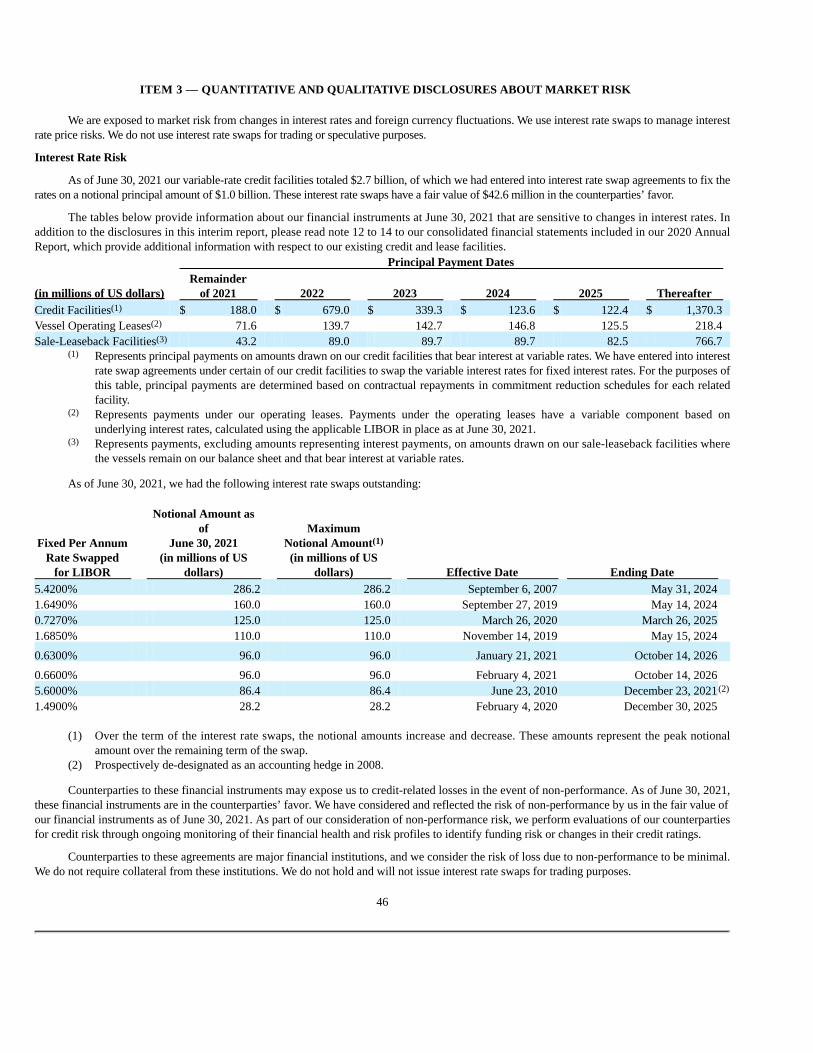
ITEM 3 — QUANTITATIVE AND QUALITATIVE DISCLOSURES ABOUT MARKET RISK
We are exposed to market risk from changes in interest rates and foreign currency fluctuations. We use interest rate swaps to manage interestrate price risks. We do not use interest rate swaps for trading or speculative purposes.
Interest Rate Risk
As of June 30, 2021 our variable-rate credit facilities totaled $2.7 billion, of which we had entered into interest rate swap agreements to fix therates on a notional principal amount of $1.0 billion. These interest rate swaps have a fair value of $42.6 million in the counterparties’ favor.
The tables below provide information about our financial instruments at June 30, 2021 that are sensitive to changes in interest rates. Inaddition to the disclosures in this interim report, please read note 12 to 14 to our consolidated financial statements included in our 2020 AnnualReport, which provide additional information with respect to our existing credit and lease facilities. Principal Payment Dates
(in millions of US dollars) Remainder
of 2021 2022 2023 2024 2025 Thereafter Credit Facilities(1) $ 188.0 $ 679.0 $ 339.3 $ 123.6 $ 122.4 $ 1,370.3 Vessel Operating Leases(2) 71.6 139.7 142.7 146.8 125.5 218.4 Sale-Leaseback Facilities(3) 43.2 89.0 89.7 89.7 82.5 766.7 (1) Represents principal payments on amounts drawn on our credit facilities that bear interest at variable rates. We have entered into interest
rate swap agreements under certain of our credit facilities to swap the variable interest rates for fixed interest rates. For the purposes ofthis table, principal payments are determined based on contractual repayments in commitment reduction schedules for each relatedfacility.
(2) Represents payments under our operating leases. Payments under the operating leases have a variable component based onunderlying interest rates, calculated using the applicable LIBOR in place as at June 30, 2021.
(3) Represents payments, excluding amounts representing interest payments, on amounts drawn on our sale-leaseback facilities wherethe vessels remain on our balance sheet and that bear interest at variable rates.
As of June 30, 2021, we had the following interest rate swaps outstanding:
Fixed Per AnnumRate Swapped
for LIBOR
Notional Amount asof
June 30, 2021(in millions of US
dollars)
MaximumNotional Amount(1)
(in millions of USdollars) Effective Date Ending Date
5.4200% 286.2 286.2 September 6, 2007 May 31, 2024 1.6490% 160.0 160.0 September 27, 2019 May 14, 2024 0.7270% 125.0 125.0 March 26, 2020 March 26, 2025 1.6850% 110.0 110.0 November 14, 2019 May 15, 2024
0.6300% 96.0 96.0 January 21, 2021 October 14, 2026 0.6600% 96.0 96.0 February 4, 2021 October 14, 2026 5.6000% 86.4 86.4 June 23, 2010 December 23, 2021 (2)
1.4900% 28.2 28.2 February 4, 2020 December 30, 2025
(1) Over the term of the interest rate swaps, the notional amounts increase and decrease. These amounts represent the peak notionalamount over the remaining term of the swap.
(2) Prospectively de-designated as an accounting hedge in 2008.
Counterparties to these financial instruments may expose us to credit-related losses in the event of non-performance. As of June 30, 2021,these financial instruments are in the counterparties’ favor. We have considered and reflected the risk of non-performance by us in the fair value ofour financial instruments as of June 30, 2021. As part of our consideration of non-performance risk, we perform evaluations of our counterpartiesfor credit risk through ongoing monitoring of their financial health and risk profiles to identify funding risk or changes in their credit ratings.
Counterparties to these agreements are major financial institutions, and we consider the risk of loss due to non-performance to be minimal.We do not require collateral from these institutions. We do not hold and will not issue interest rate swaps for trading purposes.
46

PART II — OTHER INFORMATION
Item 1 — Legal Proceedings
None.
Item 1A — Risk Factors
None.
Item 2 — Unregistered Sales of Equity Securities and Use of Proceeds
In April 2021, we issued to Fairfax and certain of its affiliates in a private placement warrants to purchase 5.0 million common shares ofthe Company at $13.00 per share. The common shares issuable upon exercise of the warrants are subject to a registration rights agreement enteredinto between the Company and Fairfax concurrently with the execution of the third amendment to the APR acquisition agreement and the warrantagreement.
In June 2021, we issued to Fairfax and certain of its affiliates in a private placement 12.0 million Series J preferred shares of the Company,representing total liquidation value of $300.0 million, and warrants to purchase 1.0 million common shares of the Company at $13.71 per share.The common shares issuable upon exercise of the warrants are subject to a registration rights agreement entered into between the Company andFairfax concurrently with execution of the Fairfax Exchange and the warrant agreement.
Pursuant to the respective registration rights agreements, the 6.0 million common shares issuable upon exercise of the warrants issued toFairfax in April and June 2021 were registered under the Securities Act of 1933, as amended, in July 2021.
Item 3 — Defaults Upon Senior Securities
None.
Item 4 — Mine Safety Disclosures
None.
Item 5 — Other Information
None.
Item 6 — Exhibits
None.
47