Embed Size (px)
Citation preview

Press release from Atlas Copco AB
Atlas Copco Group Center
Atlas Copco AB Visitors address: Telephone: +46 8 743 8000 A Public Company (publ)
SE-105 23 Stockholm Sickla Industriväg 19 www.atlascopcogroup.com Reg. No: 556014-2720
Sweden Nacka Reg. Office Nacka
July 16, 2021 Atlas Copco Second-quarter report 2021
Record order intake and revenues
The comparison figures presented in this report refer to previous year unless otherwise stated.
Order intake increased 45% to record MSEK 32 529 (22 401), organic growth of 54%
Revenues increased 14% to record MSEK 27 534 (24 102), organic growth of 21%
Operating profit increased 52% to MSEK 5 924 (3 889), corresponding to a margin of 21.5% (16.1) ─ Adjusted operating profit, excluding items affecting comparability, was MSEK 6 026 (4 476),
corresponding to a margin of 21.9% (18.6)
Profit before tax amounted to MSEK 5 872 (3 826)
Basic earnings per share were SEK 3.75 (2.58)
Operating cash flow at MSEK 3 743 (3 483)
Return on capital employed was 26% (26)
MSEK 2021 2020 2021 2020
Orders received 32 529 22 401 45% 62 997 50 440 25%
Revenues 27 534 24 102 14% 53 555 49 200 9%
EBITA* 6 285 4 201 50% 12 027 9 631 25%
– as a percentage of revenues 22.8 17.4 22.5 19.6
Operating profi t 5 924 3 889 52% 11 311 9 013 25%
– as a percentage of revenues 21.5 16.1 21.1 18.3
Profi t before tax 5 872 3 826 53% 11 215 8 836 27%
– as a percentage of revenues 21.3 15.9 20.9 18.0
Profi t for the period 4 571 3 129 46% 8 688 6 969 25%
Bas ic earnings per share, SEK 3.75 2.58 7.14 5.73
Di luted earnings per share, SEK 3.75 2.57 7.12 5.73
Return on capita l employed, % 26 26
Apri l - June January - June
* Operating profit excluding amortization of intangibles related to acquisitions.
Near-term demand outlook Atlas Copco expects that the customers’ business activity level will remain at the high current level.
Previous near-term demand outlook (published April 27, 2021): Although the world’s economic development remains uncertain, Atlas Copco expects that the customers’ business activity level will remain at the high current level. Quarterly and annual financial data in Excel format can be found at: https://www.atlascopcogroup.com/en/investor-relations/financial-reports-presentations/latest-results

Atlas Copco – Q2 2021 2 (19)
Summary of half-year resultsOrders received in the first six months of 2021 increased by 25% to MSEK 62 997 (50 440), corresponding to an organic growth of 34%. Acquisitions contributed with 3% and currency had a negative effect of 12%. Revenues reached MSEK 53 555 (49 200), corresponding to a 17% organic increase.
Operating profit increased by 25% to MSEK 11 311 (9 013). The operating margin was 21.1% (18.3). Adjusted for items affecting comparability, the margin was 21.8%
(19.5). There was a negative impact of changes in exchange rates for the first half-year of MSEK 1 780.
Profit before tax was MSEK 11 215 (8 836), corresponding to a margin of 20.9% (18.0). Profit for the period totaled MSEK 8 688 (6 969). Basic and diluted earnings per share were SEK 7.14 (5.73) and 7.12 (5.73) respectively.
Operating cash flow before acquisitions, divestments and dividends totaled MSEK 8 064 (7 308).
Review of the second quarter Market development The customers’ activity level remained high and the demand for Atlas Copco’s products and services improved considerably compared to the previous year, which was heavily impacted by the COVID-19 pandemic. The order intake increased significantly year on year but also grew compared to the previous quarter to a new record level.
Compared to the previous year, strong order growth was achieved for all business areas in all regions, for all types of equipment and service.
Sequentially, the order growth was primarily driven by increased order volumes for industrial compressors, industrial and scientific vacuum equipment, and the service businesses, while vacuum equipment to the semiconductor industry remained basically unchanged at a high level. Geographic distribution of orders received
Apri l - June 2021 Orders Received, % Change*, %
North America 25 +84
South America 3 +84
Europe 28 +46
Africa/Middle East 4 +36
As ia/Oceania 40 +50
Atlas Copco Group 100 +57
Atlas Copco Group
*Change in orders received compared to the previous year in
loca l currency.
Sales bridge
Orders
MSEK received Revenues
2020 22 401 24 102
Structura l change, % +3 +3
Currency, % -12 -10
Organic*, % +54 +21
Tota l , % +45 +14
2021 32 529 27 534
*Volume, price and mix.
Apri l - June
Orders, revenues and operating profit margin
0%
5%
10%
15%
20%
25%
30%
35%
0
5 000
10 000
15 000
20 000
25 000
30 000
35 000
Q12018
Q22018
Q32018
Q42018
Q12019
Q22019
Q32019
Q42019
Q12020
Q22020
Q32020
Q42020
Q12021
Q22021
Orders received, MSEK Revenues, MSEK
Operating margin, % Adjusted operating margin, %
Geographic distribution of orders received and revenues Apri l - June 2021
Orders
received
Revenues Orders
received
Revenues Orders
received
Revenues Orders
received
Revenues Orders
received
Revenues
North America 21 20 25 21 32 31 32 27 25 23
South America 5 5 0 0 3 2 7 8 3 4
Europe 34 35 12 13 35 36 34 35 28 29
Africa/Middle East 6 7 1 1 1 2 7 8 4 4
As ia/Oceania 34 33 62 65 29 29 20 22 40 40
100 100 100 100 100 100 100 100 100 100
Compressor Technique, % Atlas Copco, %Vacuum Technique, % Industria l Technique, % Power Technique, %

Atlas Copco – Q2 2021 3 (19)
Revenues, profits and returns Revenues increased 14% to MSEK 27 534 (24 102), corresponding to an organic growth of 21%. Currency had a negative effect of 10%, and acquisitions added 3%.
The operating profit increased 52% to MSEK 5 924 (3 889) and includes a change in provision for share-related long-term incentive programs, reported in Common Group Items of MSEK -102 (-237). Previous year’s items affecting comparability also included restructuring costs of MSEK -140 in the business areas Vacuum Technique and Power Technique, and MSEK -210 related to a provision for settlement of a pension dispute in Edwards Ltd (Vacuum Technique) dating back to before the acquisition of Edwards Ltd in 2014.
Adjusted operating profit increased 35% to MSEK 6 026 (4 476), corresponding to a margin of 21.9% (18.6). Higher revenue volume was the main explanation for the higher margin, while currency had a negative impact.
The net currency effect compared to the previous year was negative MSEK 715, mainly due to the weaker USD.
Net financial items were MSEK -52 (-63) whereof interest net at MSEK -64 (-71). Other financial items, mainly financial exchange differences, were MSEK +12 (+8). Profit before tax amounted to MSEK 5 872 (3 826), corresponding to a margin of 21.3% (15.9). Corporate income tax amounted to MSEK -1 301 (-697), corresponding to an effective tax rate of 22.2% (18.2). Previous year included one-time adjustments, mainly related to provisions for withholding taxes on dividends from subsidiaries that reduced the effective tax rate by approximately 5 percentage points.
Profit for the period was MSEK 4 571 (3 129). Basic and diluted earnings per share were SEK 3.75 (2.58) and SEK 3.75 (2.57), respectively.
The return on capital employed during the last 12 months was 26% (26). Return on equity was 29% (30). The Group uses a weighted average cost of capital (WACC) of 8.0% as an investment and overall performance benchmark.
Operating cash flow and investments Operating cash surplus increased to MSEK 7 268 (5 780). Working capital increased by MSEK 345 (increase of 387). Net investments in rental equipment were MSEK -124 (-118) and net investments in property, plant and equipment were MSEK -396 (-303).
Operating cash flow (important internal KPI, but not an IFRS measurement, and hence defined on page 13) reached MSEK 3 743 (3 483). Net indebtedness The Group’s net indebtedness amounted to MSEK 13 076 (23 772), of which MSEK 2 564 (3 480) was attributable to post-employment benefits. The Group’s interest-bearing liabilities have an average maturity of 4.6 years. The net debt/EBITDA ratio was 0.5 (0.9) and the net debt/equity ratio was 23% (44). Acquisition and divestment of own shares During the quarter, 878 652 series A shares, net, were sold for a net value of MSEK 453. These transactions are in accordance with mandates granted by the Annual General Meeting and relate to the Group’s long-term incentive programs. See page 17. Employees On June 30, 2021, the number of employees was 41 105 (39 909). The number of consultants/external workforce was 3 595 (2 761). For comparable units, the total workforce increased by 1 417 from June 30, 2020.
Revenues and operating profit – bridge
Volume, price, Items affecting Share-based
MSEK Q2 2021 mix and other Currency Acquisitions comparability LTI* programs Q2 2020
Atlas Copco Group
Revenues 27 534 4 992 -2 280 720 - - 24 102
Operating profit 5 924 2 210 -715 55 350 135 3 889
21.5% 16.1%
*LTI= Long term incentive

Atlas Copco – Q2 2021 4 (19)
Compressor Technique
MSEK 2021 2020 2021 2020
Orders received 14 272 11 134 28% 27 304 23 934 14%
Revenues 12 212 11 405 7% 23 734 22 993 3%
EBITA* 2 994 2 526 19% 5 798 5 119 13%
– as a percentage of revenues 24.5 22.1 24.4 22.3
Operating profi t 2 916 2 444 19% 5 646 4 964 14%
– as a percentage of revenues 23.9 21.4 23.8 21.6
Return on capita l employed, % 91 76
* Operating profi t excluding amortization of intangibles related to acquis i tions .
Apri l -June January - June
Record order intake
Strong order growth for all types of equipment and service
Operating profit margin at 23.9%
Sales bridge
Orders
MSEK received Revenues
2020 11 134 11 405
Structura l change, % +1 +1
Currency, % -10 -8
Organic*, % +37 +14
Tota l , % +28 +7
2021 14 272 12 212
*Volume, price and mix.
Apri l -June
Industrial compressors The demand for industrial compressors was strong, and the order intake for all compressor sizes increased significantly compared to the previous year. The strong order growth was supported by the generally improved business climate and increased market penetration. Sequentially, the order volumes also increased markedly for both smaller and larger compressors.
All compressor sizes generated strong order growth in all regions compared to the previous year. Gas and process compressors Order volumes for gas and process compressors increased significantly compared to the previous year, primarily in North America and Asia, but remained flat sequentially. Compressor service The order intake for service increased considerably compared to the previous year and also grew compared to the previous quarter.
Geographically, and compared to the previous year, solid order growth was achieved in all regions.
Innovation A new oil-free screw blower, the ZS 5 VSD, was introduced. The new product is targeting applications such as wastewater treatment, food and beverage, pneumatic conveying, and pharma. Thanks to the new screw technology, the blower offers 20% more energy efficiency than previous generations. It is a compact plug-and-play solution enabling easy replacement of older equipment for customers.
Acquisitions The business area made four acquisitions in the quarter:
The operating assets of MidState Air Compressor, a US- based compressor distributor with 15 employees.
The operating assets of Medigas Service & Testing Co. Inc., a US-based supplier of medical gas systems with 6 employees and revenues of MSEK 23.
The operating assets of Compressed Air Systems, Inc. (CAS), a US-based compressor distributor, with 30 employees.
Airflow Compressors & Pneumatics Ltd (Airflow), a UK-based compressor distributor with 16 employees. Revenues and profitability Revenues reached MSEK 12 212 (11 405), corresponding to an organic increase of 14%.
The operating profit increased 19% to MSEK 2 916 (2 444), corresponding to a margin of 23.9% (21.4). The higher margin was primarily due to higher revenue volume. Return on capital employed (last 12 months) increased to 91% (76). Orders, revenues and operating profit margin
0%
5%
10%
15%
20%
25%
30%
0
2 500
5 000
7 500
10 000
12 500
15 000
Q12018
Q22018
Q32018
Q42018
Q12019
Q22019
Q32019
Q42019
Q12020
Q22020
Q32020
Q42020
Q12021
Q22021
Orders received, MSEK Revenues, MSEK Operating margin, %

Atlas Copco – Q2 2021 5 (19)
Vacuum Technique
MSEK 2021 2020 2021 2020
Orders received 9 137 5 723 60% 17 936 12 839 40%
Revenues 7 220 6 535 10% 14 028 12 694 11%
EBITA* 1 912 1 413 35% 3 729 3 043 23%
– as a percentage of revenues 26.5 21.6 26.6 24.0
Operating profi t 1 789 1 278 40% 3 484 2 775 26%
– as a percentage of revenues 24.8 19.6 24.8 21.9
Return on capita l employed, % 23 20
* Operating profi t excluding amortization of intangibles related to acquis i tions .
January - JuneApri l -June
• Record order intake, revenues and operating profit • Strong order growth for semiconductor and industrial vacuum equipment • Continued growth for service Sales bridge
Orders
MSEK received Revenues
2020 5 723 6 535
Structura l change, % +1 +0
Currency, % -17 -11
Organic*, % +76 +21
Tota l , % +60 +10
2021 9 137 7 220
*Volume, price and mix.
Apri l -June
Semiconductor and flat panel display equipment The order intake to the semiconductor and flat panel industry increased significantly compared to the previous year, primarily due to several key accounts that invested in new production capacity. Sequentially, the order volumes remained at about the same high level as in the first quarter.
Geographically, and compared to the previous year, all regions recorded strong order growth. Industrial and scientific vacuum equipment Order volumes for industrial and scientific vacuum equipment increased considerably, both compared to the previous year and sequentially, supported by increased demand from most customer segments.
Year on year, the order intake increased in all geographical regions.
Vacuum service Service orders increased year on year and sequentially, both to industrial vacuum customers and to the semiconductor industry.
Compared to the previous year, the order intake increased in all major regions.
Innovation The business area introduced a new range of advanced vacuum gauges, the Leybold THERMOVAC, to strengthen its position in vacuum sensing technology. With reliable and robust measurement results, customers will benefit from optimized processes and the increased process throughputs, whatever the application.
Acquisitions The business area made two acquisitions in the quarter:
IBVC Vacuum, S.L.U, a Spanish vacuum distributor and service provider with 10 employees.
ARPUMA regel- und fördertechnische Geräte GmbH, a vacuum systems and solutions provider based in Germany with 14 employees and revenues of MSEK 41. Revenues and profitability Revenues increased 10% to record MSEK 7 220 (6 535), corresponding to an organic increase of 21%.
The operating profit also reached a record of MSEK 1 789 (1 278). Previous year included restructuring costs of MSEK -90 and MSEK -210 related to a provision for settlement of a pension dispute in Edwards Ltd. The operating margin was 24.8% (19.6, adjusted 24.1). Increased revenue volume was the main explanation for the higher operating margin, while currency had a negative impact. Return on capital employed (last 12 months) was 23% (20). Orders, revenues and operating profit margin
0%
5%
10%
15%
20%
25%
30%
35%
40%
45%
50%
0
1 000
2 000
3 000
4 000
5 000
6 000
7 000
8 000
9 000
10 000
Q12018
Q22018
Q32018
Q42018
Q12019
Q22019
Q32019
Q42019
Q12020
Q22020
Q32020
Q42020
Q12021
Q22021
Orders received, MSEK Revenues, MSEK
Operating margin, % Adjusted operating margin, %
Atlas Copco – Q2 2021 6 (19)
Industrial Technique
MSEK 2021 2020 2021 2020
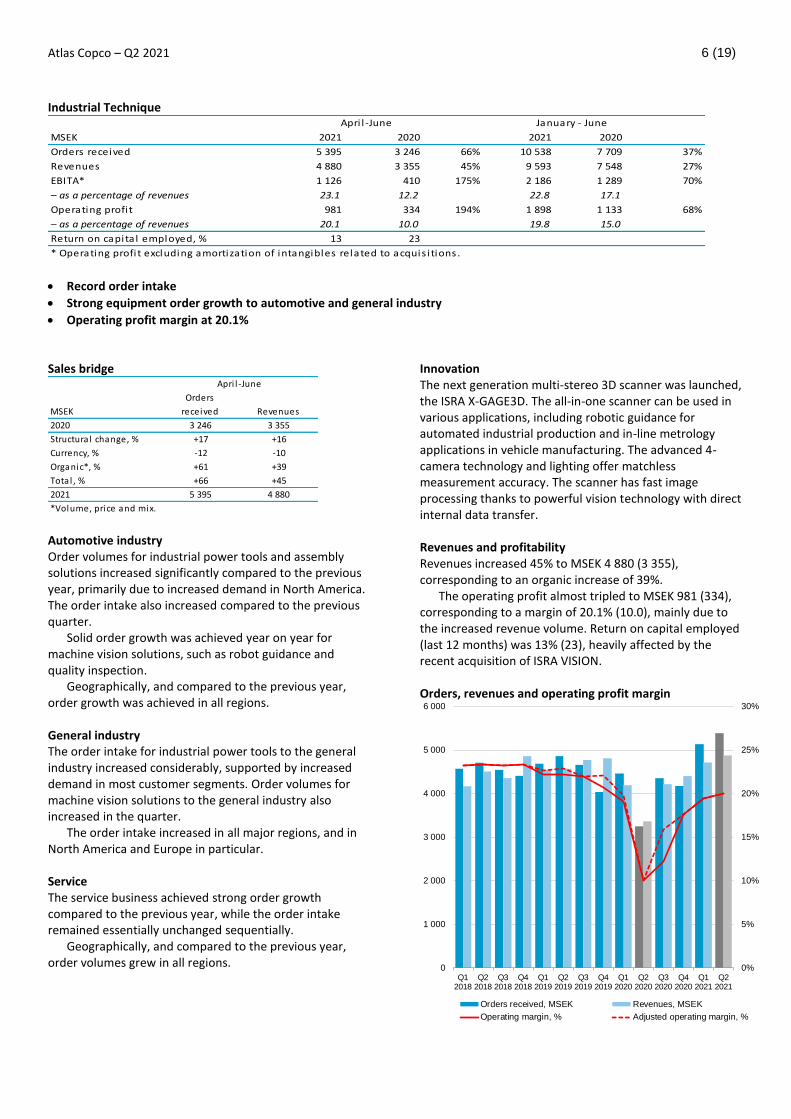
Orders received 5 395 3 246 66% 10 538 7 709 37%
Revenues 4 880 3 355 45% 9 593 7 548 27%
EBITA* 1 126 410 175% 2 186 1 289 70%
– as a percentage of revenues 23.1 12.2 22.8 17.1
Operating profi t 981 334 194% 1 898 1 133 68%
– as a percentage of revenues 20.1 10.0 19.8 15.0
Return on capita l employed, % 13 23
* Operating profi t excluding amortization of intangibles related to acquis i tions .
January - JuneApri l -June
Record order intake
Strong equipment order growth to automotive and general industry
Operating profit margin at 20.1%
Sales bridge
Orders
MSEK received Revenues
2020 3 246 3 355
Structura l change, % +17 +16
Currency, % -12 -10
Organic*, % +61 +39
Tota l , % +66 +45
2021 5 395 4 880
*Volume, price and mix.
Apri l -June
Automotive industry Order volumes for industrial power tools and assembly solutions increased significantly compared to the previous year, primarily due to increased demand in North America. The order intake also increased compared to the previous quarter.
Solid order growth was achieved year on year for machine vision solutions, such as robot guidance and quality inspection.
Geographically, and compared to the previous year, order growth was achieved in all regions. General industry The order intake for industrial power tools to the general industry increased considerably, supported by increased demand in most customer segments. Order volumes for machine vision solutions to the general industry also increased in the quarter.
The order intake increased in all major regions, and in North America and Europe in particular.
Service The service business achieved strong order growth compared to the previous year, while the order intake remained essentially unchanged sequentially.
Geographically, and compared to the previous year, order volumes grew in all regions.
Innovation The next generation multi-stereo 3D scanner was launched, the ISRA X-GAGE3D. The all-in-one scanner can be used in various applications, including robotic guidance for automated industrial production and in-line metrology applications in vehicle manufacturing. The advanced 4-camera technology and lighting offer matchless measurement accuracy. The scanner has fast image processing thanks to powerful vision technology with direct internal data transfer. Revenues and profitability Revenues increased 45% to MSEK 4 880 (3 355), corresponding to an organic increase of 39%.
The operating profit almost tripled to MSEK 981 (334), corresponding to a margin of 20.1% (10.0), mainly due to the increased revenue volume. Return on capital employed (last 12 months) was 13% (23), heavily affected by the recent acquisition of ISRA VISION. Orders, revenues and operating profit margin
0%
5%
10%
15%
20%
25%
30%
0
1 000
2 000
3 000
4 000
5 000
6 000
Q12018
Q22018
Q32018
Q42018
Q12019
Q22019
Q32019
Q42019
Q12020
Q22020
Q32020
Q42020
Q12021
Q22021
Orders received, MSEK Revenues, MSEK
Operating margin, % Adjusted operating margin, %

Atlas Copco – Q2 2021 7 (19)
Power Technique
MSEK 2021 2020 2021 2020
Orders received 3 902 2 400 63% 7 576 6 223 22%
Revenues 3 377 2 930 15% 6 498 6 255 4%
EBITA* 556 305 82% 1 046 798 31%
– as a percentage of revenues 16.5 10.4 16.1 12.8
Operating profi t 539 286 88% 1 015 759 34%
– as a percentage of revenues 16.0 9.8 15.6 12.1
Return on capita l employed, % 23 21
* Operating profi t excluding amortization of intangibles related to acquis i tions .
Apri l -June January - June
Strong order growth for all business types
Acquisition of specialty steam rental company
Operating profit margin at 16.0% Sales bridge
Orders
MSEK received Revenues
2020 2 400 2 930
Structura l change, % +1 +1
Currency, % -13 -9
Organic*, % +75 +23
Tota l , % +63 +15
2021 3 902 3 377
*Volume, price and mix.
Apri l -June
Equipment Order volumes for equipment increased significantly compared to the previous year. The growth was supported by increased demand for portable compressors, generators and pumps, particularly in North America and Europe. Sequentially, orders also grew.
Year on year, strong order growth was achieved in all regions.
Specialty rental The demand for the specialty rental business increased, and the order intake increased considerably compared to the previous year and compared to the previous quarter.
Geographically, and compared to the previous year, orders grew in all regions.
Service The order intake for service increased significantly compared to the previous year, but growth was also achieved sequentially.
All regions contributed to the year-on-year growth.
Innovation A new energy storage system was introduced, the Zenergize range. The products can be used combined with generators or renewables to make hybrid power solutions as well as to create microgrids for several applications, hence reducing customers' CO2 emissions while delivering optimal performance. The storage systems are compact and light compared to traditional alternatives, yet capable of providing over 12 hours of power with a single charge.
Acquisitions The business area acquired a majority share of Eco Steam and Heating Solutions, a specialty steam rental company based in the Netherlands with 23 employees and revenues of MSEK 198. Revenues and profitability Revenues reached MSEK 3 377 (2 930), corresponding to an organic increase of 23%.
The operating profit increased 88% to MSEK 539 (286). Previous year included restructuring costs of MSEK -50. The operating margin was 16.0% (9.8, adjusted 11.5), supported by increased revenue volumes but negatively affected by currency. Return on capital employed (last 12 months) was 23% (21). Orders, revenues and operating profit margin
0%
8%
16%
24%
32%
40%
0
1 000
2 000
3 000
4 000
5 000
Q12018
Q22018
Q32018
Q42018
Q12019
Q22019
Q32019
Q42019
Q12020
Q22020
Q32020
Q42020
Q12021
Q22021
Orders received, MSEK Revenues, MSEK
Operating margin, % Adjusted operating margin, %

Atlas Copco – Q2 2021 8 (19)
Accounting principles The consolidated accounts of the Atlas Copco Group are prepared in accordance with International Financial Reporting Standards (IFRS), as adopted by the EU. The description of the accounting principles and definitions applied in this report are found in the Annual Report 2020. The interim report is prepared in accordance with IAS 34 Interim Financial Reporting. Non-IFRS measures are also presented in the report since they are considered to be important supplemental measures of the company´s performance. For further information about these measures and how they have been calculated, please visit: http://www.atlascopcogroup.com/investor-relations Risks, risk management and factors of uncertainty Atlas Copco’s global and diversified business is active within many customer segments and results in a variety of risks and opportunities geographically and operationally. Thus, the ability to identify, analyze and manage risks is crucial for effective governance and control of the business. The aim is to meet the Group’s goals with a high awareness of risks and well-managed risk taking. Atlas Copco sees the benefits of an efficient risk management both from risk reduction and business opportunity perspectives, which can lead to good business growth. Risks in Atlas Copco are identified in a 360 degree spectrum, meaning that both internal, and external exposures are assessed including todays circumstances and future changes. The Group’s risk management approach follows the decentralized structure of Atlas Copco. Risks are analyzed and addressed in an integrated way. Local companies are responsible for their own risk management, which is monitored and followed up regularly at for example local business board meetings. Group functions responsible for legal, insurance, human resources, compliance, sustainability, treasury, tax, controlling and accounting provide policies, guidelines and instructions regarding risk management. Risk areas include compliance risks, external exposure risks, including pandemics, operational risks and strategic risks. These risk areas can impact the business negatively both in the long and short term, but often also create business opportunities if managed well. Examples of risks and how they are handled is described below. Market risks The demand for Atlas Copco’s equipment and services is affected by changes in the customers’ investment and production levels. A general economic downturn, geopolitical tensions, pandemics, changes in trade agreements, trade sanctions, a widespread financial crisis and other macroeconomic disturbances may, directly or indirectly, affect the Group negatively both in terms of revenues and profitability. However, the Group’s sales are well diversified with customers in many industries and countries around the world, which mitigates the risk.
Financial risks Atlas Copco is subject to currency risks, funding risks, interest rate risks, tax risks, and other financial risks. In line with the overall goals with respect to growth, return on capital, and protecting creditors, Atlas Copco has adopted a policy to control the financial risks to which the Group is exposed. A financial risk management committee meets regularly to manage and follow up financial risks, in line with the policy. Production risks A large part of the components used in production are sourced from sub-suppliers. The availability is dependent on the sub-suppliers and if they have interruptions or lack capacity, this may adversely affect production. To minimize these risks, Atlas Copco has established a global network of sub-suppliers, which means that in most cases there are more than one sub-supplier that can provide a certain component. Atlas Copco is also directly and indirectly exposed to raw material prices. Cost increases for raw materials and components often coincide with strong end-customer demand and can partly be compensated for by increased sales prices. Acquisitions Atlas Copco has the ambition to grow all its business areas, primarily through organic growth, complemented by selected acquisitions. The integration of acquired businesses is a difficult process and it is not certain that every integration will be successful. Therefore, costs related to acquisitions can be higher and/or synergies can take longer to materialize than anticipated. For more information of Atlas Copco’s risk management process and further descriptions of risks and how they are handled, see the Annual Report 2020. Forward-looking statements Some statements in this report are forward-looking, and the actual outcome could be materially different. In addition to the factors explicitly discussed, other factors could have a material effect on the actual outcome. Such factors include, but are not limited to, general business conditions, fluctuations in exchange rates and interest rates, political developments, the impact of competing products and their pricing, product development, commercialization and technological difficulties, interruptions in supply, and major customer credit losses. Atlas Copco AB Atlas Copco AB and its subsidiaries are sometimes referred to as the Atlas Copco Group, the Group or Atlas Copco. Atlas Copco AB is also sometimes referred to as Atlas Copco. Any mentioning of the Board of Directors, the Board or the Directors refers to the Board of Directors of Atlas Copco AB.

Atlas Copco – Q2 2021 9 (19)
Consolidated income statement (condensed)
Jun. 30 Jun. 30 Jun. 30 Jun. 30
MSEK 2021 2020 2021 2020
Revenues 27 534 24 102 53 555 49 200
Cost of sa les -15 907 -14 547 -31 092 -28 942
Gross profit 11 627 9 555 22 463 20 258
Marketing expenses -3 002 -2 653 -5 855 -5 733
Adminis trative expenses -1 708 -1 709 -3 574 -3 352
Research and development costs -1 007 -927 -1 985 -1 907
Other operating income and expenses 14 -377 262 -253
Operating profit 5 924 3 889 11 311 9 013
- as a percentage of revenues 21.5 16.1 21.1 18.3
Net financia l i tems -52 -63 -96 -177
Profit before tax 5 872 3 826 11 215 8 836
- as a percentage of revenues 21.3 15.9 20.9 18.0
Income tax expense -1 301 -697 -2 527 -1 867
Profit for the period 4 571 3 129 8 688 6 969
Profi t attributable to
- owners of the parent 4 569 3 129 8 684 6 965
- non-control l ing interests 2 - 4 4
Basic earnings per share, SEK 3.75 2.58 7.14 5.73
Di luted earnings per share, SEK 3.75 2.57 7.12 5.73
Bas ic weighted average number
of shares outstanding, mi l l ions 1 217.3 1 214.7 1 216.9 1 215.1
Di luted weighted average number
of shares outstanding, mi l l ions 1 219.9 1 215.7 1 219.4 1 215.9
Key ratios
Equity per share, period end, SEK 46 45
Return on capita l employed, 12 month va lues , % 26 26
Return on equity, 12 month va lues , % 29 30
Debt/equity ratio, period end, % 23 44
Equity/assets ratio, period end, % 45 47
Number of employees , period end 41 105 39 909
3 months ended 6 months ended

Atlas Copco – Q2 2021 10 (19)
Consolidated statement of comprehensive income
Jun. 30 Jun. 30 Jun. 30 Jun. 30
MSEK 2021 2020 2021 2020
Profit for the period 4 571 3 129 8 688 6 969
Other comprehensive income
Items that will not be reclassified to profit or loss
Remeasurements of defined benefi t pens ion plans 315 -518 1 047 307
Income tax relating to i tems that wi l l not be reclass i fied -82 111 -252 -84
233 -407 795 223
Items that may be reclassified subsequently to profit or loss
Trans lation di fferences on foreign operations -981 -3 930 1 958 -1 014
Hedge of net investments in foreign operations 156 984 -176 -101
Cash flow hedges -26 - -54 -82
Income tax relating to i tems that may be reclass i fied -44 -278 58 47
-895 -3 224 1 786 -1 150
Other comprehensive income for the period, net of tax -662 -3 631 2 581 -927
Total comprehensive income for the period 3 909 -502 11 269 6 042
Total comprehens ive income attributable to
- owners of the parent 3 910 -499 11 262 6 040
- non-control l ing interests -1 -3 7 2
3 months ended 6 months ended

Atlas Copco – Q2 2021 11 (19)
Consolidated balance sheet (condensed) MSEK Jun. 30, 2021 Jun. 30, 2020 Dec. 31, 2020
Intangible assets 47 528 49 606 45 840
Rental equipment 2 438 2 678 2 255
Other property, plant and equipment 11 432 11 732 11 136
Financia l assets and other receivables 1 668 1 839 1 706
Deferred tax assets 1 536 1 560 1 484
Total non-current assets 64 602 67 415 62 421
Inventories 15 242 16 036 13 450
Trade and other receivables 29 682 28 049 25 777
Other financia l assets 624 167 58
Cash and cash equiva lents 13 720 5 277 11 655
Assets class i fied as held for sa le 5 6 5
Total current assets 59 273 49 535 50 945
TOTAL ASSETS 123 875 116 950 113 366
Equity attributable to owners of the parent 55 713 54 150 53 215
Non-control l ing interests 17 332 319
TOTAL EQUITY 55 730 54 482 53 534
Borrowings 21 904 22 604 21 669
Post-employment benefi ts 2 564 3 480 3 488
Other l iabi l i ties and provis ions 1 879 1 500 1 473
Deferred tax l iabi l i ties 1 987 1 856 1 736
Total non-current liabilities 28 334 29 440 28 366
Borrowings 2 952 3 132 2 977
Trade payables and other l iabi l i ties 35 015 28 089 26 556
Provis ions 1 844 1 807 1 933
Total current liabilities 39 811 33 028 31 466
TOTAL EQUITY AND LIABILITIES 123 875 116 950 113 366 Fair value of derivatives, cash equivalents and borrowings The carrying value and fair value of the Group’s outstanding derivatives, liquidity funds and borrowings are shown in the tables below. The fair values of bonds are based on level 1 and the fair values of derivatives, liquidity funds and other loans are based on level 2 in the fair value hierarchy. Compared to 2020, no transfers have been made between different levels in the fair value hierarchy for derivatives and borrowings and no significant changes have been made to valuation techniques, inputs or assumptions. Liquidity funds, reported under cash equivalents, are according to IFRS 9 classified at fair value through profit and loss. For further information, see note 27 in the Annual Report 2020. http://www.atlascopco.com/ir
Financial instruments recorded at fair value MSEK Jun. 30, 2021 Dec. 31, 2020
Current assets and liabilities
Assets 662 950
Liabi l i ties 8 69 Carrying value and fair value of borrowings MSEK Jun. 30, 2021 Jun. 30, 2021 Dec. 31, 2020 Dec. 31, 2020
Carrying value Fair value Carrying value Fair value
Bonds 13 148 13 525 13 017 13 577
Other loans 8 354 8 454 8 260 8 406
Lease l iabi l i ty 3 354 3 354 3 369 3 369
24 856 25 333 24 646 25 352

Atlas Copco – Q2 2021 12 (19)
Consolidated statement of changes in equity (condensed)
MSEK
owners of
the parent
non-control l ing
interests Total equity
Opening balance, January 1, 2021 53 215 319 53 534
Changes in equity for the period
Total comprehens ive income for the period 11 262 7 11 269
Dividend -8 883 - -8 883
Change of non-control l ing interests -500 -309 -809
Acquis i tion and divestment of own shares 776 - 776
Share-based payments , equity settled -157 - -157
Closing balance, June 30, 2021 55 713 17 55 730
MSEK
owners of
the parent
non-control l ing
interests Total equity
Opening balance, January 1, 2020 53 231 59 53 290
Changes in equity for the period
Total comprehens ive income for the period 6 040 2 6 042Dividend -4 250 - -4 250Change of non-control l ing interests -153 271 118
Acquis i tion and divestment of own shares -677 - -677
Share-based payments , equity settled -41 - -41
Closing balance, June 30, 2020 54 150 332 54 482
Equity attributable to
Equity attributable to

Atlas Copco – Q2 2021 13 (19)
Consolidated statement of cash flows (condensed)
MSEK 2021 2020 2021 2020
Cash flows from operating activities
Operating profi t 5 924 3 889 11 311 9 013
Depreciation, amortization and impairment (see below) 1 338 1 286 2 616 2 577
Capita l ga in/loss and other non-cash i tems 6 605 114 610
Operating cash surplus 7 268 5 780 14 041 12 200
Net financia l i tems received/paid -5 -194 133 -242
Taxes pa id -2 266 -1 101 -3 332 -2 176
Pens ion funding and payment of pens ion to employees -71 -77 -146 -158
Change in working capita l -345 -387 -845 -723
Investments in renta l equipment -128 -136 -233 -314
Sale of renta l equipment 4 18 25 46
Net cash from operating activities 4 457 3 903 9 643 8 633
Cash flows from investing activities
Investments in property, plant and equipment -405 -317 -776 -733
Sale of property, plant and equipment 9 14 40 19
Investments in intangible assets -366 -299 -694 -604
Acquis i tion of subs idiaries and associated companies -594 -8 714 * -718 -12 798 *
Other investments , net -6 4 -543 28
Net cash from investing activities -1 362 -9 312 -2 691 -14 088
Cash flows from financing activities
Annual dividends pa id -4 442 -4 250 -4 442 -4 250
Dividends pa id to non-control l ing interest - -Acquis i tion of non-control l ing interest -797 -182 -797 -182
Redemption of shares - - 0Repurchase and sa les of own shares 453 347 776 -677
Change in interest-bearing l iabi l i ties , net 850 2 496 -641 855
Net cash from financing activities -3 936 -1 589 -5 104 -4 254
Net cash flow for the period -841 -6 998 1 848 -9 709
Cash and cash equiva lents , beginning of the period 14 746 12 837 11 655 15 005
Exchange di fferences in cash and cash equiva lents -185 -562 217 -19
Cash and cash equivalents, end of the period 13 720 5 277 13 720 5 277
*Includes approximately MSEK 1 600 in Q1 and appoximately MSEK 8 700 in Q2 related to the acquisition of ISRA VISION.
Depreciation, amortization and impairment
Rental equipment 176 188 344 386
Other property, plant and equipment 349 330 670 667
Right-of-use assets 281 295 558 594
Intangible assets 532 473 1 044 930
Total 1 338 1 286 2 616 2 577
Calculation of operating cash flow
MSEK 2021 2020 2021 2020
Net cash flow for the period -841 -6 998 1 848 -9 709
Add back:
Change in interest-bearing l iabi l i ties , net -850 -2 496 641 -855
Repurchase and sa les of own shares -453 -347 -776 677
Annual dividends pa id 4 442 4 250 4 442 4 250
Acquis i tion of non-control l ing interest 797 182 797 182
Acquis i tions and divestments 594 8 714 718 12 798
Investments of cash l iquidi ty - - 547 - Currency hedges 54 178 -153 -35
Operating cash flow 3 743 3 483 8 064 7 308
Apri l - June January - June
Apri l - June January - June

Atlas Copco – Q2 2021 14 (19)
Revenues by business area 2019 2020 2021
MSEK (by quarter) Q1 Q2 Q3 Q4 Q1 Q2 Q3 Q4 Q1 Q2
Compressor Technique 11 397 11 974 12 314 12 601 11 588 11 405 11 890 12 446 11 522 12 212
- of which external 11 241 11 832 12 146 12 502 11 470 11 322 11 806 12 381 11 423 12 099
- of which internal 156 142 168 99 118 83 84 65 99 113
Vacuum Technique 5 253 5 650 6 107 6 560 6 159 6 535 5 928 6 063 6 808 7 220
- of which external 5 253 5 650 6 107 6 560 6 154 6 535 5 925 6 059 6 804 7 214
- of which internal 0 0 0 0 5 0 3 4 4 6
Industrial Technique 4 547 4 576 4 783 4 806 4 193 3 355 4 221 4 407 4 713 4 880
- of which external 4 538 4 567 4 774 4 799 4 180 3 347 4 215 4 399 4 705 4 873
- of which internal 9 9 9 7 13 8 6 8 8 7
Power Technique 3 177 3 555 3 697 3 486 3 325 2 930 2 932 2 919 3 121 3 377
- of which external 3 149 3 531 3 649 3 458 3 294 2 898 2 903 2 899 3 089 3 348
- of which internal 28 24 48 28 31 32 29 20 32 29
Common Group Items /
Eliminations -193 -175 -225 -134 -167 -123 -122 -97 -143 -155
Atlas Copco Group 24 181 25 580 26 676 27 319 25 098 24 102 24 849 25 738 26 021 27 534 Operating profit by business area
2019 2020 2021
MSEK (by quarter) Q1 Q2 Q3 Q4 Q1 Q2 Q3 Q4 Q1 Q2
Compressor Technique 2 618 2 773 2 897 2 910 2 520 2 444 2 729 2 965 2 730 2 916
- as a percentage of revenues 23.0 23.2 23.5 23.1 21.7 21.4 23.0 23.8 23.7 23.9
Vacuum Technique 1 292 1 401 1 508 1 591 1 497 1 278 1 354 1 390 1 695 1 789
- as a percentage of revenues 24.6 24.8 24.7 24.3 24.3 19.6 22.8 22.9 24.9 24.8
Industrial Technique 1 008 1 016 1 051 994 799 334 513 776 917 981
- as a percentage of revenues 22.2 22.2 22.0 20.7 19.1 10.0 12.2 17.6 19.5 20.1
Power Technique 524 619 606 559 473 286 410 425 476 539
- as a percentage of revenues 16.5 17.4 16.4 16.0 14.2 9.8 14.0 14.6 15.3 16.0
Common Group Items /
Eliminations -394 -430 -219 -427 -165 -453 -246 -183 -431 -301
Operating profit 5 048 5 379 5 843 5 627 5 124 3 889 4 760 5 373 5 387 5 924
- as a percentage of revenues 20.9 21.0 21.9 20.6 20.4 16.1 19.2 20.9 20.7 21.5
Net financial items -141 -64 -65 -55 -114 -63 -64 -80 -44 -52
Profit before tax 4 907 5 315 5 778 5 572 5 010 3 826 4 696 5 293 5 343 5 872
- as a percentage of revenues 20.3 20.8 21.7 20.4 20.0 15.9 18.9 20.6 20.5 21.3 Return on capital employed by business area
2019 2020 2021
% (by quarter) Q1 Q2 Q3 Q4 Q1 Q2 Q3 Q4 Q1 Q2
Compressor Technique 105 100 93 87 80 76 75 79 84 91
Vacuum Technique 26 25 23 22 22 20 19 19 20 23
Industrial Technique 39 37 36 35 31 23 16 13 12 13
Power Technique 30 30 29 28 25 21 19 18 19 23
Atlas Copco Group 33 33 32 30 29 26 24 23 23 26

Atlas Copco – Q2 2021 15 (19)
Acquisitions and divestments Revenues Number of
Date Acquis i tions Divestments Bus iness area MSEK* employees*
2021 Jun. 24 Airflow Compressors & Pneumatics Ltd (Ai rflow) Compressor Technique 16
2021 Jun. 14 Compressed Air Systems, Inc. (CAS) Compressor Technique 30
2021 May 31 ARPUMA regel - und fördertechnische Geräte GmbH Vacuum Technique 41 14
2021 May 25 Medigas Service & Testing Co. Inc. Compressor Technique 23 6
2021 May 10 MidState Ai r Compressor Compressor Technique 15
2021 May 3 Eco Steam and Heating Solutions (acquis i tion of
majori ty share)
Power Technique 198 23
2021 Apr. 7 IBVC Vacuum, S.L.U. Vacuum Technique 10
2021 Mar. 3 Cooper Freer Ltd Compressor Technique 18
2021 Jan. 26 DGM SRL Compressor Technique 21
2021 Jan. 7 Ehrler & Beck GmbH Vacuum Technique 15
2021 Jan. 5 Kawalek Kompressoren Compressor Technique 10
2020 Dec. 31 Puri fication Solutions LLC Compressor Technique 242 60
2020 Dec. 21 Perceptron Industria l Technique 516 300
2020 Sep. 2 MEDGAS-Technik GmbH Compressor Technique 126 80
2020 Aug. 4 iTrap (the technology and operating assets) Vacuum Technique 4
2020 Aug. 4 THN Druckluft and Produktions GmbH & Co.KG Compressor Technique 15
2020 Jun. 24 ISRA VISION AG Industria l Technique 1 619 800
2020 Jun. 5 Ovity Ai r Comprimé Compressor Technique 8
2020 Feb. 28 Dekker Vacuum Technologies Inc Vacuum Technique 217 70
2020 Feb. 27 Dr. Gustav Gai l Drucklufttechnik GmbH Compressor Technique 10
2020 Jan. 22 M.C. Schroeder Equipment Co., Inc. Vacuum Technique 8
2020 Jan. 16 Hydra Flow West Compressor Technique 7
2020 Jan. 3 Scheugenpflug AG Industria l Technique 850 600
*Annual revenues and number of employees at time of acquisition/divestment. No revenues are disclosed for former Atlas Copco distributors.
Due to the relatively small size of most of the acquisitions made in 2021, full disclosure as per IFRS 3 is not given in this interim report. Disclosure will be given in the annual report 2021. See the annual report for 2020 for disclosure of acquisitions made in 2020.

Atlas Copco – Q2 2021 16 (19)
Parent company Income statement (condensed)
MSEK 2021 2020 2021 2020
Administrative expenses -187 -251 -391 -356
Other operating income and expenses 30 5 56 29
Operating profit/loss -157 -246 -335 -327
Financia l income and expenses 1 548 1 412 1 520 1 362
Profit/loss before tax 1 391 1 166 1 185 1 035
Income tax 49 16 98 73
Profit/loss for the period 1 440 1 182 1 283 1 108
Apri l - June January - June
Balance sheet (condensed)
Jun. 30 Jun. 30 Dec. 31
MSEK 2021 2020 2020
Total non-current assets 162 231 159 049 161 665
Total current assets 11 803 13 110 16 926
TOTAL ASSETS 174 034 172 159 178 591
Total restricted equity 5 785 5 785 5 785
Total non-restricted equity 139 523 140 355 146 504
TOTAL EQUITY 145 308 146 140 152 289
Total provis ions 877 689 666
Total non-current l iabi l i ties 23 118 23 097 23 007
Total current l iabi l i ties 4 731 2 233 2 629
TOTAL EQUITY AND LIABILITIES 174 034 172 159 178 591 Assets pledged and contingent liabilities
Jun. 30 Jun. 30 Dec. 31
MSEK 2021 2020 2020
Assets pledged 196 187 183
Contingent l iabi l i ties 3 268 11 848 3 290
Accounting principles Atlas Copco AB is the ultimate Parent Company of the Atlas Copco Group. The financial statements of Atlas Copco AB have been prepared in accordance with the Swedish Annual Accounts Act and the accounting standard RFR 2, Accounting for Legal Entities. The same accounting principles and methods of computation are followed in the interim financial statements as compared with the most recent annual financial statements. See also accounting principles, page 8.
Atlas Copco – Q2 2021 17 (19)
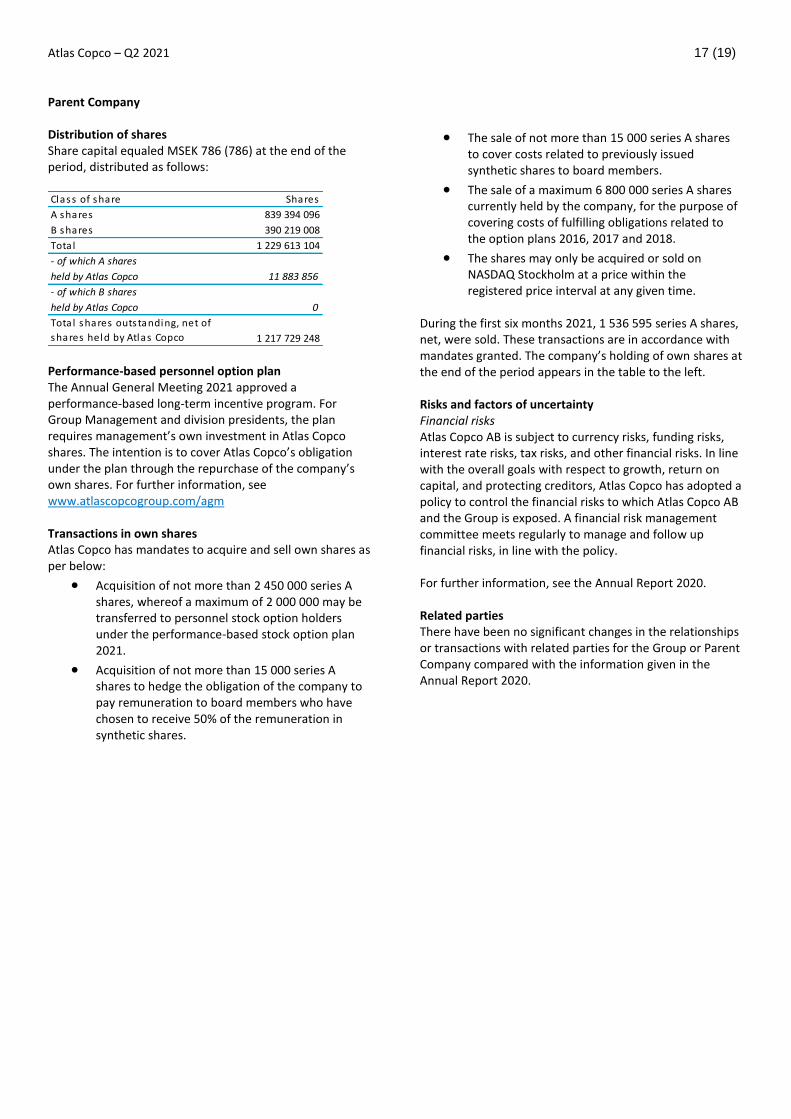
Parent Company Distribution of shares Share capital equaled MSEK 786 (786) at the end of the period, distributed as follows: Class of share Shares
A shares 839 394 096
B shares 390 219 008
Tota l 1 229 613 104
- of which A shares
held by Atlas Copco 11 883 856
- of which B shares
held by Atlas Copco 0
1 217 729 248
Tota l shares outstanding, net of
shares held by Atlas Copco Performance-based personnel option plan The Annual General Meeting 2021 approved a performance-based long-term incentive program. For Group Management and division presidents, the plan requires management’s own investment in Atlas Copco shares. The intention is to cover Atlas Copco’s obligation under the plan through the repurchase of the company’s own shares. For further information, see www.atlascopcogroup.com/agm Transactions in own shares Atlas Copco has mandates to acquire and sell own shares as per below:
Acquisition of not more than 2 450 000 series A shares, whereof a maximum of 2 000 000 may be transferred to personnel stock option holders under the performance-based stock option plan 2021.
Acquisition of not more than 15 000 series A shares to hedge the obligation of the company to pay remuneration to board members who have chosen to receive 50% of the remuneration in synthetic shares.
The sale of not more than 15 000 series A shares to cover costs related to previously issued synthetic shares to board members.
The sale of a maximum 6 800 000 series A shares currently held by the company, for the purpose of covering costs of fulfilling obligations related to the option plans 2016, 2017 and 2018.
The shares may only be acquired or sold on NASDAQ Stockholm at a price within the registered price interval at any given time.
During the first six months 2021, 1 536 595 series A shares, net, were sold. These transactions are in accordance with mandates granted. The company’s holding of own shares at the end of the period appears in the table to the left. Risks and factors of uncertainty Financial risks Atlas Copco AB is subject to currency risks, funding risks, interest rate risks, tax risks, and other financial risks. In line with the overall goals with respect to growth, return on capital, and protecting creditors, Atlas Copco has adopted a policy to control the financial risks to which Atlas Copco AB and the Group is exposed. A financial risk management committee meets regularly to manage and follow up financial risks, in line with the policy. For further information, see the Annual Report 2020. Related parties There have been no significant changes in the relationships or transactions with related parties for the Group or Parent Company compared with the information given in the Annual Report 2020.

Atlas Copco – Q2 2021 18 (19)
This is Atlas Copco The Atlas Copco Group is a world-leading provider of sustainable productivity solutions, demanded by all types of industries, enabling everything from industrial automation to reliable medical air solutions. The Group offers innovative compressors, air treatment systems, vacuum solutions, industrial power tools and assembly systems, machine vision, and power and flow solutions. Atlas Copco develops products and services focused on productivity, energy efficiency, safety and ergonomics, supported by insights from connected products. The company was founded in 1873, is based in Nacka, Sweden, and has a global reach spanning more than 180 countries. In 2020, Atlas Copco had revenues of BSEK 100 (BEUR 10) and about 40 000 employees at year end. Business areas Atlas Copco has four business areas. The business areas are responsible for developing their respective operations by implementing and following up on strategies and objectives to achieve sustainable, profitable growth. The Compressor Technique business area provides compressed air solutions; industrial compressors, gas and process compressors and expanders, air and gas treatment equipment, and air management systems. The business area has a global service network and innovates for sustainable productivity in the manufacturing and process industries. Principal product development and manufacturing units are located in Belgium, the United States, China, India, Germany, and Italy. The Vacuum Technique business area provides vacuum products, exhaust management systems, valves and related products. The main markets served are semiconductor and scientific instruments as well as a wide range of industrial segments including chemical process industries, food packaging and paper handling. The business area has a global service network and innovates for sustainable productivity in order to further improve its customers’ performance. Principal product development and manufacturing units are located in the United States, Mexico, United Kingdom, Czech Republic, Germany, South Korea, China, and Japan. The Industrial Technique business area provides industrial power tools, assembly and machine vision solutions, quality assurance products, software, and service through a global network. The business area innovates for sustainable productivity for customers in the automotive and general industries. Principal product development and manufacturing units are located in Sweden, Germany, Hungary, United Kingdom, France, the United States, China, and Japan. The Power Technique business area provides air, power and flow solutions through products such as mobile compressors, pumps, light towers and generators, along with a number of complementary products. It also offers specialty rental and provides services through a dedicated, global network. Guided by a forward-thinking approach to innovation, Power Technique provides sustainable productivity solutions across multiple industries, including construction, manufacturing, oil and gas, and exploration drilling. Principal product development and manufacturing units are located in Belgium, Spain, the United States, China, and India.
Vision, mission and strategy The Atlas Copco Group’s vision is to become and remain First in Mind—First in Choice of its customers and other principal stakeholders. The mission is to achieve sustainable, profitable growth. Sustainability plays an important role in Atlas Copco’s vision and it is an integral aspect of the Group’s mission. An integrated sustainability strategy, backed by ambitious goals, helps the company deliver greater value to all its stakeholders in a way that is economically, environmentally and socially responsible. For further information
• Analysts and investors Daniel Althoff, Vice President Investor Relations Mobile: +46 768 99 95 97 [email protected]
• Media
Sara Liljedal, Media Relations Manager Mobile: +46 72 144 10 38 [email protected]
Conference call A presentation for investors, analysts and media will be held on July 16, 2021 at 14:30 CEST. The dial-in numbers are:
Sweden: +46 8 50 55 83 66
United Kingdom: +44 33 33 00 90 30
United States: +16 46 72 24 902 The conference call will be broadcasted live on the web. Please see our website: http://www.atlascopcogroup.com/investor-relations for the webcast link and presentation material. Third-quarter report 2021 The Q3 2021 report will be published on October 21, 2021 around 12:00 CEST and the conference call will be at 14:00 CEST. Silent period starts September 21, 2021. Fourth-quarter report 2021 The Q4 2021 report will be published on January 25, 2022. Silent period starts December 26, 2021. This information is information that Atlas Copco AB is obliged to make public pursuant to the EU Market Abuse Regulation and the Securities Markets Act. The information was submitted for publication, through the contact person set out above, at 13:30 CEST on July, 16, 2021.

Atlas Copco – Q2 2021 19 (19)
The Board of Directors and President declare that the interim report gives a fair view of the business development, financial position and result of operation of the Parent Company and the consolidated Group and describes significant risks and uncertainties that the parent company and its subsidiaries are facing.
Nacka, July 16, 2021 Atlas Copco AB
Hans Stråberg Board member
Chair
Staffan Bohman Board member
Tina Donikowski Board member
Johan Forssell Board member
Anna Ohlsson-Leijon Board member
Mats Rahmström Board member
President and CEO
Gordon Riske Board member
Peter Wallenberg Jr Board member
Mikael Bergstedt Board member
Union representative
Benny Larsson Board member
Union representative
Auditors’ Review Report
Atlas Copco AB (publ), Corp. Reg. No. 556014-2720 Introduction We have reviewed this interim report for Atlas Copco AB (publ.) as per June 30, 2021, and the six-month period then ended. The Board of Directors and the President are responsible for the preparation and presentation of this interim financial information in accordance with IAS 34 and the Swedish Annual Accounts Act. Our responsibility is to express a conclusion on this interim report based on our review. Approach and scope of the review We conducted our review in accordance with the International Standard on Review Engagements, ISRE 2410, Review of Interim Report Performed by the Independent Auditor of the Entity. A review consists of making inquiries, primarily of persons responsible for financial and accounting matters, and applying analytical and other review procedures. A review is substantially less in scope
than an audit conducted in accordance with International Standards on Auditing (ISA) and other generally accepted auditing practices.
The procedures performed in a review do not enable us to obtain a level of assurance that would make us aware of all significant matters that might be identified in an audit. Therefore, the conclusion based on a review does not give the same level of assurance as a conclusion based on an audit. Conclusion Based on our review, nothing has come to our attention that causes us to believe that the interim report is not prepared, in all material respects, in accordance with IAS 34 and the Annual Accounts Act for the Group, and in accordance with the Annual Accounts Act for the Parent Company.
Nacka, July 16, 2021
Ernst & Young AB
Erik Sandström Authorized Public Accountant


![Atlas Copco (India) Limited · 3. Atlas Copco International B.V. ACO0101339 4. Atlas Copco AB ACO0101595, ACO0101097, A 0005191 and 10177354 5. Atlas Copco [I] Ltd Charitable Foundation](https://img.pdfslide.us/doc/110x75/5ec4197bfe534e04f779e397/atlas-copco-india-limited-3-atlas-copco-international-bv-aco0101339-4-atlas.jpg)