Embed Size (px)
Citation preview
23rd World Gas Conference, Amsterdam 2006
ATLANTIC BASIN LNG: DIVERSE DRIVERS THAT REQUIRE DIVERSIFIED MARKETING
Author
Ken Snodgrass
Shell Gas & Power International B.V.
ABSTRACT
It is an understatement to state that the Atlantic Basin LNG is changing. Hardly a day goes by that you don’t see a public statement about a new or expanding regasification facility in North America or Europe. Henry Hub prices continue to climb to new highs with US domestic gas production predicted to decline. The 2004-2005 dry Spanish winter sent many Spanish marketers scrambling for supply. Competition grows with new entrants vying for supply to fill hungry downstream markets. The Atlantic Basin rate of growth is even outpacing Asia Pacific, the historical focus of LNG marketing.
What market drivers will dominate the Atlantic Basin during the next five years? Certainly, the Atlantic Basin supply and demand balance has driven the current high gas prices. But the Atlantic Basin is expected to be driven by other factors: the need for market build-up supply before the ramp up of new projects, changing weather patterns, scheduling constraints, the growing number of LNG vessels, government imposed sourcing constraints and suppliers wanting to diversify their markets.
Successful navigation within these multiple drivers will require a diverse marketing approach. Flexibility is the key attribute to survive and thrive in the rapidly changing Atlantic Basin LNG market. A key objective for Shell in the Atlantic Basin is to implement a marketing strategy that penetrates both the high volume and premium gas markets giving our customers multiple markets and value. Shell has been active in numerous areas:
• North American regasification projects in the US (Cove Point, Elba Island, Gulf Landing and Broadwater) and Mexico (Altamira) provide access to the key Henry Hub-priced gas markets.
• Northern European gas supply complementing LNG imports into Spain. • Ionio regasification project in Priolo, Sicily. • New and expanding supply from Nigeria and Qatar.
Shell’s role as market facilitator gives us access into multiple markets with different risk and
price structures. Shell has vast experience in LNG and natural gas trading that creates optimal commercial value to gas resource holders during the different project life stages. Even during this rapidly changing LNG period, stability can be achieved through diversification that contributes to sustainable market growth in the Atlantic Basin.
TABLE OF CONTENTS
Abstract Body of Paper 1. Changing Atlantic Basin LNG Market
a. Definition of Atlantic Basin LNG Region b. Growth of Atlantic Basin LNG Supply c. Growth of Atlantic Basin Regasification Facilities
2. Dominate Market Drivers in the Atlantic Basin LNG Market
a. Price b. Weather c. Scheduling d. Shipbuilding Market e. Sourcing Constraints f. Suppliers Seeking Global Market Diversity
3. Success Factors in the Atlantic Basin LNG Market
a. Premium North American Gas Markets b. Foundation of High-Volume Markets c. Diversified Atlantic Basin LNG Supply d. Flexibility During LNG Project Life Cycle e. Leveraging LNG with Pipeline Supply
4. Conclusions List of Figures F1 Map of Atlantic Basin Region
F2 Historical Atlantic Basin LNG Demand (Yearly Volume, % of Global LNG Demand) F3 Map of North American LNG Regasification Facilities Announced in 2004 and 2005 F4 Map of European LNG Regasification Facilities Announced in 2004 and 2005 F5 HH Prices: Historical and Future F6 Brent Prices: Historical and Future F7 2005 Hurricane Map F8 Historical Spanish Inland Rainfall F9 Historical Spanish Mainland Water Reserves
F10 Example of Liquifaction Plant Build-Up F11 LNG Fleet: Actual and Projected (with no scrapping) F12 147kt CBM LNG New-Building Prices F13 Qatar LNG Supply Map F14 Nigerian LNG Supply Map F15 Map of North American Premium and High-Volume Markets F16 Map of European High-Volume Markets F17 Shell’s Atlantic Basin LNG Regasification Facilities and Gas Markets
Paper 1. Changing Atlantic Basin LNG Market
It is an understatement to state that the Atlantic Basin LNG market is changing. Hardly a day goes by that you don’t see a public statement about a new or expanding regasification facility in North America or Europe. This paper will examine the market drivers that are predicted to dominate the Atlantic Basin LNG market during the next five years and the predicted success factors in the Atlantic Basin LNG market.
As an introduction to the Atlantic Basin LNG market, it is first best to define the Atlantic Basin LNG market, examine the historical Atlantic Basin demand (both in volume and percentage of global LNG demand) and show the expanding proposed Atlantic Basin regasification facilities.
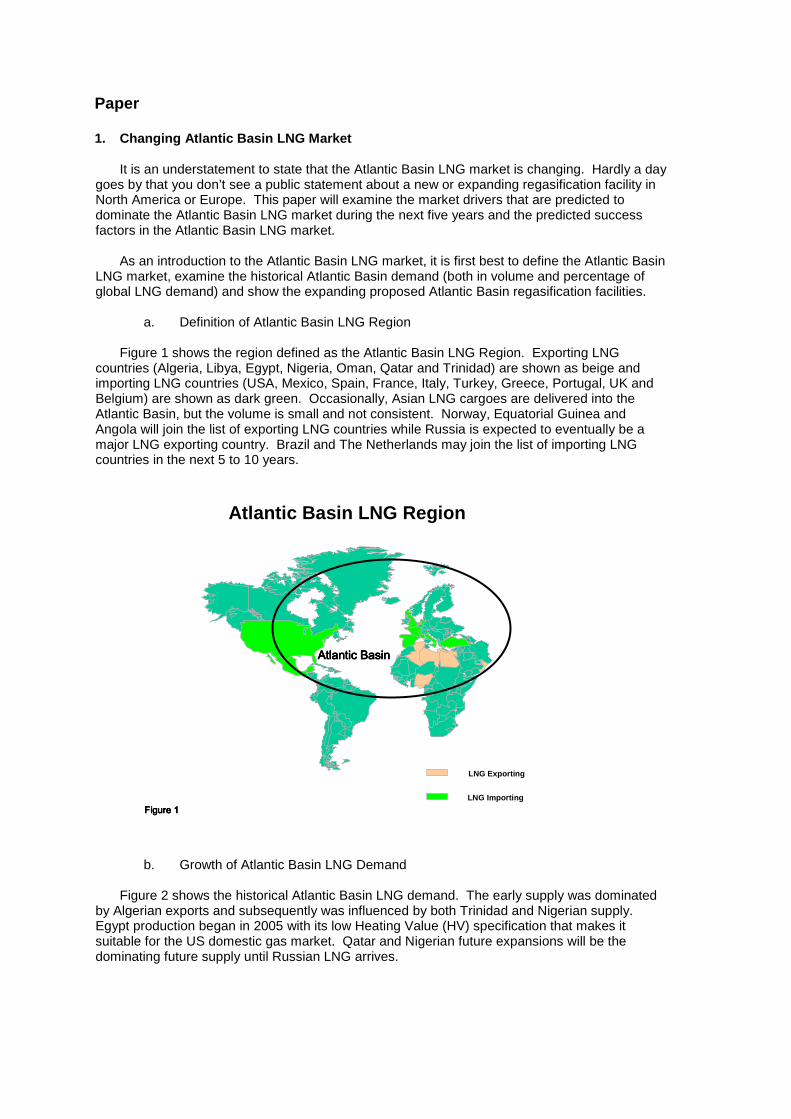
a. Definition of Atlantic Basin LNG Region
Figure 1 shows the region defined as the Atlantic Basin LNG Region. Exporting LNG countries (Algeria, Libya, Egypt, Nigeria, Oman, Qatar and Trinidad) are shown as beige and importing LNG countries (USA, Mexico, Spain, France, Italy, Turkey, Greece, Portugal, UK and Belgium) are shown as dark green. Occasionally, Asian LNG cargoes are delivered into the Atlantic Basin, but the volume is small and not consistent. Norway, Equatorial Guinea and Angola will join the list of exporting LNG countries while Russia is expected to eventually be a major LNG exporting country. Brazil and The Netherlands may join the list of importing LNG countries in the next 5 to 10 years.
b. Growth of Atlantic Basin LNG Demand
Figure 2 shows the historical Atlantic Basin LNG demand. The early supply was dominated
by Algerian exports and subsequently was influenced by both Trinidad and Nigerian supply. Egypt production began in 2005 with its low Heating Value (HV) specification that makes it suitable for the US domestic gas market. Qatar and Nigerian future expansions will be the dominating future supply until Russian LNG arrives.
Atlantic BasinAtlantic BasinAtlantic BasinAtlantic Basin
Atlantic Basin LNG Region
Figure 1Figure 1Figure 1Figure 1
LNG Exporting
LNG Importing
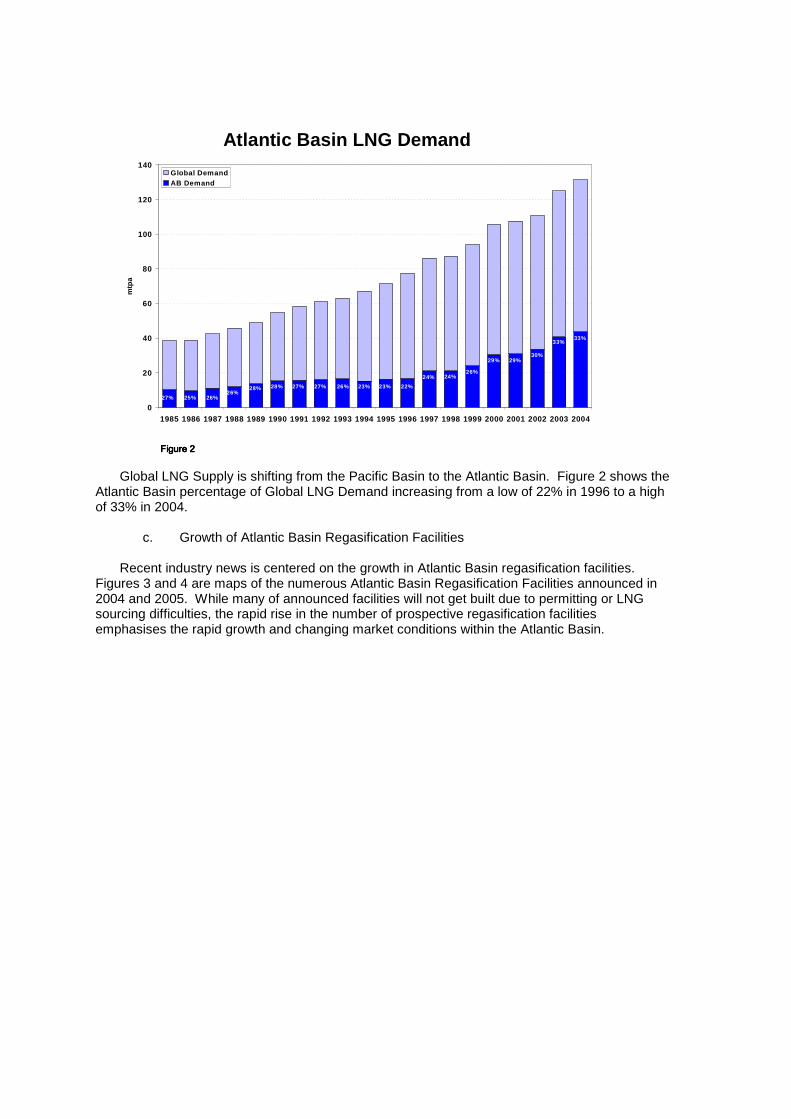
Global LNG Supply is shifting from the Pacific Basin to the Atlantic Basin. Figure 2 shows the Atlantic Basin percentage of Global LNG Demand increasing from a low of 22% in 1996 to a high of 33% in 2004.
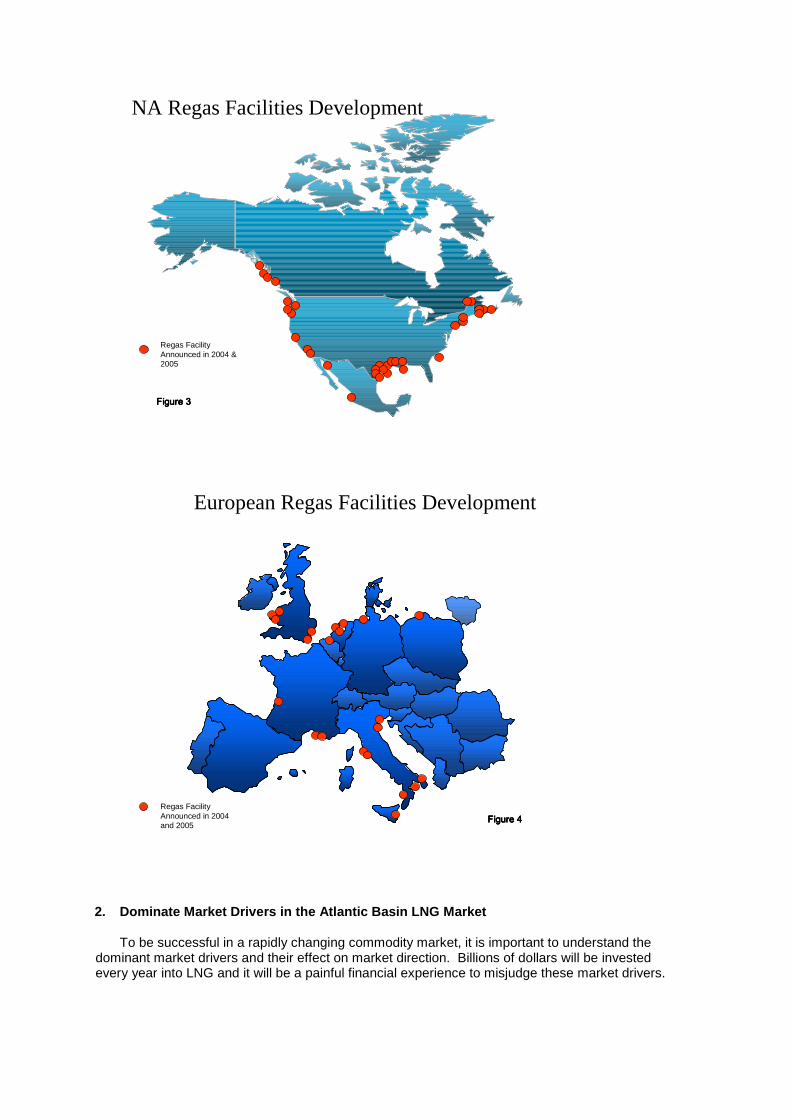
c. Growth of Atlantic Basin Regasification Facilities
Recent industry news is centered on the growth in Atlantic Basin regasification facilities. Figures 3 and 4 are maps of the numerous Atlantic Basin Regasification Facilities announced in 2004 and 2005. While many of announced facilities will not get built due to permitting or LNG sourcing difficulties, the rapid rise in the number of prospective regasification facilities emphasises the rapid growth and changing market conditions within the Atlantic Basin.
Atlantic Basin LNG Demand
0
20
40
60
80
100
120
140
1985 1986 1987 1988 1989 1990 1991 1992 1993 1994 1995 1996 1997 1998 1999 2000 2001 2002 2003 2004
mtp
a
Global DemandAB Demand
27% 25%
26%24%24%
22%23%23%26%27%27%28%28%26%
26%
33%33%
30%29%29%
Figure 2Figure 2Figure 2Figure 2
2. Dominate Market Drivers in the Atlantic Basin LNG Market
To be successful in a rapidly changing commodity market, it is important to understand the dominant market drivers and their effect on market direction. Billions of dollars will be invested every year into LNG and it will be a painful financial experience to misjudge these market drivers.
NA Regas Facilities Development
Regas Facility Announced in 2004 & 2005
Figure 3Figure 3Figure 3Figure 3
European Regas Facilities Development
Regas Facility Announced in 2004 and 2005
Figure 4Figure 4Figure 4Figure 4
This paper examines six markets drivers that are expected to dominate the Atlantic Basin market over the next five years.
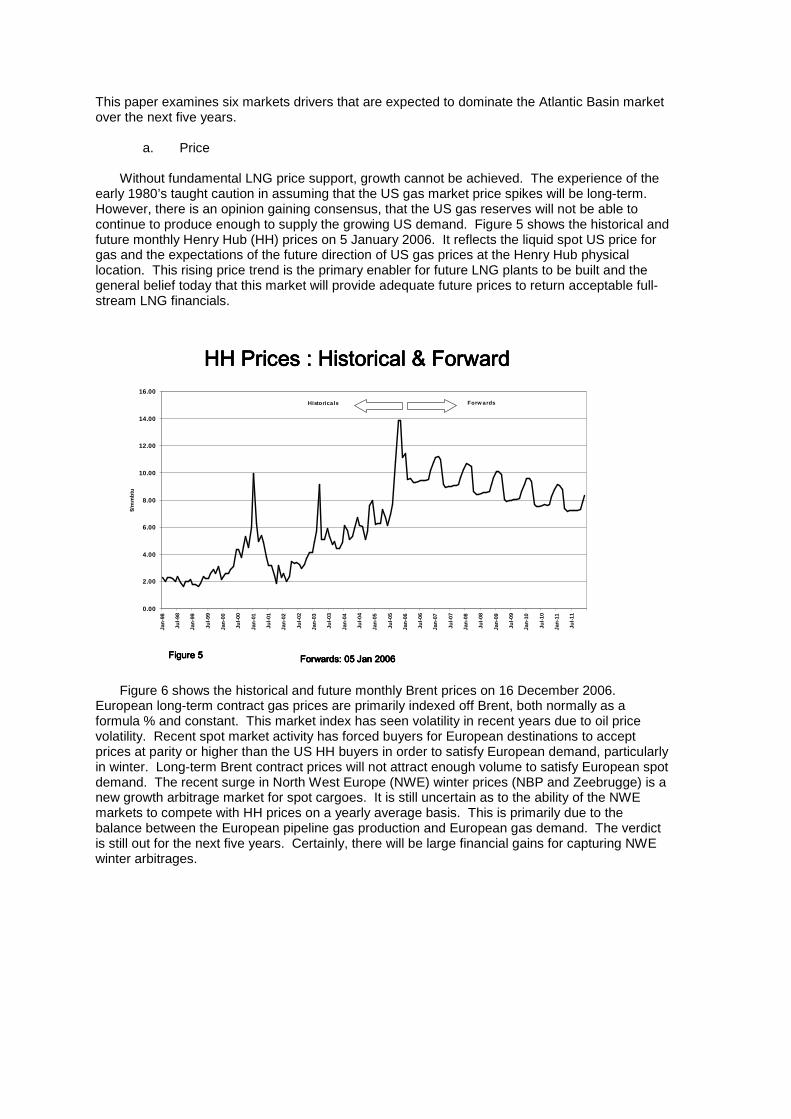
a. Price
Without fundamental LNG price support, growth cannot be achieved. The experience of the early 1980’s taught caution in assuming that the US gas market price spikes will be long-term. However, there is an opinion gaining consensus, that the US gas reserves will not be able to continue to produce enough to supply the growing US demand. Figure 5 shows the historical and future monthly Henry Hub (HH) prices on 5 January 2006. It reflects the liquid spot US price for gas and the expectations of the future direction of US gas prices at the Henry Hub physical location. This rising price trend is the primary enabler for future LNG plants to be built and the general belief today that this market will provide adequate future prices to return acceptable full-stream LNG financials.
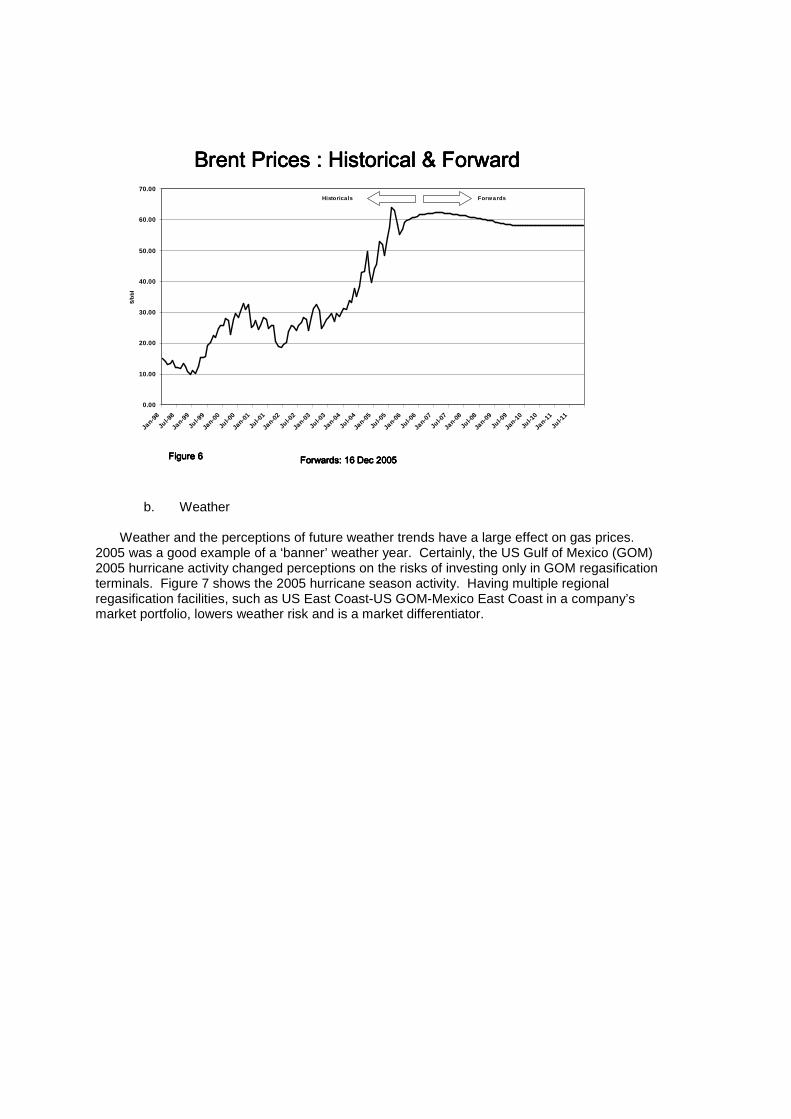
Figure 6 shows the historical and future monthly Brent prices on 16 December 2006. European long-term contract gas prices are primarily indexed off Brent, both normally as a formula % and constant. This market index has seen volatility in recent years due to oil price volatility. Recent spot market activity has forced buyers for European destinations to accept prices at parity or higher than the US HH buyers in order to satisfy European demand, particularly in winter. Long-term Brent contract prices will not attract enough volume to satisfy European spot demand. The recent surge in North West Europe (NWE) winter prices (NBP and Zeebrugge) is a new growth arbitrage market for spot cargoes. It is still uncertain as to the ability of the NWE markets to compete with HH prices on a yearly average basis. This is primarily due to the balance between the European pipeline gas production and European gas demand. The verdict is still out for the next five years. Certainly, there will be large financial gains for capturing NWE winter arbitrages.
HH Prices : Historical & ForwardHH Prices : Historical & ForwardHH Prices : Historical & ForwardHH Prices : Historical & Forward
0.00
2.00
4.00
6.00
8.00
10.00
12.00
14.00
16.00
Jan
-98
Jul-
98
Jan
-99
Jul-
99
Jan
-00
Jul-
00
Jan
-01
Jul-
01
Jan
-02
Jul-
02
Jan
-03
Jul-
03
Jan
-04
Jul-
04
Jan
-05
Jul-
05
Jan
-06
Jul-
06
Jan
-07
Jul-
07
Jan
-08
Jul-
08
Jan
-09
Jul-
09
Jan
-10
Jul-
10
Jan
-11
Jul-
11
$/m
mb
tu
Historicals Forw ards
Forwards: 05 Jan 2006Forwards: 05 Jan 2006Forwards: 05 Jan 2006Forwards: 05 Jan 2006Figure 5Figure 5Figure 5Figure 5
b. Weather
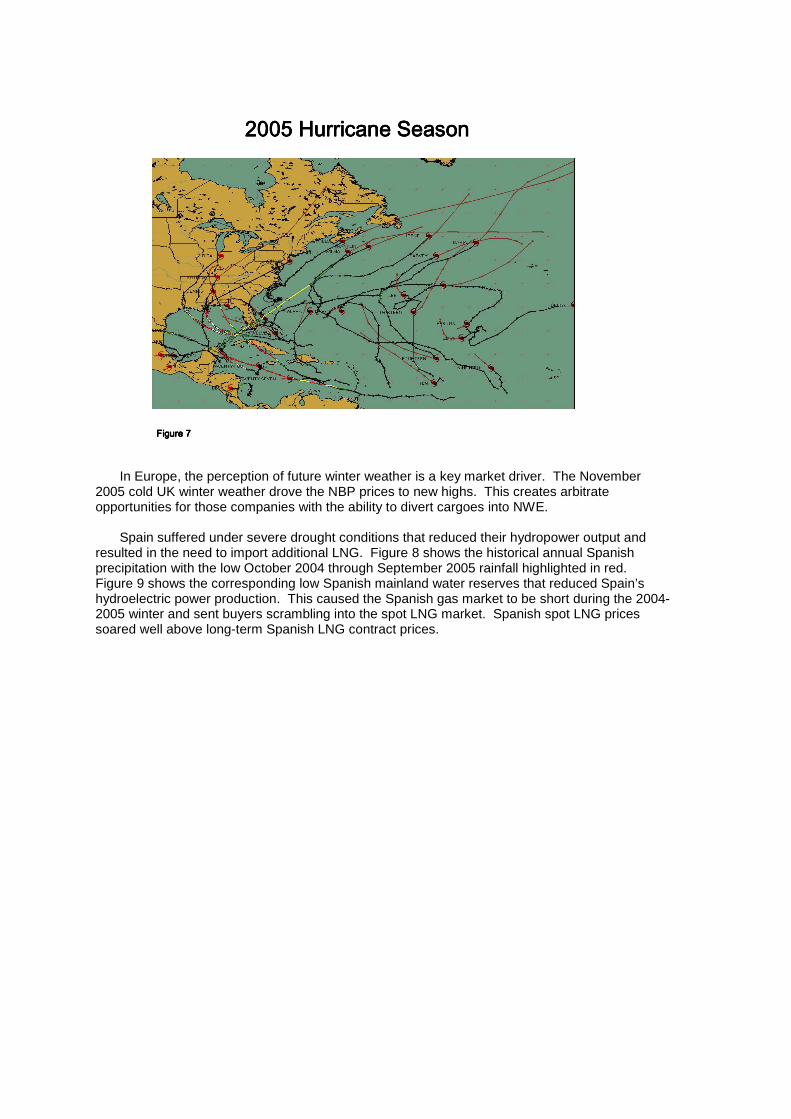
Weather and the perceptions of future weather trends have a large effect on gas prices.
2005 was a good example of a ‘banner’ weather year. Certainly, the US Gulf of Mexico (GOM) 2005 hurricane activity changed perceptions on the risks of investing only in GOM regasification terminals. Figure 7 shows the 2005 hurricane season activity. Having multiple regional regasification facilities, such as US East Coast-US GOM-Mexico East Coast in a company’s market portfolio, lowers weather risk and is a market differentiator.
Brent Prices : Historical & ForwardBrent Prices : Historical & ForwardBrent Prices : Historical & ForwardBrent Prices : Historical & Forward
0.00
10.00
20.00
30.00
40.00
50.00
60.00
70.00
Jan-9
8
Jul-9
8
Jan-9
9
Jul-9
9
Jan-0
0
Jul-0
0
Jan-0
1
Jul-0
1
Jan-0
2
Jul-0
2
Jan-0
3
Jul-0
3
Jan-0
4
Jul-0
4
Jan-0
5
Jul-0
5
Jan-0
6
Jul-0
6
Jan-0
7
Jul-0
7
Jan-0
8
Jul-0
8
Jan-0
9
Jul-0
9
Jan-1
0
Jul-1
0
Jan-1
1
Jul-1
1
$/b
bl
Historicals Forw ards
Forwards: 16 Dec 2005Forwards: 16 Dec 2005Forwards: 16 Dec 2005Forwards: 16 Dec 2005Figure 6Figure 6Figure 6Figure 6
In Europe, the perception of future winter weather is a key market driver. The November
2005 cold UK winter weather drove the NBP prices to new highs. This creates arbitrate opportunities for those companies with the ability to divert cargoes into NWE.
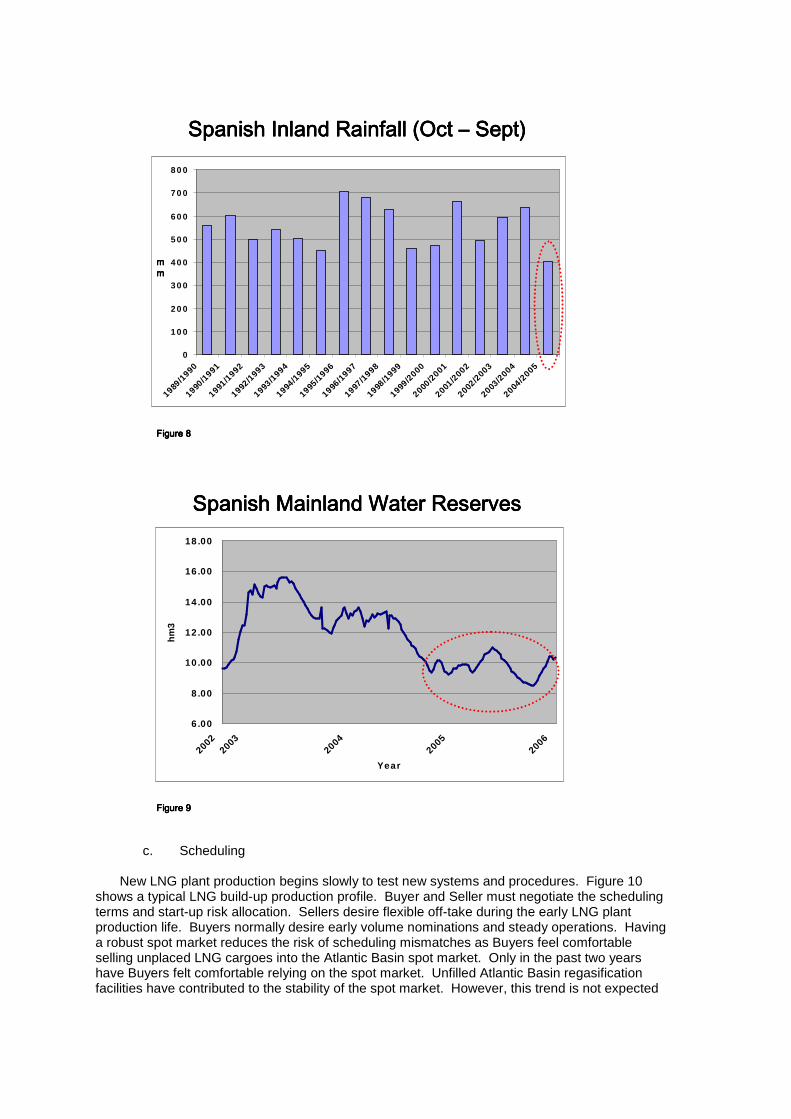
Spain suffered under severe drought conditions that reduced their hydropower output and resulted in the need to import additional LNG. Figure 8 shows the historical annual Spanish precipitation with the low October 2004 through September 2005 rainfall highlighted in red. Figure 9 shows the corresponding low Spanish mainland water reserves that reduced Spain’s hydroelectric power production. This caused the Spanish gas market to be short during the 2004-2005 winter and sent buyers scrambling into the spot LNG market. Spanish spot LNG prices soared well above long-term Spanish LNG contract prices.
2005 Hurricane Season2005 Hurricane Season2005 Hurricane Season2005 Hurricane Season
Figure 7Figure 7Figure 7Figure 7
c. Scheduling
New LNG plant production begins slowly to test new systems and procedures. Figure 10
shows a typical LNG build-up production profile. Buyer and Seller must negotiate the scheduling terms and start-up risk allocation. Sellers desire flexible off-take during the early LNG plant production life. Buyers normally desire early volume nominations and steady operations. Having a robust spot market reduces the risk of scheduling mismatches as Buyers feel comfortable selling unplaced LNG cargoes into the Atlantic Basin spot market. Only in the past two years have Buyers felt comfortable relying on the spot market. Unfilled Atlantic Basin regasification facilities have contributed to the stability of the spot market. However, this trend is not expected
Spanish Inland Rainfall (Oct Spanish Inland Rainfall (Oct Spanish Inland Rainfall (Oct Spanish Inland Rainfall (Oct –––– Sept)Sept)Sept)Sept)
0
1 0 0
2 0 0
3 0 0
4 0 0
5 0 0
6 0 0
7 0 0
8 0 0
1989/1
990
1990/1
991
1991/1
992
1992/1
993
1993/1
994
1994/1
995
1995/1
996
1996/1
997
1997/1
998
1998/1
999
1999/2
000
2000/2
001
2001/2
002
2002/2
003
2003/2
004
2004/2
005
mmmmmmmm
Figure 8Figure 8Figure 8Figure 8
Spanish Mainland Water ReservesSpanish Mainland Water ReservesSpanish Mainland Water ReservesSpanish Mainland Water Reserves
6 .00
8 .00
10 .00
12 .00
14 .00
16 .00
18 .00
20022003
20042005
2006
Year
hm
3
Figure 9Figure 9Figure 9Figure 9
Spanish Inland Rainfall (Oct Spanish Inland Rainfall (Oct Spanish Inland Rainfall (Oct Spanish Inland Rainfall (Oct –––– Sept)Sept)Sept)Sept)
0
1 0 0
2 0 0
3 0 0
4 0 0
5 0 0
6 0 0
7 0 0
8 0 0
1989/1
990
1990/1
991
1991/1
992
1992/1
993
1993/1
994
1994/1
995
1995/1
996
1996/1
997
1997/1
998
1998/1
999
1999/2
000
2000/2
001
2001/2
002
2002/2
003
2003/2
004
2004/2
005
mmmmmmmm
Figure 8Figure 8Figure 8Figure 8
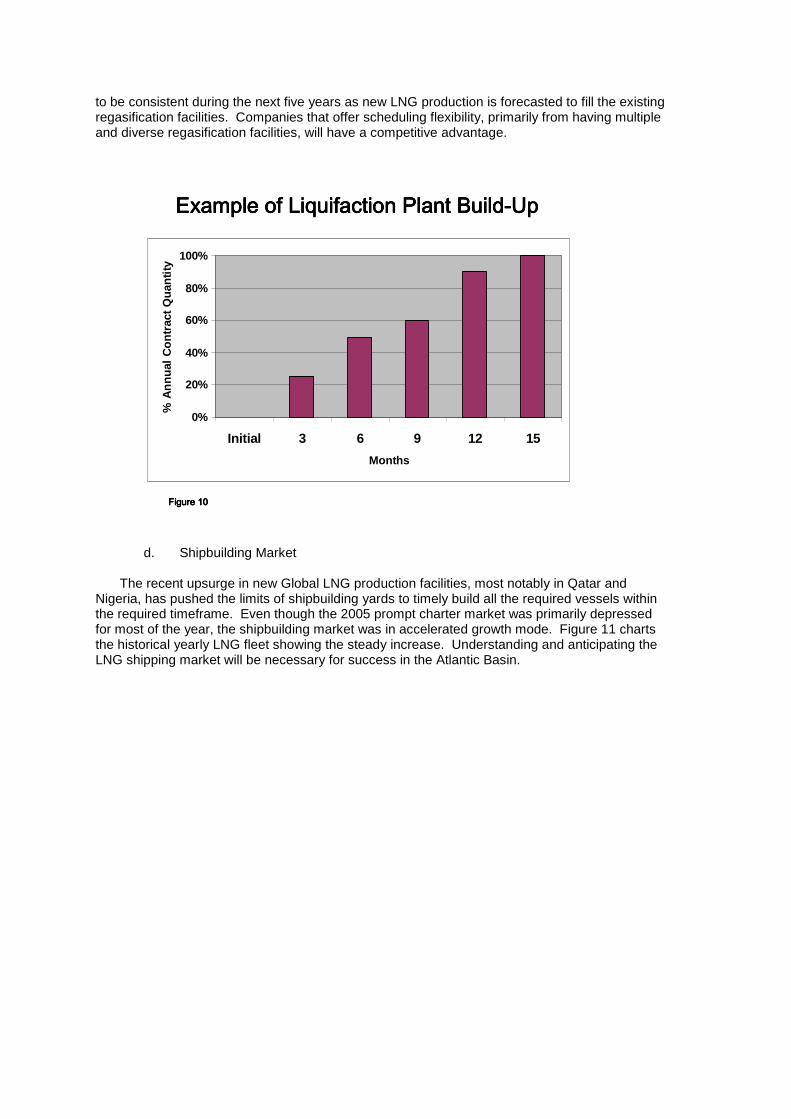
to be consistent during the next five years as new LNG production is forecasted to fill the existing regasification facilities. Companies that offer scheduling flexibility, primarily from having multiple and diverse regasification facilities, will have a competitive advantage.
d. Shipbuilding Market
The recent upsurge in new Global LNG production facilities, most notably in Qatar and
Nigeria, has pushed the limits of shipbuilding yards to timely build all the required vessels within the required timeframe. Even though the 2005 prompt charter market was primarily depressed for most of the year, the shipbuilding market was in accelerated growth mode. Figure 11 charts the historical yearly LNG fleet showing the steady increase. Understanding and anticipating the LNG shipping market will be necessary for success in the Atlantic Basin.
Example of Example of Example of Example of Liquifaction Liquifaction Liquifaction Liquifaction Plant BuildPlant BuildPlant BuildPlant Build----UpUpUpUp
Figure 10Figure 10Figure 10Figure 10
0%
20%
40%
60%
80%
100%
Initial 3 6 9 12 15
Months
% A
nn
ual
Co
ntr
act
Qu
anti
ty
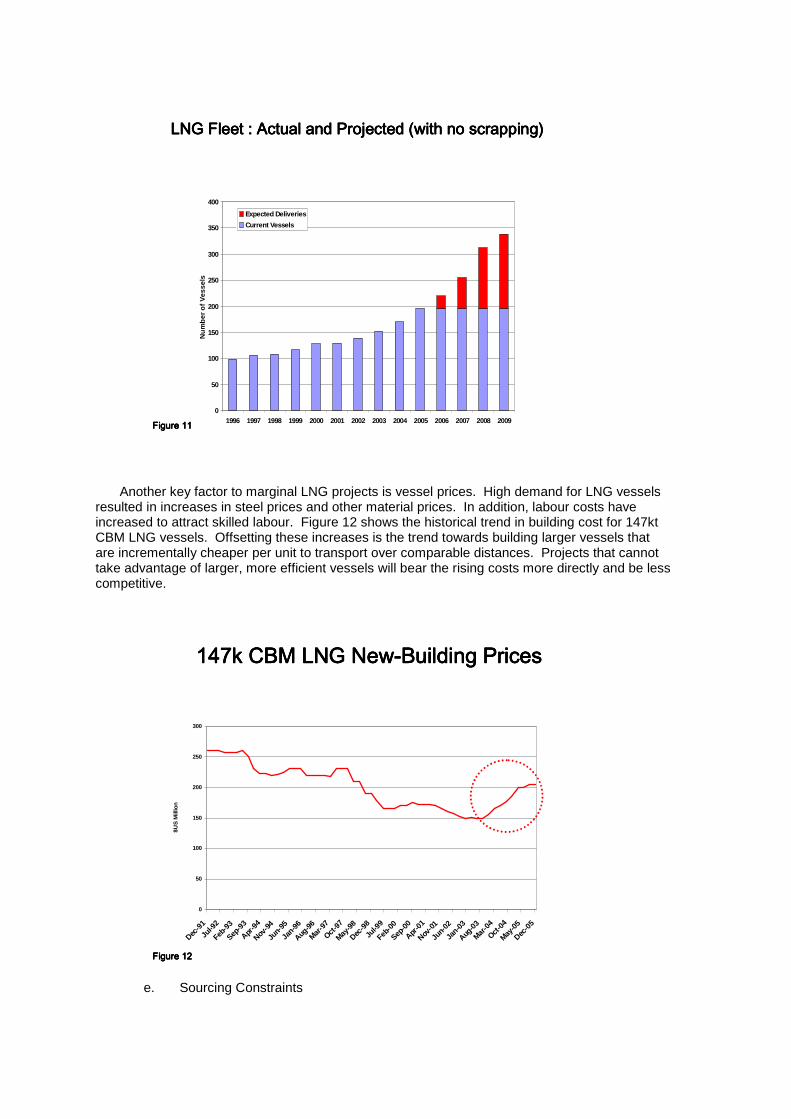
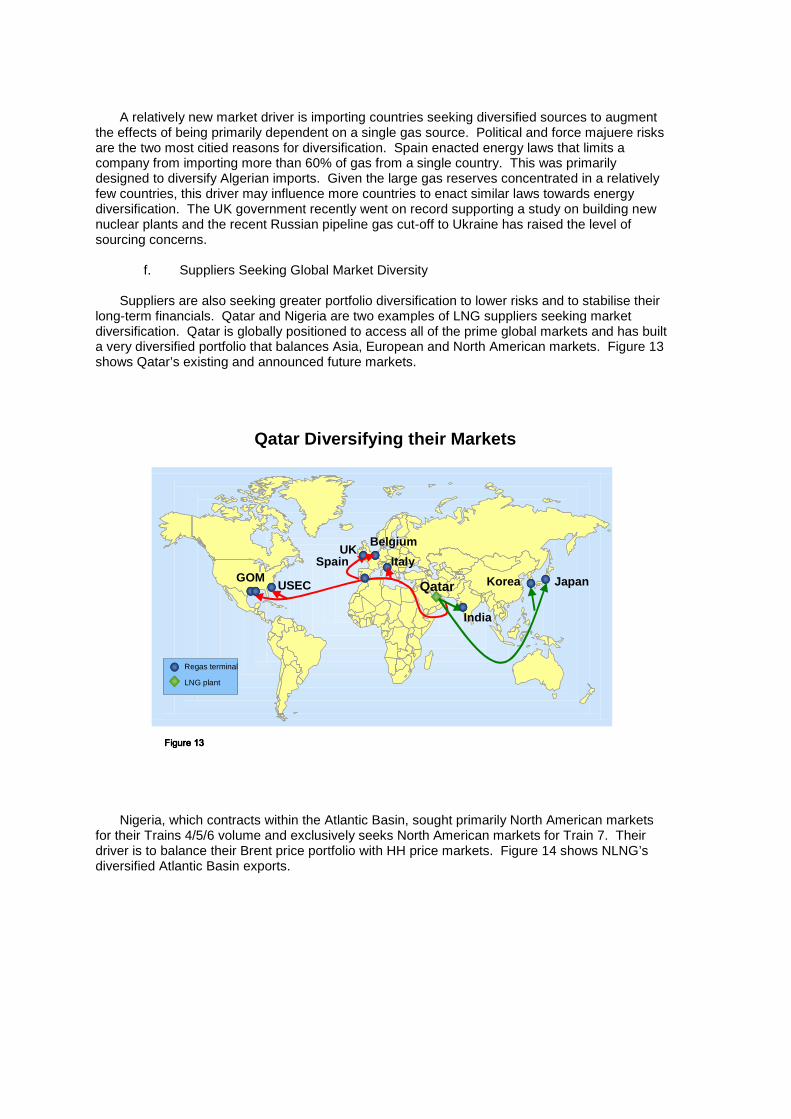
Another key factor to marginal LNG projects is vessel prices. High demand for LNG vessels
resulted in increases in steel prices and other material prices. In addition, labour costs have increased to attract skilled labour. Figure 12 shows the historical trend in building cost for 147kt CBM LNG vessels. Offsetting these increases is the trend towards building larger vessels that are incrementally cheaper per unit to transport over comparable distances. Projects that cannot take advantage of larger, more efficient vessels will bear the rising costs more directly and be less competitive.
e. Sourcing Constraints
LNG Fleet : Actual and Projected (with no scrapping)LNG Fleet : Actual and Projected (with no scrapping)LNG Fleet : Actual and Projected (with no scrapping)LNG Fleet : Actual and Projected (with no scrapping)
Figure 11Figure 11Figure 11Figure 110
50
100
150
200
250
300
350
400
1996 1997 1998 1999 2000 2001 2002 2003 2004 2005 2006 2007 2008 2009
Nu
mb
er o
f V
esse
ls
Expected Deliveries
Current Vessels
147k CBM LNG New147k CBM LNG New147k CBM LNG New147k CBM LNG New----Building PricesBuilding PricesBuilding PricesBuilding Prices
0
50
100
150
200
250
300
Dec-9
1
Jul-9
2
Feb-9
3
Sep-9
3
Apr-9
4
Nov-9
4
Jun-
95
Jan-9
6
Aug-9
6
Mar-9
7
Oct-9
7
May-9
8
Dec-9
8
Jul-9
9
Feb-0
0
Sep-0
0
Apr-0
1
Nov-0
1
Jun-
02
Jan-0
3
Aug-0
3
Mar-0
4
Oct-0
4
May-0
5
Dec-0
5
$US
Mill
ion
Figure 12Figure 12Figure 12Figure 12
A relatively new market driver is importing countries seeking diversified sources to augment
the effects of being primarily dependent on a single gas source. Political and force majuere risks are the two most citied reasons for diversification. Spain enacted energy laws that limits a company from importing more than 60% of gas from a single country. This was primarily designed to diversify Algerian imports. Given the large gas reserves concentrated in a relatively few countries, this driver may influence more countries to enact similar laws towards energy diversification. The UK government recently went on record supporting a study on building new nuclear plants and the recent Russian pipeline gas cut-off to Ukraine has raised the level of sourcing concerns.
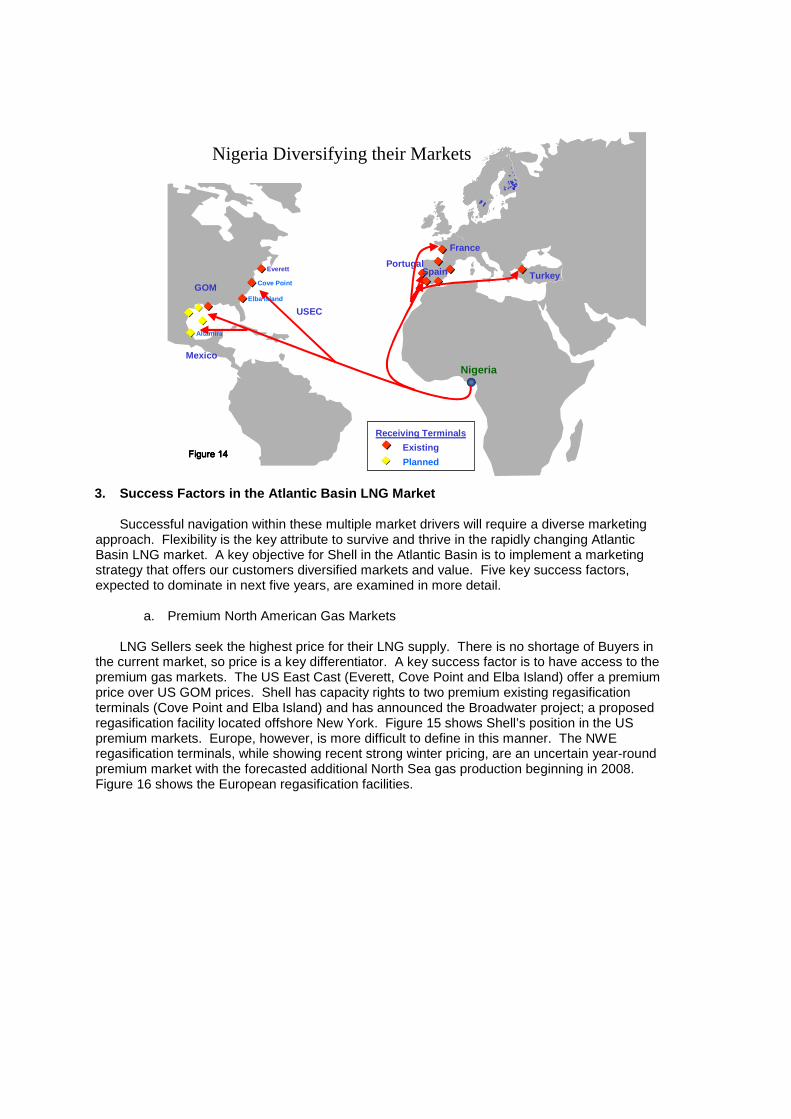
f. Suppliers Seeking Global Market Diversity
Suppliers are also seeking greater portfolio diversification to lower risks and to stabilise their long-term financials. Qatar and Nigeria are two examples of LNG suppliers seeking market diversification. Qatar is globally positioned to access all of the prime global markets and has built a very diversified portfolio that balances Asia, European and North American markets. Figure 13 shows Qatar’s existing and announced future markets.
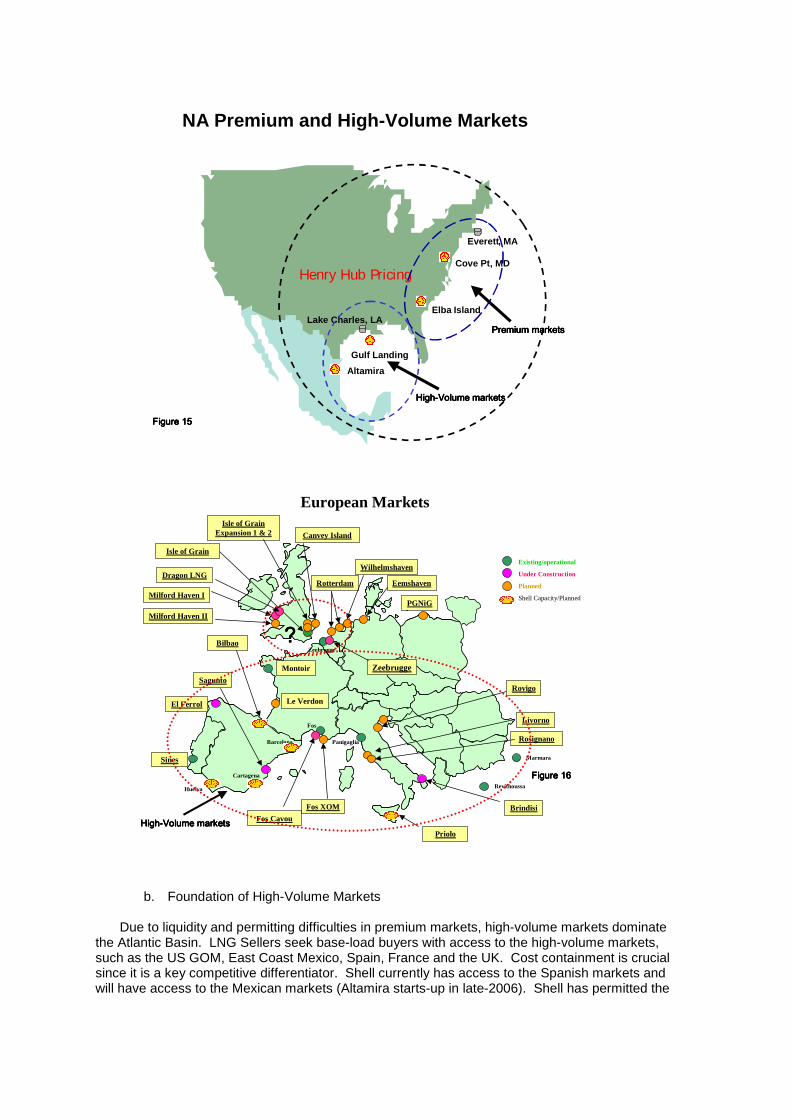
Nigeria, which contracts within the Atlantic Basin, sought primarily North American markets
for their Trains 4/5/6 volume and exclusively seeks North American markets for Train 7. Their driver is to balance their Brent price portfolio with HH price markets. Figure 14 shows NLNG’s diversified Atlantic Basin exports.
Qatar Diversifying their Markets
Qatar Japan
UKSpain
LNG plant
Regas terminal
Korea
Italy
USECGOM
Belgium
India
Figure 13Figure 13Figure 13Figure 13
3. Success Factors in the Atlantic Basin LNG Market Successful navigation within these multiple market drivers will require a diverse marketing
approach. Flexibility is the key attribute to survive and thrive in the rapidly changing Atlantic Basin LNG market. A key objective for Shell in the Atlantic Basin is to implement a marketing strategy that offers our customers diversified markets and value. Five key success factors, expected to dominate in next five years, are examined in more detail.
a. Premium North American Gas Markets
LNG Sellers seek the highest price for their LNG supply. There is no shortage of Buyers in the current market, so price is a key differentiator. A key success factor is to have access to the premium gas markets. The US East Cast (Everett, Cove Point and Elba Island) offer a premium price over US GOM prices. Shell has capacity rights to two premium existing regasification terminals (Cove Point and Elba Island) and has announced the Broadwater project; a proposed regasification facility located offshore New York. Figure 15 shows Shell’s position in the US premium markets. Europe, however, is more difficult to define in this manner. The NWE regasification terminals, while showing recent strong winter pricing, are an uncertain year-round premium market with the forecasted additional North Sea gas production beginning in 2008. Figure 16 shows the European regasification facilities.
Receiving Terminals
Existing
Planned
Everett
Elba Island
Cove Point
Nigeria
Altamira
Nigeria Diversifying their Markets
SpainPortugal
France
Turkey
USEC
Mexico
GOM
Figure 14Figure 14Figure 14Figure 14
b. Foundation of High-Volume Markets
Due to liquidity and permitting difficulties in premium markets, high-volume markets dominate the Atlantic Basin. LNG Sellers seek base-load buyers with access to the high-volume markets, such as the US GOM, East Coast Mexico, Spain, France and the UK. Cost containment is crucial since it is a key competitive differentiator. Shell currently has access to the Spanish markets and will have access to the Mexican markets (Altamira starts-up in late-2006). Shell has permitted the
Everett, MA
Lake Charles, LA
Cove Pt, MD
Elba Island
Henry Hub Pricing
NA Premium and High-Volume Markets
Premium marketsPremium marketsPremium marketsPremium markets
HighHighHighHigh----Volume marketsVolume marketsVolume marketsVolume markets
Figure 15Figure 15Figure 15Figure 15
Altamira
Gulf Landing
European Markets
SaguntoRovigo
Brindisi
Bilbao
Milford Haven I
Isle of Grain
Milford Haven II
Sines
Livorno
Zeebrugge
Huelva
Cartagena
Montoir
Panigaglia
Le VerdonEl Ferrol
Barcelona
Fos
Revithoussa
Marmara
Fos XOM
Priolo
Fos Cavou
Zeebrugge
Rotterdam Eemshaven
PGNiG
Existing/operational
Under Construction
Planned
Shell Capacity/Planned
WilhelmshavenDragon LNG
Isle of Grain Expansion 1 & 2
Rosignano
Canvey Island
Figure 16Figure 16Figure 16Figure 16
HighHighHighHigh----Volume marketsVolume marketsVolume marketsVolume markets
????
Gulf Landing regasification facility in the US GOM and announced the Ionio regasification facility in Sicily. Figures 15 and 16 show Shell’s position in the high-volume markets.
c. Diversified Atlantic Basin LNG Supply
Success in the Atlantic Basin LNG market means diversity. A combination of premium markets and high-volume markets gives a company the ability to offer Sellers a portfolio of options. As stated earlier, suppliers seek companies that diversify their market portfolio. Given the rapidly changing LNG Atlantic Basin market, concentration on a single or few markets may quickly find companies with the wrong market choice. Broadly diversifying in all the key Atlantic Basin markets will result in a more stable (less-risky) portfolio position. Shell is established in both Europe and North America, having a strong portfolio presence in both the premium and high-volume markets.
d. Flexibility During LNG Project Life Cycle
Market diversification yields flexibility. The normal business model around LNG projects is point-to-point scheduling. This model allows for no market/production build-up periods, so regasification facilities normally remain at less than full capacity until the production build-up is completed. When problems occur at either the production or regasification facilities, Sellers and/or Buyers are forced into the spot market or shutdown. Having a flexible market portfolio allows Buyers to allocate volume to different markets during the early, uncertain build-up period and when problems occur. A good example of this is during the hurricane season. Offering a portfolio of US EC, GOM/Mexico and European markets and scheduling less volume to the GOM terminals during the peak GOM hurricane season lowers the hurricane risk. A single source GOM buyer cannot offer this flexibility.
e. Leveraging LNG with Pipeline Supply
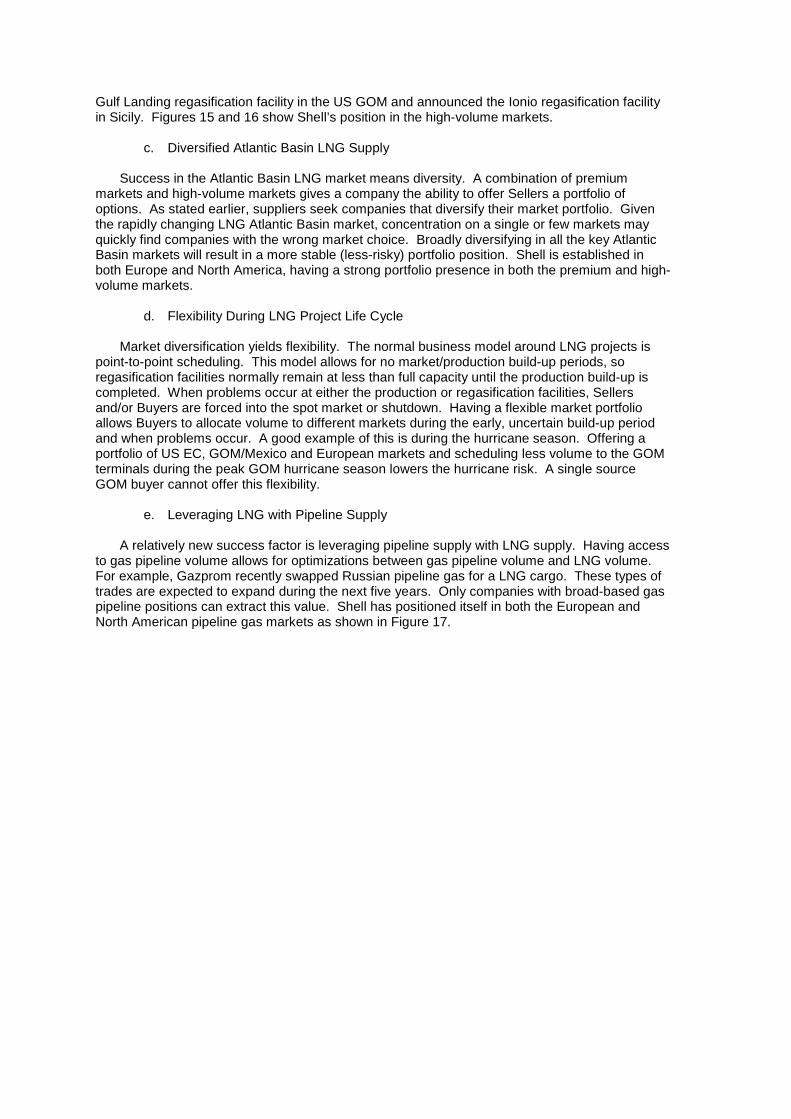
A relatively new success factor is leveraging pipeline supply with LNG supply. Having access to gas pipeline volume allows for optimizations between gas pipeline volume and LNG volume. For example, Gazprom recently swapped Russian pipeline gas for a LNG cargo. These types of trades are expected to expand during the next five years. Only companies with broad-based gas pipeline positions can extract this value. Shell has positioned itself in both the European and North American pipeline gas markets as shown in Figure 17.
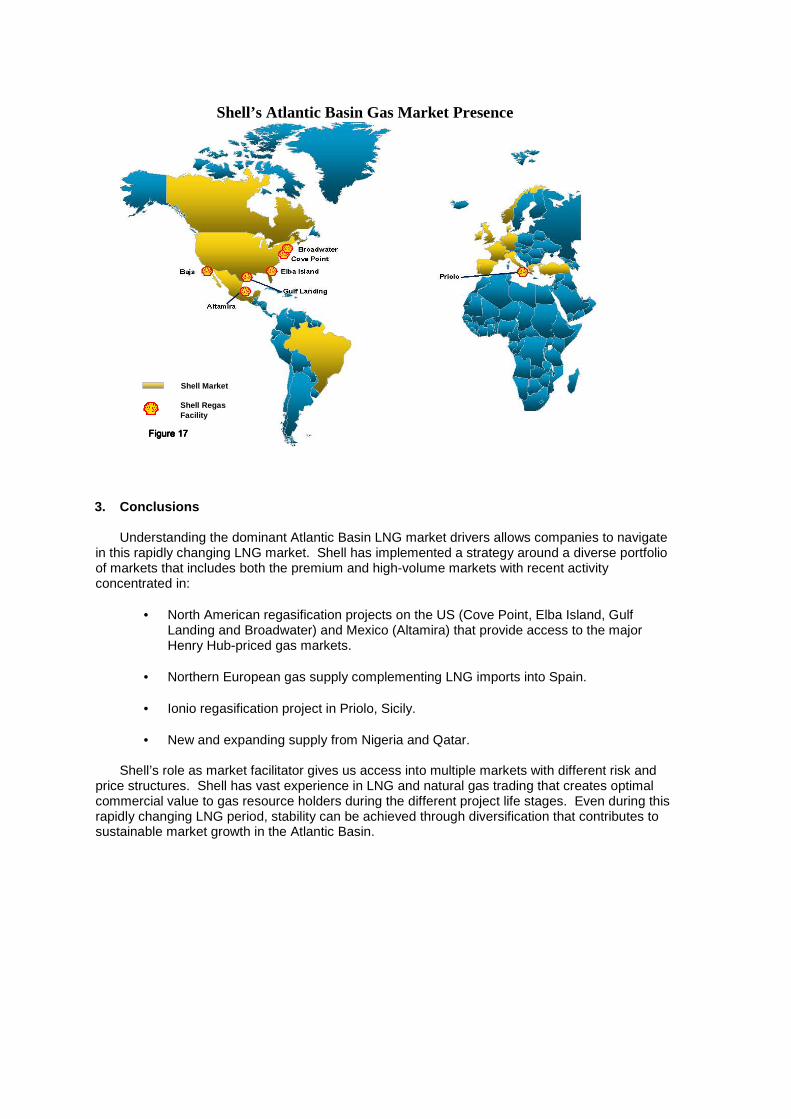
3. Conclusions
Understanding the dominant Atlantic Basin LNG market drivers allows companies to navigate in this rapidly changing LNG market. Shell has implemented a strategy around a diverse portfolio of markets that includes both the premium and high-volume markets with recent activity concentrated in:
• North American regasification projects on the US (Cove Point, Elba Island, Gulf Landing and Broadwater) and Mexico (Altamira) that provide access to the major Henry Hub-priced gas markets.
• Northern European gas supply complementing LNG imports into Spain. • Ionio regasification project in Priolo, Sicily. • New and expanding supply from Nigeria and Qatar.
Shell’s role as market facilitator gives us access into multiple markets with different risk and
price structures. Shell has vast experience in LNG and natural gas trading that creates optimal commercial value to gas resource holders during the different project life stages. Even during this rapidly changing LNG period, stability can be achieved through diversification that contributes to sustainable market growth in the Atlantic Basin.
Shell’s Atlantic Basin Gas Market Presence
Shell Market
Shell RegasFacility
Figure 17Figure 17Figure 17Figure 17