Embed Size (px)
Citation preview
Atlanta n Cleveland n Los Angeles n Miami n Washington, D.C.
Multi-Employer Plan Surveys and Actuarial Assumptions
2013 IBEW / NECA Employee Benefits Conference Session
January 31, 2013
Stan Goldfarb, F.S.A., E.A.Actuary and Managing Consultant
Horizon Actuarial Services, LLC

“Multi-Employer Plan Surveys & Actuarial Assumptions”January 31, 2013
2013 IBEW/NECA Employee Benefits Conference, Naples, FL
Presentation Contents
2
Page
I. Update on Trends In Mortality 2
II. Capital Market Assumptions Survey 12
III. Inventory of Multiemployer Construction Industry Pension Plans 17
X:\Associates\Goldfarb\TRAINING MATERIALS\PPPresentations\IBEW-NECA Presentation SG 1-31-2013.pptx

“Multi-Employer Plan Surveys & Actuarial Assumptions”January 31, 2013
2013 IBEW/NECA Employee Benefits Conference, Naples, FL
Update on Trends in Mortality
3

“Multi-Employer Plan Surveys & Actuarial Assumptions”January 31, 2013
2013 IBEW/NECA Employee Benefits Conference, Naples, FL
How Good is Your Mortality Assumption?
How has experience conformed over the last few years?
Should you reflect future mortality improvements? The actuarial standards require us to at least consider future mortality improvements
4
“Multi-Employer Plan Surveys & Actuarial Assumptions”January 31, 2013
2013 IBEW/NECA Employee Benefits Conference, Naples, FL
Obesity
5

“Multi-Employer Plan Surveys & Actuarial Assumptions”January 31, 2013
2013 IBEW/NECA Employee Benefits Conference, Naples, FL
Obesity - Mortality
Overweight and obesity increase the rate of mortality1
Lowest levels of mortality are associated with BMI of 22.5-25
Men with a BMI of 30 or more have a risk of death 1.61 times greater than those with a BMI of between 22.5 and 24.92
Research shows that overweight and obesity are responsible for1:
• 16% of mortality from ages 30 to 44
• 17% of mortality from ages 45 to 54
• 14% of mortality from ages 55 to 64
1. Obesity and its Relation to Mortality and Morbidity Costs; Behan, Cox
2. Body mass index and mortality among US male physicians; Annuls of Epidemiology; Ajani, Lotufo, Gaziano, Lee, Spelsberg, Buring, Willit, Manson
6

“Multi-Employer Plan Surveys & Actuarial Assumptions”January 31, 2013
2013 IBEW/NECA Employee Benefits Conference, Naples, FL
Obesity - Prevalence
* The epidemiology of obesity. Gastroenterology 132(6):2087-2102; Ogen, Yanoskim Carroll, Flegal
Survey Period Overweight (BMI>25)
Obese (BMI>30)
Extremely obese (BMI >40)
1960-1962 44.8% 13.3% 0.9%
1971-1974 47.2% 14.5% 1.3%
1976-1980 47.1% 15.0% 1.4%
1988-1994 55.8% 23.2% 3.0%
1999-2000 64.5% 30.9% 5.0%
2001-2002 65.7% 31.3% 5.4%
2003-2004 66.3% 32.9% 5.1%
7
“Multi-Employer Plan Surveys & Actuarial Assumptions”January 31, 2013
2013 IBEW/NECA Employee Benefits Conference, Naples, FL
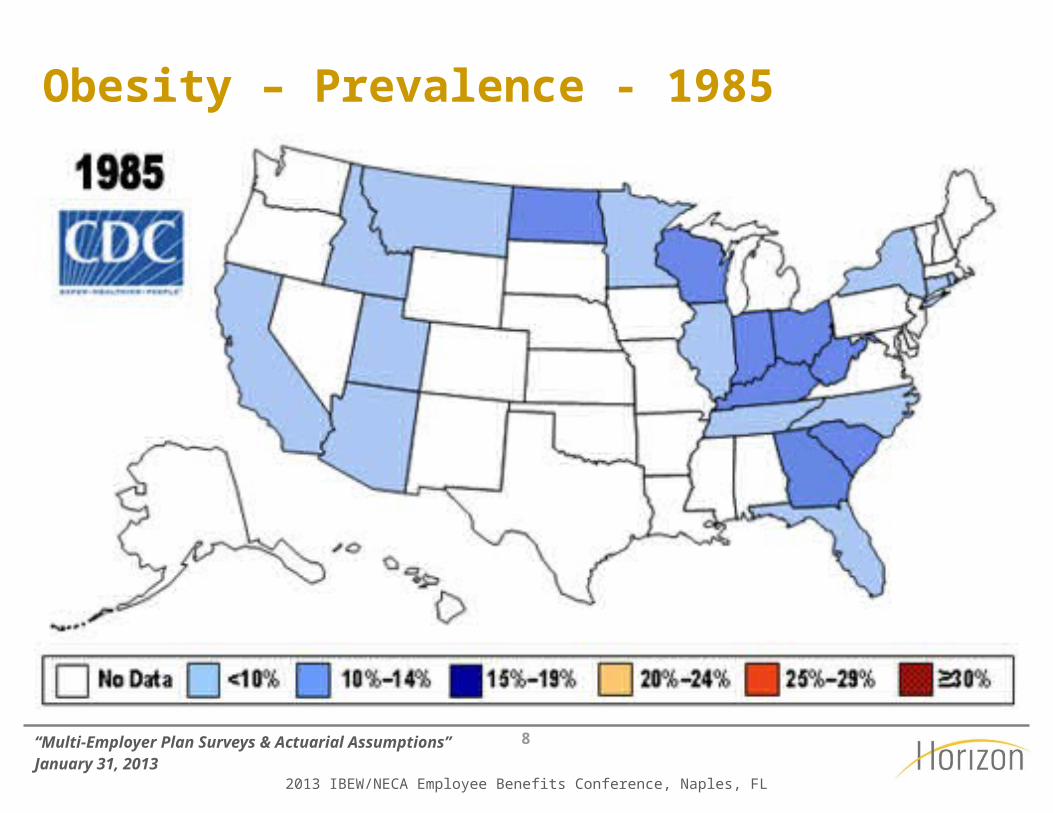
Obesity – Prevalence - 1985
8
“Multi-Employer Plan Surveys & Actuarial Assumptions”January 31, 2013
2013 IBEW/NECA Employee Benefits Conference, Naples, FL
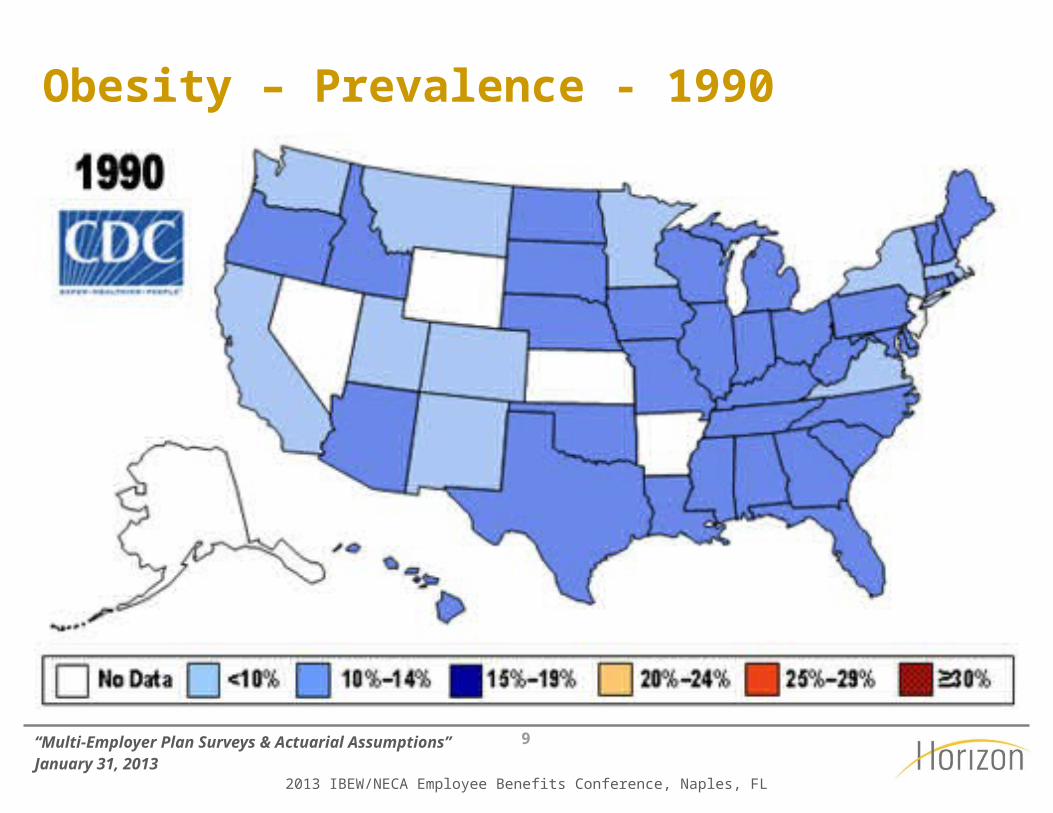
Obesity – Prevalence - 1990
9

“Multi-Employer Plan Surveys & Actuarial Assumptions”January 31, 2013
2013 IBEW/NECA Employee Benefits Conference, Naples, FL
Obesity – Prevalence - 2000
10

“Multi-Employer Plan Surveys & Actuarial Assumptions”January 31, 2013
2013 IBEW/NECA Employee Benefits Conference, Naples, FL
Obesity – Prevalence - 2005
11

“Multi-Employer Plan Surveys & Actuarial Assumptions”January 31, 2013
2013 IBEW/NECA Employee Benefits Conference, Naples, FL
Obesity – Prevalence - 2010
12

“Multi-Employer Plan Surveys & Actuarial Assumptions”January 31, 2013
2013 IBEW/NECA Employee Benefits Conference, Naples, FL
Capital Market Assumptions Survey
13

“Multi-Employer Plan Surveys & Actuarial Assumptions”January 31, 2013
2013 IBEW/NECA Employee Benefits Conference, Naples, FL
2012 Survey Overview
14
Horizon requested capital market assumptions from several different investment consulting firms.
2012 capital market assumptions requested: Expected returns (arithmetic) by asset class
Standard deviations of expected returns (arithmetic) by asset class
Correlation coefficient matrix
Commentary on investment horizon and whether expected returns are different for the short term versus the long term
Seventeen (17) investment consulting firms responded.
2012 Survey Respondents
1. Callan Associates
2. CAPTRUST Financial Advisors
3. AJ Gallagher Fiduciary Advisors / Independent Fiduciary Services
4. Hewitt EnnisKnupp
5. Investment Performance Services, LLC
6. RV Kuhns & Associates
7. Marco Consulting Group
8. Marquette Associates
9. Meketa Investment Group
10. JP Morgan
11. Morgan Stanley / Graystone Consulting
12. New England Pension Consultants
13. Pension Consulting Alliance
14. The PFM Group
15. SEI
16. Towers Watson
17. Wurts & Associates
A full report on the survey can be found at www.horizonactuarial.com.

“Multi-Employer Plan Surveys & Actuarial Assumptions”January 31, 2013
2013 IBEW/NECA Employee Benefits Conference, Naples, FL
Expected Returns by Asset Class
15
The following chart shows the ranges of expected returns (arithmetic) for the different asset classes for the seventeen investment advisors who responded to the survey. There are considerable differences in different
advisors’ expected returns for some asset classes. As the saying goes, “reasonable people may differ.”
0% 2% 4% 6% 8% 10% 12% 14% 16%
US Equity - Large Cap [ 7.8% | 9.4% | 10.7% ]
US Equity - Small/Mid Cap [ 7.7% | 10.5% | 12.7% ]
International Equity - Developed [ 8.1% | 9.9% | 11.8% ]
International Equity - Emerging [ 9.8% | 12.6% | 14.8% ]
US Fixed Income - Investment [ 2.5% | 4.1% | 6.7% ]
US Fixed Income - High Yield [ 5.7% | 7.4% | 8.9% ]
International Fixed Income - Developed [ 2.6% | 3.8% | 5.3% ]
International Fixed Income - Emerging [ 6.4% | 7.2% | 10.7% ]
Treasuries (Cash Equivalents) [ 1.3% | 2.8% | 4.0% ]
TIPS (Inflation-Protected) [ 2.6% | 3.5% | 5.1% ]
Real Estate [ 6.3% | 7.6% | 9.1% ]
Hedge Funds [ 5.9% | 7.3% | 11.4% ]
Commodities [ 4.8% | 7.3% | 9.2% ]
Infrastructure [ 7.2% | 8.3% | 9.8% ]
Private Equity [ 10.6% | 12.9% | 15.4% ]
ASSET CLASS [ Minimum | Composite | Maximum ]
2012 Survey: Expected Returns by Asset Class
SOURCE: Horizon Actuarial survey of 2012 capital market assumptions from 17 independent investment advisors. Returns are ARITHMETIC.

“Multi-Employer Plan Surveys & Actuarial Assumptions”January 31, 2013
2013 IBEW/NECA Employee Benefits Conference, Naples, FL
2012 Survey Composite Capital Market Assumptions
16
The following are the composite capital market assumptions from the survey. Each survey respondent was given equal weight in determining the average assumptions.
Horizon Actuarial 2012 Survey of Capital Market AssumptionsComposite Assumptions
Correlation MatrixAsset Class E[R] StdDev 1 2 3 4 5 6 7 8 9 10 11 12 13 14 15
1 US Equity - Large Cap 9.37% 18.23% 1 1.00 0.86 0.80 0.68 0.19 0.62 0.07 0.51 0.03 0.02 0.33 0.58 0.25 0.55 0.762 US Equity - Small/Mid Cap 10.54% 23.01% 2 0.86 1.00 0.71 0.66 0.11 0.59 0.02 0.48 0.00 (0.02) 0.23 0.55 0.23 0.50 0.713 International Equity - Developed 9.89% 20.41% 3 0.80 0.71 1.00 0.72 0.13 0.55 0.25 0.45 0.00 0.04 0.29 0.58 0.32 0.55 0.674 International Equity - Emerging 12.61% 28.27% 4 0.68 0.66 0.72 1.00 0.05 0.54 0.10 0.59 (0.02) 0.06 0.23 0.58 0.36 0.54 0.595 US Fixed Income - Investment 4.13% 5.89% 5 0.19 0.11 0.13 0.05 1.00 0.34 0.49 0.44 0.23 0.65 0.05 0.15 0.06 0.19 0.046 US Fixed Income - High Yield 7.37% 12.28% 6 0.62 0.59 0.55 0.54 0.34 1.00 0.16 0.61 (0.00) 0.22 0.22 0.47 0.24 0.52 0.527 International Fixed Income - Developed 3.77% 7.28% 7 0.07 0.02 0.25 0.10 0.49 0.16 1.00 0.26 0.12 0.43 (0.04) 0.11 0.13 0.32 (0.01)8 International Fixed Income - Emerging 7.23% 13.21% 8 0.51 0.48 0.45 0.59 0.44 0.61 0.26 1.00 0.05 0.28 0.05 0.46 0.27 0.42 0.399 Treasuries (Cash Equivalents) 2.77% 1.89% 9 0.03 0.00 0.00 (0.02) 0.23 (0.00) 0.12 0.05 1.00 0.16 0.13 0.11 0.04 0.05 0.04
10 TIPS (Inflation-Protected) 3.49% 6.01% 10 0.02 (0.02) 0.04 0.06 0.65 0.22 0.43 0.28 0.16 1.00 0.06 0.15 0.28 0.22 (0.04)11 Real Estate 7.56% 11.73% 11 0.33 0.23 0.29 0.23 0.05 0.22 (0.04) 0.05 0.13 0.06 1.00 0.23 0.26 0.35 0.3812 Hedge Funds 7.25% 9.00% 12 0.58 0.55 0.58 0.58 0.15 0.47 0.11 0.46 0.11 0.15 0.23 1.00 0.37 0.48 0.5213 Commodities 7.29% 18.72% 13 0.25 0.23 0.32 0.36 0.06 0.24 0.13 0.27 0.04 0.28 0.26 0.37 1.00 0.37 0.2614 Infrastructure 8.29% 13.78% 14 0.55 0.50 0.55 0.54 0.19 0.52 0.32 0.42 0.05 0.22 0.35 0.48 0.37 1.00 0.5015 Private Equity 12.90% 25.14% 15 0.76 0.71 0.67 0.59 0.04 0.52 (0.01) 0.39 0.04 (0.04) 0.38 0.52 0.26 0.50 1.00
SOURCE: Horizon Actuarial survey of 2012 capital market assumptions from 17 independent investment advisors.

“Multi-Employer Plan Surveys & Actuarial Assumptions”January 31, 2013
2013 IBEW/NECA Employee Benefits Conference, Naples, FL
Expected Return: Hypothetical Pension Fund
17
This exhibit shows expected returns for a hypothetical multiemployer pension fund based on (1) the most conservative advisor’s assumptions, (2) the composite assumptions from the survey, and (3) the most optimistic
advisor’s assumptions. Expected geometric returns are projected over a 20-year period.
Hypothetical Multiemployer Pension Fund - 2012 SurveyExpected Return (Arithmetic) Conservative Survey Optimistic
Asset Class Weight Minimum Composite Maximum Advisor Composite AdvisorUS Equity - Large Cap 20.0% 7.8% 9.4% 10.7% 1-Year Arithmetic ReturnsUS Equity - Small/Mid Cap 10.0% 7.7% 10.5% 12.7% Expected Return 6.96% 7.92% 9.09%Non-US Equity - Developed 7.5% 8.1% 9.9% 11.8% Standard Deviation 11.23% 11.04% 10.83%Non-US Equity - Emerging 5.0% 9.8% 12.6% 14.8%US Fixed Income - Investment 10.0% 2.5% 4.1% 6.7% 20-Year Geometric ReturnsUS Fixed Income - High Yield 5.0% 5.7% 7.4% 8.9% 75th Percentile 8.02% 8.97% 10.14%Non-US Fixed Income - Developed 5.0% 2.6% 3.8% 5.3% 67th Percentile 7.41% 8.37% 9.55%Non-US Fixed Income - Emerging 2.5% 6.4% 7.2% 10.7% 50th Percentile 6.33% 7.31% 8.50%Treasuries (Cash Equivalents) 5.0% 1.3% 2.8% 4.0% 33rd Percentile 5.25% 6.24% 7.46%TIPS (Inflation-Protected) 5.0% 2.6% 3.5% 5.1% 25th Percentile 4.63% 5.64% 6.87%Real Estate 10.0% 6.3% 7.6% 9.1%Hedge Funds 5.0% 5.9% 7.3% 11.4% Probability of Exceeding 7.50% 32.0% 46.9% 66.1%Commodities 2.5% 4.8% 7.3% 9.2%Infrastructure 2.5% 7.2% 8.3% 9.8%Private Equity 5.0% 10.6% 12.9% 15.4%Inflation N/A 2.2% 2.7% 3.3%TOTAL PORTFOLIO 100.0%
Considerations and Limitations
- Target allocations may be approximated if certain asset classes are not included in the survey.
- Capital market assumptions are based on indexed returns and do not reflect anticipated alpha.
- Many investment advisors provided assumptions over a short time horizon (10 years or less).
- For advisors that provided both short term and long-term assumptions, long-term assumptions weregenerally higher by 100 to 200 basis points for fixed income investments.
SOURCE: Horizon Actuarial survey of 2012 capital market assumptions from 17 independent investment advisors.
4.5%5.0%5.5%6.0%6.5%7.0%7.5%8.0%8.5%9.0%9.5%
10.0%10.5%11.0%
Conservative Advisor
Composite Assumptions
Optimistic Advisor
75th percentile
50th percentile
25th percentile
20-Year Annualized (Geometric) Returns

“Multi-Employer Plan Surveys & Actuarial Assumptions”January 31, 2013
2013 IBEW/NECA Employee Benefits Conference, Naples, FL
Inventory of Multiemployer Construction Industry Pension Plans – 2012 Edition
18

“Multi-Employer Plan Surveys & Actuarial Assumptions”January 31, 2013
2013 IBEW/NECA Employee Benefits Conference, Naples, FL
19
Inventory of Multiemployer Construction Industry Pension Plans – 2012 Edition
Joint project between Horizon Actuarial and Mechanical Contractors Association of America
Purpose is to summarize trends in pension plans based on data from Form 5500’s filed with the IRS
Over 800 plans included in the inventory
10 years of historical data (2001-2010)
Results broken down by assets:
Large Plans – At least $500 million in assets
Medium Plans – Between $100-$500 million in assets
Small Plans – Under $100 million in assets
Full report available at www.horizonactuarial.com

“Multi-Employer Plan Surveys & Actuarial Assumptions”January 31, 2013
2013 IBEW/NECA Employee Benefits Conference, Naples, FL
20
Distribution of Plans by Asset Value (MVA)MCAA/HAS Construction Industry
Survey (Fig. 2.01)
44
186
155
143
118
97
35
25
13
3
- 50 100 150 200
Under $5M (5.4%)
$5M to $24M (22.7%)
$25M to $49M (18.9%)
$50M to $99M (17.5%)
$100M to $199M (14.4%)
$200M to $499M (11.8%)
$500M to $999M (4.3%)
$1.000B to $1.999B (3.1%)
$2.000B to $4.999B (1.6%)
At least $5.000B (0.4%)
Distribution of Plans by Asset Value
Source: 2009-2010 Form 5500 data
SAMPLE PLAN

“Multi-Employer Plan Surveys & Actuarial Assumptions”January 31, 2013
2013 IBEW/NECA Employee Benefits Conference, Naples, FL
21
Distribution of Plans by Participant CountMCAA/HAS Construction Industry
Survey (Fig. 2.02)
28
165
181
101
77
66
53
32
51
39
17
9
Under 100 (3.4%)
100 to 499 (20.1%)
500 to 999 (22.1%)
1,000 to 1,499 (12.3%)
1,500 to 1,999 (9.4%)
2,000 to 2,999 (8.1%)
3,000 to 3,999 (6.5%)
4,000 to 4,999 (3.9%)
5,000 to 9,999 (6.2%)
10,000 to 24,999 (4.8%)
25,000 to 49,999 (2.1%)
At least 50,000 (1.1%)
Distribution of Plans by Participants
Source: 2009-2010 Form 5500 data
SAMPLE PLAN

“Multi-Employer Plan Surveys & Actuarial Assumptions”January 31, 2013
2013 IBEW/NECA Employee Benefits Conference, Naples, FL
22
Maturity (Active/Inactive Participants)
2001 2002 2003 2004 2005 2006 2007 2008 2009 2010 2011
SAMPLE PLAN 0.82 0.82 0.84 0.86 0.87 0.93 0.96 0.91 0.76 0.67 0.68
MCAA/HAS Construction Industry Survey (Fig. 3.02)
0.000.501.001.502.002.503.003.504.00
2001 2002 2003 2004 2005 2006 2007 2008 2009 2010
724 789 788 785 793 794 801 754 801 574
3.47 3.56 2.98 2.68 2.69 2.46 2.54 2.37 2.14 1.90
1.74 1.63 1.52 1.43 1.36 1.34 1.32 1.27 1.14 1.06
1.19 1.16 1.10 1.02 0.99 0.98 0.97 0.93 0.82 0.74
0.83 0.78 0.75 0.72 0.69 0.67 0.68 0.66 0.58 0.51
0.42 0.40 0.37 0.36 0.33 0.34 0.34 0.33 0.28 0.25
Participant Ratio: Actives to Inactives (End of Plan Year)
Plan Year Beginning
Number of Plans
95th Percentile
75th Percentile
50th Percentile
25th Percentile
5th Percentile
Source: Form 5500 DataAll Construction Industry Plans
Construction Industry Plans

“Multi-Employer Plan Surveys & Actuarial Assumptions”January 31, 2013
2013 IBEW/NECA Employee Benefits Conference, Naples, FL
23
Cash Flow as a Percentage of Plan AssetsMCAA/HAS Construction Industry Survey (Fig. 4.02)
2001 2002 2003 2004 2005 2006 2007 2008 2009 2010 2011
SAMPLE PLAN (3.3) (3.3) (3.6) (1.9) (0.5) 0.3 (0.3) (0.9) (2.7) (3.1) (2.8)
-12.00-10.00
-8.00-6.00-4.00-2.000.002.004.006.00
2001 2002 2003 2004 2005 2006 2007 2008 2009 2010
693 763 746 737 764 773 777 724 780 555
4.1 4.2 4.3 3.3 3.4 3.8 4.5 4.3 4.2 4.1
0.4 (0.0) (0.4) (0.6) (0.5) (0.2) 0.1 0.0 (0.8) (1.0)
(1.9) (2.3) (2.8) (2.7) (2.6) (2.4) (1.9) (2.1) (3.6) (3.6)
(3.9) (4.5) (5.2) (4.8) (4.7) (4.3) (3.9) (4.2) (6.3) (5.9)
(6.5) (7.1) (8.0) (7.5) (7.4) (7.3) (6.8) (7.3) (10.9) (9.5)
Cash Flow as a Percentage of Assets
Plan Year Beginning
Number of Plans
95th Percentile
75th Percentile
50th Percentile
25th Percentile
5th Percentile
Source: Form 5500 DataAll Construction Industry Plans
Construction Industry Plans

“Multi-Employer Plan Surveys & Actuarial Assumptions”January 31, 2013
2013 IBEW/NECA Employee Benefits Conference, Naples, FL
24
Net Investment ReturnsMCAA/HAS Construction Industry Survey (Fig. 5.01)
-30%
-20%
-10%
0%
10%
20%
30%
2001 2002 2003 2004 2005 2006 2007 2008 2009 2010
320 370 370 349 367 376 378 375 382 377
4.5% 1.3% 23.8% 12.8% 9.0% 14.8% 10.1% -6.2% 25.2% 14.4%
0.8% -5.0% 19.2% 10.2% 6.9% 12.5% 8.0% -19.9% 20.3% 12.7%
-1.6% -7.8% 16.7% 8.5% 5.7% 10.9% 6.7% -23.0% 16.2% 11.5%
-3.8% -10.3% 13.9% 6.8% 4.5% 9.5% 5.6% -25.8% 12.6% 9.9%
-7.9% -14.4% 7.1% 4.0% 2.7% 6.0% 3.4% -29.2% 6.7% 7.1%
Net Investment Returns
Plan Year Beginning
Number of Plans
95th Percentile
75th Percentile
50th Percentile
25th Percentile
5th Percentile
Source: Form 5500 DataCALENDAR YEAR PLANS ONLY
Construction Industry Plans
2001 2002 2003 2004 2005 2006 2007 2008 2009 2010 2011
SAMPLE PLAN (1.6%) (9.7%) 14.7% 7.1% 9.2% 14.0% 9.3% (17.2%) 11.5% 10.4% (1.5%)

“Multi-Employer Plan Surveys & Actuarial Assumptions”January 31, 2013
2013 IBEW/NECA Employee Benefits Conference, Naples, FL
25
Net Investment Return Assumption
92321221712
15537
36339
8014
0 200 400
Not Available5.50% or less (0.4%)
5.75% per year (0.3%)6.00% per year (1.7%)6.25% per year (0.3%)6.50% per year (2.3%)6.75% per year (1.7%)
7.00% per year (21.3%)7.25% per year (5.1%)
7.50% per year (49.9%)7.75% per year (5.4%)
8.00% per year (11.0%)8.25% per year (0.1%)8.50% or more (0.6%)
Investment Return Assumption
Source: 2009-2010 Form 5500 data
All Construction Industry Plans
MCAA/HAS Construction Industry Survey (Fig. 5.03)
SAMPLE PLAN

“Multi-Employer Plan Surveys & Actuarial Assumptions”January 31, 2013
2013 IBEW/NECA Employee Benefits Conference, Naples, FL
26
MVA Funded StatusMCAA/HAS Construction Industry Survey (Fig. 6.01)
2001 2002 2003 2004 2005 2006 2007 2008 2009 2010 2011
SAMPLE PLAN 0.91 0.77 0.83 0.85 0.91 0.97 1.03 0.79 0.84 0.87 0.81
0.400.500.600.700.800.901.001.101.201.30
2001 2002 2003 2004 2005 2006 2007 2008 2009 2010
280 334 331 332 352 362 363 357 366 323
1.11 0.98 1.04 1.14 1.15 1.23 1.24 0.95 1.03 1.07
0.93 0.80 0.89 0.93 0.92 0.97 0.98 0.76 0.85 0.88
0.85 0.73 0.80 0.82 0.82 0.86 0.87 0.68 0.76 0.80
0.77 0.65 0.71 0.73 0.73 0.77 0.79 0.61 0.67 0.71
0.63 0.50 0.56 0.57 0.56 0.59 0.63 0.42 0.47 0.50
End of Year Funded Percentage (Market Value)
Plan Year Beginning
Number of Plans
95th Percentile
75th Percentile
50th Percentile
25th Percentile
5th Percentile
Source: Form 5500 DataCALENDAR YEAR PLANS ONLY
Construction Industry Plans

“Multi-Employer Plan Surveys & Actuarial Assumptions”January 31, 2013
2013 IBEW/NECA Employee Benefits Conference, Naples, FL
27
Election of 2010 PRA Funding Relief
Funding Relief Elections (Estimated) Construction Industry Plans PPA Status: 2009 Plan Year
All Plans
Elected Relief
% Elected Relief
“Green Zone” 166 83 50.0%
Endangered 127 85 66.9%
Seriously End. 41 28 68.3%
Critical 122 90 73.8%
TOTAL 456 286 62.7%
Funding Relief Elections HAS Pension DatabasePPA Status: 2009 Plan Year
All Plans
Elected Relief
% Elected Relief
"Green Zone" 25 22 88.0%
Endangered 12 9 75.0%
Seriously End. 10 9 90.0%
Critical 15 10 66.7%
TOTAL 62 50 80.6%
MCAA/HAS Construction Industry Survey (Fig. 6.04)
HAS Pension Database

“Multi-Employer Plan Surveys & Actuarial Assumptions”January 31, 2013
2013 IBEW/NECA Employee Benefits Conference, Naples, FL
28
Normal Cost per Active ParticipantMCAA/HAS Construction Industry Survey (Fig. 7.01)
2001 2002 2003 2004 2005 2006 2007 2008 2009 2010 2011
SAMPLE PLAN 2,089 2,452 2,687 2,403 2,834 2,663 2,660 2,777 2,565 2,564 2,553
01,0002,0003,0004,0005,0006,0007,0008,000
2001 2002 2003 2004 2005 2006 2007 2008 2009 2010
253 302 308 300 312 320 334 288 295 301
4,372 4,458 5,250 4,607 4,660 4,679 5,903 5,551 6,732 6,184
2,690 2,890 2,893 2,854 2,808 2,963 3,251 3,330 3,630 3,382
1,944 2,007 1,985 2,059 2,038 2,032 2,169 2,267 2,554 2,261
1,301 1,342 1,332 1,347 1,314 1,305 1,423 1,438 1,590 1,453
655 556 573 555 495 545 625 570 594 558
Normal Cost of Benefits (Per Active Participant)
Plan Year Beginning
Number of Plans
95th Percentile
75th Percentile
50th Percentile
25th Percentile
5th Percentile
Source: Form 5500 DataCALENDAR YEAR PLANS ONLY
Construction Industry Plans

“Multi-Employer Plan Surveys & Actuarial Assumptions”January 31, 2013
2013 IBEW/NECA Employee Benefits Conference, Naples, FL
29
15-Year Amortization of Unfunded Liabilities per Active ParticipantMCAA/HAS Construction Industry Survey (Fig. 7.03)
02,0004,0006,0008,000
10,00012,00014,00016,000
2001 2002 2003 2004 2005 2006 2007 2008 2009 2010
278 326 335 327 355 362 363 359 366 323
4,286 5,764 8,477 9,318 11,013 9,629 8,380 8,243 14,401 12,760
2,109 3,119 5,061 4,300 4,413 4,492 3,686 3,040 7,821 7,035
814 1,809 3,359 2,390 2,337 2,437 1,844 1,239 4,556 4,206
- 687 1,684 1,155 969 864 438 4 2,436 1,855
- - 72 - - - - - 318 5
15-Year Amortization of Unfunded Liabilities (Per Active Participant)
Plan Year Beginning
Number of Plans
95th Percentile
75th Percentile
50th Percentile
25th Percentile
5th Percentile
Source: Form 5500 DataCALENDAR YEAR PLANS ONLY
Construction Industry Plans
2001 2002 2003 2004 2005 2006 2007 2008 2009 2010 2011
SAMPLE PLAN 2,087 2,609 4,338 3,295 3,632 2,915 2,059 1,568 4,291 4,423 3,930

“Multi-Employer Plan Surveys & Actuarial Assumptions”January 31, 2013
2013 IBEW/NECA Employee Benefits Conference, Naples, FL
30
Employer Contributions in Prior Year per Active ParticipantMCAA/HAS Construction Industry Survey (Fig. 7.04)
2001 2002 2003 2004 2005 2006 2007 2008 2009 2010 2011
SAMPLE PLAN 5,850 5,736 5,992 6,627 7,128 7,350 6,834 6,376 5,604 6,250 7,443
02,0004,0006,0008,000
10,00012,00014,00016,00018,00020,000
2001 2002 2003 2004 2005 2006 2007 2008 2009 2010
315 364 360 344 362 370 372 369 378 372
9,812 9,530 10,317 10,794 12,000 13,846 15,806 16,843 16,305 18,044
5,768 5,792 5,899 6,230 6,751 7,704 8,581 9,449 8,812 9,422
4,030 4,133 4,198 4,579 4,886 5,703 6,189 6,383 6,065 6,556
2,671 2,491 2,637 2,883 2,859 3,344 3,793 3,897 3,703 3,947
865 1,071 1,086 1,108 1,182 1,487 1,488 1,772 1,513 1,973
Employer Contributions (Per Active Participant)
Plan Year Beginning
Number of Plans
95th Percentile
75th Percentile
50th Percentile
25th Percentile
5th Percentile
Source: Form 5500 DataCALENDAR YEAR PLANS ONLY
Construction Industry Plans

“Multi-Employer Plan Surveys & Actuarial Assumptions”January 31, 2013
2013 IBEW/NECA Employee Benefits Conference, Naples, FL
31
Contributions vs. Cost per Active ParticipantMCAA/HAS Construction Industry Survey (Fig. 7.05)
2001 2002 2003 2004 2005 2006 2007 2008 2009 2010 2011
SAMPLE PLAN 1,674 675 (1,033) 929 662 1,772 2,115 2,031 (1,252) (737) 960
-15,000
-10,000
-5,000
0
5,000
10,000
2001 2002 2003 2004 2005 2006 2007 2008 2009 2010
246 299 298 287 305 315 328 283 302 306
4,130 3,119 1,471 2,265 2,596 3,173 5,052 7,535 2,804 5,004
1,193 307 (571) 156 554 1,108 2,050 3,438 (416) 901
394 (408) (1,664) (756) (206) 189 970 1,740 (2,246) (968)
(366) (1,481) (3,254) (1,957) (1,558) (904) (145) 402 (4,428) (2,928)
(1,943) (3,489) (6,083) (5,550) (6,774) (4,314) (2,481) (1,945) (10,967) (8,318)
Contributions vs. Costs (Per Active Participant)
Plan Year Beginning
Number of Plans
95th Percentile
75th Percentile
50th Percentile
25th Percentile
5th Percentile
Source: Form 5500 DataCALENDAR YEAR PLANS ONLY
Construction Industry Plans