Embed Size (px)
Citation preview

~ATI.)S;FOREIG:N AGRICULTUR,A{ TRADE',OF ·THE.' UNIT'~D S~ATES, ;1.974 FJ!:BRUA!)¥. washi~gto'n, .Dt.~ USD"/~"TUS Economic Res..earch SE;!rv.i.ce_;~ ~ . FEB .14

' . 0 :~ IIIII 2.8. 1111I 2.5
lilli~ 1:= B~ iP:~ Wu.: 13 . 6
1\\\\ 1.1 ~..:: I~ 2.0
\ ,
\\\\\~ \\\\\ 1.4 \ .6

FEBRUARY 1974
I
FOREIGN AGRICULTURAL TRADE OF THE UNITED STATES
u.s. Farm Exports Rocketed to a Record $17.7 Billion in 1973
u.s. Agricultural Imports in 1973 Reached a Record $8.4 Billion
Export Fact Sheet
Trade Statistics, July- Dece mber
ECONOMIC RESEARCH SERVICE • u.S. DEPARTMENT OF AGRICULTURE

• • • • • • • • • • • • • • • • • • • • • • • • • • • • • • • • • • • • •
CONTENTS
Special in this issue:
Index of Articles, January-December 1973 .•..••••.••••••••••••••••.•••• 5
U.S. Farm Exports Rocketed to a R~cord $17.7 Billion j,n 1973 •.•••••••• 8
U.S. Agricultural Imports in 1973 Reached a Record $8.4 Billion ••••••• 24
Export Fact Sheet ••••.•••••••.•.••••••.•••••••.••••••.••..•.••••••••..•• 34
International Price Highlights .••• 0 38
Export Highlights, July-December ........................................ 43Import Highlights, July-December
III ••••••• ~ ••••••••••••••••••••••••••••••• 53
U.S. agricultural trade data for December and July-December: U.S. imports: Quantity and value by commodity •••••.•••••••••••••••••• 56 U.S. exports: Quantity and value by commodity .•••••••..•.•••••••••••• 61 U.S. exports and imports: Value by country •••••••••.•.••••.••••••••.• 65
Quantity indexes; by commodity groups, July-December: Exports ........................... It ...................................... . 67 Imports •••••••.•.•.••••••••••.••••••••.•.•.•••••••.•., •••..•••••••••••• 68
Explanatory Note ••.•.•.•••••.•••.••••••..••••••••.••.••••••••••••••.•••• 69
Principal Coordinators Glenn R. Samson Dewain H. Rahe
Thomas A. Warden
(202) 4~4.7-8474
Statistics Program Area Foreign Demand and Competition DiVision
Economic R~search Service
-2

fOREIGN AGRICULTURAL TRADE OF THE UNITED STATES
Digest esseaEZZ2e8Eeee!eEeEgeeZ!8EE:EEEEES2e~~ee2eeE!EEeEZEZZEEEEEEszsszzeE8szeEEEEseSi
u.s. ~ 1£!:ports Rocketed !.2.!!. Ra;;ord .$17.7 Billion in 1:.2Zl (see E..-1!). U.S. agricultural exports in 1973 totaled $17.7 bi11ion--an alltime calendar year high and 88 percent above the $9.4 billion worth exported in 1972.
A sharp advance in exports of grains, particularly wheat and feed grains, accounted for three-fifths of the total increase in agricultural exports in 1973. But increases for soybeans, protein meal, tobacco, cotton, fruits, nuts, vegetables, meats, cattle hides, and poultry meats were also important.
Volume of agricultural exports gained by 30 percent in 1973, accounting for about twofifths of the value increase. Exports to all majc)r markets b.creased significantly. Shipments to traditional markets, such as Western Europe and Japan, grew at a phenomenal rate because of increased consumption and limited supplies in other major exporting countries. Increased exports to the USSR and the People's Republic of China-a new market in 1973--accounted for about one-sixth of the calendar year growth. In addition, exports to the developing countries of Latin America, Asia, and Africa rose to record levels because of increased incomes, improved foreign exchange positions, and reduced agricultural production in many of these areas.
* * * * * U.S. Agricultural Imports i!!,1973 Reached ~Record $8.4 Bi~lion (~E.' 24). U.S. farm product imports advanced 30 percent in 1973 to an alltime high of nearly $8.4 billion. About nine-tenths of the gain resulted from higher prices. Strong demand raised some commodity prices markedly, especially tropical products, wines, dairy products, and meats.
Competitive imports rose 29 percent to a rp.cord $5.52 billion. Meat imports were about the same as 1972's volume but sharply higher prices raised the value by 36 percent. U.S. dairy product imports jumped to $331 million in 1973 from $167 million a year earlier. Nonfat dry milk, cheese, butter, and butteroil import quotas were increased during the year. Other competitive value gains occurred for fruits, nuts, and vegetables; sugar; vegetable oils and oilbearing products; grains; feeds; and hides.
Sharp advances in prices for coffee, cocoa~ crude rubber, carpet wool, and sisal pushed the value of noncompetitive imports to almost $2.9 billion. Voluma was
-3
only marginally above the 1973 level as increases for coffee, rubber, bananas, tea, pepper and silk were nearly offset by declines in cocoa, carpet wool, and sisal.
* * * * * Export ~~ (~~.~. This article highlights a wide variety of information on U.S. agricultural exports for the past fiscal year.
* * * * * pelected ~ Series £f International Significance (~E' 38). Fears of a mounting energy crisis and possible tight supplies of key agrcultural commodities were reflected in climbing December commodity prices. The Dow-Jones and Reuter's commodity indexes were at the highest level of the year. The U.S. f.o.b. Gulf port price for No.2 Hard Winter wheat, ordinary protein, was $200 a ton, 10 pprcent higher than during November. The f.o.b. Gulf port price for No. 2 Yellow corn advanced 4 percent and that for No.2 yellow soybeans, 5 percent. The c.i.f. Liverpool price for cotton rose 9 percent, but the sharpest price jump was for rubber--33 percent.
Cocoa beans, imported cow meat, rice, and sugar de.stined for the U.S. market were the only major import-export commodities to show a downturn in pric.e.
U.S. ~ Exports !!! ~ Half f>.i Fisc.al 1974 Nearly Doubled ~-Earl1&£ Levels (~E'~)' During the first half of fiscal 1974, U.S. agricultural exports totaled $9.9 billion, 92 percent greater than the level of a year earlier. Nearly threefourths of the increase stemmed from higher prices. A sharp advance in export values of grains and products accounted for over two-thirds of the total ~ncrease in value. But significant gains also occurred in exports of cotton, tobacco, soybeans, meats, live cattle, fruits, nuts, vegetables, and poultry meat. Only dairy products, hides and skins. and vegetable oils were below the export levels of a year earlier. Virtually every country and area took more U.S. farm exports during the period.
***** U.S. Agricultural J!nport ~!l.P. ~-Th!!.5!.!!! July-December 1973 (~~. 53). U.S. agricultural imports in July-December 1973, at $4.3 billion were 33 per.cent above the level of a year earlier. Price increases accounted for a large part of this gain. In addition, larger volume was registered for some commodities, mainly dairy products. Competitive farm product imports totaled almost $2.95 billion, while imports of noncompetitive items approached $1.37 billion.
-4

,,.....--..,.~-- ......................-.... , -'--_._--.. !
•SPECIAL In this •Issue
U22 JJUOU3EE3EaE: 33 oeU:aaU.iiS aU20UU2J aEJiiiUaaaeaSes&iiUUU OUUlllIiISUli
INDEX OF ARTICLES, JANUARY-DECEMBER 1973
Special Articles
U.S. Agricultural Exports:
Far.m Export-Record in 1972 .~ •..•••••••.•••••••••••.••••••••• ~ ••••••• Growing Farm Exports to the Enlarged European Community, by Dewain
l:I. Rahe ............ , ••••••••••• 41 •••••••••••••••••••••••••••••••••••
U.S. Agricultural Exports to the 50 Largest Markets, 1972 ••••••••••• U.S. Shipments to COMECON Set New Record •••••••••••••••••••••••••••• Export Licensing Systems Announced for Soybeans, Cottonseed, and
Related Products •••.....•. "...•...•..•••..••.•••..•.• ••••••••••• 0/I
Exports of Farm Products Reach $12.9 Billion Record in Fiscal Year 1973 •••.••.•.•••••...•..•. II •••••••It •••••••••••••••••••••• II ••••••••
Record $1.4 Billion in Agricultural Exports To Eastern Europe and USSR, by Thomas A. Warden ......................... It ••••••••••••••••
U.S. Agricultural Export Shares by Regions and States, by Glenn R. Samson .••••••.•••• .II ...............................................
Problems in Transporting Fiscal 1974 Grain and Soybean Exports, by D.E. Umberger and T.Q. Hutchinson •.•.••••••••..•• "...•.••.•••• •••0
U.S. Agricultural Trade with the Enlarged European Community •••••••• U.S. Agricultural Exports As a Share of Production •••••••••••••••••• Top Outlets for U.S. Agricultural Exports in Fiscal 1973 ••••••••••••
U.S. Agricultural Imports:
Import Fact Sheet ................ II ..... II ................................... ..
Farm Imports Rose 11 Percent in 1972 •••••••••••••••••••••••••••••••• U.S. Agricultural Imports Increase From Most Sources •••••••••••••••• Tariff Rates on U.S. Agricultur.al Imports Lower in 1972 ••••••••••••• U.S. Agricultural Imports From the Enlarged European Community •••••• New Record For U.S. Agricultural Imports in Fiscal 1973 at $7.3
llillian ..... (I .......................... II ••••••••••••• It ••••••••••••••
Imports of Fruits and Vegetables Under Quarantine, 1972/73 •••••••••• U.S. Agricultural Import Fact Sheet, Fiscal 1973 ••••••••••••••••••••
U.S. Agricultural Imports and Exports:
U.S.-Mexican Agricultural Trade Expands ••••••••••••••••••••••••••••• Bloom Buying Boosted, by Isaac E. Lemon ••••••••••••••••••••••••••••• U.S.-Japanese Trade Paradox, by Bruce L. Greenshields •••••••••••••••
-5-
Feb.
April May June
July
Aug.
Sept.
Oct.
Oct. Oct. Nov. Dec.
Jan. Feb. May May June
Aug. Nov. Dec.
Jan. Feb. Mar.
5
5 5
18
5
5
30
5
18 25 32 19
23 19 22 37
5
26 39 38
13 27
5

U.S. Agricultural Imports and Exports--Continued:
Expanding Trade with Canada, by Omero Sabatini ••••••••• - •••••••••• April 33 Spain--A Thriving Commercial Customer, by James Lopes •.••••••••••• April 42 The Booming South Korea Market, by John B. Parker, Jr ••••••••••••• July 9 Japanese Market Doubles, by Bruce L. Greenshie1ds and Kent B.
Gat es •• 0 Sept. 5•••••••••••••••••••••••••••••••••••••••••••••• 0 •• : ••• D ••
PRC-U.S. Agricultural Trade in FY 1973, by Linda A. Bernstein ••••• Sept. 12 U.S. Share of Market Slips as West German Trade Expands, by Cynthia Breitenlohner .........••.••..•....... ••••••••••••••• e •••••••• ,0 Sept. 150 •••
French Ag~icultural Trade at New High in 1972, by Lorin O. Lovfald .•••.....• '.....•. "..•......•..•... Oct. 520 ••••••••••••••••••••••
U.S.-Philippine Trade Rising, by E. Wayne Denney •••••••••••••••••• Oct. 60 Farm Trade with Canada Up, Imports Growing Faster Than Exports,
by ()[nero Sabatini e,•• " ••••••••••• til ••••••••••••••••••••••••••••••• Nov. 35 Mexico's Agricultural Trade •••••••.•••.••..••••••....•.••••••.••.• Dec. 5
Dollar Sales and Government Programs:
Export Assistance to U.S. Farm Exports, 1971/72, by Isaac E•. Lemon •••••••.••••.•.•.••.•••• 0 Jan. 5•••••••••••••••••••••• It • • • • • • • • • • ••
Fiscal 1973 Exports Under Government-Financed Programs at Lowest Level Since Fiscal 1955, by M. Louise Perkins ••••••••••••••••••• Nov. 5
Price Developments:
Trade Prices Rose Sharply in Fourth-Quarter 1972, by Hans G. Hirsch .•.•.............•.• Mar. 14til •••••••••••••••••••••••••••••••••••••
Agricultural Trade Prices Increase Sharply--Export Price Rises Exceed Import Price Rises, by Hans G. Hirsch •••••••••••.•••••••••• June 14
Export Price Rises Far Exceed Record Import Price Advances, by Hans G. Hirsch •••••••...••••.••••••••...••.•••••••••.•••••••.••• Sept. 39
Export Prices Rise More than Import Prices ••••••...••.••••••••••.•• Dec. 54
World Agricultural Trade:
EC Council Fixes 1973/74 Prices •••••••••••••••••••••••••••••••••• May 46 Agricultural Export Controls Imposed by Other Countries, by
Patrick M. O'Brien ...•••....•............•.........••.••..•.•.. Sept. 28
Commercial and Government Program Export Highlights
July-September 1972 ........•.... ".....•.....••......••.........•..•. Jan. 32 Calendar Year 1972 ••........•....•...........••.•... April 530 ••••••••••••••
July-March 1972/73 • 0 June 28•••••••••••••••••••••••••••••••••••••••••• ,•• CI ••
~ Freight Rate Highlights
Record Exports Cause Dramatic Sh::'pping Rate Increases, by T;Q. Hu1.!chiI'lson ••••••••••••••••• Mar. 220 •••••••••••••••••••••••••••••••••••••
Supplements
U.S. Foreign Agr.icultural Trade Statistical Report, Calendar Year 1972 •.••••..•...•......•.••.•.....•... :: Mayil: .:. 0 • • • • • • • • • • • • • • • • • • • • • • •
U.S. Foreign Agt~cultural Trade Statistical Report, Fiscal year 1973 ••.•.•...•......•.•..•..•••.•......•.•........•.•.••...••.... Nov.
-6

Special Supplement
u.s. Farm Product Exports to Reach New High of $19 Billion Nov.
Features Appearing Eve~ ~onth
Agricultural Export Highlights Agricultural Import Highlights
International Agricultural Price Highlights Quantity Indexes of U.S. Agricultural Trade
U.S. Agricultural Trade Statistics for Latest Month Cumulative U.S. Agricultural Trade Data for Current Fiscal Year
-7

SPECIAL •In this •Issue
eaaai9aaaaaaaaa02zaaaasaSiSZSiiiaaaaiaaaas:: aaa:~aaa:ig2i22aaiaiaaia2aai2saili
U.S. FARM EXPORTS ROCKETED TO A RECORD $17.7 BILLION IN 1973
by Dewain H. Rahe ~/
For calendar year 1973, U.S. agricultural exports totaled an unprecedented $17.7 billion. Exports were 88 percent above the 1972 record of $9.4 billion, reflecting the biggest dollar and percentage increases in history.
Growth in our fa1n exports had begun to accelerate late in 1972 and continued through 1973 as a result of the opening of East-West trade, reduced agricultu:cal production in many areas of the world, lower fishmeal output in Peru, and continued gains in demand stemming from higher incomes in. major foreign markets. •
Unfavorable weather conditions in 1972 caused the agricultural production shortfalls. particularly in the Soviet Union, Southeast Asia, Australia, and parts of Latin America and Africa. Crop output was down sharply in these areas and major exporters othe'r than the United States did not have the facilities or the uncomm:i,tted supplies to meet import needs. In addition. the sharp drop in Peruvian fishmeal output, together with reduced peanut output in India and Senegal, put greater demand on U.S. soybeans to make up for the shortfall in world protein supplies.
At the same time, economic growth in many developed countries was continuing to advance at record ~ates, and they were importing more farm products to satisfy increased demand for food resulting from higher incomes. A number of developing countries--for example, Taiwan, Korea, Brazil, Venezuela, and Mexico--were also achieving substantial increases in per capita income. This factor, together with population gains, contributed to substantial increases in their demand for j.mported food products. In addition, many countries--both developed and developing--were using stepped-up agricultural imports as a policy instrument to reduce the impact of the inflationary spiral in food prices.
The competitive position of U.S. agricultural exports in 1973 was enhanced by realignment of major foreign currencies in 1971-73. For the principal commercial markets in Western Europe and Japan, the depreciation of the dollar averaged about 15 percent in 1973. This depreciation was the result of the 1971 Smithsonian agreement, the February 12, 1973, devaluation by the United States, and the floating of currencies by Japan and major European countries.
The sharp advance in grain exports, particularly wheat and feed grains, alone accounted for three-fifths of the total increase in agricultural exports in 1973. But increases for soybeans, protein meal, tobacco, cotton, fruits, nuts, vegetables, meats, cattle
~/ Supervisory Agricultural EconOmist, Statistics Program Area, Foreign Demand and Competition Division, Economic Research Service.
-8

r--------------...... -.,--~-----------_ u..s. TRADE BALANCE
$ BIL.---------. r--------.., r---------, Total NC)nagricultural Agricultural
+10
-5
-10
-15 L...L...__--'-___.L-J '--'--__-'--__....J.....J L...L...__--'-___.1.-I
1963 '68 '73 '63 '68 '73 '63 '68 '73 CALENDAR YEARS
U.S. DEPARTMENT OF AGRICULTURE NEG. ERS 74-74111 ECONOMIC RESEARCH SERVICE
Figure 1
hides, and poultry meats also contributed significantly to the 1973 record. In fact, new export records were established for wheat, corn, soybeans, soybean meal, cattle hides, lemons, grapefruits, fresh vegetables, and live animals. Cotton exports were the highest since 1960.
The volume of U.S. agricultural exports gained 30 percent in calendar year 1973, accounting for around two-fifths of the value gain. Higher prices--especially for soybeans, soybean meal, wheat, feed grains, most fruits, vegetables, hides and skins, meats, tobacco, and nuts--were responsible for the balance of the increase.
The phenomenal rise in agricultural exports boosted the favorable U.S. agricultural trade balance by over $6 billion to a record $9.3 billion despite a nearly 30-percent gain in agricultural imports to a record $8.4 billion. This record agricultural trade balance more than offset the country's trade deficit in nonagricultural products, which totaled $7.6 billion in 1973. Although the nonagricultural trade balance is somewhat improved from last year's deficit of $9.4 billion, it is considerably below the $4- to $5-bi11ion surplus that was racked up annually during the early 1960's. Overall, the United States had a favorable trade balance of $1.68 billion in 1973-measurably better than 1972's deficit of $6.4 billion.
Major Commodities Exported
Gr~ and preparations.--U.S. exports of grains and preparations rose to an a11time high of $8.5 billion in calendar year 1973--nearly 2~ times greater than the 1972 level. While exports of all major products gained, those of wheat and feed grains accounted for most of the overall increase. Larger volume accounted for nearly two
-9

I u.s. AGRICULTURAL EXPORTS, BY COMMODITY GROUPS
Wheat and flour .......... .
Feed grains ................. .
Animals and Dr4I)dILJctS•. ,.!,;
Fruits, nuts, and vegetables ..........•.."''""'""
_1973Cotton, excl. linters •...••. ~1972
Tobacco ........................ .
Rice .............................. .
o 1500 3000 4500 $ MILLION
CALENDAR YEARS U.S. DEPARTMENT OF AGRICULTURE NEG. ERS 5876-74(1' ECONOMIC RESEARCH SERVICE
Figure 2
fifths of the overall value increase, and higher prices for the balance. The wheat export unit value, for example. averaged $2.93 a bushel in 1973, compared with $1.74 a year earlier. Feed grain exports averaged $85 a ton, compared with $55 in 1972; rice averaged $341.00 a ton--a year earlier. the e~~ort unit value was $198.00 a ton.
Exports of wheat and products reached an unprecedented level of 1.4 million bushels in 1973. sharply above the 840 million bushels exported in 1972. The 1973 wheat exports wer~ equivalent to over three-fourths of U.S. production.
The biggest increase in wheat exports occurred in shipments to the USSR, which took 320 million bushels. accounting for about two-fifths of the total gain. The People's Republic of China was the next most important growth market, taking 97 million bushels in 1973, compared with only 21 million in 1972. Japan was a market for 132 million bushels of U.S. wheat in 1973, up from 92 million a ~ar earlier. A number of developing countries also became more important cash customers for U.S. wheat. Sharp increases were registered in shipments to Asia, the Middle East, North Africa, Latin America. and the Far East. The adverse weather in 1972 was a principal factor in the rapid growth of U.S. wheat exports, but stocks were down in many areas and consumptionalso gained.
Total world wheat trade in the current marketing year (July-June) is estimated at 71 million tons--down slightly from the 74 million tons traded a year earlier. The United States is expected to account for over two-fifths of the 1973/74 world trade.
U.S. rice exports totaled 35.8 million cwt in 1973, down a fifth from the previous year's record of 44.8 million. The decline occurred because of a very tight supply

____ __ _
Table l.--U.S. agricultural exports: Value by commodity, calendar years 1972 and 1973
Commodity 1972 19731/
Million dollars
Animals and animal products: Dairy products .................................... : 150 Fats, oils, and greases •••••••••••.••• : 209 Hides and skins, inc~uding furskins .. : 354
Cattle hides, whole •••••••••••..••• : 256 Furskins ................ ~ ..................... : 62 Other hides and skins •.••.•.•.•..•. : 36
Meats and meat products 204o •••••••••••••• :
Poult~y and poultry products •••.•••.. : 90
60 333 473 331
98 44
374 120
Other ......................... ....... :____~1~0~8~______~~2~2~5---Total animals and products ••.•.•... :=====1=.1=1=5=========1~.=5=8=5~=:
Cotton, excluding linters .•......•...•• : 503
Feeds and fodders, excl. protein meal: Com byproducts •••• "." •. "." ••• "" .•• ",,: 53 .Alfalfa meal .. ".... "... "........ 11 ................ : 17 Other ................... _............ :______~9~0__
Total feeds and fodders, except oil :
928
94 25
.______~1~,5~2~__
cake and meal .•.••.....••••..••••. :======1=6=0===========2=7=1===
Fruits and preparations .....•.••...•..• : 429 535
Grains and preparations: Feed grains, excluding products 1,522 3,538 Rice 388 540 Wheat and products •.0 ••••••••••••••••• : 1,479 4,176 Other ................................ :______~9~5~________~2~0~2___
Total grains and preparations ••...• :=====3~.4~8=4=========8=.=4=5=6===
Nuts and preparations ......•...•••..•.. : 93
Oi1seeds and products: Cottonseed and soybean oil ............. 241 30ybeans •..•..••....•.•....•••.••••.• : 1,508 Protein meal ......................... : 434 other ..................................... :___-::-'2'7"2;;.,;5::-
Total oi1seeds and products ••.•.••• :=====2~.4=0=8=========4=.=3=0=6===
Tobacco, unmanufactured ...••.••••••.••• : 672 714 Vegetables and preparations .....••.•••• : 257 373 Other .................................. :______~2~6~O__________3~6~7___
Total agricultural exports1./ Preliminary.
............. 9.401 17.656
-11-
121
238 2,759
985 --:---=3'='2-::-4
Change
Percent
-60 +60 +34 +29 +57 +22 +83 +33
+108 +42
+84
+77 +49 +69
+69
+25
+132 +39
+182 +113 +143
+30
-1 +83
+127 +44 +79
+6 +45 +31
+88
-----------------~~- .. -.-.•.-.- ..

u.s. AGRICULTURAL EXPORTS: COMMERCIAL AND UNDER GOVERNMENT PROGRAMS
$ BIL.
15
ricultural exports10
GOVERNMENT
:....1955 '58 '61 '64 '67 '70 '73
CALENDAR YEARS
U.S. DEPARTMENT OF AGRICULTURE NEG. EAS 3140-74(1) ECONOMIC RESEARCH SERVICE
Figure 3
situation in the United States. Although rice exports rose during the last half of 1972 and early 1973, reduced stocks slowed exports in the last half of 1973. Most of the decline occurred in shipments under Government-financed programs. Exports fell sha1~ly to South Vietnam, Bangladesh, Indonesia, and South Korea.
Several factors worked together to boost U.S. feed grain exports from only 27.8 million tons in 1972 to a record 41.5 million tons in 1973. First, feed grain production was off sharply in Thailand, Australia, and other major exporting countries. At the same time, livestock production was expanding in many countries. Producers were using more feed grains in feed rations instead of fishmeal and peanutmeal--which were '-in short supply--and instead of other high-priced protein and nongrain, high-carbohydrate feeds.
In Japan, for instance, livestock production increased nearly 3 percent, yet only a half million tons of surplus rice were allocated for mixed feeds, compared with 1.2 million tons in 1972. U.S. feed grain exports to Japan in 1973 more than doubled the 1972 level, reaching a record 9 million tons. Exports to the USSR in 1973 totaled over 4.2 million tons, about the same as a year earlier. As a result, the USSR was the third largest market for U.S. feed grains following Japan and the enlarged European Community (EC). u. S. feed grain exports to the enla.rged EC totaled over 10 million tons--up sharply from about 8.8 million tons a year earlier. Ireland, the Netherlands, and West Germany all substantially increased their purchases. The biggest increase, however, occurred in shipments to Italy, which was a market for 3 million tons.
The~e increased feed grain exports occurred despite record grain production in the EC countries in 1972. Rising incomes in the EC were increasing the demand for meats.
-12

. ,:,-~- .. ?':;'f\;";:'\~:":'>~:'~~; ·~\":~·'(~::~·I-:r t·?..",--:>5.,~'~ ~!> •..·.i,·· -'!' - .~. ".,':, .ty:·~"~t:~fr} ;'~~':':l:t;:;'\':.~K ~.•~;".:)-;.". ~ '~' ~"'.' t',-
Table 2.--U.S. agricultural exports: Value by commodity, calendar years 1961-73
Commodity 1961 : 1962 : 1963 1964 : 1965 : 1966 : 1967 1968 1969 1970 Y
-- MilliQn dollars
Animals and animal products: Dairy products ~ ••••••• : 120 120 170 211 183 114 109 131 121 127 Fats, oils, and greases .-: 182 148 173 250 227 192 179 152 167 247 Hides and skins, exc1.
furskins .............. ,,: 86 83 75 93 109 154 127 121 151 187 Meats and meat products .: 66 62 87 115 104 107 105 118 156 132 Pou1tr-f products 21 .•.•• : 85 89 75 74 70 67 59 57 57 56 Other ................... : 80 76 82 84 73 75 82 82 92 101
Total animals, etc•••• : 619 578 662 827 766 709 661 661 744 850
Cotton, excluding linters .: 875 528 577 682 486 432 464 459 280 372 Fruits and preparations ••• : 271 285 275 277 312 314 309 275 325 334
Grains and preparations: Feed grains, e."!;c1. products ••••••••••••••• 516 787 793 854 1,131 1,331 1,052 923 860 1,064
Rice, milled •••••••••••• 112 153 178 206 244 230 316 348 348 314 Wheat and flour ......... 1,298 1,135 1,330 1,532 1,183 1,534 1,206 1,100 830 1,111 Other ................... 74 82 82 75 76 97 108 97 91 107
Total grains, etc••••• 2.000 2,157 2.383 2.667 2.634 3.192 2.682 2.468 2.129 2.596 I
I-'
I Oi1seeds and products:'" Cottonseed and soybean oils ................... 127 185 165 210 241 154 154 107 128 244
Soybeans ................ 343 407 472 567 650 767 772 810 822 1,228 Protein meal •••••••••••• 48 91 125 145 187 227 246 262 :t84 358 Other ................... 50 42 56 86 95 93 84 101 87 91
Total oi1seeds, etc••• 568 725 818 1,008 1.173 1,241 1,256 1,280 1,321 1,921
Tobacco, unmanufactured B.' 391 373 403 413 383 482 498 524· 540 517 Vegetables and preparations 132 159 182 169 166 188 175 182 192 206 Other •••.••••••"••••••••••• 168 229 284 305 309 323 335 379 405 463
Total exports ••••••••••••• 5,024 5,034 5,584 6,348 6,229 6,881 6,380 6,228 5.936 7,259·
Y Beginning January 1970, export values include small amounts of commodities formerly classified as nonagricultural.Y Preliminary.l' Includes some additional commodities starting in 1971. 21 Includes live poultry starting in 1971.
1971
196 268
199 151
78 81
973
583 351
972 256
1,090 113
2.431
;:'11 1,327
420 131
2.189
496 216 454
7,693
1972
150 209
292 204 90
170 1,115
503 429
1,522 388
1,452 122
3.484
241 1,508
434 225
2 1408
672 257 533
9,401
1973 Y
60 333
375 374 120 323
1,585
928 535
3,538 540
4,130 248
8.456
238 2,759
985 324
41 306
714 373 759
17,656
. -' ~
,:~ :(;
..),: ';
), .~\
':"
"J ,?!
. '~l
t',~
'.~
~>1.'~ •'~., .•• : ...:' :

,,~,,~ ..~~~~-.
Table 3.--U.S. farm export unit values, calendar years 1969-73 11
Average unit pric:.~_U
Commodit~ :Unit: 1969 1970 1971 1972
-- Dollars
Raisins ••••••••••••••••••••••••••••••• :Lb. 0.18. 0.18 0.18 0.26 Soybean meal ••••••.•••••••••••. e •••••• :Ston: 81.88 85.15 88.75 102.62 Dried peas ••••• a •••••••••••••••••••••• : Lb • .06 .06 .07 .06 Wheat ••••••...••••.•••.•..•.••••••...• :Bu. 1.63 1.58 1.69 1.74 Rice, milled basis •••••••••••••••••••• :Lb. .08 .08 .08 .09 Soybeans •••••••••••••••••• ~ ••••••••••• :Bu. 2.64 2.79 3.13 3.42 Almonds, shelled •••••••••••••••••••••• :Lb. .72 .73 .69 .78 Tallow, inedible ••••••••••••.••••••••• :do. .07 .09 .09 .08 Feed grains •.••••••••..••••••••••••.•• :Mton: 51.27 54.45 57.66 54.83 Corn •••.••••••••••••••.•••••••••••.••• :Bu. 1.31 1.44 1.46 1.40 Grain sorghum ••••••••••••••••• ~ ••••••• :do. 1.23 1.30 1.46 1.44
I Chicken, fresh or frozen •••••••••••••• :Lb. .27 .26 .25 .26 ..... ~ Pork, except offa1s ••••••••••••••••••• :do. .43 .43 .38 .50 -I Cattle hides •.•••.•••••••••••••••••••• :No. 8.60 8.35 8.02 14.64
Alfalfa meal, dehydrated •••••••••••••• :Ston: 51.81 54.42 52.02 51.08 Peaches, canned ••••••••••••••••••••••• :Lb. .12 .12 .13 .14 Beef and veal, except offa1s •••••••••• :do. .84 .84 .86 .96 Dried beans ••••••••••••••••••••••••••• :do. .08 .09 .10 .n Offals, edible ••• , •••.•••••••••• a ••••• :do. .26 .29 .28 .35 Soybean oil •.•••••.•••••••••••••••••.• :do. .11 .13 .14 .13 Fruit cocktail, canned •••••••••••••••• :do. .16 .17 .19 .19 Cottonseed oil •••••••••••••••••••••••• :do. .12 .13 .1-6 .14 Grapes, fresh ••••.••••••.••••.•••••••• :do. .10 .12' .12 .19 Oranges 1/ ............................ :do. .09 .09 .10 .09 Tobacco, flue-cured stemmed ••••••••••• :do. 1.22 1.25 1.26 1.33 Leruons and ltmes •••••••••.• o •••••••••• :do. .11 .10 .11 .11 Tobacco, unmanufactured ••••••••••••••• :do. .93 .97 .98 1.06 Tobacco, flue-cured unstemmed ••••••••• :do. .86 .92 .95 1.01 Cotton, raw •••••••••••••••••.••••••••• :Rble: 116.91 124.80 141.30 162.94
11 Listed in order of percent change from previous year.II Total export value reported divid~d by total quantity exported.2! Includes tangerines and c1ementines.
1973
0.49 191. 72
.11 2.93
.15 5.67 1.27
.13 85.33 2.16 2.10
.37
.69 19.37 66.29
.18 1.23
.14
.44
.16
.22
.16
.21
.10 1.46
.12 1.12 1.07
169.07
Percent change
from 1972 to 1973
Percent
+88 +87 +83 +68 +67 +66 +63 +63 +56 +54 +46 +42 +38 +32 +30 +29 +28 +27 '+26 +23 +26 +14 +11 +11 +10
+9 +6 +6 +4

I I
i
I
And higher meat prices encouraged livestock producers to expand livestock production, which required additional imports of feed grains. The EC dairy producers were using more. feed grains because higher CAP prices encouraged both an expansion in dairy herd and production per animal.
Other major markets for U.S. feed grains in 1973 included Spain, Portugal, the Republic of China (Taiwan), Indonesia, Korea, Peru, Israel, India, Egypt, Poland, Greece, and Mexico. Exports to Mexico rose to a record of nearly 906,000 tons in 1973 from 438,000 in 1972.
Oi1seeds ~ products.--U.S. exports of oi1aeeds, including products, rose to a record $4.3 billion in 1973, a gain of 79 percent over the 1972 level. Higher prices accounted for over three-fourths of the increase.
As with feed grains, the growth in our oilseed exports was largely due to the very tight world protein meal situation that prevailed through all of 1973. Peru, the world's largest fishmea1 exporter had a sharply reduced anchovy catch in 1972 because a change in the ocean current drove the anchovies out to deeper water. Durlng 1973, Peru exported only an estimated 325,000 tons of fishmeal. Normally, exports lo10uld total close to 1.7 million tons, which is equivalent to over 120 million bushels of soybeans. In addition to reduced protein meal supplies from Peru, sunf10werseed production was down in the USSR and Eastern Europe, and peanut production declined in Africa and Asia.
Despite higher prices for protein meal, demand for soybeans advanced with the continued rise in livestock production in Western Europe, Japan, Canada, and other developing countries. U.S. exports of soybeans in 1973 increased about 50 million bushels to a calendar year record of 486 million bushels. U.S. soybean exports have gained steadily since World War II, with the increase averaging over 10 percent annually. Most of the 1973 gain occurred in shipments to the enlarged EC, the USSR, Spain, Poland, Israel, Japan. and Korea. Over half of U. S. soybea.~ production is exported in the form of meal or soybeans, and these exports account for well over one-half of world meal e~ports in either oilseeds or meal form.
U.S. exports of oil cake and meal rose over 1 million tons in 1973, reaching 5.3 million short tons. Higher prices pushed~alue up 127 percent. Spain, Yugoslavia, Australia. Greece, Eastern Europe, Portugal, and Japan accounted for most of the increase. Because of a greater crushing capacity, the European Community took about the same volume of oil cake and meal as in 1972, but bighe.: prices resulted in a sharp increase in the value of 1973 shipments.
U. S. exports of cottonseed and soybean oil in 1973 totaled 1.51 million pounds-270 million pounds below the 1972 level. Soybean oil exports, which accounted for all of the decline, fell by 341 million pounds, partly because more U.S. soybeans were crushed overseas. But U.S. cottonseed oil exports increased by over 70 million pounds because of plentiful U.S. supplies' and reduced availability of sunflower oil in Eastern Europe. Exports of cottonseed oil to E~pt rose to 204 million pounds in 1973 from i87 million a year earlier. Other important.markets for U.S. cottonseed oil included Venezuela, Mexico, enlarged EC, Sweden, Japan, and South Africa.
Fruits and preparations.--U.S. exports of fruits and preparations rose by a fourth to a record $535 million in in 1973. Higher prices accounted for over one-half of the gain. Values were up substantially for canned fruits, "fresh fruits, and juices. While most of the overall gain occurred in shipments of fresh products, exports of canned fruits showed a substantial rise despite smaller supplies and higher prices. While the value of dried fruit exports was up, quantity was down because of reduced supplies resulting from freezing weather conditions in many U.S. production areas. The realignment of currencies in the pest 2 years has made many U.S. fruits attractively priced to many foreign buyers.
-15 • •
:

.-"-.'"'........,~~-
Table 4.--U.S. agricultural exports: Value by months, January 1961 to December 1973
Months 1961 19731962 1963 1964 1965 1966 1967 1968 1969 1970 1971 197211 '£1
-- Million~
January •• , •••••••.•••••••• : 422.2 379.1 201.9 542.8 210.4 505.7 530.2 545.0 177.7 524.1 670.5February .................. : 425.6 410.8 492.2 523.2 325.7 519.7 512.0 769.7 1,136.1
547.4 239.5 559.6 634.8March ..................... : 469.4 428.0 505.2 714.2 1,179.4523.6 696.2 619.5 552.0 544.4 517.2 569.7 714.8 filill,Z -:~ January-March ••••••••••• : 1,317.2 1.217.9 1.199.3 1.589.6 1.232.3 1.644.9 1.594.2 1,636.8 934.4 1.653.4 2.020.1 2,152.1 3.123.2
April ••••••••••••••••••••• : 394.4 410.9 499.7 521.1 553.8 552.3 524.5 523.7 60Z.0 558.4 632.5 627.7 1,264.1 May ••••••••••••••••••••••• : 395.3 474.2 505.4 530.5 532.9 549.4 548.1 497.5 583.6 573.7 623.6 711.5 1,364.9 June •••••••••••••••••••••• : 348.7 470.7 412.9 459.4 530.9 551.1 521.0 461.~ 513.2 599.4 607.6 743.5 1.~76.0
April-June •••••••••••••• : 1.138.4 1.355.8 1.418.0 1.511.0 1.617.6 1.652.8 1.593.6 1.482.5 1.698.8 1.731.5 1.863.: 2,OllZ,7 4,oos,q
January-June ••••.••••••••• : 2.455.6 2.573.7 2.617.3 3,100.6 2.849.9 3.297.7 3,187.8 3.119.3 2.633.2 3.384.9 3.883.8 4.234.8 7.728.Z
July...................... 350.4 402.0 410.5 479.7 548.0 489.9 472.2 465.6 499.8 567.8 579.D 680.8 1,218.1 AuguBt •••••••••••••••••••• 391.4 359.4 408.7 419.6 459.3 571.0 468.1 489.0 438.4 537.5 546.7 679.0 1,469.5 September ••••••••••••••••• 371.5 396.3 432.9 494.7 484.6 564.0 488.9 469.6 471.5 568.3 749.9 709.5 1,448.7
~ July-September •••••••••• : 1.113.3 1.157.7 1.252.1 1.394.0 1.491.9 1.624.9 1.429.2 1.424.2 1.409.7 1.673.6 1.875.6 2.069.3 4,136,3~ I
Octobll1' ...................... 495.2 389.2 552.3 575.7 587.1 622.4 531.8 463.8 644.9 729.9 466.2 907.5 1,733.7November ••••••••.••••• ~ •• _ : 490.2 451.4 574.5 607.7 651.4 697.7 667.4 609.4 657.8 725.8 630.5 1,080.4 2,082.0
De~ember •••••••••••••••• ,.: 469.6 462.0 588.1 669.5 648.3 638.6 563.6 610.7 590.9 744.6 841.9 1.108.6 1.975.6
Octob~r-December •••••••• : 1.455.0 1.302.6 1.714.9 1.852.9 1.886.8 1.958.7 1.762.8 1.683.9 1.893.6 2.200.3 1.938.6 3,096.5 5,79],3
July-December ••••••••••••• : 2.568.3 2.460.3 2.967.0 3.246.9 3.378.7 3.583.6 3.192.0 3.108.1 3.303.3 3.873.9 3.614.2 5,lfiS,II 9 927 Ii
January-December 11 ••••••• : 5,023.9 5,034.0 5,584.3 6,347.5 6,228.6 6,881.3 6,379.8 6,227.6 5,936.5 7,258.6 7,698.0 9,400.7 17,655.8
Monthly average ••••••••• : 418.7 419.5 465.4 529.0 519.1 573.4 5:n.6 518.9 494.7 604.9 641.5 783.3 1,471.3
11 Beginning January 1970, export values include small amounts of commodities formerly c1assisfied as nonagricultural.!I Preliminary, monthly totals for 1913 are not revised and will not add to total.11 Totals may not add due to rounding.

Vegetables and preparations.--Exports of vegetables and preparations in 1973 rose by46 percent to a new record of $366 million. Again, fresh items accounted for most ofthe increase, but there were also sharp gains in shipments of canned and dehyd=ated~egetables. Hop exports fell from 1972's high level because of a big crop of betteri quality hops in Western Europe.
.1
Animals and animal products.--Exports of animals and animal products advanced by overtwo-fifths in 1973 to $1.60 billion, another alltime high. Cattle hide shipments,which accounted for 17 percent of the overall increase, rose to a record $398 million,35 percent above the 1972 level. The increase was partly due to a decline in e.~ortavailability in Argentina because of an embargo and a sharp increase in demand forleather and leather products. However, the Argentine embargo was somewhat offset bythe expansion in Argentine exports of leather and leather products.
EXports of meats and prepartions gained 83 percent to total $374 million. Pork exportsto Japan increased to over 97 million pounds from 46 million in 1972, and those toCanada gained about 12 million pounds to reach 43 million. Exports of variety meatsgained only 11 percent in volume, but higher prices pushed the value up by 40 percent.A 52-percent increase in beef exports was accounted for by larger shipments to Japan,the Carribean, and the principal markets in Europe.
Exports of poultry and ~oultry products rose to $120 million in 1973. The increaseoccurred for turkeys, fresh and frozen chickens, and eggs. Substantial increases inred meat prices encouraged many countries to import more U.S. poultry products tosatisfy the rapidly expanding demand for meat.
U.S. exports of dairy products fell from $150 million worth in 1972 to $60 million in1973. The 60-percent decline was concentrated in shipments of nonfat dry milk andbutter. In 1972, butter exports were unusually large to the United Kingdom becauseof reduced supplies in the European Community and New Zealand. Most of the declinein nonfat dry milk occurred in exports under Government-financed programs or in concessional exports to developing countries for welfare and food lunch programs. Increased U.S. consumption and lower production of nonfat dry milk reduced the suppliesavailable for export. (Because of a very tight nonfat dry milk supply situation, theUnited States imported nearly 300 milli0~ pounds in 1973.)
U.S. exports of animal fats and oils rose 59 percent in 1973 because of substantiallyhigh~L prices. Export volume for tallow and greases fell 2 percent to 2.2 millionpounds, while value was up nearly 65 percent to $297 million. Exports of lard fellby one-third to 113 million pounds. Declines occurred mostly in exports to theUnited Kingdom.
Cotton.--U.S. cotton exports totaled 5.4 million bales in 1973, up 78 percent from the3.1 million bales in 1972. Most of the increase occurred to the Far East countriesespecially People's Republic of China and Japan. The People's Republic of China took609,000 bales in 1973, compared with none in 1972. Exports to Japan rose 1.1 millionbales from 717,000 in 1972. Canada and the enlarged EC also took more U.S. cotton in1973. The increase in cotton exports reflected increased world consumption particularly in the foreign non-communist countries.
Tobacco.--U.S. exports of tobacco rose. slightly to 639 million pounds in 1973 from636 million a year earlier. Value was up by 6 percent, primarily because of higherprices. Gains were in shipments of burley and tobacco stems. Exports of flue-curedtobacco fell 2 percent to 416 million pounds but higher prices drove the value up by6 percent. In the principal U.S. tobacco markets in Europe and Asia, cigarettesmoking continued to gain in 1973. Tobacco production in Africa, the major U.S. competitor in the world market, fell about 7 percent.
-17-·

.;.
."----- ~= ~' """._.. ~l
Table 5.--U.S. agricultural exports by regions, calendar years 1970-73
Region 11
Western Europe •••••••••••••••. EC (9) ••••••••••••••••••••• : EC (6) ••••••••••••••••••••• : EC (3) ••••••••••••••••••••• :
Eastern Europe and USSR ~I •.. : USSR ......................... .
I ...... ~
As ia ............................ : Japan •••••••••••..••••••••• : People's Republic of China .:
Latin America .................. Canada, excl. transshipments .: Canadian transshipments •••••• :
Africa ..•.... CI ............... .
Oceania •••••••••••• • ..........._____....c:::;..:.__________:::.:.=_________...:::~__________.:::.:~___
Total .............. 0 ........... .
11II
Not adjusted for transshipments. Includes Yugoslavia.
Change I Percent I
+67 r +66 I +76 r
I +32
+108 +113
+99 +110 +843
+94
+45 +429
+95
+54
+88
J
~:.''<''''''"'~.'''- '"' ..... ,,~--"<'"~

I t----·,--"
Major Market for ~ Agricultural Exports
The 1973 growth in, U.S. agricultural exports occurred to nearly every country and region. Exports to Western Europe totaled $5.6 billion, over two-thirds above the $3.4 billion level of 1972. Grains and soybeans accounted for most of the gain, primarily because increased livestock production in Western Europe generated demand for protein meal, and supplies from sources other than the United States were down. And--as mentioned above--the short protein supply encouraged stepped-up feeding of grains in ~ieu of high-protein feeds. Countries in Western Europe also took more U.S. cotton, tobacco, fruits and vegetables. However, shipments of lard and dairy products were off sharply from a year earlier.
Exports to Eastern Europe and the USSR hit a record of $1.5 billion in 1973--more than doubling the level of a year earlier. Farm shipments to the Soviet Union totaled $916 million, compared with $430 million a year earlier, and those to Eastern Europe (excluding USSR) increased to $577 mi1lion--sharp1y above the $288 million worth exported in 1972. Altogether, the increase in exports 'to Eastern Europe and the USSR accounted for 13 percent of the total rise in 1973 exports. The increase occurred primarily in wheat, feed grains, protein meal, and soybeans.
In calendar 1973', U.S. agricultural exports to Japan broke the $3 billion mark--more than double the $1,429-mi11ion level of 1972. Only 3 years ago, Japa.n became the first billion dollar foreign market for U.S. agricultural products. The value increase to Japan in 1973 was concentrated in grains, cotton, soybeans, fruits and preparations, pork, tallow and grease, and hides and skins. Much of the increase, of course, stemmed from higher prices.
U.S. agricultural exports to the People's Republic of China totaled nearly $575 million in 1973, compared with only $61 million in 1972. Wheat exports were 97 million bushels with a value of $278 million. Corn exports, totaling 55 million, were the next most important item shipped. Cotton exports to this new country market totaled about 610,000 bales valued at $100 million. Other commodities exported included soybeans, soybean oil, tallow, tobacco, and cattle hides.
Exports to other Asian countries in 1973 were valued at $2.9 bi1lion--a gain of 65 percent over a year earlier. Grains accounted for much of the overall increase. But exports of soybeans, cotton, and hides and skins also gained sharply. Countries in this area have become a very rapid growth market for U.S. agricultural exports, especially the Republic of Korea, Hong Kong, and the Republic of China (Taiwan). More important, the 1973 inc~ease in exports to these Asian countries occurred in commercial sales, although shipments under Government programs were still important.
The Middle East and Africa were also more important markets for U.S. farm products in 1973. MOst of the increase to these regions was concentrated in grains.
Exports to Latin American countries in 1973 totaled $1.7 bi11ion--near1y double the level of a year earlier. The increase occurred in shipments to Brazil, Mexico, Peru, Chile, Argentina, and Colombia. Caribbean countries increased their imports of U.S. farm products by over two-fifths in 1973 to a record $266 million because of riSing demand from the hotel and tourist indUstry, as well as from demand generated by population and income growth. On a commodity baSis, grains alone accounted for over three-fourths of the increase in exports to Latin American countries.
-19

I _._ ..... -1_~"","""",~~~·_>=-.' .".~'"~,. __
~-,.. ~"~.... -.....---- ... - ,~-,--=~
TABLE 6.--U.S. AGRICULTURAL EXPORTS: QUANTITY AND VALUE BY COMMOOITY
'COM140nITY UNIT : JANUARY-DECEMBER
QUANTITY VALUE 1972 1973 11 1972 1973 11
THOU. THOU. 1.0po DOL. 1.000 DOL.
OECF,...f1F.R QUA/liTITY VALUE
1972 1973 11 1972 1973 11 THOU. THOU. 1,000 DOL. 1.000 DOL.
ALL COMMODITIES 48,978.600 70,223,000 4,649,200 6,886.000
NONAGRICULTURAL COMMODITIES 39.577,928 52.567,301 1.540.584 4.910.413 AGRICULTURAL COMMODITIES 9,400,672 17,655,699 1.10&,616 1,975,587
ANIMALS AND ANIMAL PRODUCTS 10 115,198 1.584,547 105.895 147.238 ANIMALS LIVE.
CATTLE OTHER
EX POULTRY NO 104 273
66,934 43,617 23.318
167,288 125,979 41,309
18 25 12.848 6.773 6.075
18.344 12.726 5,617
DAIRY PRODUCTS ANHYDROUS MILK FAT BUTTER CHEESE AND CURD MILK AND CREA.H
LB LB LB
960 42,430
6,490
340 3,327 7,104
149.731 355
22,b58 5.252
60,388 258
1,841 6,375
:3 10058
544
7 27
510
6.130 3
568 503
4.592 6
21 515
.!, l'
CONDENSED OR EVAPORATED ORY. WHOLE MILK AND CREAM FRESH NONFAT DRY
OTHER
FATS, OILS, AND GREASES LARD AND OTHER RENDERED PIG FAT TALLOII I
LB LB
GAL LB
LB LB
55,359 38,269
1,521 282.461
2.536,351 164.386
43,350 49.696
1,722 17.735
2,439.253 113,347
11.,310 6.242 2,340
78,184 23,389
20130748 18,908
8,462 9.159 3,228 5,519
25.5'+6
333,073 19.570
3.444 2,026
216 5,976
159,895 4.357
3,455 2'41~
20
~~: 189.09"
5.815
661 404 236
1.874 1.882
13.977 574
771 523 444 116
2,196
34,192 1.417
EDIBLE INEDIBLE
OTHER
LB LB LB
12.435 2,189.200
1711,331
16,343 2,163,216
146,346
1.173 172,520 16,147
2.727 287,231
23,545
279 142,907
12,351
3.72" 165,830
13,72C;
37 12,097 1,268
733 29,434
2.607 MEATS AND MEAT PREPARATIONS
BEEF AND VEAL, EXCEPT OFFAlS PORK, EXCEPT OFFALS OFFALS, EDIBLE, VARIETY MEATS OTHER
LB LB LB LB La
435,043 52,156 99,276
254,053 29,558
590,847 79,122
160.692 2810880 69.153
203,875 49,821 49,436 88,592 16.026
373,659 97,696
111.058 123,918 40,·987
37.385 5,729 6.404
22.656 2.596
52.011 9.248 4,603
30,956 7,205
18,029 5,044 3,101 8.551 1,333
35,360 11.644 3,295
16-.196 4,?25
POULTRY AND POULTRY PRODUCTS POULTRY, LIVE:
90.353 119,935 8.843 13."68 8REEDING CHICKS BABY CHICKS. EX BRFEDING CHICKS OTHER
POULTRY MEAT. FRFSH. FROZEN:
NO NO
13,030 17,481
11,857 18,390
14.866 3,581 2,214
15,671 3.640 3,201
1.009 1.033
857 1.208
1,245 246 191
1.076 ?45
1,;>29 CHICKENS TURKEYS OTHER
PoULTRY. CANNED AND SPECIALTIES EGGS IN THE SHELL, FOR HATCHING EGGS IN THE SHELL, OTHER EGGS. DRIED AND nTHERWISE PRESERVED
L8 lB LB LB
DOZ DOZ
LB
97,319 36,3911 10,356 10,961 11,815 3,111 4.151
96.111 49,651 13.378 9.512
12.040 2.795 4.689
25,286 15,012 3,778 3,943
12,208 1,186 3.626
35,241 24.762
6,531 4,043
14,b28 1,586 4.819
9,108 4.837 1.097
9S1 1168 308 638
10,785 5.980
955 381 863 26-4 325
2.376 1.951
412 361 954 132 501
4.402 3,279
555 262
1.251 183 614
HIDES AND SKINS, INC FURSKINS CATTLE HIOES. WHOLE OTHER
NO 17.0'12 16,659 354,063 256,017
97,98&
473,468 331,415 142.053
1.502 1,376 4?.614 33.538
9.076
36.525 24.654 11.871
CONTINUfD-

_. -----.....-,-,-."- ..,........"'"-~~.- --""',.,........~., •........·,........ ~_-.-~"d, ...__~~ .. ,~~~ '., .....,,~'"_
,-~-., ..........,---, ......,.~ .., ,--.-~~ ....... -<.'--, .........
TABLE 6.--U.S. AGRICULTURAL EXPORTS: QUANTITY AND VALUE BY CO~NODITY--CONTINUEO
JANUARY-OECEMBERCOMMOOITY DECEMBERUNIT : QUANTITY VALUF OU4NTITY V4lUE1912 1913 1/ 1912 1913 1/ I 1912 1973 11 1972 1973 11THOU. THOU. 1.000 DOL. 1.000 DOL. THOU. THOU. 1.000 DOL. 1.000 DOL. OT~ER ANIMAL PRODUCTS
41,493 56,736~AIR, ANIMAL. EX WOOL OR FINE HAIR LB 1.898 10002 3,454 4,556706 718SAUSAGE CASINGS 133 30 67LB 13.591 14.810 3211,267 11.510 1.157WOOL. UN~ANUFACTIIRED. INC FINE HAIR CLB 808 10135 1,380:10.542 14,721 16.1:112 16.716 1.20.1:1OTHF.:R 191 800 95612,798 19.793 1.452 2.188VEGETABLE PRODUCTS
8.285.474 16,071.152 1.002,721 1,828,349COTTON. UNMANUFACTUkED R!3A 3.254 6,228 5U8.31:19 939,040COTTON. RAW RBA 3,081i 560 621 86.339 130,520
LINTERS 5.481 503,322 92-7,126 534RBA 165 141 592 85.684 128.891!:>.061 11,314 21 34 656 1.629FRUITS AND PREPARATIONS
CANNED 428.692 534,669LB 368.258 360,924 62.590 7.3,611 33,394 50.942CHERRIES 30.649 26.845 5.621LB 24.045 16,135 5,500 6.119FRUIT COCKTAIL 5,111 3.353 2,195LB 92.138 109.140 11,222 24.296 811 90!PEACHES 6.642 9.41·2 1.351LB 134.159 118,081 19.290 2,302PEARS 21.461 9.154 1.011LB 13,041 9,239 1.411 10333PINEAPPLES 1.852 1".900 493 lt285LB 71.310 18,164 11,819 13.064 88 272OTHER LB 8.208 4.614 1.324 81632.95tl 28,960DRIED 6.848 1.101 2.198 2.20A 563L8 204.751 195,046 !i54
I PRUNES 59.023 85.114 1l!.102 31.818... LB 82.155 100,926 23,995 4.126 14.526 I-' GRAPES (RAISINS) 40.163 5.428 14,029 2.016 .J L8 101.001 10,296 5,A87
OTHER 26.621 34.132 4,815LR 14,413 1,958 7,15621.594 23.824 8.401FRESH 10,819 1.860 3,436LB 2.124,019 2,314.016 151 1,483234,931 283,744 133,349APPLES L9 163.823 16,635 22,895127.621 178.869 14.187BERRIES 240326 20,924 23,668LB 28.391 34.681 1.123 9,532 2.3·U 3,206GRAPEFRUITS 645 1t120 149LB 414.111 426.734 38,165 38.934 322GRAPES 23,IM 24.514 1,957LB 211.854 224.316 41.5A8 41,443 2,313LEMONS AND LIMF.S 11,676 l~" 182 4,336LB 345.164 443,362 38,594 53.011 4.551 ORANGES.TAN6ERTNES.AND CLEMENTINE 19.971 30,409 2,260La 666,186 642,561 61.143 65.224 4,468PEARS 40.451 50.107LB 58.105 810551 4.319 5.677OTHER 6,639 10.926 1.508 12.861LB 264,121 281.930 858 107852b,893FRUIT JUICES 34,2a9 3.005 2,963GAL 35.679 42.143 414 566GRAPEFR!JIT GAL
66.317 81,267 3,091 2.933 5.893 6,595ORANGE 6.358 6,122 10,252 11,401 434 342 821 796GAL 18.451 22.101 42,417 51,225 1,5133OTHER lt599 3,197GAL 10,811 12,720 13,588 49?~7FROZEN FRUITS 18,6,,2 1.080LB 1U,531 19,314 2,202 5,584
992 1,274 1.0;52OTHER 888 95} 187 2573,629 5,349 333 49.0NUTS AND PREPARATIONS LB 144,699 133,911ALMONDS 93,127 121,284 13,.981 17,913 9.145L8 12,858 21993556.219 55,988 6~.428WALNUTS 1.425 110392 6.159LB 36.356 40,292 16,16114,190 21.282OTHER 3.298 2.498 1,341LB 35,485 37;406 "39822,949 30.574 3,258 4,023 2.246 4.376
CONTINOED--
kII
->-",~,,,~,- -- ~;-""."....,.."~~..",,,,. ...,."-,,,-.~~-.""""'''''-;:'''-:.~~~~~~"i

l --~~,..,." •....-.-""__...~_ ,,-em..... 'eR;t ....'.,., ..
t TABLE 6.--U.S. AGRICULTURAL EXPORTS: QUANTITY AND VALUE BY CONNODITY--CONT!NU~n
JANUARY-DECEMBER DECEMBF.R COMMODITY UNIT : QUANHTY VALUE' QUANTITY VALUE
1972 1973 11 1972 1973 11 1972 1973 11 1972 1973 11 THOU. THOU. 1.000 DOL. 1.000 DOL. THOU. THOU. 1.000 DOL. 1.000 DOL.
GRAINS AND PREPARATIONS 3.484.430 8.456.209 437.R69 931.745 FEED GRAINS AND PRODUCTS MT 28.117 41.910 1.548.1;95 3.576.387 2.727 3.175 169.138 394.423
FEED GRAINS MT 27.754 41.462 1.521.131 3.538.003 2.696 3.734 167.186 391.052 BARLEY 8U 57.384 91.037 57.799 188.022 7.013 7.247 9.789 17.864CORN BU 880.210 1.305.191 1,234.365 2.824.520 83.702 111.596 130.965 299.616 GRAIN SORGHUMS au 150.359 219.748 215,930 460.844 16.117 26.526 25.912 66,963OATS eu 22.581 510423 13.643 64.617 511 4.697 519 6.609
MALT AND FLOUR. INC BARLEY MALT LB 109.264 119.588 6".966 10.136 11.406 8.433 718 894CORN GRITS AND HOMINY LB 55.248 63.169 2.112 3.242 4.289 3,853 195 il22CORNMEAL CWT 2,047 2.489 8.918 1.2.381 176 3~3 7~8 1.294CORN STARCH LB 56.150 69.221 6.364 8.676 5.500 6.319 589 858OATMEAL AND GROATS CWT 80 183 452 1.312 0 4 0 41 OATMEAL & OATS. ROLLED. ETC LB 26.979 40.168 1.946 2.637 2.181 438 2nl 63
RICE. MILLED BASTS LB 4.482.431 3,582.086 3aR.217 539,960 407.302 405,633 43.781 97.521MILLED LB 2.895.000 2.669.370 270.949 4310841 288,914 378.970 32.901 92.899HUSKED. BI'lOWN LB 1.587.431 912.116 117.328 108.119 118.388 26.664 10.881 4.622
RYE au 195 310552 236 65.792 161'; 1.251 194 3.752WHEAT AND PRODUCTS ~U 840.269 1.422.008 1.479.109 4.176.363 110.828 93.555 217.744 427.975
WHEAT au 783,266 1.371.516 10365.876 4.019,794 106.827 89.493 207,226 408,995WHEAT FLOUR CWT 20.376 17,2"91 85,942 110.499 1.315 1.166 7.249 11,147OTHER WHEAT PRODUCTS au 10.569 11.364 27.291 46.069 10006 10406 3.270 7.833
I BAKERY PRODUCTS LA 22.148 24.674 8.072 10.110 2.002 2.302 828 1.010 I'" I INF"ANTS AND DIElETIC FOOOS LB 212.086 191.497 22.408 27.906 9.553 1.609 1,156 1.111'" BLENDED FOOD PRODUCTS LB 284.868 291.546 24.419 34.887 36.667 26.195 3.237 3.411OTHER 13.416 24.805 10192 2.542
PEEDS AND FODOERS.EX OIL CAKE&HEAL 160.412 210.868 17.012 20.389 I CORN BYPRODUCTS. FEED 21 ST~ 862 996 53.344 94.314 66 6? 4,894 7.074ALFALFA MEAL. DEHYDRATED STN 168 161 8.557 10.105 12 q 698 696ALFALFA MEAL. SUN-CURED STN 144 188 7.065 9,82" 8 2(' 600 1.766ALFALFA HAY CUBES STN 19 75 917 4,186 6 I5 285 292POULTRY FEEDS. PREPARED STN 118 115 18,999 29.259 10 12 1.787 3.122 t OTHER 11,469 122.521 8.808 1,439
OILSEEDS AND PRODUCTS 2.40B.177 4.305.925 289.2:34 523,549--- IOIL CAKE AND MEAL STN 4.246 5.283 434,141 985.325 461 557 55.585 112.378
SOYBEAN OIL CAKE AND MEAL STN 3.985 4.866 408,949 932.962 437 520 52.9?'5 105.890OTHER STN 26l 416 25.198 52.364 29 37 2.659 6.488
OILSEEDS 1.657.929 2,963,473 212,752 365.468FLAXSEED au 10.557 418 32.165 2,577 . 2.458 209 8,114 1.736SOYBEANS ~U 440.768 486.484 1,508.073 2,758.643 49.651 58,028 185.950 334.924SAFFLOWER SEED LB 93.155 147.513 4.295 9.23.3 17.926 493OTHER 113.396 193,020
51 18.195 28.802
5
VEG OILS AND WAXES LB 2.273.547 2.129.192 316,102 357.127 163.894 189,717 20.898 45.104COTTONSEED OIL LB 475,705 545.868 64,622 85.976 32.154 31h321 3.824 8.020SOYBEAN OIL LB 1.310.763 970.(J75 116.479 152.006 64.952 116.131 7.790 26.618OTHER LB 487.018 613.250 75,001 119.J46 66.78!'! 35.259 9.284 11.065
CONT.INUED-

,~ ....""'., ....- .."..----..~ ...-,,-..........-----.',-_~"".,._,,,,,~;~,,,,,,,,, .".,.,•. ",-~';''''_;''''''''''''''''4 ............ ,C .......t ~ ......"_~"_"""~,/j:'t.~'.,,,,_.'~~.~,, ,_,....'...._".,""...
TABLE 6.--U.S. AGqICULTURAL EXPORTS: QUANTITY AND VALUE BY COMMODITY--CONTINUEO
JANUARY-DECEMBER DECEMS~R
COMMOnITY UNIT : QUANTITY 1972 1973 11
VALUE 1972 1973 11
QUANTITY 1972 1973 11 1972
VALUE 1973 1/
THOU. THOU. 1,000 DOL. 1,000 DOL. THOU. THOU. 1,000 DOL. 1,000 DOL.
TOBACCO,UNMANUFACTIIRED RURLEY
LB LB
635,516 53.665
638,172 59.299
672,123 610264
713,972 73,845
59,614 2,493
59,544 3,113
69,415 2.828
12,350 4,337
CIGAR WRAPPER DARK-FIRED KENTUCKY AND TENNESSEE
LB LB
3,060 20.630
2.091 18.430
15.264 15.217
9.910 14,395
235 1.945
13 10493
1,653 10451
330 1,191
FLUE-CURED LB 425,308 416.463 516,544 54\1.453 42.941 39,094 51:,118 60.233 MARYLAND BULK SMOKING TOBACCO OTHI!R
LB LB LB
10.992 29,367 92,495
9,511 25,792
101,125
11 ,558 33,298 18,917
10,431 32,935 22,942
511 3,421 8,057
692 2,927
12,092
516 4,031 1.872
711 3,656 1,1186
VEGETABLES CANNED
AND PREPARATIONS LB 114.376 196.213
256,615 21,733
373,238 40,438 10,693 24,215
26,287 2,048
39,264 5,515
ASPARAGUS LB 3.822 4.053 1,247 1,625 288 126 115 60 COAN LB 20.372 51,611 3,507 8,165 2,349 7,478 439 1,326 SOUPS LB 20.328 28,370 4,411 cy635 10643 2,380 347 "66 TOMATOES,TOMATo SAUCE AND PUREE OTHER
LB LB
35,330 34.526
68.044 44,135
5,821 6,746
14,473 8.941
3.276 3.131
9,839 4,392
550 598
2,384 10080
PULSES LB 577.171 744,981 52,412 101,140 14,501 59,338 6,941 13,012 DRIED BEANS LB 215,051 449,302 30,717 64,992 35,852 40,660 3,693 9.284 DRIED PEAS. INC COW AND CH~CK LB 226.693 239.019 13.163 25,431 28.691 17,625 1,801 3.419 DRIED LENTILS LB 15.427 56.600 8.592 10.711 9.957 1,052 1.441 309
I
FRESH LETTUCE ONIONS
LB LB LB
1.424,291 338.283 128,811
}.590'743 345.496 186,155
91",356 18,241 1,837
12.2.207 23,462 16.556
113,3~3
32,4"" 9,413
116,101 24,026 18,185
8.259 1,990
586
9.965 1,511 1,862
'" co I
POTATOES, TOMATOES
EXCEPT SWEET POTATOES LB LB
383,174 136,151
4610899 150,660
12,445 11,480
18,588 20,153
11,899 14,904
23,918 14,692
412 1.879
A81 1,934
OTHER LB 436.666 446.532 35.353 42,848 44,639 35,885 3 .. 332 3,111 FROZEN VEGETABLES LB 25.962 45,815 4,178 9,514 1,927 4,421 3!H 835 HOPS LB 19,589 13.412 1&,801 12.998 2,611 1,9(!9 3,0:;0 1.531 SOUPS AND VEGETARLES. DEHYDRATED LB 29.561 32.331 13.439 15.491 2,.96\, 2.881 1.356 1.394 TOMATO JUICE. CANNED GAL 1.592 2,536 1,744 2,942 233 316 265 461 VEGETABLE SEASONINGS LB 4'1, 913 53.844 12,510 15,399 3,12R 5,302 881 1,406 OTHER 39.715 53.050 3.136 5,018
OTHER VEGETABLE PRODUCTS 213,510 355,941 33.305 31,656 COFF!'.:E l R 30,590 410918 30.032 39,010 2.1167 3,622 2,146 3.629 DRUGS, HER8S. ROOTS, ETC ~SSENTIAL OILS AND RESINOIDS
L8 LI3
10.629 13,368
11 ,195 15,980
14,261 36,643
15,271 51.573
851 1,667
en9 1,134
1.818 3,110
1,805 5,609
FLAVORING SIRUPS. SUGARS. ExTRACTS 52,955 52,713 9.376 3.601 HONEY LB 4,102 17.571 1,429 1,315 388 605 152 316 NURSERY STOCK 11 ,473 13,544 847' 1,249 SEEDS, SPICES
EXCEPT OILSEEnS LB LB
264.051 8,434
319.234 9.318
63,617 5.841
89,595 7,006
33.608 682
68.966 891
8,663 491
14,208 149
OTHER 51.193 19,758 5,502 6.,484
11 PRELIMINARY

--~~'------------~-'''--",,-','' '---I
,
SPECIAL this •Issue
iiSnaaa see:: nEE: ii iii iiU iii an Ii IIUi nlSan 2iLUUSiO unUUEii28ile i2 nn il!ii EiiI!Ii
U.S. AGRICULTURAL IMPORTS IN 1973 REACHED A RECORD $8.4 BILLION
U.S. imports of agricultural products advanced strongly during calendar year 1973, reaching a record high. of $8.38 bt11ion--30 percent above the 1972 level. About ninetenths of the nearly $2-bi11ion gain resulted from higher prices. Volume, measured by the volume index, rose only 3 percent to 121 (1967 = 100). Following currency realignment in February 1973, imported items from many countries became more expensive in dollar terms. Strong demand raised some commodity prices markedly, especially for certain tropical products. Competitive agricultural imports rose 29 percent to ,$5.52 billion, and noncompetitive items jumped 31 percent to $2.86 billion. In November 1973, total farm product imports broke previous ~ecords, reaching $850.5 million.
Beef and veal impprt volume remained at 1972's 1.5 billion pounu level, but sharply higher prices raised value by 36 percent to $1.17 billion. In 1973, beef and veal imports from Mexico, Ireland, and ~rgentina were less than in 1972, while those from New Zealand, Australia, and most Central American countries increased. Mexico placed export restrictions on cattle and beef to increase the availability of meat in domestic markets, and U.S. feeder cattle imports from that country declined substantially. Total dutiable cattle entries--which include nonregistered feeder cattle, calves, and heavyweight catt1e--numbered 1,019,000 head in 1973, compared with 1,169,000 in 1972. Although entries from Canada were higher, these did not offset the drop in 200-700 pound feeders from Mexico.
Pork import volume went up slightly from 1972's 395 million pounds, but higher prices pushed value up 46 percent to $440 million. Denmark, the Netherlands, Poland, and Canada--the principal sources of canned hams, shoulders, and fresh-frozen pork--reva1ued their currencies upward relative to the dollar in February 1973. Strong demand and inflationary pressures also resulted in higher prices for meats imported from those countries.
Dairy product imports jumped significantly in 1973--to $331 million from $167 million a year earlier, primarily because import quotas on nonfat dry milk, cheese, butter, and butteroil were increased during the year. Cheese import volume gained nearly 30 percent, mainly cheddar, Swiss, and "other" cheeses not specifically described in tariff schedules. Nonfat dry milk imports totaled 266 million pounds ($87.3 million); butter imports amounted to over 43 million pounds ($25 million); and butteroi1 imports, 23 million pounds ($12.9 million). Imports of these items were insignificant during 1972. West European countries, Canada, Australia, and New Zealand were the principal sources for U.S. dairy product imports.
Fruit, nut, and vegetable imports totaled $791 million in 1973, 20 percent higher than their year-earlier level. Fruit imports were valued at $217 million, compared with $182 million in 1972. Volume increases for frozen strawberries, fresh and canned oranges, mangoes, melons, pears, prunes, and grape juice, plus price rises, accounted
-24

I
j-'- ..-...~.
for most of the gain. Edible nut imports totaled $148 mil~ion, compared with about f $116 million in 1972. Volume increases were concentrated in chestnuts, shelled
cashews, pis tache nuts, and filberts. Vegetable imports totaled $425 million, 17 percent higher than the 1972 value. Volume gains were recorded for tomatoes, cucumbers, eggplant, garli.c, onions, peas, peppers, and potatoes •
., Overall, imports of oilbearing commodities reached nearly $312 million, compared with $213 million in 1972. Increased imports of oilbearing materials stemmed mainly from higher prices. Copra, coconut oil, castor, palm, palm kernal, and tung oil prices rose with strong upward demand pressures. Import volume was somewhat higher for sesameseed, castor oil, and coconut oil, but lower for copra, palm oil, and olive oil.
Wine impor.ts rose 17 percent in volume to 55.5 million gallons as demand for table wines continued to expand strongly. Higher prices caused value to ju~ 37 percent to $287 million.
Other competitive or partly competitive agricultural import gains took place for sugar and related products, grains, feeds, hides, nursery stock, seeds, swine, and eggs. Sugar import volume in 1973 totaled 5.23 million short tons, 1 percent helow the previous year. Higher prices pushed import value up 10 percent to $918 million.
Noncompetitive agricultural import gains in 1973 were primarily due to higher prices, especially for coffee. cocoa, crude rubber, spices, essential oils, and carpet wool. In 1973, $2.86 billion worth of noncompetitive items were imported, compared with $2.18 billion in 1972. The volume index rose by 3 percentage points to 109 (1967 = 100), with increases for coff~e, rubber, bananas, tea, pepper, and silk. Green coffee import volume rose 5 percent, while value advanced 32 percent. Such imports from Brazil totaled 608 million pounds, ~ompared with 814 million pounds in 1972. Freeze damage in mid-1972 reduced Brazilian supplies and contributed to sharply higher prices. Increased imports from Colombia, Central America, Mexico, Angola. the Ivory Coast, and Ethiopia more than offset the volume decline from Brazil. Cocoa bean import volume fell 12 percent to 555 million pounds, mostly because of reduced production. But because of sharply higher prices resulting from strong demand, the value of cocoa bean imports jumped 40 percent to $212 million.
Crude rubber imports totaled 1.4 billion pounds, 7 percent higher than in 1972. Larger industrial demand for natural rubber was the main factor. Prices more than doubled with demand in other countries also higher. U.S. crude rubber import value soared 79 percent above the 1972 level of $190 million.
-25

Commodity
Supplementary
Animals and an1mal p~oducts: Cattle, dutiable •••••••••••••••••••••••• : Dairy products .............................. ~ .................... : Hides and skins ••••••••••••••••••••••••• : Meats and meat products, excluding poultry ................................ :
Wool, apparel ••••••••••••••••••••••••••• :
Other animals and animal products ••••••• :.____~~------~=_----~~------~~ Total animals and products •••••••••••• : 735 883 892 783 920 1,159 1,079 1 Za ".~"U
Cotton, raw, excluding linters ............ ,. .......... ~ Fruits and preparations ...................................... .: Grains and preparations ...................................... : Nuts, edible, and preparations 4 •• ~ ......... : Oilseeds and products ~
Coconut oil .......................................................... :
, '" ~
Copra ................................... : Olive oil edible ...................... : Other oilseeds and products ••••••••••••• :
Sugar and molasses: Sugar, Cane .......................................................... .: Nolasses, inedible ............................................ !
Tobacco, unmanufactured ...................................... : Vegetables and preparations ............................ :-Wines and malt: beverages:
fnnes ................................... : Halt beverages .......................... :
Othe" supplementary vegetable products •••• : Total supplementary products ............ :
46 16 78
1,938
S2 18 88
2,128
54 19 98
2,292
62 23 98
2,096
68 21 92
2,247
77 23
101 2,627
87 23
103 2,696
100 26
104 3,037
117 27
105 3,089
145 32
141 3,608
162 34
145 3,688 4
210 35
;:8iii4
287 49
226 523
Complementarv
Bananas, fresh .. , ........................................... : Cocoa beans ....... ~ .......................................... -: Coffee, green .............................. : Drugs, crude ........................................... :Essent:ia1 ails ......................................... : Fibers, unmanufac.tured ....• ~ ............... ~ Rubbe", crude, excluding allied gUlnS •••••• : Silk, ra\J •••..•••.•.••• , ........ , .... ~ ................. ; Spices .................................... : Tea, eTude ............................................... : Wool, carpet ................ .., ... ~ .............. ~ ................. : Other complementary products ••••••••••• , •• :
~=! :;:~:!~ ~; :!.~:!
1; :;:;
!!:'!! 42 33
J..:Jl
J.,.l~1~i J.tI
~.,j ~/..l.)
£Vi
i.i ~2 j, 'j;'
ou .t.L.:J!lU 38 47
120 ~,059
21 31 31
1HZ 23 47 57 71 39
12? 1,067
25 29 215
177 23 44 o'=i7 72 ""
Total complementary products ............ : 1,753 1,740 1.719 1.986 1,840 1,864 1,755 _,, __
Total agrIcultural imports 1/
11 1/
Preliminary. Totals may not add due to rounding.
8,382

Table 8.--U.S. agricultural imports: Value by months. January 1961 to December 1973
Months 1961 1962 : 1963 : : 1964
: : 1965
: : 1966
: : U67 1968 1969 1970 1971 1972
1973
!I
-- Million~
January ................... Febrnary .................. March .....................
298.7 276.2 345.5
326.0 299.9 325.3
232.9 374.3 352.7
331.7 294.5 381.7
175.1 269.3 420.3
352.7 371.2 430.7
413.0 353.7 412.9
414.7 402.4 369.7
208.6 315.6 474.8
491.0 457.5 523.9
506.6 419.7 499.6
575.6 591.6 506.6
648.9 615.3 658.7
January-March ••••••••••• 920.4 951.2 959.9 t.007.9 864.7 1.154.6 1.179.6 1.186.8 999.0 1.472.4 1.425.9 1.673.8 1.922.9
April ..................... &y •.•...••••..•..•.••..•• June ......................
286.9 294.9 314.8
312.7 335.9 288.0
348.4 323.3 295.7
361.2 328.6 314.1
368.5 337.9 344.6
383.0 358.1 387.1
362.8 337.0 364.8
439.5 434.4 386.7
487.9 438.1 430.0
514.5 443.5 499.4
554.4 477.9 529.8
489.5 529.0 520.6
696.2 786.3 664.0
April-June •••••••••••••• 896.6. 936_.6__9_&.I.lt__---.LJl0_:L~;;].&_1..].28.2 .... l,06t..6 .. 1,260.6 1,356.0 ·1.457.4 1.562:1 1.539.1 2,146.5
January-June 1.817.0 1.887.8 1.927.3 2.011.8 1.915.7 2.282.8 2.244.2 2.447.4 2.355.0 2.929.8 2.988.0 3,212.9 4,069.4
I N .... I
July...................... August •••••••••••••••••••• September •••••••••••••••••
July-September •••••••••••
315.1 334.4 296.6
946.1
296.5 330.0 313.1
939.6
335.2 346.7 343.1
1.025.0
316.7 315.2 338.4
970.3
260.3 318.7 354.0
933.0
342.6 352.6 415.3
1.110.5
346.8 369.4 347.7
1,063.9
438.6 442.1 460.3
1.341.0
434.0 407.7 398.6
1.240.3
461.7 463.8' 469.0
1.394.5
489.0 555.1 650.5
1.694.6
471.6 563.7 547.1
1,582.4
634.6 719.9 638.5
1.993.0
October November •••••••••••••••••• : December •••••••••••••••••• :
320.8 305.5 301.6
332.5 356.8 351.3
374.3 317.5 367.1
347.7 381.6 370.6
411.0 398.8 428.1
388.1 358.6 351.6
376.3 379.7 388.3
396.0 419,4 419.8
469.1 411.2 481.8
480.3 442.9 522.3
302.5 298.2 540.2
573.6 547.7 550.2
710.3 850.6 759.0
October-December ••••••••• 927.9 1.040.6 1.058.9 1.099.9 1.237.9 1.098.3 1.144.3 1.235.2 1.362.1 1.445.5 1.140.9 1,671.5 2,319.9
July-December 1.874.0 1.980.2 2.083.9 2,070.2 2.170.9 2.208.8 2.208.2 2,576.2 2.602.4 2,840.0 2.835.5 3,253.9 4.312.9
January-December ~ ••••••• : 3.691.0 3.868.0 4.011.2 4,082.0 4.086.6 4.491.4 4.452.2 5.02~.6 4,957.2 5.769.8 5.823.4 6,466.9 8.382.3
Monthly average ••••••••• : 307.6 322.3 334.3 340.2 340.5 374.3 371.0 418.6 413.1 480.8 485.2 538.9 698.5
!I Preliminary.11 Totals may not add due to rounding.

Table 9 .--Average unit values for principal imported agriclO1tural products; calendar years 1969-73
AVerage unit valuesCOllllllodity ~Unit:--------------________________________________________
Cattle, 200-700 1bs •••••••••••••• :No. Cattle, 700 lbs. and oveL •••••••• :do. Beef, boneless, frbsh or frozen •• :Lb. Pork, hams and shoulders, canned .:do. Pork, frozen ..................... :do. Cheese, Emmentha1er •••••••••••••• :do. Cheese, Edam and Gouda ••••••••••• :do. Milk, dry, not over 3% butterfat .:do. Casein, excluding mixtures ••••••• :do. Sheep and lamb skins ••••••••••••• :do. Mink furskins •••••••••••••••••••• :No. Wool, appaL'el .................... :G1b.: Cotton, raw •••••••••••••••••••••• :Rble: Apples, fresh •••••••••••••••••••• :Lb. Oranges, fresh •••••••••••••••.••• :do. Oranges, canned, mandarin •••••••• :do. Cante10upe, fresh •••••••••••••••• :do. Pineapples, canned ••••••••••••••• :do. Strawberries, frozen ••••••••••••• :do. Brazil nuts, shelled ••••••••••••• :do. Pistachio nuts, not shelled •••••• :do. Cashew nuts, shelled ••••••••••••• :do. Barley, unmilled ••••••••••••••••• :Bu. Biscl1its, cakes and wafers ••••••• :Lb. Copra ••••••••••••••••••••.••••••• :do. Coconut oil •••••••••••••••••••••• : do • Palm oil ......................... :do. Sugar, cane and beet ••••••••••••• :Ston: Molasses, inedible •••••••.••••••• :Gal.: CucUlDbers, fresh ••••••••••••••••• :Lb. Onions, fresh or dry ••••••••••••• :do. Peppers, fresh ................... :do. Squash, fresh .................... :do. Tomatoes, fresh •••••••••••••••••• :do. Tomatoes, canned •••.••••••.•••••• :do. Tomato paste and sauce ••••••••••• :do. Tobacco leaf, oriental ••••••••••• :do. Beer and ale ••••••.•••••••••••••• :Gal.: Wine, still grape, less than 14%
alcohol ••••••.•••••••••••••••••• :do. Bananas, fresh ••••••••••••••••••• :Lb. Coffee, green .................... :do. Coffee, roasted or ground •••••••• :do. Coffee, soluble •••••••••••••••••• :do. Cocoa beans •••••••••••••••••••••• : do • Cocoa butter ••••••••••••••••••••• :do. Lime oil ••••••••••••••••••••••••• :do. Sisal and henequin ••••••••••••••• :Lton: Rubber, natural, dry ••••••••••••• :Lb. Rubber, natural, latex ••••••••••• :do. Pepper, unground, black •••••••••• :do. Silk, raw •••••••••••••••••••••••• :do. Vanilla beans .................... :do. Tea, crude ••.•••••••••••••••••••• :do. Wool, carPet ..................... :Glb.:
1969
84.14 305.73
.46
.83
.48
.53
.46
.11
.21
.73
.61 137.52
.10
.06
.19
.06
.12
.17
.44
.62
.55 1.11
.36
.08
.12
.07 134.16
.10
.09 ,07 .18 .13 .15 .09 .15 .68
1.11
4.31 .05 .33 .37
1.07 .34 .88
7.37 J.23.31
.21
.20
.29 7.08 4.77
.38
.36
1970
86.30 367.31
.50
.88
.43
.56
.48
.10
.22
.61 9.30
.52 169.68
.09
.08
.21 .05 .12 .14 .40 .65 .60
1.19 .37 .09 .13 .10
138.68 .11 ,09 .09 .18 .13 .15 .09 .14 .61
1.11
4.45 .05 .44 .47
1.31 .32 .68
7.23 107.36
.19
.18
.43 7.75 4.63
.38
.35
1971:.........,,:
Dollars -
.100.48 385.20
.53
.84
.31
.58
.55
.18
.29
.81 8.93
.48 171.32
.10
.07
.21
.05
.12
.13
.46
.60
.59 1.19 .37 .08 .13 .11
143.69 .11 .10 .08 .18 .13 .15 .09 .14 .64
1.18
4.09 .04 .41 .46
1.46 .26 .52
6.28 108.46
.15
.16
.44 1.93 4.46
.41
.36
1972
122.68 454.02
.57
.85
.47
.53
.64
.22
.47
.94 11.92
.60 163.31
.09
.06
.22
.06
.12
.15
.48
.80
.62 1.39
.42
.06
.11
.09 151.61
.13
.08 .09 .18 .13 .15 .10 .15 .61
1.24
4.21 .04 .43 .54
1.40 .24 .56
6.1.2 114.45
.14
.16
.39 8.18 4.75
.41
.50
1913
111.17 486.93
.71 1.23
.65
.66
.70
.33
.44 1.45
15.65 1.13
187.09 .13 .07 .22 .07 .13 .21 .55 .80 .70
2.47 .45 .10 .13 .11
174.96 .21 .09 .08 .18 .12 .15 .13 .17 .60
1.40
4.94 .05 .54 .57
1.49 .38 .96
6.49 166.03
.24
.21
.46 10.35 4.43
.40
.97
-28

TABLE 10.--0.S. AGPICUlTURAl I~POPTS: QUANTITV AND VALUE BY COMMODITY
JANUA~Y-DECEMBER DECEMBERCO/4/110DITV UNIT : IlUAt.TITY VALUE QUANnT~ VALUE1972 1973 11 1972 1973 11 : 1';72 1973 11 1972 1973 11 THCU .. THCU. 1,000 COL. 1,00C DOL. THOU. THOU. 1.000 DOL. 1.000 D~L. ALL COMMOD IT I ES 55,309.700 ~e.653.0CO "'.760,500 5.761.700 NONAbRICULTUP,AL COMto10DITIES ~- 48.842,791 60.270,625 4.210,3...6 5,002,6B8 AG~ICULTURAL COMMODITIES 6.466,903 8.382.315 550.154 759.012 SUPPLEMENTARY .... 284,303 5.523.302 365 ....37 516.926 ANIMALS AND ANIMAL P~ODUCTS 1,831.0E4 2,55<;.025 162,839 245.947
ANIMALS. LIVE 182. lE8 231.906BABY CHICKS 36.224 35,932NC 3,291 3,064 1,563 1,626 198 207 65CATTLE. DUTIABLE NO 92:1..169 1.019 152.084 192,298CATTLE FOq BREEDING. FREE Nt! 2"'2 ,185 33.844 32.82117 16 9.874 10.965 2 i 1.022HORSES 1.039" 11,470 13.298OTHER
NO " 0 0 861 1.0531.777 13.119 433 926 DAIRY PRODUCTS 167,610 331,003CHEESE 16,584 29,80.0LB 179.3...2 232',025 110.310 14<;.969
I
19.938 29.9...0 f8LUE MOLD. INCLUDING RDOUEfCRT L8 6.971 12.217 20.7948,175 6,.910 7.731 918 970 821CHEDDAP 1.014 I
LB '1.512 21.044 4.903 11.588 1.089 h142 535.. COLBY LB 792 691 \Q
1.160 317 555 36 58 11 I
EDAM AND GOUDA 26LB 10.130 11,594 6.507 8.158 1,588 1,922. 963POMANO,REGGIANO.PAR,..ESANO 1.415 IL8 12.144 12,0"'1 8,512 ... 494 1.546 1.16_ 984 1.681PECO~INO ~LB 22,958 17,212 17,959 14,306 2.338 1.83i 1,814 10538SWISS LB 47.036 65.775OTHER 29.514 "'3.~03 5.0"'7 , 8.008 3.000 5.388LB 69 7 800 95,025 35.627 5"~233 1.3768UTTEP 14.241 4.084 9.036 iLB 714 ~3.489 414 25.167 97 1 65 3CASEIN AND MIXTURES LB 105.401 112,221 50.920 50.346 1.250NONFAT OR V MILK 11i084 3.424 5.173 ,LB 1.602 266,564 360 87.299 1.106 608OTHER 238 1635.546 18.222 639 3.666
HIDES AND ~'(JNS•.lNClUIHNG FUR'>KI NS 116.993 160.706 fCALF AND KIP SKI~S 10.655 10,968L8 3.600 4.515 1.868 3,073CATTLE HIDES 301 431 209 316 !LB 16.351 39.053 5.011 13.641 1.471 3,625 629GOAT ANa KID SKINS 1.096 !L8 5.242 3,102 5,392 4.154 360 18 450SHEEP A~D LAMB SKINS 33LO 46.447 36.261 45.084 53,188 1.370 1,109 1.803FURSKINS 1.41451,792 71,102OTHER. 6,873 7,1917.187 <;,543 691 719 MEATS AND MEAT PPEPAPATIONS Lfl 2.012,501 1,911.86'1 1,219,354 1.665.320 137.571 155.849 88.963BEEF AND VEAL 156.817LB 1,480.855 1,494,832 861.,614 10 171,795 102.152CANNED 121.164 60.953 113.119LB 100,458 93.557 63.501 12.112 5,695FJ:,ESH OJR FROZEN 7.766 3.480 7·~899LB 1,324,241 1,348.534 154,750 1.045.613 <;3.278 109,864PPEPARED all PRESERVED LB 56,156 52.142 43,423 54,010 3.119
5;,231 100,749 MUTTON, GOAT, AND LA~B LIl 92,866 40.172 30.945
3.534 2,243 4,47222.001 1.395 884PORK 500 552LB 394.740 397.930 301,994 43... 168 30,755FlIES!" 1R FROZEN LB 30.125 25,612 39,72964,389 62,361 29.998 41,2B4 3.042HA"'SAND SHOULOEflS,CND,COOKED.ETC L8 298,950 307,225 251.626 374.021
3.177 1.112 2.31324.434 24.611 21,788OTHER 35.011LB 31.401 28,343 20,370 24.457 3,219 2.337eTHER 2.112 2 .... 06 LB 44,039 3B.\!"'4 24.741 31,156 3,26'1 3,675 1,897 .3,416
CONTUUED-
I
~. . -;''''y'-..,J

"J~'~';";::t:r~ 'to;~; ~:.:,,,{"~,:,~~,;:~:-~~,~:...a),J1;:~;~:~'"/,,:~'1' }~~,~:-.t':o '';:,:'~~_\ '".' ~~0"! ~ ;' ,., ,~.'! t',:~';:~>;";:": :,':~{.j~:;.' ';:"', ~~ ""i';':;;·;":'~7.,)(":;Y",~--::~ ~i. -';;"1[ ;;""'-"",->'",;";0.
,".--.~-~
TABLE 10.--U.S. AGRICULTURAL IMPORTS: QUANTITY AND VALUE 8Y COMMODITY--CONTINUED
JANUARY-DECEMBER" DECEMBER COMMODITY UNIT : 'QUANTITY 'UlUE QUANTiTY VALUE i
1972 1973 1/ 1972 1973 11 1972 1973 11 1972 1973 11 THCU. THOU. 1,000 DOL. 1,000 DOL. ·fHOU. THOU. 1,000 DOL. 1.000 DOL.
~ :-i~ POULTRY PRODUCTS 2,809 8,066 154 512
EGGS, DRIED AND OTHERWISE PRESERVED LB. 48 38 35 29 It :3 3 2 EGGS IN THE SHELL DOl 1.770 13,820 1,652 6,626 89 795 51 391 POUL TRY MEAT LB 976 870 1,122 1,410 61 42 100 119
OTHER A~IMAL PRODUCTS 141.531 162,024 --- 10,260 11,918 BEESWAX LB 2,863 2,802 1.909 2,133 159 204 99 194 BONES. HOOFS, AND HORNS 6,210 3,864 295 361 BRISTLES, CRUDE OR PREPARED L8 3,401 3,450 13,283 13,140 155 2 It- 511 811 FATS. OILS. AND GREASES LB 16,B95 24.616 2.911 4,129 816 2,310 113 428 FEATHERS AND DOWNS. CRUDE, SORTED LB 8,278 9.059 15,152 16,534 484 683 1,003 1.303 GELATIN 15,109 19.049 1.084 1,591 HAIR. UNMANUFACTURED LB 5.858 5.340 6.228 6.481 569 109 599 574 SAUSAGE CASINGS 27.210 28,569 2,029 2,425 '\ OSSEIN LB 13.242 11.862 5,541 5,116 2.~79 627 1,001 179 RENNET LB 1.107 10718 3.292 2.955 29 69 197 228 WOOL.UNMANUFACTURED.EX FREE IN BOND GLB 41.288 31,890 24.914 35,935 2,570 1,256 1,886 2.028 OTHER 19,586 24,118 1,444 1,735
VEGETABLE PRODUCTS 2.453,239 2.964.217 202,598 270,979
COTTON, UNMANUFACTURED RBA 126 66 13,710' 8,029 3 3 IS7 339 I COTTON. RAW RBA 74 33 12,085 6,174 0 1 57 166 0 L INTE!l S RBA 52 33 1,E:25 1,855 2 2 101 173 I '" I ! '
FRUITS AND PREPARATIONS 181,675 2170132 16,084 17,259 APPL ES. FRESH LB 91,182 96,731 8,952 12,200 7,103 6,656 745 980 APPLE AND PEAR JUICES GAL 25,566 20,644 8,599 13.675 10509 2,093 870 1,454 BLUEBERR IES LB 13,984 15,249 ~" 399 5,833 842 869 347 376 STRAWBERP.IES LB 136,041 162.075 21,356 33.563 7.554 8.164 1.436 1,7BO
:;,
OTHER BEll R IES LB 16,15B 21,131 3,232 4.929 1,174 417 261 170 CHERR I ES LB 9.V.7 6,817 2.919 2,899 465 33 138 35 DATES LB 26.101 24.934 2.787 2,178 18,021 8,184 2,049 1,016 FIGS LB 18,171 7,562 2,OB9 2,029 624 1,128 102 590 GRAPES LB 36,356 31,904 5.470 6,631 1,926 129 365 37 ~
" MELONS LB 340.393 361,175 13,661 16,922 3.029 1.227 189 72 :,:' ORANGES. MANDARIN, CANNED LB 81,055 90,932 17,710 20,130 5,505 4,415 1.360 1,050 ORANGES. FRESH LB 109.670 121,145 6,952 8.896 19.005 19,9B3 1,568 1,958 'f
ORANGE JUICE, CONCENTRATED GAL 38.075 20,146 14,836 1,822 4,511 1,738 1,4'11 3,051 PEARS. FRESH LB 21,606 28,173 3,062 3,970 130 32 177 6 PEA'IS. PREP OR PRES LB 8,990 1,621 1.031 253 629 24 80 19 PINEAPPLES, CND. PREP OR PRES LB 251,068 221,590 30,<685 29,247 13.620 9.544 1,100 1,325 'r. PINEAPPLE JUICE GAL 10,680 10.102 2,554 2.339 296 1,242 59 295 ~t
JELLIES AND JAMS lB 12,107 9.518 3,505 3,528 675 561 209 212 OTHER 21,873 39.,t>88 2,932 2,835
CCNTINUED
':;J
:::7. ~
-' "
",.':., ..... ' " , ,,):'tl:.·...::-.n :'"'; ~ .<-~.. "~." y•.•. '.,.....: ",;'-:",";~'<

TABLE 10.--U.S. AGRICULTURAL IMPORTS: QUANTITY AND VALUE BY COM~ODITY--CO~TINUED
COMMODITY UNIT : JA~UARY-OECEMBER
eUANT lTY VALUE 1972 1973 1/ 1972 1973 1/
THCU. THOU. 1,000 COL. 1,000 DOL.
DECEMBER QUANTITY VALUE
1972 1973 1/ 1972 1973 11 THOU. THOU. 1,000 DOL. 1,000 OCl.
NUTS AND PREPARATIONS ALMONDS BF Al IL NUTS CASHEW NUTS CHESTNUTS COCONUT MEAT, FR, PREP, F IL8ERTS PISTACHE NUTS WALNUTS r'lTHER
OR PRES
LB LB LB L8 LO LB L8 LB
327 38,232
106,797 10,621
118,3('7 5,560
17.7B6 758
244 34,6B3
108,032 12,856
102.595 10,245 34.0B6
1,253
115,657 252
11,882 66,029 3,911
12.813 3.235
14, :'!l8 440
2.779
14B,163 235
13,255 75,728
4,705 16,917
6.096 27.597
862 2,769
63 1,568 9,363 1,616
10,195 881
2,410 43
65 1,588 7,237 2.690 9,101 1,63B
21 0
10,B92 46
823 5,583
597 1.002
517 L.870
32 423
11,452 39
B75 6,OB7
949 2.17B
996 19
0 309
I .... ....
GRAINS AND PREPARATIONS BARLEY BARLEY MALT CORN OATS !liCE RYE WI-IEAT WHEAT FLOUR WHEAT GLUTEN eISCUITS, CAKES, WAFERS, BP. EAD CRUMBS 3FEAD, YEAST-LEAVENED MACARONI, SP~GHETTI, ETC r"THER
ETC
BU CWT
BU BU LB BU BU
CWT LB LB LB LB LB
16,535 275 922
4,379 31,709
154 1
40 32,064 89,461 23,020
6,320 42,19B
8.329 296
1,133 1,021
32,641 0
47 38
30,903 94.914 29,224 4,791
49,513
en, 130 22,964
1,414 1.724 3,509 1,924
166 4
210 8,OB5
37,396 3,315 1,416 8,110 6,893
111,750 20,586
1,901 2,744 1,201 2,753
0 132 380
9,015 42,674
5,263 l,426
11,399 12,274
2,643 14 72
229 4,607
0
°0 2.977 6,822 2,138
394 3,799
932 29 29 10 69
0 40
0 2,678 6,082 1,727
381 3,67B
10,723 4.262
BO 156 189 335
0 0 1
764 3.203
322 99
759 553
9.680 2,323
329 III
1B 30
0 12
0 925
3.066 623 116
1,136 991
OILBEARING OIL CAKE OILSEEDS
COPRA SESAME OTHER
MATERIALS AND AND MEAL AND DILNUTS
SEED
PRODUCTS STN
LB lB
17
460,714 47,220
25
437,756 52,295
213,149 719
42,041 25,607
8,249 8,lB4
311,558 2,251
64,153 45,497 lC,241 8,415
2
50,904 2,617
5
24,251 1,551
15,964 76
3,826 2.637
532 657
39,071 236
5,535 4,318
508 709
VEGETABLE OILS AND WAXES CARNAUBA CASTOR OIL COCONUT OIL CLIVE OIL, EDIBLE PALM OIL oALM KERNEL OIL TUNG OIL OTHER
lB LB LB 1..8 LB LB LB LB LB
1,438,706 9,065
97,530 676,969
67,105 431.109 101,021 21,597 34.309
1,437,020 9,828
101,326 716,909
59,923 3870 1142 100~707
21,796 39,390
170,389 3.739
17,60B 62,644 25,906 38,739 12.0BO 2.105 7,568
245,155 4,172
40,951 93,897 31,996 44,238 16.131 2,939
10,831
105,281 748
7.656 . 50,432
3,185 20,624 16.660 2.580 3,395
138,123 936
12,438 74,584 3,142
29,832 13,439
0 3,751
12,062 331
20148 3,953 1,425 1,663 1,715
285 541
33,301 453
5,327 16,009
1,861 5,103 3,372
0 1,176
CONTINUED-
1\,.

l M'" ~X:l\."':C'm •
,~--.--~ .. .,--,.---....""
TABLE 10 .--U.S•. AGRICULTURAL IMPORTS: QUANTITY AND VALUE BY COMMODITY--CONTINUED
JANUARY-DECEMBER DECEMSER COMMODITY UNIT QUANTITY VALUE QUANTITY VALUE
1972 1973 11 1972 1973 11 1972 1973 11 1972 1973 11 THCU. THOU. 1,000 DOL. 1,000 DOL. THOU. THOU. 1,000 DOL. 1,000 DOL. ISUGAR ANC RELATED PRODUCTS 932,476 1,064,714 69,515 101,690
SUGAR STN 5,278 5,230 831,887 918,184 386 461 62,671 86,934 MCLASSES, INED IBLE GAL 407,933 448,139 54,096 95,545 24,472 31,556 3,292 10,782 MAPLE SUGAR AND SIRUP LB 10,052 11,473 6,276 6,769 51tl 665 388 448 CONFECTIONERY PRODUCTS LB 85,156 89,460 29,577 37,017 6,714 7,297 2,51t5 3.063 HONEY LB 38,960 10,658 8,900 3,765 751 959 199 361 OTHER 1,740 3,434 421 101
29,406 29,148 FFESH OR FPOZEN:
VEGETABLES AND PREPARATIONS 364,050 425,440
BEANS LB 17,965 14,950 2,354 2,108 2,879 1,056 374 151 CAP ROTS LB 51,030 48,008 2,386 2,097 7,597 4,843 378 208
2,302 986CUCUMBERS LB 169,518 177,553 13,857 15,329 24,941 16,990 DASHEENS LB 19,784 22,64'. 2,334 2,806 1,551 1,957 186 268 EGGPLANT LB 29,034 39,241 3,331 4,186 4,499 4,843 521 366 GARLIC LB 17,300 20,634 4,265 6,003 600 439 229 183 nNIONS LB 62,323 150,750 5,416 12,521 7,723 7,904 539 609 PEAS LB 9,251 11 ,608 2,324 2,908 483 397 139 109 PEPPERS L8 64,888 92,242 11,446 17,005 2,642 .5,468 530 748 POTATOES, WHITE OR IRISH CWT 756 855 2,020 3,575 101 156 306 717
38,495 39,636 5,117 4,928 4,333 3,790 608 257SCUASH LB TOMATOES LB 586,844 753,100 B8,745 115,602 14,650 16,967 2,274 2,438 TU~NIPS OR RUTABAGAS CWT 847 855 4,086 4,926 98 71 571 416
I OT IER 1101\6 12,884 914 930 N w PREf ~RED OR PRESERVeD: I C, SSAVA,FLDUR,STARCH,AND TAPIOCA LB 141,84B 108,323 5,B88 5,323 2,177 7,584 III 1tl3
HnFS LB 13,827 12,143. 13,109 12,298 1,911 1,104 1,975 1,lt44 MUSHROOMS, INCLUDING DRIED LB 53,416 50,757 39,677 36,479 3,262 3,716 2,328 2,620 OL YVES, IN BR INE GAL 17,471 17 ,506 50,ll2 57,335 2,092 1,38~ 5,009 4,824 ONIONS LB 6,436 7,022 1,781 2,446 635 541 167 203 PEAS, EX DR lED LB 16,471 12~212 3,910 2,606 229 585 54 113 PICKLED VEGETABLES LB 49,330 51,29B 1,069 7,711 3,422 3,335 565 544 TOMATOES LB 158,630 100,714 16,059 12,921 1B,022 11,338 1,960 10913 TOMATO PASTE AND SAUCE tB 126,241 118,122 18,483 20,139 21,116 14,029 3,254 2,994 OTHER 49,165 61,306 4,112 5,695
OTHEP VEGETABLE PRODUCTS 535,394 677,491 49,856 62,339 BP.OOMCORN STN 11 12 6,904 B,296 1 1 602 732 CUT FLOWERS 4,030 11,657 612 1,459 ESSENTIAL OR DISTILLED OILS LB 2,527 2,213 9,421 5,222 165 169 487 131t
FEEDS AND FODDERS,EX OIL CAKE&MEAL 39,072 51,675 3,805 4.090 5,533 11,665 694 707FLAVORING EXTRACTS
JUTE ANO JUTE BUTTS, UNMANUFACTU~ED LTN 13 31 3,635 5,370 1 1 296 142 MAL T LIQUORS GAL 28,854 35,101 35,674 49,244 2,140 2,991 2,711 4,640
801 1,053NURSERY ANO GREENHOUSE STOCK 22,703 25,611 SEEDS. EXCEPT OILSEEDS LB 62,448 47,696 21,196 24,604 5,058 4,998 1,751 2,770
4,309 4,597 1,547 10895SPICES LB 29,160 29,533 10.619 11,246 TOBACCO, UNMANUFACTURED LB 252,183 276,539 150,456 166,025 20,216 26,025 11,232 17,380
GAL 41,332 55,523 210,158 286,980 5,053 4,488 23,956 25,606WINES OTHER J.5,993 22,885 1,361 1.731
CONTlHUED

,-"" " ',":','.,'.
TABLE 10.--U.S. AGRICULTURAL IMPORTS: QUANTITY AND VALUE BY COHMODITY--CONTINUED
OECEMBERJANUARY-DECEMBER COMMODITY UNIT QUANTITY VALUE
1972 1973 11 1972 1913 11 THCU. THOU. 1,000 DOL. 1,000 DOL.
COMPLEMENTARY 2,182,600 2,859,072
3ANANAS LB 4,110,845 4,183,994 186,239 1n,H2 PLANTAINS LB 105,318 121,133 5.110 4,865 COFFEE, GREEN LB 2,145,619 2,882,111 1,181.,844 1,565,193 COFFEE EXTRACTS,ESSENCES,CONCENTRATES LB 56.535 68.173 79,098 102,314 COCOA BEANS LB 632,030 554,910 150,886 211,7"6 COCOA BUTTER LB 46,252 33,506 25,926 32,042 COCOA AND CHOCOLATE PREPARATIONS LB 239,856 238,959 61,056 68,066 DRUGS, HER8S, ROOTS, ETC . LB 88,257 56,B85 31,365 28,526 ESSENTI~L OR DISTILLED OILS LB 13,000 12,514 40,141 51, 789 FIBERS, UNMANUFACTURED LTN 91 79 19.019 20,197 RUBBER, CRUDE, NATURAL:
RUBBER, DRY FORM LB 1,162,722 1,293,272 160,594 30B,679 RUBBER, LATEX LB 186,108 146.740 29.180 31,362
SILK, RAW LB 552 562 4,513 5,815 SPICES:
PEPPER, UNGROUND, BLACK LB 41,440 49.619 18,932 22,668 VANILLA BEANS LB 2,366 2,857 11,231 12,643 OTHER LB 75.074 73,632 29.870 35.964
TEA LB 151,495 113,314 62,821 6",209 WOOL, UNMANUFACTURED, FREE IN BOND GLB 86,361 48,975 43,306 47,615
;' OTHER 41,403 41,860
~ , 1/ PRELIMINARY ,. s: ~.
~>
QUANTITY 1912 THOU.
355,911 9,343
110,418 6,111
80,775 5,116
20,918 811 839
6
112,919 12,557
19
5,066 313
5,132 lC.731
5,056
1913 1/ THOU.
286,034 10,125
218.566 9,964
61,114 1,293
19,525 6,297 1,311
6
74,939 10,899
14
1,649 188
6,845 11,991
1.640
VALUE 1-S12
1,000 DOL.
184,111
16,069 310
83.705 9,163
23,802 4,316 5~198 2,OB2 3,496 1,108
15,910 10886
164
1,864 1,696 2,035 4,582 3,753 3,518
1913 11 1.000 DOL.
242,086
13,168 432
123.753 12,593 32,693
1,694 6,140 10823 5,092 1,502
22,704 3,268
:.;213 ;'1
~811 1,001 :~.,4.094 "~ 5,112 10932 2.140
.',;
;~
,"; :,
.:: ~?,
" ~
~ - ....... "•. -,,~- ~-.'"' .....-'-:.:.":;-.,~~It:;.:;s.-,~.

I~··
Export Fact Sheet
iiiiiliiii&.iiliiiiilli88ii~i]iiiiiiIIieeijiiee;ijeeeaeeeei8iiiiiiiiiiiiiliiiii
U.S. AGRICULTURAL EXPORTS, 1972/73
Exports of farm products made waves in fiscal 1973. reaching $12.9 billion: Unprecedented commercial sales in fiscal 1973 pushed our total farm exports 60 percent above the record $8 billion set in fiscal 1~n2. The $4. 9-billion increase was more than total agricultural exports in any single year prior to fiscal 1961. While a part of the value increase was due to higher prices, volume accounted for 60 percent, with the quantity index for U.S. agricultural exports (1967 = 100) rising 37 percentage points above the 1972 level. In fiscal 1973, export records were set for wheat, corn, rice, soybeans, cattle hides, lemons, grapefruits, oranges, fresh vegetables, soybean meal, corn byproducts, and live animals. Value totals were up for all other commodities except dairy products and vegetable oils.
Farm exports in fiscal 1973 were equivalent to about 21 percent of 1972 U.S. farm marketings of $60.7 billion.
The output of 1 of every 4 harvested acres wasexportef~ Eighty-five million acres of U.S. cropland were required to produce the commoditi~s exported in fiscal 1973. World production shortfalls in grains and protein meals provided foreign markets for three-fourths of U.S. wheat output (including wheat products), more than onehalf of the soybeans and rice, and over three-fifths of the hops and flaxseed. More than one-third of U.S. production of cotton, tobacco, and tallow went to foreign markets in fiscal 1973. A larger share of U.S. produced feed grains entered the world market at substantially higher prices than in fiscal 1972.
The United States is the world's largest farm exporter: U.S. products accounted for nearly one-fifth of the world's agricultural exports in fiscal 1973. About 479,000 U.S. farmworkers supplied these exports which amounted to $3.47 for every person living outside the United States. U.S. farmers supplied nine-tenths of world soybean exports, three-fifths of the feed grains, two-fifths of tne wheat, one-third of the tobacco, and one-fourth of the cotton &ld rice.
Expanded sales for dollars accounted for all of the $4.9 billion increase in U.S. agricultural exports: Commercial farm sa1es--which include barter for overseas procurement and CCC credit sa1es--hit a record $11.9 billion in fiscal 1973, accounting for over nine-tenths of total farm exports. Remaining exports were concessiona1 sa1es--primarily under Public Law 480-rand these were off 8.2 percent from the fiscal 1972 level.
Export ~in since 12§.Q. ~ also largely attributable to expanded dollar sales: The $4.9-billion gain in commercial sales for dollars in fiscal 1973 boosted our farm export gain since :960 to $8.6 billion. Gover.nment-assisted_~xports, which have trended down since 1960, averaged $1.06 billion yearly during the past 5 years. On the other hand, commercial sales have advanced sharply, averaging $7.17 billion yearly since fiscal 1969.
-34

Farm exports to Japan, the top country market, topped the $2 bill:i..on mark in fiscal 1973: U.S. farm exports to Japan totaled $2.3 billion in fiscal 1973, accounting ~a record 18 percent of all farm exports and nearly doubling the year-earlier level. A $1.13-billion increase in exports to this market accounted for some 23 percent of the total fiscal year gain in farm exports. Feed grains, oilseeds, wheat and flour, cotton, and hides and skins continued to dominate the flow of U.S. farm exports to Japan.
Fifteen countries accounted for $9.26 billion of fiscal 1973 exports: While U.S. agricultural exports go to some 164 countries, 15 countries took 72 percent of the total value in fiscal 1973. Five markets--Japan, the Netherlands, the USSR, Canada, and West Germany--accounted for about three-fifths of our farm exports to the top 15 countries. The United Kingdom, Italy, and the Republic of Korea follol1ed, taking an additional one-fifth. Exports to the USSR, heavily concentrated in wheat and feed grains, totaled $957 million in fiscal 1973, accounting for 16 percent of the total increase in our farm e~ports.
In fiscal 1973, Canada and the Netherlands remained the maj or transshipment points for sizable quantities of U.S. grains and oilseeds. Canada forwarded U.S. farm products valued at $104 million.
Exports to Eastern Europe and the USSR were valued at $1.4 billion in fiscal 1973, nearly triple the year-earlier level: U.S. farm sales to East European countries and the Soviet Union in fiscal 1973 towered over the previous year's $353 million--which had been a Lecord. The new alltime high in U.S. farm exports to these countries was largely due to the $957 million worth of wheat, feed grains, soybeans, cattle hides, and linseed oil exported to the USSR. U.S. farm exports to the USSR increased five-fold,between fiscal 1972 and 1973. Poland, Yugoslavia, and Romania were the other major markets in the area, taking U.S. farm products totaling $360 million.
Agricultural exports to the People's Republic of China accounted for over nine-tenths of all U. S. exports to that country in fiscal 1973: After 20 years of trade isolation from the United States, the People's Republic of China took U.S. farm products valued at $207 million in fiscal 1973. Grain and grain products totaled $103 million, accounting for nearly one-fourth of China's total grain imports of 6.3 million tons. Other U.S. exports to China included cotton, soybean oil, and cattle hides.
-35

· _",."...,~,"",..",,-__,,=- """""::;#:;$ II -
Table 11.--U.S. agricultural exports: Performance comparisons 1971/72 and 1972/73 If1972/73 : 1972/73Percentage underQuantity Value Unit value Change !211 11 exports: expartaGovernment ~rograms1972 -Coumodity :Unit: (value as a per-: 88 a share
centage : of world of 1972 : agricul1971/72 1972/73 1971/72 1972/73 1971/72 1972/73 Quantity Value 1971/72 1972/73 :production: tural
: ~guantit:!:l ! trade Million Million
Millions dollars!i!!ll!!!!!!. Dollars~ ~ ~ ~ .~~ ~ All cOlllIlOdities •••••••••• : ___ 8,047 12,894 +60 14 8 one-fifth Soybeans and products .... : -- 2,004 3,165 +58 7Soybeans (beans only) .. :Bu. 431 506 2 551,391 2,289 3.227 4.524 +17 +65Soybean meal ........... :Ston: 40 nine-tenths4 5 378 692 94.50 138.40 +25 +83Soybean oil ............ :Lb. : 1,562 1,132 1 £1224 144 .143 .127 -28 -36 58 52
11 39 .063 .076 +194 +255 8Soybean flour .......... :do. : 175 514
£1 Feed grains and products • :Mton: 21 36 1,141 2,347 +71 +106 7 4 three-fifths
Corn, grain ............ :Bu. 661 l,D8 908 1,882 1.374 1.654 +72 +107 5Sorghum grain .......... :do. 103 190 147 3 21315 1.427 1.658 +84 +114 24 12 23Bar1ey,grain ........... :do. 48 62 50 98 1.042 1.581 +29 +96Oats, grain •••••••••••• :do. 23 20 0 0 1514 17 .609 .850 -13 +21 0 0Other feed grain prod. .: --- 322 30 -36 24 24
Wheal: and products ....... : Bu. 632 1,188 1,071 2,378 --- +88 +122 37 15Wheat, grain ••••••••••. )do. 576 1,133 965 2,243 771.675 1.980 +97 +132, Wheat flour ............ :Cwt.: 21 18 33 11 two-fifths83 93 3.952 5.167 -14 +12 77 68Other wheat products ••• :Bu. :'" '", 10 13 23 42 +30 +83 97 102
Cotton and products ...... : --_ : 605 839 Cotton, excl. linters •• :Rble: ~/3,332 Y4,729 530 748
+39 159.00 158.10 +42 +41Cottonseed 011 ......... :Lb. : 458 580 t7 15 5 one-fourth68 78 .148 .134 +27 +15 2Linters ................ :Rble: Y143 !l243 5 8 34.97 32.92 Y+70 +60Cottonseed ............. :Lb. : 7 21 1 3 .143 .143 +200 +200
3 Cottonseed meal •••••••• :Ston: !l6 ll13 1 2 66.67 53.85 +117 +100.. :
Tobacco, unmanufactured •• :Lb. 558 591 570 639 1.022 1.081 +6 +12 4 5 4 one-third Fruits and r-reparations ... : -- 381 457 +20Fresh .................. :Lb. 2,086 2,176 209 255 .100 .117 +4 +22Juices .. '" ............. :Ga1. : 35 39 63 74 1.800 1.897 +11 +17Dried .................. :Lb. 251 154 57 57 .227 .370 '-39 0Canned •••••.••.•..••••• :do. 297 352 3749 64 .165 .182 +19 +31Other .................. : ___ 3 7 +133
Rice ..................... :Lb. 3,754 4,269 306 435 .082 .102 +14 +42 65 55 50 one-fourth Hides and skins .......... : ___ 236 495 +110 £1 V"getab1es and prep•••••• 235 296 +26Fresh .................. Lb. 1,285 1,557 82 111 .064 .071 +21 +35Canned ................. do. 99 138 19 26 .192 .188 +39 +37Pulses ................. do. 600 658 52 64 .087 .097 +10 +23Hopa •••••••••••.•.••••• do. 33 33 29 27 .879 .818 0 -7Other •.•.••.••••••.•.•• 48 68 +42
Animal fats, oil., and greases ................. Lb. 2,680 2,539 228 237 .085 .093 -5 +4 13 11Tallow ................. Qo. 2,314 2,238 189 .082201 .090 -3 +6Lard ................... do. 184 144 21
15 11 38 three-fourths19 .114 .132 -22 -10Other .................. do. 182 157 18 17 ?:.I 5 9 one-sixth
-14 -6 COfl:f;inued-
"''::'''':.,,~--:--:n'''''''''',,"",,''''.''''";t''->'">""T1-'''''''''''~'''
64

,..:>-•••...,-....~---~.,...". ....'''".--~-,
Table U.--U.S. agricultural exports: Performance comparisons 1971/72 and 1972/73--Continued
Commodity :Unit:
Quantity
1971/72 1972/73
Value
1971/72 1972/73
Unit value
1971/72 1972/73
Change
Quantity
.!2ll1/1972 -
Value
Percentage under Government programs
(value)
1971/72 1972/73
197%/73 1972175 exports exports
as a per-: as a share centage : of world
of 1972 agricu1: production: tura1 : (guantitZ2: trade
Millions ~ Million ~
Million dollars .!!2.!!!ru. .!!2.!!!ru. ~ Percent ~ Percent Percent
Meats and products ~I •... :Lb. Variety meats •••••••••• :do. Beef and veal •••••••••• : do. Pork ••••••••••••••••••• :do. Sausage casings •••••••• : do. Other 1:./ ••••••••••••••• :do.
586 266 44 95 12
169
717 265
63 169 14
206
231 81 42 42 10 56
370 104
69 110 14 73
.304
.954
.442
.833
.392 1.095
.651 1.000
+22 0
+43 +78 +17 +22
+60 +28 +64
+162 +40 +30
~/ 11
I
'" '" I
Dairy products ••••••••••• : ---Nonfat dry milk •••••••• :Lb. Butter .••••••••.•••.••• : do. Condensed and evaporated: milk •••••••••••••••••• :do.
Other •••••••••••••••••• :"--
Feeds and fodders, excl. oil cake •••••••••••••••• : --_
Corn byproducts •••••••• :Ston: Alfalfa meal ••••••••••• : do. : Other feeds and fodders : ---
Edible tree nuts ••••••••• :Lb. Almonds •••••••••••••••• : do. Walnuts •••••••••••••••• : do. OthelO •••••••••••••••••• :do.
357 126
53
3/784 1/367_
145 77 34 34
135 4
47
3/909 1/340
135 59 41 35
218 102
65
12 39
138 45 19 74
84 55
8 21
86 35
2
8 41
217 71 20
126
88 51 14 23
.285
.516
.226
57.40 51.77
.579
.714
.235
.618
.259
.500
.170
78.11 58.82
.652
.864
.341
.657
-62 -97
-12
+16 -7
-7 -23 +21
+3
-61 -66 -97
-33 +5
+57 +58
+5 +70
+5 -7
+75 +10
45 88
48 ~I
2
27 61
~j
1/
5 JJ
10
23 18
Poultry products ••••••••• : ---Meat ••••••••••••••••••• :Lb. Baby chicks •••••••••••• :No. Eggs, in shell ••••••••• : Doz. : Other •••••••••••••••••• :--
144 30 13
162 30 16
82 43 19 12
8
98 54 18 15 11
.299
.633
.923
.333
.600
.938
+13 0
+23
+20 +26
-5 +25 +38
2 Y :1,..1
1 1/11
Peanuts •••••••••••••••••• :Lb. 372 349 44 59 .118 .169 +6 +34 11
Live cattle •••••••••••••• : No. ?./76 ~/107 31 54 407.89 504.67 +41 +74 y y Flaxseed ••••••••••••••••• : Bu. 2 9 5 27 2.500 3.000 +350 +440 65
1/2/3/ ~/
Unit values and percentage changes computed from unrounded data. Less than 0.5 percent. Data in thousands rather than in millions of units. Includes poultry meat, shown separately below.
~ tt
··:>"t"'''';'':·~::·:7:"·"'"''7''-\ZJt

International Price HighUghts
.iliiiil:8iieisisiiillil.iiiliiiilll~i.liaiilliaeieilliiiiiiiaiaa iiiii!ie!aaieESeaeaeiil!iiliili
SELECTED PRICE SERIES OF INTERNATIONAL SIGNIFICANCE
Commodity prices cli~ed in December, reflecting fears of a mounting energy crisis and possible tight supplies of key agricultural commodities. The Dow-Japes commodity index averaged 326, 8 percent higher than the November index, and the highest level of the year. The Reuter's commodity price index for December was 1,345, 10 percent higher than the November index, and also the highest of the year.
Buyers of rubber and cot ton bid up prices for these commodities, whose synthetic substitutes are petro' ,~um based products. The energy crisis also gave rise to increasingshipping costs in ,~c' .::ember.
Because of official reports of stock drawdowns of U.S. wheat and feed grains to extremely low levels during 1973/74, world prices of these two key commodities climbed during December.
Cocoa beans, imported cow meat, and sugar destined for the U.S. market (at the f.o.b. Caribbean price) and rice were the only major import-export commodities to show a downturn in price.
Because of the tight wheat situation resulting from a drawdown of U.S. stocks, wheat prices increased steadily in December. The monthly average price for U.S. No.2 Hard Winter wheat, ordinary protein, f.o.b. vessel, Gulf ports, was $200 a ton, 10 percent higher than the November average and 90 percent higher than the December 1972 average. While no quotation was given for No. 1 Canadian Western Red Spring (CWRS) wheat, 14-percent protein, in store, Fort William-Port Arthur-Thunder Bay, the price of No. 1 CWRS wheat, 13.S-percent protein, in store, Lake Superior ports, rose slightly to $20S a ton.
The December c.i.f. Rotterdam price for No.1 CWRS wheat, 13.S-percent protein, averaged $22S a ton--up 7.S percent from the November price. For U.S. No.2 Hard Winter wheat, l2-percent protein, the average was $223 a ton--up 11 percent--narrowing the differential between these two wheats to about $2 a ton.
The differential between U.S. No. 2 Hard Winter wheat, l2-percent protein, f.o.b. vessel, Gulf ports, and c.i.f. Rotterdam was $23 a ton in December. For No.1 CWRS wheat, l3.S-percent protein, the differential between the c.i.f. Rotterdam price and the f.o.b. Lake Superior ports price was $20 a ton. The differential between No.1 CWRS wheat, 13.S-percent protein, f.o.b. Lake Superior ports, and the same wheat type, l4-percent protein, c.i.f. U.K. nearest forward shipment, rose to $34 a ton in December. This increase may be due to the quotation for different protein contents, as well to added shipping costs in U.K. ports. The increased shipping costs, in turn, were most likely a result of fuel and labor cost rises.
-38

According to the November Feed Situation (USDA, ERS), a tight supply and demand situation also dominates the outlook for feed grains. World production of feed grains in 1973/74 is estimated to be at a record 580 million metric tons, 7 percent above the year-earlier level. But because of depleted stocks in major grain exporting nations, supplies will be barely adequate for 1973/74 requirements, and carryover stocks at the end of the season will be down to the lowest level in more than 15 years. While U.S. 1973/74 corn production was estimated in November at a record 5.7 billion bushels, production is short of expected demand. (Subsequently, in January, the 1973/74 corn crop was estimated at 5.6 billion bushels.)
The corn price in October and November was stable because of new crop supplies. However, in December, the price for U.S. No.2 yellow corn, f.o.b. vessel, Gulf ports, advanced slightly to $112 a ton. The c.i.f. U.K., nearest forward shipment price for U.S. No. 3 yellow corri advanced 11 percent to $143 a ton, widening the differential between the two prices to $35 a ton. The widening may be due to increased shipping costs resulting from higher fuel costs. Argentine corn, c.i.f. Rotterdam, rose to $143 a ton, or 9 percent above the November price. With U.S. No. 3 corn, c.i.f. Rotterdam, averaging $132 a ton, the differential between the two market classes of Cl,rn widened to $11 a ton. During Deceml,er, the c. 1. L Rotterdam price for U. S. No. 2 grain sorghum averaged $131 a ton--nearly the same as in No-"ember. The 6-percent price rise in U.S. No.3 yellow corn, c.i.f. Rotterdam, closed the gap between corn and grain sorghum prices in that market.
The f.o.b. vessel Gulf ports price for U.S. No.2 yellow soybeans rose 5 percent to $228 a ton in December. For U.S. soybean meal, 44-percent protein, the c.i.f. Rotterdam price advanced more sharply--by 11 percent to $245 a ton. December price quotations for U.S. soybeans, f.o.b. Gulf ports, were 42 percent higher than a year earlier, and quotations for U.S. soybean meal, c.i.f. Rotterdam, 23 percent higher.
Rice prices moderated somewhat as the new crop came to market. The December c.i.f. Hamburg/Antwerp offering price for U.S. No.2 long grain rice, 4-percent broken, averaged $828 a ton, down slightly from the $866-a-ton November offering. The f.o.b. mill price quotations for long and medium grain from U.S. rice-producing States reflected the same price drop. For example, the December f.o.b. mill, Houston, price quotation for No. 2 medium grain rice, 4-percent broken, was $661 a ton, down from the November peak of $672 a ton. Similarly, for No. 2 long grain rice, 4-percent broken, the quotation at Houston mills was $746 a ton, down $14 from the November high. The Lo.b. price for Thai white rice, 5-percent broken, is not yet being quoted.
American cotton, Memphis Territory, strict middling, 1-1/16 inches, c.i.f. Liverpool, took an upturn to 88 cents a pound from the weakened 81 cents a pound price of November. This price rise is in response to higher production costs for synthetic fibers produced from petrochemicals.
Price changes for major agricultural imports wel:le mixed, with the rubber price making the most dramatic change. Heavy demand for natural rubber has been brought on by the changing competition from synthetic rubber. Synthetic rubber is a petroleum product whose output is likely to be restricted by the Arab oil embargo. Consequently, the December monthly average of No. 1 rubber, ribbed smoked sheets, advanced strongly to 51 cents a pound, 33 percent higher than the November average and 137 percent higher
) than the December 1972 average.f
The New York spot price quotation for coffee from Santos, No.4, remained steady at 70 cents a pound for the fourth consecutiv~ month, but the December price was still 22 percent higher than a year earlier. The highe~ coffee import price is related to a 1973/74 world coffee harvest (October-September marketing year) of 66 million bags, down from the 76 million bags produced in 1972/73. According to an October 1973 Foreign Agricultural Service report on coffee (FAS Report FCOF 4-73), most of the
-39

production drop is due to a 35-percent shortfall in Brazilian coffee output resulting from bad weather and a severe infestation of coffee rust. Prices of other market classes of coffee have also risen. The December New York spot price for Colombian Nanizales coffee averaged 71 cents a pound, 13 percent above the year-earlier price.
The New York spot price for cocoa beans averaged 65 cents a pound in December, dropping for the second consecutive month. The record high prices of 1973 are being eased by larger cocoa bean harvests from the new crop. According to a November 1973 Foreign Agricultural Service circular on cocoa (FAS Report FeB 2-73), the 1973/74 world cocoa bean crop (October-September)' is about 1.46 million metric tons, up 5.2 percent from the, 1972/73 crop, but well under the 1971/72 record of 1. 5 7 million tons.
Through December, an acute shortage prevailed in world sugar supplies. With world sugar stocks at a very low level and consumption exceeding new crop production, world sugar prices continued to soar to a new high of 11.83 cents a pound. According to the Foreign Agricultural Service, however, 1973/74 world sugar production will climb to a record 82 million tons, 8 percent higher than the pre''lious crop year.
The price for raw cane sugar, 96 degrees, f.o.b. and stowed, the Caribbean, destined for the U.S. market, was 9.33 cents a pound, down 3 percent from the November price.
During December, there was a "negati~e" premium on raw cane sugar of 2.50 cents a pound (the differential between the pdce which foreign suppliers to the U. S. sugar market receive and the price received for world free-market sales). This unusual situation was a result of extremely high prices on the world market and occurred ~uring nine of the twelve months of 1973.
Expenses of duty, unloading, insurance, and freight for raw cane sugar shipped from the Caribberul to New York were 1.55 cents a pound in November and 1.52 cents a pound in December. Such expenses in November and December 1972 were 1.12 cents and 1.22 cents a pound, respectively.
The f.o.b. price, U.S. port of_entry, for imported cow meat, 90-percent lean, frozen, boneless, declined for the fourth consecutive month to 95 cents a pound.

ir ,4 , '!\.~':,~' ."
Table 12. --Selected pri¢e series of l.nternati..na1 signi.ficance ..~
Year and month
Wheat, No. I, Can. West. Red Spring,
14% protein in store. Ft. Wm.-Pt. Art < -Thunder Bay
w'heat, U.S. No.2 Hard Winter,
ordinary protein, f.o.b. vessel, Gulf ports 11
lfueat, U:S. No.2 Hard Winter, c.i.L U.K.,
nearest forward shipment
Wheat, No. I, Can. West. Red Spring,
14% protein, c.i.f. U.K.. nearest
forward shipment
Rice, Thailand, White, 5% broken,
Lo.b. Bangkok
Corn, U.S. No.2 yellow, f.o.b. vessel,
Gulf ports
\'i 'I'~}1 !<~
Can. .ill.!!.!. il!!!.& .ill.!!.!. il!!!.& :b.l.t. il!!!.& :b/1.t. $/m.t. il!!!.& .ill.!!.!. $/m.t.
~1972-~ 12."a average 3.52 129.50 3.55 130.27 48.81 118.75 66.12 158.60 191.13 2.38 93.88
1972 ~vember
December 2.34 2.57
87.08 94.84
2.45 2.86
90.02 105.09
40.64 46.78
94.03 108.01
44.14 50.20
102.21 115.85
175.71 182.57
1.51 1.74
59.45 68.50
. ~... I
1973 ---y,j"nuary .................... .
February ................... : March ...................... : April ...................... : May ........................ : June ....................... : July ....................... : August ..................... : September .................. : October .................... : NovelDber •••.•••••..•..••••. : December ................... :
2.67 2.68 2.68 2.68 2.77 3.10 3.57 4.81 5.64 5.61
2/5.57 ~/5.59
98.33 98.93 98.84 98.59
101.77 114.26 131.30 176.17 205.5': 205.90 204.'f4 205.43
Corn U S ' •• No.3 yellow,c.1.f. U.K.,
nearest forward ______~s~h~i~pm~p~_t
2.94 2.69 2.72 2.81 2.84 2.90 2.99 4.72 5.16 4.96 4.95 5.43
108.03 98.84 99.94
103.25 104.44 106.56 109.77 173.28 189.51 182.43 182.20 199.52
Corn Argenti';e,
c.i.f. Rotterdam
u.m 43.77 41.ft ~.M U.M ~.~
D.e n.q. n.q. n.q. n.q. n.q.
111.77 104.57 102.00 105.36 121.04 140.70 156.56
n.q. n.q. n.q. n.q. n.q.
Sorghum grain, U.S. No.2,
c.i.f. Rotterdam
50.79 51.23 50.00 50.00
2/51.88 - 57.33
n.q. n.q.
98.00 101.15 100.67 105.00
117.82 122.88 121.66 122.23
2/129.30 - 145.34
n.q. n.q.
2"3.63 241.46 235.89 239.55
Soybeans, U.S. No.2 yellow,
f.o.b. vessel, Gulf ports
179.21 198.10 204.65
n.q. n.q. n.q. n.q. n.q. n.q. n.q. n.q. n.q •
Soyb"aIls, U.S.N 2 b 1k 1'01 f ~ K'
• " •• , nearest forward
shipment
1.~9 2.06 2.03 1.95 2.20 2.57 2.78 3.11 2.73 2.70 2.74 2.86
78.34 81.10 79.92 76.77 86.41
101.97 109.64 122.43 107~28 106.39 107.87 112.59
b 1Soy ean mea , u.s., 44%,
c.i.f. Rotterdam
it ~:~
:.:~ e.' .<] ~l
,,;;
.,;:
:b/l.t. il!!!.& .ill.!!.!. il!!!.& .ill.!!.!. ~ .ill.!!.!. $.m.t. 1/1. t. il!!!.& il!!!.&
~l-.'ill.-~12."a average
lS72 ~vember
December
1973 "'"'J.inuary .................... :
February ................... : March ...................... : April ...................... : Hay ............ : ........... : June ....................... : July ....................... : August ..................... : September .................. : October .................... : November .................... : December ................... :
40.80
30.40 38.74
40.20 36.63 35.23 35.81 40.80 46.75 55.75 n.q.
52.75 52.00 55.00 62.58
98.39
70.40 87.99
93.26 87.86 85.72 87.54
101.68 118.52 139.46
n.q. 125.75 124.13 128.88 142.77
2.91
2.08 2.32
2.39 2.29 2.23 2.20 2.50 3.19 3.69 3.95 3.37 3.41 3.34 3.64
114.58
81.89 91.33
94.09 90.15 87.79 96.61 98.42
125.58 145.19 155.31 132.67 136.21 131.68 143.30
2.68
1.75 2.14
2.33 2.26 2.12 2.07 2.25 2.77 3.09 3.50 3.16 3.25 3.33 3.32
105.85
68.89 84.25
91. 73 88.97 83.46 81.49 88.58
108;85 121. 73 137.69 124.40 127.95 131.10 130.70
7.28
3.76 4.37
4.79 6.43 6.86 6.92 9.55
10.69 9.02 9.80
,6.86 6.16 5.91 6.21
267.51
138.16 160.57
176.00 236.26 252.06 254.36 350.98 392.67 331.50 360.09 252.11 226.25 217.30 228.18
95.42
65.30 1166.20
1I95.2~ 3/83.18 3/72.55 3/73.18 1/77.85
n.q. n.q.
3/138.50 - 114.22
132.29 101.00
n.q.
228.71
151.21 155.22
224.50 202.71 179.37 181. 76 197.14
n.q. n.q.
342.83 276.64 286.47 240.46
n.q.
296.64
157.50 199.51
219.50 256.88 237.50 243.25 353.80 477.50 580.00 333.75 230.00 206.60 221.25 245.00
Continued-
d ',I
-i J"''''':
i t-,.~
;1 h:.~ .-~:?
[, ."~~"",,
'<>J".~'~ • ~.,' , ,,' <..', !....~~_-...,,,. ::~ . .:.,,q,,.... I,-,

:,\e"",,,""-:::::: .c'".,""..__ "M'-"""--iI !
Table 12 .--Se1ected price series of international signific~,ce-·Continued
:Cotton, American, Imported CO~7 Sugar, cane, raw, 960 , spot, f.o.b. Rubber, No. 1
:Hemphis Territory meat, 90},o lean, Coffee Cocoa beans & stowed, port of u.~gin ribbed smokedYear and month strict middling, : frozen, boneless, from Santos, 1;4, from Accra, sheets, New
1-1/16 inches, f.o.b. U.S. New York, spot U S k t 4/: New York, spotto world market to •• mar e _: York, spotc.i.f. Liverpool port of entry
.£.l.1J!.... ~ c/lb. ~ c;:/lb. ~ c;:/lb. $/m. t. C/lb. 1l!!!.:.h .£.l.1J!.... ~ c;:/lb. ~
December 1972-November 10.37 228.58 9.53 210.17 62.1 136.82 33.1 72.91973 average 60.70 1,338.37 89.99 1.983 65.08 1.434
1972 ~;vember ••••••••••••• : 36.50 804.68 67.44 1.487 57.50 1.268 7.25 159.83 7.91 174.38 37.1 81.79 20.3 44.8
December ••••••••••••• : 38.80 855.39 71.03 1.566 57.50 1.268 9.08 200.18 7.97 175.71 37.9 '83.50 21.4 47.1
1973 --:.'hinuary ••••••••.••••• : 42.38 934.31 77.05 1.699 57.70 1.272 9.40 207.23 8.12 179.01 37.4 82.45 22.9 50.5
February ••••••••••••• : 43.50 959.01 85.88 1.893 59.88 1.320 9.06 199.74 7.86 173.28 39.3 86.64 25.2 55.6 !1arch •••••••••••••••• : 45.91 1,012.14 90.31 1.991 62.63 1.381 8.89 195.99 8.14 179.46 43.7 96.34 28.9 63.7
112.88 30.9 68.1April •••••••••••••••• : 46.23 1,019.19 84.19 1.856 64.00 1.411 9.06 199.74 8.34 183.86 51.2 !1ay •••••••••••••••••• : 51.75 1,140.88 83.70 1.845 64.80 1.428 9.67 213.18 8.74 192.68 61.1 134.70 31.7 69.9
81.44 1.795 66.00 1.455 9.77 215.39 8.89 195.99 70.2 154.76 37.4 82.53une ••••••••••••••••• : 55.25 1,218.04 July •• , •••••••••••••• : 65.00 1,432.99 90.40 1.992 69.00 1.521 9.86 217.37 8.85 195.11 88.6 195.25 43.6 96.1 August ••••••••••••••• : 79.80 1,759.27 115.06 2.537 69.50 1.532 9.09 200.40 9.34 205.91 79.9 176.09 42.3 93.1 September ••••••••••••: 90.18 1,988.11 103.62 2.284 70.00 1.543 9.01 198.64 9.54 210.32 80.5 177.53 38.8 85.7
1.543 9.56 210.16 9.68 213.40 80.9 178.35 35.5 78.2October •••••••••••••• : 88.75 1,956.58 99.75 2.199 70.00 November ••••••••••••• : 80.95 1,784.62 97.50 2.150 70.00 1.543 10.14 223.55 9.60 211.64- 74.J. 163.41 38.2 84.2
2.104 70.00 1.543 11.83 260.80 9.33 205.68 65.2 143.67 50.7 111.7, December •••••••••••••: 88.42 1,949.31 95.42 .,. N,
1/ Buyer's price equals seller's price minus export payment, except for rounding errors I/ 13~ percent protein plus premium for 14 percent protein quoted Fort William-Port Arthur-n,under Bay. During November and December 1973, 14 percent protein
not quoted, averages for 13~ percent protein were used. 3/ Pound sterling per metuic ton.
New York spot pric!! minus .625 crib. duty and minUl! freight and insurance from CarlbbMn to New York.~/ Sources: Honth1y Bulletin in Agricultural Economics and Statistics, FAO; Rice Trade Intelligence, FAO; The Public Ledger, London; Grain !1arket lli!!!!!.,
AHS, USDA; Rice ~~, AHS, USDA; Foreign Agriculture, FAS, USDA; Bangkok Board of Trade; Reuter's; ~ and General Economic Review, Liv&rpoo1; The National Provi~r, Chicago; ~ Ellll. ~~; '!!!!!. Journal of COlmnerce; New York Coffee & Sugar Exchange; and Bureau of Labor Stat:[stics, Spot }~rket Prices.
<<

Export Highlights
i.illllliiiiiiiiiiiiii&iiiiiiimiiiiiiliiiiiiiiiiBaieiiiiiieei8iiBiiiiiillliiilJ
U.S. FARM EXPORTS IN FIRST HALF OF FISCAL 1974 NEARLY DOUBLED YEAR-EARLIER LEVEL
For the first half of fiscal 1974, U.S. agricultural exports totaled $9.9 billion, 92 percent: greater than the level of a year earlier. Exports of grains and preparations were up 154 percent, accounting for around two-thirds of the overall increase. Exports of cotton, tobacco, soybeans, meats, live cattle, fruits, nuts, vegetables, and poultry meats were also up substantially. However, export~ of dairy products~ hides and skins, and vegetable oils fell sharply.
Nearly three-fourths of the $4.7-bi11ion increase in farm exports during July-December stemmed from higher prices. Higher prices were especially noted for grains, dried beans and peas, alfalfa meal, nuts, meats, cotton, and tobacco. Despite these substantially higher prices--which overall averaged 61 percent higher in July-December than a year eaE1ier--the volume of agricultural exports was over one-fourth ab~ve the year-earlier level.
December 1973 exports of farm products totaled $1.98 bi11ion--sharp1y above the $1.1 billion of December 1972 but somewhat below the November 1973 a11time monthly high of $2.1 billion. December exports continued to be very strong for wheat, feed grains, soybeans, soybean meal, tobacco, live animals, fruits, nuts, and vegetables. Al theugh volume was up 9 percent from December 1972, the value gain was 78 percent because of higher prices.
For the first 6 months of the current fiscal year, U.S. agriculture had a favorable trade balance of $5.6 bi11ion--substantia11y above the $1.9 billion surplus registered during the first half of fiscal 1973. The trade balance for nonagricultural products was less in the red in July-December 1973: $3.7 billion in deficit, compared with $5.2 billion a year earlier. With the upsurge in agricultural exports, the total trade balance for the United States advanced to a $1. 95-bi11ion surplus for the first half of fiscal 1974.
The gain in agricultural exports during July-December 1973 occurred to virtually every count~y and area. But most important was the more than doubling of exports to Asia, Latin America, and Africa. Exports to the People's Republic of China totaled $435 million, compared with $61 million during July-December 1972. China. was the top for~ign mar.ket for our wheat exports during the first half of fiscal 1974, taking 95 mi1~iDn bushels. The PRC was also a very important market for U.S. feed grains and cotton, and a smaller market for hides and skins, tobacco, and vegetable oils. Japan took over $1.55 billion worth of U.S. farm exports in July-December 1973, compared with $808 million a year earlier. Gains to Japan occurred for feed grains, soybeans, wheat, fruits, and vegetables. Shipments of U.S. farm prod.ucts to Western Europe were up nearly two-thirds, with gains occurring both" to the enlarged EC and non-EC countries.
-43

i
Table 13.--U.S. agricultural exports to the People's Republic of China: . Quantity and value by commodity, December and July-December 1973
December July-December Commodity Unit
Quantity Value Quantity Value
1,000 1,000 Thousands dollars Thousands dollars
Wheat, unmilled •••••••..••••.•. :M.ton 174 23,174 2,584 272 ,436 Corn, unmilled ••••••••••••••••• :do. 220 23,887 928 95,606 Soybean oil •••••••••••••••••••• :Lb. 0 0 15,430 2,471 Cotton, raw •••••••••.•••••••••• :R.ba1e: 69 13,481 156 27,653
__________ ~~~______ 1,359Tobacco, unmanufactured ••.••••• :Lb. ________~O ~~0 ____ 1,197 ~~~~
Total ........................ :--- 60,542 399,525
Feed grains, cotton, tobacco, soybeans, and soybean products account~d for most of the increase. Eastern Europe took nearly three-fourths more U.S. farm products, while shipments to the USSR gained slightly. Wheat exports to the USSR in Ju1y-De~ember totaled 72 million bushels, compared with 98 million a year ago. With a~ estimated record grain crop of over 220 million tons this year, the USSR will not need to import as much grain as it did last year. U.S. agricultural exports also gained significantly to Afrtcan and Middle Eas t and other Asian countries. Most of the increase to these countries was concentrated in grains. •
-44

I !
Table l4.--U.S. agricultural exports: Value by commodity, July-December 1972 and 1973
July-December CotmIlodity
1972 1973 1/
-- Million dollars --
Animals and animal produc.ts: Dairy products ••••.•.••••••••...•..•.•..•• : 54 Fats, oils, and greases ••••••••.•••.•.•••• : 105 Hides and skins, including furskins ••••••• : 207
Cattle hides, whole ••••••••••••••••••••• : 173 Furskins .....•.••......••. 15e ••••••••••••• :
Other hides and skins ••••••••••••••••••• : 19 Meats and meat products ••••••••••••••••••• : 107 Poultry and poultry products •••••••••••••• : 49 Other •••••.••••••••.••••••••••••••.•...••• : ______ ~6~0~________~~___
Total animals and products •••••••••••••• :===58::2=========
Cotton, excl~ding linters ••••••••••••••••••• : 214
Feeds and fodders, excl. protein meal: Corn byproducts •••••••••••.•.••.••••••••.• : 28 Alfalfa meal .......•..••.................. : 9 Other •••••••••••••.•••••.•..•••••..•••..•. : ______ ~5~1~________~~___
Total feeds and fodders, except oil cake and meal ....•. ~ ••...•.•. '.......... :====8;:8=========
Fruits and preparations ••••••••••••••••••••• : 236
Grains and preparations: Feed grains, excluding products 909 Rice ....................................... 209 ~Tbeat and products ••••••••••..••••••.••••• : 906 Other •••••••••••..••••••••••.•.•••.••••••• :______~5=1----------==~---
Total grains and preparations ••••••••••• :===2=.:0:7:5=================
Nuts and preparations •.•••••.••••••••••••••• : 61
Oi1seeds and products: Cottonseed and soybean oil 95 Soybeans ••...••.•.••.•.••.......•.••...... : 818 Protein meal ................•.•.....'...... : 247 Other ••••••••..••••••••••••••••.•••••••.•• :__~~1~3~6~--------~~---
Total oi1seeds and products ••••••••••••• :====1=,:2:9:6=================
Tobacco, unmanufactured •••••.•••.•.•.••• 3448 ••• :
Vegetables and preparations ••••••••••••••••• : 125 Other ••••••• ~ •••...•••.••••••••.•.•.•.•.•.•• : ____ _=1~4~5__________~~___
Total agricultural exports 5,166
1/ Preliminary.
-45-
Change
Percent
-47 +92 -10 -19 +67 +11 +63 +45
+155 +40
+84
+83 +57 +49
+62
+33
+135 +50
+198 +124 +154
+54 'j'
•
+17 +57
+107 +36 +62
+22 +62 +30
+92

---
Table 15 .--U.S. agricultural exports by regions, July-December 1972 and 1973
July-December Region 1./ Change
1972 1973
-- Million dollars -- Percent
Western Europe ...... '" .......................... . 1,842 3,040 +65 Enlarged EC .................................. . 1,500 2,437 +62
Eas tern Europe and USSR 2) ...................... : 489 633 +29 USSR ...............•................ 316 331 +5III •••••••••
Asia ........................................... . 1,726 3,672 +113 Japan ........................................ . 808 1,547 +91 People's Republic of China ..•......•.......... : 61 435
I
~ Latin AIJlerica .................................. . 490 1,093 +123 I
Canada, excluding transshipments ...•.. 367 578 +57 Canadian transshipments ........•.....•.. 105 509
Af.rica ......................................... . 117 348 +197
':I.1'l••••••••••••••••••••••••••••••••••••••• III 'Oceania • _______="-_________ 55 +83
Total 5,166 9,928 +92
1/ Not adjusted for transshipments. ~/ Includes Yugoslavia.

Table 16.--U.S. farm export unit values, July-December 1972 and 1973 1/
Average unit value ~/ Conunodity Unit Change
1972 1973
Dollars Dollars Dollars Percent
Dried peas ............................ :Lb. .06 .15 +.09 +150 Tallow, inedib1e ...................... : do. .08 .17 +.09 +113 Rice, milled basis .................... :do. .09 .19 +.10 +111 Soybean meal .......................... : S. ton 111.59 233.59 +122.00 +109 Wheat ................................. :Bu. 1. 79 3.68 +1.89 +106 Almonds, shelled ...................... :Lb. .80 1.42 +.62 +78 Soybeans .............................. :Bu. 3.54 6.08 +2.54 +72 Corn .................................. :do. 1. 43 2.45 +1.02 +71 Feed grains ........................... :M. ton 56.22 96.01 +39.79 +71 Dried beans ...... , ..................... :Lb. .10I .17 +.07 +70
~ Chickens, fresh or frozen .....•....... :do. .25 .42 +.17 +68 I Soybean oil ........................... : do. .12 .20 +.08 +67
Grain sorghum ......................... :Bu. 1.45 2.29 +.84 +58 Cottonseed oil ........................ :Lb. .13 .20 +.07 +54 Alfalfa meal, dehydrated .............. :S.ton 50.69 77.02 +26.33 +52 Raisins ............................... ~Lb. .34 .50 +.16 +47 Beef and veal, except offals .......... :do. .92 1.24 +.32 +35 Pork, except offals ................... :do. .51 .67 +.16 +31 Peaches, canned .......•....•.......... : do. .15 .19 +.04 +27 Offals, edible ........................ : do. .37 .47 +.10 +27 Fruit cocktail, canned .•.........•.... :do. .19 .23 +.04 +21 Cotton, raw ......................•.... :R.bale: 161. 33 188.98 +27.65 +17 Grapes, fresh •..............•......•.. : Lb. .19 .21 +.02 +11 Tobacco, flue-cured stemmed ........... :do. 1.36 1.50 +.14 +10 Lemons and limes ........•............. : do. .12 .13 +.01 +8 Tobacco, unmanufactured .......•....... :do. 1.10 1.16 +.06 +5 Tobacco, flue-cured unstenuned ..•...... :do. 1.06 1.09 +.03 +3 Cattle hides .....•..........•......... :No. 17.70 17.72 +.02 Orane:es 3,/ ..•..•..........••........•. :Lb. .10 .10 ~/ Listed in order of percent change from previous year. 11 Total export value reported divided by
total quantity exported. 1/ Includes tangerines and clementines.

Table 17.--U.S. agricultural exports to COMECON: Quantity and value by principal commodities and countries, July-December 1972 and 1973
USSR Poland Romania
COlllllOdity :Unit: Quantity Value Quantity Value Quantity Value ,--'-----'--
1972 1973 1972 1973 1972 1973 1972 1973 1972 1973 1972 1973
1,000 1,000 1,000 1,000 1,000 1,000 Thou. Tho~ dol. dol. Thou. Thou. dol. dol. Thou. Thou. dol. dol.
Wheat, unmilled ••••••••••••• :Mton: 2,656 1,966 154,825 149,351 142 338 8,493 36,450 29 a 1,440 a Corn, unmilled •••••••••••••• : do. 1,656 2,580 90,016 147,387 143 261 8,081 23,442 162 a 8,525 a Ba-:1ey, unmilled •••••••••••• :do. 159 13 6,316 858 59 86 2,844 8,705 0 24 a 2,672 Oata, unmilled •••••••••••••• :do. 37 a 1,355 a a 82 a 7,381 a a a a Rye, unmilled ••••••••••••••• : do. 0 235 a 28,369 a a 0 a a 11 a 1,294
<0 ••••••••••••• :Grain sorghum do. 0 a a a a 27 a 2,293 a a a t)
Oil cake and meal .....••.•.. : do. 0 a a a 74 115 8,575 33,544 11 61 1,515 13,916 Soybeans •••••••••• ', ••••••••• :Bu. 14,391 654 52,560 557 1,120 1,213 3,860 9,118 a a a 0 Linseed oil, raw •••••••••••• :Lb. 22,046 22,044 1,700 2,660 52,805 32,497 4,240 6,598 a a a 0 Cattle hidea, whole ......... olio. 295 a 7,190 a 300 305 5,776 6,443 659 652 13,190 10,267 Other ................... : ••• ,--- 1.577 2,117 5.962 11,202 181 35
TCl.... ·~l ....................................... : --- --- 315,539 331,299 47,831 145,176 24,851 28,184
Czechoslovakia Hungary East Germany
Quantity Value Quantity Value Quantity Value
1972 1973 1972 1973 1972 1973 1~72 1973 1972 1973 1972 1973
1,000 1,000 1,000 1,000 1,000 1,000 Thou. Thou. dol. dol. Thou. Thou. dol. dol. Thou, Thoi'. dol. .....!!2h
Wheat, unmilled ............. :Mton: 0 a a a a a a a 85 a 5,029 0 Corn, unmilled .............. :do. 18 46 994 3,066 a a 0 a a 61 a 6,441 Barley, unmilled ............ :do. 16 a 920 a a a a a a a 0 a Oats, unmilled .............. : do. 0 0 a 0 a 15 a 1,550 a a a a Rye, unmilled ....... , ....... :do. a a a a a a a a a a a a Grain sorghuma .............. :do. 0 a a a a 0 a a 0 0 a a Oil cake and meal ........... :do. 82 70 10,432 19,378 17 3 2,268 574 a 33 a 10,765 Soybeans .................... :Bu. a 266 a 1,270 a a a a a a a a Linseed oil, raw ............ :Lb. a a 0 a a a a a a a a a Cattle hides, whole, ......... :No. 506 244 8,855 4,083 42 71 653 980 0 16 a 152 Other ....................... :--- 4.821 4.065 1.440 1,028 865 2,138
Total .......................................... : --- 2G,022 31,862 4,361 4,132 5,894 19,496
Bulgaria Total COMECON
Quantity Value Quantity Value
1972 1973 1972 1973 1972 1973 1972 1973
1,000 1,000 1,000 1,000 Thou. Thou. dol. dol. ~ Thou. ..!l!!.h dol.
Wheat, unmilled ............. :Mton: a a a a 2,912 2,304 169,787 185,801 Corn, unmilled .............. :do. a a a a 1,979 2,948 107,616 180,336 Barley, unmilled ............ :do. a 0 a a 234 123 10,080 12,235 Oata, unmi lied .............. :do. a a a a 37 97 1,355 8,931 Rye, unmilled ............... : do. a a a a 0 336 a 29,663 Grain Borghuma .............. :do. a a a a a 27 a 2,293 Oil cake and meal ........... :do. a a a a 184 282 22,790 78,177 Soybeans .................... :Bu. a a a a 15,511 2,133 56,420 10,945 Linseed oil, raw ............ :Lb. a a a a 74,851 54,541 5,940 9,258 Cattle hides, whole ......... :No. 10 a 262 a 1,812 1,288 35,926 21,925 Other ....................... :--- 834 1,066 15.680 21.651
Total ......................................... : ...... - 1,096 1,066 425,594 561,215
Lesa than $500, 000.:!I
-48

,
:
Table 18 .--U.S. exports to the EC: Value by commodity, December and July-December 1972 and 1973
December July-DecemberCommodity
1972 1973 1972 1973
-- 1,000 dollars - Variable-levy commodities: 1/
Feed grains •...•........-:.•••.•.•.••. 55,184 102,503 233,050 507,889 Corn ••••..•".••.•................••. 52,377 89,696 220,542 439,695 Grain sorghums •...•••....•.....•••. 357 5,487 7,287 20,807 Barley ............................ . 2,060 3,341 4,744 16,739 'Oats •........•••••...••..........••. 390 3,979 477 30,648
Rice •••...••....••.•...•........••••. 2,9~2 5,222 10,417 21,165 Rye grain .•.••.••.•.•.•.••.•.••..•••. 1~ 0 1~ M7 Whea t gra in •.•.••.•••..•••••....•.••. 14,280 9,693 64,132 111,850 Whea t flour ••••.••.••••...••.•.•••••. 36 111 326 526 Beef and veal, excl. variety meats ••. ~ ~ 613 8~ Pork, excl. variety meats •••••••••••. 1 82 151 302 Lard 2/ ••••.•.•......•.•••.••.•••.•• : ° 0 229 68 Dairy-products ••••.•••••••••••••..••. 1 17 34 112 Poultry and eggs ••.•••••••••••..••.•. 977 2,212 7,189 13,190
Live poultry ••••••..•.•.•••••.••••. 30 54 591 737 Broilers and fryers •••••.••.••••••. 29 58 136 445 Stewing chickens •••••.•.••.••.••••. o 0 0 21 Turkeys ........................... . 738 1,832 5,543 10,416 Other fresh poultry................ 0 7 4 542 Eggs •..••.•.••.••••.••...•••..••••. 180 261 915 1,029
Other •••••.••••.•••.••••••••••••••••. _--::::1:-z,-=4-=45::-_--:-=-=--:9:-;:4~8---:"'::"77.L.,9~0~8~_~1=2...., ~85~8:!.Tota1 ............•.......•.•..••.==7::5::,:::0::73===12::0:,=:8::6::3===3:2:::4='2::;2::4='Y==6::6::9::.5=3::9=
Nonvariable-levy commodities: Canned poultry 'J./ ••.................. 45 9 457 56 Cotton, excl. linters ••.•••.••••••••• 19,809 9,177 35,989 27,968 Fruits and preparations •..•.•••.••••. 6,134 7,554 41,978 53,798
Fresh fruits ••.••.•..•.• ~" .•.•• I ••• : 1,014 1,462 10,801 11,243 Ci trus .......••.•.•••••••.••••••. 812 1,250 10,413 10,391
Oranges and tangerines •......•. 2 2 3,017 3,926 Lemons and limes •.•...•.•.•.••. 426 922 5,465 4,509 Grapefruits •••.•.•••..••....••. 381 322 1,918 1,923 Other •.•...•...•.••••••••.••••. 3 4 13 33
Apples •••....•••••••.•..••••••••. 93 o 98 8 Grapes .,...•••••.••••..•.••...•... 75 88 107 207 Other •••••••.•.....•••••.•••..••. 34 124 183 637
Dried fruits .•••.••.....••.•..••.•. 1,456 3,235 8,662 17,010 Raisins •..•..•••.•.•.•..•..••.••. 491 768 1,802 3,599 Prunes •••...•....••..•••..•..•••. 686 1,822 5,799 12,294 Other ••••...•.•...••.••..•....••• 279 645 1,061 1,117
Fruit juices •.••.•....••..••...•••. 1,017 764 4,614 6,235 Orange •..•.....•.••....•••....••. 695 545 3,145 3,978 Grapefruit •••.••..••..••••.•.•••. 59 69 623 1,010 Other ••••.••••.••....••••..•••••. 263 150 846 1,247
Canned fruits ~/ •••..••••••••.•.••. 2,472 2,012 16,818 17,391Peaches ••••••••••••••••.••••••••. 480 241 4,45~ 5.205 Fruit cocktail •.•••.••••••••••••. 397 763 2,710 3,630 Pineapples •••••••.••...•••••..••. 903 504 4,062 4,661
,
Other •..••••.••••...••.•••••••••. 692 504 5,591 3,895 Continued-

I
I
I
i
fl'
Table 18 --u.S. exports to the EC: Value by commodity, December and July-December 1972 and 1973--Continued
December July-DecemberCommodity
1972 1973 1972 1973
1,000 dollars -Nonvariable-levy commodities--Con:
Other fruits...................... 175 81 1,083 1,919 Vegetables and preparations .•......• 3,936 3,042 16,202 18,864
Pulse .•..........•..•...••...•.•.. 2,967 1,781 10,234 12,514 Dried beans..................... 1,908 1,517 6,699 9,474 Dried peas ...................... 1,059 264 3,535 3,040
Fresh vegetables .•....•........... 150 210 307 548 Canned vegetables ..•.......•..•... 39 205 733 1,163
Asparagus ................•..•... 2 1 27 52 Other .•.•...•............•...... 37 205 706 1,111
Hops ............................... 309 30 1,112 462 Other vegetables and preparations.: 471 815 3,816 4,177
Hides and skins .•..............•.... 3,825 4,116 25,316 20,173 Cattle hides ...................... 1,631 929 17,304 8,757 Calf and kip skins ................ 206 231 1,136 797 Other .•.•...•...••..........•..... 1,988 2,956 6,876 10,619
Oilseeds and products .•.......•..... 127,590 262,791 518,544 863,814 Oil cake and meal................. 36,837 69,164 153,127 280,966
Soybean ..•......•.••......•••... 35,172 66,829 140,567 263,696 Other........................... 1,665 2,335 12,560 17,270
Oilseeds .......................... 87,126 191,498 353,237 566,568 Soybeans .•••.•..•.•.•....•...... 72,018 176,970 295,505 523,165 Flaxseed ...........••...•....... 4,528 194 21,183 218 Other........................... 10,580 14,.334 36,549 43,185
Vegetable oils ......•..•.••....•.. 3,627 2,129 12,180 16,280 Cottonseed ..••.........••..••... 752 972 2,201 2,068 Soybean ......................... 0 3 16 1,526 Linseed ....•....•.........•..... 438 989 2,536 2,852 Other .••••.....•.•.•..••..•..... 2,437 165 7,427 9,834
Tallow ...•.•.•..•..•.•..•........... 1,614 5,313 11,576 42,667 Tobacco, unmanufactured............. 8,340 9,616 72,043 99,321 Variety meats, fresh or frozen 11 ... 4,832 10,500 30,520 44,169 Nuts and preparations............... Corn byproducts, feed 11 ........... :
3,122 4,810
5,495 6,691
20,418 i8,009
31,384 50,606
Food for relief and charity ..•...... 0 0 160 16 other .......•.....................•.__1~0~,L.l:0~4~0__~1-72...:'4:-:9~5:..--_~4-72..L;,1~8:::.:5:---:---::-:7:-:4u.,.:;:0::;00::-
Total nonvariable-levy items ......====1=9=4=,=0:9=7=====3=3=6:,=8=00======8=4:3:,:3:9=7===1:,:3:2=6:,:8:3::6
Total EC ............................. . 269,170 457,663 1,167,621 1,996,375
II Grains, poultry, and pork were subject to variable levies beginning on July 30, 1962; rice, O'il Sept. 1, 1964; and beef and dairy products, on NO'I. 1, 1964. 2:,/ Lard for food is a variable-levy commodity, while lard for ind'Jstrial use is bound in the General Agreement 0t1 Tariffs and Trade (GATT) at 3 percent ad valorem. u.S. lard is for food use. 11 Although canned poultry and pork variety meats are subject to variable levies, these cannot exceed the amount of import duties bound in GATT. ~I Variable levy on sugar-added content. 11 Mainly corn gluten feed and meal, which arenonvariab1e-levy commodities; but may contain small quantities of other corn products, subject to variable levies (see "Export Highlights, March 1970").
-50
,
.~
•

I
I I ,
i
i I
,.-.,.- < ". <" •
Table 19.--U.S. exports to the Enlarged EC: Value by commodit~ December and Ju1~-December 1972 and 1973
December July-December COlllDlodity
1972 1973 1972 1973
- 1,000 dollars -Variable-levy commodities: 11
Feed gra ins •...............••.....••. 69,770 112,429 289,186 581,830 Corn •.•.•....•...................•. 66,963 99,622 273,147 512,494 Grain sorghums •.....•..•........••. 357 5,487 10,816 21,949 Barley •.•.•.....•••....•.•....•.• , . 2,060 3,341 4,746 16,739 Oats •.•..•.........•.•..........•••. 390 3,979 477 30,648
Rice •.•..•.•....•..•.•••..••••..••.•. 4,035 6,561 15,843 27,896 Rye grain •..•••.•....•••••...••...... Wheat grain ••..•..•••........••...••.
175 16,513
0 12,060
175 81,725
747 121,491
Whea t flour •••..•...•.••..••...••..•. 38 116 343 535 Beef and veal, exc1. variety meats ••. 119 168 865 1,280 Pork, exc1. variety meats ••.•..•••.•. .Lard '];/ •••••••..•........•.••.••••••. Dairy products ••..••••..••••.•••••••.
1 11 42
84 55 19
156 6,281
136
393 5,144
140 Pou1 try and eggs •••••.•••••.•.•..•.•. 1,255 2,3'81 9,311 16,071
Live poultry •.•..•.•••..••••••..••. Broilers and fryers •••••.••..•••••. Stewing chickens •.•••••••..•••..••.
30 53 o
54 74 0
617 178
4
767 736
21 Turkeys ........................ ".. . Oth~r fresh poultry •••..••.•••.•••• Eggs •..•••••..••••••...•••••...••..
814 o
358
1,838 7
408
6,903 44
1,565
11,949 543
2,055 Other •.••••••••.•••.•••••••.••••••.• '_71~'z.::8~7~0__-:-=-:1~.~4;.;.7~1__~9;..t..~94~4:;-_--:=-=1~6.L'1;.;1~2:.
Tota1 •.•.••••..•.•.•.••...••••••. ==93:,:8=:2:::9===13=5::,:3::44===4:::1=3=,:::96:::5===7:::7:1~'6:::3::9=
Nonvariab1e-1evy commodities: Canned poultry J/ ................... . 48 14 513 69 Cotton, exc1. linters •..••....••••••. 21,159 9,997 39,381 33,686 Fruits and prepa·rations •...•••••••.•. 8,444 11,490 52,841 71,955
Fresh fruits •••••••.••.•.••••• I ••• : 2,107 2,349 13,224 i4,017 Citrus ••. ~ ••••....•••••••••••••• : 933 1,348 11,423 11,172
Oranges and tangerines ••.•.•••. 2 3 3,570 4,703 Lemons and limes •••..••.•...••. 484 963 5,787 4,912 Grapefruits •••.•.•••...•••••••. 444 378 2,053 2.,091 Other ••••••....•••.•.••.••.•••. 3 4 13 66
Apples ••••...••.•.....•••..•••••. 622 79 772 189 Grapes •..••••....•.•..•......•••. 501 637 704 1,138 Other ••••.••.••.•••..••••..•.•.•. 51 285 325 978
Dried fruits .••.....•......•.•••.•. 2,017 5,302 14,282 25,576 Raisins •.•••..••.••••••.••.•••.•. 625 1,735 4,229 7,017 Prunes ••.....••....•.•••.•••••••. 993 2,889 7,930 16,569 Other ••.•.•.•.•...••.•.•.•••...•. 399 678 2,123 1,930
Fruit juices •••••..•..••...•••.•••. 1,123 1,169 5,558 8,186 Orange ••.•.••..••.••.•.•.••...••. 786 808 3,789 5,271 Grapefruit •.•..•.•..•.••••.•••••. 68 128 795 1,349
974 1,566Other •••••••••.••••••••.•••.••••• 269 233 Canned fruits fil .................. . 2,838 2,564 18,133 21,216
Peaches ••••••.••••••••••••••••••. 506 272 4,565 6,087 Fruit cocktail •.•••••••••••.••••. 452 1,132 3,076 5,247 Pineapples •••••.•..•.••••••••.••. 1,029 547 4,402 5,400 Other .•.••.•.•.•.••..•.•.•••••.•• 851 613 6,090 4,482
.' ~ ;
~ ..! ,
,
.
Continued-
-51

•••
Table19.--U.S. exports to .the Enlarged EC: Value by counnodity, December and July-December 1972 and 1973--Continued
commodity
Nonvariable-levy commodities--Con: Other frui ts ••.••••••..••.••.••••.
Vegetables and preparations ••.•••••• Pulse ." .. ".. "" ... "." .. ".... " ... It
Dried beans .•.•••.•••.••.•••.••• Dried peas .•.••...•.•.•••..••••.
Fresh vegetables ••..••••••...•..•. Canned vegetables •.•..•.•••••••...
Asparagus ..••••••.••.••••••••••. Other •••••..•.•••..•.• • ••••••. :
Hops •••••.••.....••.••••.•.••••••. Other vegetables and preparations.:
Hides and skins ••.••.•..•••••••••.•. Cattle hides ••.•..•••..•••••••.... Calf and kip skins ••••••.••.••.••. Other ".... ".... ".""."" ...•....... :
Oilseeds and products .••••••.••.•••. Oil cake and meal ..••.••••••••• ··,
Soybean •••••.••.•.••.••••••••... Other "".""." .... ".""."" ... "... ".
Oi1seeds ••••.••••••••••••.•.•••••. Soybeans ".. "." ... ".. "."." ... "."" Flaxseed •••.•••••.••••.••••••••. Other .. ".. "... "." .. "."" ........ .
Vegetable oils .••.•.••••.••.•.•••. Cottonseed ••••.•.•.•...••••••.•. Soybean """" .... """".,, .... ,,""" ... Linseed ••.••...•••.•.••••••...•. Other •••••...•••.•••.•••••••••.•
Tallow ••.•. ""."."" .. "." .. ".""" ..... . Tobacco .. unmanufactured............. Variety meats, fresh or frozen 1/ ... Nuts and preparations •••..•.••..••.. Corn byproducts, feed 2/ ........... : Food for relief and charity.........
December July-December
1972 1973 1972 1973
1,000 dollars -
359 106 1,644 2,900 5,992 10,502 24,678 46,980 3,619 8,317 13,417 33,881 2,376 6,313 8,781 26,618 1,243 2,004 4,636 7,263
184 227 357 688 295 383 1,432 2,854
38 26 321 516 257 357 1,111 2,338 922 136 2,763 844 972 1,439 6,709 8,713
6,889 5,899 32,932 28,506 2,352 10063 19,430 9,968
228 231 1,279 893 4,309 4,605 12,223 17,645
138,328 288,099 584,800 944,258 41,675 77,481 164,052 304,253 39,917 74,207 150,726 281,865
1,758 3,274 13,326 22,388 91,539 207,603 402,269 619,794 76,120 192,447 343,254 571,284 4,528 194 21,183 218
10,891 14,962 37,832 48,292 5,114 3,015 18,479 20,211 1,293 974 4,826 2,742
5 11 82 1,543 999 1,772 4,125 3,646
2,817 258 9,446 12,280 2,179 5,694 13,668 44,578
25,482" 20,163 175,843 234,019 7,331 13,548 40,714 54,292 4,044 7,933 27,604 43,126 4,810 6,691 28,012 50,618
0 0 165 17 Other .•.•••.•..••.•...•••.•..•.."••• .,_"",1.1.5....9iL.18.1.o5L..-_........:1~9u,...:9~8~0___..::::6~5...., 1=-9~8'--_--=-ll::..:2::..:,'-'9:..:9...:9_
Total nonvariab1e~levy items ......==2=4=0=,=6=91~====4=0=0=,0=1=0=====1=,=0=8=6=,=34=9====1=,=6=6=5=!~10=3=== 535,354 1,500,314 2,436,742Total EC ••••••••.•..•...••••••••••••.. 334,520
1/ Gr.ains, poultiy , and pork were subject to variable levies beginning on July 30, 1962; rice, on Sept. 1, 19611; and beef and dairy products, on NO'I. 1, 1964. 2) Lard for food is a variable-levy commodity, while lard for ind·.lstria1 use is bound in the General Agreement;:>11 Tariffs and Trade (GATT) "at 3 percent ad valorem. U.S. lard is for food use. 1/ Although canned poultry and pork variety meats are subject to variable levies, these cannot exceed the amount of import duties bound in GATT. i/ Variable levy on sugar-added content. 2/ Mainly corn gluten feed and meal, which are nonvariable-1evy commodities; but may contain small quantities of other corn products, subject to variable levies (see "Export Highlights, March 1970").
-52
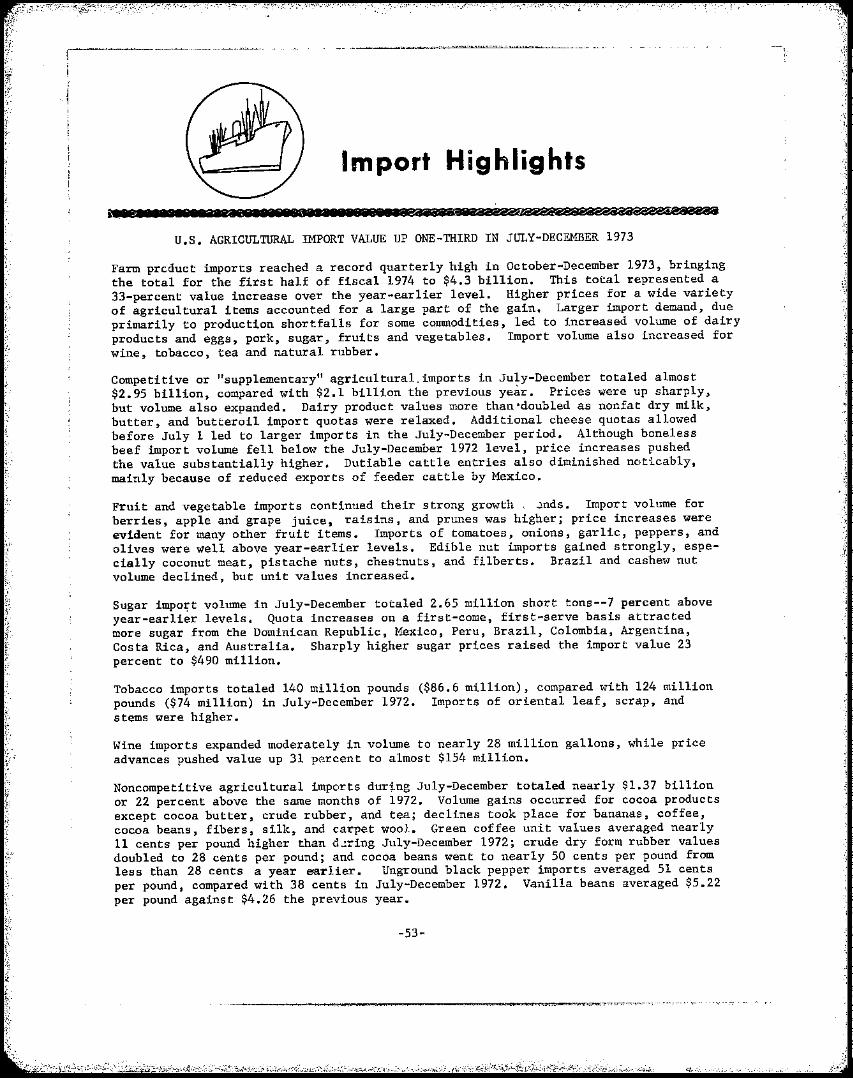
Import Highlights
illElllllllllillliillliliBlllliiiiiilliSiiii&iiiiaSaaaiiS2iiaeBiSiiiOaSiiiiiiia
U.S. AGRICULTURAL IMPORT VALUE UP ONE-THIRD IN JULY-DECEMBER 1973
Farm prcduct imports reached a record quarterly high in October-December 1973, bringing the total for the first half of fiscal 1974 to $4.3 billion. This total represented a 33-percent value increase over the year-earlier level. Higher prices for a wide variety of agricultural items accounted for a large part of the gain. Larger import demand, due primarily to production shortfalls for some commodities, led to increased volume of dairy products and eggs, pork, sugar, fruits and vegetables. Import volume also increased for wine, tobacco, tea and natural rubber.
Competitive or "supplementary" agricultural. imports in July-December totaled almost $2.95 billion, compared with $2.1 billion the previous year. Prices were up sharply, but volume also expanded. Dairy product values more than'doub1ed as nonfat dry milk, butter, and butteroi1 import quotas were relaxed. Additional cheese quotas allowed before July 1 led to larger imports in the July-December period. Although boneless beef import volume fell below the July-December 1972 level, price increases pushed the value substantially higher. Dutiable cattle entries also diminished nCiticab1y, mainly because of reduced exports of feeder cattle by Mexico.
Fruit and vegetable imports continued their strong growth ~nds. Import volume for berries, apple and grape juice, raisins, and prunes was higher; price increases were evident for many other fruit items. Imports of tomatoes, onions, garlic, peppers, and olives were well above year-earlier levels. Edible nut imports gained strongly, especially coconut meat, pis tache nuts, chestnuts, and filberts. Brazil and cashew nut volume declined, but unit values increased.
Sugar impo~t volume in July-December totaled 2.65 million short tons--7 percent above year-earlier levels. Quota increases on a first-come, first-serve basis attracted more sugar from the Dominican Republic, Mexico, Peru, Brazil, Colombia, Argentina, Costa Rica, and Australia. Sharply higher sugar prices raised the import value 23 percent to $490 million.
Tobacco imports totaled 140 million pounds ($86.6 million), compared with 124 million pounds ($74 million) in July-December 1972. Imports of oriental leaf, scrap, and stems were higher.
Wine imports expanded moderately in volume to nearly 28 million gallons, while price advances pushed value up 31 percent to almost $154 million.
Noncompetitive agricultural imports dur1.ng July-December totaled nearly $1.37 billion or 22 percent above the same months of 1972. Volume gains occurred for cocoa products except cocoa butter, crude rubber, and tea; declines took place for bananas, coffee, cocoa beans, fibers, silk, and carpet wool. Green coffee unit values averaged nearly 11 cents per pound higher than dJring July-December 1972; crude dry form rubber values doubled to 28 cents per pound; and cocoa beans went to nearly 50 cents per pound from less than 28 cents a year earlier. Unground black pepper imports averaged 51 cents per pound, compared with 38 cents in July-December 1972. Vanilla beans averaged $5.22 per pound against $4.26 the previous year.
-53

Table 20.--U.S. agricultural imports: Value by commodity, July-December 1972 and 1973
July-DecemberCommodity or commodity group Change
1972 1973
Supplementary -- Million dollaLa -- Percept
Animals and animal procucts: Cattle and calves .................................................................. : 95 103 +8Dairy prOducts and eggs •••••••••••••••••••••••••••••••• : 88 226 +156 Hides and skins, including furskins •.•.•••••••••••••••• : 50 61 +21Meats and meat products, excluding poultry:
Beef and veal ........................ I, ........... " .................... " : 510 717 +41Pork 0 ...................................................................... : 144 242 +68
26 27 +4 13 15 +11 13 12 -12
6855 +24 994 1.471 +48
Cotton, raw, excluding linters ••••••••••••••••••••••••••• : 3 5 +3BFeeds and fodders, excluding oil cake •••••••••••••••••••• : 20 26 +27Fruits and preparations •.... 0 000' ................................ 0: 78 89 +14Grains and preparations ..... ." ................. It It It •• It ••••• It• It It : 53 61 +14Nuts and preparations, edible •••.•••••••••••••••••••••••• : 62 76 +24Oilseeds, oilnuts, and products:
Coconut oil ••• It ••••••• :•••••••••••••••••••••••••••••••• It 24 59 +148 {ICopra •••••••••••••••• " •• "" ...................................... 4' • 12 24 +103
Olive oil •......••.............•........ It ••• ~ •••••••••• : 11 17 +47Other oilseeds and products •••••••••••••••••••••••••••• : 45 80 +78
Seeds and nursery stock, excluding oilseeds •••••••.•••••• : 26 30 +15Sugar and molasses: Sugar, cane •.•....•••••••••...•..••••••••••.. ·.••.. 0 •••• : 398 490 +23' Holasses, inedible •••••••••••••••.••••.•••••••••••••••• : 24 50 +110
Tobacco, unmanufactured ......... 0:0............................ 74 87 +17Vegetables and preparations •••••••••••••••••..••••.•••••• : 119 135 +14Wines and malt beverages:
Wines .•..• 0 ........................... 0 ............................................ " 0 .......... : 117 154 +31 l"Ialt beverages ......................... 0 .................................. 0 ................. : 20 28 +37
Other supplememtary vegetable products , 50 64 +28••••••••••••••••••• :____~--~------------~~---2,130Total supplementary products , ••••••.••••••••••••••••• '::=========================2,946 +38
Complementary
Bananas, fresh ••.......•.. '.....•......•..•..............•. 95 94 -1Cocoa and chocolate:
Cocoa beans ..• /I ••••••••••••••••• c. • 0 /I ............ It • /I •••• " : 60 81 +34 Cocoa butter ..•........••..•. 0 •• " /I•• 0 ................. •• : 14 17 +22 Cocoa and chocolate prepared ••• "••••••••••••••••••.•••• : 31 38 +23
Coffee: Coffee, green or crude ............................ ".• 0" 0: 637 718 +13 Coffee, soluble •••................ 0" ••••••••••• It •••• G" .: 44 45 +1
Drugs, crude .............................................. ,: 14 13 -9 Essential oils ••••"•••••••••.• 0 •• 00 •• a •• 0 ••••• "000" • 0 0 0 • 0 : 20 29 +48 Fibers, unmanufactured •.•.••• 00 ••• 00 •••••••••••••••••••• 0 : e 10 +14Rubber, crude:
Rubber, crude, dry form •••.•••••••••••••••••.••• , .••••• : 81 189 +133 Rubber, latex ••.•••••••.•••••.••••••••••••••••.•••• , ••• : 13 16 +25
Silk, raw ................................................. : 3 2 -47Spices •••••••.•••••••.••••••••••••••••.•••••••••••••••••• : 27 34 +26 Tea, crude ••.............•...•......•...•.•......• 01 ••• " " • : 29 34 +16 Wool, carpet ••••••••••••••••••••••.••••••••••••.••••••••• : 23 19 -15 Other complementary p.roducts ••••••••••••••••••••••••••••• :__ 2/+....,-::-~+-________-:'-,,~:-___
1,124 1.367 +22 28 +17
Total complementary products ••••.•••••••••••••••••••• :====================~=======
Total agricultural imports •••••••••.•••••••••••••••••••••• 3,254 4,313 +33
Percentage change computed from unrounded data.
-54
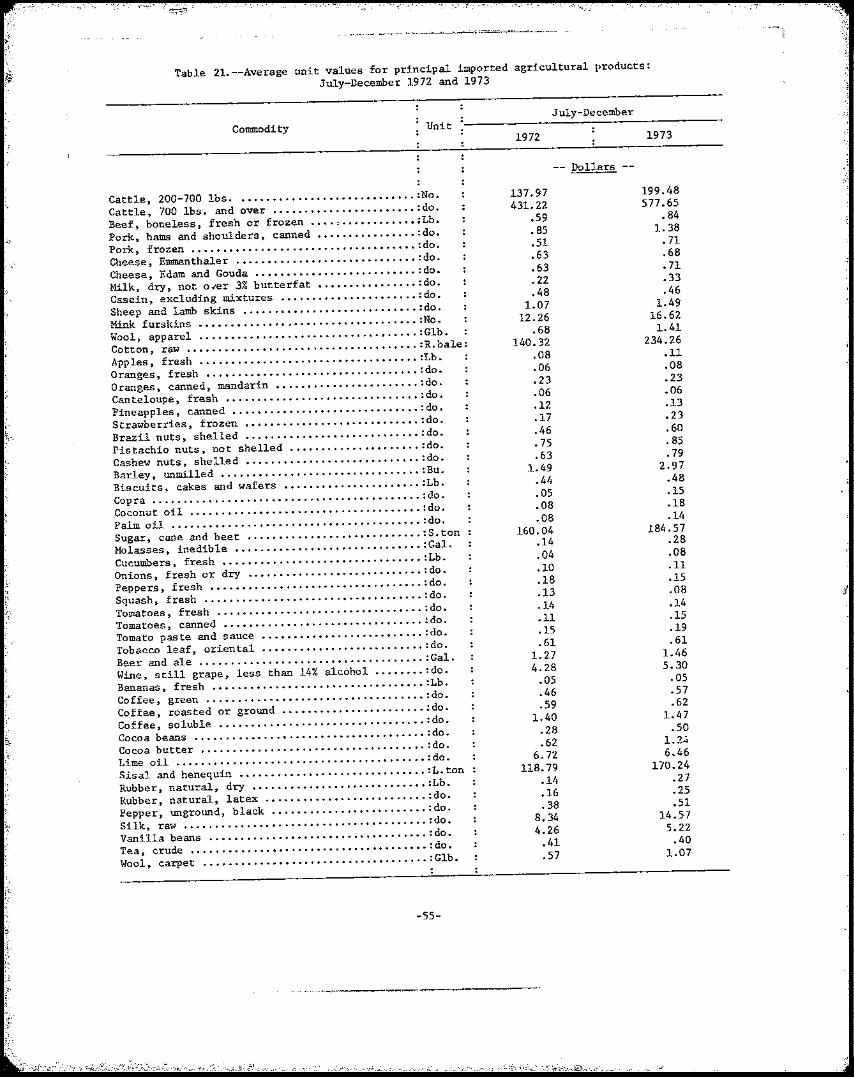
i
'
!
i
·'~'.''';'
Table 21.--Average unit values for principal imported agricultural products: JQly-December 1972 and 1973
July-December UnitCommodity 19731972
Dollars
199.48137.97Cattle, 200-700 lbs ••.•..•.....••..•.••.....•... :No. 577.65431.22Cattle, 700 1bs. and over .•.....•..••.•..•••.•.• : do. ,59 .84
Beef, boneless, fresh or frozen ••.. , .•..••..•.•• :Lb. 1.38.85Pork, hams and shoulders, canned .....•..•..••.•• :do. .71.51Pork, frozen .••..•....•.••..•.•.••..•• ··•·••·••· :do. .68.63Cheese, Emmentha1er ...••......•.•••....•..•..•.• :do. .71.63Cheese, Edam and Gouda ..•..•....•••.......•..•.. : do. .33.22Milk, dry, not o~er 3% butterfat •.••.....•.....• :do. .46.48Casein, excluding mixtures ..•.•......•.••.•..... :do. 1.491.07Sheep and lamb skins ...•.•..••..•.....•.....•..• : do. 16.6212.26Mink furskins ...•..•.•..... , ....•..••.•........• :No. 1.41.68Wool, apparel ..•.•.•........•..•......• ···•····· :G1b. 234.26140.32Cotton, raw ...•..•..•...•..•...•..•...• ·····•··· :R.ba1e: .11.08Apples, fresh ..•...•...........•....•......•..•. :Lb. .08.06Oranges, fresh •.•••...•...•.......•••....•..•..• : do. .23.23Oranges, canned, mandarin ••..••.•..•.. ·•········ :do. .06.06Cante1oupe, fresh .•..••••........•.•.•. ········· :do. .13.12Pineapples, canned ..•..........•..•.....•....... : do . .23.17Strawber:cies, frozen ..•........•.•......•..•.••. : do. .60.46Brazil nuts, shelled ..•...•.•.....•.....•....... : do. .85.75Pistachio nuts, not shelled ............••.•..•.. : do. .79.63Cashew nuts, shelled ..•............••..•....••.. : do. 2.971.49Barley, unmilled •...............•... ···•·•·····• :Bu. .48.44Biscuits, cakes and wafers •....••....•.•.•...... :Lb. .15.05Copra ........•......•......•.•..........•.•..•.• :do. .18.08Coconut oil ....•...•.......•......•.•.......•... : do. .14.08Palm oil .•.•..•................•.....• ···•·•··•· :do. 184.57160.04Sugar, cane and beet ..•.•............ ·•··•······ :S.ton .28.14Molasses, inedible •.•.......•.•.••.. ······•·•·•• :Gal. .08.04Cucumbers, fresh ....••.....••....•••.....••...•. :Lb. .11.10Onions, fresh 0 r dry ....•........•.••.•.•..•.••• : do. .15.18Pepper.s, fresh ..•....•...•...••.••...•.......•.. : do. .08.13Squash, fresh ......•.............. ·••···•····••· :do. .14.14Tomatoes, fresh ....•..•..••.............•..•..•. : do. .15.11Tomatoes, canned ••.............................. : do. .19.15Tomato paste and sauce •....•.•..•....•.• ····· .. · :do. .61.61Tobacco leaf, oriental ..........•..• ·······•···· :do. 1.461.27Beer and ale .••........•..........•....•......•. : Gal. 5.304.28Wine, still grape, less than 14% alcohol ..••.... :do. .05.05Bananas, fresh .•...•........................•... :Lb. .57.46Coffee, green .•.•...•..•.••.....••...•.......... : do. .62.59Coffee, roasted or ground .•........•....• ······· :do. 1.471.40Coffee, soluble •.....•....•..•..•...........•... : do. .50.28Cocoa beans •......•......•.......... ·····•···••• :do. 1.24.62Cocoa butter .....•....•..•.•....•..• ············ :do. 6.466.72Lime oil ...............••.•..•........•....•...• : do. 170.24118.79Sisal and henequin •......•...............•....•. :L.ton .27.14Rubber, natural, dry .•...••..........•.••.....•. :Lb. .25.16Rubber, natural, latex .•..••.•........ ··•······· :do. .51.38Pepper, unground, black •..•..••...•... ·········· :do. 14.57 Silk, raw .........•.........•••.••. ·····••·•···• :do.
8.34 5.22
Vanilla beans ..••..••.....•....••..• ···••••··••• :do. 4.26
.40 Tea, crude ••.....•..••.•.•.••.••• ··••····•··•··• :do.
.41 1.07.57Wool, carpet ...••.••...•.••••....••.••.••••....• :Glb.
-55
,
>
;
"

,'t.,-""'f'..,,!!I,-<'. ".:.:r..y.. (I" ;) "'),3 . '6"
TABLE; 22. __U.S. AGRICULTURAL IMPORTS: QUA~TITY AND VALUE ~Y COM~ODITY
r.OMMOOITY UNIT : JULY-DECEMBER
I)UANTITY VALUE 1972 1973 11 l'H2 1973
THOU. THOU. 1.000 DOL. 1.000 II DOL.
DECEMf:lF.:R QUANTiTY VALUE
1':172 1973 11 1972 1973 THOU. THOU. 1,000 DGL. 1.000
II
ALL COM~OOITIES 28.339.300 35.628.300 4,760~500 5.761.700
NONAGRICULTURAL COMMODITIES 25.085.374 31.315.372 4,210.346 5,002.688
AGRICULTURAL COMHODITIE;S 3.253.926 4.312.928 550.154 759.012
SUPPLEMENTARY 2.129,923 2.946tl30 365,43, 516.926
~NIMALS AND ANIMAL PRODUCTS 993.675 1.471.484 162.839 245.947
I
'" 0-I
)lNIMALS. LIVE BABY CHICKS CATTLE. DUTIA8LE CATTLE FOR aREEDYNG. FRE;E HORSES OTHER
DAIHY PRODUCTS CHEESE
8LUE MOLD. INCLUDIN6 ROQUEFORT CHEDDAR COLBY EDAM AND GOUDA RDMhND.REGGIANn,PARHES)lNO PECORINO SWTSS OTHER
BUTTER C4SEIN AND MIXTURES NONFAT DRY MILK OTHER
NO NO NO NO
LB LB Lfl LB LH LB LB LB LB LB I.B LB
1.935 605
8 2
IU2,603 3.910 7.21l5
670 6.243 6.310
10.918 ~6.418 40.84B
421 43.909
1,175
1.735 431
7 2
142.037 5,(>97
10.758 lt076 7.281 4,975 9,935
40.242 62.473 43,099 59,337
IB3,303
104.905 747
90.187 4.612 6.070 3.289
87,188 61.891
3.860 3.b44
2b9 3,952 4,236 8.379
16.691 20.860
277 21,668
258 3.U93
121.070 832
97.454 5.(l56 8.002 9.726
222,621 93.092
4.851 6.021
523 5tl71 4,681 8.031
27.501 36.312 24.928 21.50B 61.140 15.954
198 242
2 0
, --19.938
'118 1.089
36 1.51;1A 1.546 2.338 5.047 7.376
97 1.250 1.106
207 185
1 0
29.940 970
Itl42 513
)..922 10768 1.832 8.008
14.241 7
11.084 601\
36.224 65
33.844 1.022
861 433
16,584 12.217
J\21 535
17 963 984
1.814 3.\)00 4.084
£:5 3.424
23B 639
35.932 92
32,821 1.039 1.053
926
29,800 20.794 1.0H
691 26
},415 1.687 1,538 5.388 9.036
3 5.173
163 3.666
;',
'1
HIDES AND SKINS, INCLUOING CALF AND KIP SKINS CATTLE HIDES GOAT )lND KID SKINS SHf.EP AND LAMB SKINS FURSKINS OTHfR
FURSKINS LB LB LB LB
l.Bbl 6.044 2.519
17.635
2.911 210 698
564 12.937
500175 1.169 2.358 2.163
19.591 ?0,592 3,703
60.765 1.980 7.250
B12 19.595 27.198
3.931
301 1.471
360 1.370
437 3.625
18 1.10'1
l!it655 2119 629 450
1.A03 6.873
691
10.968 316
10096 33
1.614 7.191
719
MEATS AND ~EAT PREPARATIONS BEEF AND VE;AL
CIINNED FPESH OR FROZEN PREP)lRED OR PRF.SERVED
MUTTON. GOAT. AND LAMB PORK
FRESH OR FROZEN HAMS AND SHOULOERS.CND.CDOKEO.ETC OTHER
OTHER
LB LB LB LB LB LB LB LB Lfl LP ... 8
1,100.942 853,278
47,597 773,298
32.3&3 41J.983
IB5,767 2B.701
141.538 15.528 21h915
1.0680184 839.541
52.678 757.250
29.614 13,6£>3
1960125 31.716
150,62B 13,782 18.85'>
680,460 509.958
29,655 455,870 24.433 13.536
143.981 14,191
119,780 10.010 12.Q85
9B6,00B 717.059
45,994 636.885 34.I80
8.671 242.201
23.096 205.609
13.496 18.077
13"{,571 102,152
5,695 '13.278
3.179 1.395
30.755 3,042
24.434 3.279 3.269
155.849 1210 164
7,766 109.864
3.534 884
30.12,> 3.177
24,611 2.337 3.675
RR.963 60.953
3.480 55.231
2.243 500
25.612 1. 7 \2
2h781\ 2.112 1.897
156.817 113.119
7.899 100.749
4.472 552
39.729 2.313
35.011 2.406 3.416
CONTINUEO-
__ 4 --xJ fj,,-,

'>'~:'- ...,-~~. ~ .'!o~ ~~~''"",,'tf''''' ry t'--'....,y- ~')- . -~~..::--=-~~~'-I
~
TABLE 22.--U.S. AGRICULTURAL IMPORTSI QUANTITY AND VALUE BY COM~ODITY--CONTINUEO
~t~ :,
COHMOOITY UNIT JULY-DrCEMBER
QUANTITY VALUE 1972 1973 1/ 1972 1973 11
THOU. THOU. l.OOO DOL. 1.000 DOL. I
DECEMBER QUANTITY VALUE
1972 1913 11 1912 1913 11 THOU. THOU. 1.000 DOL. 1,000 DOL.
POULTRY PRODUCTS EGGS. DRIEO AND OTHER_ISE PRESERVED EGGS IN THE SHELL POULTRY MEAT
LB OOZ
UI
28 1.192
374
19 5,506
537
1.664 18
1,1.16 530
4,109 It
3,258 836
4 89 61
::I 195 ~2
154 3
51 100
512 2
391 119
;{".:cc j
OTHER ANIMAL PRODUCTS BEESWAX BONES. HOOFS. ANn HORNS BRISTLES. CRUDE OR PREPARED FATS. QILS. AND GREASES FEATHERS ANO DOWNS, CRUDE. SORTED GELATIN HAIR. U~~~NUFACTURED SAUSAGE i:~S~NGS OSSEIN RENNET WOOL.UNMANUFACTURED.EX FREE IN BOND OTHER
LB
LB LB LB
LB
LB LB
GLB
966
1,430 7.936 ;3.181
'".3.590
1.610 448
19.555
1.489
!t108 12.981 4.245
2.655
5.168 829
8.310
69,283 619
3.038 5.117 1.019 (.363 1.146 3,745
13.181 3.268 1.590
13.399 9.138
76,911 1.280 2.022 1.114 2.609 1,588
10.021 3.446
14.668 2.662 l,3~!:l
11,851 12.251
159
155 816 ~84
S69
2.319 29
2.510
204
216 2.310
683
109
621 69
1.256
10.260 99
295 511 113
1.003 1,084
599 2.029 1.001
191 1,886 1.444
11.918 194 361 Bl1 428
1,3r.3 1.591
514 2.425
179 ??8
2,028 1.135
;; ";j~:
,,~ 0-
VEGETABLE PRODUCTS 10 136.248 1.414,646 202.598 210.979
I
'"
COTTON. UNMANUFACTURED COTTON. RAW LINTERS
RBA RBA R8A
41 19 21
38 14 23
3,401 2.111
684
4,702 3.367 1,335
3 n 2
3 1 2
158 51'
IIi!
339 166 113
!
l' ~ :!i. ~i ('
~~ ("l~; I'i
I' FRUITS AND PREPARATIONS APPLF.S. FRESH APPLE AND PEAR JUICES BLUEBERRIES STRAWBERRIES OTHER BERRIES CHERRIES DATES FIGS GRAPES MELONS ORANGES. MANOARIN. CANNED ORANGES. FRESH ORANGE ~UICE, CONCENTR~TEO PEARS. FRESH PEARS. PREP OR PRES PINEAPPLES. CND. PREP OR PRES PINEAPPLE ~UICE JELLIES AND JAMS OTHf.R
LB GAL
LB LB L8 LB Lij LB LB L8 LB LB
GAL LB LB LB
GAL LB
41.165 '!-.81b 9.371
27.230 11 .547 6.713
19.221 6.196
13.383 4.8'H
45.530 69,614 16.382 6.067 5.807
111.123 4.530 5.015
33.500 11 .433 10.378 35.329 15.090
3.6B7 8,908 4.485
10.608 14,633 43.789 65.198 13.022
642 268
99'447 5.000 4.386
17,718 3.760 2.705 2.957 4.786 2.235 2.136 2.195 1.060 1.884
302 10.661 4,617 6.088
868 663
13.531 1.104 1,629
14.528
88.836 3,823 8.383 3.773 7,881 3.477 1.695 1~1~1 1,516 2.339
476 10.203 5.079 5.098
134 17
13.620 1.165 1.803
11.168
1.1U3 1.509
842 7.554 1.174
465 18.U21
624 1.926 3.029 5.505
19.005 4.511,
730 629
13,620 296 675
6.656 2.093
869 8.164
477 33
8,184 1.728
129 1.2?7 4.415
19,983 7.138
32 24
9.544 1,242
561
16.084 745 810 347
1.436 261 138
2,049 102 365 189
1.36e 1,568 1.491
117 80
1.100 59
209 2.932
11,259 980
1.454 376
1.790 170
35 1.016
590 31 12
1.050 1.958 3.051
(,
19 1.325
295 212
2.835
~;!;
q
CO~TINUED--
~

TARLE 22.--U.S. AG~lCULTURAL IMPORTS: ~UANTITY AND VALUE BY COMMODITY--CONTINUEO
JULV-DECEMHER DECEMRE"R COMMOOITY UNIT : QUANTITY y"ALUf QUANTITY VAllIE
197<' 1973 11 1972 1973 11 1972 1973 11 1972 1973 11 THOU. THOU. 1,000 DOL. 1,000 DOL. THOU. T~OU. 1,000 OOL. 1.000 DOL.
NUTS AND PREPARATIONS 61.715 76.368 10,892 11 .452 IILMONDS LB 250 91 173 82 63 65 46 39 BRAZIL NUTS LB 30,600 25.616 8.514 9,508 1,568 1.588 823 875 CASHEII NUTS LB 56,868 47.210 35,806 37,541 9.363 7,237 5,583 6.087 CHESTNUTS LB 9.261 11,910 3~459 4.335 1.616 2,690 597 949 COCONUT MEAT~ FR. PREP. OR PRES LB 54,587 57,206 5,571 11,656 10.195 9,101 1,002 2,178 Fr.LRERTS LB 3,560 6,551 2,071 3,913 881 1,638 517 q96 PISTACHE NUTS LB 5.667 8.8A7 4.380 7,693 2.410 21 1.870 19 WALNUTS LB 33'1 195 1!18 166 43 (l 32 0 OTHE~ 1.523 1,474 423 309
eRAINS AND PREPARATIONS 53,410 60.6B3 10,723 9,680 BARLEY BU 9,422 f}f5H 14,080 13,606 2,643 932 4,262 2,323 BARLEY MALT CIIT 104 113 552 863 14 29 BO 329 CORN tlU 421 5'13 754 1,609 72 29 156 III OATS au 1,562 139 1,240 235 229 In 189 18 RICE LB 120104 9.505 881 89B 4,607 69 335 30 RYE flU 154 0 166 0 0 0 0 0 WHEAT au 0 41 1 110 0 40 0 12 WHEAT FLOUR CIIT 18 24 B9 272 0 0 1 0 WHEAT GLUTEN LB 150979 13.521" 4,Oi1-9 4,337 2,971 2,618 764 925 BISCUITS. CAKES, WAFERS. ETC LB 48 tl7l 46,962 21.301 <!Z,100 6,822 6.0B2 3,203 3.066 BREAD CRUMBS LB 11,177 15,917 1,728 3,159 2.138 2,727 322 623 BREAD, YEAST-LEAVENED LR 2.730 2,416 629 725 394 381 99 116
I VI CD,
M~CARONI, SPAGHETTI, OTHER
ETC LB 21.74B 22,520 4,185 3.177
6,l25 6,043
3,799 3,678 159 553
1,136 991
OILBEARING OIL CAKE
MATERIALS AND MEAL
AND PRODUCTS STN 9 8
92,226 420
119,8&1 480 2 C;
15,'1"4 76
39,071 236
OILSEEDS ANn OILNUTS 18,840 31,855 3.826 5.535 COpRA LB 223,478 151,731 11,704 23.748 50,904 24.251 2,637 4,318 SESAME SEED OTHER
LR 18,594 16,145 3,495 3,641
.... 075 4,032
2.611 1,551 532 657
508 109
VEGETABLE OILS AND WAXES LR 643.934 683,722 72,965 147,552 10S,281 138,123 12,062 33,301 CA~NAUflft LR 4.326 4.444 1,742 1,920 748 936 331 453 CASTOR OIL COCONUT OIL
LB LB
46,288 2Af>,534
61.011 321.869
9,719 23,835
25,594 59,220
7,656 50,432
12,438 74.58...
2,148 3,953
0;,327 16,009
OLIVE OIL. EDIRLE PALM OtL PALM KERNEL OIL
LB LB LB
27,355 203,269
49.879
29.574 180,532 51.850
11,308 16,528 5.240
16,600 25.584 10,874
3.185 20.624 16,660
3.142 29,832 13.43Q
1,425 1,663 1,115
1,961 5.103 3.372
TUNG bIL LB 8.810 6,661 ",4O 1.162 2,5BO n 285 0 OTHER LB 17,473 21,721 3.753 6,599 3.395 3.151 541 1.176
CONTINUED-

j
TABU; 22.--U.5. AGRICULTURAL IMPORTS: QUANTITY ANO VALUE BY COMMODITY--CONTINUED
JULY-DECEfoIRER DECEMBF.R COMMonITY UNIT QUANTITY
1972 1973 11 VALUE
1912 1973 11 QUANTITY
1912 1913 11 1912 VALUE
1913 11 THOU. THOU. 1,000 DOL. 1,000 DOL. THOU. THOU. 1,000 DOL. 1,000 DOL.
SUGAR AND RELATED PROOUCTS SUGAR MOLASSES. INEDIBLE MAPLE SU~AR AND SIRUP CONFECTIONERY PRODUCTS HONEY OTHER
STN GAL
LB LH LB
2.489 113.542
4.805 42,119 13.901
2,654 175.452
5.508 41.012
4,119
445,532 398.314 23,655 3tl16
15.846 3,406 1.135
561,036 489.831 49,614
3,165 21.390
1,802 1.115
386 24,412
541 6.114
751
46) 31.556
665 1.291
959
69,515 62,671
3.292 388
2.545 199 421
101,690 86.934 10,782
448 3.063
361 101
VEGETABLES AND PREPARATIONS 118.161 134.922 .._ 29,406 29.148 FRESH OR FROZEN:
BEANS LB 3.166 1.293 420 186 2.819 1.056 374 151 CARROTS CUCUMBERS OASHEENS EGGPLANT GARLIC ONIONS PEAS PEPPERS POTATOES. WHITF OR IRISH
L8 LB LB LB LB LB LB LB
CIIT
36,908 28,678 10,615 6,318 6.551
15.911 1 tl78 4.871
201
31,838 19,668 12,134 6.255 7.919
20,908 10859 9.805
303
1.822 2,513 1,318
735 1,821 1.594
370 898 612
1,421 1,209 1,515
532 2.214 2.288
514 1.432 1.330
7.597 24.941
1,551 4,499
600 '7.123
483 2.642
lIil
4.843 16,990
lt957 4,843
439 7.904
391 5,468
15(.
318 2.302
186 521 229 539 139 530 306
208 986 268 366 183 609 109 148 711
SQUASH TOMATOES
LB LB
4.925 43.565
4.215 57.495
658 6.096
324 8.204
4.333 14.650
3.790 16,967
608 2,274
257 2.438
TURNIPS OTHER
OR RUTABAGAS CWT 471 436 2.681 4.429
2.614 5.005
98 11 !H1 914
416 930
, ..... '"' J
PREPARED OR PR~SFRVEO: CASSAVA.FLOU ,STARCH. AND TAPIOCA HOPS MUSHROOMS. INCLUDING DRIEO OLIVES. IN BRINE ONIONS PEAS, EX DRIED PICKLED VEGETA~LES TOMAtOES TOMATO PASTE AND SAUCE OTHER
LB LB LB
GAL LB LB L8 LB LB
46.806 2.854
24.172 8.119 3,176 3.491
30,601 60.114 58,069
53.219 1.888
25.560 8.843 3.043 3.601
21,716 35,142 48.250
2.035 2.821
18.084 24,T10
931 821
3.924 6,520 8,839
24.031
2.686 2,554
18,133 29,981
1.138 HI
3.668 5.41~ 9,238
31.803
2olT1 1.911 3.262 2.092
635 229
3,422 18,022 21,116
1.584 1,104 3.716 1,385
541 585
3.335 11,338 14,029
111 1.915 2,328 5.009
161 54
565 1,960 3,254 4.1H!
413 1,444 <!.620 4,Il24
203 113 544
1,913 2,994 5.695
OTHE~ VEGETABLE PRODUCTS 283.418 362.211 49,856 62.339 BROO~CORN CUT FLOWERS ESSENTIAL OR DISTILLED OILS FEEDS AND FODDERS.EX OIL CAKE~MEAL FLAVORING f.XTR4CTS JUTE AND JUTE BUTTS. UNMANUFACTURED MALT LIQUORS NURSERY 4HO GREENHOUSE STOCK SFEOS, EXCEPT 0 II. SEFOS SPICES TOBACCO. UNMANUFACTUPED WINES OTHER
STN
LB
LTN GAL
LB LB LIl
GAL
8
1.054
4 15.882
<'4.895 10,140
124.017 25,655
7
810
13 18,962
18.434 12,845
140,531 21.804
4.544 2.301 2,812
20.380 2.909 1.281
20,245 16.968 8.178 3,625
13.850 111.218
8,447
4.852 7,530 2.464
25.899 "3,696 1.884
21,106 18.M1 11,715 5.165
86,516 153,813
12,261
1
165
1 2.140
5.058 4,309
20,216 5.053
169
1 2.?91
4,99A 4.591
26.025 ':;',488
602 612 481
3,805 694 296
2,711 801
1,751 1,547 11~232 23,956
1,361
732 1,459
134 4,090
101 142
4,640 1,053 2,110 1,895
17,380 25,606
1.131 CONTINUED-

':t , "'\1 )1 & '';':;' "
r
TABLE 22.--U.S. AGRICULTURAL IMPORTS I QUANTITY AND VALUE av CO~MODITY--CONTINUEO
cOMMOOITY UNIT : JULy-DECEMBER
QUANTITY VALUE QU~.NTITY DECEMBER
VALUE 1972 1973 11 1972 1973 11 1972 1973 11 1972 1973 11
THOU" THOU. 1.000 DOL. 1.000 OOL. THOU. THOU. 1.000 DOL. 1.000 DOL.
COMPLEMENTARY lt124.003 1.366.798 184.717 242.086
8ANANAS LR 2.090.410 2,GI4.698 94.659 94.075 355,971 286.034 16.069 13.768 PLANTAINS LB 53.316 60.680 2.318 2.375 9.343 10.125 370 432 COFFEE. GREEN LB 1.391.28& 10270.386 637.273 718.347 170.418 218.566 83.105 123.753 COFFEE EXTRACTS.ESSENCES.COHCENTRATES LB 31.73~ 30.662 44.32Q 44,871 &.111 9.964 9.163 12.593 COCOA "lEANS LB 216.824 162.340 60.126 80.807 80.775 61.714 23.802 3~.693
COCOA BUTTER LB 21.736 13,344 13.574 16,532 5.716 1,293 4.316 1.694 COCOA AND CHOCOLATF PREPARATIONS LB 115.226 1210202 31,015 38,018 20.978 19.525 5.198 6.740 DRUGS, HERBS. ROOTS. ~TC ESSENTIAL OR DISTILLED OILS
LB LB
34,617 6.390
30.750 6.861
14.334 1!h892
13.098 2'h430
87l 839
6.297 1.311
2.n82 3.496
1.823 5.092
FIBERS. UNMANUFACTUREO LTN 42 37 9.052 10.284 6 6 1.108 1.502 RUBBER. CRUDE. NATURAL:
RURBER. DRY FORM LB 577.911 664.602 III .092 189.145 112.979 74.939 15.910 22.704 RUB~ER. LATEX LB 82,261 64.4!l6 13.003 16.204 12,557 10.899 1.886 3.268
SILK. RAW LB 340 103 2,837 1.503 19 14 164 273 SPICES:
PEPPER. UNGROUNO. BLACK LII 33.239 22.876 12.53& 11.628 5,066 1.64Q 1.864 811 VANILLA BEANS LB ~98 773 2.547 4.032 313 188 1.696 1.001 OTHER LB 31.226 34.298 11 ••532 18,659 5,132 6,845 2.035 4.094
TEA LB 71,785 84,182 29,409 34.076 10.731 11.9Q7 4,582 5.172 WOOL. UNMANUFACTUR~O. FREE IN BONO r,LB 39.996 18.238 22.973 19.490 5.056 1.640 3.753 1.932 OTHER 21.453 24,224 3,51B 2,740
I
'" 0 11 PAELIMINARY I
,

, ~
TABLE 23.--U.S. AGRICULTURAL [XPORTS: QUANTITY AND VALUE BY COMMODITY
JULY-DECEMBERCOMMODITY DECEMBERUNIT : QUANTITY VALUE QUANTITY VALUE1972 1973 11 1972 1973 11 1972 1973 11THOU. 1972 1973 11THOU. 1,000 DOL. 1,000 DOL. THOU. THOU. 1,000 DOL. 1,000 nOl. ALL COMMODITIES
25,154,100 37,540.800 4,649.200 6.886.000 NONAGRICULTURAL COMMODITIES
19.988.200 27.613.213 3.540.584 4,910.413AGRICULTURAL COMMODITIES
5.165.900 9.927.587 1,108.616 1.975.587 ANIMALS AND ANIMAL PRODUCTS
t 582.219 813.804 c, 105.895 141.238 ~" ANIMALS LIVE. EX POULTRY1 CATTLE 40.684 123,266NO 55 12.848 18.344220 24.396 96.496OTHfR 18 20; 6.173 12.12616.288 26.170
I 6.015 5.611DAIRY PRODUCTS
54.257 28.655ANHYDROUS MILK ,FAT 6.130LB 4.59214 132~ RUTTER 11 112 3 1LB 10200 155 3 6662 128CHEESE AND CURD 1,058 21 568 21i MILK AND CREAM: LB 3.064 3.129 2.613 3.481 544 510 503 515i CONDENSED OR EVAPORATED LB 23.321 19.603 4.141 3.966 3.444DRY. WHOLE MILK AND CREAM 3.455 661LB 19.009 17121.540 3.027 4.347FRESH 2.026 2.418i GAL 404 523840 888 1.251 1.861NONFAT DRY 216 205 238 444LB 119.959 2.989 30,931OTHER 995 5,916 391 1,814 11611 ,622 13.166 1.882 2.196
F~TS. OILS. AND GREASESI La 1.241.050 1.141,298 104,734 200,919LARD AND OTHER RENDERED PIG FAT 159.895 189,096 13.917 34.192....'" LB 80.495 49,413 9.390 10,363I TALLOW: 4,351 5,815 514 1,411
EDIBLE LB 9,604 14,301 851INEDIRLE 2,465 279 3,126 31LB 1.011 .199 996,791 133OTHER 86.104 112.809 142.907 165,830 12,091LB 190153 80.126 29,4341.188 15.343 12.351 13,725 1.268 2,601
MEATS AND MEAT PREPARATIONSi LB 219,343 269.591 101,001 113.911 31.385BEEF AND VEAL, EXCEPT OFFALS LB 28.074 52.011 18.029 35.36043,135 25.930 54.223 5.129PORK, ExCEPT OFFALS 9,248 5.044LB 48.090 11.64439.359 <14.761 26.280! OFFALS. EDIRLE. VARIETY MEATS LB 6.404 4.603 30101 3.295121.036 144.004 41.511 67.216OTHER 22.656 30.956LB 16.143 42.494 8.551 16.1968.800 26.252 2.596 1.205 1.333 4.(125POULTRY AND POULTRY PRODUCTS
49.089POULTRY. LI VE: 11.299 8.843 13.668BREEDING CHICKC; NO 6,246 5.802 6.872 1.156BABY CHICKS. EX BRfEDING CHICKS NO 1.009 851 1.245 1.0169.538 10.7~~ 10817OTHER 1.981 1.033 1,208 246 2451.418 2.321POULTRY MEAT/ FRESH. FROZEN: 191 1.229CHICKENS LB 48.515 51.763 12.300 21.149TURKEYS 9.108 10.185 2.316 4.402LB 26,518 32,416 11.033OTHER 17,802 4,8a1 5,980 1,951LB 6.016 3,2196.111 2,245 3.601 1.091POULTRY. CANNED AND SPECIALTIES 955LB 6,019 30131 412 5552.223 1,122EGGS IN THE SHELL. FOR HATCHING DOZ 951 381 361 2625,611 5,310 5,115 6,691EGGS IN THE SHELL. OTHER DOZ 2,404 868 863 954 1.2511,551 926 1,028 308EGGS. DRIED AND OTHERWISE PRESERVED 264 132LB 2,821 2.925 2.219 3,617 638
183 325 501 614
HIDES AND SKINS. INC FURSKINS 207.442 185.109CATTLE HIDES. WHOLE NO 42.614 36,5259.518 7,659OTHER 172,804 139.889 1,502 1,376 33,538 24.65434.638 45.821 9,016 11 .811 CONTINUED-

I
<n "
TABLE 23.--U.S. AGRICULTURAL EXPORTS: QUANTITY AND VALUE BY COMMODITY--CONTINUEn
JULY-DECEMBER DECFMBE~
COMMODITY UNIT QUANTITY VALUE QUANTITY VALUE 1912 1913 II 1912 1913 II 1912 1913 1/ 1912 1913 11
THOU. THOU. 1,000 DOL. 1,000 DOL. THOU. THOU. 1,000 DOL. 1.000 nOLo
3.454 4,5<;6OTHER ANIMAL PRODUCTS l'h012 29,925 HAIR, ANIMAL. EX WOOL OR FINE HAIR LB 420 352 222 32B 133 30 61 32 SAUSAGE CASINGS LB 6.699 1,549 5.960 9,368 1.151 808 1.135 1.380 WOOL, UNMANUFACTURED. I~C FINE HAIR CLB 10,023 6,809 6.069 9,640 1,208 191 800 956
OTHER 6,161 10,589 1,452 2,188
4.583,681 9,113,183 It002.121 1,828,349VEGETABLE PRODUCTS -~
COTTON. UNMANUFACTURED RBA lt413 2,669 2A6.596 399,142 560 621 86,339 130,520 COTTON. RI,W R8A 1,321 2,085 214,022 393,951 534 592 95.694 128,891 i. LINTERS RBA 81 584 2.514 5,185 27 34 656 1.629
FRUITS AND PREPARATIONS 236.490 314.432 33,394 50,942 CANNED LB 221,110 2310000 38,108 48,533 30.649 26,845 5,621 6,119
CHERRIES LB 22,192 11,184 4,990 4,290 3,353 2,195 811 901 FRUIT I:OCi(TAIL LB 5It883 62,348 9,855 14,489 6,642 9,412 1,351 2.302 PEACHES L8 80,698 81.432 12,181 16,259 9.154 1.011 1.411 It333 PEARS LB 7.158 6,133 1,062 1,286 88.493 1,28c; 212 PINEAPPLES LB 40,656 41,596 6,162 8.030 8,208 4.614 1.324 816 OTHER LB 18,522 16,306 3.858 4,119 2,198 2.208 563 554
DRIED LB 99,296 140,581 33,296 61,661 12,102 31,818 4,126 14,526 PRUNES LB 460124 73,622 14,293 28,811 5,428 14,029 2,016 5.A81 GRAPES (RAISINS) LB 40,114 52,654 13,803 26,215 4,815 14,413 1,958 1,156 OTHER LB 13,058 14,305 5,200 6,568 1,860 3,436 151 1,483
FRESH LB 10048,561 1,186,221 129,560 158,163 133,349 163,823 i6.635 22,895 I
APPLES LB ('6,615 96,111 1.820 13,200 20,924 23,66A 2,341 3.206'" N I BERRIES LB 11.035 13,208 2.539 3.313 645 1.120 149 322
GRAPEFRUITS LB 126,354 142.256 12.839 15,033 23,164 24,514 1.951 2,313 GRAPES L8 188.681 206.966 36,513 43,019 11,616 18,182 4.336 4.551 LEMONS AND LIMES LB 180,133 185,145 21,261 23.353 19.911 30.409 2,260 4.468 ORANGES,TANGERINES,AND CLEMENTINE LB 281,249 294.612 27,358 30.440 40,451 500101 4.319 5.611 PEARS LB 40,575 6B,530 4,833 9,193 1,508 12,861 858 1.185 OTHER LB 153,919 118.613 16,391 20,612 3.005 2,963 414 566
FRUIT JUICES GAL 16,030 19,361 31.341 38.696 3,091 2.933 5,893 6,595 GRAPEFRUIT GAL 2,116 2,852 4.520 4,130 434 342 821 196 ORANGE GAL 80132 10.222 19,810 24.401 1,583 1.599 3.191 4,241 OTHER GAL 5,182 6,286 6,951 9,559 1,080 992 1.214 1,552
FROZEN FRUITS LB 1,466 13,541 1,554 4,144 888 951 181 251 OTHER 2,031 3,235 333 490
NUTS AND PREPARATInhS LB 94,591 91,480 61,244 94.116 13,981 11,913 9,145 21,935 ALMONDS LB 45,803 39,914 36,085 54,926 1,425 11 .392 6,159 16,161 WALNUTS L8 31,251 31,889 12,249 19,991 3.298 2.498 1.341 1.398 OTHER LB 17,530 19,611 12.911 19,199 3,258 4.023 2,246 4.316
CONTINUC:D-
-.. p

-,."""- "--~ " J;""f1?' ',"",':
TABLE 23.--U.S. AGRIGULTURAL EXPORTSI QUANTITY AND VALUE BY COMMODITY--CONTINUEn
.JULY-DECEMBER DECEMBER COMMOnITY UNIT I QUANTITY
1972 1973 11 THOU. THOU.
VALUE 1972 1973
1.000 DOL. 1.000 11 DOL.
QUANTITY 1972 1973 11 THOU. THOU.
1972 1.000
VALUE 1973
DOL. l.pOO 11 DOL.
1 ~
GRAINS AND PREPARATIONS F~ED GRAINS AND PRODUCTS
FEED GRAINS BARLEY CORN GRAIN SORGHUMS OATS
MALT AND FLOUR. INC BARLEY MALT CORN GRITS AND HOMINY CORNMEAL CORN STARCH OATMEAL AND GROATS O_TMEAL ~ OATS. ROLLED. ETC
RICE. HILLED BASTS HILLED HUSKED. BROWN
RYE ~HEAT AND PRODUCTS
WHEAT WHEAT FLOUR OTHER WHEAT PRODUCTS
BAKERY PRODUCTS INFANTS AND DIETETIC FOODS BLENDED FOOD PROnUCTS OTHER
HT HT BU BU BU BU LB LB
CWT LB
CWT LB LB LB LB BU BU eu
CWT BU LB LB LB
16.367 16.169 23.276
521.136 93.563
3.390 60.366 17.621
1.162 28.050
67 20,055
2.308.391 11476.212
832.179 191
502.375 475.447
9.208 5.946
10.663 80.122
168.425
22.450 22.235 51.879
687.931 122.873 35.187 44.410 30.107
10499 36.162
84 3,767
1,621,653 1,431.094
190.5<;9 22.027
736.045 714.048
7.930 4,119
13.036 70.919
120.092
2.074.783 923.906 909,032
26.132 745.004 135.591
2.305 3.961
801 5.138 3,161
374 10440
2G9.129 146.882 62.247
231 906.464 B49.176
41.001 16.287 4.033 8,553
14.576 7.891
5.268.192 2.153.489 2,134.925
ll6,425 1,687.734
281.192 49.574
3.737 1.691 7,417 4.724
575 419
313.684 284.342
29.342 49.847
2.704.507 2.625.706
58.286 20.515
5.386 11 .369 16.202 13.709
2.727 2.696 7.013
83.702 16,117
511 11 .406 4.289
176 5,500
0 2.181
407.302 288.914 1111.388
166 110.828 106.827
1.315 1.006 2.002 9.553
36.667
3.175 3.734 7.247
III .596 26.526 4.697 8.433 3.853
333 6,319
4 438
405.633 378,970
26,664 1.251
93.555 89.493
1.166 1.406 2.302 7.609
26.195
437.869 169.738 167.186
9.789 130.965 25.912
519 178 195 788 5&9
0 201
43.781 32.901 10.881
194 217.744 207.226
7.249 3.270
828 1.156 3.237 1.192
931.745 394.423 391.052
17.864 299,616
66.963 6,609
894 222
1.294 858
41 63
97.521 92.899
4.622 3.752
427.975 408.995
11.147 7.833 1.010 1.111 3.411 2.542
I
'" 'r' FEEDS AND FODnERS.F.X OJL CAKE~HEAL CORN BYP~ODUCTS. FEED 21 ALFALFA HEAL. DEHYDRATED ALFALFA HEAL. SUN-CURED ALFALFA HAY CUBES POULTRY FEEDS. PREPARED OTHER
STN STN STN STN STN
436 87 82 13 58
524 79 99 50 55
IH.562 28.467
4.401 3.993
628 10.035 40.038
141.680 52.032 6.118 5.217 2.783
15.380 60,090
66 12
8 6
10
62 8
22 C;
12
17.072 4.894
698 600 285
1.787 8.808
20.389 7.074
696 1.766
292 3.122 7.439
OILSEEDS AND PRODUCTS OIL CAKE AND MEAL
SOYBEAN OIL CAKE AND OTHER
OILSEEDS FLAXSEED SOYBEANS SAFFLOWER SEED OTHER
VEG OILS AND WAXES COTTONSEED OIL SOYBEAN OIL OTHER
HEAL STN STN STN
BU BU LB
LB LB LB LB
2,241 2.064
177
8.662 231.421 86.399
1.046.925 226,353 527.183 293.389
2,230 2,016
213
305 211 ,832 130.909
843.15B 192.216 365.367 285.575
1.296.110 246.555 230.324
16.231 912.717
26.946 818.197
3.963 63.611
136.838 29.259 65,674 41.906
2,093.000 510.466 471.003
39.464 1.406.6d4
2.119 1,28B.214
7.957 108.193 176.730 31.569 73.384 65.718
467 437
29
2.458 49.651 11.926
163.894 32.154 64,952 66.788
557 520
37
209 58.028
51
189p717 38.321
116.137 35.259
289.234 55.585 52.925
2.659 2J2.152
8.114 185.950
493 18.195 20.898
3.824 1.790 9.284
523.549 112.378 105.890
6.488 365.468
1.736 334~924
5 28.802 45.104
8.020 26.618 11 .065
CONTINUED-
c

"
TABLE 23.--U.S. AGRICULTURAL EXPORTS: QUANTITY AND VALUE BY COMMODITY--CONTINUEO
COMMOOITY UNIT JULY-DECEMBER
QUANTITY VALUE 1912 1973 1/ 1972 1973
THOU. THOU. 1,000 DOL. 10000 1/ I
DOL.
DECEMBER QUANTITY VALUE
1912 1913 1/ 1912 1973 17' THOU. THOU. 1,000 DOL. 1,000 DOL.
I 13'..,. I
TOBACCO, UNMANUFACTURED BURLEY CIGAR WRAPPER DARK-FIRED KENTUCKY. AND TENNESSEE FLUE-CURED MARYLAND BULK SMO~INr, TOBACCO OTHER
VEGETABLES AND PREPARATIONS CANNED
kSPARAGUS CORN SOUPS TOMATOES, TOMATO SAUCE AND PUREE OTHER
PULSES DRIED BEANS DRIED PEAS, INC COW AND CHICK DRIED LENTILS
FRESH LETTUCE ONIONS POTATOES. EXCEPT SWEET POTATOES TOMATOES OTHER
FROZEN VEGETABLES HOPS SOUPS AND ~EGETARLES, DEHYDRATED TOMATO JUICE. CANNED VEGETABLE SEASONINGS OTHFR
OTHER VEGETABLE PRODUCTS COFFEE DRUGS, HERBS, ROOTS, ETC ESSENTIAL OILS AND RESINOIDS FLAVORING SIRUPS, SUGARS. EXTRACTS HONEY NURSERY STOCK SEEDS, EXCEPT 011 SEEDS SPICES OTHER
LB LB LB LB LB LB LB LB
LB LB LB LA LB LB LB LB LB LB LB LB LB LB LB LB LB LB LB
GAL LB
J __
LB LB LB
LB
LB LB
313,249 23,516
1,515 9,131
211,181 5,811
12,608 48,B22
63,217 1,921
12,904 10,193 19,241 18,351
314,521 153,356 106.118 54,447
591,655 128.892 52.571
186.957 82,697
146.538 13,926 7,901
16,264 821
24,672
13.964 4.965 7,013
2,742
141,814 4,331
360,5611 30,058
113 9,320
231,810 5,649
16,546 60,411
12lr286 2,214
310931 15,420 41,331 24,385
4010121 214,423
95,495 31,204
631,618 103.630 104.692 205.858
85,784 131.655 28.125
6,025 17,400
10208 28.743
19,139 6,083 8,475
11.110
144,872 4,623
343,623 27.100
9,543 6,804
268,599 6.456
14.393 10,130
124,515 12.008
690 2,218 2,2B2 3.193 3,626
29,215 16,019 6.7B3 6,413
39,552 7.414 3.259 6.555
10,363 11.961 2.653 7,557 7,580
913 5.813
19.224
142.757 13.553
8,719 19,086 28,227
938 4,861
32,139 2,946
31.6AA
411.155 38,106
3.605 1,310
329,212 6.445
21,684 11.333
201,480 26,403
892 5,B13 3.156
10,831 5,051
66,137 45.7BO 14.340 6,618
51,026 1.079 9.262 8.245
12,121 14.319 5.998 5.702 8,808 1,405 8,B30
26.511
182.586 20.154
9,727 21,591 24,818
4.942 5,625
45,011 3,195
40.923
59,614 2,493
235 1.945
42.941 511
3,427 8.057
10,693 288
2.349 1,643 3,216 3,131
74,501 35.852 2110691
9.951 113,383 32.466
'7,413 11 .899 14,904 44,639
1.927 2.677 2,966
233 3.728
2,867 857
1,667
388
33,6D8 .,i!2
59,544 3,113
73 1,493
39,094 692
2,921 12.092
24.215 126
1.418 2,380 9,839 4,392
59,33!! 40.660 11 ,625
1,052 116,107 24.026 IB,185 23.918 14,692 35,885
4.421 1.929 2,881
316 5.302
3.622 809
1t134
60C;
68,966 891
69,..H5 2,828 1.653 1.451
51.118 516
4.031 1,872
26.287 2,041)
115 439 341 550 59B
6,941 3.693 1.801 1.441 8,259 1.990
586 472
1,879 3,332
351 3,050 1,356
265 881
3,136
33,305 2.746 10818 3,710 9.376
152 841
8.663 491
5,502
72,350 4,331
330 1.191
~0,233 '711
3.656 1,A86
39,264 5.515
60 1,326
666 2.384 1,080
13,012 9,284 3,419
309 9.965 1.571 1.A62
A87 1.934 3,111
835 1.537 1.394
461 1,406 5,(l1B
37.656 3,('29 1,805 5,6093,607
316 1,249
14,208 749
6.484
1/ PRELIMINARY

Table 24. __0.5. agricultural expo,ts and Imports: Value by country, July-December 1972 and 1973
Exports Imports Exports Imports
Country Country 1972 1973 1972 1973191Z 1973 1972 1973
-- 1 000 dollars -- -- 1,000.!l.!!.!!..!!:! World 1/ ............................. : 5,165,900 9, 927.587~3, 926 4,312,962! Europe--Cont inued
Sweden .•• "" .......................... . 34,132 45,699 8,572 9,196 Hajor Trade Blocs: Norway .............................. : 26,654 51,903 5,413 7,511
CAC!I ............................... . 27,648 51, SIS 205,650 238,197:: Finland ............................. : 8,523 12,734 6,730 9,536 !.AFTA .............................. : 348,571 865,208 844,663 996,486: : Denmark ............................. : 49,120 73,842 92,491 131,904 EC ................................. : 1,167,621 1,996,375 267,305 412,967:: United Kingdom ...................... : 259,055 345,747 30,497 42,081 EASTERN EUROPE ..................... : 173,790 301,586 55,639 82,078:: Ireland ............................. : 24,518 20,778 14,580 39,707
: : Netherlands ......................... : 417,376 689,732 73,095 134,484 Greenland ............................ . o o o 0:: Belgium-Luxembourg .................. : 80,127 112,839 9,781 22,413 Canada 11 ............................ : 471,741 577,676 182,022 272,200:: France .............................. : 134,967 190,110 84,303 127,688 Hique1011 and St. Pierre Islands •••••• : 26 59 o 0:: West Cermany ........................ : 381,438 672,306 48,505 64,460 Hexico ............................... : 110,951 220,480 225,073 261,168: : Ea. t Germany ........................ : 5,894 19,496 24 76
:: Austria ............................. : 7,746 10,255 5,941 9,204 Central America ...................... : 43,849 69,813 221,621 253,175: : Czecho.lovakin ...................... : 26,022 31,862 375 640
Guatemala ••••.•...••••••.•.•.•..•.. ! 8,165 11,519 53,186 60,863: : Hungary ............................. : 4,361 4,132 2,566 4,826 Belize .... ~ •...•............•...•.. : 1,274 1,532 2,758 3,204: : Switzerland ......................... : 51,757 76,282 17 ,019 16,796 £::1 Salvador ........................ : 4,082 13,421 21,465 33,336: : o o o oEstonia ............................. : Hondura............................ : 4,780 5,552 38,098 51,973:: Latvia .............................. : o o o 29 tilcar~agua ••••..•.••••••••••••••.••• : 4,181 9,558 32,956 39,300:: Lithuania ........................... : o o o o Cos to Rica •......•...•..•....•.•... : 6,440 11,465 59,945 52,725: : Poland .............................. : 47,831 145,176 36,055 46,427 Panama ............................... : 14,927 16,766 13,213 11,709: : USSR ................................ : 315,539 331,299 2,376 2,429 Canal Zone ......................... : o o o 65 :: Azores .......................... ~." .. : 24 649 39 39
Spain ............................... : 172,539 247,321 60,519 79,199 Caribbean ............................ :. 91,027 147,472 107,407 122,901: : Portugal ............................ : 27,392 57,060 22,687 23,824
Bermuda 5,120 6,;;88 6 10: : Cibraltar ........................... : 17 64 3 20 I Bahamas ....................... "••••••• 13,905 19,742 199 68 :: Halta-Goto .......................... : 582 2,055 4 1 '" Cuba ............................... : o 2 1 0: ! Italy ............................... : 153,714 331,388 51,621 63,921I '" Jamaica ................. •••••••• 20,093 35,430 7,571 1,973 Yugoslavia .......................... : 63,679 7l,460 12,759 22,895;1 " ••• :
Haiti .............................. : 5,200 9,110 7,592 7,621 Albania ............................. : 57 :nO 194 121 Dominican Republic ................. : 19,488 37,436 89,146 110,302 Greece" .... "." ••••••••• ". '" •• " •••••••••• 11,233 97,474 17,519 15,708 Leeward-Wlndward Is lands ••••••••••• : 3,286 5,080 387 535 Romania" •• "••••••• "." •• "••••••••••• ": 24,851 28,184 2,815 5,461 Barbados ........................... : 2,505 3,600 158 714 Bulgaria ............................ . 1,096 1,066 851 1,633 Trinidad-Tobago .................... : 10,967 16,789 2,303 1,477: : Turkey .............................. : 7,453 34,899 34,476 40,994 ""chedands Antilles ............... : 9,114 12,003 41 32: : Cyprus .............................. : 4,506 8,790 398 351 French West lnd les ................. : 1,349 1,692 3 109: :
::Asla ................................. .. 1,714,135 3,627,948 500,809 707,838 South America •••••••••••••••••••••••• : 244,511 655,666 627,827 740,303 : : Syrian Arab Republic ................ : 816 1,278 1,173 1,623
Colombia ........................... : 24,753 81,097 l1)2.166 150,238:: Lebanon ••••••••••• , ................. : 13,482 18,239 3,877 3,841 Venezuela ............................. ! 72 ,815 84,498 10,539 11,860:: Iraq ................................ : 434 30,204 3,120 1,759 Guvana •••• "................ ~ •••••••• ! 3,974 5,946 8,039 4,745:: Iran ................................ : 34,973 64,179 18,336 18,543 Su~ln8m •••••••••••• 2,836 4,891 187 65:: Israel .............................. : 63,337 112,003 3,354 3,624
0 •••••••••••••••
French Gu iana ...................... . 81 10) 11 175:: Jordan .............................. : 6,243 8,934 o o E.::uador ......................... o. •••• 11,891 19,314 ,.3,702 49,997:: Caza Strip .......................... : 22 o o o Peru .•••••....••.•.........•..•..•. : 39,576 68,768 49,234 61,274:: Kuwait .............................. : 1,957 4,138 o o Bolivia ............................ : 3,019 4,585 1,456 2,903 :: Saudi Arabia ........................ : 16,274 46,020 27 151 ChHe .............................. : 16,004 95,148 1,359 1,807:: Qatar ............................... : 76 216 o o 8razil ............................. : 53,006 196,565 347,209 367,339:: United Arab Emirates ................ : 462 2,542 50 54 raraguay . + ..... f ................. ,,, •• ; 682 331 7,348 10,590:: Yemen Arab Republic ................. : 856 4,685 31 199 Proguay ...... , ..................... " .! 13 ,070 1,113 586 825 : : Yemen (Aden) •••••••••••••••••••••••• : 128 1,760 41 60 l\rgentina "..................... II •••••• ! 2,804 93,309 55,991 78,485:: Oman ................................ : 12 1,320 o o Falkland Islands ................... : o o o 0:: Bahrain ............................. : 650 1,264 o o
: : Afghanistan ......................... : 2,140 195 975 655 Europe ................................. ; 2,343,201 3,716,877 642,403 923,908:: India ............................... : 41,504 216,994 48,820 53,444
Iceland ............................ : 998 2,065 195 334:: Pakistan ............................ : 49,204 69,255 1,566 1,939
Continued-

',~ ,~.J.. 'J" "i'?'''' ',:"';',: ~;;;\F_rW:--:O' -1~~";'~"'!':~"l~":- , -:'<j" ;::..,;..-c-- ""~;:"'~'~~~:"-::''''i:..;,-:;,-:-'R''~-'-.~-:- "";,)~'
Table 24.--u.s. agricultural exports and imports: Value by country, Ju1v-December 1972 sndJcl9117..13C::-C::-!iC!!.on!ll.ti!ln!!!u.!.!e~dL_______________----------------
Exports ImportsExports Imports
CountryCountry 1972 1973 1972 1973
1972 1973 1972 1973
1.000 ~---- 1,000 ~
: :Africa--ContinuedAaie.. -Cont1nued 12,150 10,879160: : Federal Republic of Cameroon ••••••••. 1,370 1,391
1,150 378 65Nepal ••....•..•....••...•... ·•····• : 2,074 11,747 9 201,619: : Senegal ............................. : Bang1ad"sh ......................... : 67,334 49,236 1,269
2,903 35 a12,947:: Mali ................................ : 5895,955 10,527sri L.nk~ (Ceylon) ................. : 7,711 301 5696:: Guinea ....................... • ...... : 311 2,541357 13 35Burma .............................. : 19,301: : Sierra Leone ........................ : 1,922 4,712 1,777 785
31,257 31,100 9,060Thailand .................. •••••·••• : 976 1,289 38,308 42,347G 0:: Ivory Coast .................. •• .. ···:
North Villltiam ...................... : 0 a 12,079 16,736 17,047362: : Ghana ............................... : 5,64:1 South Vietnam •••••••••••••••••••••• : 70,586 54,026 325
139 1,115 a a35: : The Gambia •••••••••••••••••••••••••• :ta08 ,., ...• ~ ........•... ~ ........... : 1,104 2,270 28
166 4,285 17 a a 20:: Niger ••••••.•••.•••••••••••••••• ····:C&ilIbo.dia (Khiler Republic) •••••••••• : 8,604 47,447 643 896 a 22
98,442~: Togo .......................... • .... ·:t-talaysla .• ~ ....•.....•...... ~ ...... : 5,544 14,958 52,252 18,69917,600:: Nigeria ••••••.•••••••••••••••••••••• : 11,663 23,824 7,198 Singtoporo .......................... : 12,856 37,363 9,710 11 a 0128,336:: Central African Republic •••••••••••• : 5 Indonesia .......................... : 66,614 96,112 78,278 a 855123 161
68,349 179,587 263,936:: Gabon ................. ·.············:Philippines ........................ : 52.080 20 502 a 20:: Chad ................................ :£, 14 aHaCilo ••••••••••••• 4 ................. : 31 a 4 0a514:: British West Africa ................. :IS 45 710Southern-Southeastern Asia, n.e~c•• : a 95 81a10,025:: Madeira Islands •••••••••.•••••.••••• : ~ Peoples Republic of Chilla •••••••••• : 61,284 435,039 8,160 328 3,072 a a314:: Upper Volta ...................... ···:a 543Otlter Mongolia ..................... : a a : : Dahomey ............................. : 1,158 2,241 923 769 North Korea ........................ : a 0 a 2,189 38,543 52,4845,193:: Angola .............................. : 2,235Korea. Republic of ................. : 164,288 313,620 4,043
208 412. 106 384,117:: Congo (Brazzaville) ••••••.•. , ••••••• :Hong Kong .......................... ! 39,649 95,528 3,237 Q29,230:: Western Portuguese Africa, n.e~c . ..• : 224 690 ITl Republic of China .................. : 83,025 246,517 31,202 12,787 2.4,67129,789:: Liberia ............................. : 3,769 7,587 Japan .............................. : 808,072 1,546,752 30,408 11,002 9,619: : Zaire (Congo-Kinshasa) ••••••.•••.••• : 2,016 4,877
310 9,172 9,593676,110:: Burundi ...................... • .. ····: 77 c:-I Australia and Oceania ................ ·: 2Y,796 54,658 464,274 212 8,373 9,593189446,184:: Rwanda ........................ ·.····:20,527 38 503 312,649i\ustrdie •••••••••••••.•••••••••••• : a 0'" I 15,564:: Somali Republic ..................... : 318 0
Papua New Guinea ................... : 121 146 7,486 2,576 28,377 36,193206,103 : : Ethiopia •••••••••••••••••••.•••••••• : 4964,909 9,496 137,641
108:: Afars-Issas .................. ·······: New Zealand ........................ : 8 18265 345 WeD tern SaDlOS ....................... : 39 219 24 29,328
11 o : : Uganda •••••••••••••••••••••••••••••• : 64 35 31,973 BrHloh Pacific Islands •••••••••••• : 2 61 6,454 7,888 12,19411 :: Kenya ............................... : 682 French Paciric Islands ....••..•••.. : 1,763 2,581 9 332 3931:: Seychelles-Dependencies ••.•••••••••• : 31 30 Trust Territory of Pacific Islands .: 2,234 3,323 6
799 837 10,803 12,1648,139:: Tanzania ............................ :Pacific blanda, n.c.c............. : 201 329 6,448 480 2,818 2,943:: Mauritius-Dependencies ••••••••.••••• : 1,377
9,935 14,787355,356 :: Mozambique .......................... : 124 208 Africa ............................... : 116,668 347,617 282,494
430 6,410 13,840 14,5711,855:: Malagasy Repub lic .............. .. :Morocco ••• 4 •••• ~ •••• ••••••••••••••• : 10,011 52,398 1,927
68 : : French Indian Ocean Areas .•••••• .: 2 1,841 670 989 Algeria ............................ : 8,357 44,272 218 7,063 12,244939:: Republic of South Africa ............ : 18,71() 34,103 Tunisia .......... "' ................ : 7,007 16,732 2,020 2o : : Botavana ••••••••.• •••..•.•.••••••• ~ . : a 9!J6 3 Libya .............................. : 1,405 2,117 a 226 11 1699 :: Zambia •••••••••••••• , ••••••••••••••• : 175 Egypt .............................. : 22,765 62,394 727
88 112 3,008 5,8611,630:: Swaziland ......................... ··:Sudan .............................. : 1,465 18,495 1,089 01:: Rhodesia ........................... :: 1 1 a Canary Ialand. .. ................... : 5,530 6,673 0 o : : Malawi .............................. : 135 24 1,329 5,971 Spanish Africa, n.e.c •••••••••••••• : 2 7 a 0 0
0 470 4,319:: Lesotho ............................ . 474 879 Equatorial Guinea .................. : 0 0113:: Unidentif' "d ...................... . 509,321
16 272Mauritania ..................... • ... : 108
1/ Totals may not add due to rounding.11 Excludes transshipment. of grains snd oUseeds beginning Jan. I, 1973. 'J.l Transshipments through Canada were final destinations was not known at the time of export.
~",:..",;,0.t',~""-""

Table 25.--Quantity indexes: U.S. agricultural exports. fiscal year 1968-73, monthly and accumulated, July 1972 to date
(Calendar year 1967 = 100)
AllAnimals Cotton Tobacco, Grains Vegetable Fruits
and agricultural animal commoditiesYear and month and unmanu- and oils and and
linters factured feeds oilseeds Vegetablesproducts 11
1967/68 ••• , •••••••••••• : 96 101 100 104 99 91 101 1968/69 ................ . 110 69 100 85 106 93 92 1969/70 ................ . 101 75 101 97 148 109 106 1970/71 •••••••• , ••••••• : 117 98 98 106 157 103 115 1971/72 •••••••••••••••• : 134 89 94 103 159 107 115 1972/73 •••••••••••••••• : 126 126 102 167 182 118 152 July-December:
70 110 149 169 117 1371972/73 •••••••••••••• 125 1973/74 •••••••••••••• 131 117 125 195 148 139 165
Adjusted for ~na1 Y!!!!!.tl!!!! J/
Monthly 1972/73:
July ••••••••••••••••• : 159 44 100 127 149 120 126 August ••••••••••••••• : 122 47 111 148 155 109 137 September •••••••••••• : 118 36 97 153 107 108 133 October •••••••••••••• : 124 95 99 145 177 106 132 November ........................ : 131 134 89 151 198 129 144 December ........................ .. ~ 112 146 94 157 170 114 145 January ............................ : 118 162 115 174 194 113 159 February ••••••••••••• : 118 125 121 167 237 112 160 March •••••••••••••••• : 127 141 104 191 247 117 176 April ............... -.: 131 148 100 194 201 122 174 May .................. : 129 128 96 185 191 134 166 June .................... : 124 171 112 215 126 129 170
1973/74: July ••••••••••••••••• : 119 152 106 189 92 138 155 August ............................. : 124 230 100 232 73 124 180
111 204 65 138 163September ........................ : 136 108 October •••••••••••••• : 167 112 120 182 144 130 169
Novem.hr:r .......................... : 125 98 88 184 193 149 158
December .......................... :- 118 156 78 168 181 137 155 January .............. : February ••••.•••••••• : March •••••••••••••••• : April ................ : May .................. : June .......... , ............. .
Not adjusted for ~ variation
1972/73: July •••••••• , •••••••• : 136 33 80 128 125 120 117 August ••••••••••••••• : 112 19 92 142 116 105 118 September •••••••••••• ' 114 26 107 141 82 109 118 October •••••••••••••• : 124 59 120 142 215 126 133 November ••••••••••••• : 146 111 135 161 265 132 170 December ......................... : 120 173 128 172 211 112 166 January ............................ : 117 211 89 179 197 99 164 Feb~uary ••••••••••••• : 112 168 94 166 229 94 159 Mar.ch •••••••••••••••• : 140 219 100 186 255 116 182 April •••••••••••••••• : 128 194 86 177 185 121 163 May •••••••••••••••••• • 132 141 94 192 180 134 167
169
1973/74: July ••••••••••••••••• : 103 120 88 190 80 131 143 August ••••••••••••••• : 114 143 85 223 58 120 158 September ............ ;- 131 84 121 196 52 138 147 October .......................... : 167 80 153 179 182 160 169 November ••••••••••••• :
0June ......... ............ ! 128 158 96 211 125 145
142 84 179 195 280 152 192
December ............ ; ............ ~ 128 193 122 186 237 135 181 January .................... ~ February .................... ~ .. ; March'" ......................... ~ .. : AprH •••••••••••••••• : May .................. : June .............. 404o ...... ;
1/ Based on 359 classifications in 1971. 2/ The seasonal adjustment series has been revised to incorporate the Bureau of the Census Method X-11. This new ...thod of
adjuBting for seasonal variations is a continuing system which takes into account changing seasonal patterns. For detailed explanation of the new adjustment procedures, see U.S. Department of COIJIller<:e, Bureau of the Census, The X-11 ~ 2i the Seasonal Meth;)d II ~ Adjustment Program, Technical Paper No. 15, U.S. Government Printing Office, Washington, D.C., 1965.
-67

_ ;~__""'"''''''_i_'''"''' ·_....,<--I----...,~'#_"" •.,- .....O~,~_-.•__"<.'''.,,..''''.....''4_' .•" ......... _
Table 26. --Quantity indexes: U.S. agr1cultural imports, fiscal years 1968-73, monthly and accumulated, July 1972 to date
(Calendar :z:ear 1967 = 100) SUEE1ementar:z: l[ ComE1ementar:z: 1[ : All agri-
Animals Vegetable Sugar, Rubber :Grains Cocoa, cultural Year anti month and oils molasses J andand Total coffee, I Total commodi ties
animal feeds and tea .Yand and allied E:roducts Oilseeds s}:ruE:s gums
1967/68 ............. : 108 92 97 102 105 104 107 104 105
1968/69 ............. : 115 96 105 103 110 100 127 103 107
1969/70 .............. 121 131 104 107 116 101 131 104 111
1970/71 ~ ...... ~ ..... : 114 136 III 113 118 98 124 101 111
1971/72 .............. 115 145 119 118 122 105 138 108 116
1972/73 ............. : 127 122 129 109 128 111 136 112 121 July-December:
1972/73 ............ 134 141 117 105 124 100 131 103 115
1973/74 ............ 133 94 117 112 126 92 142 97 llt.
Adjusted for ~ variation 1/
Monthly 1972/73:
July •••••••••••••• : 119 130 151 99 119 88 123 92 108 August ............. 133 95 135 118 133 100 122 110 120
September ••••••••• : 135 160 122 99 126 112 109 113 121
October •....••.•.. : 141 174 131 112 130 103 145 107 120 November •••••••.•• : 145 131 87 119 136 97 150 102 121
December ........... 118 126 159 83 112 97 138 103 109
January •.•......•. : 130 132 84 125 135 104 141 107 123
February •••••••••• : 124 112 165 117 138 115 134 117 132
March .............. 106 ~ 117 143 13394 l2 121 130 125
April .............. 114 115 125 103 123 130 127 122 121
May ................ 135 87 150 145 144 148 152 140 143
June ............... 119 106 129 86 99 157 101123 114
1973/74: 94 113July ............... 122 73 114 105 126 93 125
August ............. 136 67 142 111 133 87 154 102 117
September ••••••••. : III 76 105 93 109 78 175 92 W: 81 72 122 79 152 89 108October ............ 144 126
November ...... ~ •.. : 146 118 183 180 162 101 149 105 138 December .......... : 127 55 164 97 118 113 95 104 114
January •.......... : February .......... : March .............. April ............... May ••••••••••••••• • June ...............
~!ot adl!:t.:.t ed for seasonal variation
1972/73: July .............. : 119 135 151 10i' 115 85 102 89 104
August ............. 139 69 108 144 135 105 135 108 124
September .•....•.. : 134 132 112 104 123 113 105 110 117
October ............ 142 169 146 96 126 113 150 116 122 121 91 148 98 112November .......... : 145 148 67 83 123 90 148 99 113December .........• : 125 192 121 97
January ............ 134 96 138 108 135 125 154 126 132
February .......... : 116 79 183 78 124 115 130 117 121
Harch .............. 109 85 144 123 127 126 156 126 126
April ............. : 114 137 98 122 135 121 115 116 127
May ............... : 127 121 142 130 142 143 147 137 140
June ............... 117 108 140 115 131 99 140 101 119
1973/74: July •••••••.•••••• : 121 76 114 113 122 90 107 90 109
93 101August ............. 142 52 117 143 135 172 121
September ......... : 109 65 97 99 107 78 167 89 99
October ............ 145 121 6292 118 89 158 98 110
November .......... : 146 134 148 139 146 95 148 101 127
December .......... : 135 115 132 117 131 106 102 100 118 January ..•........ : February .......... : March ............. : April .............. May ............... : June ............... 1/ Supplementary agricultural imports consist of all imports similar to agricultural commodities produced commercially in the
United States together with all other agricultural imports interchangeable to any significant extent with such United States conunodities. Complementary agricultural imports include all others, about 98 percent of which consist of rubber, coffee, raw silk, cacao beans, wool for carpets, bananas J tea, and vegetable fibers.
2/ Based on 430 classifications in 1971."i./ The seasonal adjustment series has been revised to incorporate the Bureau of the Census Meth(Jd X-Ii. TIle new method of adjusting for seasonal variations is a continuing system which takes into account changing seasonal patterns. For detailed explanation of the new adjus~ment procedures, see U.S. Department of Commerce, Bureau of the Census, The X-1l Varient of the Seasonal Method II Seasonal Adjustment Program. Technical Paper No 15. U.S. Government Printing Office, Washington, D.C., 1965.
-68

';.;:,?" u
Explanatory Note
U.S. foreign agricultural trade statistics in this .report incluJe official U.S. data based on 'compilations of the Bureau of the Census. Agricultural commodities consist of (1) nonmarine food products and (2) other products of agriculture which have not passed through complex processes of manufacture such as raw hides c.~ld skins, fats and oils~ and wine. Such manufactured products as textiles, lea~her, boots and ~hoes, cigarettes, naval stores, forestry products, and distilled alcoholic beverages are not considered agricultural.
The trade sta': i..;U,-.s exclude shipments between the 50 States and Puerto Rico, between the 50 States aU;.l ,",a island possessions, between Puerto Rico and the island possessions, among the island possessions, and intransit through the United States from one foreign country to another when documented as such through U.S. Customs.
EXPORTS The export statistics also exclude shipments to the U.S. armed forces and diplomatic missions abroad for their own use and supplies for vessels and
planes engaged in foreign trade. Data on shipments valued at less than $251 are not compiled by commodity and ,ire excluded from agricultural statistics but are reflected in nonagricultural and overall export totals in this report. The agricultural export statistics include shipments under P.L. 83-480 (Agricultu~al Trade Development and Assistance Act), and related laws; under P.L. 87-195 (Act for International Development); and involving Government payments to exporters. (USDA payments are excluded from the export value.) Separate statistics on Government program exports are compiled by USDA from data obtained from operating agencies.
The export value, the value at the port of exportation, is based on the selling price (or cost if not sold) and includes inland freight, insurance, and other charges to the port. The country of destination is the cOtmtry of ultimate destination or where the commodities are to be consumed, further processed, or manufactured. When the shipper does not know the ultimate destination, the shipments are credited to the last country, as known to him at the time of shipment from the United States, to which the commodities are to be shipped in their present form. Except for Canada, export shipments valued at $251-$499 are included on the basis of sampling estimates; shipments to Canada valued at $251-$1,999 are sampled.
IMPORTS Imports for consumption are a combination of entries for immediate consumption and withdrawals from warehouses for consumption. Data on shipments
valued at less than $251 are estimated on the basis of a I-percent sample and are not compiled by commodity. Th~y are excluded from agricultural statistics but are reflected in nonagricultural and overall import totals in this report.
The import value, defined generally as the market value in the foreign country, excludes import duties, ocean f~eight, and marine insurance. The country of origin is defined as the country where the commodities were grown or processed. When the coutltry of origin is not known, the imports are credited to the country of shipment.
Imports similar to agricultural commodities produced commercially in the United States and others that are interchangeable in use to any significant extent with such U.S. commodities are supplementary or partly competitive. All other commodities are comr plementary or noncompetitive.
Further explanatory material on fore.ign trade statistics artll f!ompilation procedures of the Bureau of the Census is contained in the publications of that agency.
-69