Embed Size (px)
Citation preview

ATINER CONFERENCE PAPER SERIES No: ARC2013-0563
1
Athens Institute for Education and Research
ATINER
ATINER's Conference Paper Series
ARC2013-0563
Emilio Antoniol
PhD Student in Architecture Technology
IUAV University of Venice
Italy
Development of a Shading Devices
Efficiency Verification Method
using Software Simulations
ATINER CONFERENCE PAPER SERIES No: ARC2013-0563
2
Athens Institute for Education and Research
8 Valaoritou Street, Kolonaki, 10671 Athens, Greece
Tel: + 30 210 3634210 Fax: + 30 210 3634209
Email: [email protected] URL: www.atiner.gr
URL Conference Papers Series: www.atiner.gr/papers.htm
Printed in Athens, Greece by the Athens Institute for Education and Research.
All rights reserved. Reproduction is allowed for non-commercial purposes if the
source is fully acknowledged.
ISSN 2241-2891
25/09/2013
ATINER CONFERENCE PAPER SERIES No: ARC2013-0563
3
An Introduction to
ATINER's Conference Paper Series
ATINER started to publish this conference papers series in 2012. It includes only the
papers submitted for publication after they were presented at one of the conferences
organized by our Institute every year. The papers published in the series have not been
refereed and are published as they were submitted by the author. The series serves two
purposes. First, we want to disseminate the information as fast as possible. Second, by
doing so, the authors can receive comments useful to revise their papers before they
are considered for publication in one of ATINER's books, following our standard
procedures of a blind review.
Dr. Gregory T. Papanikos
President
Athens Institute for Education and Research
ATINER CONFERENCE PAPER SERIES No: ARC2013-0563
4
This paper should be cited as follows:
Antoniol, E. (2013) "Development of a Shading Devices Efficiency Verification
Method using Software Simulations" Athens: ATINER'S Conference Paper
Series, No: ARC2013-0563.
ATINER CONFERENCE PAPER SERIES No: ARC2013-0563
5
Development of a Shading Devices Efficiency Verification
Method using Software Simulations
Emilio Antoniol
PhD Student in Architecture Technology
IUAV University of Venice
Italy
Abstract
This study aims to determine a verification procedure of solar shading
devices efficiency in buildings. Currently, there are large amounts of technical
shading solutions on the market. However, choosing a specific system does not
always guarantee a correct shading effect on the façade. The first part of this
work is focused on the development of a shading devices classification system.
The shading efficiency verification method is developed through the analysis
of two reference buildings: the Ahmedabad Mill Owners' Building, by Le
Corbusier, and Bologna's town hall building by MC Architects. Tridimensional
models of the buildings are made using the software Ecotect in order to analyze
shading effects during the summer solstice and other significant days. The
study also evaluates solar diagrams related to glass surfaces protected by
shading devices. These diagrams allow to verify the sun-light exposure time
frames that represent possible local overheating effects. A monthly average sun
exposure tool is also used in the tests in order to assess the value of incident
solar radiation on the examined surface. The simulation is performed either
with and without the shading systems in order to analyze the reduction of direct
radiation on the windows. The verification method allows to define the shading
system effectiveness and to identify the time frame in which overheating
problems could exist. Furthermore, this method can also be used as a practical
tool during the design phase, helping the designer to choose the right shape and
orientation of shading devices.
Key words: solar shading systems, shading efficiency, software simulation
Corresponding Author:
ATINER CONFERENCE PAPER SERIES No: ARC2013-0563
6
Introduction
The correct design of a solar shading device is a complex problem that
involves several thermal and visual comfort aspects of a building. As reported
by Lechner (2001) 'shading is a key strategy of achieving thermal comfort in
the summer' but, at the same time, it plays also an important role on controlling
light and passive solar gain during winter seasons. For this reason, the type and
shape of a sun shading device must be linked to the local climate conditions. In
warm or hot climates sun heating and glare have to be avoided through the use
of shading devices that allow the natural ventilation inside the building.
However, in coldest climates free sun energy gains are an important
contribution to the thermal balance of buildings and should be encouraged. The
global efficiency of a shading system depends on many factors like orientation,
position and climate conditions. The big number of different available
solutions creates the problem of choosing the correct shading device to
optimize the shading effect, without losing the free gains when they are useful
(Fathy, 1986). This study tries to define a verification method of solar shading
devices effectiveness. The ultimate goal is to determine how a particular
shading system works and how it can be improved.
Description of Methods
In order to determine a verification method for the sun shading
effectiveness, the first step is to define a classification of shading devices.
European and Italian1 standards propose a terminological classification of
shutters, sun screens and blinds. They are divided into many categories based
on several variables. Many studies try to classify shading devices using the
standards as model (Lechner, 2001; Ceccherini Nelli, D'Audino & Trombadore
2010; Arbizzani, 2010). However, such a terminological classification does not
define an efficiency classification; furthermore the use of too many variables
does not help in the choice of a specific device. For that reason, in this study
four main variables are obtained from the standards and a typological
classification of shading devices is defined (Tatano & Rossetti, 2012). The first
variable is the morphology, which is divided into horizontal elements, vertical
elements, panels or grids. The next two variables are linked to the position of
shading devices in relation to the façade (internal, external or included) and in
relation to the vertical plane (vertical, perpendicular, horizontal or
oblique/slope). The shading devices can be classified into seven categories
obtained from the combination of these different positions. The movement
system is the last considered variable. Sun shading device can be fixed,
rotating, sliding or could be characterized by complex movement obtained by
sliding and rotation. Some other secondary variables, that can be considered in
1EN 12216:2002 'Shutters, external blinds, internal blinds - Terminology, glossary and
definitions' and UNI 8369-4:1988 'Classificazione e terminologia degli schermi’
ATINER CONFERENCE PAPER SERIES No: ARC2013-0563
7
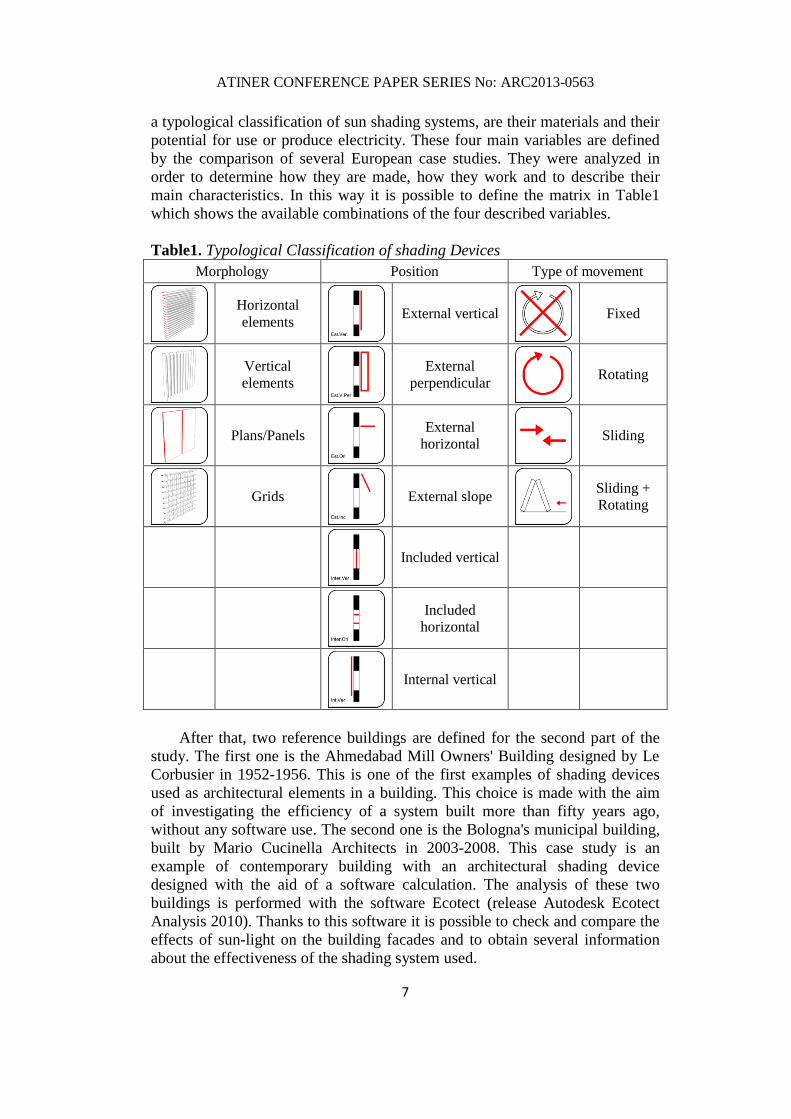
a typological classification of sun shading systems, are their materials and their
potential for use or produce electricity. These four main variables are defined
by the comparison of several European case studies. They were analyzed in
order to determine how they are made, how they work and to describe their
main characteristics. In this way it is possible to define the matrix in Table1
which shows the available combinations of the four described variables.
Table1. Typological Classification of shading Devices
Morphology Position Type of movement
Horizontal
elements
External vertical
Fixed
Vertical
elements
External
perpendicular
Rotating
Plans/Panels
External
horizontal
Sliding
Grids
External slope
Sliding +
Rotating
Included vertical
Included
horizontal
Internal vertical
After that, two reference buildings are defined for the second part of the
study. The first one is the Ahmedabad Mill Owners' Building designed by Le
Corbusier in 1952-1956. This is one of the first examples of shading devices
used as architectural elements in a building. This choice is made with the aim
of investigating the efficiency of a system built more than fifty years ago,
without any software use. The second one is the Bologna's municipal building,
built by Mario Cucinella Architects in 2003-2008. This case study is an
example of contemporary building with an architectural shading device
designed with the aid of a software calculation. The analysis of these two
buildings is performed with the software Ecotect (release Autodesk Ecotect
Analysis 2010). Thanks to this software it is possible to check and compare the
effects of sun-light on the building facades and to obtain several information
about the effectiveness of the shading system used.
ATINER CONFERENCE PAPER SERIES No: ARC2013-0563
8
Verification Procedure
The verification procedure is split into four steps. The first one consists in
modeling the reference building in a simplified way. Only the most important
building elements are performed in the model while elements not related to the
sun-light, for example internal structures or furniture, are excluded. In this
phase, it is very important to model shading devices in a correct way to obtain
accurate results. All shading components must be inserted in the model
according to the real dimension, position and characteristics. In the second step
the model has to be oriented in the right geographic position and the weather
climate data file1 of that place must be uploaded using the weather and solar
tools. In this way the software is able to show the sun position and to generate
the shadows effects in different moments of the day and year. The third step
consists in analyzing the shading distribution on the façade. During the day, the
sun position changes determine different screen effects on the façade. This
preliminary analysis of shadows gives the possibility to define which parts of
the glazed surfaces are directly exposed to solar radiation. By selecting them
into the model, it is possible to define the sun-path diagrams that show the
shading effect on the surface during the year time. The sun-path diagram is a
spherical, stereographic or orthographic graph which illustrates the complete
path of the sun during the year (Mazria, 1979; Tatano & Rossetti, 2012).
Ecotect tool is able to overlay the sun-path diagram with shadows diagram,
using a gray scale pattern to define different range of shading . In this way, it is
possible to define the sun-light exposure time frames in which the building
may present overheating problems. Such a phenomenon can be verified
comparing the sun-air temperature in that time frames with the set point
temperature of the period. If the sun-air temperature is higher than the internal
set point, overheating problems are possible. The last analysis phase consists in
the quantification of the shading benefits. Using the monthly average sun
exposure tool, it is possible to determine the value of incident solar radiation on
the examined surface. To evaluate the sun shading effectiveness the exposure
test must be performed twice: the first one using the model of the real building,
and the second one using the same model without shading devices2. In this way
it is possible to analyze the influence of sun shading devices and collect the
monthly values of incident energy on the glass surfaces. The result of this
simulation is not the exact value of incident energy on the glass because the
method does not consider dynamic effects like the reflected energy. However
the test gives the designer a reference number that can be compared with other
shading solutions to obtain a classification based on their performances.
1The Ecotect software use .wea files that are located in the software database. For a specific
place it is possible to create a .wea file using the official EnergyPlus weather files .epw at:
http://apps1.eere.energy.gov/buildings/energyplus/weatherdata_about.cfm. 2Ecotect works like a CAD software. In the modeling phase it is possible to set different object
into different layers. To make the analysis without sun shading devices is sufficient to exclude
their layers from the model.
ATINER CONFERENCE PAPER SERIES No: ARC2013-0563
9
Results and Discussion
In order to validate it, the verification procedure was applied to two case
studies. The results of this procedure give the possibility to define a method to
perform a shading system device analysis.
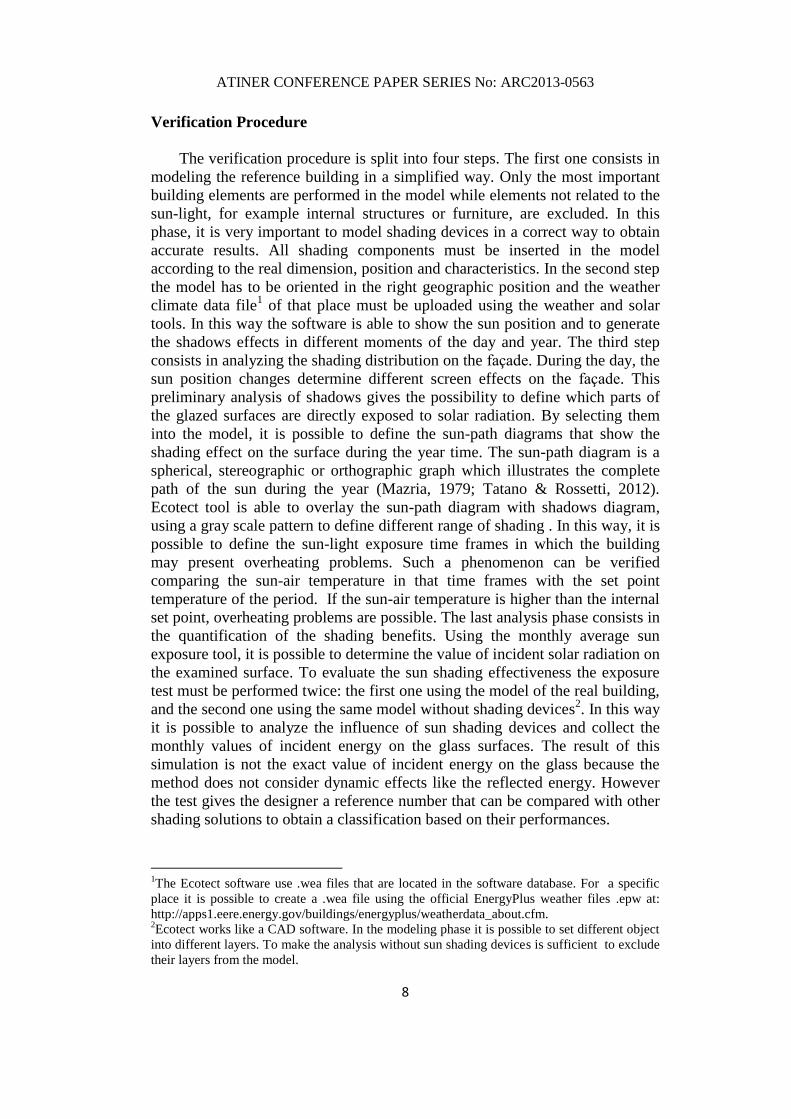
The first building analyzed was the Ahmedabad Mill Owners' Building by
Le Corbusier, Figure1. This building consists of a concrete squared building,
organized in three levels with offices, meeting rooms and a conference room at
the top; the two lower floors are enclosed with a glass façade while the last one
is an open space with a bar and the conference room. The second level, in
which the president offices and some meeting rooms are located, is directly
linked to the ground through a long access ramp. The building façades are
completely closed on the south and north fronts while they are completely
opened towards east and west, according to the dominant winds. On these
fronts Le Corbusier inserted a sun shading system in order to prevent indoor
overheating effects during the hot seasons. The shading system is made of
concrete too. It is composed of a fixed external grid made up of horizontal and
vertical concrete elements. On the west side the vertical elements are oriented
with a 45° angle in relation to the façade. The horizontal planes are made up of
some planters, corresponding to the floor levels, and some concrete slabs. The
sun shading device is 3.4m deep. A similar system is placed on the east side
but it is only 2.0m deep and the vertical planes are perpendicular to the façade.
They are spaced 5.3m each-other while on west side the distance between two
vertical elements is only 2.5m.
Figure 1. Mill Owners' Building. West and East Fronts

ATINER CONFERENCE PAPER SERIES No: ARC2013-0563
10
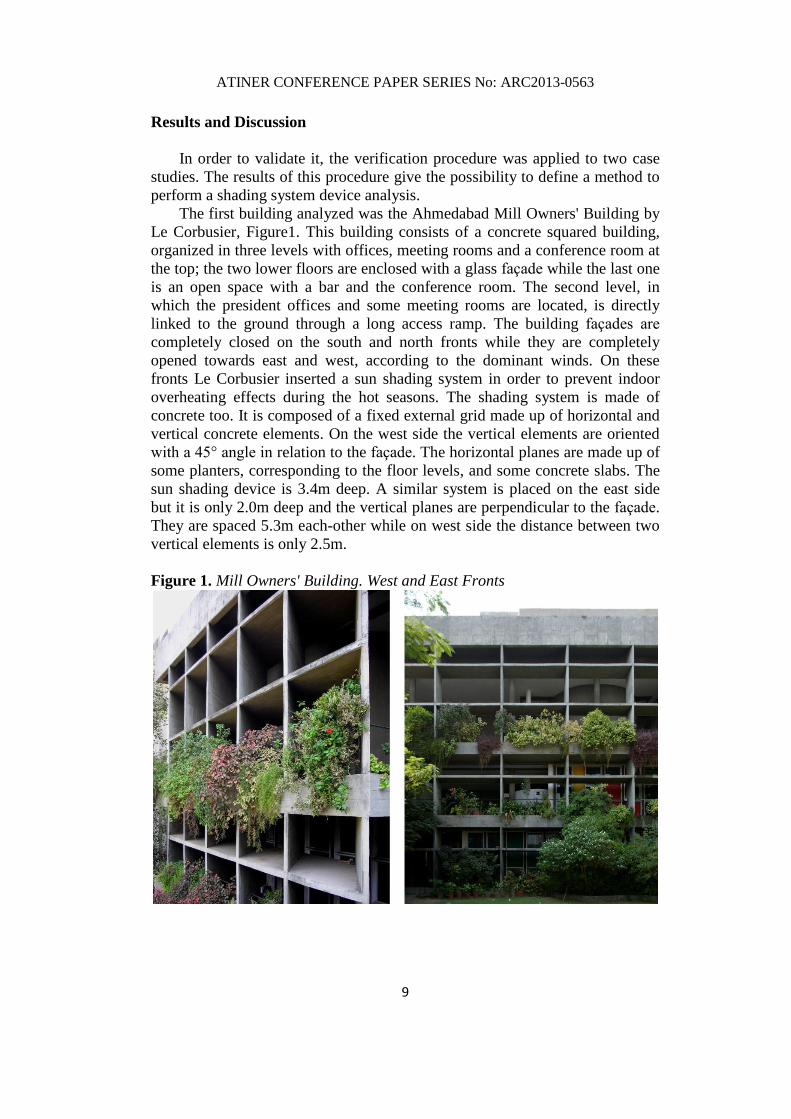
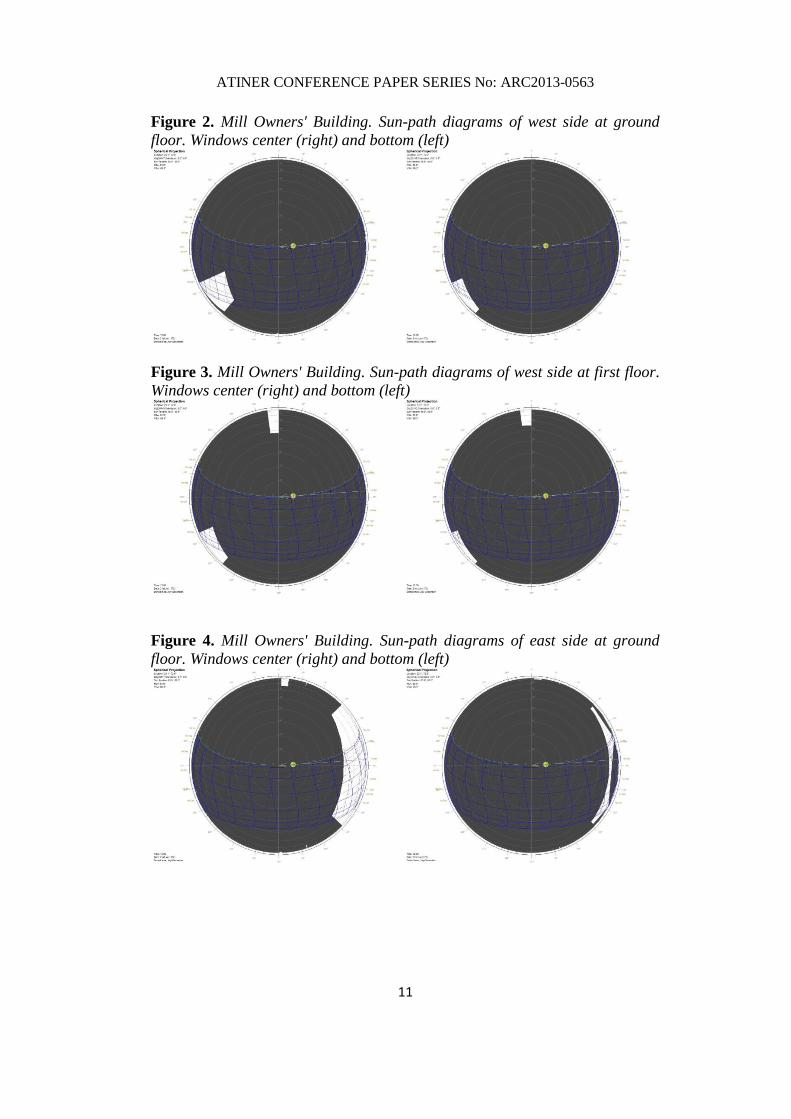
Two sun-path diagrams were produced for each side and for each level of
the building. To perform the analysis, a window for each level was selected to
be tested. Then, the test was performed in two specific points: at the bottom
and in the window centre. The differences between the two diagrams show if
the shading system gives a complete protection on all the façade. Figure2
shows the results for the west ground level (bottom and center point), and
Figure3 for the west first level (bottom and center point). The white areas on
the graphs indicate the time frame in which the sun can hit the glass. The white
areas are focused in the late afternoon hours (after 3.00pm) and only in the
coldest period of the year (November - January) so the sun shading system
prevent overheating effects. Figure4 shows the same graphs for the east side
ground level1. In this case the white area is bigger than in the west graphs and
the sun rays hit the glass during all the year from 6.00am to 10.00am. At the
center of the windows, shading efficiency is higher thanks to the horizontal
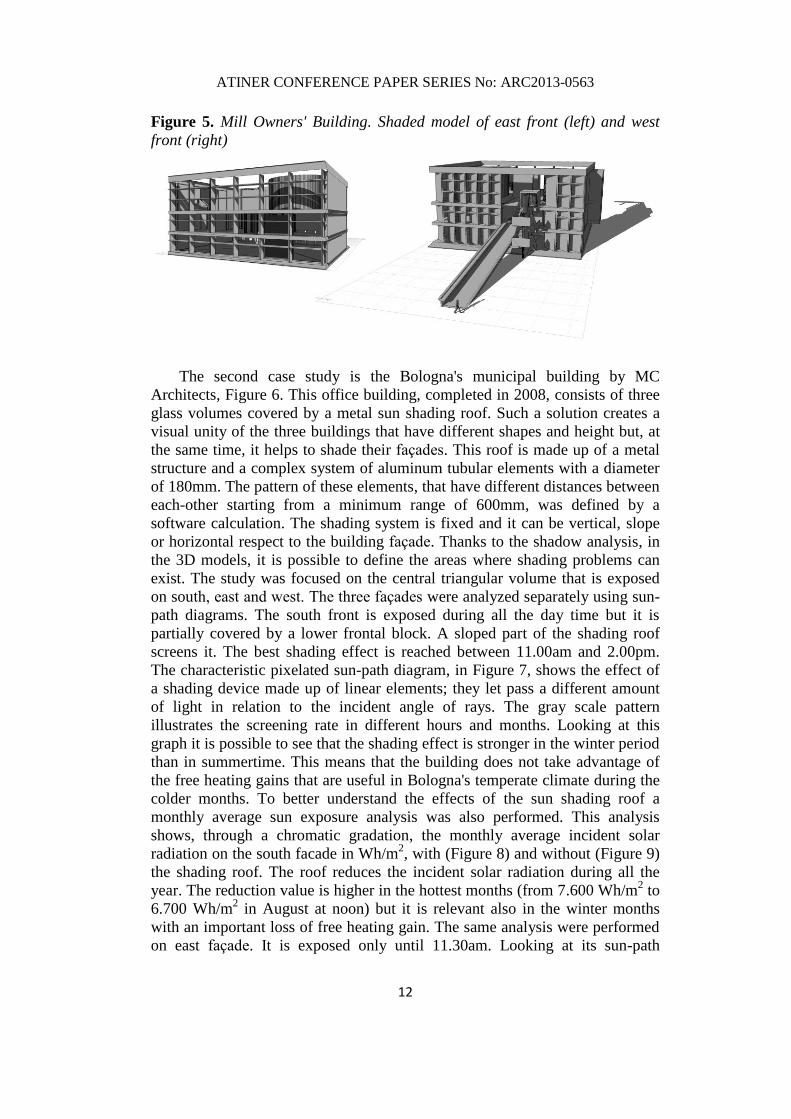
elements that form the grid. Models in Figure5 allow to compare the shadows
on the two sides when the sun is in front of them (9.00am for east side, 6.00pm
for west side). On the east front it is possible to identify a single shadow
component, the horizontal one. Otherwise, two different shadows components
are shown on the west side: the horizontal one, similarly to the east side, and a
vertical one, caused by the vertical oblique concrete elements. This means that
shading device on the west side is more efficient that the east one, thanks to the
position and orientation of vertical elements. A different test was preformed for
the top level. This is not a closed space so overheating is not possible,
primarily thanks to the right orientation of windows that allow natural
ventilation. Otherwise, such a problem could exist in a closed space, like the
conference room, if reached by the sun-light. For that reason, the shadows path
of top level was analyzed. The simulation was performed without the building
roof, in order to isolate only the shadows created by the concrete grid. During
the day the sun-light never reach the walls of the room, so there will be no
indoor overheating problems. Finally, it is possible to assert that this building
shading system is useful and correctly designed. It has only a local problem on
the east side, during the morning, anyway the overall efficiency is good. Le
Corbusier chose the right orientation of the windows to exploit natural
ventilation and the right shape and orientation for the shading devices to reduce
sun irradiation. At the same time, the concrete system is well integrated in the
building and it has also an important architectonic impact.
1The result for the east first level is similar to the ground level one shown in the Figure3.
ATINER CONFERENCE PAPER SERIES No: ARC2013-0563
11
Figure 2. Mill Owners' Building. Sun-path diagrams of west side at ground
floor. Windows center (right) and bottom (left)
Figure 3. Mill Owners' Building. Sun-path diagrams of west side at first floor.
Windows center (right) and bottom (left)
Figure 4. Mill Owners' Building. Sun-path diagrams of east side at ground
floor. Windows center (right) and bottom (left)
ATINER CONFERENCE PAPER SERIES No: ARC2013-0563
12
Figure 5. Mill Owners' Building. Shaded model of east front (left) and west
front (right)
The second case study is the Bologna's municipal building by MC
Architects, Figure 6. This office building, completed in 2008, consists of three
glass volumes covered by a metal sun shading roof. Such a solution creates a
visual unity of the three buildings that have different shapes and height but, at
the same time, it helps to shade their façades. This roof is made up of a metal
structure and a complex system of aluminum tubular elements with a diameter
of 180mm. The pattern of these elements, that have different distances between
each-other starting from a minimum range of 600mm, was defined by a
software calculation. The shading system is fixed and it can be vertical, slope
or horizontal respect to the building façade. Thanks to the shadow analysis, in
the 3D models, it is possible to define the areas where shading problems can
exist. The study was focused on the central triangular volume that is exposed
on south, east and west. The three façades were analyzed separately using sun-
path diagrams. The south front is exposed during all the day time but it is
partially covered by a lower frontal block. A sloped part of the shading roof
screens it. The best shading effect is reached between 11.00am and 2.00pm.
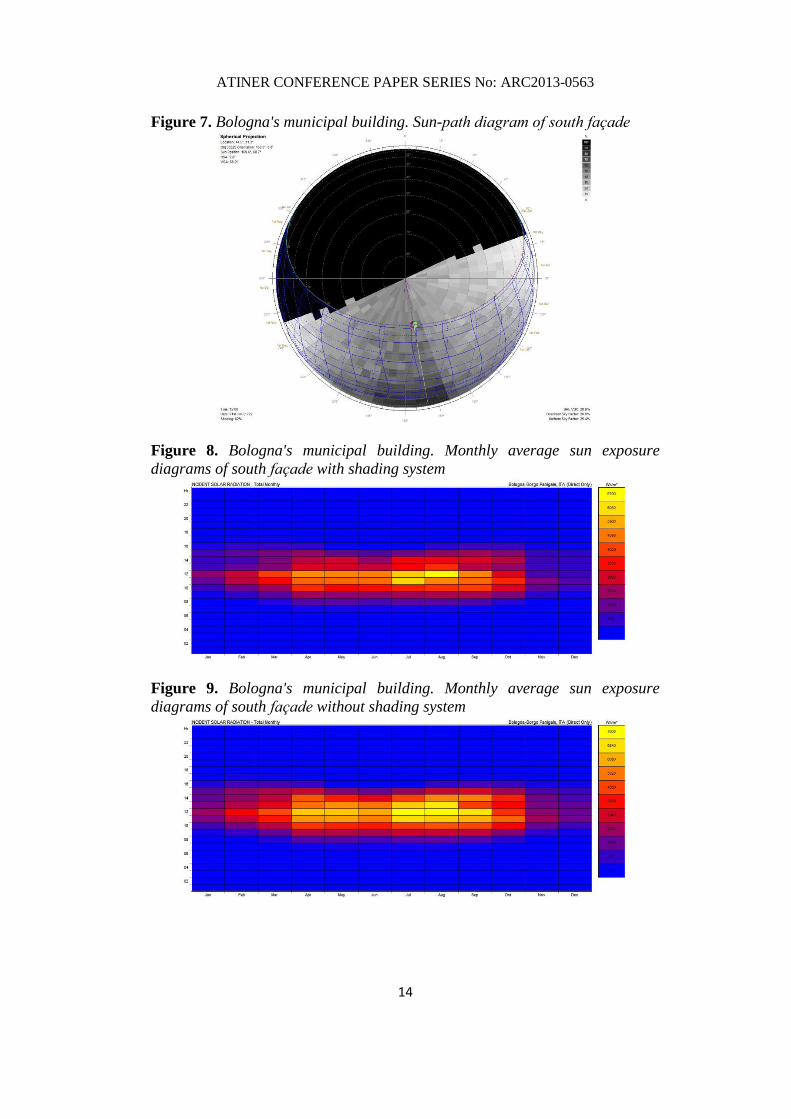
The characteristic pixelated sun-path diagram, in Figure 7, shows the effect of
a shading device made up of linear elements; they let pass a different amount
of light in relation to the incident angle of rays. The gray scale pattern
illustrates the screening rate in different hours and months. Looking at this
graph it is possible to see that the shading effect is stronger in the winter period
than in summertime. This means that the building does not take advantage of
the free heating gains that are useful in Bologna's temperate climate during the
colder months. To better understand the effects of the sun shading roof a
monthly average sun exposure analysis was also performed. This analysis
shows, through a chromatic gradation, the monthly average incident solar
radiation on the south facade in Wh/m2, with (Figure 8) and without (Figure 9)
the shading roof. The roof reduces the incident solar radiation during all the
year. The reduction value is higher in the hottest months (from 7.600 Wh/m2 to
6.700 Wh/m2 in August at noon) but it is relevant also in the winter months
with an important loss of free heating gain. The same analysis were performed
on east façade. It is exposed only until 11.30am. Looking at its sun-path

ATINER CONFERENCE PAPER SERIES No: ARC2013-0563
13
diagram, Figure 10, the shading effect is higher than on the south front. The
average screen rate is about 60% related to the 50% of south side. Furthermore,
in the winter period, from 9.00 to 11.00am the shading effect is lower than in
summer so free heating gains are possible. This is also noticeable in the
monthly average sun exposure graphs. In Figure 11 and Figure 12 the two
diagrams with and without the shading system are compared. During the
summer there is an important reduction of incident radiation, about 1.100
Wh/m2, while in the colder months the reduction is not higher than 300 Wh/m
2.
The last façade, the west one, is exposed only in the afternoon starting form
1.00pm. However, the roof covers only a minimal part of it and it does not
produce a real shading effect. The monthly average sun exposure graph shows
that, in the summer, there is an amount of over 6.000 Wh/m2 of incident
radiation on glass. For that reason, overheating problems during summer can
exist on this side. To reduce this effects, architects used solar control glasses
and internal blinds to prevent dazzle problems. A last analysis was performed
on the roof floor, in the place where the external units of the cooling system are
set. These machines normally work better if the external air is not too hot. In
order to reduce the incident solar radiation on this area, the shading metal roof
cover also this part of the building. The test shows a reduction of 4.400Wh/m2
of incident radiation in the summer period. In this case study the shading
system has a strong architectural impact, since it creates the formal unity of the
building. Otherwise, it is not perfectly efficient in all its parts. On the west
façade the shading roof is not able to perform its function, so it is necessary to
integrate it with other systems like blinds or special glasses. During the year
the fixed roof shades the building without the possibility to regulate it. It causes
the loss of many free gains in winter. However, the system is effective in many
areas; without it the overheating problem inside the building could be more
relevant.
Figure 6. Bologna's municipal building. East front (by Daniele Domenicali)
and tridimensional model
ATINER CONFERENCE PAPER SERIES No: ARC2013-0563
14
Figure 7. Bologna's municipal building. Sun-path diagram of south façade
Figure 8. Bologna's municipal building. Monthly average sun exposure
diagrams of south façade with shading system
Figure 9. Bologna's municipal building. Monthly average sun exposure
diagrams of south façade without shading system

ATINER CONFERENCE PAPER SERIES No: ARC2013-0563
15
Figure 10. Bologna's municipal building. Sun-path diagram of east façade
Figure 11. Bologna's municipal building. Monthly average sun exposure
diagrams of east façade with shading system
Figure 12. Bologna's municipal building. Monthly average sun exposure
diagrams of east façade without shading system
ATINER CONFERENCE PAPER SERIES No: ARC2013-0563
16
Conclusion
The case studies described in this paper are different as regards age,
materials and morphology. The shading systems are also different in materials
and structure and, in addition, they work differently. However, it is possible to
analyze their functioning using three simple tools. The study of the shadows,
thanks to a 3D models, is a really common tool included in every modeling
software; it gives the possibility to analyze how shadows change along the
time. This simple operation allows to understand where and when a sun
overexposure problem can exist. The analysis of shadows can also give
information on how to correctly orientate shading elements. It can demonstrate
which type of shading device is better to use. Just to give an example, it is
possible to know if a vertical or an horizontal element is better to screen
different sun ray angles. The use of sun-path diagrams gives more specific
information about time frames in which overheating problems are possible.
They allow to analyze the shading device effectiveness in different seasons and
hours. Moreover, different types of shading device give a specific sun-path
diagram result; a pixelated graph is related to a discontinuous system, for
example Bologna's grid roof, while a clearly defined graph is linked to a
monolithic system made up of planes or wide elements. Finally, the monthly
average sun exposure graph gives a quantification of the sun radiation stopped
by the shading system. It also allows to identify the months in which sun
exposure is higher. These information are useful to describe how the system
works but they can also be used during the design phase. It is possible to make
comparisons between different shading systems applied to the same building. It
is also possible to study the final efficiency of the system and define which
device is better to use in relation to changes in its position, dimension or
orientation. For example, in the Ahmedabad's case study, a deeper shading
concrete grid could solve the identified overexposure problem on the east side.
In the Bologna's building the use of a mobile system could be recommended to
prevent summer irradiation and to allow winter free gains.
References
Arbizzani, E. (2010). Tecnologia dei sistemi edilizi. Rimini: Maggioli. [In Italian]
Ceccherini Nelli, L., E. D'Audino & A. Trombadore (2010). Schermature solari.
Firenze: Alinea. [In Italian]
Fathy, H.(1986). Natural energy and vernacular architecture : principles and
examples with reference to hot arid climates. Chicago: The University of Chicago
Press
Lechner, N. (2001). Heating, cooling, lighting : design methods for architects. New
York: Wiley
Le Corbusier (1957). Oeuvre complète, 1952-1957. Zurich: Les Editions
d’Architecture.
Le Corbusier (1948). 'Problèmes de l’Ensoleillement: le Brise-soleil.' In: Le Corbusier,
Oeuvre complète, 1938-1946, 103-109. Zurich: Les Editions d’Architecture.
ATINER CONFERENCE PAPER SERIES No: ARC2013-0563
17
Mazria, E. (1979). The passive solar energy book: a complete guide to passive solar
home, greenhouse, and building design. Emmaus: Rodale Press.
Olgyay, A. & V.G. Olgyay (1957). Solar Control and Shading Devices. Princeton:
Princeton University Press.
Scatasta, R. (2008). Un luogo (in) comune : racconto fotografico della costruzione
della nuova sede del comune di Bologna. Milano: Skira. [In Italian]
Tatano,V. & M. Rossetti (2012). Schermature solari. Evoluzione, progettazione e
soluzioni tecniche. Rimini: Maggioli. [In Italian]