Embed Size (px)
Citation preview

ATIA 2009
Accessible Online State Assessment Compared to Paper-Based Testing: Is There a Difference in Results?
Presenters: Linnie Lee, Bluegrass Technology Center, Preston Lewis, University of Kentucky
1
2Kentucky Investigation
Enhanced Assessment Grant
2

3
Kentucky Investigation
Purpose: To fully evaluate the variables around comparability of the KY online accessible assessment to the traditional paper-based administration with an adult reader (oral) accommodation for students with disabilities
3

4
Background: KY CATS Online
KY state assessment is accessible online for reading and responding with a text reader (text to speech technology)
State test available online for eligible students with disabilities since 2003
Includes all grades and test content areas
In the spring of 2008, 2,421 students from 118 KY schools tested online
4
5
CATS Online Basic Design/Accessibility Features
•Choice/variety of screen/text presentation modes
• Digital text readable with text or screen reader
• One question/answer per screen
• Choice of layout for Reading passages
• Alternative text for graphics
• Headphones for privacy and engagement
5
6
Question: How does performance of online students compare to offline students statewide ?
Are online students results comparable to those of paper students statewide that received an oral accommodation?
Does the large difference in the “N” of two groups impact comparison?
6
7
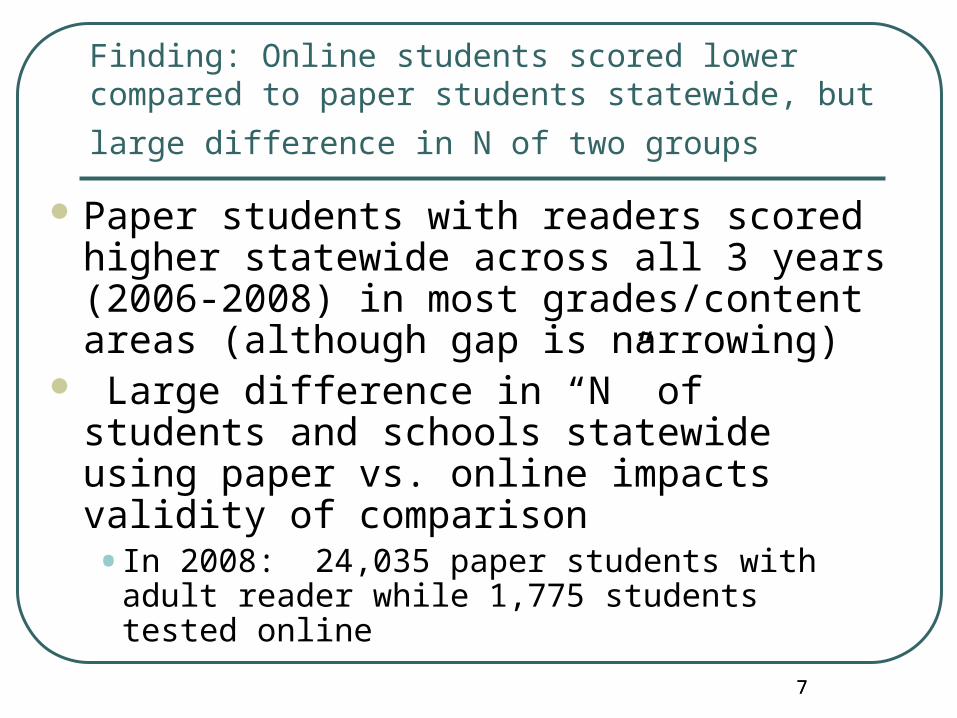
Finding: Online students scored lower compared to paper students statewide, but large difference
in N of two groups
Paper students with readers scored higher statewide across all 3 years (2006-2008) in most grades/content areas (although gap is narrowing)
Large difference in “N” of students and schools statewide using paper vs. online impacts validity of comparison• In 2008: 24,035 paper students with adult reader
while 1,775 students tested online
7
8
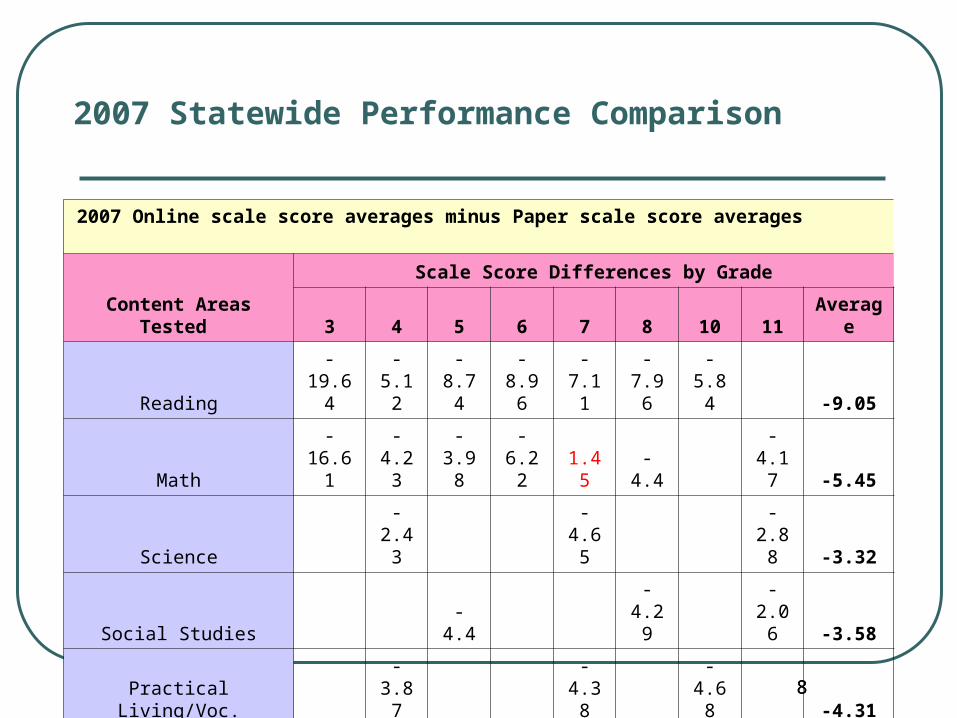
2007 Statewide Performance Comparison
8
2007 Online scale score averages minus Paper scale score averages
Content Areas Tested
Scale Score Differences by Grade
3 4 5 6 7 8 10 11 Average
Reading -19.64 -5.12 -8.74 -8.96 -7.11 -7.96 -5.84 -9.05
Math -16.61 -4.23 -3.98 -6.22 1.45 -4.4 -4.17 -5.45
Science -2.43 -4.65 -2.88 -3.32
Social Studies -4.4 -4.29 -2.06 -3.58
Practical Living/Voc. -3.87 -4.38 -4.68 -4.31
Arts and Humanities 0.1 1.42 -3.03 -0.50
Grade N: Online 29 122 135 221 257 261 248 195
Grade N: Paper 2990 3202 3310 3019 2941 2764 1940 1459
9
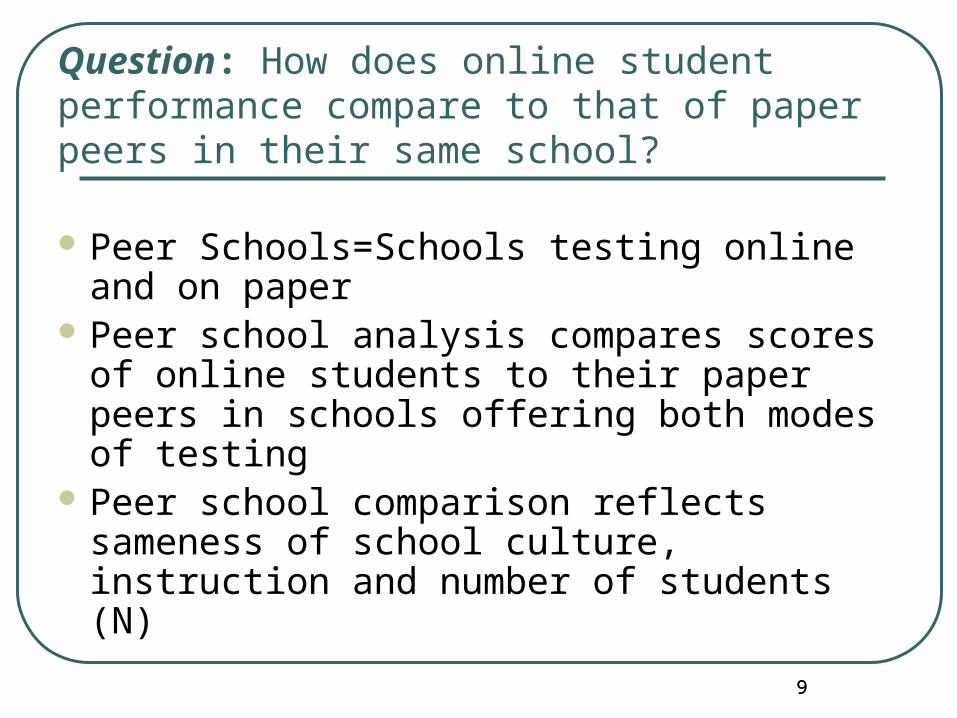
Question: How does online student performance compare to that of paper peers in their same school?
Peer Schools=Schools testing online and on paper
Peer school analysis compares scores of online students to their paper peers in schools offering both modes of testing
Peer school comparison reflects sameness of school culture, instruction and number of students (N)
9
10
Finding: Online Students Scores Higher than Paper Peers from Same Schools
Peer school comparison across grades and content areas shows online scores comparable to or higher than paper students from their same schools
10
11
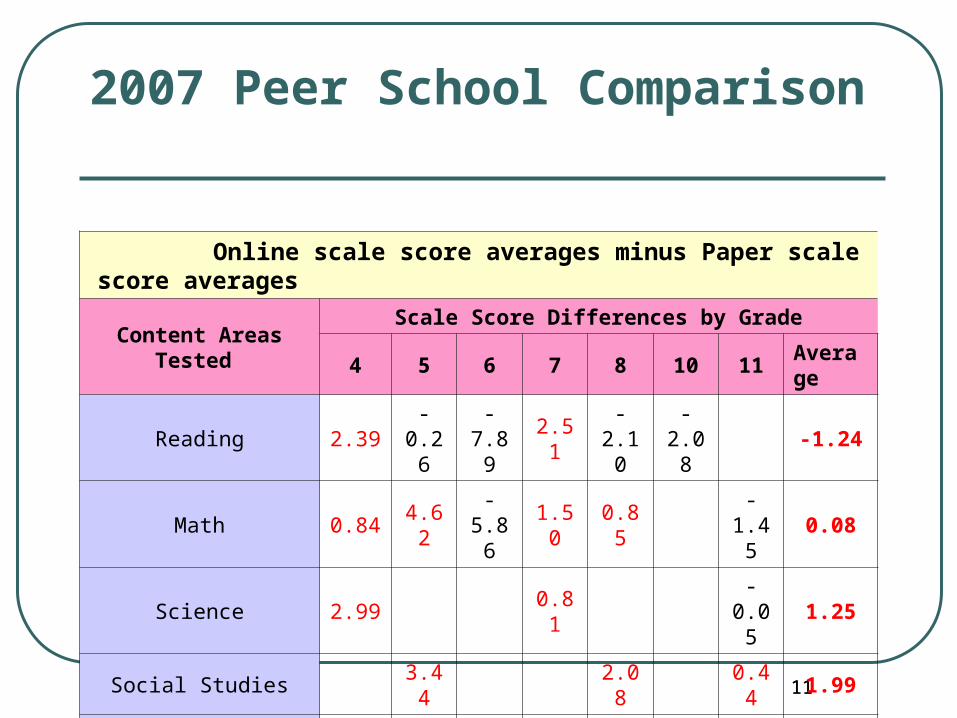
2007 Peer School Comparison
11
Online scale score averages minus Paper scale score averages
Content Areas Tested
Scale Score Differences by Grade
4 5 6 7 8 10 11Average
Reading 2.39 -0.26 -7.89 2.51 -2.10 -2.08 -1.24
Math 0.84 4.62 -5.86 1.50 0.85 -1.45 0.08
Science 2.99 0.81 -0.05 1.25
Social Studies 3.44 2.08 0.44 1.99
Practical Living/Voc. 2.59 -2.94 1.60 0.42
Arts and Humanities 7.36 8.53 1.22 5.70
Grade N: Online 71 86 158 187 210 79 93
Grade N: Paper 69 103 138 244 206 179 76

12
Question: Are the accountability levels/rankings of KY schools with students online different from schools at large?
• Do KY schools at large differ in their accountability profile from schools with students testing online?
• Are “struggling” schools more likely to seek online assessment as a solution?
13
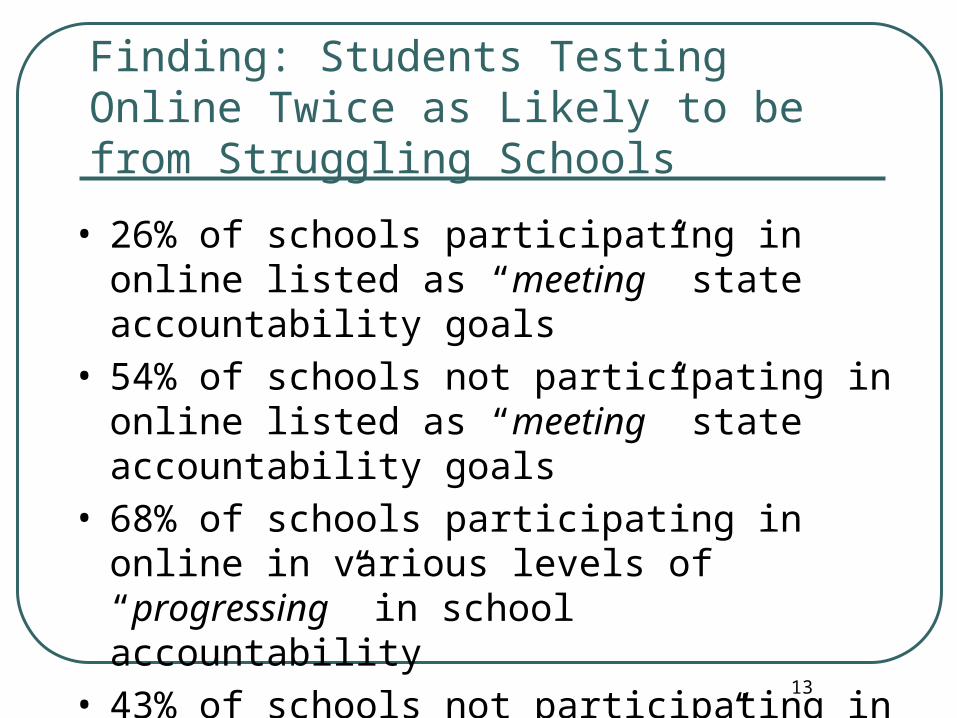
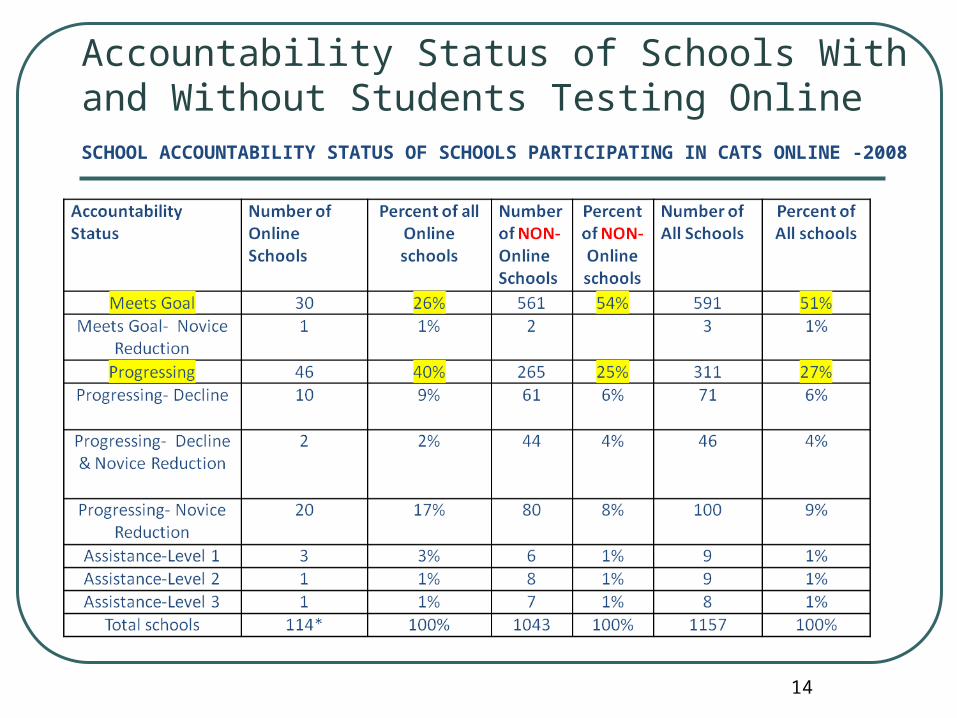
Finding: Students Testing Online Twice as Likely to be from Struggling Schools
• 26% of schools participating in online listed as “meeting” state accountability goals
• 54% of schools not participating in online listed as “meeting” state accountability goals
• 68% of schools participating in online in various levels of “progressing” in school accountability
• 43% of schools not participating in online listed as “progressing” in school accountability
14
Accountability Status of Schools With and Without Students Testing OnlineSCHOOL ACCOUNTABILITY STATUS OF SCHOOLS PARTICIPATING IN CATS ONLINE -2008
15
Question: Do the same students and schools tend to return to online testing from year to year?
• Does the population of students participating in online testing remain consistent across years?
• Do the schools participating in online testing remain consistent across years?
16
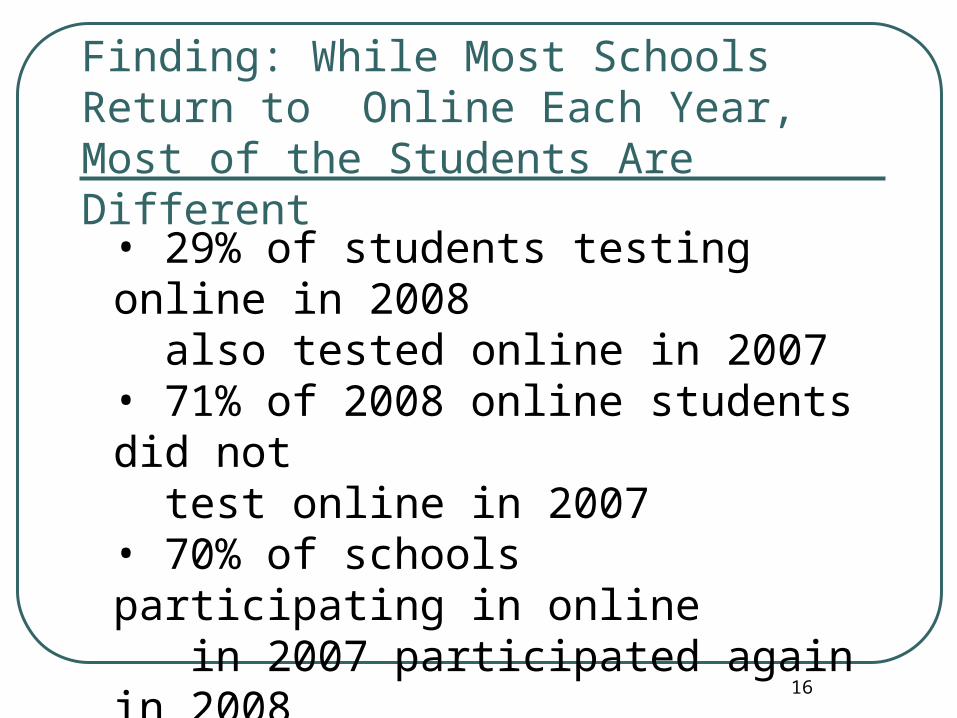
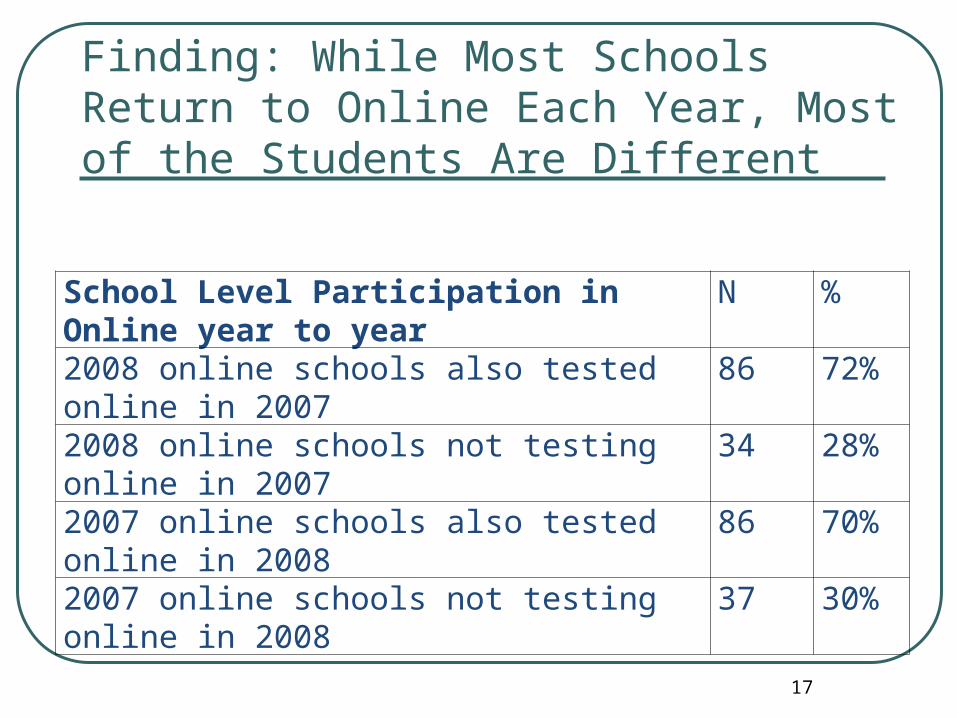
Finding: While Most Schools Return to Online Each Year, Most of the Students Are Different
• 29% of students testing online in 2008 also tested online in 2007• 71% of 2008 online students did not test online in 2007• 70% of schools participating in online in 2007 participated again in 2008• 30% of schools participating in online in 2007 did not return in 2008
17
School Level Participation in Online year to year N %
2008 online schools also tested online in 2007 86 72%
2008 online schools not testing online in 2007 34 28%
2007 online schools also tested online in 2008 86 70%
2007 online schools not testing online in 2008 37 30%
Finding: While Most Schools Return to Online Each Year, Most of the Students Are Different
18
Question: Did online students receive adult supports/accommodations to the same extent as paper students?
Textreader provided oral/reader accommodation for each online student
Unclear if local decision-making always considered online students need for other adult supports/accommodations
(e.g., paraphrasing, cueing/prompting or dictation)
18
19
Finding: Online students received traditional adult accommodations about half as often as paper students
Online students had fewer adult supports/ accommodations (e.g., paraphrasing, cueing & dictation) than paper students
Online students provided these other adult accommodations performed overall better than online students w/o these accommodations
While technology provides oral/reader accommodation, it may not replace need for also providing other traditional accommodations during online testing
19
20
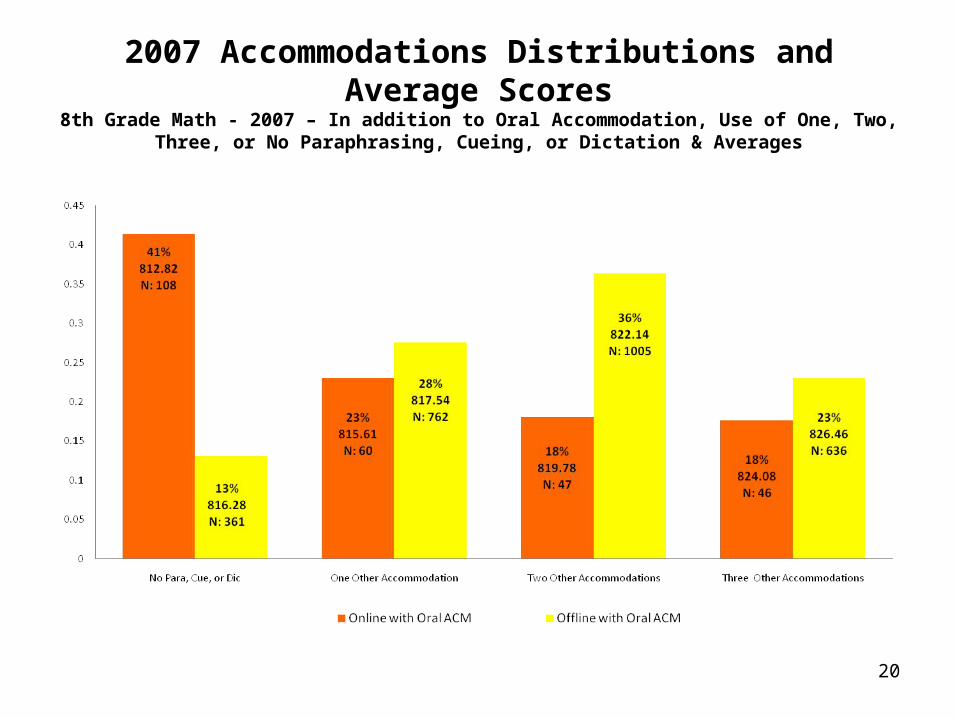
2007 Accommodations Distributions and Average Scores
8th Grade Math - 2007 – In addition to Oral Accommodation, Use of One, Two, Three, or No Paraphrasing, Cueing, or Dictation & Averages
21
Question: Did online students’ reading of passages differ from students testing on paper with adult reader?
Previous KY post-test surveys indicated students using a text reader were re-reading test items more often than when they tested on paper with an adult oral accommodation
21
22
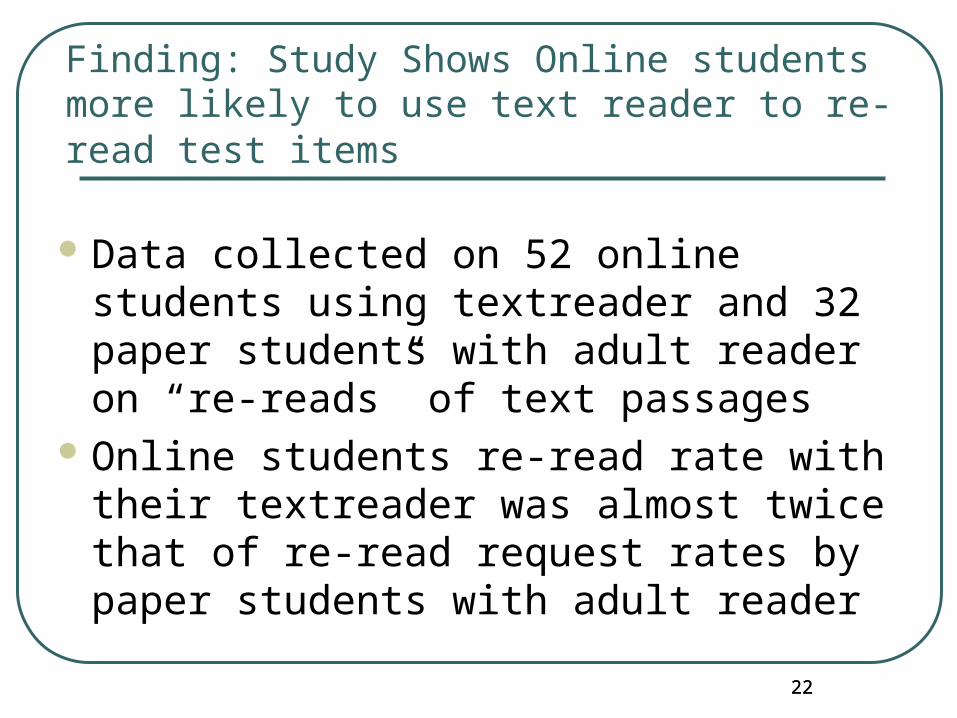
Finding: Study Shows Online students more likely to use text reader to re-read test items
Data collected on 52 online students using textreader and 32 paper students with adult reader on “re-reads” of text passages
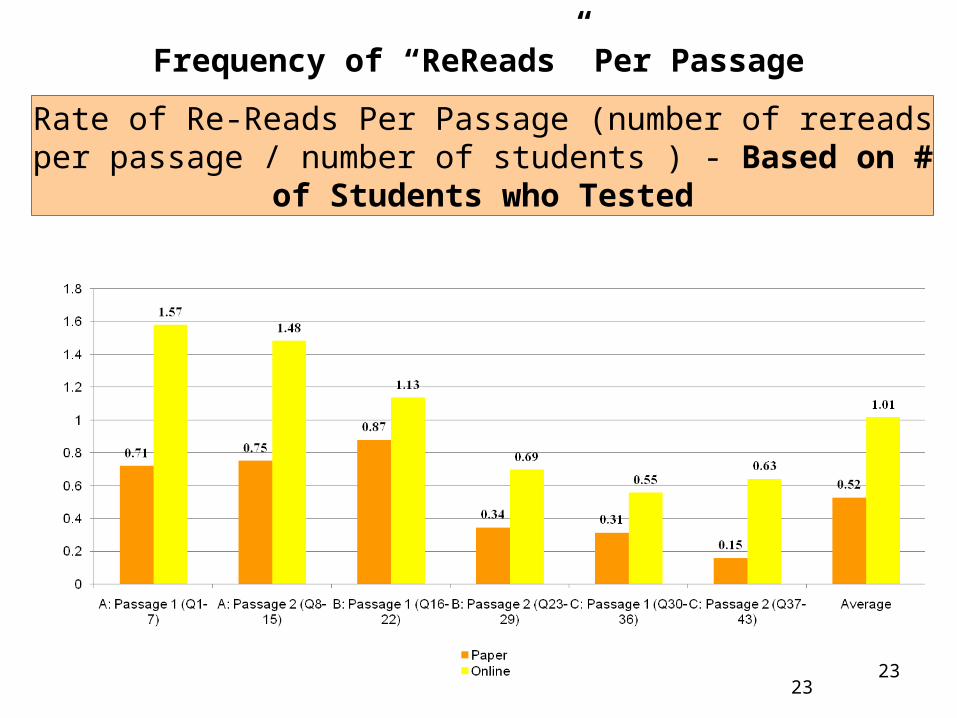
Online students re-read rate with their textreader was almost twice that of re-read request rates by paper students with adult reader
22
23
Rate of Re-Reads Per Passage (number of rereads per passage / number of students ) - Based on # of Students who Tested
Frequency of “ReReads” Per Passage
23
24
Lessons Learned: Further Research
● Findings mixed on whether online students’ performance differs from students on paper
Unclear on extent to which performance differences may be due to adult readers’ influence
Unclear of extent to which performance differences were a result of most students being new to online assessment
● Connection between accessible instruction and student selection for online was not always evident
24
25
Lessons Learned: Further Research
● Unclear if local decision making always considered online students for receipt of other accommodations consistent with IEPs
Need to determine the extent to which text reader accommodation was a routine part of instruction
Need to determine why many students did not return to online assessment year to year, even though most schools continued participation
25

26
Other Lessons Learned & Insights
Technology accommodation in isolation of other traditional supports not always sufficient
Great variability across schools in quality of hardware and student software skills
Online students may read the test more independently and more often than paper students, but impact not clear
Text reader consistently reads the same way to each student, while adult readers may not
Adult readers able to provide supports not available to online (e.g., inflection), but not always appropriate
26