Embed Size (px)
Citation preview
A Newsletter of Finance Lab
February, 2013 Volume 1, Issue 7
a₹tha
Indian Institute of Management Calcutta
2 a₹tha – a newsletter of finance lab
Indian Institute of Management Calcutta
Editorial
Chief Editor
Prof. Ashok Banerjee Editorial Team
Prof. Partha Ray
Dr. Golaka C. Nath
This is the month for two big budgets-Railways and Finance.
We’ll carry some analyses of budget and economic survey
that have implications for equity, credit, and bond markets.
In fact, on the day of the release of this issue, Union Budget
has already been presented. We are not carrying any snap
shots on the budget in this issue. Wait for the next number!
This issue covers three articles. The first piece deals with
Algorithmic Trading, its uses and possible abuses. The second
article raises some questions on the new bank licensing
policy and evaluates whether it would be good for the
country as a whole or are we going back to pre-1969 regime.
The third article looks at the relationship between gold and
crude oil prices. The article finds that The study finds that
even though the general price level of gold and oil evolve in a
similar direction, the relationship may not be tradable based
on data for the long term.
I hope you’ll enjoy reading the newsletter. Please offer
suggestions for further improvement to [email protected]
Editor
T
3 a₹tha – a newsletter of finance lab
Indian Institute of Management Calcutta
TABLE OF CONTENTS
ALGORITHMIC TRADING ................................................................................................................. 4-6
Prof. Ashok Banerjee
NEW BANK LICENSING POLICY IN INDIA: QUO VADIS? ........................................................ 7-9
Prof. Partha Ray
GOLD OIL RATIO AND ITS IMPLICATIONS ........................................................................... 10-12
Dr. Golaka C. Nath
4 a₹tha – a newsletter of finance lab
Indian Institute of Management Calcutta
Prof. Ashok Banerjee
Ashok Banerjee, Ph.D., is Professor, Finance and Control, Indian Institute
of Management Calcutta (IIM-C). He is also the faculty in-charge of the
Financial Research and Trading Lab at IIM-C. His primary research
interests are in areas of Financial Time Series, News Analytics and Mergers
& Acquisitions.
Introduction
Trading strategy is defined as a set of rules for making trading decisions. Such rules may be applied by
people to execute trade by placing orders ‘manually’. However, whenever trading rules are applied by a
computer ‘automatically’ to execute trade, it is called programme trading or algorithmic trading. An
automated trading strategy ‘wraps wraps trading formulas into automated order and execution systems’.
The computer algorithm also decides on certain finer aspects of the order such as the timing, price, or
even the final quantity of the order. Algorithmic (popularly called, algo) trading is widely used whenever
a hedge fund, pension fund, or other institutional trader wanted to place a large order with minimum
market impact costs. The computer programme in that case will slice the large order into smaller lots and
will execute small size trades in appropriate time without causing any noticeable change in the price. In
other words, algo trading helps in minimizing trading costs. Algo trading can be used for market timing,
arbitrage or pure speculative transactions. Algo trading is also useful whenever a large institutional
investor intends to execute trade on the basis of ‘information’.
The success of algo trading depends on the robustness of the algorithm and speed of execution. Algo
traders try to exploit a small bid-ask spread by executing large orders in short span of time. Indian stock
exchanges offer co-location facility to trading firms to allow faster trading. Co-location is when brokers
locate their computer servers physically within metres of an exchange’s system to shave off milliseconds
off the time it takes to execute a trade.
Algo trading is alleged to be main force behind occasional market crash. How does that work? With the
popularity of algo trades, many traders, unconnected with each other, place orders for directional trade.
Assume there is a set of algos across unconnected desks which are programmed for directional trade,
whether up or down. As long as one is making profits, the programme rides the trade. Once an abnormal
trade (generally in frontline index stocks) is entered into the system by any broker and a specific stock or
a set of stocks start moving down sharply, a number of other algos come into play based on their
programmed logic, and thus go short on the specific stocks or the index, as the direction is down. This
happens in a matter of seconds or milliseconds and hence market could crash before any one gets to know
about it. (http://blogs.reuters.com/india-expertzone/2012/10/05/).
Regulatory Response
The regulators were highly watchful of the roles that algo traders have on market dynamics. In case of
any flash crash, algo traders become the fall guy. Algo traders, on the other hand argue, that they provide
liquidity in the market and thereby facilitate better price discovery. It is alleged that algorithmic or
programme trading was instrumental for “flash crashes”. During Mahurat Trading in October 2011, such
a program trading created a ruckus in the BSE, so much that the exchange canceled all trades made on
that day to avoid a payment crisis. If the transaction cost of trade is high, it discourages programme
Algorithmic Trading
5 a₹tha – a newsletter of finance lab
Indian Institute of Management Calcutta
trades. Thus, any lowering of the Securities Transaction Tax (which has been a favourite demand of high
frequency traders) would encourage algo traders.
The stock exchanges in India witness significant algo trades. According to an estimate, about one-third of
the trade in both cash and derivatives segments of the National Stock Exchange (NSE) are programme
trading. The Securities and Exchange Board of India (SEBI) has allowed trading through algorithm. The
SEBI has recently asked all algo traders to undertake Algorithmic System’s audit every six months
through Exchange empanelled system auditors & submit the report to the Exchange. This audit
requirement will be effective from March 2013.
The Forward Market Commission (FMC), the commodity market regulator in India, had banned
algorithmic trading in micro and mini contracts effective December 1, 2012. These small size contracts
were originally launched to benefit small traders. FMC observed, in utter dismay, that only large traders
have availed the benefit of algo trading in such contracts and small and marginal traders were largely
unaware of such small trading lot and tick size contracts. Recently, in February 2013, the Chairman of
FMC informed that of the daily trading volume (about ₹80,000 crores) in the commodity futures markets,
around a fifth of volumes on metals and energy bourse MCX and and close to a tenth of volumes on agri
bourse NCDEX are generated by algos. Commodity exchanges have been asked to penalise brokers who
place huge orders not resulting into trades and brokers will not be allowed to place more than 20 orders
per second.
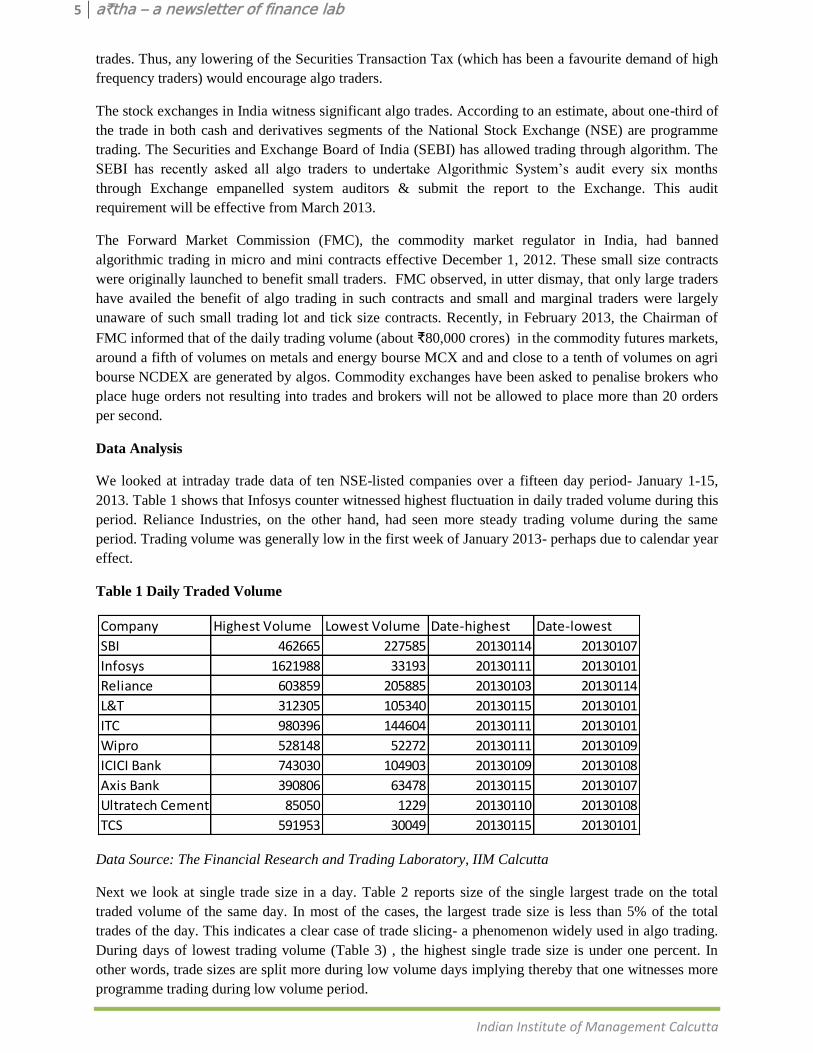
Data Analysis
We looked at intraday trade data of ten NSE-listed companies over a fifteen day period- January 1-15,
2013. Table 1 shows that Infosys counter witnessed highest fluctuation in daily traded volume during this
period. Reliance Industries, on the other hand, had seen more steady trading volume during the same
period. Trading volume was generally low in the first week of January 2013- perhaps due to calendar year
effect.
Table 1 Daily Traded Volume
Data Source: The Financial Research and Trading Laboratory, IIM Calcutta
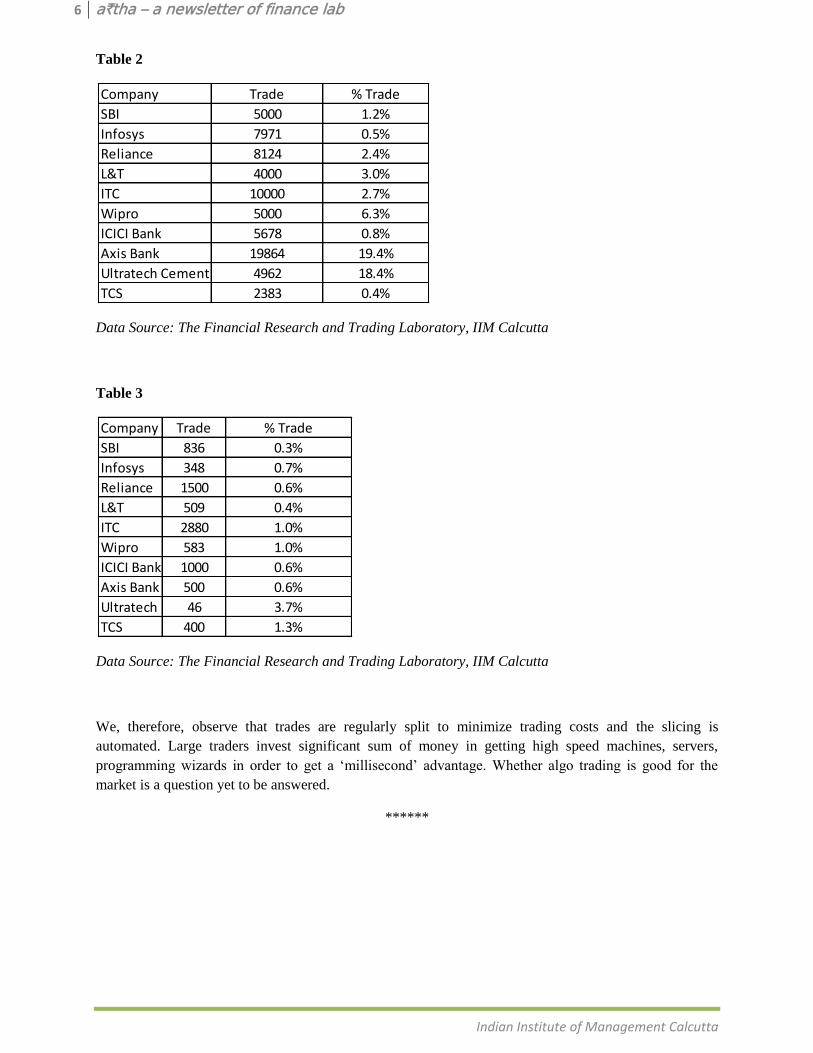
Next we look at single trade size in a day. Table 2 reports size of the single largest trade on the total
traded volume of the same day. In most of the cases, the largest trade size is less than 5% of the total
trades of the day. This indicates a clear case of trade slicing- a phenomenon widely used in algo trading.
During days of lowest trading volume (Table 3) , the highest single trade size is under one percent. In
other words, trade sizes are split more during low volume days implying thereby that one witnesses more
programme trading during low volume period.
Company Highest Volume Lowest Volume Date-highest Date-lowest
SBI 462665 227585 20130114 20130107
Infosys 1621988 33193 20130111 20130101
Reliance 603859 205885 20130103 20130114
L&T 312305 105340 20130115 20130101
ITC 980396 144604 20130111 20130101
Wipro 528148 52272 20130111 20130109
ICICI Bank 743030 104903 20130109 20130108
Axis Bank 390806 63478 20130115 20130107
Ultratech Cement 85050 1229 20130110 20130108
TCS 591953 30049 20130115 20130101
6 a₹tha – a newsletter of finance lab
Indian Institute of Management Calcutta
Table 2
Data Source: The Financial Research and Trading Laboratory, IIM Calcutta
Table 3
Data Source: The Financial Research and Trading Laboratory, IIM Calcutta
We, therefore, observe that trades are regularly split to minimize trading costs and the slicing is
automated. Large traders invest significant sum of money in getting high speed machines, servers,
programming wizards in order to get a ‘millisecond’ advantage. Whether algo trading is good for the
market is a question yet to be answered.
******
Company Trade % Trade
SBI 5000 1.2%
Infosys 7971 0.5%
Reliance 8124 2.4%
L&T 4000 3.0%
ITC 10000 2.7%
Wipro 5000 6.3%
ICICI Bank 5678 0.8%
Axis Bank 19864 19.4%
Ultratech Cement 4962 18.4%
TCS 2383 0.4%
Company Trade % Trade
SBI 836 0.3%
Infosys 348 0.7%
Reliance 1500 0.6%
L&T 509 0.4%
ITC 2880 1.0%
Wipro 583 1.0%
ICICI Bank 1000 0.6%
Axis Bank 500 0.6%
Ultratech Cement46 3.7%
TCS 400 1.3%

7 a₹tha – a newsletter of finance lab
Indian Institute of Management Calcutta
Prof. Partha Ray
Partha Ray, Ph.D., is Professor, Economics, Indian Institute of
Management Calcutta (IIM-C). Prior to joining IIM-C, Prof. Ray, a career
central banker, was the adviser to Executive Director, International
Monetary Fund, Washington D.C. during 2007-2011.
Ever since the bank nationalization in July 1969, India has been traditionally dominated by public sector
banks. It is instructive to turn to Dr I G Patel, the then Secretary, Economic Affairs (and later Governor of
the RBI) to get the context. In his autobiography Dr Patel mentioned the following,
“It was, I think, later in July 1969 that I was sent for once again. No one else was present.
Without any fanfare, she (the Late Mrs. Indira Gandhi, the then Prime Minister and Finance
Minister as well) asked me whether banking was under my charge. On my telling that it was, she
simply said: 'For political reasons, it has been decided to nationalise the banks....' There was no
pretence that this was a political decision”.1
Dr. Patel is said to have offered two suggestions to Mrs Gandhi: (a) foreign banks should not be
nationalized; and (b) instead of nationalizing all banks, it would be better if only the major banks, which
accounted for 85–90 per cent of the total banking business, were nationalized; both these suggestions
were accepted.
While the banking network under the public sector auspices has been growing tremendously during the
1970s and 1980s, which had made great strides in terms of financial inclusion and spurt in financial
savings, there were serious issues relating to their efficiency as well as product range. After the initiation
of financial sector liberalization since the 1990s, thus, the banking sector in India has been made open to
the private players. Accordingly, extremely successful private sector banks like ICICI Bank or HDFC
Bank emerged in the 1990s. For quite some time there were demands for reviewing the existing bank
licensing policy. Perhaps in the aftermath of the global financial crisis, there was some lull in such
demands. But, in his Budget Proposal for 2010-11 (of February 26, 2010) the then Finance Minister Mr.
Pranab Mukherjee announced that,
"We need to ensure that the banking system grows in size and sophistication to meet the needs of a
modern economy. Besides, there is a need to extend the geographic coverage of banks and improve access
to banking services. In this context, ....the RBI is considering giving some additional banking licenses to
private sector banks. Non Banking Financial Companies could also be considered, if they meet the RBI's
eligibility criteria" (para 38).2
Accordingly, the RBI had put out a Discussion Paper on August 11, 2010 inviting feedback and
comments. Apart from receiving the comments the RBI had extensive discussion with important
stakeholders. The gist of these comments and discussions was placed on the RBI’s website on December
23, 2010. Subsequently, the draft guidelines on ‘Licensing of New Banks in the Private Sector’ were
released on August 29, 2011 for comments. Subsequently, the guidelines have been finalized taking into
1 See, Patel I. G. (2002): Glimpses of Indian Economic Policy: An Insider’s View, Delhi: Oxford University Press; (p.
135). 2 Available at http://indiabudget.nic.in/ub2010-11/bs/speecha.htm
New Bank Licensing Policy in India: Quo Vadis?1
8 a₹tha – a newsletter of finance lab
Indian Institute of Management Calcutta
account the important amendments in December 2012 to the Banking Regulation Act, 1949. More
recently, on February 22, 2013, the Reserve Bank of India (RBI) has released guidelines for licensing of
new private sector banks.
The Key features of the new policy are as follows:3
Eligible Promoters: Entities / groups in the private sector, entities in public sector and Non-
Banking Financial Companies (NBFCs) shall be eligible to set up a bank through a wholly-
owned Non-Operative Financial Holding Company (NOFHC).
‘Fit and Proper’ criteria: Entities / groups should have a past record of sound credentials
and integrity, be financially sound with a successful track record of 10 years.
Corporate structure of the NOFHC: The NOFHC shall be wholly owned by the Promoter /
Promoter Group. The NOFHC shall hold the bank as well as all the other financial services
entities of the group.
Minimum voting equity capital requirements for banks and shareholding by
NOFHC: The initial minimum paid-up voting equity capital for a bank shall be ₹ 5 billion;
within which the NOFHC shall initially hold a minimum of 40 per cent of the paid-up voting
equity capital of the bank. This shall be locked in for a period of five years and which shall be
brought down to 15 per cent within 12 years. The bank shall get its shares listed on the stock
exchanges within three years of the commencement of business by the bank.
Regulatory framework: While the bank will be governed by the provisions of the relevant
Acts, the NOFHC shall be registered as a non-banking finance company (NBFC) with the
RBI and will be governed by a separate set of directions issued by RBI.
Foreign shareholding in the bank: The aggregate non-resident shareholding in the new
bank shall not exceed 49 percent for the first 5 years after which it will be as per the extant
policy.
Corporate governance of NOFHC: At least 50% of the Directors of the NOFHC should be
independent directors.
Prudential norms for the NOFHC: The prudential norms will be applied to NOFHC both
on stand-alone as well as on a consolidated basis and the norms would be on similar lines as
that of the bank.
Exposure norms: The NOFHC and the bank shall not have any exposure to the Promoter
Group. The bank shall not invest in the equity / debt capital instruments of any financial
entities held by the NOFHC.
Other conditions for the bank: Besides, there are other conditions like, (a) the Board of the
bank should have a majority of independent Directors; (b) the bank shall open at least 25 per
cent of its branches in unbanked rural centres (population upto 9,999 as per the latest census);
(c) the bank shall comply with the priority sector lending targets and sub-targets as applicable
to the existing domestic banks; (d) banks promoted by groups having 40 per cent or more
assets/income from non-financial business will require RBI’s prior approval for raising paid-
up voting equity capital beyond `10 billion for every block of ₹ 5 billion.
3 Available at http://rbi.org.in/scripts/BS_PressReleaseDisplay.aspx?prid=28191
9 a₹tha – a newsletter of finance lab
Indian Institute of Management Calcutta
Besides, existing NBFCs, if considered eligible have been permitted to promote a new bank or convert
themselves into banks.
Going forward, applications for floating banks need to be submitted to the RBI by July 1, 2013. While in
the first stage, the applications will be screened by the RBI, subsequently, the applications will be referred
to a High Level Advisory Committee (the constitution of which is to be announced shortly). Once the
Committee submits its recommendations to the RBI, it will take a decision to issue an in-principle
approval for setting up of a bank.
Who are going to come to the fray? There were unconfirmed press reports that not more than four to five
licenses may not be issued by the RBI (Financial Express, February 25, 2013) or that some of the leading
investment banks may develop cold feet. There are still some concerns. Is floating of banks by corporate
houses a good thing? Will it compromise on the age-old principles of conservative banking that seemed to
have serviced India well? Will the Budget for 2013-14 make any fresh announcements? While many of
these have been examined in detail at the discussion stage, going forward, stakeholders may need clarity
on many such issues. Watch this space in the days to come!
******

10 a₹tha – a newsletter of finance lab
Indian Institute of Management Calcutta
Dr. Golaka C. Nath
Dr. Golaka C Nath is a Senior Vice President at the Clearing
Corporation of India Ltd. (CCIL). He has over 21 years of experience
in the banking and financial sector, having previously worked with the
National Stock Exchange of India Ltd. and Vijaya Bank. In the past, he
has worked on a World Bank Project on “Developing Bond Market in
South Asia”. He has also provided secretarial service to the High
Powered Committee on “Corporate Bonds and Securitization”
appointed by the Ministry of Finance, Government of India.
Gold is one of the most traded precious metals while oil is the most traded raw material. They play an
important role in any economy. Typically, Gold and Crude Oil prices tend to move together and have
good correlation. There are two important reasons for this – (a) historically, gold was used by countries to
buy oil and a large part of the proceeds from oil revenue ends up in investment in gold. As oil prices
move upward, the oil economies receiving such surplus funds invest much of this surplus in gold or other
hard assets; (b) rising oil prices place upward pressure on inflation and this enhances the appeal of gold
because it acts as a hedge against inflation. By using gold as a currency, we can value the price of crude
oil using the oil gold ratio. This ratio is independent of any currency and any other measure of inflation.
Crude Oil is an important commodity that affects economy of every country. The higher price of crude
will benefit the oil producing and exporting economies and affects negatively the countries which import
oil for their domestic consumption. Oil production and consumption is used as an indicator of economic
activity. Changes in its price quickly affects the consumer prices (inflation) leading to shifts in monetary
policy which will have a significant impact on the economy. In contrast to this, gold is a commodity that
does not produce any regular income by holding and the holders’ revenue depends on the price
appreciation because of enhanced demand for the commodity as against lower supply. Gold is used by
central banks as a reserve component and all central banks hold huge amount of gold in their vaults. Gold
is basic part of the international reserve portfolio of most countries, including the oil producing countries.
Demand for gold increases when investors would like to put their money in safe assets. Having a clear
understanding of the gold/oil ratio is one of the keys ways to visualize why rising oil prices is not bad for
all economies. Higher crude oil prices result in slowing down the economy as a whole and resultant
inflation reduces disposable income for people. This does eventually adversely affect investment climate
and specifically financial markets in particular; gold typically shines very well during these very
times. The gold/oil ratio is simply computed by dividing the international gold price by the crude oil
price (in the same currency).
Historical Gold Oil Relationship
Typically Gold and Crude Oil price movements have great correlations. They deviate tactically over
shorter periods of time as their respective supply-and-demand influences dictate, but over the long run
they move together. Historically, an ounce of gold can buy about 16 barrels of oil. For a period of 309
months (from May’87 to Jan’13), gold could buy about 15.72 barrels of WTI crude and 16.44 barrels of
Brent. Both Brent and WTI crude prices also move very closely with each other but in recent times, they
* Personal views of the author only and not the views of his organization
Gold Oil Ratio and its Implications*
*
*
*
11 a₹tha – a newsletter of finance lab
Indian Institute of Management Calcutta
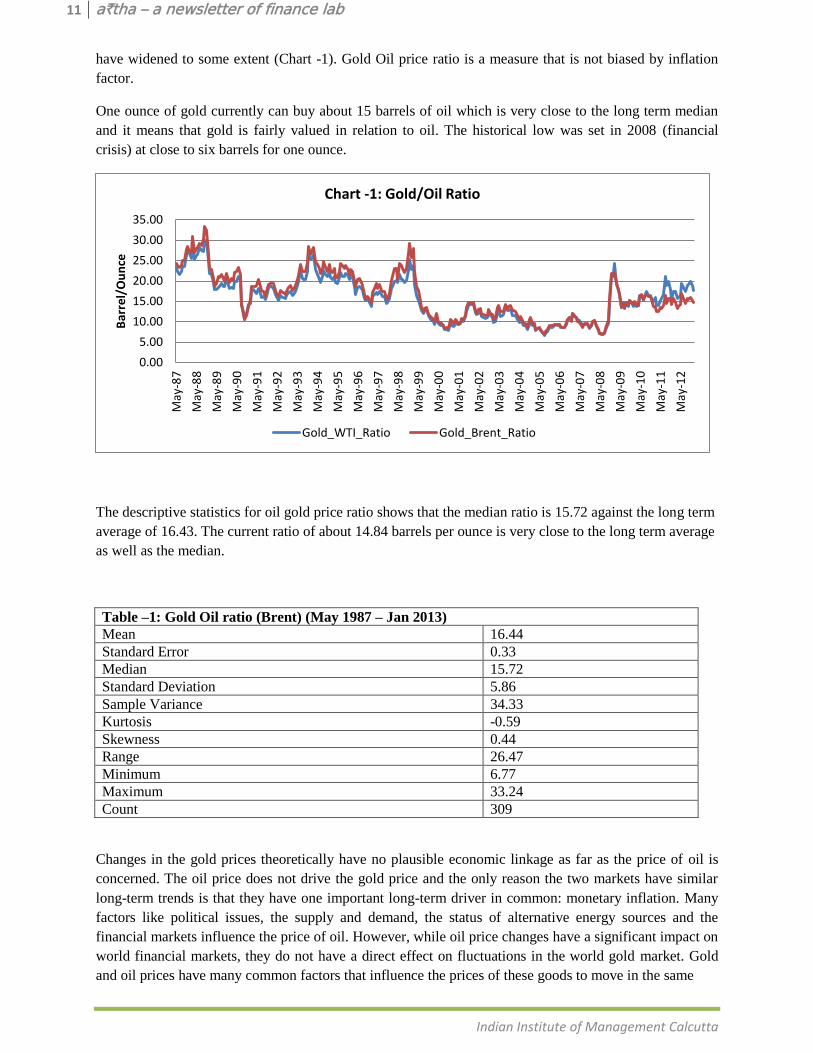
have widened to some extent (Chart -1). Gold Oil price ratio is a measure that is not biased by inflation
factor.
One ounce of gold currently can buy about 15 barrels of oil which is very close to the long term median
and it means that gold is fairly valued in relation to oil. The historical low was set in 2008 (financial
crisis) at close to six barrels for one ounce.
The descriptive statistics for oil gold price ratio shows that the median ratio is 15.72 against the long term
average of 16.43. The current ratio of about 14.84 barrels per ounce is very close to the long term average
as well as the median.
Table –1: Gold Oil ratio (Brent) (May 1987 – Jan 2013)
Mean 16.44
Standard Error 0.33
Median 15.72
Standard Deviation 5.86
Sample Variance 34.33
Kurtosis -0.59
Skewness 0.44
Range 26.47
Minimum 6.77
Maximum 33.24
Count 309
Changes in the gold prices theoretically have no plausible economic linkage as far as the price of oil is
concerned. The oil price does not drive the gold price and the only reason the two markets have similar
long-term trends is that they have one important long-term driver in common: monetary inflation. Many
factors like political issues, the supply and demand, the status of alternative energy sources and the
financial markets influence the price of oil. However, while oil price changes have a significant impact on
world financial markets, they do not have a direct effect on fluctuations in the world gold market. Gold
and oil prices have many common factors that influence the prices of these goods to move in the same
0.00
5.00
10.00
15.00
20.00
25.00
30.00
35.00
May
-87
May
-88
May
-89
May
-90
May
-91
May
-92
May
-93
May
-94
May
-95
May
-96
May
-97
May
-98
May
-99
May
-00
May
-01
May
-02
May
-03
May
-04
May
-05
May
-06
May
-07
May
-08
May
-09
May
-10
May
-11
May
-12
Bar
rel/
Ou
nce
Chart -1: Gold/Oil Ratio
Gold_WTI_Ratio Gold_Brent_Ratio
12 a₹tha – a newsletter of finance lab
Indian Institute of Management Calcutta
direction. Gold is considered to be a hedge against inflation. Rising global oil prices is likely to fuel
inflation, in which case investors will be most willing to direct their investments in assets that will have
the highest resistance to inflation. Gold, being a stable reserve for many central banks, will be the most
preferred asset class. The demand for gold is likely to increase and this will lead to higher gold prices.
However, the reverse is not true - increases or decreases in gold prices may not have an effect on oil
prices.
Due to increasing international concern over rising sovereign debt after the financial crisis and the
continued decline of the major currencies like US Dollar, Euro, global demand for gold has increased
significantly. India and China are major gold markets and their domestic demand has in recent years had a
significant impact on global gold price developments. Some of the central banks have been net buyers of
the yellow metal in recent times further increasing the demand for gold.
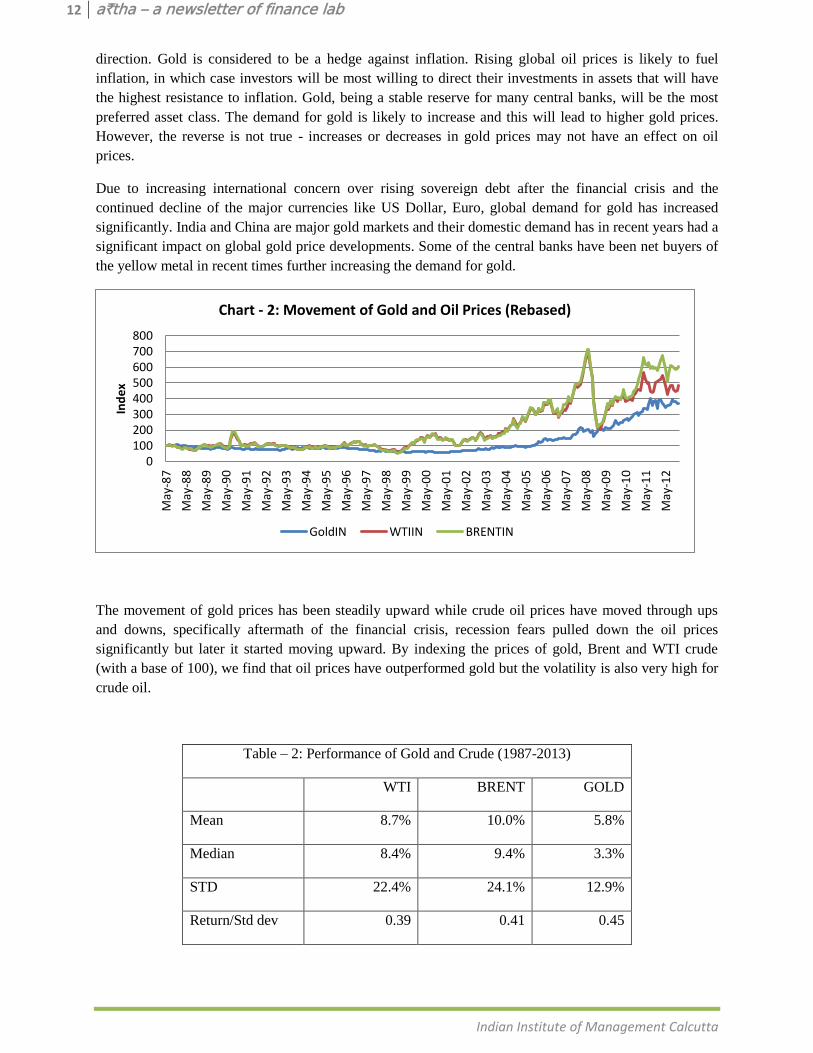
The movement of gold prices has been steadily upward while crude oil prices have moved through ups
and downs, specifically aftermath of the financial crisis, recession fears pulled down the oil prices
significantly but later it started moving upward. By indexing the prices of gold, Brent and WTI crude
(with a base of 100), we find that oil prices have outperformed gold but the volatility is also very high for
crude oil.
Table – 2: Performance of Gold and Crude (1987-2013)
WTI BRENT GOLD
Mean 8.7% 10.0% 5.8%
Median 8.4% 9.4% 3.3%
STD 22.4% 24.1% 12.9%
Return/Std dev 0.39 0.41 0.45
0100200300400500600700800
May
-87
May
-88
May
-89
May
-90
May
-91
May
-92
May
-93
May
-94
May
-95
May
-96
May
-97
May
-98
May
-99
May
-00
May
-01
May
-02
May
-03
May
-04
May
-05
May
-06
May
-07
May
-08
May
-09
May
-10
May
-11
May
-12
Ind
ex
Chart - 2: Movement of Gold and Oil Prices (Rebased)
GoldIN WTIIN BRENTIN
13 a₹tha – a newsletter of finance lab
Indian Institute of Management Calcutta
The study finds that even though the general price level of gold and oil evolve in a similar direction, the
relationship may not be tradable based on data for the long term. It is possible for short-term patterns to
emerge occasionally. So, even though there seems to be no proved relationship between gold and oil
monthly returns over the long term, it may happen that a relationship can unveil itself in a short period of
time that may offer trading opportunities to investors. The study finds that there seems to be a relatively
strong relationship between gold and oil prices but not between gold and oil monthly returns. The strength
of the relationship between gold and oil coincides with high or low gold returns. This relationship may
not be useful for speculation over the long term but it’s possible that patterns emerge locally, in short time
spans.
*******