Embed Size (px)
Citation preview
arX
iv:0
808.
2180
v3 [
astr
o-ph
] 5
Sep
200
8
Draft version October 29, 2018Preprint typeset using LATEX style emulateapj v. 6/22/04
METALLICITY-CORRECTED TIP OF THE RED GIANT BRANCH DISTANCE TO NGC 4258
Violet A. Mager, Barry F. Madore & Wendy L. FreedmanThe Observatories
Carnegie Institution of Washington813 Santa Barbara St.Pasadena, CA 91101
Draft version October 29, 2018
ABSTRACT
We have determined the distance to NGC 4258 using observations made with the Hubble SpaceTelescope (HST) and the Wide Field, Advanced Camera for Surveys (ACS/WFC). We apply a mod-ified technique that fully accounts for metallicity effects on the use of the luminosity of the tip ofthe red giant branch (TRGB) to determine one of the most precise TRGB distance moduli to date:µ(TRGB) = 29.28± 0.04 (random) ±0.12 (systematic) mag (7.18± 0.13± 0.40 Mpc). We discuss thisdistance modulus with respect to other recent applications of the TRGB method to NGC 4258, andwith several other techniques (Cepheids and masers) that are equally competitive in their precision,but different in their systematics.
Subject headings: distance scale – galaxies: individual (NGC 4258)
1. INTRODUCTION
This is the first in a short series of papers using a re-fined methodology for determining distances using thediscontinuity in the I-band magnitude of the red giantbranch luminosity function as a standard candle (Leeet al. 1993), the so-called TRGB (tip of the red giantbranch) method. Here we apply a new methodology incorrecting for the now well understood and precisely cal-ibrated metallicity effects on the TRGB magnitude (seeSection 4.1 and Madore et al. 2008).Our first target is the spiral galaxy NGC 4258. It
is nearby, and therefore very highly resolved, not onlyinto its bright, high-mass Population I disk stars, butalso into its fainter, but still accessible, low-mass Pop-ulation II halo stars. NGC 4258 contains many knownCepheids that have been discovered and used as distanceindicators in multiple observing campaigns using HST.Its halo has been resolved and studied on equally asmany occasions, revealing a broad, richly populated giantbranch for TRGB distance determination. The unique-ness of NGC 4258 lies at its center, where a Keplerian-rotating disk of water masers has proper motions andradial velocities that can be cross-compared and mod-eled with essentially one additional free parameter: thedistance. As such, the independently calibrated Popu-lation I (Cepheid) and Population II (TRGB) distancescales both converge on and cross at NGC 4258, wherethey can be compared to that from simple geometry(maser method). No other galaxy provides such an en-vironment for testing the distance scale. That said, itmust also be emphasized that NGC 4258 is still only oneobject, and its uniqueness means that there is no inde-pendent check on the maser distance methodology itself,its random errors, or its systematics.Without prejudice as to which (if any) of the three
distance determination methods discussed here is better(understood or calibrated) at this point, we now pro-ceed to present a new and improved determination of theTRGB distance using HST ACS/WFC data from one
Electronic address: [email protected], [email protected], [email protected]
of our approved and scheduled programs, and archivalWFPC2 data as a consistency check. We compare theseresults with previous TRGB results, and with the otherpast and published methods.
2. DATA REDUCTION AND CALIBRATION OF THE ACSIMAGES
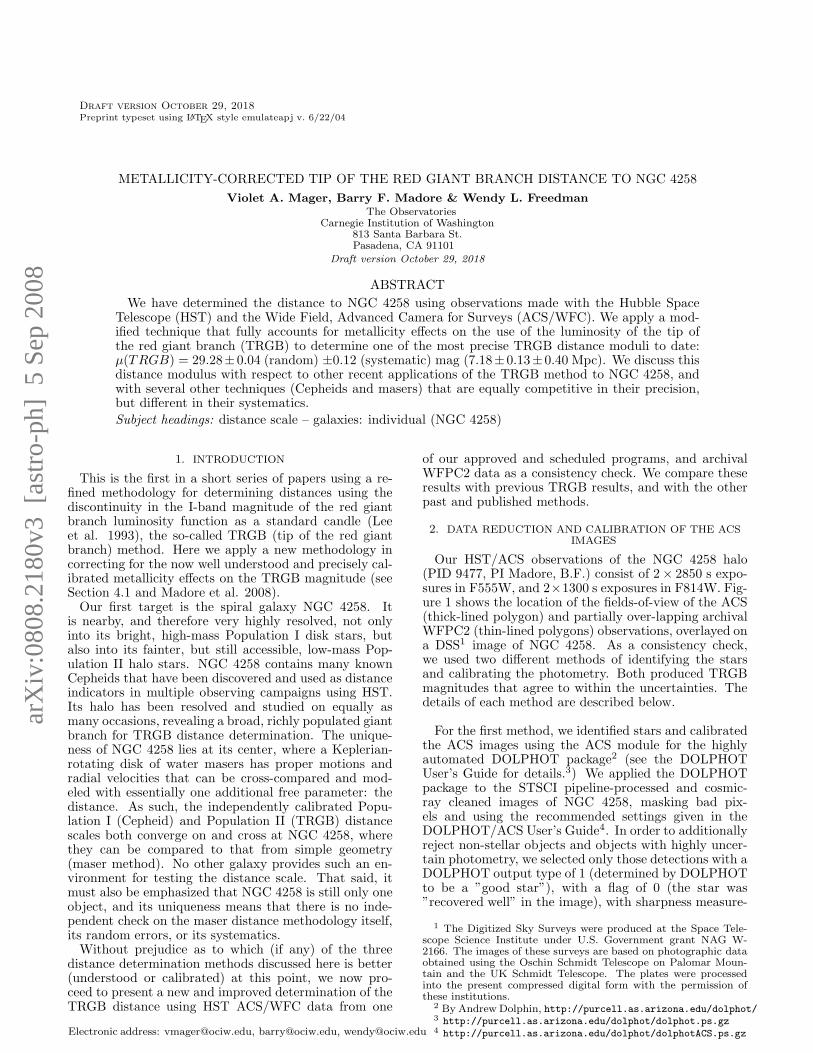
Our HST/ACS observations of the NGC 4258 halo(PID 9477, PI Madore, B.F.) consist of 2× 2850 s expo-sures in F555W, and 2×1300 s exposures in F814W. Fig-ure 1 shows the location of the fields-of-view of the ACS(thick-lined polygon) and partially over-lapping archivalWFPC2 (thin-lined polygons) observations, overlayed ona DSS1 image of NGC 4258. As a consistency check,we used two different methods of identifying the starsand calibrating the photometry. Both produced TRGBmagnitudes that agree to within the uncertainties. Thedetails of each method are described below.
For the first method, we identified stars and calibratedthe ACS images using the ACS module for the highlyautomated DOLPHOT package2 (see the DOLPHOTUser’s Guide for details.3) We applied the DOLPHOTpackage to the STSCI pipeline-processed and cosmic-ray cleaned images of NGC 4258, masking bad pix-els and using the recommended settings given in theDOLPHOT/ACS User’s Guide4. In order to additionallyreject non-stellar objects and objects with highly uncer-tain photometry, we selected only those detections with aDOLPHOT output type of 1 (determined by DOLPHOTto be a ”good star”), with a flag of 0 (the star was”recovered well” in the image), with sharpness measure-
1 The Digitized Sky Surveys were produced at the Space Tele-scope Science Institute under U.S. Government grant NAG W-2166. The images of these surveys are based on photographic dataobtained using the Oschin Schmidt Telescope on Palomar Moun-tain and the UK Schmidt Telescope. The plates were processedinto the present compressed digital form with the permission ofthese institutions.
2 By Andrew Dolphin, http://purcell.as.arizona.edu/dolphot/3 http://purcell.as.arizona.edu/dolphot/dolphot.ps.gz4 http://purcell.as.arizona.edu/dolphot/dolphotACS.ps.gz
2 MAGER, MADORE & FREEDMAN
Fig. 1.— DSS image of NGC 4258 overlayed with the footprints of the HST ACS (thick-lined polygon) and WFPC2 (thin-lined polygons)images used in this analysis. North is up, and east is to the left.
ments of –0.3 to +0.3, and with a crowding parameter< 0.5 mag. We then applied Galactic extinction correc-tions using the E(B–V) reddening measurements givenin the NASA/IPAC Extragalactic Database (NED), andthe total-to-selective absorption ratios (A/E(B–V)) pre-sented in Sirianni et al. (2005).As a consistency check on the photometry, we also used
DAOPHOT II (Stetson 1987) and ALLSTAR (Stetson1994) to independently reduce and analyze the ACS im-ages. We located stars within 5σ of the sky in the F814Wimages, applying sharpness cut-offs determined throughvisual inspection of the results to reject bad pixels andlow surface brightness galaxies, as well as roundness cut-offs to reject bad rows, columns, and highly inclinedgalaxies. Any remaining bad pixels were rejected whenobjects whose PSF-fit photometry could not be deter-mined for both the F814W and the F555W images wereeliminated from our analysis. We rejected most of theremaining non-stellar objects (cosmic rays and/or com-
pact galaxies that coincidentally had PSF’s similar to thestellar PSF) by applying a cut-off limit in the ALLSTARχ measurement (which gives an indication of how goodthe PSF fit was with respect to the other objects in thegroup it was measured in). After visual inspection ofits effects on the color-magnitude diagram (CMD), wechose χV < 2 and χI < 3. Aperture corrections andtransformations of the F555W and F814W magnitudesto Johnson V and I, respectively, were applied followingthe method outlined in Sirianni et al. (2005). We thenapplied the Galactic extinction corrections as describedabove.Method 1 (DOLPHOT) and Method 2 (DAOPHOT
II/ALLSTAR)) both produced consistent photometry atthe brightness level of the TRGB. Our edge-detectionsoftware (as described in Section 4.2) found that theI-band magnitude of the TRGB for both photometrymethods agrees to within 0.04 mag, which is within themeasured uncertainties. However, we note in passing
DISTANCE TO NGC 4258 3
that DOLPHOT went deeper than the 5σ cut-off used inMethod 2, and reported somewhat smaller photometricuncertainties at the tip. As such, we present the pho-tometry from DOLPHOT in all subsequent figures andanalysis of the ACS data.
3. DATA REDUCTION AND CALIBRATION OF THEWFPC2 IMAGES
As a comparison, we downloaded pipeline-calibratedWFPC2 images of the NGC 4258 halo (PID 9086, PIFerguson, H.C.) from the STScI (Space Telescope ScienceInstitute) archive (see Fig. 1 for the location of these ob-servations). These observations include 9 × 1268 s (onaverage) exposures in F606W, and 9 × 1300 s exposuresin F814W. We did not use the smaller field-of-view PCchip in our analysis. We registered the individual imagesof each of the chips in each filter with the IMSHIFT taskin IRAF5, and averaged the images (with cosmic ray re-jection) using IRAF/IMCOMBINE. As with Method 2 forthe ACS data (Section 2), we used DAOPHOT II andALLSTAR to locate stars above 2σ of the sky, and todetermine their PSF-fit magnitudes.We applied transformations and corrections as follows.
The instrumental F606W and F814W magnitudes wereCTE (charge transfer efficiency)-loss corrected, aperturecorrected, and transformed to Johnson V and I magni-tudes (respectively) using the methods outlined in Dol-phin (2000), with the updated 2002 calibration con-stants.6 The WFPC2 first- and second-order color termsare much larger than those for ACS, and required fiveiterations of the transformation equation to converge atthe 0.001 mag level for each star. We further rejectednon-stellar detections by requiring that χV < 0.9 andχI < 1 (see Section 2). Finally, we corrected for Galac-tic extinction using the E(B–V) = 0.016 mag reddeningvalue calculated by NED for the Galactic line of sight toNGC 4258, and transformed to AV = 2.68× E(B–V) andAI = 1.82× E(B–V).
4. MEASURING THE APPARENT MAGNITUDE OF THETRGB
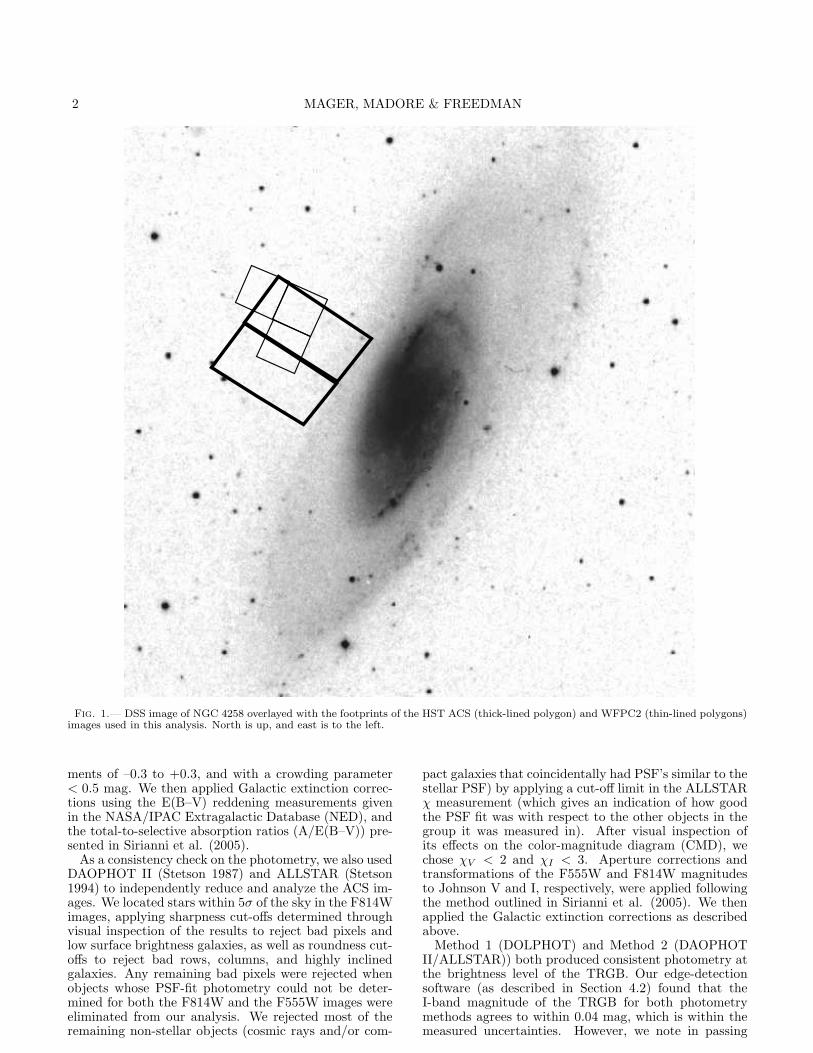
Figure 2 shows the CMD’s for NGC 4258 from theWFPC2 data (left panel) and the ACS data (right panel).The error bar in the lower right corner of each panelrepresents the median uncertainty on the photometry ofthe stars within ±0.3 mag of the location of the TRGB.The comparison of data sets is impressive. It should bementioned, however, that the number of stars detected inWFPC2 may have been improved with less conservativesignal-to-noise cuts in DAOPHOT II, or by using otherreduction packages, such as HSTPHOT.
As can be seen in these figures, there is a readily appar-ent luminosity above which the number density of starsdrops off precipitously. We identify this discontinuitywith the TRGB, which is the result of the core heliumflash of red giant stars occurring at about the same bolo-metric luminosity for stars of all ages & 2 Gyr. TheI-band magnitude of this discontinuity is known to be
5 IRAF is distributed by the National Optical Astronomy Ob-servatories, which are operated by the Association of Universitiesfor Research in Astronomy, Inc., under cooperative agreement withthe National Science Foundation.
6 http://purcell.as.arizona.edu/wfpc2 calib/
only weakly dependent on metallicity for sufficiently lowmetallicities ([Fe/H] . −0.7 dex) (Iben & Renzini 1983;Lee et al. 1993). At higher metallicities, line-blanketingeffects begin to have a more significant effect, and cor-rections have been suggested to take this into account(e.g., Salaris & Cassisi 1998; Bellazzini et al. 2001, 2004;however, see below and Madore et al. 2008 for the latestcalibration). As such, measuring the magnitude of thisnumber-density drop-off, which corresponds to the tip ofthe red giant branch, has proven to be a reliable way offinding the distance modulus of any galaxy that has re-solvable stars which are part of an existing population ofold red giant stars.We now consider the uncertainty in measuring the lo-
cation of the TRGB. The most important factors includerandom photometric errors, sample size, crowding issues,and contamination/confusion caused by asymptotic giantbranch (AGB) stars (Renzini 1992; Madore & Freedman1995). Lee et al. (1993) first introduced a quantitativemethod of measuring the magnitude of the TRGB and itsuncertainty. They used a zero-sum (Sobel) kernel edge-detector [-1, 0, 1] applied to the binned histograms ofthe observed luminosity functions. This filter produces amaximum response at the magnitude where the slope ofthe luminosity profile is largest. However, this method issensitive to random noise spikes in the luminosity func-tion, and will, of course, produce slightly different an-swers depending on the choice of bin size, the starting-point of the histogram, etc. (Madore & Freedman 1995;Sakai et al. 1996). To reduce the impact of noise spikes,Madore & Freedman used a modified version of the Leeet al. edge-detector, with a weighted Sobel filter thatsmoothed the data over 2 bins on either side of the cen-tral bin (i.e., [-1, -2, 0, +2, +1]). Sakai et al. (1996)went a step further, Gaussian-smoothing the luminositydistribution and applying an edge-detection filter to thecontinuous function, thereby avoiding the issues involvedin the discrete binning. Mendez et al (2002) modifiedthis method to take into account the natural power-lawdistribution of the luminosity function, using a logarith-mic ratio in their edge-detection filter instead of the firstderivative. Additionally, they employed a maximum-likelihood analysis as an alternative method of estimatingthe position of the TRGB, with uncertainties being de-rived from bootstrap re-sampling of the data. Mouchineet al. (2005) also used the maximum-likelihood analy-sis and bootstrap re-sampling to find TRGB distancesto several galaxies, including NGC 4258. Other authors(e.g., Cioni et al. 2000; Sarajedini et al. 2002; Frayn& Gilmore 2003; McConnachie et al. 2004; Makarov etal. 2006) have additionally modified these and similartechniques, reducing the contribution of random noisespikes in the luminosity function. Madore et al. (2008)discuss yet another modification to the basic technique,this time aimed at capturing the metallicity-sensitivityof the TRGB itself. A similar methodology is describedand applied below.One problem inherent in all of these methods is that
for some galaxies, the edge-detector can produce multi-ple peaks (some of which are larger than the one at thelocation of the TRGB itself). Choices were then made byeliminating peaks based on a priori knowledge of the gen-eral location of the TRGB. It is most desirable to removethis ambiguity, and develop an algorithm that can pro-
4 MAGER, MADORE & FREEDMAN
Fig. 2.— Color-magnitude diagrams for NGC 4258 from the WFPC2 data (left panel) and the ACS data (right panel). The error bar inthe lower right corner of each panel represents the median uncertainty on the photometry of the stars within ±0.3 mag of the TRGB.
duce a reliable result without added intervention. Forthis analysis, we employ another method of measuringthe magnitude of the TRGB that is robust against ran-dom noise spikes in the luminosity profile, yet does notrely on fitting the data to any adopted model.Uncertainties are introduced in the TRGB distance
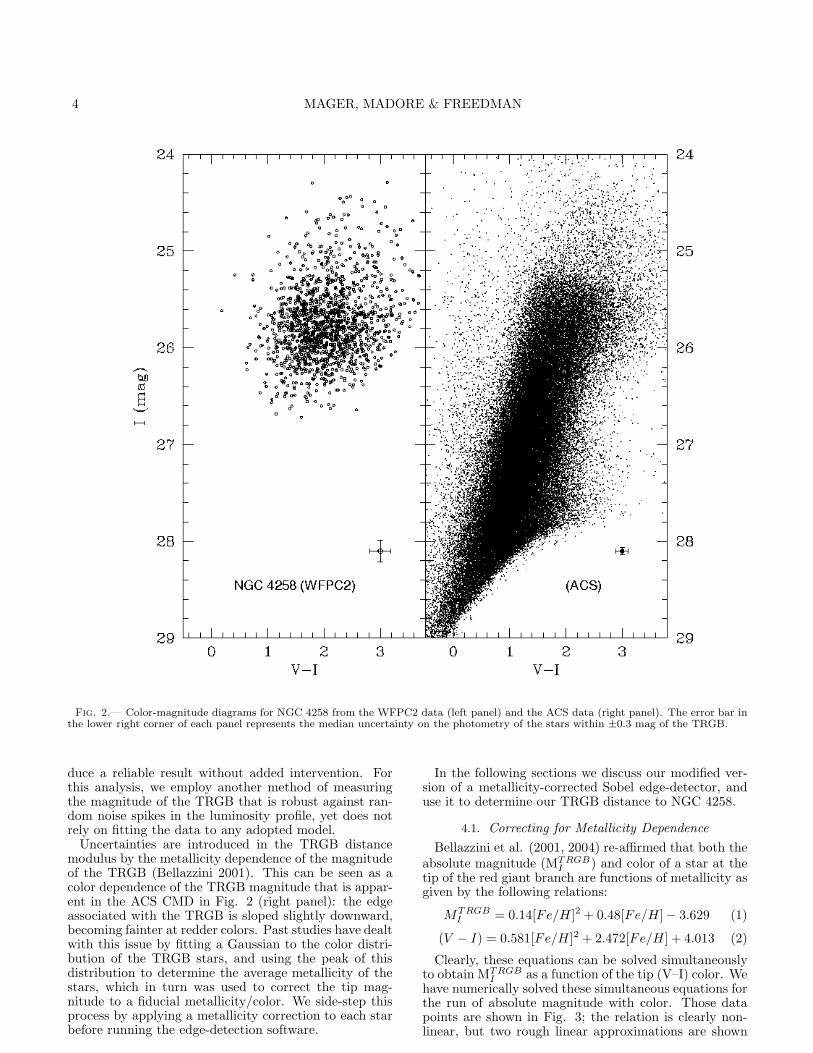
modulus by the metallicity dependence of the magnitudeof the TRGB (Bellazzini 2001). This can be seen as acolor dependence of the TRGB magnitude that is appar-ent in the ACS CMD in Fig. 2 (right panel): the edgeassociated with the TRGB is sloped slightly downward,becoming fainter at redder colors. Past studies have dealtwith this issue by fitting a Gaussian to the color distri-bution of the TRGB stars, and using the peak of thisdistribution to determine the average metallicity of thestars, which in turn was used to correct the tip mag-nitude to a fiducial metallicity/color. We side-step thisprocess by applying a metallicity correction to each starbefore running the edge-detection software.
In the following sections we discuss our modified ver-sion of a metallicity-corrected Sobel edge-detector, anduse it to determine our TRGB distance to NGC 4258.
4.1. Correcting for Metallicity Dependence
Bellazzini et al. (2001, 2004) re-affirmed that both theabsolute magnitude (MTRGB
I) and color of a star at the
tip of the red giant branch are functions of metallicity asgiven by the following relations:
MTRGB
I = 0.14[Fe/H ]2 + 0.48[Fe/H ]− 3.629 (1)
(V − I) = 0.581[Fe/H ]2 + 2.472[Fe/H ] + 4.013 (2)
Clearly, these equations can be solved simultaneouslyto obtain MTRGB
Ias a function of the tip (V–I) color. We
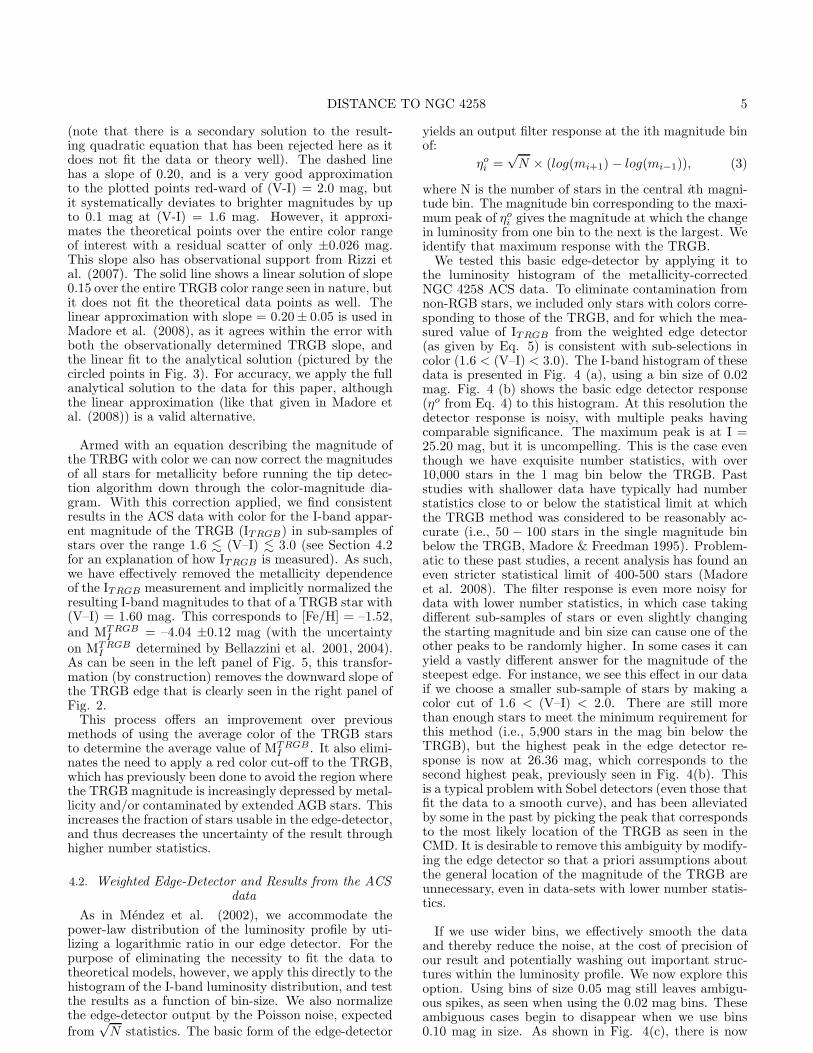
have numerically solved these simultaneous equations forthe run of absolute magnitude with color. Those datapoints are shown in Fig. 3; the relation is clearly non-linear, but two rough linear approximations are shown
DISTANCE TO NGC 4258 5
(note that there is a secondary solution to the result-ing quadratic equation that has been rejected here as itdoes not fit the data or theory well). The dashed linehas a slope of 0.20, and is a very good approximationto the plotted points red-ward of (V-I) = 2.0 mag, butit systematically deviates to brighter magnitudes by upto 0.1 mag at (V-I) = 1.6 mag. However, it approxi-mates the theoretical points over the entire color rangeof interest with a residual scatter of only ±0.026 mag.This slope also has observational support from Rizzi etal. (2007). The solid line shows a linear solution of slope0.15 over the entire TRGB color range seen in nature, butit does not fit the theoretical data points as well. Thelinear approximation with slope = 0.20± 0.05 is used inMadore et al. (2008), as it agrees within the error withboth the observationally determined TRGB slope, andthe linear fit to the analytical solution (pictured by thecircled points in Fig. 3). For accuracy, we apply the fullanalytical solution to the data for this paper, althoughthe linear approximation (like that given in Madore etal. (2008)) is a valid alternative.
Armed with an equation describing the magnitude ofthe TRBG with color we can now correct the magnitudesof all stars for metallicity before running the tip detec-tion algorithm down through the color-magnitude dia-gram. With this correction applied, we find consistentresults in the ACS data with color for the I-band appar-ent magnitude of the TRGB (ITRGB) in sub-samples ofstars over the range 1.6 . (V–I) . 3.0 (see Section 4.2for an explanation of how ITRGB is measured). As such,we have effectively removed the metallicity dependenceof the ITRGB measurement and implicitly normalized theresulting I-band magnitudes to that of a TRGB star with(V–I) = 1.60 mag. This corresponds to [Fe/H] = –1.52,and MTRGB
I= –4.04 ±0.12 mag (with the uncertainty
on MTRGBI
determined by Bellazzini et al. 2001, 2004).As can be seen in the left panel of Fig. 5, this transfor-mation (by construction) removes the downward slope ofthe TRGB edge that is clearly seen in the right panel ofFig. 2.This process offers an improvement over previous
methods of using the average color of the TRGB starsto determine the average value of MTRGB
I. It also elimi-
nates the need to apply a red color cut-off to the TRGB,which has previously been done to avoid the region wherethe TRGB magnitude is increasingly depressed by metal-licity and/or contaminated by extended AGB stars. Thisincreases the fraction of stars usable in the edge-detector,and thus decreases the uncertainty of the result throughhigher number statistics.
4.2. Weighted Edge-Detector and Results from the ACSdata
As in Mendez et al. (2002), we accommodate thepower-law distribution of the luminosity profile by uti-lizing a logarithmic ratio in our edge detector. For thepurpose of eliminating the necessity to fit the data totheoretical models, however, we apply this directly to thehistogram of the I-band luminosity distribution, and testthe results as a function of bin-size. We also normalizethe edge-detector output by the Poisson noise, expectedfrom
√N statistics. The basic form of the edge-detector
yields an output filter response at the ith magnitude binof:
ηoi =√N × (log(mi+1)− log(mi−1)), (3)
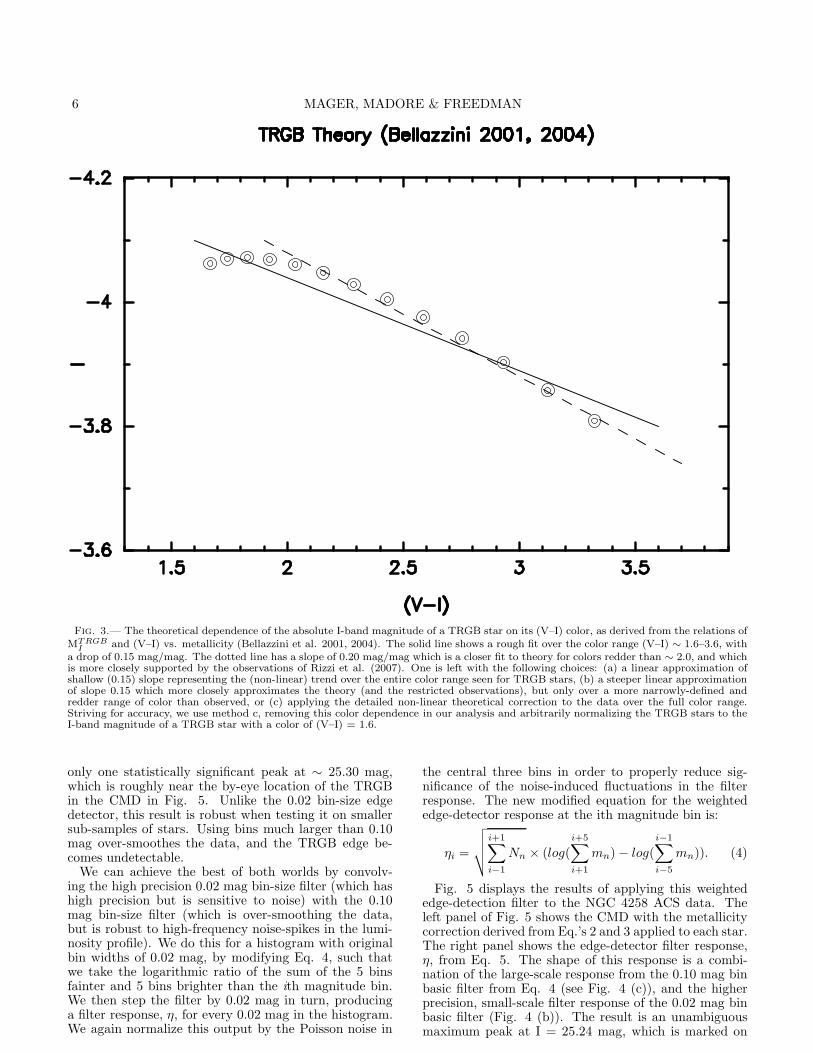
where N is the number of stars in the central ith magni-tude bin. The magnitude bin corresponding to the maxi-mum peak of ηoi gives the magnitude at which the changein luminosity from one bin to the next is the largest. Weidentify that maximum response with the TRGB.We tested this basic edge-detector by applying it to
the luminosity histogram of the metallicity-correctedNGC 4258 ACS data. To eliminate contamination fromnon-RGB stars, we included only stars with colors corre-sponding to those of the TRGB, and for which the mea-sured value of ITRGB from the weighted edge detector(as given by Eq. 5) is consistent with sub-selections incolor (1.6 < (V–I) < 3.0). The I-band histogram of thesedata is presented in Fig. 4 (a), using a bin size of 0.02mag. Fig. 4 (b) shows the basic edge detector response(ηo from Eq. 4) to this histogram. At this resolution thedetector response is noisy, with multiple peaks havingcomparable significance. The maximum peak is at I =25.20 mag, but it is uncompelling. This is the case eventhough we have exquisite number statistics, with over10,000 stars in the 1 mag bin below the TRGB. Paststudies with shallower data have typically had numberstatistics close to or below the statistical limit at whichthe TRGB method was considered to be reasonably ac-curate (i.e., 50 − 100 stars in the single magnitude binbelow the TRGB, Madore & Freedman 1995). Problem-atic to these past studies, a recent analysis has found aneven stricter statistical limit of 400-500 stars (Madoreet al. 2008). The filter response is even more noisy fordata with lower number statistics, in which case takingdifferent sub-samples of stars or even slightly changingthe starting magnitude and bin size can cause one of theother peaks to be randomly higher. In some cases it canyield a vastly different answer for the magnitude of thesteepest edge. For instance, we see this effect in our dataif we choose a smaller sub-sample of stars by making acolor cut of 1.6 < (V–I) < 2.0. There are still morethan enough stars to meet the minimum requirement forthis method (i.e., 5,900 stars in the mag bin below theTRGB), but the highest peak in the edge detector re-sponse is now at 26.36 mag, which corresponds to thesecond highest peak, previously seen in Fig. 4(b). Thisis a typical problem with Sobel detectors (even those thatfit the data to a smooth curve), and has been alleviatedby some in the past by picking the peak that correspondsto the most likely location of the TRGB as seen in theCMD. It is desirable to remove this ambiguity by modify-ing the edge detector so that a priori assumptions aboutthe general location of the magnitude of the TRGB areunnecessary, even in data-sets with lower number statis-tics.
If we use wider bins, we effectively smooth the dataand thereby reduce the noise, at the cost of precision ofour result and potentially washing out important struc-tures within the luminosity profile. We now explore thisoption. Using bins of size 0.05 mag still leaves ambigu-ous spikes, as seen when using the 0.02 mag bins. Theseambiguous cases begin to disappear when we use bins0.10 mag in size. As shown in Fig. 4(c), there is now
6 MAGER, MADORE & FREEDMAN
Fig. 3.— The theoretical dependence of the absolute I-band magnitude of a TRGB star on its (V–I) color, as derived from the relations ofMTRGB
Iand (V–I) vs. metallicity (Bellazzini et al. 2001, 2004). The solid line shows a rough fit over the color range (V–I) ∼ 1.6–3.6, with
a drop of 0.15 mag/mag. The dotted line has a slope of 0.20 mag/mag which is a closer fit to theory for colors redder than ∼ 2.0, and whichis more closely supported by the observations of Rizzi et al. (2007). One is left with the following choices: (a) a linear approximation ofshallow (0.15) slope representing the (non-linear) trend over the entire color range seen for TRGB stars, (b) a steeper linear approximationof slope 0.15 which more closely approximates the theory (and the restricted observations), but only over a more narrowly-defined andredder range of color than observed, or (c) applying the detailed non-linear theoretical correction to the data over the full color range.Striving for accuracy, we use method c, removing this color dependence in our analysis and arbitrarily normalizing the TRGB stars to theI-band magnitude of a TRGB star with a color of (V–I) = 1.6.
only one statistically significant peak at ∼ 25.30 mag,which is roughly near the by-eye location of the TRGBin the CMD in Fig. 5. Unlike the 0.02 bin-size edgedetector, this result is robust when testing it on smallersub-samples of stars. Using bins much larger than 0.10mag over-smoothes the data, and the TRGB edge be-comes undetectable.We can achieve the best of both worlds by convolv-
ing the high precision 0.02 mag bin-size filter (which hashigh precision but is sensitive to noise) with the 0.10mag bin-size filter (which is over-smoothing the data,but is robust to high-frequency noise-spikes in the lumi-nosity profile). We do this for a histogram with originalbin widths of 0.02 mag, by modifying Eq. 4, such thatwe take the logarithmic ratio of the sum of the 5 binsfainter and 5 bins brighter than the ith magnitude bin.We then step the filter by 0.02 mag in turn, producinga filter response, η, for every 0.02 mag in the histogram.We again normalize this output by the Poisson noise in
the central three bins in order to properly reduce sig-nificance of the noise-induced fluctuations in the filterresponse. The new modified equation for the weightededge-detector response at the ith magnitude bin is:
ηi =
√
√
√
√
i+1∑
i−1
Nn × (log(i+5∑
i+1
mn)− log(i−1∑
i−5
mn)). (4)
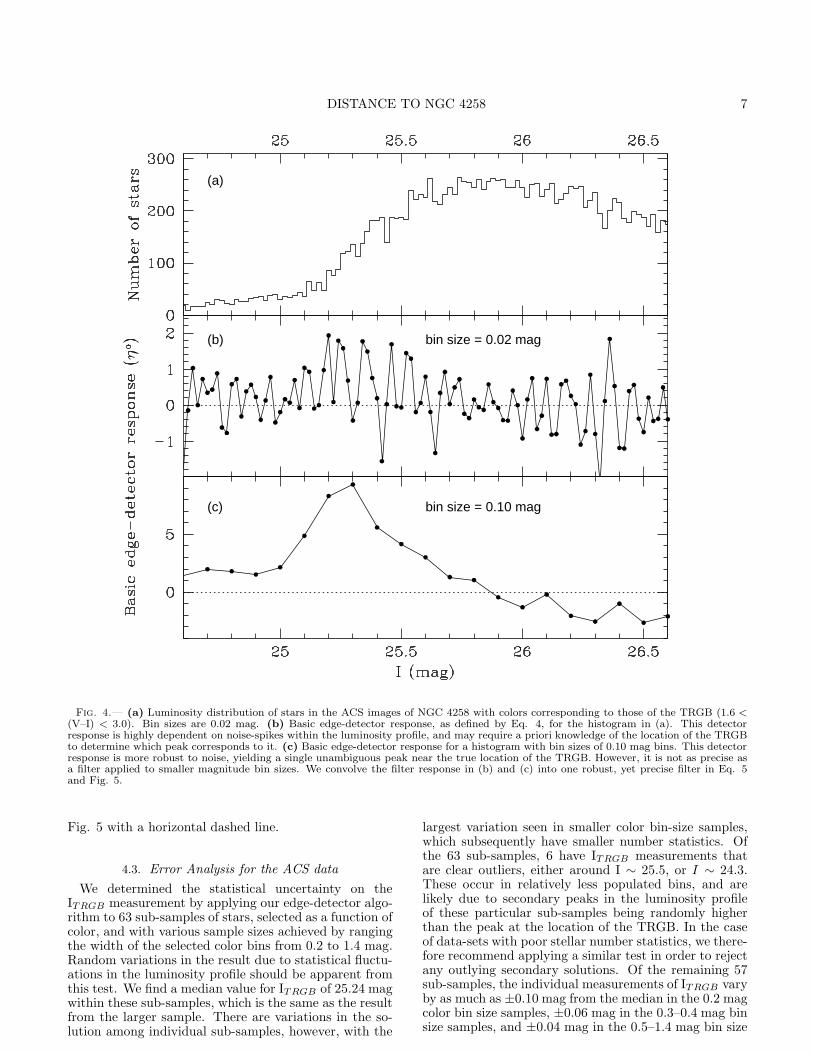
Fig. 5 displays the results of applying this weightededge-detection filter to the NGC 4258 ACS data. Theleft panel of Fig. 5 shows the CMD with the metallicitycorrection derived from Eq.’s 2 and 3 applied to each star.The right panel shows the edge-detector filter response,η, from Eq. 5. The shape of this response is a combi-nation of the large-scale response from the 0.10 mag binbasic filter from Eq. 4 (see Fig. 4 (c)), and the higherprecision, small-scale filter response of the 0.02 mag binbasic filter (Fig. 4 (b)). The result is an unambiguousmaximum peak at I = 25.24 mag, which is marked on
DISTANCE TO NGC 4258 7
(a)
bin size = 0.02 mag(b)
bin size = 0.10 mag(c)
Fig. 4.— (a) Luminosity distribution of stars in the ACS images of NGC 4258 with colors corresponding to those of the TRGB (1.6 <
(V–I) < 3.0). Bin sizes are 0.02 mag. (b) Basic edge-detector response, as defined by Eq. 4, for the histogram in (a). This detectorresponse is highly dependent on noise-spikes within the luminosity profile, and may require a priori knowledge of the location of the TRGBto determine which peak corresponds to it. (c) Basic edge-detector response for a histogram with bin sizes of 0.10 mag bins. This detectorresponse is more robust to noise, yielding a single unambiguous peak near the true location of the TRGB. However, it is not as precise asa filter applied to smaller magnitude bin sizes. We convolve the filter response in (b) and (c) into one robust, yet precise filter in Eq. 5and Fig. 5.
Fig. 5 with a horizontal dashed line.
4.3. Error Analysis for the ACS data
We determined the statistical uncertainty on theITRGB measurement by applying our edge-detector algo-rithm to 63 sub-samples of stars, selected as a function ofcolor, and with various sample sizes achieved by rangingthe width of the selected color bins from 0.2 to 1.4 mag.Random variations in the result due to statistical fluctu-ations in the luminosity profile should be apparent fromthis test. We find a median value for ITRGB of 25.24 magwithin these sub-samples, which is the same as the resultfrom the larger sample. There are variations in the so-lution among individual sub-samples, however, with the
largest variation seen in smaller color bin-size samples,which subsequently have smaller number statistics. Ofthe 63 sub-samples, 6 have ITRGB measurements thatare clear outliers, either around I ∼ 25.5, or I ∼ 24.3.These occur in relatively less populated bins, and arelikely due to secondary peaks in the luminosity profileof these particular sub-samples being randomly higherthan the peak at the location of the TRGB. In the caseof data-sets with poor stellar number statistics, we there-fore recommend applying a similar test in order to rejectany outlying secondary solutions. Of the remaining 57sub-samples, the individual measurements of ITRGB varyby as much as ±0.10 mag from the median in the 0.2 magcolor bin size samples, ±0.06 mag in the 0.3–0.4 mag binsize samples, and ±0.04 mag in the 0.5–1.4 mag bin size
8 MAGER, MADORE & FREEDMAN
Fig. 5.— Left: The CMD from the NGC 4258 ACS data after applying the TRGB metallicity correction to each star (as derived fromEq.’s 2 and 3). Right: The value of the edge-detector response (η) from Eq. 5. The maximum peak of η gives our measured apparentmagnitude of the TRGB, which is marked by the dashed horizontal line in both panels.
samples. For our measurement of ITRGB from the largestsample (1.6 < (V–I) < 3.0), we adopt an uncertainty cor-responding to the range of values achieved in the largersub-samples, giving ITRGB = 25.24± 0.04 mag.Systematic errors also contribute to the uncertainty of
ITRGB. One such possible error source is stellar crowd-ing, which can lead to systematically brighter measure-ments for the TRGB (Madore & Freedman (1995)). Totest the effects of crowding on our results, we applied ourweighted edge detector to three separate sections of bothchips in the ACS images, each with a different densityof stars based on its proximity to the disk of the galaxy.The detected edge in each of these image sections variedwithin the statistical uncertainty of the detector (±0.04mag), and did not show any trend with increasing stellardensity. Therefore, we conclude that crowding does nothave a significant systematic effect in this ACS field.
4.4. Results from the WFPC2 Data
As a consistency check, we also applied our weightededge-detector to the WFPC2 images of NGC 4258, pro-viding a direct comparison of our measured TRGB ap-parent magnitude to that of Mouhcine et al. (2005) fromthe same data set. As evident in Fig. 1, the WFPC2 ob-servations spatially overlap with the ACS observations,and thus sample largely the same population of halostars. As can be seen in Fig. 2, however, there are farfewer stars detected in the WFPC2 images than the ACSimages (mostly due to the superior sensitivity of the ACSdetector). As such, the WFPC2 data will provide us withan indication of the applicability of our edge-detector todata with lower number statistics. Even so, the WFPC2images still exceed the minimum requirements for a re-liable measurement of the TRGB magnitude (Madore &Freedman 1995, Madore et al. 2008), with slightly lessthan 1000 stars in the 1 mag-width bin brighter than
DISTANCE TO NGC 4258 9
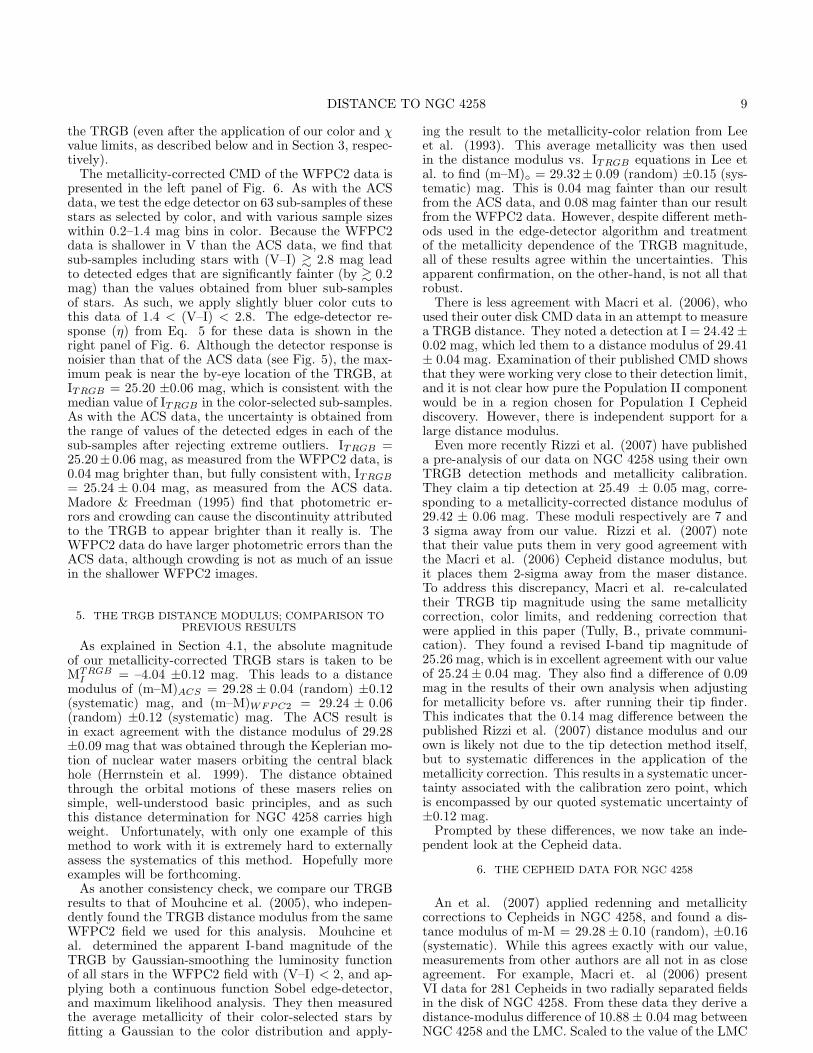
the TRGB (even after the application of our color and χvalue limits, as described below and in Section 3, respec-tively).The metallicity-corrected CMD of the WFPC2 data is
presented in the left panel of Fig. 6. As with the ACSdata, we test the edge detector on 63 sub-samples of thesestars as selected by color, and with various sample sizeswithin 0.2–1.4 mag bins in color. Because the WFPC2data is shallower in V than the ACS data, we find thatsub-samples including stars with (V–I) & 2.8 mag leadto detected edges that are significantly fainter (by & 0.2mag) than the values obtained from bluer sub-samplesof stars. As such, we apply slightly bluer color cuts tothis data of 1.4 < (V–I) < 2.8. The edge-detector re-sponse (η) from Eq. 5 for these data is shown in theright panel of Fig. 6. Although the detector response isnoisier than that of the ACS data (see Fig. 5), the max-imum peak is near the by-eye location of the TRGB, atITRGB = 25.20 ±0.06 mag, which is consistent with themedian value of ITRGB in the color-selected sub-samples.As with the ACS data, the uncertainty is obtained fromthe range of values of the detected edges in each of thesub-samples after rejecting extreme outliers. ITRGB =25.20± 0.06 mag, as measured from the WFPC2 data, is0.04 mag brighter than, but fully consistent with, ITRGB
= 25.24 ± 0.04 mag, as measured from the ACS data.Madore & Freedman (1995) find that photometric er-rors and crowding can cause the discontinuity attributedto the TRGB to appear brighter than it really is. TheWFPC2 data do have larger photometric errors than theACS data, although crowding is not as much of an issuein the shallower WFPC2 images.
5. THE TRGB DISTANCE MODULUS; COMPARISON TOPREVIOUS RESULTS
As explained in Section 4.1, the absolute magnitudeof our metallicity-corrected TRGB stars is taken to beMTRGB
I= –4.04 ±0.12 mag. This leads to a distance
modulus of (m–M)ACS = 29.28 ± 0.04 (random) ±0.12(systematic) mag, and (m–M)WFPC2 = 29.24 ± 0.06(random) ±0.12 (systematic) mag. The ACS result isin exact agreement with the distance modulus of 29.28±0.09 mag that was obtained through the Keplerian mo-tion of nuclear water masers orbiting the central blackhole (Herrnstein et al. 1999). The distance obtainedthrough the orbital motions of these masers relies onsimple, well-understood basic principles, and as suchthis distance determination for NGC 4258 carries highweight. Unfortunately, with only one example of thismethod to work with it is extremely hard to externallyassess the systematics of this method. Hopefully moreexamples will be forthcoming.As another consistency check, we compare our TRGB
results to that of Mouhcine et al. (2005), who indepen-dently found the TRGB distance modulus from the sameWFPC2 field we used for this analysis. Mouhcine etal. determined the apparent I-band magnitude of theTRGB by Gaussian-smoothing the luminosity functionof all stars in the WFPC2 field with (V–I) < 2, and ap-plying both a continuous function Sobel edge-detector,and maximum likelihood analysis. They then measuredthe average metallicity of their color-selected stars byfitting a Gaussian to the color distribution and apply-
ing the result to the metallicity-color relation from Leeet al. (1993). This average metallicity was then usedin the distance modulus vs. ITRGB equations in Lee etal. to find (m–M)◦ = 29.32± 0.09 (random) ±0.15 (sys-tematic) mag. This is 0.04 mag fainter than our resultfrom the ACS data, and 0.08 mag fainter than our resultfrom the WFPC2 data. However, despite different meth-ods used in the edge-detector algorithm and treatmentof the metallicity dependence of the TRGB magnitude,all of these results agree within the uncertainties. Thisapparent confirmation, on the other-hand, is not all thatrobust.There is less agreement with Macri et al. (2006), who
used their outer disk CMD data in an attempt to measurea TRGB distance. They noted a detection at I = 24.42 ±0.02 mag, which led them to a distance modulus of 29.41± 0.04 mag. Examination of their published CMD showsthat they were working very close to their detection limit,and it is not clear how pure the Population II componentwould be in a region chosen for Population I Cepheiddiscovery. However, there is independent support for alarge distance modulus.Even more recently Rizzi et al. (2007) have published
a pre-analysis of our data on NGC 4258 using their ownTRGB detection methods and metallicity calibration.They claim a tip detection at 25.49 ± 0.05 mag, corre-sponding to a metallicity-corrected distance modulus of29.42 ± 0.06 mag. These moduli respectively are 7 and3 sigma away from our value. Rizzi et al. (2007) notethat their value puts them in very good agreement withthe Macri et al. (2006) Cepheid distance modulus, butit places them 2-sigma away from the maser distance.To address this discrepancy, Macri et al. re-calculatedtheir TRGB tip magnitude using the same metallicitycorrection, color limits, and reddening correction thatwere applied in this paper (Tully, B., private communi-cation). They found a revised I-band tip magnitude of25.26 mag, which is in excellent agreement with our valueof 25.24± 0.04 mag. They also find a difference of 0.09mag in the results of their own analysis when adjustingfor metallicity before vs. after running their tip finder.This indicates that the 0.14 mag difference between thepublished Rizzi et al. (2007) distance modulus and ourown is likely not due to the tip detection method itself,but to systematic differences in the application of themetallicity correction. This results in a systematic uncer-tainty associated with the calibration zero point, whichis encompassed by our quoted systematic uncertainty of±0.12 mag.Prompted by these differences, we now take an inde-
pendent look at the Cepheid data.
6. THE CEPHEID DATA FOR NGC 4258
An et al. (2007) applied redenning and metallicitycorrections to Cepheids in NGC 4258, and found a dis-tance modulus of m-M = 29.28 ± 0.10 (random), ±0.16(systematic). While this agrees exactly with our value,measurements from other authors are all not in as closeagreement. For example, Macri et. al (2006) presentVI data for 281 Cepheids in two radially separated fieldsin the disk of NGC 4258. From these data they derive adistance-modulus difference of 10.88 ± 0.04 mag betweenNGC 4258 and the LMC. Scaled to the value of the LMC
10 MAGER, MADORE & FREEDMAN
Fig. 6.— Left: The CMD from the NGC 4258 WFPC2 data after applying the TRGB metallicity correction to each star (as derivedfrom Eq.’s 2 and 3). Right: The value of the edge-detector response (η) from Eq. 5. The maximum peak of η gives our measured apparentmagnitude of the TRGB, which is marked by the dashed horizontal line in both panels. This agrees with the result from the ACS datawithin the uncertainties.
distance modulus (18.50 mag) adopted by the HST KeyProject (Freedman et al. 2001) this corresponds to a dis-tance modulus of 29.38 mag for NGC 4258. How robustis this number?
So as to be totally consistent with the Key Project zeropoints and methodology we restrict ourselves to Cepheidsin NGC 4258 that have periods in excess of 10 days. Thishas the added advantage of using stars with the highestsignal to noise, and implicitly avoiding other issues con-cerning the putative change in slope of the PL (period-luminosity) relation below 10 days, and the possible con-tamination of the data set by over-tone pulsators thatare also only found below 10 days in period.Using those restricted samples of Cepheids in each of
the two radial fields, and the method described in Freed-man et al. (1994), we find the following:
Outer Field: µV = 29.80± 0.10, µI = 29.66± 0.06Inner Field: µV = 29.84± 0.04, µI = 29.60± 0.03The very first thing to notice is that the apparent mod-
uli for these two distinct fields in both bands are sta-tistically the same to within one sigma of each other.However, there are slight differences, and these in turngive rise to systematic differences in the formally derivedreddenings for each of the two fields: the Inner FieldCepheids have a mean reddening of E(V −I) = 0.24 magwhile the Outer Field Cepheids have a calculated meanreddening of E(V − I) = 0.14 mag. These differencesin reddening get further multiplied up (by the ratio oftotal-to-selective absorption) yielding systematic differ-ences in the extinction: AV (inner) = 0.58 mag andAV (outer) = 0.34 mag. Ultimately the two extinction-corrected (true) moduli become:Outer: µ◦ = 29.45± 0.08
DISTANCE TO NGC 4258 11
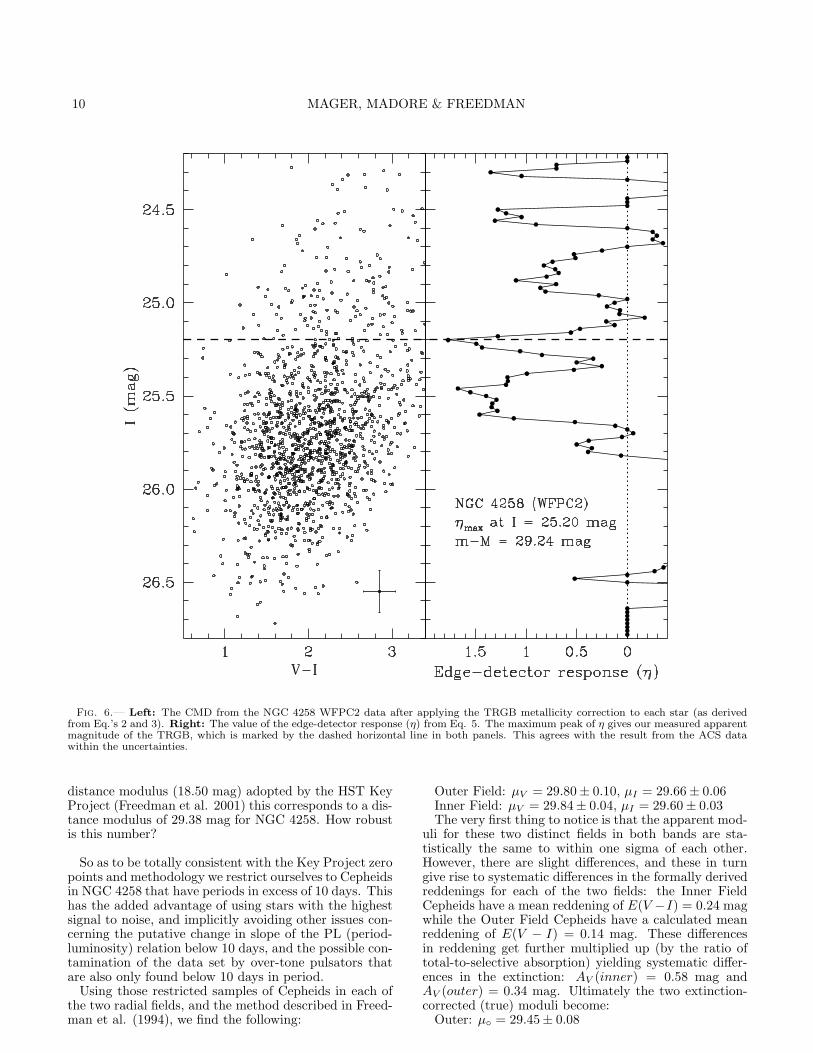
Fig. 7.— The V-band PL relation for all long-period (P > 10 d) Cepheids in NGC 4258 using data from Macri et al. (2006). Smallsymbols are for Cepheids in the inner field; large symbols track the Cepheids in the outer field. The solid line represents the expectedtrend from calibrations, with the dotted lines marking the 2-σ variation from this trend (Madore & Freedman 1991). Note the significantlysmaller scatter of the larger symbols with respect to the expected range.
Inner: µ◦ = 29.26± 0.03This difference represents a 2-sigma significance of sep-aration amounting to about 0.2 mag. The presumptiveinterpretation is that this difference is due to metallicitydifferences between the inner and outer field Cepheids.There are, however, other possible interpretations of thedata. The first is that the reddening law may be dif-ferent between the two fields. The second is that smallnumber statistics have generated the difference. That is,for the small sample of stars in the outer field we justgot (un)lucky. We offer up evidence in support of thatpossibility below.First we set aside the possibility of systematically
changing the reddening law for a different paper. Theimplications of changing the reddening law from galaxyto galaxy, or from place to place within a given galaxyare too far-reaching for us to give it the necessary atten-tion in this paper. Suffice it to say that if the canonicalvalue of RV I ≃ 2.4 is adopted for the inner field, thetwo moduli can be made to agree if RV I ≃ 4.0 in theouter field. The second possibility is easy to consider,
and it has few consequences beyond this particular ap-plication. It is also motivated by our earlier observationthat the apparent moduli in the two fields were statisti-cally identical but systematically diverged as reddeningcorrections were derived and applied.To shed some light on the possibility that there may
be no real differences in the two Cepheid populations,we now merge the two data sets and invite the readerto inspect and consider the results. In Figures 7 and8 we show the apparent V and I-band PL relations forthe Cepheids in NGC 4258; the large filled circles arethe Cepheids in the outer field, and the more abundantsmaller filled circles are Cepheids in the inner field. Hadthere been no differences in the symbols the inner andouter-field Cepheids would be inseparable. That is, theouter-field Cepheids would fall entirely within the knownbounds of the fiducial PL relation instability strip; butthey do not fill the strip. This latter point is important.Because the outer Cepheids do not fully sample the strip,their mean is suspect and may well be biased. The widthof the instability strip that these particular Cepheids de-
12 MAGER, MADORE & FREEDMAN
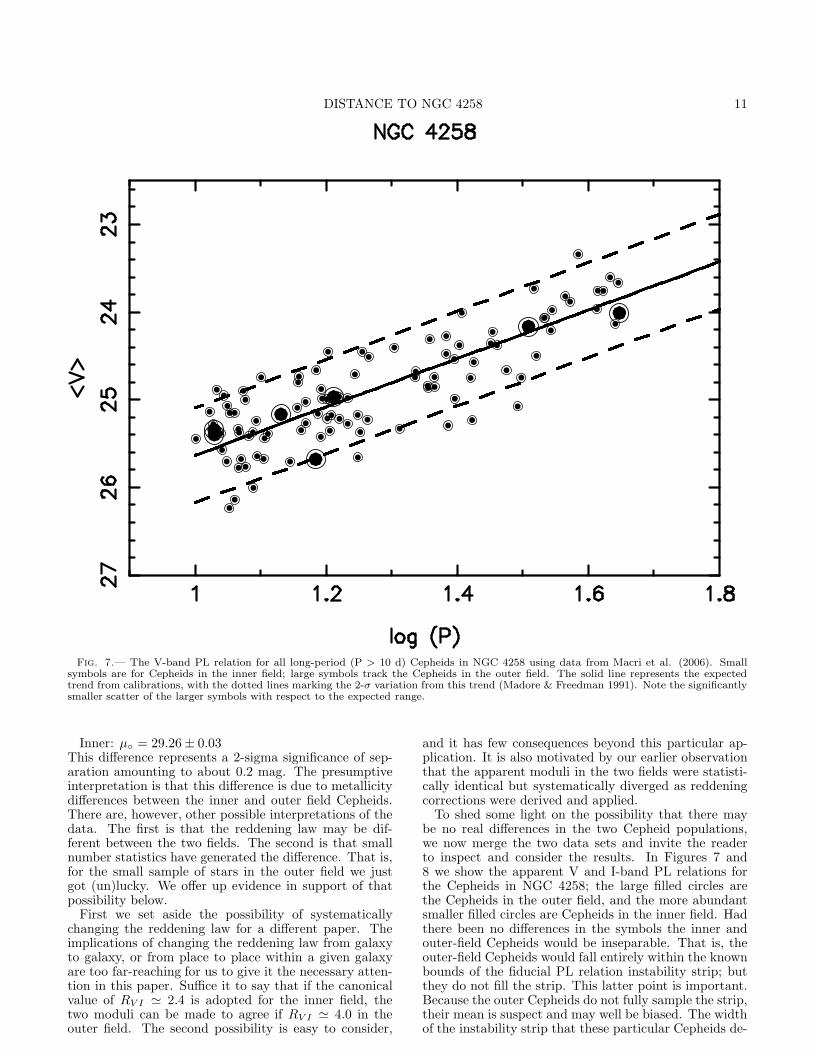
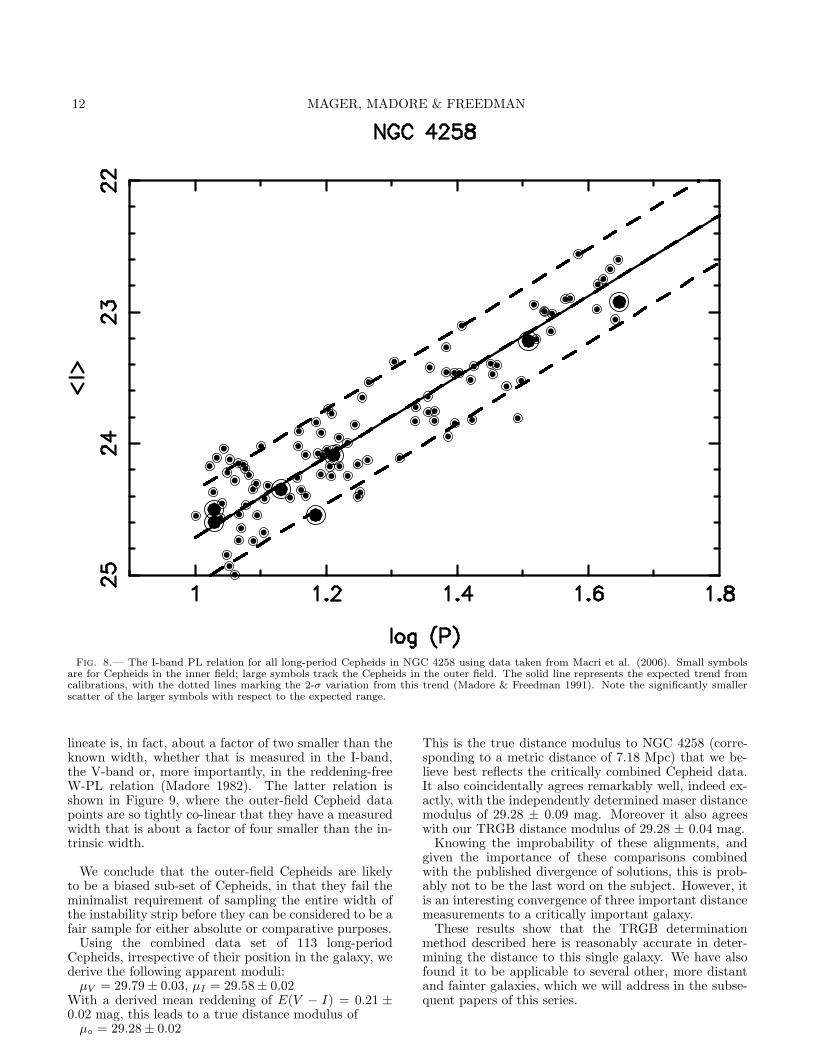
Fig. 8.— The I-band PL relation for all long-period Cepheids in NGC 4258 using data taken from Macri et al. (2006). Small symbolsare for Cepheids in the inner field; large symbols track the Cepheids in the outer field. The solid line represents the expected trend fromcalibrations, with the dotted lines marking the 2-σ variation from this trend (Madore & Freedman 1991). Note the significantly smallerscatter of the larger symbols with respect to the expected range.
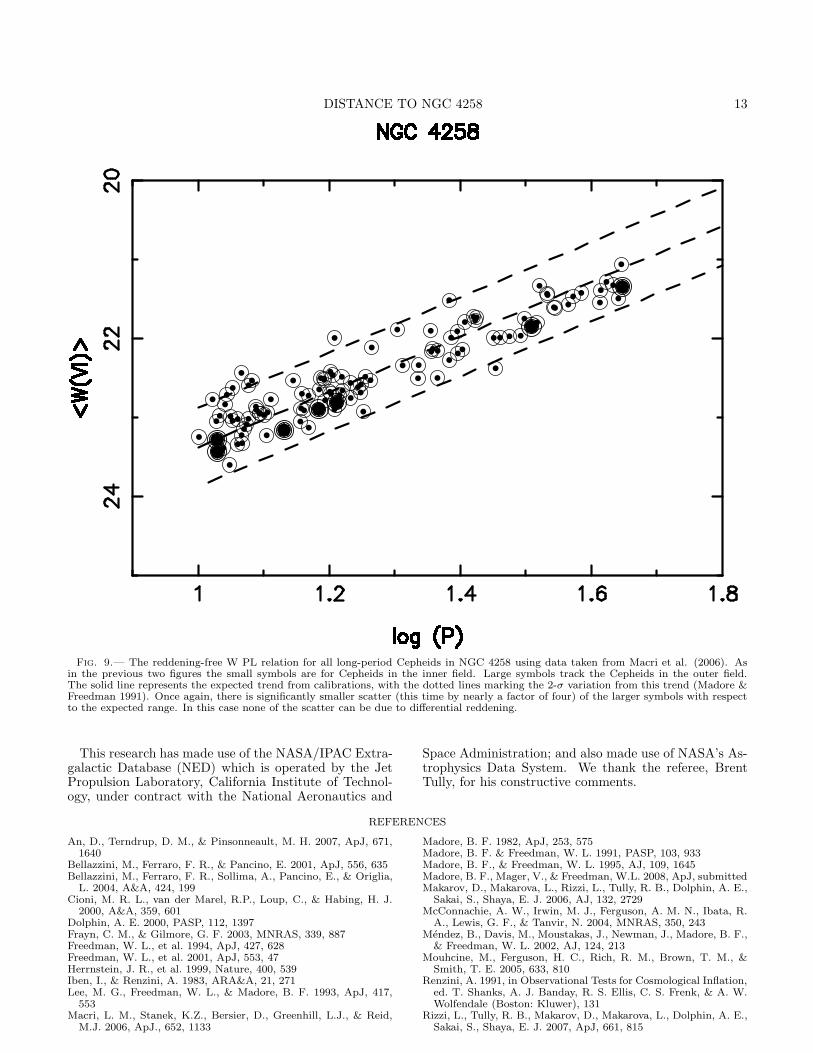
lineate is, in fact, about a factor of two smaller than theknown width, whether that is measured in the I-band,the V-band or, more importantly, in the reddening-freeW-PL relation (Madore 1982). The latter relation isshown in Figure 9, where the outer-field Cepheid datapoints are so tightly co-linear that they have a measuredwidth that is about a factor of four smaller than the in-trinsic width.
We conclude that the outer-field Cepheids are likelyto be a biased sub-set of Cepheids, in that they fail theminimalist requirement of sampling the entire width ofthe instability strip before they can be considered to be afair sample for either absolute or comparative purposes.Using the combined data set of 113 long-period
Cepheids, irrespective of their position in the galaxy, wederive the following apparent moduli:µV = 29.79± 0.03, µI = 29.58± 0.02
With a derived mean reddening of E(V − I) = 0.21 ±0.02 mag, this leads to a true distance modulus ofµ◦ = 29.28± 0.02
This is the true distance modulus to NGC 4258 (corre-sponding to a metric distance of 7.18 Mpc) that we be-lieve best reflects the critically combined Cepheid data.It also coincidentally agrees remarkably well, indeed ex-actly, with the independently determined maser distancemodulus of 29.28 ± 0.09 mag. Moreover it also agreeswith our TRGB distance modulus of 29.28 ± 0.04 mag.Knowing the improbability of these alignments, and
given the importance of these comparisons combinedwith the published divergence of solutions, this is prob-ably not to be the last word on the subject. However, itis an interesting convergence of three important distancemeasurements to a critically important galaxy.These results show that the TRGB determination
method described here is reasonably accurate in deter-mining the distance to this single galaxy. We have alsofound it to be applicable to several other, more distantand fainter galaxies, which we will address in the subse-quent papers of this series.
DISTANCE TO NGC 4258 13
Fig. 9.— The reddening-free W PL relation for all long-period Cepheids in NGC 4258 using data taken from Macri et al. (2006). Asin the previous two figures the small symbols are for Cepheids in the inner field. Large symbols track the Cepheids in the outer field.The solid line represents the expected trend from calibrations, with the dotted lines marking the 2-σ variation from this trend (Madore &Freedman 1991). Once again, there is significantly smaller scatter (this time by nearly a factor of four) of the larger symbols with respectto the expected range. In this case none of the scatter can be due to differential reddening.
This research has made use of the NASA/IPAC Extra-galactic Database (NED) which is operated by the JetPropulsion Laboratory, California Institute of Technol-ogy, under contract with the National Aeronautics and
Space Administration; and also made use of NASA’s As-trophysics Data System. We thank the referee, BrentTully, for his constructive comments.
REFERENCES
An, D., Terndrup, D. M., & Pinsonneault, M. H. 2007, ApJ, 671,1640
Bellazzini, M., Ferraro, F. R., & Pancino, E. 2001, ApJ, 556, 635Bellazzini, M., Ferraro, F. R., Sollima, A., Pancino, E., & Origlia,
L. 2004, A&A, 424, 199Cioni, M. R. L., van der Marel, R.P., Loup, C., & Habing, H. J.
2000, A&A, 359, 601Dolphin, A. E. 2000, PASP, 112, 1397Frayn, C. M., & Gilmore, G. F. 2003, MNRAS, 339, 887Freedman, W. L., et al. 1994, ApJ, 427, 628Freedman, W. L., et al. 2001, ApJ, 553, 47Herrnstein, J. R., et al. 1999, Nature, 400, 539Iben, I., & Renzini, A. 1983, ARA&A, 21, 271Lee, M. G., Freedman, W. L., & Madore, B. F. 1993, ApJ, 417,
553Macri, L. M., Stanek, K.Z., Bersier, D., Greenhill, L.J., & Reid,
M.J. 2006, ApJ., 652, 1133
Madore, B. F. 1982, ApJ, 253, 575Madore, B. F. & Freedman, W. L. 1991, PASP, 103, 933Madore, B. F., & Freedman, W. L. 1995, AJ, 109, 1645Madore, B. F., Mager, V., & Freedman, W.L. 2008, ApJ, submittedMakarov, D., Makarova, L., Rizzi, L., Tully, R. B., Dolphin, A. E.,
Sakai, S., Shaya, E. J. 2006, AJ, 132, 2729McConnachie, A. W., Irwin, M. J., Ferguson, A. M. N., Ibata, R.
A., Lewis, G. F., & Tanvir, N. 2004, MNRAS, 350, 243Mendez, B., Davis, M., Moustakas, J., Newman, J., Madore, B. F.,
& Freedman, W. L. 2002, AJ, 124, 213Mouhcine, M., Ferguson, H. C., Rich, R. M., Brown, T. M., &
Smith, T. E. 2005, 633, 810Renzini, A. 1991, in Observational Tests for Cosmological Inflation,
ed. T. Shanks, A. J. Banday, R. S. Ellis, C. S. Frenk, & A. W.Wolfendale (Boston: Kluwer), 131
Rizzi, L., Tully, R. B., Makarov, D., Makarova, L., Dolphin, A. E.,Sakai, S., Shaya, E. J. 2007, ApJ, 661, 815

14 MAGER, MADORE & FREEDMAN
Sakai, S., Madore, B. F., & Freedman, W. L. 1996, 461, 713Salaris, M., & Cassisi, S. 1998, MNRAS, 298, 166Sarajedini, A., et al. 2002, ApJ, 567, 915Sirianni, M., et al. 2005, PASP, 117, 1049
Stetson, P. B. 1987, PASP, 99, 191Stetson, P. B. 1994, PASP, 106, 250