Embed Size (px)
Citation preview

arX
iv:1
303.
3321
v1 [
astr
o-ph
.SR
] 1
4 M
ar 2
013
Accepted by ApJ, March 04, 2013Preprint typeset using LATEX style emulateapj v. 5/2/11
PLASMOID EJECTIONS AND LOOP CONTRACTIONS IN AN ERUPTIVE M7.7 SOLAR FLARE: EVIDENCEOF PARTICLE ACCELERATION AND HEATING IN MAGNETIC RECONNECTION OUTFLOWS
Wei Liu1,2, Qingrong Chen3, Vahe Petrosian3
Accepted by ApJ, March 04, 2013
ABSTRACT
Where particle acceleration and plasma heating take place in relation to magnetic reconnection is afundamental question for solar flares. We report analysis of an M7.7 flare on 2012 July 19 observed bySDO/AIA and RHESSI. Bi-directional outflows in forms of plasmoid ejections and contracting cusp-shaped loops originate between an erupting flux rope and underlying flare loops at speeds of typically200–300 kms−1 up to 1050 kms−1. These outflows are associated with spatially separated doublecoronal X-ray sources with centroid separation decreasing with energy. The highest temperatureis located near the nonthermal X-ray loop-top source well below the original heights of contractingcusps near the inferred reconnection site. These observations suggest that the primary loci of particleacceleration and plasma heating are in the reconnection outflow regions, rather than the reconnectionsite itself. In addition, there is an initial ascent of the X-ray and EUV loop-top source prior to itsrecently recognized descent, which we ascribe to the interplay among multiple processes includingthe upward development of reconnection and the downward contractions of reconnected loops. Theimpulsive phase onset is delayed by 10 minutes from the start of the descent, but coincides with therapid speed increases of the upward plasmoids, the individual loop shrinkages, and the overall loop-topdescent, suggestive of an intimate relation of the energy release rate and reconnection outflow speed.Subject headings: acceleration of particles—Sun: flares—Sun: UV radiation —Sun: X-rays, gamma
rays
1. INTRODUCTION
Magnetic reconnection is believed to be the primaryenergy release mechanism during solar flares, but whereand how the released energy is transformed to heatthe plasma and accelerate particles remain unclear (forreviews, see Holman et al. 2011; Fletcher et al. 2011;Petrosian 2012; Raymond et al. 2012). Evidence of mag-netic reconnection and current sheets on the Sun hasbeen observed in various situations and wavelengths.A major advance in the last decade was the discov-
ery of a second coronal source above a commonly ob-served loop-top source in X-rays and radio wavelengths(Sui & Holman 2003; Sui et al. 2004; Pick et al. 2005;Veronig et al. 2006; Li & Gan 2007; Liu et al. 2008,2009c; Chen & Petrosian 2012; Su et al. 2012; Bain et al.2012; Glesener et al. 2012). Such double sources oftenexhibit higher-energy emission being closer to each other,indicating higher temperatures or harder spectra of ac-celerated electrons in the inner region nearer to the pre-sumable magnetic reconnection site.Another surprise has been the descent of the loop-top
X-ray source at typically 10–40 kms−1 early in the im-pulsive phase before its common ascent through the de-cay phase (Sui & Holman 2003; Sui et al. 2004; Liu et al.2004; Shen et al. 2008). The upper coronal source, how-ever, usually keeps ascending all the time.Shrinkages of entire flare loops (Svestka et al. 1987)
at speeds on the order of 10 kms−1 have been ob-
1 Lockheed Martin Solar and Astrophysics Laboratory, Build-ing 252, 3251 Hanover Street, Palo Alto, CA 94304
2 W. W. Hansen Experimental Physics Laboratory, StanfordUniversity, Stanford, CA 94305
3 Department of Physics, Stanford University, Stanford, CA94305
served in soft X-rays (SXRs; Forbes & Acton 1996;Reeves et al. 2008), extreme ultraviolet (EUV; Li & Gan2006), and microwaves (Li & Gan 2005; Reznikova et al.2010). They were interpreted as contractions of newly re-connected loops due to magnetic tension as they evolvefrom initially cusp shapes toward more relaxed roundshapes.Often after the impulsive phase, bright loops and dark
voids seen in SXR or EUV descend onto a flare ar-cade from above at greater speeds of typically 150 kms−1
(McKenzie & Hudson 1999; Savage & McKenzie 2011).At even greater heights of a few R⊙, similar descend-ing loops are seen in white-light coronagraphs, usuallyhours after a coronal mass ejection (CME; Wang et al.1999; Sheeley et al. 2004). These features are also inter-preted as contracting post-reconnection loops, but theirobserved speeds are only a small fraction of the expectedcoronal Alfven speed on the order of ∼1000 kms−1.Imaging and Doppler observations have also re-
vealed bi-directional magnetic reconnection inflows(Yokoyama et al. 2001; Milligan et al. 2010; Liu et al.2010), outflows (Innes et al. 1997; Ko et al. 2003;Wang et al. 2007; Nishizuka et al. 2010; Hara et al.2011; Watanabe et al. 2012), or both (Lin et al. 2005;Takasao et al. 2012; Savage et al. 2012).The physics behind descending X-ray loop-top sources
and their relationship with slow loop shrinkages,fast supra-arcade loop contractions, and reconnec-tion outflows remain unclear, although some mod-els have been proposed (e.g., Somov & Kosugi 1997;Karlicky & Kosugi 2004). To fill this gap, we presenthere observations of a recent eruptive M7.7 flare fromthe Reuven Ramaty High Energy Solar Spectroscopic Im-ager (RHESSI; Lin et al. 2002) and Solar Dynamics Ob-

2 Liu et al.
servatory Atmospheric Imaging Assembly (SDO/AIA;Lemen et al. 2012). We find in this flare all the aboveinterrelated phenomena, which can be understood in aunified picture as contractions of post-reconnection loopsmodulated by the interplay between energy release andcooling. The observed highest speed of ∼1000 kms−1 ofloop contractions is comparable to the expected Alfvenspeed. The maximum temperature and nonthermal loop-top emission being away from the inferred reconnectionsite suggest that primary heating and particle accelera-tion take place in the outflow regions, rather than thereconnection site itself.After an observational overview in Section 2, we
present motions of the overall X-ray and EUV emissionin Section 3. We examine bi-directional outflows in formsof plasmoids and contracting loops in Section 4. In Sec-tion 5, we analyze the spatial distribution of energy andtemperature dependent emission, including double coro-nal X-ray sources. We conclude in Section 6, followedby two appendixes on supplementary AIA and STEREOobservations.
TABLE 1Event Time Line (2012 July 18–19)
22:18, 07/18 Peak of the earlier C4.5 flare04:17, 07/19 Onset of the M7.7 flare and initial ascent
of the overall X-ray and EUV loop-top source05:02–05:07 Onset of overall X-ray and EUV loop-top descent
and transition from slow to fast rise of the flux rope CME
05:15 Max. velocity (1050 km s−1) of upward ejections
05:16 Max. velocity (−58 km s−1) of downward loop shrinkages05:15–05:20 Max. velocity (−7 to −23 kms−1) of overall
X-ray and EUV loop-top descent05:16–05:43 Flare impulsive phase, hard X-ray burst05:21–05:31 Min. height of overall X-ray and EUV loop-top descent
and onset of the second ascent04:17–05:20 Upward ejections; downward, low-altitude fast contractions05:20–16:00 Downward, high-altitude fast loop contractions04:17–16:00 Downward slow loop shrinkages
06:52 Max. velocity (−918 km s−1) of downward fast contractions
2. OVERVIEW OF OBSERVATIONS
The event under study was an M7.7 flare that occurredat ∼04:17 UT on 2012 July 19 in NOAA active region(AR) 11520 on the southwest limb. It was well observedby RHESSI and SDO/AIA, but it was not detected byFermi and its impulsive phase was missed by the X-rayTelescope on Hinode. Table 1 summarizes the event timeline that will be discussed in detail.Figure 1 shows the history of the flare emission. The
GOES 1–8 A flux peaks at 05:58 UT followed by a slowdecay lasting almost one day. We define the interval of05:16–05:43 UT as the impulsive phase, as marked by thetwo vertical dashed lines, which starts at the sudden riseof the RHESSI 25–50 keV flux and ends (during RHESSI
night) when the time derivative of the GOES 1–8 A fluxdrops to its level at the impulsive phase onset, assumingthe Neupert (1968) effect at work. We call the intervalsbefore and after the impulsive phase the pre-impulsiveand decay phases. RHESSI has good coverage except forthe late impulsive and early decay phases.Figure 2 and its associated Movie A show AIA images
of the event. An earlier C4.5 flare occurred in the samelocation, peaking at 22:18 UT on 2012 July 18 (see Fig-ure 1(a)). This is a confined flare that produces a hot
Fig. 1.— History of X-ray and EUV flare emission. (a) GOESSXR fluxes showing the preceding C4.5 flare and the main M7.7flare. (b) SDO/AIA intensity of the loop-top region (at projectedheight href = 60′′ on Cut 0, as shown in Figure 13) normalizedby its initial value (base ratio). Color-coded for AIA channels, thecurves are vertically shifted to avoid overlap and arranged fromthe top to bottom approximately in the temporal order of theirinitial response to the flare (in progressively cooler channels). (c)RHESSI count rates in colored solid lines and GOES 1–8 A fluxand its time derivative in black dotted lines, arbitrarily shifted ver-tically. The two vertical dashed lines indicate the impulsive phase.(d) Temperature and (e) emission measure of the flare plasma in-ferred from RHESSI (orange/red) and GOES (black) spectral fits,together with the power-law index γ of the nonthermal componentshown in blue in (d).
flux rope failing to erupt and cusp-shaped flare loopsunderneath it (Figure 2(a)). This configuration thengradually evolves for hours and finally becomes unsta-ble, initiating the later, eruptive M7.7 flare, when theflux rope is expelled as a fast CME of >1000 kms−1.The flux rope in this two-stage eruption was reported byPatsourakos et al. (2013).As shown in Figure 2(i), the trailing edge of the CME
displays a clear “V-shape”, which, together with the

Particle Acceleration in Reconnection Outflows 3
underlying “inverted-V shape” of cusp-like flare loops,suggests two Y-type null points with a vertical currentsheet formed in between, as predicted in the classical pic-ture of eruptive flares (Carmichael 1964; Sturrock 1966;Hirayama 1974; Kopp & Pneuman 1976). Not predictedin that picture is the initial upward growth of the cuspfollowed by its rapid downward shrinkage around theearly impulsive phase, prior to another, expected up-ward growth through the decay phase in a commonlyobserved candle-flame shape (Figures 2(a)–(l)). The ini-tial growth and shrinkage are accompanied by the grad-ual rise and impulsive eruption of the overlying fluxrope, respectively. Equally interesting are high-speed bi-directional outflows involving upward-moving plasmoidsand downward-contracting pointed cusps (Figure 2, bot-tom; Figure 5). We examine these and related featuresobserved by RHESSI and AIA in next several sections.
3. OVERALL X-RAY AND EUV SOURCE MOTIONS
We first follow the evolution of the morphologies andpositions of overall X-ray and EUV sources.
3.1. X-ray Source Morphology
We reconstructed RHESSI X-ray images in energybands from 3 to 50 keV using the CLEAN algorithm anddetectors 3–9. Depending on the count rate, we chosevariable integration time ranging from 20 s during theimpulsive phase to 4 minutes during the decay phase.Figure 3 and its accompanying Movie show examples
of RHESSI contours overlaid on AIA images. There isa persistent loop-top source at 6–10 keV (green) nearthe apex of the cusp-shaped EUV loops. Accompanyingthe evolution of the EUV loops mentioned above, thisloop-top source undergoes a gradual ascent followed by adescent and then another ascent. This can be best seenin the last panel showing the temporal migration of theemission centroid obtained from a contour at 70% of themaximum of each image. Early descents of loop-top X-ray sources have been recognized (e.g., Sui et al. 2004),but this is the first time that an evident preceding ascentis observed.Early in the event there is an additional, weaker coro-
nal X-ray source (panel (b)) located in the lower por-tion of the overlying flux rope. It later falls belowdetection with the eruption of the flux rope. Dur-ing the impulsive phase (panel (e)) at higher energies(25–50 keV), there are double footpoint sources anda Masuda-type (Masuda et al. 1994; Nitta et al. 2010,e.g.,) coronal source located 20′′ = 15Mm above the SXR(6–10 keV) loop-top. This separation is twice that of theMasuda case.The earlier C4.5 flare (panel (a)), though more com-
pact, exhibits surprisingly similar emission, including theadditional X-ray source within the flux rope and theMasuda-type hard X-ray (HXR) source. This suggeststhat the end state of the first, confined flare of a failederuption serves as the initial state of the second, erup-tive flare, making them homologous flares. Note thatthe weaker, southern footpoint emission is (partially) oc-culted by the limb, especially for the first flare.
3.2. X-ray and EUV Height-time History
To track various moving features, we placed eight cutsof 10′′ wide centered on the limb, as shown in Figure 2(f).
Cut 0 is positioned along the presumable current sheetbetween the initial flare cusp and erupting flux rope, andis used as the fiducial line for obtaining projected heightsup to ∼08:00 UT. Subsequent cuts are evenly spaced by3◦ to capture the cusp at different stages as it gradualturns toward the south. For each cut, we averaged pixelsof an AIA image sequence within it in the perpendiculardirection to obtain a space-time plot.Figure 4(c) shows, for example, a base-ratio (i.e., nor-
malized by the initial intensity profile) space-time plotfrom Cut 0 at 131 A. It shows the eruption of the fluxrope and the three-stage development (upward, down-ward, and upward again) of the underlying flare cusp.The peak emission at each time, marked by the smallpurple symbols, evidently exhibits this motion. Space-time plots of other AIA channels are shown in Figure 13and described in Appendix A.Figure 4(e) shows the height-time history of the loop-
top emission centroids in four RHESSI X-ray bands from3 to 25 keV and in all AIA EUV channels. (From nowon, we refer to both X-ray centroids and EUV peaks ascentroids.) We find that all loop-top centroids followthe same three-stage motions. The AIA 131 and 94 Achannels best exhibit this trend continuously, while incooler channels, especially 211 and 171 A, the initial as-cent and subsequent descent become obscure. Note thatthe 3–6 keV centroid (red diamonds) cannot be identi-fied since the impulsive phase because the RHESSI thinattenuator moves in and raises the energy threshold to 6keV.We also notice a clear energy dispersion that the loop-
top emissions at higher temperatures or photon energiesare located at greater heights, with all X-ray centroidssituated above EUV centroids. For example, at its great-est height prior to the impulsive phase, the 16–25 keVcentroid is 35′′ = 26Mm above its 335 A counterpart.This energy dispersion is consistent with previous obser-vations (e.g., Veronig et al. 2006) and in line with theexpected picture that higher loops are newly energizedand thus are hotter and/or host nonthermal electrons ofharder spectra, while lower loops are previously energizedand have undergone cooling. We suggest that the so-called above-the-loop-top Masuda-type sources, includ-ing the 25–50 keV coronal source in Figure 3(d), couldbe extreme cases of this general trend.In Table 2, we list the initial heights of X-ray and
EUV loop-top centroids around 04:35 UT, together withthe maximum and minimum heights during their de-scents and the percentage height reductions. In gen-eral, the above noted energy dispersion persists and the10–20% descents are in agreement with earlier reports(Veronig et al. 2006). An exception is the 193 and 304 Achannels because of their response to both hot and coolemissions (see Appendix A). There is a weak trend thathigher energy X-ray descents start (at the maximumheights) later, but still within 5 minutes during 05:02–05:07 UT, and X-ray descents end (at the minimumheights) earlier than EUV descents by up to 10 minutes.We measured the average velocities of the loop-top cen-
troids by fitting a piecewise linear function to the height-time data during their initial ascent, subsequent descent,and second ascent stages. As listed on the right hand sideof Table 2, the result shows a general trend of higher ve-

4 Liu et al.
Fig. 2.— AIA images of the event, rotated to the solar west up. Top: 94 A image sequence of the earlier C4.5 flare and the M7.7 flareunder study (see the associated online Movie A for composite 94 (red) and 335 A (green) images). The brackets in (c) and (e) mark theenlarged fields of view (FOV) of the middle and bottom panels, respectively. The numbered dotted lines in (f) mark the cuts for obtainingspace-time plots presented in this paper. Middle: Detailed 131 A image sequence showing the upward growth of the flare cusp, followedby its rapid shrinkage around the early impulsive phase. The horizontal dotted line marks the highest position of the early cusp. Bottom:131 A image sequence showing an example of pointed cusps contracting from a ray-like structure, presumably a reconnecting current sheet(see the associated Movie B). The first panel is an original image and the rest are running difference images. The slanted dashed lineindicates an average contraction velocity of −151 km s−1.
locities at higher energies. The X-ray descents of −11to −15 kms−1 are about twice faster than the EUV de-scents except for 193 A because of its dual temperatureresponse. There is also a gradual decrease in velocitywith time during the second ascent stage through thedecay phase. These trends generally agree with previousobservations (Liu et al. 2004; Veronig et al. 2006).To follow the temporal variations of the loop-top ve-
locities, we took time derivatives of spline fits to the cen-troid heights of selected channels. The resulting veloc-ities vs. time are shown in Figure 4(c) for the 6–10 &10–16 keV and 131 & 94 A channels. The outstand-ing feature is that the maximum descent velocities (alsotabulated in Table 2) in the range of −7 to −23 kms−1
are all attained during 05:15–05:20 UT, near the onsetof the impulsive phase at 05:16 UT marked by a ver-
tical dashed line. This time is delayed from the initialdescent by about 10 minutes. This indicates that theloop-top descent velocity, rather than its height, is moreintimately correlated with the energy release rate.We also show in Figure 4(e) the centroid heights of
the upper coronal X-ray source located in the lower por-tion of the flux rope. A parabolic fit indicates a fi-nal velocity of 19 kms−1 at 04:50 UT, comparable to orslower than those in other events (Liu et al. 2008, 2009c;Sui & Holman 2003). It is also 50% slower than the mid-dle portion of the then accelerating flux rope, as indi-cated by the parabolic fit in Figure 13(e), which reaches153± 3 kms−1 later at 05:07 UT near the edge of AIA’sFOV.The conjugate footpoints at 25–50 keV during the im-
pulsive phase move away from each other at an average

Particle Acceleration in Reconnection Outflows 5
Fig. 3.— (a)–(f) Evolution of RHESSI 6–10 keV sources (green contours at 31% and 90% of the maximum) overlaid on concurrent AIA131 A images (see the accompanying Movie). The blue contours show 25–50 keV emission, for both the C4.5 and M7.7 flares, at thefootpoint(s) and the Masuda-type coronal source 20′′ above the SXR and EUV loops. (g) Color-coded temporal migration of the 6–10 keVloop-top centroid as marked by the plus sign on the left. The red arrows indicate an initial ascent followed by a descent and then anotherascent. The dotted line marks the fiducial line (Cut 0) for obtaining projected heights shown in Figure 4. The first and last panels areenlarged from the bracketed regions shown in their adjacent panels.
TABLE 2Projected Heights and Velocities of RHESSI and AIA Loop-top (LT) Centroids
Channels Height (arcsec=0.737 Mm)/Time (UT) Velocity ( km s−1)/Time (UT)Initial Max Min Descent % Initial Ascent Descent 2nd Ascent
(∼04:35) Mean Max –6:00 6:00–7:00 7:00–8:00RHESSI
16–25 keV 59′′ 77′′/05:07 60′′/05:24 22% 8.9 −12 −23/05:20 14 12 1.510–16 keV 55′′ 69′′/05:06 54′′/05:21 22% 7.1 −15 −19/05:15 14 10 3.66–10 keV 53′′ 66′′/05:05 52′′/05:22 21% 6.0 −11 −15/05:18 13 9.6 2.13–6 keV 52′′ 60′′/05:04 ... ... 4.1 ... ... ... ... ...AIA193 A ... 61′′/05:03 35′′/05:31 (43%) ... −13 −20/05:19 ... 4.9 3.0131 A 47′′ 56′′/05:02 43′′/05:30 23% 4.3 −5.9 −8.3/05:18 11 3.6 2.694 A 43′′ 49′′/05:06 41′′/05:29 16% 2.5 −4.7 −7.1/05:17 5.9 3.2 2.6
304 A ... 48′′/05:04 29′′/05:27 (40%) ... −5.1 ... 4.6 4.1 2.4335 A ... 41′′/05:07 36′′/05:29 12% ... −3.9 ... 4.1 3.5 3.2211 A ... ... 31′′/05:23 ... ... −6.9 ... 5.0 4.3 3.2171 A ... ... 31′′/05:24 ... ... −6.0 ... 5.6 5.0 3.5
Note. — Centroid height uncertainties are .2′′ for RHESSI and .1′′ for AIA. Velocity uncertainties are on the order of 10%–15%.
velocity of 13 kms−1 (see Figure 4(e)), almost identi-cal to the velocity of the simultaneous loop-top ascent(see Table 2). This is consistent with previous observa-tions (Liu et al. 2004) and the classical picture of erup-tive flares during the arcade growth phase.
4. BI-DIRECTIONAL PLASMA OUTFLOWS
We now turn our attention to the bi-directional plasmaoutflows observed by AIA. As shown in Figure 5 and itsaccompanying Movie, emission features move both up-ward and downward from above the cusp-shaped flareloops. The upward outflows, observed only when the fluxrope rises toward its eruption, are mainly bright blobs(interpreted as plasmoids, top row), while the down-ward outflows are primarily in the form of retractingcusp-shaped loops (bottom row) observed throughoutthe event well into the decay phase. Among the down-ward retracting loops, those seen at low altitudes tend tohave lower speeds (.60 kms−1) and gradually deceleratewhen approaching and piling up onto the apex of the flarearcade, while those originating from high altitudes tendto have higher speeds (&100 kms−1) and decelerate morerapidly. According to these observational distinctions,we call the former slow loop shrinkages and the latterfast loop contractions, although they might share a com-mon physical origin as discussed in Section 6. The formerare likely analogous to shrinkages observed at SXR and
other wavelengths (Svestka et al. 1987), while the lat-ter, especially those occurring after the flare arcade hasformed, are likely so-called supra-arcade downflow loops(Savage & McKenzie 2011).To track these moving features, we obtained space-time
plots from the cuts defined in Figure 2(f) using the 131 Achannel because it provides the best coverage of these fea-tures. We then applied running ratio, namely, dividingthe intensity profile at each time by its previous neigh-bor, which highlights moving features as intensity tracks(see, e.g., Figure 4(d)). We exhaustively identified suchtracks of more than 10′′ long corresponding to uniquemoving features. If one feature is captured by multiplecuts, we included only the most complete track. Follow-ing Warren et al. (2011), we fitted the projected heighth of each track by a function of time t,
h(t) = h0 + vT t+ a0τ2(e−t/τ − 1), (1)
which gives the instantaneous velocity
v(t) = vT − a0τe−t/τ , (2)
and acceleration
a(t) = a0e−t/τ , (3)
where h0 and a0 are the initial height and acceleration,vT is the terminal velocity, and τ is the e-folding decay

6 Liu et al.
Fig. 4.— X-ray and EUV source motions. (a) and (b) Sub-sets of light curves from Figures 1(b) and (c). (c) and (d) Baseand running ratio space-time plots of the AIA 131 A channel fromCut 0, overlaid with selected centroid positions from (e). (e) Pro-jected heights of the emission centroids of the upper and lowercoronal sources from RHESSI (large symbols, greater heights) andof the loop-top peaks from AIA (small symbols, lower heights).Also shown is the 25–50 keV footpoint separation (purple squares)shifted upward by 30′′. (f) Velocity of centroids from spline fits toselected channels in (e). The blue symbols are the initial velocitiesof individual but rescaled by a factor of 0.5.
Fig. 5.— AIA 131 A images (see the accompanying Movie) show-ing upward moving blobs (top, labeled A and B) and V-shapes(middle) and downward contracting cusps (bottom). Their space-time fits are shown in Figure 7(a). The green contours show twodistinct 8-10 keV RHESSI sources from Figure 10(c). The first rowand column are original images and the rest are running differenceimages.
time that characterizes the observed decreasing acceler-ation (or deceleration) with time. We present below thekinematics of the features categorized above and focuson their initial velocities v0 = vT −a0τ and accelerationsa0.
4.1. Slow Downward Loop Shrinkages
Figure 6 shows kinematic measurements of the slowloop shrinkages. These loops traverse a hot (up toT ∼ 30MK; see Figure 11) loop-top region, which isbright only in the hottest channels of 193, 131, and 94 A,and descend toward the apex of the flare arcade seen incooler channels, where they fade below detection (seeFigure 13). They generally start at a low velocity with amedian of −17 kms−1 (+/− for upward/downward) anddecelerate to typically −5 kms−1 within 0.5–2.5 h. Theirmedian initial deceleration is 0.014 kms−2.Such shrinkages are persistent throughout the flare,
not only during the decay phase when the overallloop-top emission develops upward as previously ob-served (Forbes & Acton 1996), but also during the pre-impulsive and impulsive phases when the loop-top un-dergoes its initial ascent and subsequent descent. 50shrinkages are identified during 04:00–16:00 UT with anaverage occurrence rate of once per 7.7 minutes up to10:00 UT but more frequent around the impulsive phase(Figure 6(b)).Regardless of the direction of motion of the loop-top

Particle Acceleration in Reconnection Outflows 7
Fig. 6.— Kinematic measurements of slow loop shrinkages. (a) Running ratio space-time plot enlarged for the boxed region in (b),overlaid with examples of fits to shrinkage tracks labeled with their initial velocities. (b) Base ratio 131 A space-time plot from Cut 0overlaid with all 50 fits performed. (c) Initial velocities v0 of the fitted tracks in (b) as a function of time. (d) Histograms of v0 (solid) andthe final velocity vf (dotted) measured at the end of each track, with their statistical properties (median, mode, mean, standard deviation,and total number of fits) listed in (c). (e) and (f) same as (c) and (d), but for the initial acceleration a0. The black dotted lines in (c) and(e) are the time derivative (inverted) and original GOES 1–8 A flux. The two vertical dashed lines mark the impulsive phase.
emission, the initial height of loop shrinkage generally in-creases with time. The initial velocity v0 exhibits morevariability, as shown in Figure 6(c), and appears to bepositively correlated with the flare energy release rate in-dicated by the time derivative of the GOES flux (blackdotted line). In particular, near the onset of the impul-sive phase at 05:16 UT (vertical dashed line), v0 increasesrapidly and reaches a maximum of −58 kms−1. There isa similar temporal correlation with the initial deceler-ation a0 (panel (d)) that also generally correlates withv0.
4.2. Fast Downward Loop Contractions
Figure 7 shows, in the same form as Figure 6, kine-matic measurements of fast downward loop contractionsas well as upward plasmoid ejections that will be ex-amined in Section 4.3. We color-code fits to tracks ofdifferent categories: upward ejections in red and down-ward contractions in cooler colors. For the latter, we usegreen for early contractions that occur simultaneouslywith upward ejections and originate from lower heightsh < 100′′, and blue for later contractions that occur with-out observed upward counterparts (possibly out of AIA’sFOV, after the flux rope has erupted) and originate fromgreater heights h > 100′′. We identified 29 green tracksand 174 blue tracks during 04:00–16:00 UT.
As shown in Figure 7(c), the fast downward contrac-tions, especially those later blue-colored ones, start wellabove the hot loop-top region and travel into it with de-celeration for some distance before fading below detec-tion. Their final heights are generally above the originalheights of slow loop shrinkages (see Figure 6(b)).In original AIA images, the fast contracting fea-
tures are usually bright, cusp-shaped loops (see Fig-ure 2, bottom), but occasionally dark, tadpole-likevoids (McKenzie & Hudson 1999; Innes et al. 2003;Cassak & Drake 2013). In running ratio space-time plots(Figure 7, top), the former each produce a bright trackfollowed by a recovering dark track, while the latter pro-duce tracks of reversed order. We treat them all as con-tracting loops and do not distinguish their differencesthat are beyond our scope.As shown in Figure 7(c), the early, green-colored con-
tractions have short ranges of 10′′–20′′, because of thecompactness of the flare at this time, while the later,blue-colored contractions travel great distances up to200′′ = 150Mm. However, their statistical medians,modes, and means of the initial velocities are quite sim-ilar within 200–300 kms−1 (Figures 7(d) and (e); Ta-ble 3), suggestive of a common origin of these contrac-tions possibly as reconnection outflows. The initial decel-erations of the early contractions are, on the other hand,

8 Liu et al.
Fig. 7.— Same as Figure 6 but for fast upward plasmoid ejections and downward loop contractions. (a) and (b) Running ratio space-time plots obtained from Cuts 0 and 2, enlarged for the two boxed regions in (c). Overlaid with examples of color-coded fits, (a) showssimultaneous upward ejections (red dotted) and downward contractions of early, low-lying loops (green dotted), and (b) shows downwardcontractions of later, high-lying loops (blue dotted) from well above the flare arcade. Example images corresponding to the fits in (a)and (b) are shown in Figures 5 and 2 (bottom), respectively. (c) Base ratio 131 A space-time plot from Cut 2 overlaid with all fits tothese identified features. The thick green dashed line is a spline fit to the initial heights of bi-directional outflows, as an estimate to theposition of reconnection. (d)–(g) Initial velocities v0 and accelerations a0 of the color-coded fits in (c) as a function of time, togetherwith their histograms on the right. The blue dotted line in (e) is for the final velocities of the late, high-lying loop contractions. Theshort, vertical stripes in (a) with a periodicity of ∼1 minute between 04:45–05:15 UT are possibly due to quasi-periodic flare pulsations(Nakariakov & Melnikov 2009), not to be confused with the tracks of steep slopes of plasma outflows.
TABLE 3Kinematic Statistics of Bi-directional Outflows
Features Interval(a) Initial Velocity ( km s−1) Final Velocity ( km s−1) Initial Acceleration ( km s−2)(# of Fits) (minutes) Med. Mod. σ Max/Time Min Med. Mod. σ Max/Time Min Med. Mod. σ Max/Time Min
Ejected Plasmoids (25) 2.4 322 248 242 1050/05:15 121 343 320 250 1070/05:13 70 −0.018 −0.043 1.2 2.89/05:12 −2.84Shrinking Loops (50) 7.7 −17 −15 8 −58/05:16 −7 −5 −5 3 −18/04:26 −2 0.014 0.014 0.044 0.252/04:26 −0.008Contracting Cups:Early, Low Altit.(29) 2.2 −208 −231 59 −351/04:30 −110 −89 −68 58 −226/04:30 −26 2.022 1.30 3.61 16.9/04:30 0.096Late, High Altit.(174) 2.0 −242 −158 176 −918/06:52 −34 −73 −113 85 −553/05:32 −1 0.848 0.103 2.64 15.9/06:10 −0.297
Note. — Abbreviations: Med. for Median, Mod. for Mode. (a) Average occurrence interval up to 10:00 UT.

Particle Acceleration in Reconnection Outflows 9
about twice higher than those of the later ones, with amedian of 2.022 vs. 0.848 kms−2 (Figures 7(f) and (g)).The later, high-altitude contractions have a mode
velocity −158 kms−1 that is similar to the me-dian velocity −150 kms−1 of supra-arcade downflows(Savage & McKenzie 2011; Warren et al. 2011). How-ever, their median and mean velocities, −242 and−282 kms−1, are nearly twice greater. This is due tothe high velocity tail with 36 out of 174 or 21% con-tractions being faster than −400 kms−1 (hatched areain Figure 7(e)), reaching a maximum of −918 kms−1.We ascribe this difference to AIA’s improved capabilitiesthat allow us to detect such contractions in their earlystages when their velocities are high and emissions areweak.The initial velocities and decelerations of the earlier
and later fast contractions, when taken together, gener-ally increase with time up to ∼06:10 UT and then de-crease. This maximum time is delayed by almost 1 hfrom that of the slow loop shrinkages and the onset ofthe HXR burst represented by the GOES flux deriva-tive shown in Figure 6(c). The temporal variations hereseem to be more closely correlated with the GOES fluxitself. The late-phase decreases of the initial velocitiesand decelerations are physically reasonable as energy re-lease subsides, but there is an observational bias for thosetracks starting at the edge of AIA’s FOV which may havedecelerated before they are first detected.Figure 8 shows the distributions of fractional height
reductions of the downward loop shrinkages and con-tractions, defined as (h0 − hf)/h0, where h0 and hf arethe initial and final projected heights. The slow shrink-ages (light blue) and later, high-altitude fast contrac-tions (blue) have similar distributions with medians of0.3 and 0.26, respectively, which are comparable to thoseobserved in SXRs (Forbes & Acton 1996; Reeves et al.2008) and predicted theoretically (Lin 2004). The early,low-altitude fast contractions (green) have a median oftwice smaller, but comparable to the 10–20% descent ofthe overall loop-top emission (Table 2). Meanwhile, thelater fast contractions have a sizable fraction of 16% (27out of 174) with height reductions more than 0.4 (up to0.7), which is larger than predicted. Note that these ob-served values are lower limits, because loops, especiallythose detected at the edge of AIA’s FOV, could con-tinue contraction before and after their observed inter-vals when their emission remains below detection.
4.3. Fast Upward Plasmoid Ejections
As shown in Figure 7, upward plasmoid ejectionsappear as steep, elongated tracks (red fits). Com-pared with the downward loop contractions (green fits)at the same time, they travel greater distances (20′′–80′′ vs. 10′′–20′′), with larger initial velocities (median:322 vs. −208 kms−1) but smaller decelerations (median:−0.018 vs. 2.022 kms−2). (The opposite signs of the ac-celeration and velocity here indicate deceleration.) Someupward ejections even experience acceleration. Such dif-ferences, especially the ratio of their median velocities of208/322 = 2/3, are consistent with previous observationsand simulations of oppositely directed reconnection out-flows (Takasao et al. 2012; Barta et al. 2008; Shen et al.2011; Murphy et al. 2012; Karpen et al. 2012). These
Fig. 8.— Histograms of fractional height reductions of slowshrinkages (light blue) and early, low-altitude (green) and later,high-altitude (blue) fast contractions. The hatched area indicates16% of the later fast contractions with reductions greater than 0.4.The cyan triangle marks the descent fraction of the 10–16 keVloop-top from Table 2.
differences are likely due to different environments: theupflow runs into a region of (partially) open field lineswith low plasma density, while the downflow impingeson high density, closed flare loops that can cause strongdeceleration.The starting heights of these upward ejections and
their downward counterparts (Figure 7 (c)) both increasewith time. This suggests an upward development of thereconnection site situated between the opposite outflows(e.g., Shen et al. 2011). We estimated the height of thereconnection site from a spline fit, shown as the greendashed line in Figures 7(a)–(c), to the initial heights ofthe bi-directional fast outflows. Its initial velocity of afew km s−1 is similar to that of the initial loop-top as-cent, suggesting the upward development of reconnectionbeing its underlying mechanism. This estimated recon-nection site leaves the AIA FOV at about 06:40 UT.During 04:15–05:25 UT, we identified 25 upward ejec-
tions (red) and 29 downward, early fast contractions(green), at average occurrence rates of once every 2.4 and2.2 minutes, respectively. These rates are comparable tothat of the later fast contractions (blue, up to 10:00 UT)of once every 2.0 minutes and to those in MHD simula-tions (Barta et al. 2008).4 The persistence throughoutthe entire flare of such contractions also agrees with thestatistical result from Yohkoh (Khan et al. 2007).The initial velocity of upward ejections, as shown in
Figure 7(d), increases with time and seems to be cor-related with the height of the overlying flux rope as itevolves into eruption. In particular, there is a rapid ve-locity increase at the onset of the impulsive phase, reach-ing 1050 kms−1. This aspect of this event is indepen-dently studied by R. Liu (2013).
5. SPATIAL DISTRIBUTION OF ENERGY ANDTEMPERATURE DEPENDENT EMISSION
5.1. RHESSI X-ray Spectra
4 The ∼2 minute intervals of fast contractions are compara-ble to the typical periodicities of recently detected quasi-periodicfast-mode magnetosonic wave trains (Liu et al. 2011b, 2012c;Ofman et al. 2011; Shen & Liu 2012) that are correlated with flarepulsations. This may indicate that those waves are triggered bythe energy release episodes associated with these contractions.

10 Liu et al.
To infer the overall properties of nonthermal parti-cles and thermal plasma, we analyzed spatially inte-grated RHESSI spectra of individual detectors follow-ing the procedures detailed in Liu et al. (2008) andMilligan & Dennis (2009).Figure 9 shows example spectra in three phases of
the flare. (1) During the pre-impulsive phase (04:59:00–05:01:32 UT), we fitted the spectrum with two isother-mal functions combined: a warm component (red dot-ted) of temperature T = 13MK and emission measureEM = 0.37×1048 cm−3 plus a hot component (green dot-ted) of 30MK (also called super-hot, Caspi & Lin 2010)and a 40 times smaller EM. If we were to replace the hotcomponent with a power-law ∝ E−γ , we would have asteep slope of γ = 7.6. (2) During the impulsive phase(05:25–05:26 UT), we used an isothermal (T = 22MK,EM = 2.8 × 1048 cm−3) plus power-law (blue dotted,γ = 3.8) model. (3) During the decay phase, the datacan be fitted with one isothermal function of a slightlyreduced temperature of 18MK but twice higher EM of5.5× 1048 cm−3. Note that at E>25 keV, the power lawin the impulsive phase is more than an order of mag-nitude higher than the thermal component. This indi-cates that the 25–50 keV Masuda-type loop-top sourceshown in Figure 3 is primarily nonthermal and likely aparticle acceleration region itself (e.g., Liu et al. 2008;Krucker et al. 2010).
Fig. 9.— RHESSI spectra at three selected times before, during,and after the impulsive phase. The lower two spectra are verti-cally shifted by decades to avoid overlap. Colored dotted lines areisothermal and power-law fits whose parameters are listed on thetop. The black solid lines are the total fits.
We applied such spectral fits throughout the flare andthe temporal variations of the fitting parameters areshown in Figures 1(d) and (e). In general, the warm ther-mal component is persistent in time, and both its T andEM (orange plus signs) increase through the HXR burstfollowed by a more gradual decrease. A similar trendis present for the hot thermal component (red crosses)during the pre-impulsive phase. A thermal fit to GOES
data gives a somewhat lower T but higher EM (blackdotted lines), because of its well-known preferential re-sponse to relatively cooler plasma. The power-law com-ponent (blue) displays a common hardening trend beforethe RHESSI night data gap.
5.2. Energy Dependence of Double Coronal Sources
In Section 3.2 we have examined the energy-dependentheight distribution of the loop-top X-ray source (lowercoronal source). Here we extend this analysis to the up-per coronal source during the pre-impulsive phase andcompare the two sources together.As shown in Figures 10(a) and (b), the higher-energy
emission (12–15 keV, blue contours) of the lower sourceis located at higher altitudes than lower-energy emission(3–8 keV, green contours), while the upper source has anopposite trend. That is, the two sources are closer to eachother at higher energies, as can be better seen in panel(d) from the linear fits to their centroid heights as a func-tion of logarithmic energy. This implies higher tempera-tures of the thermal plasma and/or harder spectra of thenonthermal particles within the inner regions. SimilarRHESSI observations have been reported (Sui & Holman2003; Liu et al. 2008, 2009c) and interpreted as evidenceof magnetic reconnection and associated energy releasebeing located between the double coronal sources.At the highest energies (&10 keV), this trend seems to
be reversed, especially for the upper source. In previ-ous observations (e.g., Figure 4 in Liu et al. 2008), moreobvious reversals occurred at slightly higher energies of15–20 keV and were interpreted as a transition from thelow-energy thermal regime to the high-energy nonther-mal regime, in which greater stopping distances of higherenergy electrons can cause higher energy bremsstrahlungX-rays being located farther away. We further suggestthat this reversal may be an indication of the two X-ray sources being spatially separated, instead of mergingtogether at the highest energies; so are the locations ofprimary heating and particle acceleration from magneticreconnection. This is supported by the separate temper-ature peaks at the two sources as shown in Figures 11(a)and (h) and discussed in Section 5.3.
5.3. AIA Temperature Maps
To infer the spatial distributions of temperature T andemission measure (EM), we employed a forward-fittingalgorithm using AIA filter ratios (Aschwanden et al.2011; for a different approach, see Battaglia & Kontar2012). This algorithm assumes a Gaussian differentialemission measure that has a peak EM at temperatureT . Such a model provides the simplest description of theEM weighted temperature distribution along the line ofsight.Figure 11 (left) shows examples of T and EM maps.
Early in the event at 04:49 UT, the highest temperatureof logT = 6.95 or T = 8.9MK is located in the ris-ing flux rope and the underlying flare cusp, but EM ishighly concentrated in the latter. The temperature thenincreases with time especially in the flare cusp, reach-ing logT = 7.45 or T = 28.2MK at 05:09 UT, close tothe 35 MK of the hot RHESSI component at this time(see Figure 1(d), red crosses). In the decay phase, thehighest temperatures are located in the outer layer of

Particle Acceleration in Reconnection Outflows 11
Fig. 10.— Energy dependence of the double coronal X-ray sources likely located in the oppositely directed reconnection outflows. (a)and (b) RHESSI contours overlaid on AIA 131 A images. The higher energy sources (blue dotted contours at 43% and 95% of the imagemaximum) are closer toward one another than the lower energy sources (green contours). (c) Contoured 6–8 keV image at the time of (b).(d) and (e) Projected heights along the fiducial Cut 0 of the centroids of the two sources enclosed by the white dashed lines in (c). Theresult is color-coded for four consecutive times overlaid with linear fits in dashed line. The red horizontal error bars indicate energy bins.
the flare arcade and the lower portion of the contractingcusps (ray-like features) above it. The EM in the latteris nearly four orders of magnitude lower than in the cen-tral arcade, similar to those of hot fans of rays observedby Yohkoh (Svestka et al. 1998). The considerable in-crease of EM and thus density in the flare loops frompanel (d) to (e), prior to the impulsive phase, suggestschromospheric evaporation driven by thermal conduc-tion (Liu et al. 2009b; Battaglia et al. 2009) or by Alfvenwaves (Haerendel 2009), rather than electron beam heat-ing that may be important later in the presence of HXRfootpoints.To better follow the history of T and EM, we obtained
their space-time plots, as shown in Figures 11(g) and(k), from corresponding maps using Cut 0. We iden-tified the maximum temperature and EM at each timeand show their projected heights as orange and blacksymbols in panel (p). In general, both peaks follow thesame upward-downward-upward motions as the loop-topemission centroids. The temperature peaks are near theRHESSI 16–25 keV centroids (blue), while the EM peaksare close to or slightly lower than the AIA 131 A centroids(purple) at lower heights.The peak offset of the temperature and EM can be
better seen in their height distributions at selected timesshown in Figures 11(h) and (l). It explains the observedenergy dispersion of the X-ray loop-top centroids shownin Figure 4(e) because of the exponential shape of ther-mal bremsstrahlung spectra (equation (4)). As shownby the green and red lines in the middle of Figure 9,a higher temperature but lower EM produces a harder(shallower) spectrum of lower normalization that dom-inates at high energies, while a lower temperature buthigher EM produces a softer (steeper) spectrum of highernormalization that dominates at low energies. The tem-perature peak being located above the EM peak thusshifts the higher energy X-rays toward greater heights.Otherwise, if the temperature and EM peaks are cospa-tial, they would dominate X-rays at all energies and therewould be no separation of centroids with energy. We notein Figures 11(h) that the EM decreases more gradually
near the flux rope. This may lead to the less pronouncedenergy dispersion of the upper coronal source there thanthe lower (loop-top) source (see Figure 10).As a proof of concept, we modeled the observed X-
rays of energy E with thermal bremsstrahlung radiation(Tandberg-Hanssen & Emslie 1988, p. 114):
ISXR ∝ (EM)exp(−E/kT )
E√T
g(E/kT ), (4)
where EM is the emission measure and g(E/kT ) =(kT/E)2/5 is the Gaunt factor. The resulting X-ray pro-files at two selected times are shown in Figures 11(i) and(m) for the corresponding T and EM profiles. As ex-pected, the higher energy 20 keV emission (blue) is domi-nated by the temperature peak at a higher altitude, whilethe 3 keV emission (red) is dominated by the EM peak ata lower altitude. Their emission peaks, marked by opencircles, differ in height by ∆h = 7′′ and 46′′ for the twotimes. Their peak heights are repeated in panel (p) andare close to those of observed loop-top centroids.As shown in Figures 11(g) and (p), the high temper-
ature region and particularly the temperature peak areclose to the X-ray loop-top centroids but always belowthe reconnection site (green dashed line). This indicatesthat primary plasma heating takes place in reconnectionoutflows. To illustrate this, we can follow a contractingloop and the temperature variation it senses as it trav-els away from the reconnection site. A selected trackfrom Figure 7(c) is shown here as the blue dotted arrow.The temperature history on its path, as shown in Fig-ures 11(h) and (j), indicates rapid heating at an averagerate of 3.2MKmin−1 from 3.5 to 28 MK over 8 minutesand ∆h = 90Mm. This example gives us a sense of theheating rate averaged along the line of sight, not neces-sarily of a specific loop.Likewise, the track of a slow loop shrinkage at
lower altitudes reveals cooling at an average rate of−0.32MKmin−1 from 25 to 7.9 MK within 54 minutes.The rate is −1MKmin−1 earlier during the impulsivephase in the 28–9 MK range and −0.1MKmin−1 laterduring 07:00–08:30 UT in the 14–7 MK range. These

12 Liu et al.
Fig. 11.— Maps of temperature T (a–c) and emission measure EM (d–f) inferred from AIA filter ratios at three selected times onlogarithmic scales. (g) and (k) Space-time plots of T and EM maps from Cut 0 as shown in (b). The white dotted lines are temperatureand emission measure from GOES data as shown in Figures 1(d) and (e). The first side panels ((h) and (l)) on the right show the heightdistributions of T (red, top scale) and EM (black, bottom scale) at the time marked by the triangle on the left. The second side panels((i) and (m)) show the modeled corresponding thermal X-ray emission at two photon energies, 3 and 20 keV. The open circles mark theheights of the emission peaks that are also shown in (p). (j) and (o) Temporal profiles T and EM, obtained from a horizontal slice of thecorresponding space-time plots above at height href = 60′′ marked by the cross. The arrowed blue and light blue dotted lines in (g) areselected tracks of a fast contraction and slow shrinkage from Figures 7 and 6. The temperatures sampled by these tracks are shown as afunction of time and distance in (j) and (h), respectively, indicating heating and cooling experienced by these loops as they travel. (p)Projected heights of the maxima of T (orange) and EM (black) at each time in the corresponding space-time plots. Overlaid here and inthe above space-time plots are the heights of the 16-25 keV (blue) and 131 A (purple) loop-top centroids in small symbols from Figure 4(e),and of the inferred reconnection site in green dashed line from Figure 7(c). The vertical dashed lines mark the impulsive phase.
cooling rates are somewhat lower than previously foundat even lower temperatures (Vrsnak et al. 2006).
6. CONCLUSION
6.1. Summary
We have presented detailed EUV and X-ray observa-tions of the 2012 July 19 M7.7 flare, focusing on the sig-natures of magnetic reconnection and associated energyrelease. We summarize our findings and discuss theirimplications as follows.
1. The V-shaped EUV emission on the trailing edgeof the flux rope CME and the underlying, invertedV-shaped flare loops, both associated with distinctX-ray emission, suggest two oppositely oriented Y-type null points with a vertical current sheet formedin between (Figures 2 and 5).
2. Originating from the inferred magnetic reconnec-tion site within the current sheet are bi-directionaloutflows in the forms of plasmoids and cusp-shaped loops. The upward ejections have a me-dian initial velocity of 320 kms−1 and a maximumof 1050 kms−1, while the concurrent downwardcusp contractions are ∼2/3 slower with a medianof −210 kms−1. Even faster contractions up to−920 kms−1 occur after the flux rope eruption foranother 10 h, and a sizable fraction of 21% of themhave speeds ≥400 kms−1, twice faster than previ-ously reported (Savage & McKenzie 2011). Suchhigh velocities are comparable to expected coronalAlfven speeds of ∼1000 kms−1 and sound speedsof 520–910 kms−1 for a 10–30 MK flaring plasma.At lower altitudes, flare loops persistently shrink

Particle Acceleration in Reconnection Outflows 13
at typical initial velocity of −17 kms−1 and gradu-ally decelerate to about−5 kms−1 within 0.5–2.5 h.They are all evidence of reconnection outflows dur-ing different stages (Figures 6 and 7).
3. The double coronal X-ray sources are spatially sep-arated and located in the regions of bi-directionalplasma outflows. The highest temperature is foundnear the loop-top X-ray source well below the re-connection site. This suggests that primary plasmaheating and particle acceleration take place inthe reconnection outflow regions (Holman 2012),rather than at the reconnection site itself. Modelswith this ingredient were proposed long ago (e.g.,Forbes & Priest 1983), but solid observational ev-idence as presented here has been lacking (Fig-ures 10 and 11).
4. An energy dispersion is present in the loop-top po-sition with higher-energy X-ray and hotter EUVemission located at greater heights over a largerange of ∆h ≥ 26Mm. The 25–50 keV nonther-mal emission lies 15Mm (twice that of the Masudaflare) above the 6–10 keV thermal emission. Thisagrees with the expected trend of softer electronspectra in the nonthermal regime and lower tem-peratures in the thermal regime being associatedwith earlier energized loops, which are located fur-ther below the primary locus of energy release. Theupper coronal X-ray source has an opposite trendbecause it is located in the oppositely directed re-connection outflow (Figures 3, 4, and 10).
5. Prior to the recently recognized descent followed bya continuous ascent, the overall loop-top emissionexperiences an initial ascent for nearly an hour.This is the first time that such motions, includingthe descent, are observed simultaneously from EUVto HXRs covering a wide range of temperatures of1–30 MK. The transition from ascent to descent co-incides with the rapid acceleration of the flux ropeCME. The loop-top descends at ∼10 kms−1, about50% slower in EUV than in X-ray (Figure 4).
6. The flare impulsive phase starts when a rapid ve-locity increases occur for the overall loop-top de-scent, the individual loop shrinkages, and the up-ward plasmoid ejections. This is delayed by 10minutes from the initial loop-top descent, imply-ing that the energy release rate is more intimatelycorrelated with these velocities than the loop-topposition (Figure 4).
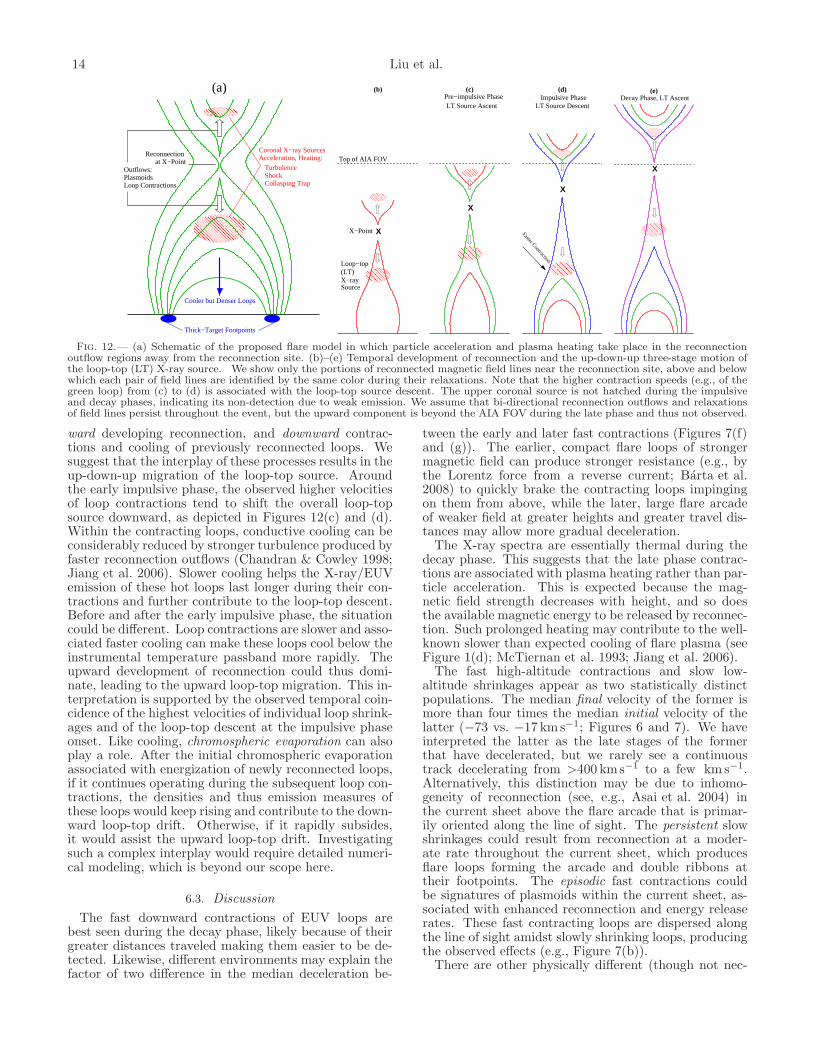
6.2. Proposed Physical Picture
We propose the following physical picture to tie to-gether the observations. The major points, includingthe location of particle acceleration and the three-stage(up-down-up) motion of the loop-top X-ray source, aresketched in Figure 12.The earlier confined C4.5 flare leads to the formation
of a flux rope and cusp-shaped loops underneath it. Af-ter six hours of slow evolution, the flux rope becomesunstable and rises (Patsourakos et al. 2013). A verticalcurrent sheet forms between two Y-type null points atthe lower tip of the flux rope and the upper tip of the
underlying cusp. Magnetic reconnection ensues withinthe current sheet, leading to the eruptive M7.7 flare.Magnetic reconnection produces bi-directional outflows
in forms of the observed plasmoids and contracting loops.Plasmoids are flux tubes formed by the tearing mode(Furth et al. 1963) with a guiding field along the cur-rent sheet. They are magnetic islands in two dimensionor when the current sheet is seen edge-on. These out-flows are driven by the magnetic tension force of thehighly bent, newly reconnected field lines, as in thosepointed cusps. The outflows generally decelerate, as ob-served here, when they run into the ambient corona andwhen the contracting loops relax to less bent shapes withreduced magnetic tension. This implies that the low-altitude slow shrinkages could be the late stages of de-celerated high-altitude fast contractions.Several mechanisms can operate in the reconnection
outflows and contribute to particle acceleration andplasma heating. Turbulence or plasma waves, for ex-ample, can be generated by the interaction of the highspeed flows with the ambient corona. Upon cascadingto smaller scales (comparable to the gyro-radii of back-ground particles) at some distance from the reconnectionsite, turbulence can accelerate the particles and heat theplasma (Hamilton & Petrosian 1992; Miller et al. 1996;Chandran 2003; Petrosian & Liu 2004; Petrosian et al.2006; Jiang et al. 2009; Fleishman & Toptygin 2013).Additional contribution to particle acceleration and/orheating can come from fast-mode shocks in the outflowregions (Forbes & Priest 1983; Tsuneta & Naito 1998;Guo & Giacalone 2012; Nishizuka & Shibata 2013),gas dynamic shocks within contracting flux tubes(Longcope et al. 2009), and the first-order Fermiand betatron mechanisms within the collapsing trapsformed by contracting loops (Somov & Kosugi 1997;Karlicky & Kosugi 2004; Karlicky 2006; Grady et al.2012).As the flux rope evolves into its fast rise and eruption
stage, the current sheet could become sufficiently longcausing significant tearing instability (e.g., Barta et al.2008), and/or become thinner than the ion skin depthleading to a transition from Sweet-Parker reconnection tocollisionless Hall reconnection (Cassak et al. 2006). Bothcan result in enhanced rates of reconnection and energyrelease. The outflow velocity will also increase, produc-ing stronger heating and particle acceleration by one or acombination of the above three mechanisms (turbulence,shock, and betatron) whose efficiency is expected to bepositively correlated with the outflow velocity. For exam-ple, faster outflows can generate stronger turbulence thatcan lead to stronger particle acceleration (see Petrosian2012, for a comparison between acceleration by turbu-lence and shocks). This explains the observed temporalcorrelation of the increase in outflow velocity and theonset of the impulse phase and HXR burst.The loop-top source seen in X-ray and EUV represents
the collective emission of the ensemble of flare loops,each of which undergoes post-reconnection contraction orshrinkage. The loop-top emission centroid is the averageposition of this ensemble, which in the thermal regimeis determined by the convolution of the spatial distribu-tions of temperature and emission measure. Such dis-tributions are influenced by several competing processes,including energization of new loops produced by the up-
14 Liu et al.
����������������������������
������������������������������������������������������
������������������������������������������������������
��������������������������������������������������������������
at X−PointReconnection
Outflows:Plasmoids
Coronal X−ray SourcesAcceleration, Heating:
Collasping TrapShockTurbulence
Loop Contractions
Thick−Target Footpoints
(a)
Cooler but Denser Loops
������������������������������������������������
������������������������������������������������
������������������
������������������
(b)
XX−Point
Loop−top(LT)X−raySource
Top of AIA FOV
���������������������
���������������������
����������������������������������������
����������������������������������������
X
(c)Pre−impulsive PhaseLT Source Ascent
Faster Contraction
������������������������������������������������
������������������������������������������������
X
Impulsive Phase(d)
LT Source Descent
������������������������������������������������������
������������������������������������������������������
X
Decay Phase, LT Ascent(e)
Fig. 12.— (a) Schematic of the proposed flare model in which particle acceleration and plasma heating take place in the reconnectionoutflow regions away from the reconnection site. (b)–(e) Temporal development of reconnection and the up-down-up three-stage motion ofthe loop-top (LT) X-ray source. We show only the portions of reconnected magnetic field lines near the reconnection site, above and belowwhich each pair of field lines are identified by the same color during their relaxations. Note that the higher contraction speeds (e.g., of thegreen loop) from (c) to (d) is associated with the loop-top source descent. The upper coronal source is not hatched during the impulsiveand decay phases, indicating its non-detection due to weak emission. We assume that bi-directional reconnection outflows and relaxationsof field lines persist throughout the event, but the upward component is beyond the AIA FOV during the late phase and thus not observed.
ward developing reconnection, and downward contrac-tions and cooling of previously reconnected loops. Wesuggest that the interplay of these processes results in theup-down-up migration of the loop-top source. Aroundthe early impulsive phase, the observed higher velocitiesof loop contractions tend to shift the overall loop-topsource downward, as depicted in Figures 12(c) and (d).Within the contracting loops, conductive cooling can beconsiderably reduced by stronger turbulence produced byfaster reconnection outflows (Chandran & Cowley 1998;Jiang et al. 2006). Slower cooling helps the X-ray/EUVemission of these hot loops last longer during their con-tractions and further contribute to the loop-top descent.Before and after the early impulsive phase, the situationcould be different. Loop contractions are slower and asso-ciated faster cooling can make these loops cool below theinstrumental temperature passband more rapidly. Theupward development of reconnection could thus domi-nate, leading to the upward loop-top migration. This in-terpretation is supported by the observed temporal coin-cidence of the highest velocities of individual loop shrink-ages and of the loop-top descent at the impulsive phaseonset. Like cooling, chromospheric evaporation can alsoplay a role. After the initial chromospheric evaporationassociated with energization of newly reconnected loops,if it continues operating during the subsequent loop con-tractions, the densities and thus emission measures ofthese loops would keep rising and contribute to the down-ward loop-top drift. Otherwise, if it rapidly subsides,it would assist the upward loop-top drift. Investigatingsuch a complex interplay would require detailed numeri-cal modeling, which is beyond our scope here.
6.3. Discussion
The fast downward contractions of EUV loops arebest seen during the decay phase, likely because of theirgreater distances traveled making them easier to be de-tected. Likewise, different environments may explain thefactor of two difference in the median deceleration be-
tween the early and later fast contractions (Figures 7(f)and (g)). The earlier, compact flare loops of strongermagnetic field can produce stronger resistance (e.g., bythe Lorentz force from a reverse current; Barta et al.2008) to quickly brake the contracting loops impingingon them from above, while the later, large flare arcadeof weaker field at greater heights and greater travel dis-tances may allow more gradual deceleration.The X-ray spectra are essentially thermal during the
decay phase. This suggests that the late phase contrac-tions are associated with plasma heating rather than par-ticle acceleration. This is expected because the mag-netic field strength decreases with height, and so doesthe available magnetic energy to be released by reconnec-tion. Such prolonged heating may contribute to the well-known slower than expected cooling of flare plasma (seeFigure 1(d); McTiernan et al. 1993; Jiang et al. 2006).The fast high-altitude contractions and slow low-
altitude shrinkages appear as two statistically distinctpopulations. The median final velocity of the former ismore than four times the median initial velocity of thelatter (−73 vs. −17 kms−1; Figures 6 and 7). We haveinterpreted the latter as the late stages of the formerthat have decelerated, but we rarely see a continuoustrack decelerating from >400 kms−1 to a few km s−1.Alternatively, this distinction may be due to inhomo-geneity of reconnection (see, e.g., Asai et al. 2004) inthe current sheet above the flare arcade that is primar-ily oriented along the line of sight. The persistent slowshrinkages could result from reconnection at a moder-ate rate throughout the current sheet, which producesflare loops forming the arcade and double ribbons attheir footpoints. The episodic fast contractions couldbe signatures of plasmoids within the current sheet, as-sociated with enhanced reconnection and energy releaserates. These fast contracting loops are dispersed alongthe line of sight amidst slowly shrinking loops, producingthe observed effects (e.g., Figure 7(b)).There are other physically different (though not nec-

Particle Acceleration in Reconnection Outflows 15
essarily unrelated) phenomena that share similar obser-vational signatures and should not be confused with thecontractions of newly reconnected loops studied here. Forexample, pre-existing coronal loops can contract at typ-ical speeds <100 kms−1 during eruptions (Liu & Wang2010; Liu et al. 2012a; Sun et al. 2012), interpreted asimplosion (Hudson 2000; Janse & Low 2007) due to therapid release of magnetic energy and thus reduction ofmagnetic pressure within the eruption volume. Whena CME eruption initiates at an elevated height, it canproduces a downward push to displace ambient coro-nal loops (e.g., Liu et al. 2012c, see their Figure 12(h),at −60 kms−1). Even slower shrinkage at −3 kms−1
can occur in active region loops due to gradual cooling(Wang et al. 1997). Sometimes, conjugate X-ray foot-points approach each other while the loop-top source de-scends (Ji et al. 2006; Liu et al. 2009a; Yang et al. 2009),likely because of reconnection progressing toward lesssheared loops at lower altitudes. We have not foundthese signatures in the flare under study here, exceptfor a few overlying existing loops that contract at about−150 kms−1 during 05:40–05:50 UT near the end of theimpulsive phase. In addition, some high-lying loopscontinue to expand and erupt at ∼100 kms−1 up to08:00 UT, three hours after the original flux rope erup-tion. Examination of such features and quantitative com-parison of these observations with particle accelerationmodels will be subjects of future investigations.
W.L. was supported by NASA SDO/AIA con-tract NNG04EA00C and LWS/TR&T contractNNX11AO68G. Q.R.C. and V.P. were supportedby NASA grants NNX10AC06G and NNX13AF79G.W.L. thanks Marian Karlicky, Paul Cassak, HughHudson, Sasha Kosovichev, Judy Karpen, Rick DeVore,Greg Slater, Tom Berger, and Mark Cheung for usefuldiscussions.
APPENDIX AOBSERVATIONS OF ALL AIA CHANNELS
In the main text, we focused on the 131 A channel. Fora complete temperature coverage, we examine all AIAchannels here. As shown in Figure 13 (top), each chan-nel has a generally broad response with one to a fewpeaks. In the order of approximately decreasing temper-ature response are 193, 131, 94, 304, 335, 211, and 171 Achannels.Figure 13 shows space-time plots of all EUV channels.
On the left are base ratio from every other frame of shortexposure so that bright flare loops are not over-exposed,while on the right are running ratio from frames of regu-lar exposure that is needed for detecting faint emission,including fast loop contractions, above the flare arcade.On the left, the 131 and 94 A channels capture the hot,diffuse loop-top emission, while the flare arcade under-neath it is best seen in cooler channels. Both regions ap-pear in the 193 A channel because of its dual response tohot Fe XXIV emission peaking at 18MK and cool Fe XII
emission at 1.6MK (O’Dwyer et al. 2010). On the right-hand side, downward fast contractions and slow shrink-
ages can be identified in the three hottest channels. Incooler channels, cooling condensations rain down the ar-cade loops since 06:00 UT at up to ∼170 kms−1 or 90%of the free fall speed, faster than typical coronal rain(Antolin & Rouppe van der Voort 2012).In Figure 13 (left), the erupting flux rope is best seen
in the hot 131 and 94 A channels as a bright, accelerat-ing track, indicating its high temperature, as also shownin Figure 11. Its evolution from gradual rise to impul-sive eruption is accompanied by the rapid increase inX-ray flux and the loop-top’s ascent-to-descent transi-tion. This is in line with observed synchronous eruptionaccelerations and flare onsets (Zhang et al. 2001, 2002;Temmer et al. 2008; Liu et al. 2011a).Figures 1(b) and 4(a) show temporal emission profiles
taken from the base-ratio space-time plots at href = 60′′
marked by a cross. Since 04:17 UT, the 131 and 94 Aemission increases considerably, while other emission re-mains essentially flat. This indicates gentle heating earlyin the flare, as seen in the temperature history at this po-sition shown in Figure 11(j). The dip in all channels atthe onset of the impulsive phase (vertical dashed line)is due to the descent of the loop-top source. The largehump afterwards results from the growth of the flare ar-cade toward greater heights. This hump generally pro-gresses toward cooler channels, indicating a cooling se-quence, similar to those recently observed in flares, ARloops, and prominence condensations (Woods et al. 2011;Viall & Klimchuk 2012; Liu et al. 2012b; Berger et al.2012). The double humps at 193 A are again due toits dual temperature response.Like 193 A, the 304 A channel responds to both hot
Ca XVIII emission at 7.1 MK and cool He II emissionat 0.05MK. The dual response of these two channelsleads to their unusually large descent of about 40% ofthe loop-top centroids (see Table 2). This is becausetheir maximum loop-top heights are dominated by hotemission, while the minimum heights are dominated bycool emission at even lower heights (Figure 4).
APPENDIX BDISAMBIGUATION WITH STEREO OBSERVATIONS
The limb view of SDO/AIA leaves an alternative pos-sibility of the loop-top descent as the progression of en-ergization from high- to low-lying loops along the arcadein the east-west direction. This possibility is not sup-ported by STEREO-A (STA) that was 121◦ ahead ofthe Earth and observed the flare on the disk. Whenthe X-ray loop-top descent occurs, the STA 195 A im-age (Figure 14(d)) shows a compact cusp-shaped loop,while the arcade system develops later (panels (e) and(f)). One could further argue that a temperature effect,i.e., cooling or heating, can make a progression appearas a compact source rather than an arcade. If so, theloops being cooled or heated would have appeared at thesame location and been captured by AIA in cooler orhotter EUV channels or by RHESSI in X-rays. Instead,all available EUV and X-ray data covering a wide tem-perature range of 105–107K show a consistent loop-topdescent, which must be a real mass motion.
REFERENCES
Antolin, P. & Rouppe van der Voort, L. 2012, ApJ, 745, 152 Asai, A., Yokoyama, T., Shimojo, M., & Shibata, K. 2004, ApJ,605, L77

16 Liu et al.
Fig. 13.— Top: Temperature response of AIA EUV channels. Other panels: Space-time plots of all AIA EUV channels in base ratiofrom Cut 0 on the left and in running ratio from Cut 3 on the right. The panels are arranged approximately in the order from highto low temperature response. The cross and horizontal dash line on the left mark the slice for obtaining the temporal profiles shown inFigure 1(b). The dotted line in (e) is a parabolic fit to the central portion of the erupting flux rope CME that has an average accelerationof a = 0.114± 0.002 km s−2 and achieves a velocity of vf = 153 ± 3 km s−1 at the edge of AIA’s FOV.
Aschwanden, M. J., Boerner, P., Schrijver, C. J., &Malanushenko, A. 2011, Sol. Phys., 384
Bain, H. M., Krucker, S., Glesener, L., & Lin, R. P. 2012, ApJ,750, 44
Barta, M., Vrsnak, B., & Karlicky, M. 2008, A&A, 477, 649Battaglia, M., Fletcher, L., & Benz, A. O. 2009, A&A, 498, 891Battaglia, M. & Kontar, E. P. 2012, ApJ, 760, 142Berger, T. E., Liu, W., & Low, B. C. 2012, ApJ, 758, L37Carmichael, H. 1964, in The Physics of Solar Flares, ed. W. N.
Hess, 451Caspi, A. & Lin, R. P. 2010, ApJ, 725, L161Cassak, P. A. & Drake, J. F. 2013, submitted to ApJ
Cassak, P. A., Drake, J. F., & Shay, M. A. 2006, ApJ, 644, L145Chandran, B. D. G. 2003, ApJ, 599, 1426Chandran, B. D. G. & Cowley, S. C. 1998, Physical Review
Letters, 80, 3077Chen, Q. & Petrosian, V. 2012, ApJ, 748, 33Fleishman, G. D. & Toptygin, I. N. 2013, MNRAS, 447Fletcher, L., Dennis, B. R., Hudson, H. S., et al. 2011,
Space Sci. Rev., 159, 19Forbes, T. G. & Acton, L. W. 1996, ApJ, 459, 330Forbes, T. G. & Priest, E. R. 1983, Sol. Phys., 84, 169Furth, H. P., Killeen, J., & Rosenbluth, M. N. 1963, Physics of
Fluids, 6, 459

Particle Acceleration in Reconnection Outflows 17
Fig. 14.— Comparison of SDO/AIA 193 A (top) and STEREO-A 195 A (bottom) images of the flare. The STEREO images are scaledas if they are viewed from the same heliocentric distance as SDO. The heliographic grids are spaced at 5◦. Note the compact brighteningat the impulsive phase onset (pointed by the arrow), in contrast to the extended arcade system later.
Glesener, L., Krucker, S., & Lin, R. P. 2012, ApJ, 754, 9Grady, K. J., Neukirch, T., & Giuliani, P. 2012, A&A, 546, A85Guo, F. & Giacalone, J. 2012, ApJ, 753, 28Haerendel, G. 2009, ApJ, 707, 903Hamilton, R. J. & Petrosian, V. 1992, ApJ, 398, 350Hara, H., Watanabe, T., Harra, L. K., Culhane, J. L., & Young,
P. R. 2011, ApJ, 741, 107Hirayama, T. 1974, Sol. Phys., 34, 323Holman, G. D. 2012, Physics Today, 65, 56Holman, G. D., Aschwanden, M. J., Aurass, H., Battaglia, M.,
Grigis, P. C., Kontar, E. P., Liu, W., Saint-Hilaire, P., &Zharkova, V. V. 2011, Space Sci. Rev., 159, 107
Hudson, H. S. 2000, ApJ, 531, L75Innes, D. E., Inhester, B., Axford, W. I., & Wilhelm, K. 1997,
Nature, 386, 811Innes, D. E., McKenzie, D. E., & Wang, T. 2003, Sol. Phys., 217,
247Janse, A. M. & Low, B. C. 2007, A&A, 472, 957Ji, H., Huang, G., Wang, H., Zhou, T., Li, Y., Zhang, Y., & Song,
M. 2006, ApJ, 636, L173Jiang, Y. W., Liu, S., Liu, W., & Petrosian, V. 2006, ApJ, 638,
1140Jiang, Y. W., Liu, S., & Petrosian, V. 2009, ApJ, 698, 163Karlicky, M. 2006, Space Sci. Rev., 122, 161Karlicky, M. & Kosugi, T. 2004, A&A, 419, 1159Karpen, J. T., Antiochos, S. K., & DeVore, C. R. 2012, ApJ, 760,
81Khan, J. I., Bain, H. M., & Fletcher, L. 2007, A&A, 475, 333Ko, Y.-K., Raymond, J. C., Lin, J., Lawrence, G., Li, J., &
Fludra, A. 2003, ApJ, 594, 1068Kopp, R. A. & Pneuman, G. W. 1976, Sol. Phys., 50, 85Krucker, S., Hudson, H. S., Glesener, L., White, S. M., Masuda,
S., Wuelser, J.-P., & Lin, R. P. 2010, ApJ, 714, 1108Lemen, J. R., Title, A. M., Akin, D. J., et al. 2012, Sol. Phys.,
275, 17Li, Y. P. & Gan, W. Q. 2005, ApJ, 629, L137—. 2006, ApJ, 644, L97—. 2007, Advances in Space Research, 39, 1389Lin, J. 2004, Sol. Phys., 222, 115Lin, J., Ko, Y.-K., Sui, L., Raymond, J. C., Stenborg, G. A.,
Jiang, Y., Zhao, S., & Mancuso, S. 2005, ApJ, 622, 1251Lin, R. P., Dennis, B. R., Hurford, G. J., et al. 2002, Sol. Phys.,
210, 3Liu, R. 2013, submitted to ApJLiu, R., Lee, J., Wang, T., Stenborg, G., Liu, C., & Wang, H.
2010, ApJ, 723, L28
Liu, R., Liu, C., Torok, T., Wang, Y., & Wang, H. 2012a, ApJ,757, 150
Liu, R. & Wang, H. 2010, ApJ, 714, L41Liu, W., Berger, T. E., & Low, B. C. 2012b, ApJ, 745, L21Liu, W., Berger, T. E., Title, A. M., Tarbell, T. D., & Low, B. C.
2011a, ApJ, 728, 103Liu, W., Jiang, Y. W., Liu, S., & Petrosian, V. 2004, ApJ, 611,
L53Liu, W., Ofman, L., Nitta, N. V., Aschwanden, M. J., Schrijver,
C. J., Title, A. M., & Tarbell, T. D. 2012c, ApJ, 753, 52Liu, W., Petrosian, V., Dennis, B. R., & Holman, G. D. 2009a,
ApJ, 693, 847Liu, W., Petrosian, V., Dennis, B. R., & Jiang, Y. W. 2008, ApJ,
676, 704Liu, W., Petrosian, V., & Mariska, J. T. 2009b, ApJ, 702, 1553Liu, W., Title, A. M., Zhao, J., Ofman, L., Schrijver, C. J.,
Aschwanden, M. J., De Pontieu, B., & Tarbell, T. D. 2011b,ApJ, 736, L13
Liu, W., Wang, T.-J., Dennis, B. R., & Holman, G. D. 2009c,ApJ, 698, 632
Longcope, D. W., Guidoni, S. E., & Linton, M. G. 2009, ApJ,690, L18
Masuda, S., Kosugi, T., Hara, H., Tsuneta, S., & Ogawara, Y.1994, Nature, 371, 495
McKenzie, D. E. & Hudson, H. S. 1999, ApJ, 519, L93McTiernan, J. M., Kane, S. R., Loran, J. M., Lemen, J. R., Acton,
L. W., Hara, H., Tsuneta, S., & Kosugi, T. 1993, ApJ, 416, L91Miller, J. A., Larosa, T. N., & Moore, R. L. 1996, ApJ, 461, 445Milligan, R. O. & Dennis, B. R. 2009, ApJ, 699, 968Milligan, R. O., McAteer, R. T. J., Dennis, B. R., & Young, C. A.
2010, ApJ, 713, 1292Murphy, N. A., Miralles, M. P., Pope, C. L., et al. 2012, ApJ,
751, 56Nakariakov, V. M. & Melnikov, V. F. 2009, Space Sci. Rev., 149,
119Neupert, W. M. 1968, ApJ, 153, L59Nishizuka, N. & Shibata, K. 2013, ArXiv e-printsNishizuka, N., Takasaki, H., Asai, A., & Shibata, K. 2010, ApJ,
711, 1062Nitta, N. V., Freeland, S. L., & Liu, W. 2010, ApJ, 725, L28O’Dwyer, B., Del Zanna, G., Mason, H. E., Weber, M. A., &
Tripathi, D. 2010, A&A, 521, A21Ofman, L., Liu, W., Title, A., & Aschwanden, M. 2011, ApJ, 740,
L33Patsourakos, S., Vourlidas, A., & Stenborg, G. 2013, ApJ, 764,
125

18 Liu et al.
Petrosian, V. 2012, Space Sci. Rev., 173, 535Petrosian, V. & Liu, S. 2004, ApJ, 610, 550Petrosian, V., Yan, H., & Lazarian, A. 2006, ApJ, 644, 603Pick, M., Demoulin, P., Krucker, S., Malandraki, O., & Maia, D.
2005, ApJ, 625, 1019Raymond, J. C., Krucker, S., Lin, R. P., & Petrosian, V. 2012,
Space Sci. Rev., 173, 197Reeves, K. K., Seaton, D. B., & Forbes, T. G. 2008, ApJ, 675, 868Reznikova, V. E., Melnikov, V. F., Ji, H., & Shibasaki, K. 2010,
ApJ, 724, 171Savage, S. L., Holman, G., Reeves, K. K., Seaton, D. B.,
McKenzie, D. E., & Su, Y. 2012, ApJ, 754, 13Savage, S. L. & McKenzie, D. E. 2011, ApJ, 730, 98Sheeley, Jr., N. R., Warren, H. P., & Wang, Y.-M. 2004, ApJ,
616, 1224Shen, C., Lin, J., & Murphy, N. A. 2011, ApJ, 737, 14Shen, J., Zhou, T., Ji, H., Wang, N., Cao, W., & Wang, H. 2008,
ApJ, 686, L37Shen, Y. & Liu, Y. 2012, ApJ, 753, 53Somov, B. V. & Kosugi, T. 1997, ApJ, 485, 859Sturrock, P. A. 1966, Nature, 211, 695Su, Y., Dennis, B. R., Holman, G. D., Wang, T., Chamberlin,
P. C., Savage, S., & Veronig, A. 2012, ApJ, 746, L5Sui, L. & Holman, G. D. 2003, ApJ, 596, L251Sui, L., Holman, G. D., & Dennis, B. R. 2004, ApJ, 612, 546Sun, X., Hoeksema, J. T., Liu, Y., Wiegelmann, T., Hayashi, K.,
Chen, Q., & Thalmann, J. 2012, ApJ, 748, 77Svestka, Z., Farnık, F., Hudson, H. S., & Hick, P. 1998,
Sol. Phys., 182, 179Svestka, Z. F., Fontenla, J. M., Machado, M. E., Martin, S. F., &
Neidig, D. F. 1987, Sol. Phys., 108, 237
Takasao, S., Asai, A., Isobe, H., & Shibata, K. 2012, ApJ, 745, L6Tandberg-Hanssen, E. & Emslie, A. G. 1988, The physics of solar
flares (Cambridge and New York: Cambridge University Press,286 p.)
Temmer, M., Veronig, A. M., Vrsnak, B., Rybak, J., Gomory, P.,Stoiser, S., & Maricic, D. 2008, ApJ, 673, L95
Tsuneta, S. & Naito, T. 1998, ApJ, 495, L67Veronig, A. M., Karlicky, M., Vrsnak, B., Temmer, M.,
Magdalenic, J., Dennis, B. R., Otruba, W., & Potzi, W. 2006,A&A, 446, 675
Viall, N. M. & Klimchuk, J. A. 2012, ApJ, 753, 35Vrsnak, B., Temmer, M., Veronig, A., Karlicky, M., & Lin, J.
2006, Sol. Phys., 234, 273Wang, J., Shibata, K., Nitta, N., Slater, G. L., Savy, S. K., &
Ogawara, Y. 1997, ApJ, 478, L41Wang, T. J., Sui, L., & Qiu, J. 2007, ApJ, 661, L207Wang, Y.-M., Sheeley, N. R., Howard, R. A., St. Cyr, O. C., &
Simnett, G. M. 1999, Geophys. Res. Lett., 26, 1203Warren, H. P., O’Brien, C. M., & Sheeley, Jr., N. R. 2011, ApJ,
742, 92Watanabe, T., Hara, H., Sterling, A. C., & Harra, L. K. 2012,
Sol. Phys., 185Woods, T. N., Hock, R., Eparvier, F., et al. 2011, ApJ, 739, 59Yang, Y.-H., Cheng, C. Z., Krucker, S., Lin, R. P., & Ip, W. H.
2009, ApJ, 693, 132Yokoyama, T., Akita, K., Morimoto, T., Inoue, K., & Newmark,
J. 2001, ApJ, 546, L69Zhang, J., Dere, K. P., Howard, R. A., Kundu, M. R., & White,
S. M. 2001, ApJ, 559, 452Zhang, M., Golub, L., DeLuca, E., & Burkepile, J. 2002, ApJ,
574, L97
![ATEX style emulateapj v. 5/2/11 · arXiv:1207.2466v1 [astro-ph.SR] 10 Jul 2012 Draftversion July12,2012 Preprint typeset using LATEX style emulateapj v. 5/2/11 MULTIWAVELENGTH OBSERVATIONS](https://img.pdfslide.us/doc/110x75/6016222b988c62529a259b46/atex-style-emulateapj-v-5211-arxiv12072466v1-astro-phsr-10-jul-2012-draftversion.jpg)


![ATEX style emulateapj v. 5/2/11 - arXiv · 2019-05-06 · arXiv:1504.08222v1 [astro-ph.SR] 30 Apr 2015 Draftversion November27,2017 Preprint typeset using LATEX style emulateapj v](https://img.pdfslide.us/doc/110x75/5f9c0f7847086871604471b2/atex-style-emulateapj-v-5211-arxiv-2019-05-06-arxiv150408222v1-astro-phsr.jpg)
![Received 2012May31 ATEX style emulateapj v. 5/2/11 · 2018. 10. 24. · arXiv:1206.4303v2 [astro-ph.CO] 1 Aug 2012 Received 2012May31 Preprint typeset using LATEX style emulateapj](https://img.pdfslide.us/doc/110x75/60b25dfbe4684b238c402908/received-2012may31-atex-style-emulateapj-v-5211-2018-10-24-arxiv12064303v2.jpg)


![ATEX style emulateapj v. 5/2/11 - arXiv · 2016-09-20 · arXiv:1609.05476v1 [astro-ph.CO] 18 Sep 2016 Draftversion September20,2016 Preprint typeset using LATEX style emulateapj](https://img.pdfslide.us/doc/110x75/5e9d2388e86d7a3b9e5022a2/atex-style-emulateapj-v-5211-arxiv-2016-09-20-arxiv160905476v1-astro-phco.jpg)