Embed Size (px)
Citation preview
Digital Spectrum Analyzer
Model AT5010D
User’s Guide
1
Safety Summary
The following safety precautions apply to both operating and maintenance personnel and must be observed during all phases
of operation, service, and repair of this instrument. Before applying power, follow the installation instructions and become
familiar with the operating instructions for this instrument.
Failure to comply with these precautions or with specific warnings elsewhere in this manual violates safety standards of design,
manufacture, and intended use of the instrument. Atten Instruments assumes no liability for a customer’s failure to comply with
these requirements. This is a Safety Class I instrument.
The most sensitive component of the AT5010D is the input section of the Spectrum Analyzer. It consists of the signal
attenuator and the first mixer. Without input attenuation, the voltage at the input must not exceed +10 dB (0.7 Vrms) AC or +25
volt DC. With a maximum input attenuation of 40dB the AC voltage must not exceed +20dBm(2.2Vrms). These limits must not
be exceeded otherwise the input attenuator and/or the fist mixer would be destroyed. When measuring via a LISN (line
impedance stabilization network) the input of the Spectrum Analyzer must be protected by means of a transient limiter.
GROUND THE INSTRUMENT
To minimize shock hazard, the instrument chassis and cabinet must be connected to an electrical ground. This instrument is
grounded through the ground conductor of the supplied, three-conductor ac power cable. The power cable must be plugged
into an approved three-conductor electrical outlet. Do not alter the ground connection. Without the protective ground
connection, all accessible conductive parts (including control knobs) can render an electric shock. The power jack and
mating plug of the power cable meet IEC safety standards.
Prior to examining unidentified signals, the presence of unacceptable high voltages has to be checked. It is also
recommended to start measurements with the highest possible attenuation and a maximum frequency range (1000MHz). The
user should also consider the possibility of excessively high signal amplitudes outside the covered frequency range, although
not displayed (e.g. 1200MHz). The frequency range of 0Hz~150KHz is not specified for the AT5010D Spectrum Analyzers.
Spectral lines within this range would be displayed with incorrect amplitude. A particularly high intensity setting shall be
avoided. The way signals are displayed on the spectrum analyzer typically allows for any signal to be recognized easily, even
with low intensity.
Due to the frequency conversion principle, a spectral line is visible at 0Hz. It is called If-feedthrough. The line appears when
the 1st LO frequency passes the If amplifiers and filters. The level of this spectral line is different in each instrument. A
deviation from the full screen does not indicate a malfunctioning instrument.
DO NOT OPERATE IN AN EXPLOSIVE ATMOSPHERE
Do not operate the instrument in the presence of flammable gases or fumes. Operation of any electrical instrument in such
an environment constitutes a definite safety hazard.
KEEP AWAY FROM LIVE CIRCUITS
Instrument covers must not be removed by operating personnel. Component replacement and internal adjustments must
be made by qualified maintenance personnel. Disconnect the power cord before removing the instrument covers and
replacing components. Under certain conditions, even with the power cable removed, dangerous voltages may exist. To
avoid injuries, always disconnect power and discharge circuits before touching them.
2
Product Introduction
Description
AT5010D is the perfect instrument for analyzing any kind of signal within the frequency range of 0.15 to 1050
MHz, and is best suited for meeting the RF measurement needs of education and industry. Also a great tool
for professionals in the cable TV industry as well as in the telecommunication. It is a value packed service tool
for signals up to 1.05GHz. Both models are suitable for pre-compliance testing during development prior to
third party testing.
An optional near-field sniffer probe set can be used to locate cable and PC board emission “hot spots” and
evaluate EMC problems at the breadboard and prototype level. The spectrum analyzer/ sniffer probe
combination is an excellent solution for RF leakage/ radiation investigation, CATV/MATV system
troubleshooting, cellular telephone/pocket pager test and EMI diagnostics.
The spectrum analyzer permits the detection of spectrum components of electrical signals in the frequency
range of 0.15 to 1050MHz. The detected signal and its content have to be repetitive. In contrast to an
oscilloscope operated in Yt mode, where the amplitude is displayed on the time domain, the spectrum
analyzer displays amplitude on the frequency domain (Yf). The individual spectrum components of "a signal"
become visible on a spectrum analyzer. The oscilloscope would display the same signal as one resulting
waveform.
The spectrum analyzer works according to the triple superhot receiver principle. The signal to be measured
(fin = 0.15MHz to 1050MHz) is applied in to the 1st mixer it is mixed with the signal of a variable voltage
controlled oscillator (fL0= 1350MHz~ 2350MHz).This oscillator is called the 1st LO (local oscillator). The
difference between the oscillator and the input frequency (fL0 - fin = 1st IF) is the first L0 in intermediate
frequency, which passes through a waveband filter tuned to a center frequency of 1350MHz. It then enters an
amplifier, and this is followed by two additional mixing stages, oscillators and amplifiers. The second IF is
35MHz and the third is 2.875MHz. in the third IF stage, the signal can be selectively transferred through a
filter with 400KHz or 20KHz bandwidth before arriving at an AM demodulator.
Applications
• AT5010D spectrum analyzer can carry out good inspection to the faults of cable system and wireless
system including remote control, cordless phone, cable TV and communication equipment, as well as
good comparison and analysis to frequency of signals.
• AT5010D spectrum analyzers can test mobile phone, RF circuits, for example, control signal of logic
circuit, baseband signal; local oscillator signal of RF circuit, IF signal and transmission signal, It is very
quick and accurate to use AT5000 series spectrum analyzers to overhaul the fault of mobile phone which
cannot enter the network, and determine the fault point.
• Spectrum analyzers can display the information of un-processed original signals, such as the voltage,
power, period, waveform, sideband, and frequency.
• The commonplace measurement modes of spectrum analyzers include: harmonic distortion, dual-tone
crosstalk distortion, and clutter investigation etc.

3
• Electromagnetic Compatible (EMC) Testing: measure the function of harmful electromagnetic wave to be
transmitted by various electronic equipments. In addition, it can output AM/FM demodulation signal from
socket PHONE, identify the broadcast signal affected by noise. From authorization aspect, it is very
effective measurement function for the evaluation and research in advance to carry out the measurement
of radioactive noise.
• Widely used for production, development, education and scientific research. True form of signal (such as
RF pulse signal) can be observed from ATTEN spectrum analyzer clearly, where figures are expanded by
Fourier series, good for apprehend in education and research.
4
Specifications
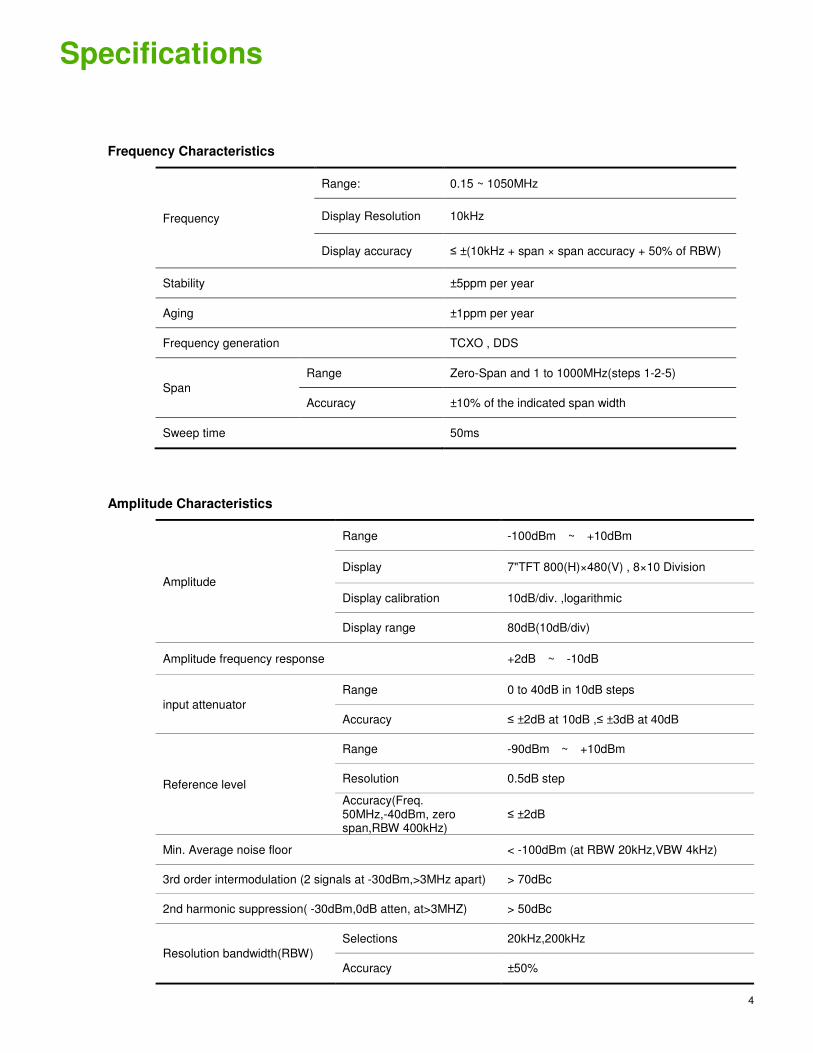
Frequency Characteristics
Frequency
Range: 0.15 ~ 1050MHz
Display Resolution 10kHz
Display accuracy ≤ ±(10kHz + span × span accuracy + 50% of RBW)
Stability ±5ppm per year
Aging ±1ppm per year
Frequency generation TCXO , DDS
Span
Range Zero-Span and 1 to 1000MHz(steps 1-2-5)
Accuracy ±10% of the indicated span width
Sweep time 50ms
Amplitude Characteristics
Amplitude
Range -100dBm ~ +10dBm
Display 7"TFT 800(H)×480(V) , 8×10 Division
Display calibration 10dB/div. ,logarithmic
Display range 80dB(10dB/div)
Amplitude frequency response +2dB ~ -10dB
input attenuator
Range 0 to 40dB in 10dB steps
Accuracy ≤ ±2dB at 10dB ,≤ ±3dB at 40dB
Reference level
Range -90dBm ~ +10dBm
Resolution 0.5dB step
Accuracy(Freq. 50MHz,-40dBm, zero span,RBW 400kHz)
≤ ±2dB
Min. Average noise floor < -100dBm (at RBW 20kHz,VBW 4kHz)
3rd order intermodulation (2 signals at -30dBm,>3MHz apart) > 70dBc
2nd harmonic suppression( -30dBm,0dB atten, at>3MHZ) > 50dBc
Resolution bandwidth(RBW)
Selections 20kHz,200kHz
Accuracy ±50%
5
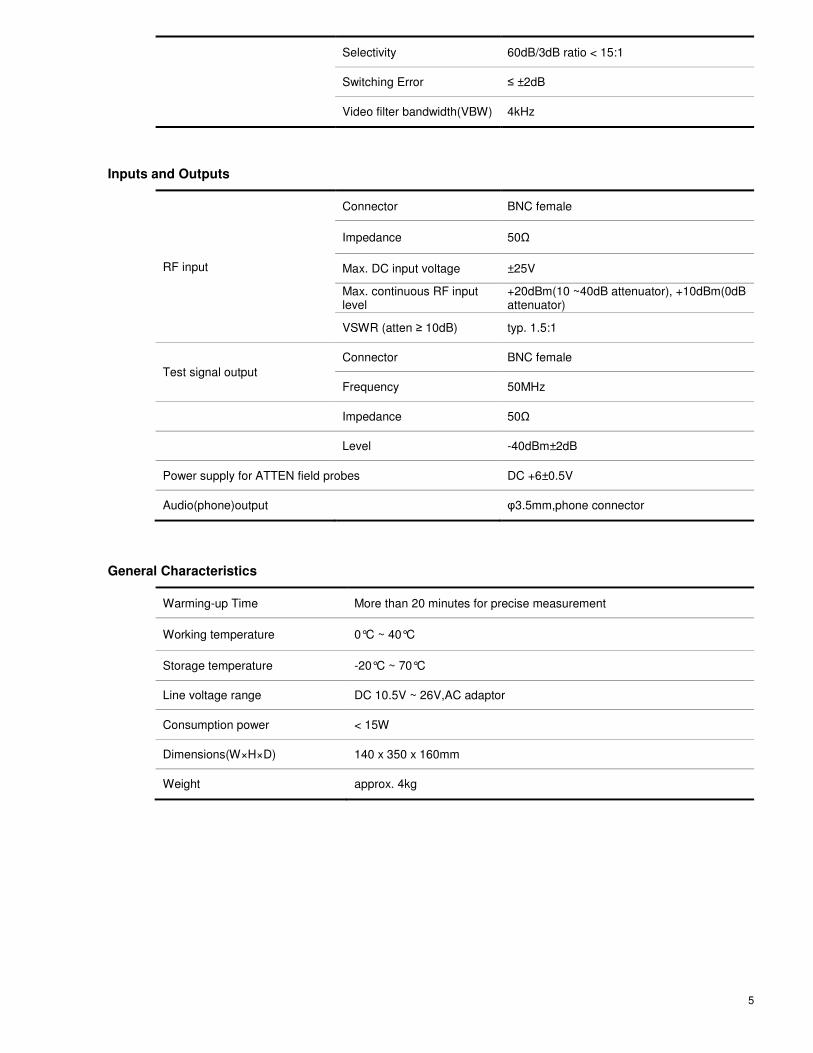
Selectivity 60dB/3dB ratio < 15:1
Switching Error ≤ ±2dB
Video filter bandwidth(VBW) 4kHz
Inputs and Outputs
RF input
Connector BNC female
Impedance 50Ω
Max. DC input voltage ±25V
Max. continuous RF input level
+20dBm(10 ~40dB attenuator), +10dBm(0dB attenuator)
VSWR (atten ≥ 10dB) typ. 1.5:1
Test signal output
Connector BNC female
Frequency 50MHz
Impedance 50Ω
Level -40dBm±2dB
Power supply for ATTEN field probes DC +6±0.5V
Audio(phone)output φ3.5mm,phone connector
General Characteristics
Warming-up Time More than 20 minutes for precise measurement
Working temperature 0°C ~ 40°C
Storage temperature -20°C ~ 70°C
Line voltage range DC 10.5V ~ 26V,AC adaptor
Consumption power < 15W
Dimensions(W×H×D) 140 x 350 x 160mm
Weight approx. 4kg
6
Panel description
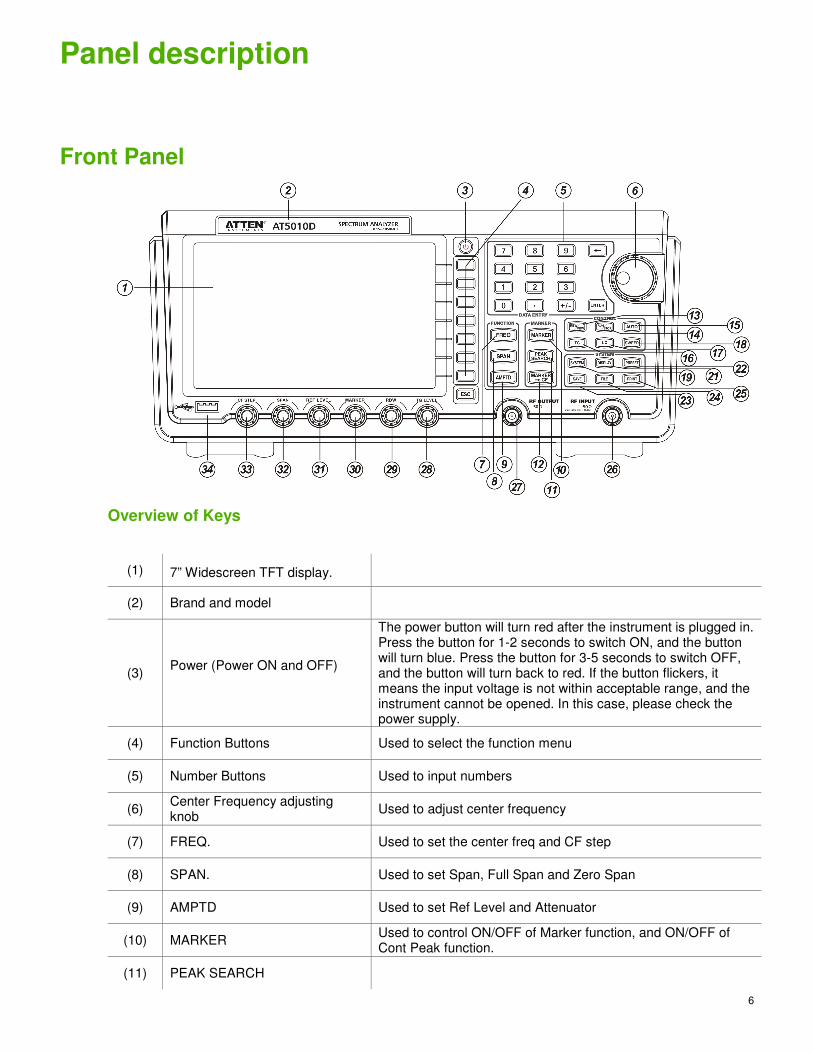
Front Panel
Overview of Keys
(1) 7” Widescreen TFT display.
(2) Brand and model
(3) Power (Power ON and OFF)
The power button will turn red after the instrument is plugged in. Press the button for 1-2 seconds to switch ON, and the button will turn blue. Press the button for 3-5 seconds to switch OFF, and the button will turn back to red. If the button flickers, it means the input voltage is not within acceptable range, and the instrument cannot be opened. In this case, please check the power supply.
(4) Function Buttons Used to select the function menu
(5) Number Buttons Used to input numbers
(6) Center Frequency adjusting knob
Used to adjust center frequency
(7) FREQ. Used to set the center freq and CF step
(8) SPAN. Used to set Span, Full Span and Zero Span
(9) AMPTD Used to set Ref Level and Attenuator
(10) MARKER Used to control ON/OFF of Marker function, and ON/OFF of Cont Peak function.
(11) PEAK SEARCH
7
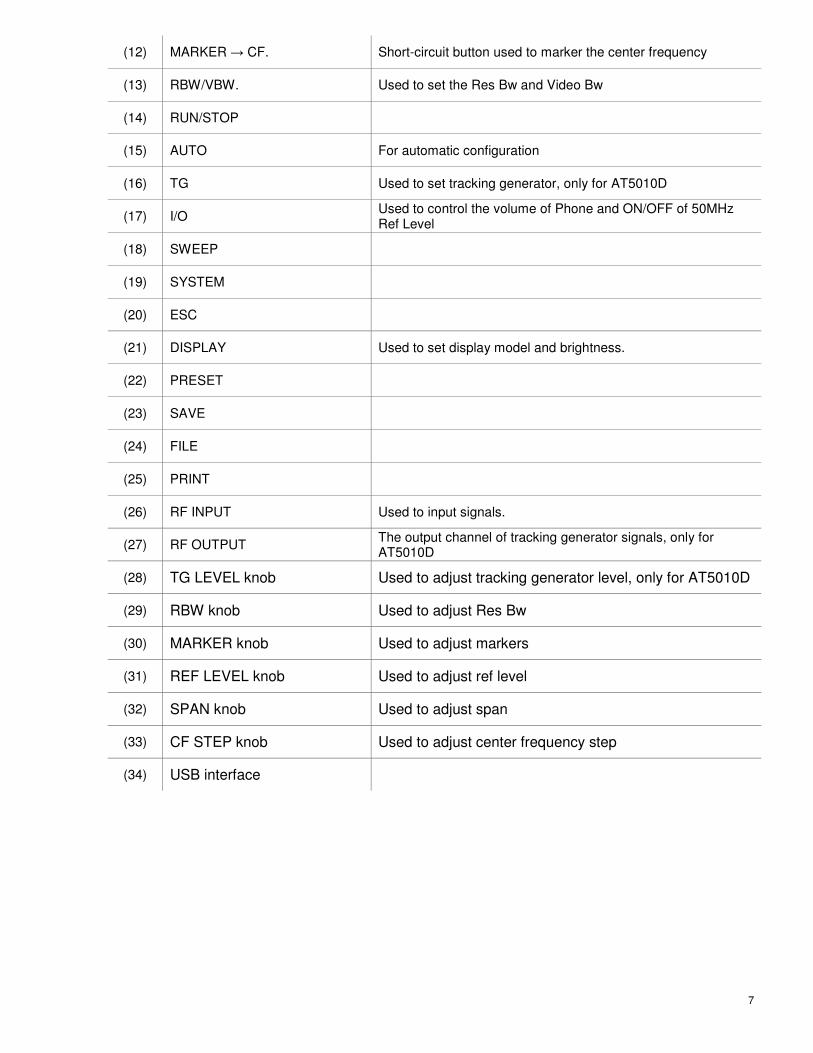
(12) MARKER → CF. Short-circuit button used to marker the center frequency
(13) RBW/VBW. Used to set the Res Bw and Video Bw
(14) RUN/STOP
(15) AUTO For automatic configuration
(16) TG Used to set tracking generator, only for AT5010D
(17) I/O Used to control the volume of Phone and ON/OFF of 50MHz Ref Level
(18) SWEEP
(19) SYSTEM
(20) ESC
(21) DISPLAY Used to set display model and brightness.
(22) PRESET
(23) SAVE
(24) FILE
(25) PRINT
(26) RF INPUT Used to input signals.
(27) RF OUTPUT The output channel of tracking generator signals, only for AT5010D
(28) TG LEVEL knob Used to adjust tracking generator level, only for AT5010D
(29) RBW knob Used to adjust Res Bw
(30) MARKER knob Used to adjust markers
(31) REF LEVEL knob Used to adjust ref level
(32) SPAN knob Used to adjust span
(33) CF STEP knob Used to adjust center frequency step
(34) USB interface
8
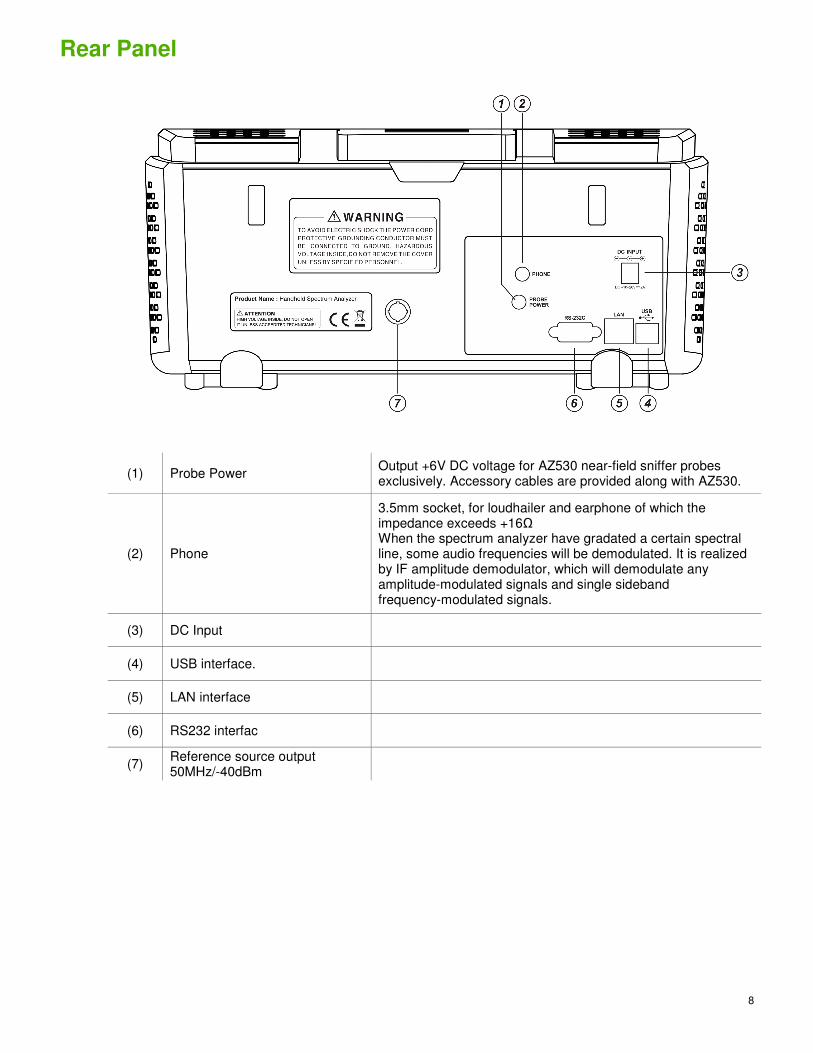
Rear Panel
(1) Probe Power Output +6V DC voltage for AZ530 near-field sniffer probes exclusively. Accessory cables are provided along with AZ530.
(2) Phone
3.5mm socket, for loudhailer and earphone of which the impedance exceeds +16Ω When the spectrum analyzer have gradated a certain spectral line, some audio frequencies will be demodulated. It is realized by IF amplitude demodulator, which will demodulate any amplitude-modulated signals and single sideband frequency-modulated signals.
(3) DC Input
(4) USB interface.
(5) LAN interface
(6) RS232 interfac
(7) Reference source output 50MHz/-40dBm
9
Introduction to Spectrum Analysis
The analysis of electrical signals is a fundamental problem for many engineers and scientists. Even if
the immediate problem is not electrical, the basic parameters of interest are often changed into
electrical signals by means of transducers. The rewards for transforming physical parameters to
electrical signals are great, as many instruments are available for the analysis of electrical signals in
the time and frequency domains.
The traditional way of observing electrical signals is to view them in the time domain using and
oscilloscope. The time domain is used to recover relative timing and phase information which is
needed to characterize electric circuit behavior.
However, not all circuits can be uniquely characterized from just time domain information.
Circuit elements such as amplifiers, oscillators, mixers, modulators, detectors and filters are best
characterized by their frequency response information. This frequency information is best obtained by
viewing electrical signals in the frequency domain. To display the frequency domain requires a device
that can discriminate between frequencies while measuring the power level at each. One instrument
which displays the frequency domain is the spectrum analyzer. It graphically displays voltage or
power as a function of frequency.
In the time domain, frequency components of a signal are seen summed together. In the frequency
domain, complex signals (i.e. signals composed of more than one frequency) are separated into their
frequency components, and the power level at each frequency is displayed. The frequency domain is
a graphical representation of signal amplitude as a function of frequency. The frequency domain
contains information not found in the time domain and therefore, the spectrum analyzer has certain
advantages compared with an oscilloscope.
The analyzer is more sensitive to low level distortion than a scope. Sine waves may look in the time
domain, but in the frequency domain, harmonic distortion can be seen. The sensitivity and wide
dynamic range of the spectrum analyzer is useful for measuring low-level modulation. It can be used
to measure AM, FM and pulsed RF. The analyzer can be used to measure carrier frequency,
modulation frequency, modulation level, and modulation distortion. Frequency con-version devices
can be easily characterized. Such parameters as conversion loss, isolation, and distortion are readily
determined from the display.
The spectrum analyzer can be used to measure long and short term stability. Parameters such as
noise sidebands on an oscillator, residual FM of a source and frequency drift during warm-up can be
measured using the spectrum analyzer's calibrated scans. The swept frequency responses of a filter
or amplifier are examples of swept frequency measurements possible with a spectrum analyzer.
These measurements are simplified by using a tracking generator.
Types of Spectrum Analyzers
There are two basic types of spectrum analyzers, swept-tuned and real-time analyzers. The swept
tuned analyzers are tuned by electrically sweeping them over their frequency range. Therefore, the
frequency components of a spectrum are sampled sequentially in time. This enables periodic and
random signals to be displayed, but makes it impossible to display transient responses. Real-time
analyzers, on the other hand, simultaneously display the amplitude of all signals in the frequency
range of the analyzer; hence the name real-time. This preserves the time dependency between
signals which permits phase information to be displayed. Real-time analyzers are capable of
displaying transient responses as well as periodic and random signals.
10
The swept-tuned analyzers of the TRF (tuned radio frequency) or superheterodyne type. A TRF
analyzer consists of a bandpass filter whose center frequency is tunable over a desired frequency
range, a detector to produce vertical deflection on a CRT, and a horizontal scan generator used to
synchronize the tuned frequency to the CRT horizontal deflection. It is a simple, inexpensive analyzer
with wide frequency coverage, but lacks resolution and sensitivity. Because trf analyzers have a
swept filter they are limited in sweep width depending on the frequency range (usually one decade or
less). The resolution is determined by the filter bandwidth, and since tunable filters don't usually have
constant bandwidth, is dependent on frequency.
The most common type of spectrum analyzer differs from the TRF spectrum analyzers in that the
spectrum is swept through a fixed bandpass filter instead of sweeping the filter through the spectrum.
The analyzer is swept through a narrowband receiver which is electronically tuned in frequency by
applying a saw-tooth voltage to the frequency control element of a voltage tuned local oscillator.
This same saw-tooth voltage is simultaneously applied to the horizontal deflection plates of the CRT.
The output from the receiver is synchronously applied to the vertical deflection plates of the CRT and
a plot of amplitude versus frequency is displayed. In the digital spectrum analyzer the data from these
deflation plates are displayed over the TFTor LCD screen
The analyzer is tuned through its frequency range by varying the voltage on the LO (local oscillator).
The LO frequency is mixed with the input signal to produce an IF (intermediate frequency) which can
be detected and displayed. When the frequency difference between the input signal and the LO
frequency is equal to the IF frequency, then there is a response on the analyzer. The advantages of
the superheterodyne technique are considerable.
It obtains high sensitivity through the use of IF amplifiers, and many decades in frequency can be
tuned.
Also, the resolution can be varied by changing the bandwidth of the IF filters. However, the super
heterodyne analyzer is not real-time and sweep rates must be consistent with the IF filter time
constant. A peak at the left edge of the CRT is sometimes called the "zero frequency indicator" or
"local oscillator feedthrough". It occurs when the analyzer is tuned to zero frequency, and the local
oscillator passes directly through IF creating a peak on the Display even when no input signal is
present. (For zero frequency tuning, FLO=FIF). This effectively limits the lower tuning limit.
Spectrum Analyzer requirements
To accurately display the frequency and amplitude of a signal on a spectrum analyzer, the analyzer
itself must be properly calibrated. A spectrum analyzer properly designed for accurate frequency and
amplitude measurements has to satisfy many requirements:
• Wide tuning range
• Wide frequency display range
• Stability
• Resolution
• Flat frequency response
• High sensitivity
• Low internal distortion
11
Frequency Measurements
The frequency scale can be scanned in three different modes full, per division, and zero scan. The full
scan mode is used to locate signals because the widest frequency ranges are displayed in this mode.
(Not all spectrum analyzers offer this mode). The per-division mode is used to zoom-in on a particular
signal. In per division, the center frequency of the display is set by the Tuning control and the scale
factor is set by the Frequency Span or Scan Width control. In the zero scan mode, the analyzer acts
as a fixed-tuned receiver with selectable bandwidths.
Absolute frequency measurements are usually made from the spectrum analyzer tuning dial. Relative
frequency measurements require a linear frequency scan. By measuring the relative separation of
two signals on the display, the display, the frequency difference can be determined.
It is important that the spectrum analyzer be more stable than the signals being measured. The
stability of the analyzer depends on the frequency stability of its local oscillators. Stability is usually
characterized as either short term or long term.
Residual FM is a measure of the short term stability which is usually specified in Hz peak-to-peak.
Short term stability is also characterized by noise sidebands which are a measure of the analyzers
spectral purity. Noise sidebands are specified in terms of dB down and Hz away from a carrier in a
specific bandwidth. Long term stability is characterized by the frequency drift of the analyzers Los.
Frequency drift is a measure of how much the frequency changes during a specified time. (i.e.,Hz/hr)
Resolution
Before the frequency of a signal can be measured on a spectrum analyzer it must first be re-solved.
Resolving a signal means distinguishing it from its nearest neighbors. The resolution of a spectrum
analyzer is determined by its IF bandwidth. The IF bandwidth is usually the 3dB bandwidth of the IF
filter. The ratio of the 60dB bandwidth (in Hz) to the 3dB bandwidth (in Hz) is known as the shape
factor of the filter. The smaller the shape factor, the greater is the analyzers capability to resolve
closely spaced signals of unequal amplitude. If the shape factor of a filter is 15, then two signals
whose amplitudes differ by 60dB must differ in frequency by 7.5 time the IF bandwidth before they
can be distinguished separately. Otherwise, they will appear as one signal on the spectrum analyzer
display.
The ability of a spectrum analyzer to resolve closely spaced signals of unequal amplitude is not a
function of the IF filter shape factor only. Noise sidebands can also reduce the resolution. They
appear above the skirt of the IF filter and reduce the offband rejection of the filter. This limits the
resolution when measuring signals of unequal amplitude.
The resolution of the spectrum analyzer is limited by its narrowest IF bandwidth. For example, if the
narrowest bandwidth is 10KHz then the nearest any two signals can be and still be resolved is
10KHz.
This is because the analyzer traces out its own IF band-pass shape as it sweeps through a CW
signal.
Since the resolution of the analyzer is limited by bandwidth, it seems that by reducing the IF
bandwidth infinitely, infinite resolution will be achieved. The fallacy here is that the usable IF
bandwidth is limited by the stability (residual Fm) of the analyzer. If the internal frequency deviation of
the analyzer is 10 KHz, then the narrowest bandwidth that can be used to distinguish a single input
signal is 10 KHz. Any narrower IF-filter will result in more than one response or an intermittent
response for a single input frequency. A practical limitation exists on the IF bandwidth as well, since
narrow filters have ling time constants and would require excessive scan time.
12
Sensitivity
Sensitivity is a measure of the analyzer's ability to detect small signals. The maximum sensitivity of an
analyzer is limited by its internally generated noise.
The noise is basically of two types: thermal (or Johnson) and nonthermal noise. Thermal noise power
can be expressed as:
Pn =K . T . B
Where:
P n= Noise power in watts n
K = Boltzmanns Constant (1.38*10-23 Joule/K)
T = absolute temperature, K
B = bandwidth of system in Hertz
As seen from this equation, the noise level is directly proportional to bandwidth. Therefore, a decade
decrease in bandwidth results in a 10dB decrease in noise level and consequently 10dB better
sensitivity. Nonthermal noise accounts for all noise produced within the analyzer that is not
temperature dependent. Spurious emissions due to nonlinearities of active elements, impedance
mismatch, etc. are sources of non-thermal noise. A figure of merit, or noise figure, is usually assigned
to this non-thermal noise which when added to the thermal noise gives the total noise of the analyzer
system. This system noise which is measured on the Display unit, determines the maximum
sensitivity of the spectrum analyzer. Because noise level changes with bandwidth it is important,
when comparing the sensitivity of two analyzers, to compare sensitivity specifications for equal
bandwidths. A spectrum analyzer sweeps over a wide frequency range, but is really a narrow band
instrument. All of the signals that appear in the frequency range of the analyzer are converted to a
single IF frequency which must pass through an IF filter; the detector sees only this noise at any time.
Therefore, the noise displayed on the analyzer is only that which is contained in the IF passband.
When measuring discrete signals, maximum sensitivity is obtained by using the narrowest IF
bandwidth.
Video Filtering
Measuring small signals can be difficult when they are approximately the same amplitude as the
average internal noise level of the analyzer. To facilitate the measurement, it is best to use video
filtering. A video filter is a post-detection low pass filter which averages the internal noise of the
analyzer. When the noise is averaged, the input signal may be seen. If the resolution bandwidth is
very narrow for the span, the span, the video filter should no be selected, as this will not allow the
amplitude of the analyzed signals to reach full amplitude due to its video bandwidth limiting property.
Spectrum Analyzer Sensitivity
Specifying sensitivity on a spectrum analyzer is somewhat arbitrary. One way of specifying sensitivity
is to define it as the signal level when signal power = average noise power. The analyzer always
measures signal plus noise. Therefore, when the input signal is equal to the internal noise level, the
signal will appear 3dB above the noise. When the signal power is added to the average noise power,
the power level on the CRT is doubled (increased by 3dB) because the signal power=average noise
power.
The maximum input level to the spectrum analyzer is the damage level or burn-out level of the input
circuit. This is (for the AT5010D) +10dB for the input mixer and +20dB for the input attenuator. Before
reaching the damage level of the analyzer, the analyzer will begin to gain compress the input signal.
13
This gain compression is not considered serious until it reaches 1dB. The maximum input signal level
which will always result in less than 1dB gain compression is called the linear input level. Above 1dB
gain compression the analyzer is considered to be operating non-linearly because the signal
amplitude displayed in the CRT is not an accurate measure of the input signal level.
Whenever a signal is applied to the input of the analyzer, distortions are produced within the analyzer
itselt. Most of these are caused by the non-linear behavior of the input mixer. For the AT5010D these
distortions are typically 70dB below the input signal level for signal levels not exceeding -30dBm at
the input of the first mixer. To accommodate larger input signal levels, an attenuator is placed in the
input circuit before the first mixer. The largest input signal that can be applied, at each setting of the
input attenuator, while maintaining the internally generated distortions below a certain level, is called
the optimum input level of the analyzer. The signal is attenuated before the first mixer because the
input to the mixer must not exceed -30dB, or the analyzer distortion products may exceed the
specified 70dB range. This 70dB distortion-free range is called the spurious-free dynamic range of the
analyzer. The display dynamic range is defined as the ratio of the largest signal to the smallest signal
that can be displayed simultaneously with no analyzer distortions present.
Dynamic range requires several things then. The display range must be adequate, no spurious or
unidentified response can occur, and the sensitivity must be sufficient to eliminate noise from the
displayed amplitude range.
The maximum dynamic range for a spectrum analyzer can be easily determined from its
specifications. First check the distortion spec. For example, this might be "all spurious products 70dB
down for -30dBm at the input mixer". Then, determine that adequate sensitivity exists. For example,
70dB down from -30dBm is -100dB. This is the level we must be able to detect, and the bandwidth
required for this sensitivity must not be too narrow or it will be useless. Last, the display range must
be adequate.
Notice that the spurious-free measurement range can be extended by reducing the level at the input
mixer. The only limitation, then, is sensitivity. To ensure a maximum dynamic range on the CRT
display, check to see that the following requirements are satisfied.
• The largest input signal does not exceed the optimum input level of the analyzer (typically-
30dBm with 0dB input attenuation).
• The peak of the largest input signal rests at the top of the top of the CRT display (reference
level).
Frequency Response
The frequency response of an analyzer is the amplitude linearity of the analyzer over its frequency
range. If a spectrum analyzer is to display equal amplitudes for input signals of equal amplitude,
independent of frequency, then the conversion (power) loss of the input mixer must not depend on
frequency. If the voltage from the LO is too large compared to the input signal voltage then the
conversion loss of the input mixer is frequency dependent and the frequency response of the system
is nonlinear. For accurate amplitude measurements, a spectrum analyzer should be as flat as
possible over its frequency range. Flatness is usually the limiting factor in amplitude accuracy since
its extremely difficult to calibrate out. And, since the primary function of the spectrum analyzer is to
compare signal levels at different frequencies, a lack of flatness can seriously limit its usefulness.
The 1dB gain compression level is a point of convenience, but it is nonetheless considered the upper
limit of the dynamic range. The lower limit, on the other hand, is dictated by the analyzer sensitivity
which, as we know, is bandwidth dependent. The narrowest usable bandwidth in turn is limited by the
tracking generator residual FM and any tracking drift between the analyzer tuning and the tracking
generator signal.
14
Supporting products
Near Field Sniffer Probes AZ530 (Optional)
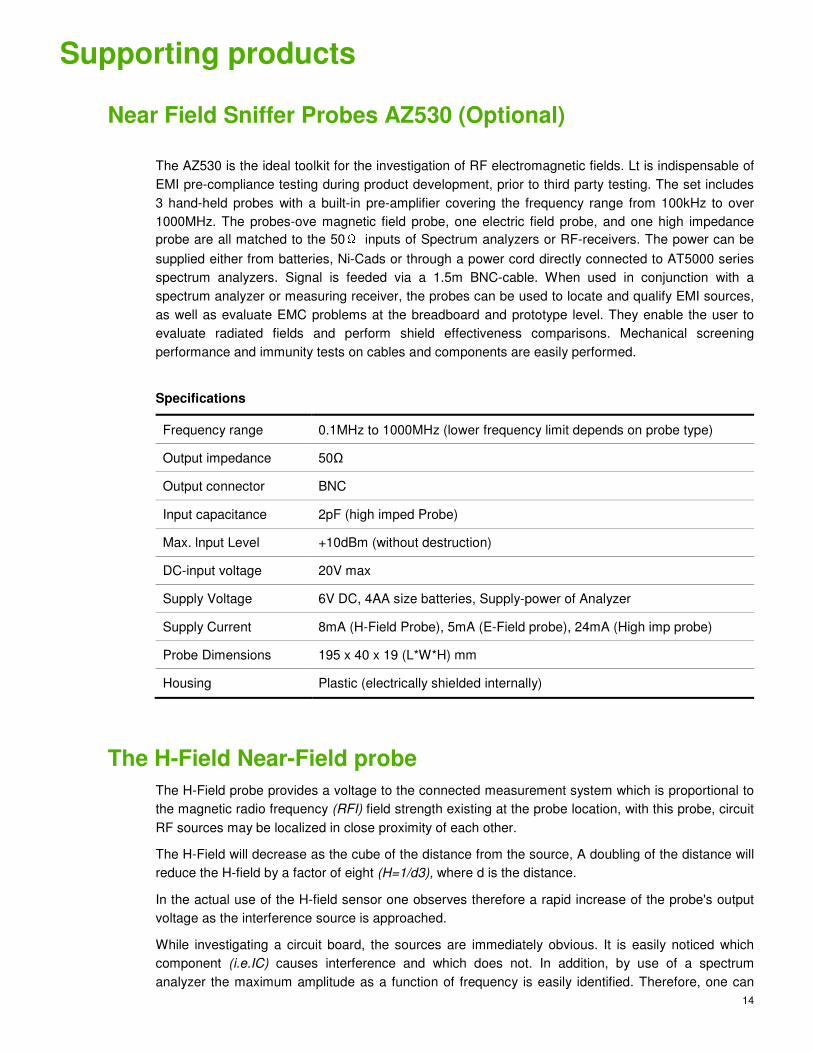
The AZ530 is the ideal toolkit for the investigation of RF electromagnetic fields. Lt is indispensable of
EMI pre-compliance testing during product development, prior to third party testing. The set includes
3 hand-held probes with a built-in pre-amplifier covering the frequency range from 100kHz to over
1000MHz. The probes-ove magnetic field probe, one electric field probe, and one high impedance
probe are all matched to the 50Ω inputs of Spectrum analyzers or RF-receivers. The power can be
supplied either from batteries, Ni-Cads or through a power cord directly connected to AT5000 series
spectrum analyzers. Signal is feeded via a 1.5m BNC-cable. When used in conjunction with a
spectrum analyzer or measuring receiver, the probes can be used to locate and qualify EMI sources,
as well as evaluate EMC problems at the breadboard and prototype level. They enable the user to
evaluate radiated fields and perform shield effectiveness comparisons. Mechanical screening
performance and immunity tests on cables and components are easily performed.
Specifications
Frequency range 0.1MHz to 1000MHz (lower frequency limit depends on probe type)
Output impedance 50Ω
Output connector BNC
Input capacitance 2pF (high imped Probe)
Max. lnput Level +10dBm (without destruction)
DC-input voltage 20V max
Supply Voltage 6V DC, 4AA size batteries, Supply-power of Analyzer
Supply Current 8mA (H-Field Probe), 5mA (E-Field probe), 24mA (High imp probe)
Probe Dimensions 195 x 40 x 19 (L*W*H) mm
Housing Plastic (electrically shielded internally)
The H-Field Near-Field probe
The H-Field probe provides a voltage to the connected measurement system which is proportional to
the magnetic radio frequency (RFI) field strength existing at the probe location, with this probe, circuit
RF sources may be localized in close proximity of each other.
The H-Field will decrease as the cube of the distance from the source, A doubling of the distance will
reduce the H-field by a factor of eight (H=1/d3), where d is the distance.
In the actual use of the H-field sensor one observes therefore a rapid increase of the probe's output
voltage as the interference source is approached.
While investigating a circuit board, the sources are immediately obvious. It is easily noticed which
component (i.e.IC) causes interference and which does not. In addition, by use of a spectrum
analyzer the maximum amplitude as a function of frequency is easily identified. Therefore, one can
15
eliminate early in the development components which are not suitable for EMC purposes. The
effectiveness of countermeasures can be judged easily. One can investigate shields for "leaking"
areas and cables or wires for conducted interference.
The High-Impedance probe
The High-impedance probe (Hi-Z) permits the determination of the radio frequency interference (RFI)
on individual contacts or printed circuit traces.
It is a direct-contact probe. The probe is of very high impedance (near the insulation resistance of the
printed circuit material) and is loading the test point with only 2pF (80Ω at 1GHz).
Thereby one can measure directly in a circuit without significantly influencing the relationships in the
circuit with the probe. One can, for example, measure the quantitative effectiveness of filters or other
or other blocking measures.
Individual pins of ICs can be identified. With this Hi-Z probe individual test points of a circuit can be
connected to the 50W impedance of spectrum analyzer.
The E-Field Monopole Probe
The E-field monopole probe has the highest sensitivity of the three probes. It is sensitive enough to
be used as an antenna for radio or TV reception.
With this probe the entire radiation from a circuit or an equipment can be measured. It is used, for
example, to determine the effectiveness of shielding measures. With this probe, the entire
effectiveness of filters can be measured by measuring the RFI which is conducted along cables that
leave the equipment and may influence the total radiation. In addition, the E-field probe may be used
to perform relative measurements for certification tests. This makes it possible to apply remedial
suppression measures so that any re-qualification results will be positive. In addition, pre-testing for
certification tests may be performed so that no surprises are encountered during the certification
tests.
Frequency Expander AT5000F Series (Optional)
Since the prices of 3GHz spectrum analyzers are all above several ten thousands USD, it is not
affordable for most radio fans, service men and even medium or small sized enterprises. Meantime,
there are many signals above 1000MHz in communication field, such as LO (local oscillator) signals
of mobile phone usually between 1GHz to 2GHz, some are exceed 2GHz, and 1800MHz, 2400MHz
or more. Based on above situations, favorable frequency expanders have been developed by
Shenzhen ATTEN Electronics Co., Ltd.
AT5000F1 operating accompany with AT5010B spectrum analyzer of 1000MHz, frequency can be
expanded to 1050MHz to 2050MHz.
Example:
Connect AT5000F1 to AT5010D spectrum analyzers, if a 800MHz signal display in spectrum analyzer, then the tested signal should be added 1000MHz, so the frequency of tested signal must be 1800MHz.
Frequency of AT5000F2 can be expanded to 2050MHz to 3050MHz, the tested frequency is the display frequency add 2000MHz.
Frequency of AT5000F3 can be expanded to 3050MHz to 4050MHz, the tested frequency is the display frequency add 3000MHz.
16
Service & Support
Maintenance and repair
Various important properties of the Spectrum Analyzer should be carefully checked at certain
intervals. Only in this it largely certain that all signals are displayed with the accuracy on which the
technical data are based. The exterior of the instrument should be cleaned regularly with a dusting
brush. Dirt which is difficult to remove on the casing and handle, the plastic and aluminum parts, can
be removed with a moistened cloth (99% water +1% mild detergent).
Spirit or washing benzine (petroleum ether) can be used to remove greasy dirt. The screen may be
cleaned with water or washing benzene [but not with spirit (alcohol) or solvents]; it must then be
wiped with a dry clean lint-free cloth.
Under no circumstances may the cleaning fluid get into the instrument. The use of other cleaning
agents can attack the plastic and paint surfaces.
Never repair the instrument with power on. As soon as the power cord is plugged into the power
socket, the power supply unit and the crystal oscillator in the instrument are powered. Unplug the
power cord before soldering.
When repairing, in general, first locate the external faults and visual faults, such as open circuit, short
circuit or unreasonable settings parameters, etc. Secondly measure the voltage of each group to see
whether it is normal. If all the voltages are normal, check the static working point of faulted circuit and
check if there are any faults soldered points. Special carefulness should be paid to determine a fault
IC. In repairing, the probe of oscilloscope or the pen of multimeter should not touch the test points
and the adjacent point in order to avoid causing more troubles.
Contact our special agents for instant repair when the user is unable to repair by itself.
17
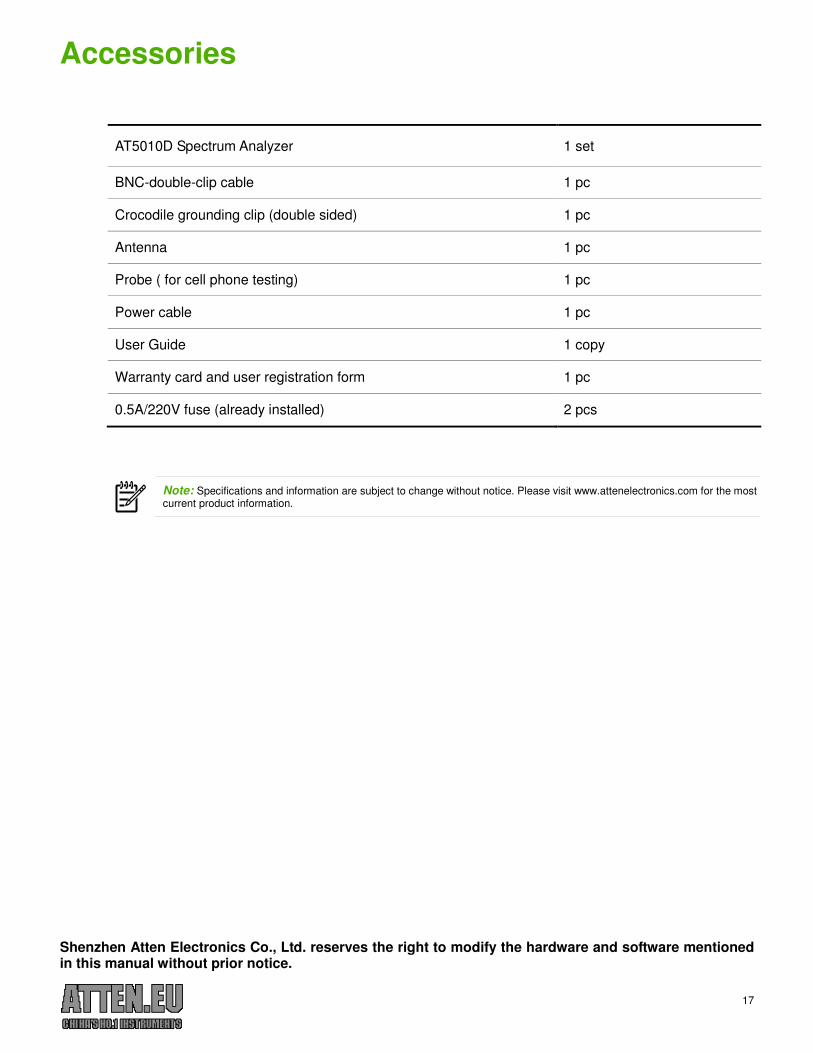
Accessories
AT5010D Spectrum Analyzer 1 set
BNC-double-clip cable 1 pc
Crocodile grounding clip (double sided) 1 pc
Antenna 1 pc
Probe ( for cell phone testing) 1 pc
Power cable 1 pc
User Guide 1 copy
Warranty card and user registration form 1 pc
0.5A/220V fuse (already installed) 2 pcs
Note: Specifications and information are subject to change without notice. Please visit www.attenelectronics.com for the most current product information.
Shenzhen Atten Electronics Co., Ltd. reserves the right to modify the hardware and software mentioned in this manual without prior notice.