Embed Size (px)
Citation preview
PROFOTABILITY
VERIZON2014 2013 NOTE
OPERATING INCOME 19,599
TAX 4915.73 Tax on op profit = Tax exp + (pretax non op exp x tax rate) 3314 + (4329 x .37) 4,916
NOPAT 14,683 NOPAT= Op Income - Tax on op profit 19,599 - 4915.73 14,683
NOA 114,992 131,446 2014 NOA= Op Asset - Op Liability 220,753 - 105,761 114,992
2013 NOA= Op Asset - Op Liability 216,537 - 85,091
RNOA 11.92% RNOA= NOPAT 14,683 11.92%
Avg NOA Avg(114,992,131,446)
ROE 37.65% ROE= Net Income (CI) 9,625 37.65%
Avg equity(CI) 25,567
NOAT 1.031 NOAT= Sales 127,079 1.031
Avg NOA= Avg(114,992,131,446)
NOPM 11.55% NOPM= NOPAT 14683 11.6%
SALES 127079
OP RETURN 11.92% RNOA= 11.92%
NON-OP RETURN 25.73% NON-OP RETURN= Flev X spread 3.82 x 6.74% 25.74%
NNO 102,694 92,610 (2014)NNO= NOA - E 114992 -12298 102694
(2013)NNO= NOA - E 131,446 - 38,836 92,610
FLEV 3.82 Flev= Avg NNO 97,652 3.82
Avg equity(CI) 25,567
NNE 5,058 NNE= NOPAT - NI 14,683 - 9625 5085
NNEP 5.18% NNEP= NNE 5,058.27 5.18%
Avg NNO 97,652
SPREAD 6.74% Spread= RNOA - NNEP 11.92%-5.18% 6.74%
ROE 37.65% ROE= RNOA + FLEV x Spread 11.92% + 3.8 x 6.74% 37.5%
PM 7.57% PM= Net Income 9625 7.57%
Sales 127079
AT 0.5015 AT= Sales 127079 0.501
Avg T Asset Avg(232,708,274,098)
FL 9.91 FL= Avg T Asset 253,403 9.91
Avg T Equity 25,567
ROE (DU POINT) 37.65% ROE= PM x AT x FL= 7.57% x 0.5 x 9.9 37.6%
Liquidity VERIZON 2014 VERIZON 2013
Current ratio = Current asset 29,623 1.06 70,994 2.62
Current liabilities 28,064 27,054
Quick ratio = Cash + Marketable securities + A/R 10,598 + 0 + 13,993 0.88 53,528 + 12,439 2.44
Current liability 28,064 27,054
Solvency
Liabilities-to-equity = Total liabilities 219,032 16.02 178,682 1.87
Equity 13,676 95,416
Total Debt-to-Equity= LT debt + St debt 110,536 + 2,735 8.28 89,658 + 3,933 0.98
Equity 13,676.00 95,416
Coverage
Times Interest Earned = EBT + Interest Exp 15,270 + 4,915 4.11 29,277 + 2,667 11.98
Interest Exp 4,915.00 2,667
EBITDA Coverage= EBITDA 15,270 + 4,915 + 16,533 7.47 29,277 + 2,667 + 16,606 18.20
Interest Exp 4,915 2,667
Free Op cash flow Cash from operations - CAPEX 30,631 - 17,191 12% 38,818 - 16,604 24%
-to-total debt= ST-debt + LT-debt 110,536 + 2,735 89,658 + 3,933
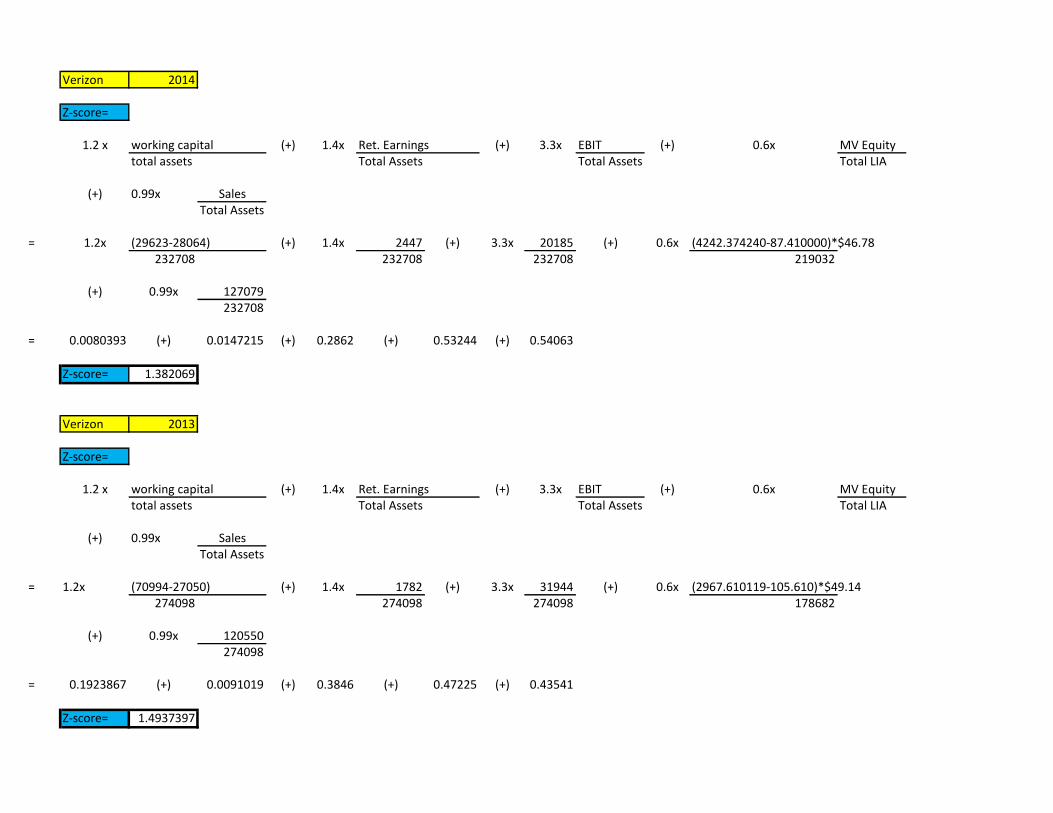
Verizon 2014
Z-score=
1.2 x working capital (+) 1.4x Ret. Earnings (+) 3.3x EBIT (+) 0.6x MV Equitytotal assets Total Assets Total Assets Total LIA
(+) 0.99x SalesTotal Assets
= 1.2x (29623-28064) (+) 1.4x 2447 (+) 3.3x 20185 (+) 0.6x (4242.374240-87.410000)*$46.78232708 232708 232708 219032
(+) 0.99x 127079232708
= 0.0080393 (+) 0.0147215 (+) 0.2862 (+) 0.53244 (+) 0.54063
Z-score= 1.382069
Verizon 2013
Z-score=
1.2 x working capital (+) 1.4x Ret. Earnings (+) 3.3x EBIT (+) 0.6x MV Equitytotal assets Total Assets Total Assets Total LIA
(+) 0.99x SalesTotal Assets
= 1.2x (70994-27050) (+) 1.4x 1782 (+) 3.3x 31944 (+) 0.6x (2967.610119-105.610)*$49.14274098 274098 274098 178682
(+) 0.99x 120550274098
= 0.1923867 (+) 0.0091019 (+) 0.3846 (+) 0.47225 (+) 0.43541
Z-score= 1.4937397
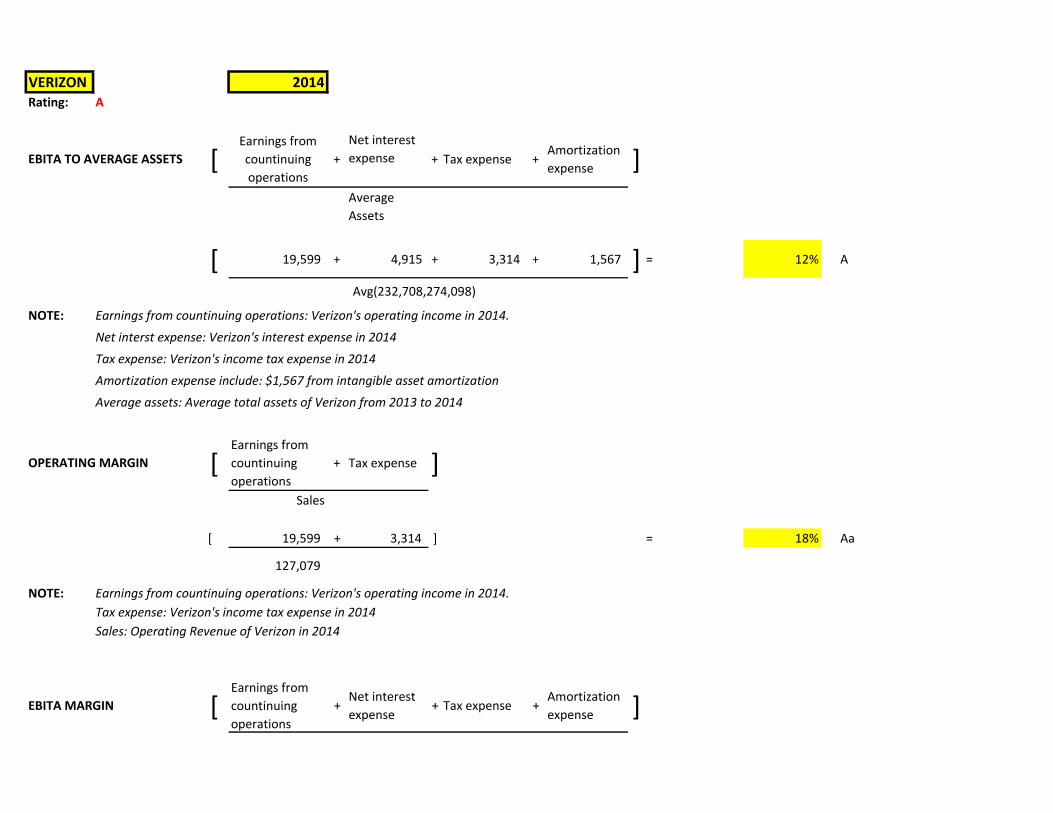
VERIZON 2014Rating: A
EBITA TO AVERAGE ASSETS [Earnings from
countinuing
operations
+
Net interest
expense + Tax expense +Amortization
expense ]Average
Assets
[ 19,599 + 4,915 + 3,314 + 1,567 ] = 12% A
Avg(232,708,274,098)
NOTE: Earnings from countinuing operations: Verizon's operating income in 2014.
Net interst expense: Verizon's interest expense in 2014
Tax expense: Verizon's income tax expense in 2014
Amortization expense include: $1,567 from intangible asset amortization
Average assets: Average total assets of Verizon from 2013 to 2014
OPERATING MARGIN [Earnings from
countinuing
operations
+ Tax expense ]Sales
[ 19,599 + 3,314 ] = 18% Aa
127,079
NOTE: Earnings from countinuing operations: Verizon's operating income in 2014.
Tax expense: Verizon's income tax expense in 2014
Sales: Operating Revenue of Verizon in 2014
EBITA MARGIN [Earnings from
countinuing
operations
+Net interest
expense+ Tax expense +
Amortization
expense ]
Sales
[ 19,599 + 4,915 + 3,314 + 1,567 ] = 23% Aa
127,079
NOTE: Earnings from countinuing operations: Verizon's operating income in 2014.
Net interst expense: Verizon's interest expense in 2014
Tax expense: Verizon's income tax expense in 2014
Amortization expense include: $1,504 from intangible asset amortization
Sales: Operating Revenue of Verizon in 2014
EBITA INTEREST COVERAGE [Earnings from
countinuing
operations
+ Net interest
expense+ Tax expense +
Amortization
expense ]
Gross interest expense
[ 19,599 + 4,915 + 3,314 + 1,567 ] = 5.56 A
5,290
NOTE: Earnings from countinuing operations: Verizon's operating income in 2014.
Net interst expense: Verizon's interest expense in 2014
Tax expense: Verizon's income tax expense in 2014
Amortization expense include: $1,567 from intangible asset amortization
Gross interst expense: is included in interest expense ( http://www.marketwatch.com/investing/stock/vz/financials)
DEBT TO EBITDA [ Long term debt +Current
maturities+
Commercial
paper+
Short term
borrowings ]
[Earnings from
countinuing
operations
+ Net interest
expense+ Tax expense +
Amortization
expense+
Depreciation
expenses ]
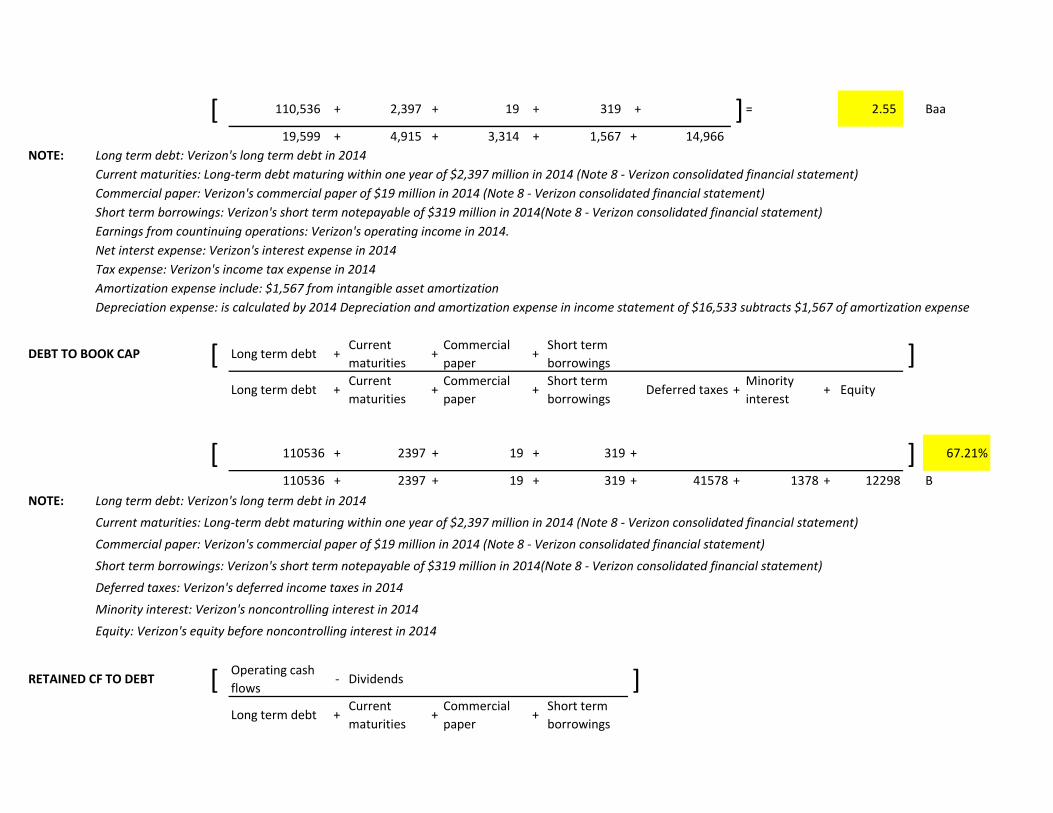
[ 110,536 + 2,397 + 19 + 319 + ]= 2.55 Baa
19,599 + 4,915 + 3,314 + 1,567 + 14,966
NOTE: Long term debt: Verizon's long term debt in 2014
Current maturities: Long-term debt maturing within one year of $2,397 million in 2014 (Note 8 - Verizon consolidated financial statement)
Commercial paper: Verizon's commercial paper of $19 million in 2014 (Note 8 - Verizon consolidated financial statement)
Short term borrowings: Verizon's short term notepayable of $319 million in 2014(Note 8 - Verizon consolidated financial statement)
Earnings from countinuing operations: Verizon's operating income in 2014.
Net interst expense: Verizon's interest expense in 2014
Tax expense: Verizon's income tax expense in 2014
Amortization expense include: $1,567 from intangible asset amortization
Depreciation expense: is calculated by 2014 Depreciation and amortization expense in income statement of $16,533 subtracts $1,567 of amortization expense
DEBT TO BOOK CAP [ Long term debt +Current
maturities+
Commercial
paper+
Short term
borrowings ]Long term debt +
Current
maturities+
Commercial
paper+
Short term
borrowingsDeferred taxes +
Minority
interest+ Equity
[ 110536 + 2397 + 19 + 319 + ] 67.21%
110536 + 2397 + 19 + 319 + 41578 + 1378 + 12298 B
NOTE: Long term debt: Verizon's long term debt in 2014
Current maturities: Long-term debt maturing within one year of $2,397 million in 2014 (Note 8 - Verizon consolidated financial statement)
Commercial paper: Verizon's commercial paper of $19 million in 2014 (Note 8 - Verizon consolidated financial statement)
Short term borrowings: Verizon's short term notepayable of $319 million in 2014(Note 8 - Verizon consolidated financial statement)
Deferred taxes: Verizon's deferred income taxes in 2014
Minority interest: Verizon's noncontrolling interest in 2014
Equity: Verizon's equity before noncontrolling interest in 2014
RETAINED CF TO DEBT [ Operating cash
flows- Dividends ]
Long term debt +Current
maturities+
Commercial
paper+
Short term
borrowings
[ 30,631 - 7,803 ] = 20.2% Ba
110536 + 2397
NOTE: Operating cash flows: Verizon's cash flow from operating activities in 2014
Dividend: Verizon's dividend paid from financing activities in 2014
Long term debt: Verizon's long term debt in 2014
Current maturities: Long-term debt maturing within one year of $2,397 million in 2014 (Note 8 - Verizon consolidated financial statement)
Commercial paper: Verizon's commercial paper of $19 million in 2014 (Note 8 - Verizon consolidated financial statement)
Short term borrowings: Verizon's short term notepayable of $319 million in 2014(Note 8 - Verizon consolidated financial statement)
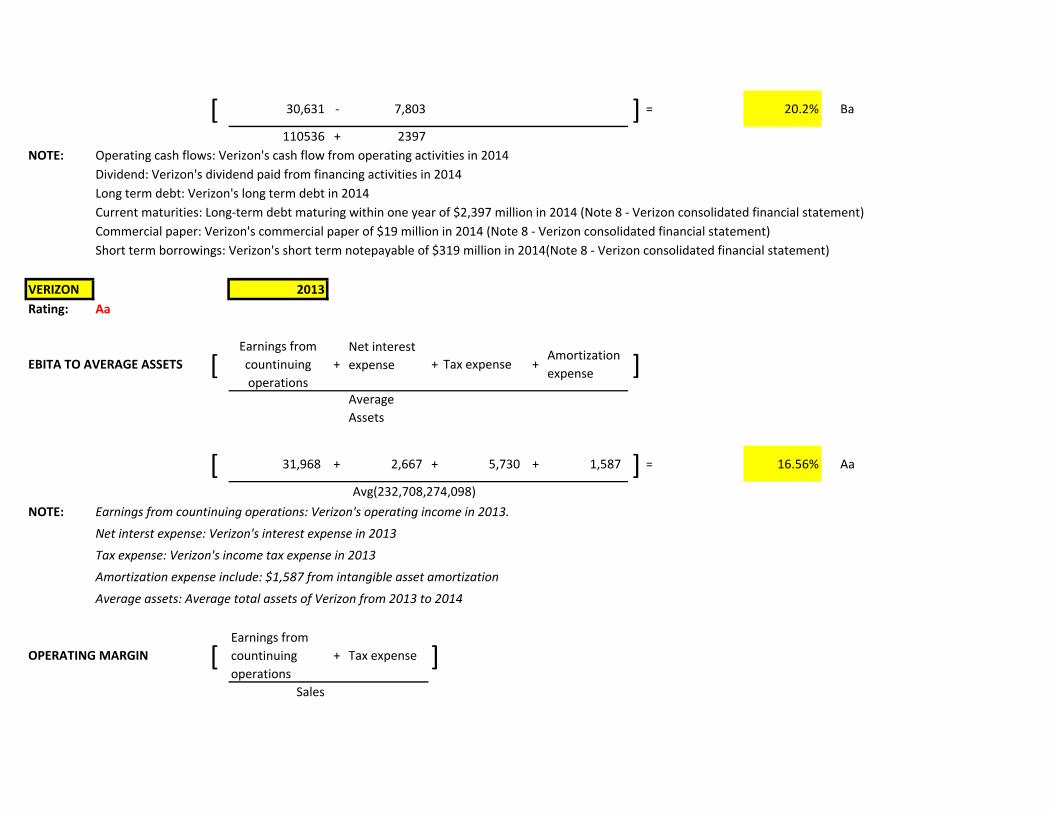
VERIZON 2013
Rating: Aa
EBITA TO AVERAGE ASSETS [Earnings from
countinuing
operations
+
Net interest
expense + Tax expense +Amortization
expense ]Average
Assets
[ 31,968 + 2,667 + 5,730 + 1,587 ] = 16.56% Aa
Avg(232,708,274,098)
NOTE: Earnings from countinuing operations: Verizon's operating income in 2013.
Net interst expense: Verizon's interest expense in 2013
Tax expense: Verizon's income tax expense in 2013
Amortization expense include: $1,587 from intangible asset amortization
Average assets: Average total assets of Verizon from 2013 to 2014
OPERATING MARGIN [Earnings from
countinuing
operations
+ Tax expense ]Sales
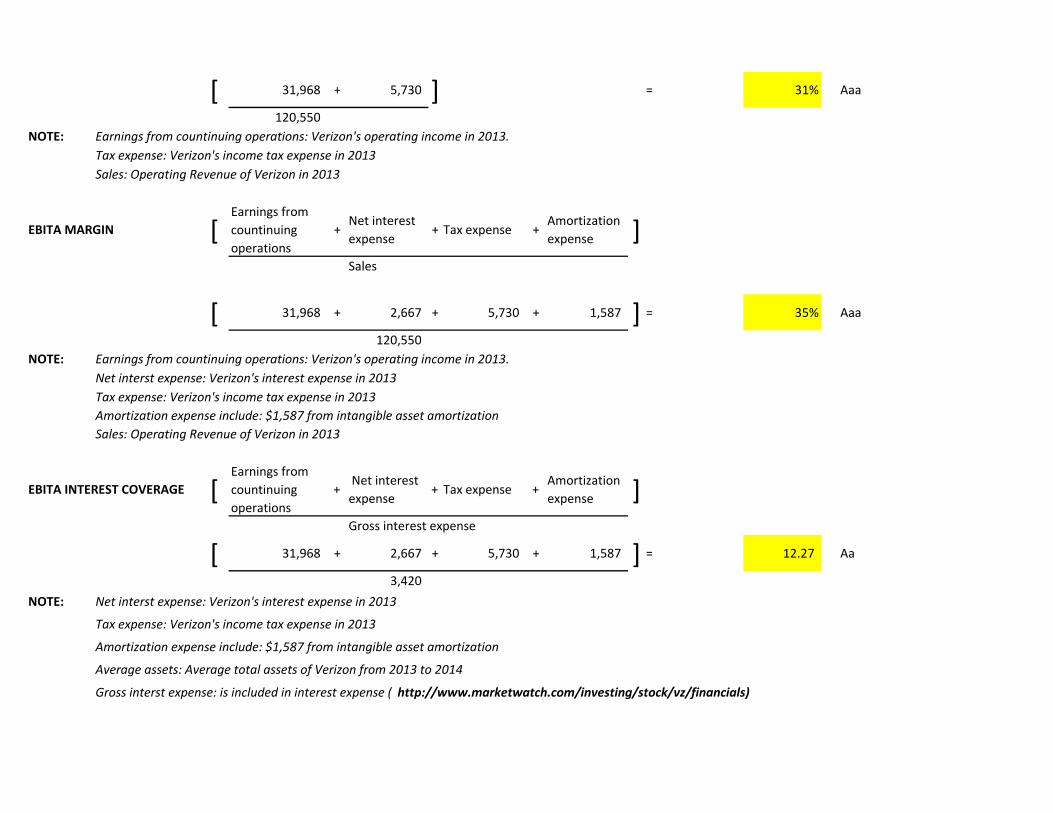
[ 31,968 + 5,730 ] = 31% Aaa
120,550
NOTE: Earnings from countinuing operations: Verizon's operating income in 2013.
Tax expense: Verizon's income tax expense in 2013
Sales: Operating Revenue of Verizon in 2013
EBITA MARGIN [Earnings from
countinuing
operations
+Net interest
expense+ Tax expense +
Amortization
expense ]Sales
[ 31,968 + 2,667 + 5,730 + 1,587 ] = 35% Aaa
120,550
NOTE: Earnings from countinuing operations: Verizon's operating income in 2013.
Net interst expense: Verizon's interest expense in 2013
Tax expense: Verizon's income tax expense in 2013
Amortization expense include: $1,587 from intangible asset amortization
Sales: Operating Revenue of Verizon in 2013
EBITA INTEREST COVERAGE [Earnings from
countinuing
operations
+ Net interest
expense+ Tax expense +
Amortization
expense ]Gross interest expense
[ 31,968 + 2,667 + 5,730 + 1,587 ] = 12.27 Aa
3,420
NOTE: Net interst expense: Verizon's interest expense in 2013
Tax expense: Verizon's income tax expense in 2013
Amortization expense include: $1,587 from intangible asset amortization
Average assets: Average total assets of Verizon from 2013 to 2014
Gross interst expense: is included in interest expense ( http://www.marketwatch.com/investing/stock/vz/financials)
DEBT TO EBITDA [ Long term debt +Current
maturities+
Commercial
paper+
Short term
borrowings ]
[Earnings from
countinuing
operations
+ Net interest
expense+ Tax expense +
Amortization
expense+
Depreciation
expenses ]
[ 89,658 + 3,486 + 447 + 0 + ]= 1.64 Aa
31,968 + 2,667 + 5,730 + 1,587 + 15,019
NOTE: Long term debt: Verizon's long term debt in 2013
Current maturities: Long-term debt maturing within one year of $3,486 million in 2013 (Note 8 - Verizon consolidated financial statement)
Commercial paper: Verizon's commercial paper of $447 million in 2013 (Note 8 - Verizon consolidated financial statement)
Net interst expense: Verizon's interest expense in 2013
Tax expense: Verizon's income tax expense in 2013
Amortization expense include: $1,587 from intangible asset amortization
Average assets: Average total assets of Verizon from 2013 to 2014
Depreciation expense: is calculated by 2013 Depreciation and amortization expense in income statement of $16,606 subtracts $1,587 of amortization expense
DEBT TO BOOK CAP [ Long term debt +Current
maturities+
Commercial
paper+
Short term
borrowings ]Long term debt +
Current
maturities+
Commercial
paper+
Short term
borrowingsDeferred taxes +
Minority
interest+ Equity
[ 89,658 + 3,486 + 447 + - + ] 43.00%
89,658 + 3,486 + 447 + - + 28,639 + 56,580 + 38,836 Baa
NOTE: Long term debt: Verizon's long term debt in 2013
Current maturities: Long-term debt maturing within one year of $3,486 million in 2013 (Note 8 - Verizon consolidated financial statement)
Commercial paper: Verizon's commercial paper of $447 million in 2013 (Note 8 - Verizon consolidated financial statement)
Deferred taxes: Verizon's deferred income taxes in 2013
3Minority interest: Verizon's noncontrolling interest in 2013
Equity: Verizon's equity before noncontrolling interest in 2013
RETAINED CF TO DEBT [ Operating cash
flows- Dividends ]
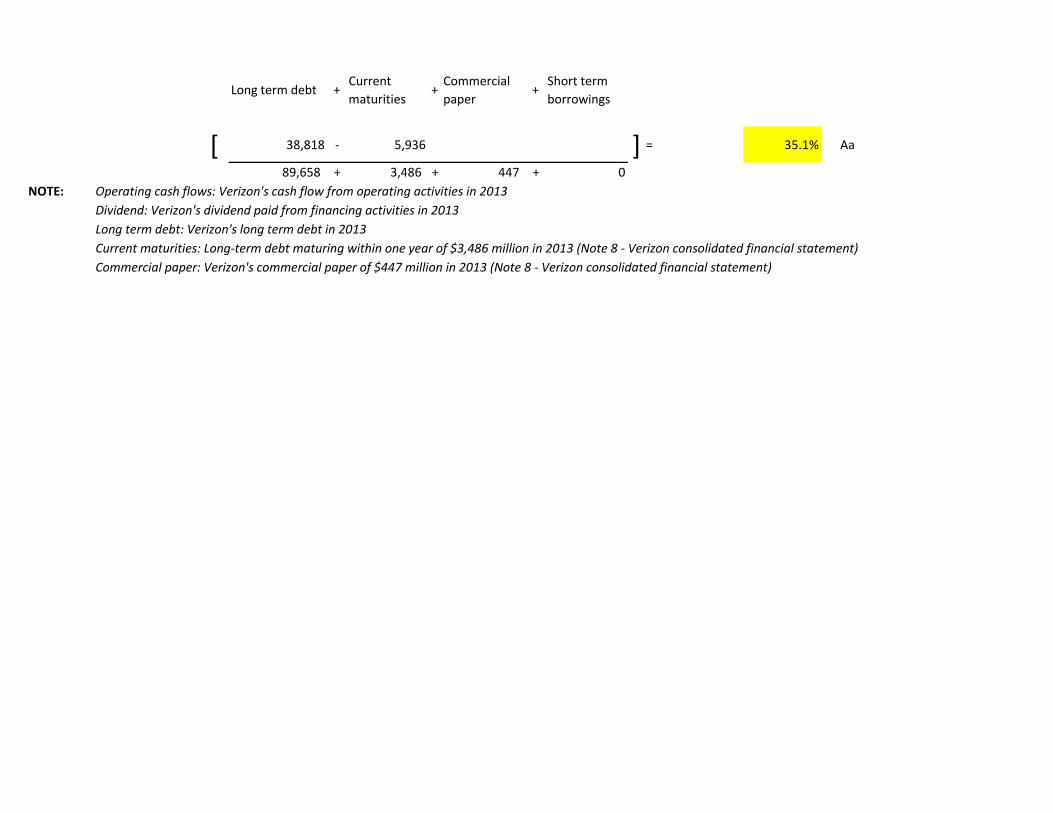
Long term debt +Current
maturities+
Commercial
paper+
Short term
borrowings
[ 38,818 - 5,936 ] = 35.1% Aa
89,658 + 3,486 + 447 + 0
NOTE: Operating cash flows: Verizon's cash flow from operating activities in 2013
Dividend: Verizon's dividend paid from financing activities in 2013
Long term debt: Verizon's long term debt in 2013
Current maturities: Long-term debt maturing within one year of $3,486 million in 2013 (Note 8 - Verizon consolidated financial statement)
Commercial paper: Verizon's commercial paper of $447 million in 2013 (Note 8 - Verizon consolidated financial statement)
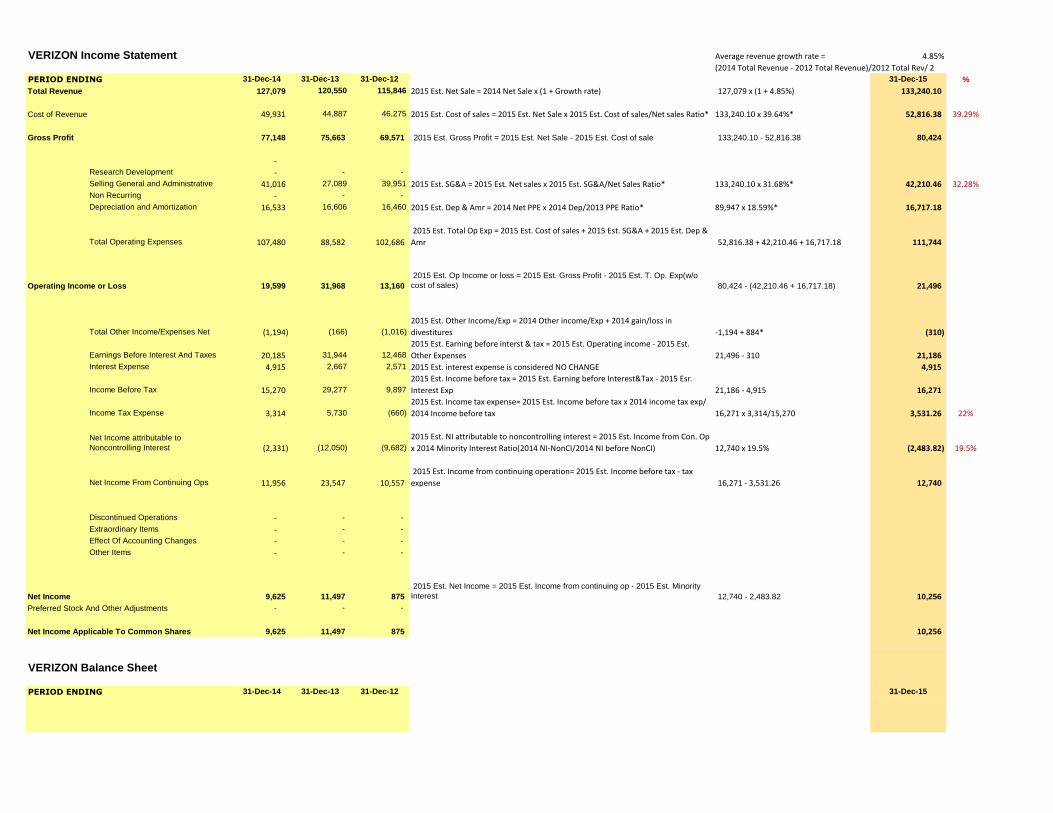
VERIZON Income Statement Average revenue growth rate = 4.85%
(2014 Total Revenue - 2012 Total Revenue)/2012 Total Rev/ 2
31-Dec-14 31-Dec-13 31-Dec-12 31-Dec-15 %
127,079 120,550 115,846 2015 Est. Net Sale = 2014 Net Sale x (1 + Growth rate) 127,079 x (1 + 4.85%) 133,240.10
49,931 44,887 46,275 2015 Est. Cost of sales = 2015 Est. Net Sale x 2015 Est. Cost of sales/Net sales Ratio* 133,240.10 x 39.64%* 52,816.38 39.29%
77,148 75,663 69,571 2015 Est. Gross Profit = 2015 Est. Net Sale - 2015 Est. Cost of sale 133,240.10 - 52,816.38 80,424
-
Research Development - - -
Selling General and Administrative 41,016 27,089 39,951 2015 Est. SG&A = 2015 Est. Net sales x 2015 Est. SG&A/Net Sales Ratio* 133,240.10 x 31.68%* 42,210.46 32.28%
Non Recurring - - -
Depreciation and Amortization 16,533 16,606 16,460 2015 Est. Dep & Amr = 2014 Net PPE x 2014 Dep/2013 PPE Ratio* 89,947 x 18.59%* 16,717.18
Total Operating Expenses 107,480 88,582 102,686
2015 Est. Total Op Exp = 2015 Est. Cost of sales + 2015 Est. SG&A + 2015 Est. Dep &
Amr 52,816.38 + 42,210.46 + 16,717.18 111,744
19,599 31,968 13,160
2015 Est. Op Income or loss = 2015 Est. Gross Profit - 2015 Est. T. Op. Exp(w/o
cost of sales) 80,424 - (42,210.46 + 16,717.18) 21,496
Total Other Income/Expenses Net (1,194) (166) (1,016)
2015 Est. Other Income/Exp = 2014 Other income/Exp + 2014 gain/loss in
divestitures -1,194 + 884* (310)
Earnings Before Interest And Taxes 20,185 31,944 12,468
2015 Est. Earning before interst & tax = 2015 Est. Operating income - 2015 Est.
Other Expenses 21,496 - 310 21,186
Interest Expense 4,915 2,667 2,571 2015 Est. interest expense is considered NO CHANGE 4,915
Income Before Tax 15,270 29,277 9,897
2015 Est. Income before tax = 2015 Est. Earning before Interest&Tax - 2015 Esr.
Interest Exp 21,186 - 4,915 16,271
Income Tax Expense 3,314 5,730 (660)
2015 Est. Income tax expense= 2015 Est. Income before tax x 2014 income tax exp/
2014 Income before tax 16,271 x 3,314/15,270 3,531.26 22%
Net Income attributable to
Noncontrolling Interest (2,331) (12,050) (9,682)
2015 Est. NI attributable to noncontrolling interest = 2015 Est. Income from Con. Op
x 2014 Minority Interest Ratio(2014 NI-NonCI/2014 NI before NonCI) 12,740 x 19.5% (2,483.82) 19.5%
Net Income From Continuing Ops 11,956 23,547 10,557
2015 Est. Income from continuing operation= 2015 Est. Income before tax - tax
expense 16,271 - 3,531.26 12,740
Discontinued Operations - - -
Extraordinary Items - - -
Effect Of Accounting Changes - - -
Other Items - - -
9,625 11,497 875
2015 Est. Net Income = 2015 Est. Income from continuing op - 2015 Est. Minority
Interest 12,740 - 2,483.82 10,256
- - -
9,625 11,497 875 10,256
VERIZON Balance Sheet
31-Dec-14 31-Dec-13 31-Dec-12 31-Dec-15
Cost of Revenue
Gross Profit
Operating Income or Loss
Preferred Stock And Other Adjustments
Net Income Applicable To Common Shares
PERIOD ENDING
Total Revenue
Net Income
PERIOD ENDING
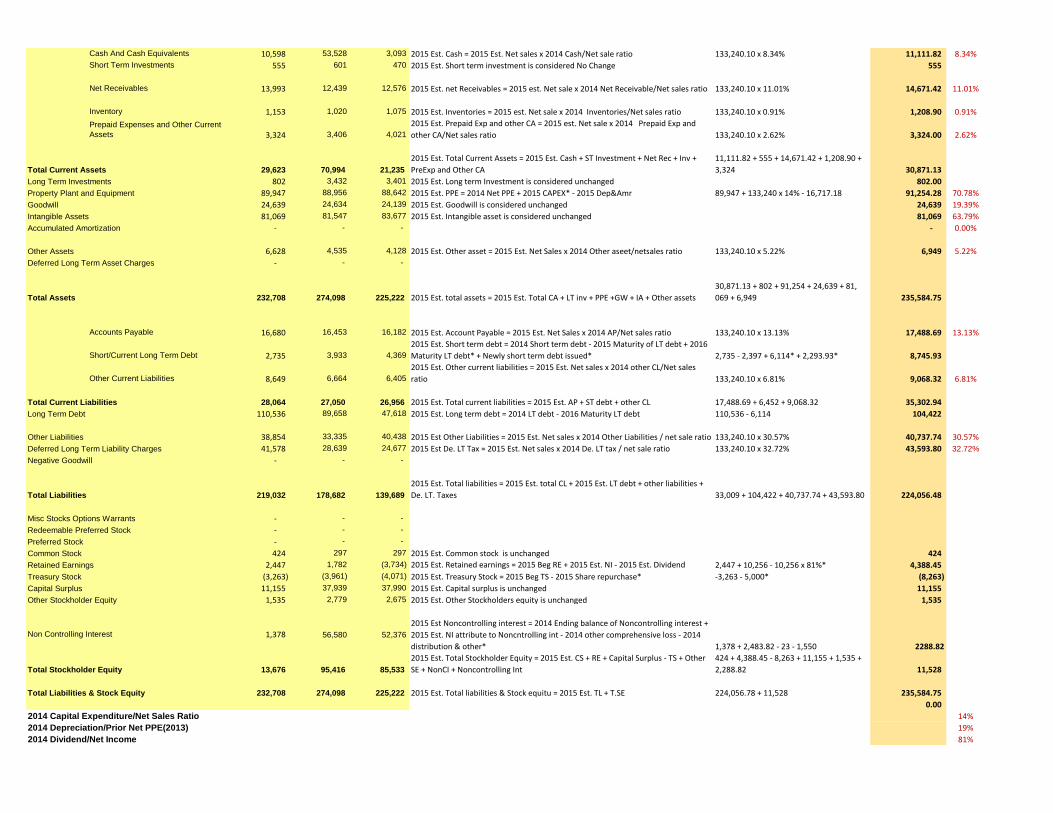
Cash And Cash Equivalents 10,598 53,528 3,093 2015 Est. Cash = 2015 Est. Net sales x 2014 Cash/Net sale ratio 133,240.10 x 8.34% 11,111.82 8.34%
Short Term Investments 555 601 470 2015 Est. Short term investment is considered No Change 555
Net Receivables 13,993 12,439 12,576 2015 Est. net Receivables = 2015 est. Net sale x 2014 Net Receivable/Net sales ratio 133,240.10 x 11.01% 14,671.42 11.01%
Inventory 1,153 1,020 1,075 2015 Est. Inventories = 2015 est. Net sale x 2014 Inventories/Net sales ratio 133,240.10 x 0.91% 1,208.90 0.91%
Prepaid Expenses and Other Current
Assets 3,324 3,406 4,021
2015 Est. Prepaid Exp and other CA = 2015 est. Net sale x 2014 Prepaid Exp and
other CA/Net sales ratio 133,240.10 x 2.62% 3,324.00 2.62%
29,623 70,994 21,235
2015 Est. Total Current Assets = 2015 Est. Cash + ST Investment + Net Rec + Inv +
PreExp and Other CA
11,111.82 + 555 + 14,671.42 + 1,208.90 +
3,324 30,871.13
802 3,432 3,401 2015 Est. Long term Investment is considered unchanged 802.00
89,947 88,956 88,642 2015 Est. PPE = 2014 Net PPE + 2015 CAPEX* - 2015 Dep&Amr 89,947 + 133,240 x 14% - 16,717.18 91,254.28 70.78%
24,639 24,634 24,139 2015 Est. Goodwill is considered unchanged 24,639 19.39%
81,069 81,547 83,677 2015 Est. Intangible asset is considered unchanged 81,069 63.79%
- - - - 0.00%
6,628 4,535 4,128 2015 Est. Other asset = 2015 Est. Net Sales x 2014 Other aseet/netsales ratio 133,240.10 x 5.22% 6,949 5.22%
- - -
232,708 274,098 225,222 2015 Est. total assets = 2015 Est. Total CA + LT inv + PPE +GW + IA + Other assets
30,871.13 + 802 + 91,254 + 24,639 + 81,
069 + 6,949 235,584.75
Accounts Payable 16,680 16,453 16,182 2015 Est. Account Payable = 2015 Est. Net Sales x 2014 AP/Net sales ratio 133,240.10 x 13.13% 17,488.69 13.13%
Short/Current Long Term Debt 2,735 3,933 4,369
2015 Est. Short term debt = 2014 Short term debt - 2015 Maturity of LT debt + 2016
Maturity LT debt* + Newly short term debt issued* 2,735 - 2,397 + 6,114* + 2,293.93* 8,745.93
Other Current Liabilities 8,649 6,664 6,405
2015 Est. Other current liabilities = 2015 Est. Net sales x 2014 other CL/Net sales
ratio 133,240.10 x 6.81% 9,068.32 6.81%
28,064 27,050 26,956 2015 Est. Total current liabilities = 2015 Est. AP + ST debt + other CL 17,488.69 + 6,452 + 9,068.32 35,302.94
110,536 89,658 47,618 2015 Est. Long term debt = 2014 LT debt - 2016 Maturity LT debt 110,536 - 6,114 104,422
38,854 33,335 40,438 2015 Est Other Liabilities = 2015 Est. Net sales x 2014 Other Liabilities / net sale ratio 133,240.10 x 30.57% 40,737.74 30.57%
41,578 28,639 24,677 2015 Est De. LT Tax = 2015 Est. Net sales x 2014 De. LT tax / net sale ratio 133,240.10 x 32.72% 43,593.80 32.72%
- - -
219,032 178,682 139,689
2015 Est. Total liabilities = 2015 Est. total CL + 2015 Est. LT debt + other liabilities +
De. LT. Taxes 33,009 + 104,422 + 40,737.74 + 43,593.80 224,056.48
- - -
- - -
- - -
424 297 297 2015 Est. Common stock is unchanged 424
2,447 1,782 (3,734) 2015 Est. Retained earnings = 2015 Beg RE + 2015 Est. NI - 2015 Est. Dividend 2,447 + 10,256 - 10,256 x 81%* 4,388.45
(3,263) (3,961) (4,071) 2015 Est. Treasury Stock = 2015 Beg TS - 2015 Share repurchase* -3,263 - 5,000* (8,263)
11,155 37,939 37,990 2015 Est. Capital surplus is unchanged 11,155
1,535 2,779 2,675 2015 Est. Other Stockholders equity is unchanged 1,535
1,378 56,580 52,376
2015 Est Noncontrolling interest = 2014 Ending balance of Noncontrolling interest +
2015 Est. NI attribute to Noncntrolling int - 2014 other comprehensive loss - 2014
distribution & other* 1,378 + 2,483.82 - 23 - 1,550 2288.82
13,676 95,416 85,533
2015 Est. Total Stockholder Equity = 2015 Est. CS + RE + Capital Surplus - TS + Other
SE + NonCI + Noncontrolling Int
424 + 4,388.45 - 8,263 + 11,155 + 1,535 +
2,288.82 11,528
232,708 274,098 225,222 2015 Est. Total liabilities & Stock equitu = 2015 Est. TL + T.SE 224,056.78 + 11,528 235,584.75
0.00
2014 Capital Expenditure/Net Sales Ratio 14%
2014 Depreciation/Prior Net PPE(2013) 19%
2014 Dividend/Net Income 81%
Total Assets
Negative Goodwill
Total Liabilities
Other Stockholder Equity
Total Stockholder Equity
Deferred Long Term Liability Charges
Non Controlling Interest
Total Liabilities & Stock Equity
Retained Earnings
Treasury Stock
Capital Surplus
Misc Stocks Options Warrants
Redeemable Preferred Stock
Preferred Stock
Common Stock
Total Current Liabilities
Long Term Debt
Other Liabilities
Deferred Long Term Asset Charges
Total Current Assets
Long Term Investments
Property Plant and Equipment
Goodwill
Intangible Assets
Accumulated Amortization
Other Assets
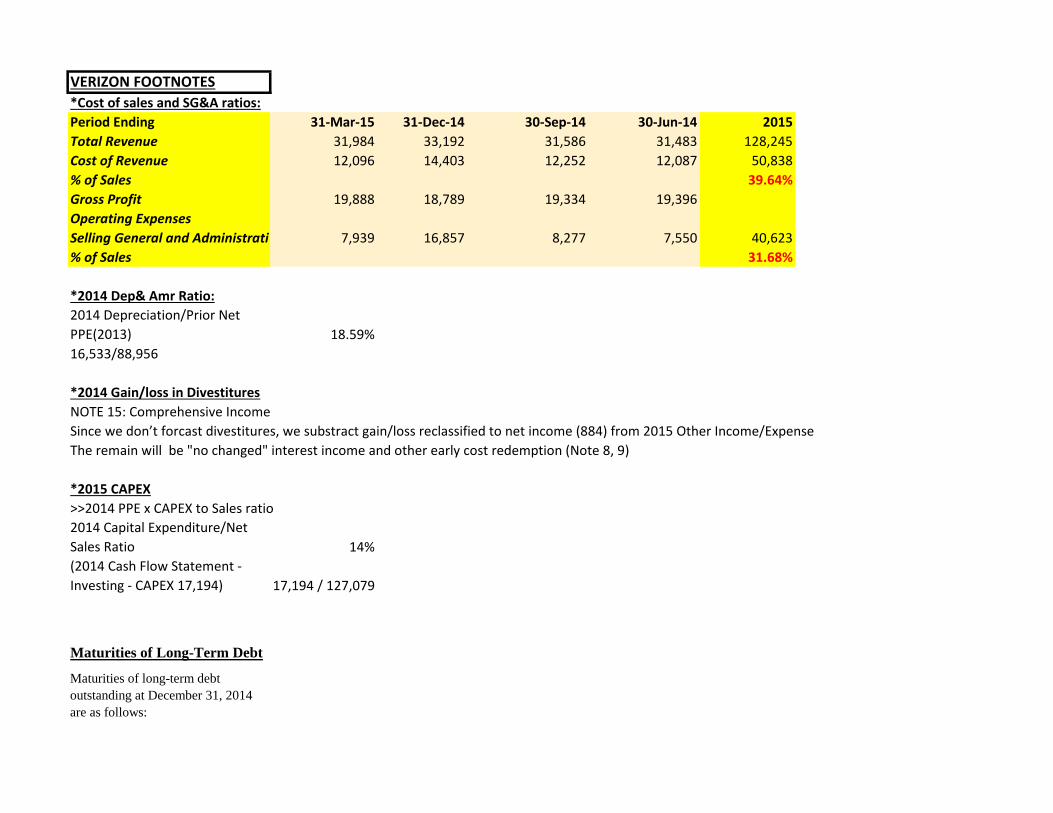
VERIZON FOOTNOTES
*Cost of sales and SG&A ratios:
Period Ending 31-Mar-15 31-Dec-14 30-Sep-14 30-Jun-14 2015
Total Revenue 31,984 33,192 31,586 31,483 128,245
Cost of Revenue 12,096 14,403 12,252 12,087 50,838
% of Sales 39.64%
Gross Profit 19,888 18,789 19,334 19,396
Operating Expenses
Selling General and Administrative 7,939 16,857 8,277 7,550 40,623
% of Sales 31.68%
*2014 Dep& Amr Ratio:
2014 Depreciation/Prior Net
PPE(2013) 18.59%
16,533/88,956
*2014 Gain/loss in Divestitures
NOTE 15: Comprehensive Income
Since we don’t forcast divestitures, we substract gain/loss reclassified to net income (884) from 2015 Other Income/Expense
The remain will be "no changed" interest income and other early cost redemption (Note 8, 9)
*2015 CAPEX
>>2014 PPE x CAPEX to Sales ratio
2014 Capital Expenditure/Net
Sales Ratio 14%
(2014 Cash Flow Statement -
Investing - CAPEX 17,194) 17,194 / 127,079
Maturities of Long-Term Debt
Maturities of long-term debt
outstanding at December 31, 2014
are as follows:
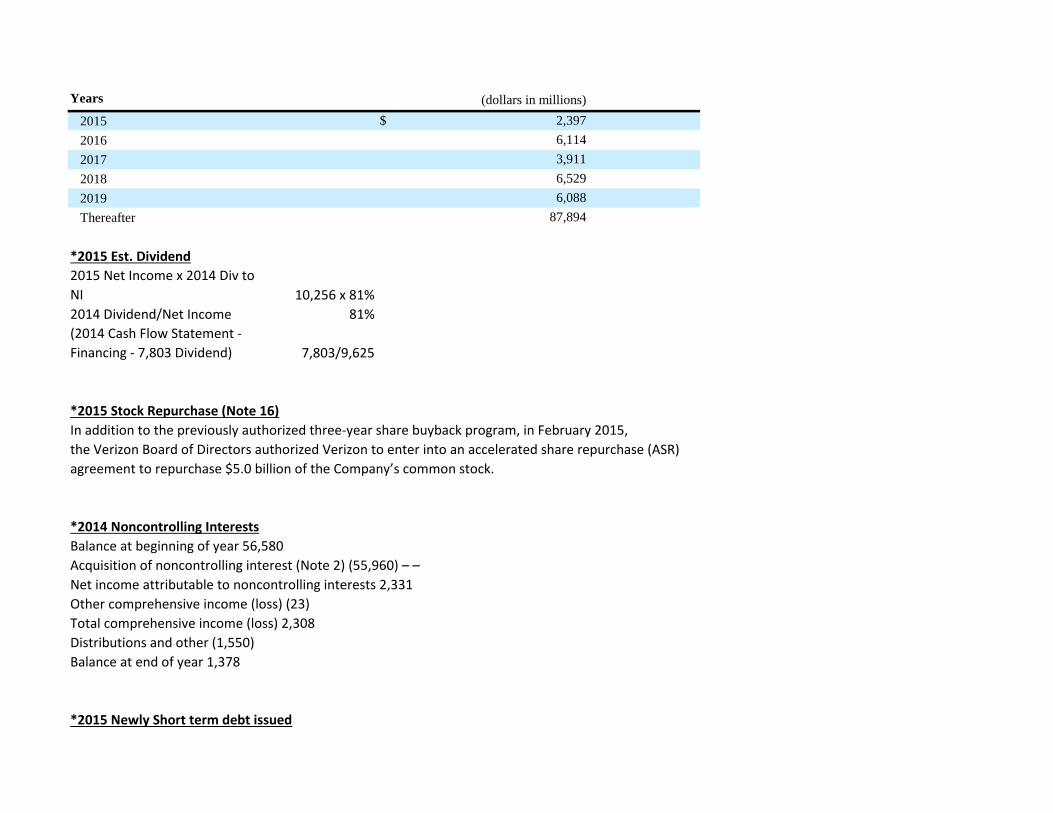
Years
2015 $ 2,397
2016 6,114
2017 3,911
2018 6,529
2019 6,088
Thereafter 87,894
*2015 Est. Dividend
2015 Net Income x 2014 Div to
NI 10,256 x 81%
2014 Dividend/Net Income 81%
(2014 Cash Flow Statement -
Financing - 7,803 Dividend) 7,803/9,625
*2015 Stock Repurchase (Note 16)
In addition to the previously authorized three-year share buyback program, in February 2015,
the Verizon Board of Directors authorized Verizon to enter into an accelerated share repurchase (ASR)
agreement to repurchase $5.0 billion of the Company’s common stock.
*2014 Noncontrolling Interests
Balance at beginning of year 56,580
Acquisition of noncontrolling interest (Note 2) (55,960) – –
Net income attributable to noncontrolling interests 2,331
Other comprehensive income (loss) (23)
Total comprehensive income (loss) 2,308
Distributions and other (1,550)
Balance at end of year 1,378
*2015 Newly Short term debt issued
(dollars in millions)
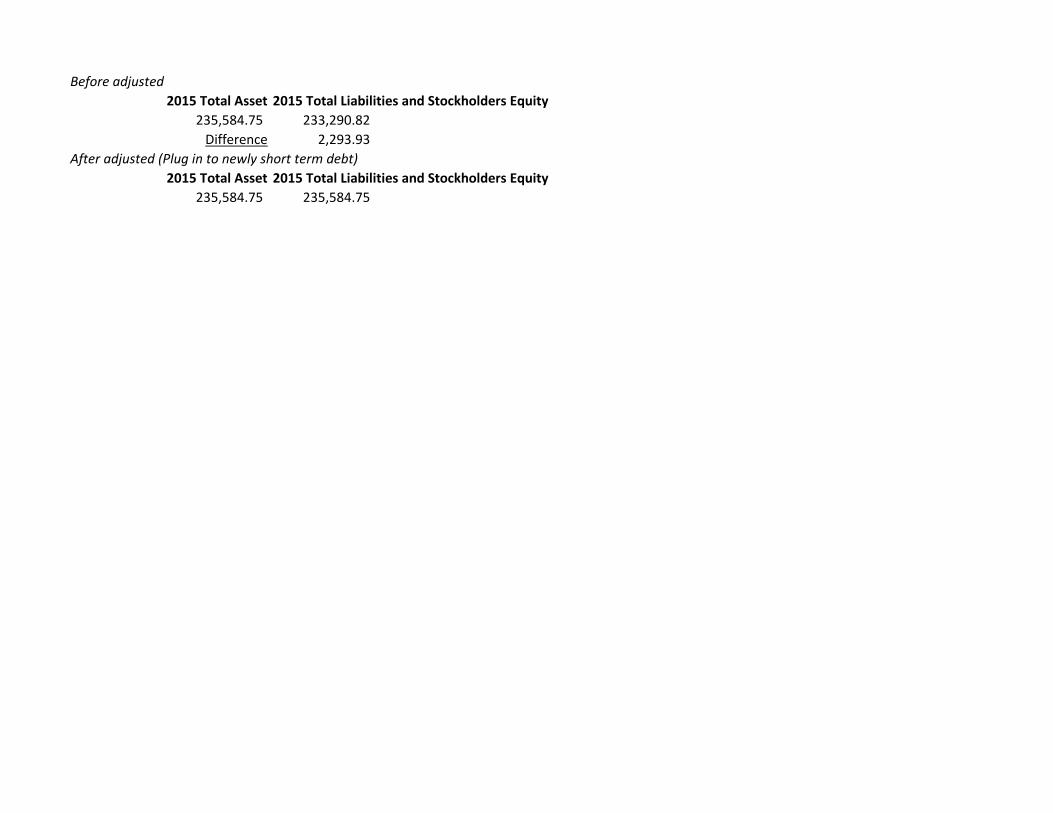
Before adjusted
2015 Total Asset 2015 Total Liabilities and Stockholders Equity
235,584.75 233,290.82
Difference 2,293.93
After adjusted (Plug in to newly short term debt)
2015 Total Asset 2015 Total Liabilities and Stockholders Equity
235,584.75 235,584.75
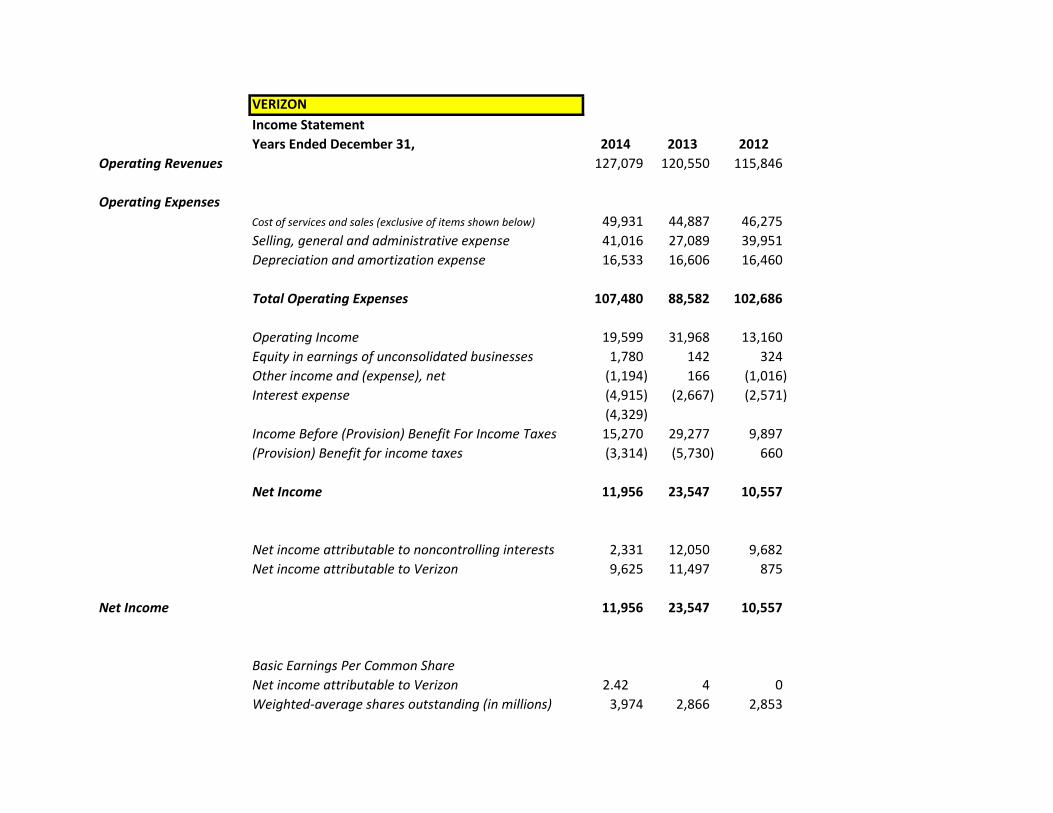
VERIZON
Income Statement
Years Ended December 31, 2014 2013 2012
Operating Revenues 127,079 120,550 115,846
Operating Expenses
Cost of services and sales (exclusive of items shown below) 49,931 44,887 46,275
Selling, general and administrative expense 41,016 27,089 39,951
Depreciation and amortization expense 16,533 16,606 16,460
Total Operating Expenses 107,480 88,582 102,686
Operating Income 19,599 31,968 13,160
Equity in earnings of unconsolidated businesses 1,780 142 324
Other income and (expense), net (1,194) 166 (1,016)
Interest expense (4,915) (2,667) (2,571)
(4,329)
Income Before (Provision) Benefit For Income Taxes 15,270 29,277 9,897
(Provision) Benefit for income taxes (3,314) (5,730) 660
Net Income 11,956 23,547 10,557
Net income attributable to noncontrolling interests 2,331 12,050 9,682
Net income attributable to Verizon 9,625 11,497 875
Net Income 11,956 23,547 10,557
Basic Earnings Per Common Share
Net income attributable to Verizon 2.42 4 0
Weighted-average shares outstanding (in millions) 3,974 2,866 2,853
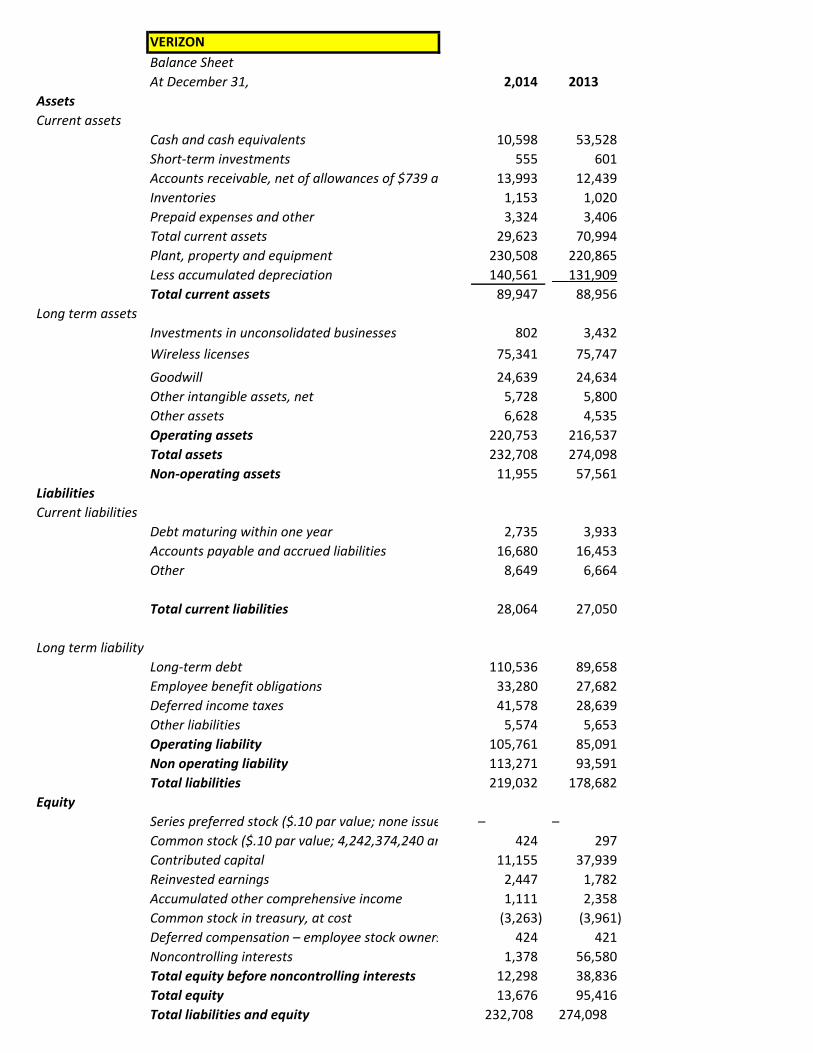
VERIZON
Balance Sheet
At December 31, 2,014 2013
Assets
Current assets
Cash and cash equivalents 10,598 53,528
Short-term investments 555 601
Accounts receivable, net of allowances of $739 and $645 13,993 12,439
Inventories 1,153 1,020
Prepaid expenses and other 3,324 3,406
Total current assets 29,623 70,994
Plant, property and equipment 230,508 220,865
Less accumulated depreciation 140,561 131,909
Total current assets 89,947 88,956
Long term assets
Investments in unconsolidated businesses 802 3,432
Wireless licenses 75,341 75,747
Goodwill 24,639 24,634
Other intangible assets, net 5,728 5,800
Other assets 6,628 4,535
Operating assets 220,753 216,537
Total assets 232,708 274,098
Non-operating assets 11,955 57,561
Liabilities
Current liabilities
Debt maturing within one year 2,735 3,933
Accounts payable and accrued liabilities 16,680 16,453
Other 8,649 6,664
Total current liabilities 28,064 27,050
Long term liability
Long-term debt 110,536 89,658
Employee benefit obligations 33,280 27,682
Deferred income taxes 41,578 28,639
Other liabilities 5,574 5,653
Operating liability 105,761 85,091
Non operating liability 113,271 93,591
Total liabilities 219,032 178,682
Equity
Series preferred stock ($.10 par value; none issued) – –
Common stock ($.10 par value; 4,242,374,240 and 2,967,610,119 shares issued in each period, respectively) 424 297
Contributed capital 11,155 37,939
Reinvested earnings 2,447 1,782
Accumulated other comprehensive income 1,111 2,358
Common stock in treasury, at cost (3,263) (3,961)
Deferred compensation – employee stock ownership plans and other 424 421
Noncontrolling interests 1,378 56,580
Total equity before noncontrolling interests 12,298 38,836
Total equity 13,676 95,416
Total liabilities and equity 232,708 274,098
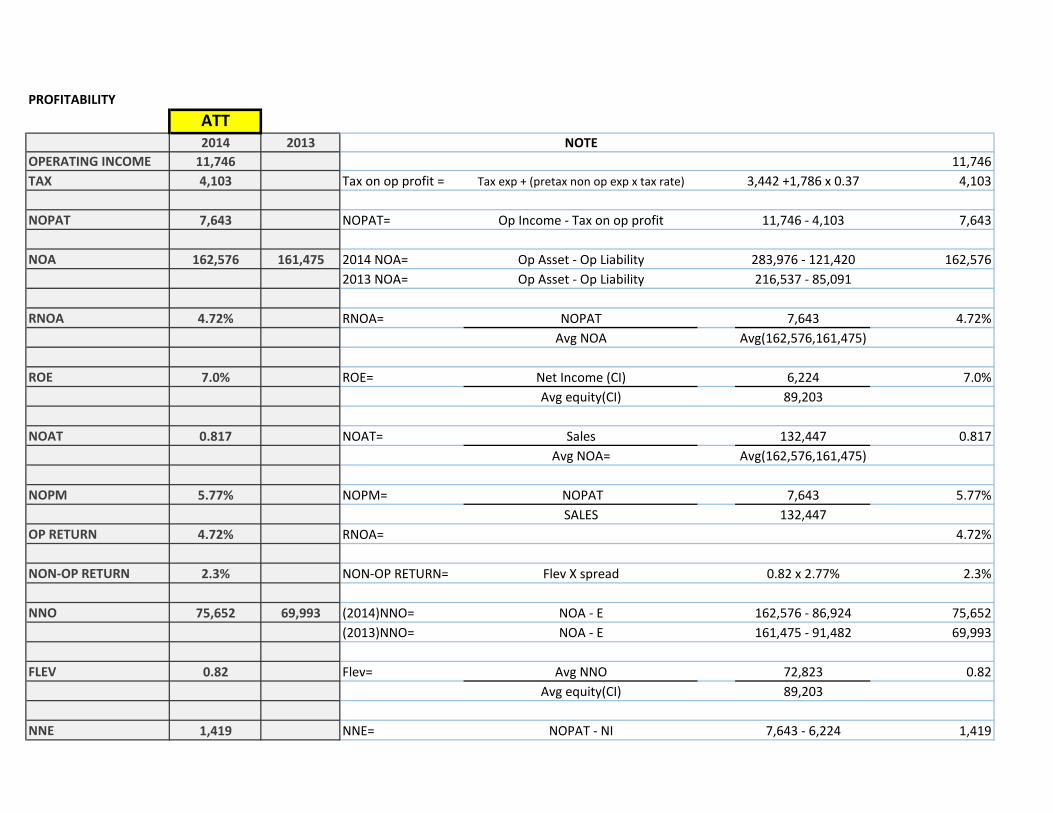
PROFITABILITY
ATT 2014 2013 NOTE NOTE2
OPERATING INCOME 11,746 11,746
TAX 4,103 Tax on op profit = Tax exp + (pretax non op exp x tax rate) 3,442 +1,786 x 0.37 4,103
NOPAT 7,643 NOPAT= Op Income - Tax on op profit 11,746 - 4,103 7,643
NOA 162,576 161,475 2014 NOA= Op Asset - Op Liability 283,976 - 121,420 162,576
2013 NOA= Op Asset - Op Liability 216,537 - 85,091
RNOA 4.72% RNOA= NOPAT 7,643 4.72%
Avg NOA Avg(162,576,161,475)
ROE 7.0% ROE= Net Income (CI) 6,224 7.0%
Avg equity(CI) 89,203
NOAT 0.817 NOAT= Sales 132,447 0.817
Avg NOA= Avg(162,576,161,475)
NOPM 5.77% NOPM= NOPAT 7,643 5.77%
SALES 132,447
OP RETURN 4.72% RNOA= 4.72%
NON-OP RETURN 2.3% NON-OP RETURN= Flev X spread 0.82 x 2.77% 2.3%
NNO 75,652 69,993 (2014)NNO= NOA - E 162,576 - 86,924 75,652
(2013)NNO= NOA - E 161,475 - 91,482 69,993
FLEV 0.82 Flev= Avg NNO 72,823 0.82
Avg equity(CI) 89,203
NNE 1,419 NNE= NOPAT - NI 7,643 - 6,224 1,419
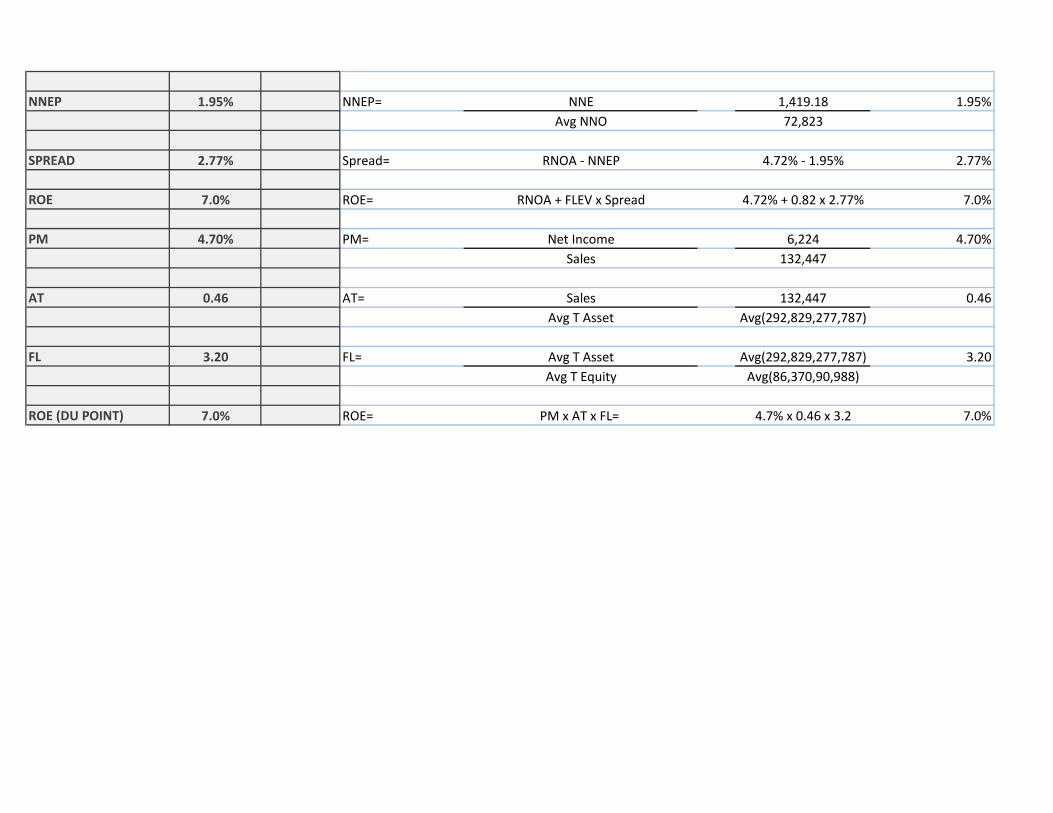
NNEP 1.95% NNEP= NNE 1,419.18 1.95%
Avg NNO 72,823
SPREAD 2.77% Spread= RNOA - NNEP 4.72% - 1.95% 2.77%
ROE 7.0% ROE= RNOA + FLEV x Spread 4.72% + 0.82 x 2.77% 7.0%
PM 4.70% PM= Net Income 6,224 4.70%
Sales 132,447
AT 0.46 AT= Sales 132,447 0.46
Avg T Asset Avg(292,829,277,787)
FL 3.20 FL= Avg T Asset Avg(292,829,277,787) 3.20
Avg T Equity Avg(86,370,90,988)
ROE (DU POINT) 7.0% ROE= PM x AT x FL= 4.7% x 0.46 x 3.2 7.0%
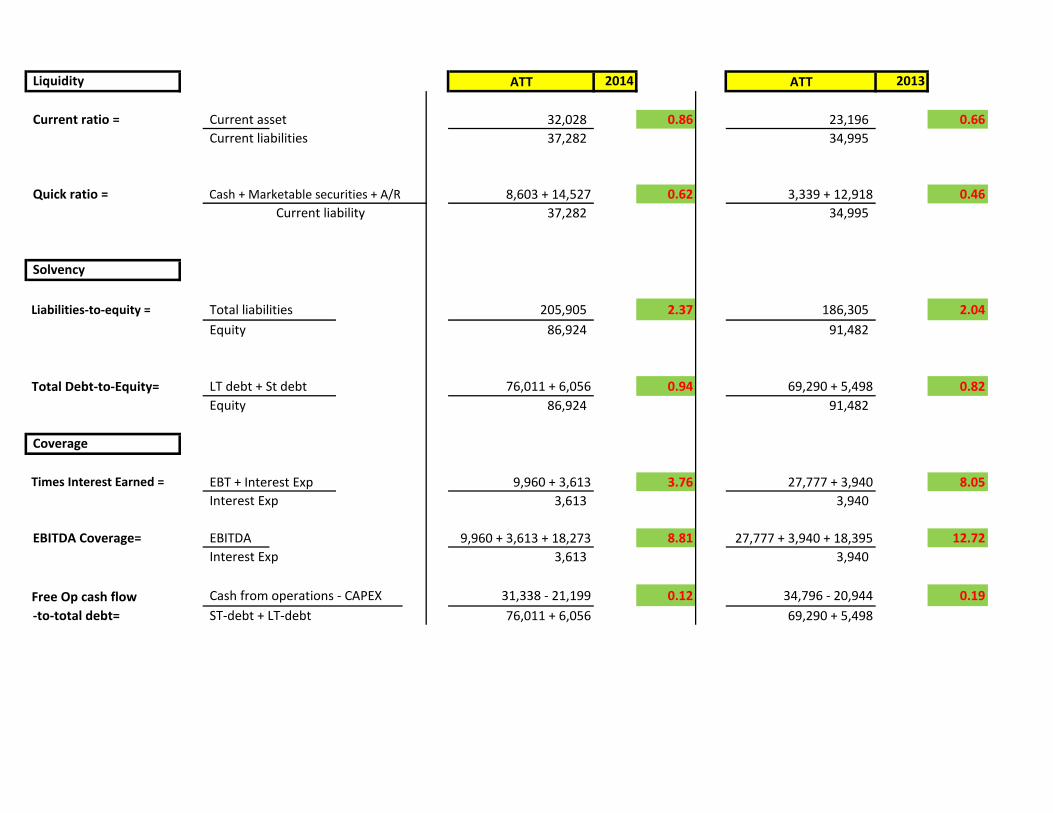
Liquidity ATT 2014 ATT 2013
Current ratio = Current asset 32,028 0.86 23,196 0.66
Current liabilities 37,282 34,995
Quick ratio = Cash + Marketable securities + A/R 8,603 + 14,527 0.62 3,339 + 12,918 0.46
Current liability 37,282 34,995
Solvency
Liabilities-to-equity = Total liabilities 205,905 2.37 186,305 2.04
Equity 86,924 91,482
Total Debt-to-Equity= LT debt + St debt 76,011 + 6,056 0.94 69,290 + 5,498 0.82
Equity 86,924 91,482
Coverage
Times Interest Earned = EBT + Interest Exp 9,960 + 3,613 3.76 27,777 + 3,940 8.05
Interest Exp 3,613 3,940
EBITDA Coverage= EBITDA 9,960 + 3,613 + 18,273 8.81 27,777 + 3,940 + 18,395 12.72
Interest Exp 3,613 3,940
Free Op cash flow Cash from operations - CAPEX 31,338 - 21,199 0.12 34,796 - 20,944 0.19
-to-total debt= ST-debt + LT-debt 76,011 + 6,056 69,290 + 5,498
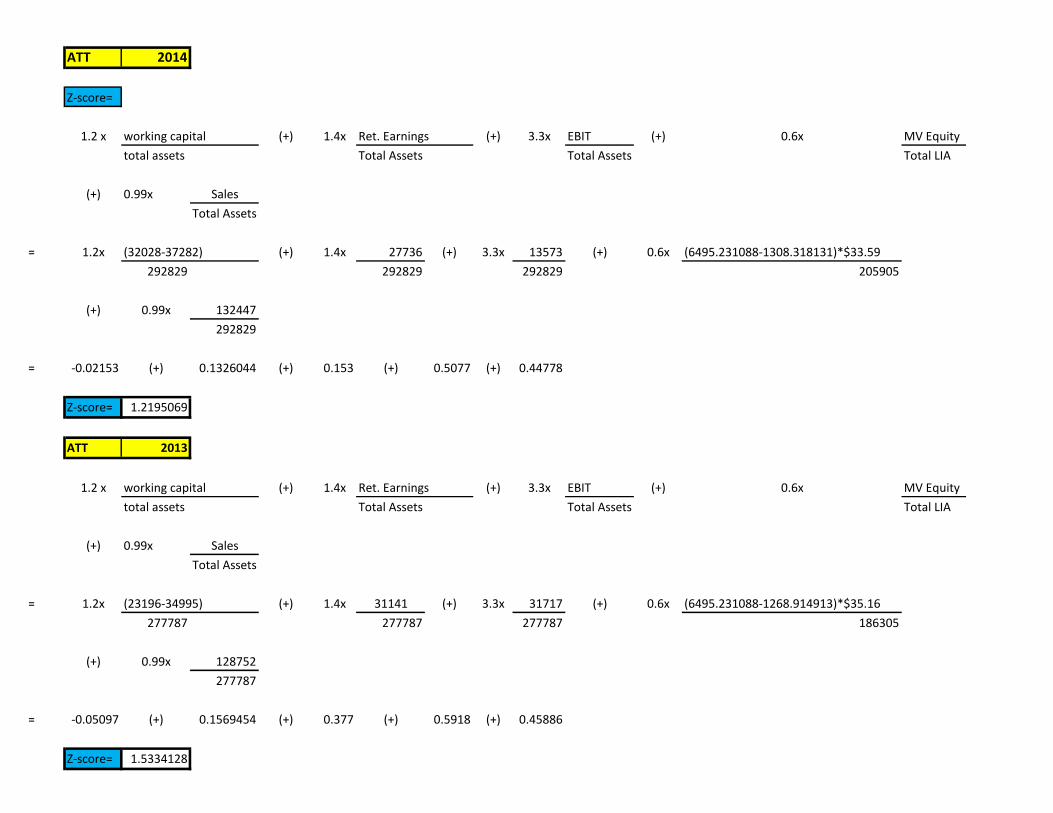
ATT 2014
Z-score=
1.2 x working capital (+) 1.4x Ret. Earnings (+) 3.3x EBIT (+) 0.6x MV Equity
total assets Total Assets Total Assets Total LIA
(+) 0.99x Sales
Total Assets
= 1.2x (32028-37282) (+) 1.4x 27736 (+) 3.3x 13573 (+) 0.6x (6495.231088-1308.318131)*$33.59
292829 292829 292829 205905
(+) 0.99x 132447
292829
= -0.02153 (+) 0.1326044 (+) 0.153 (+) 0.5077 (+) 0.44778
Z-score= 1.2195069
ATT 2013
1.2 x working capital (+) 1.4x Ret. Earnings (+) 3.3x EBIT (+) 0.6x MV Equity
total assets Total Assets Total Assets Total LIA
(+) 0.99x Sales
Total Assets
= 1.2x (23196-34995) (+) 1.4x 31141 (+) 3.3x 31717 (+) 0.6x (6495.231088-1268.914913)*$35.16
277787 277787 277787 186305
(+) 0.99x 128752
277787
= -0.05097 (+) 0.1569454 (+) 0.377 (+) 0.5918 (+) 0.45886
Z-score= 1.5334128
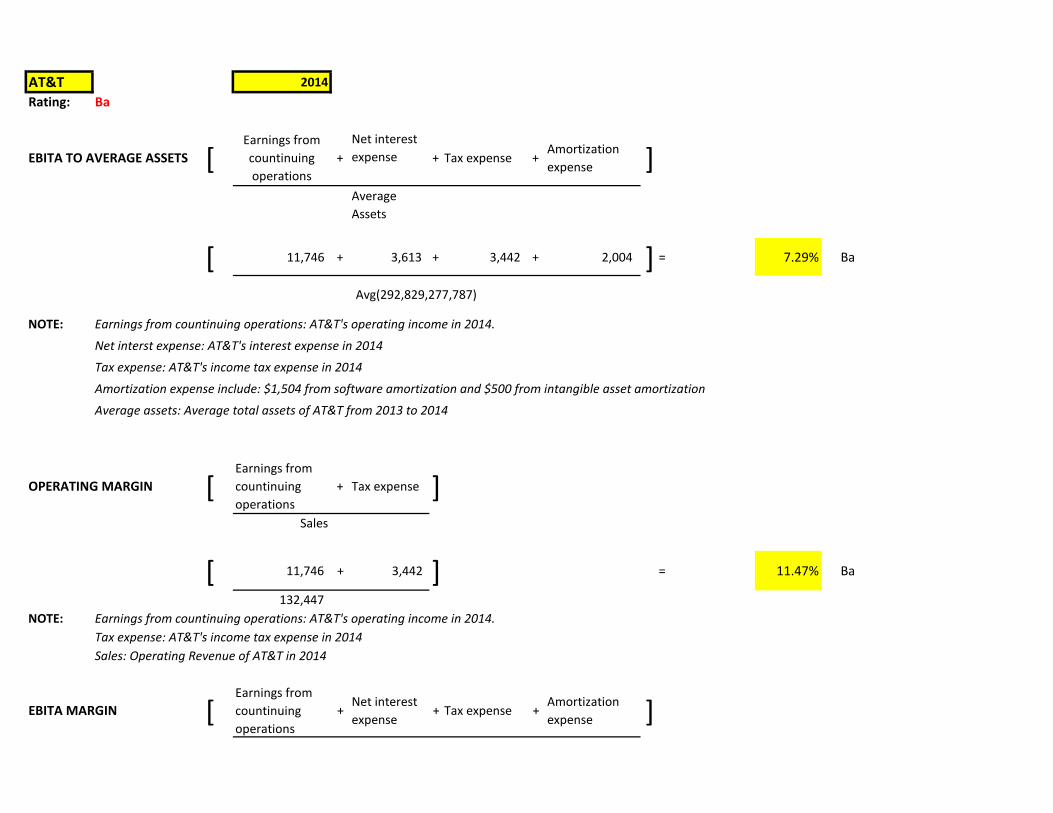
AT&T 2014
Rating: Ba
EBITA TO AVERAGE ASSETS [Earnings from
countinuing
operations
+
Net interest
expense + Tax expense +Amortization
expense ]Average
Assets
[ 11,746 + 3,613 + 3,442 + 2,004 ] = 7.29% Ba
Avg(292,829,277,787)
NOTE: Earnings from countinuing operations: AT&T's operating income in 2014.
Net interst expense: AT&T's interest expense in 2014
Tax expense: AT&T's income tax expense in 2014
Amortization expense include: $1,504 from software amortization and $500 from intangible asset amortization
Average assets: Average total assets of AT&T from 2013 to 2014
OPERATING MARGIN [Earnings from
countinuing
operations
+ Tax expense ]Sales
[ 11,746 + 3,442 ] = 11.47% Ba
132,447
NOTE: Earnings from countinuing operations: AT&T's operating income in 2014.
Tax expense: AT&T's income tax expense in 2014
Sales: Operating Revenue of AT&T in 2014
EBITA MARGIN [Earnings from
countinuing
operations
+Net interest
expense+ Tax expense +
Amortization
expense ]
Sales
[ 11,746 + 3,613 + 3,442 + 2,004 ] = 15.71% A
132,447
NOTE: Earnings from countinuing operations: AT&T's operating income in 2014.
Net interst expense: AT&T's interest expense in 2014
Tax expense: AT&T's income tax expense in 2014
Amortization expense include: $1,504 from software amortization and $500 from intangible asset amortization
Sales: Operating Revenue of AT&T in 2014
EBITA INTEREST COVERAGE [Earnings from
countinuing
operations
+ Net interest
expense+ Tax expense +
Amortization
expense ]
Gross interest expense
[ 11,746 + 3,613 + 3,442 + 2,004 ] = 5.48 Baa
3800
NOTE: Earnings from countinuing operations: AT&T's operating income in 2014.
Net interst expense: AT&T's interest expense in 2014
Tax expense: AT&T's income tax expense in 2014
Amortization expense include: $1,504 from software amortization and $500 from intangible asset amortization
Gross interst expense: is included in interest expense ( http://www.marketwatch.com/investing/stock/vz/financials)
DEBT TO EBITDA [ Long term debt +Current
maturities+
Commercial
paper+
Short term
borrowings ]
[Earnings from
countinuing
operations
+ Net interest
expense+ Tax expense +
Amortization
expense+
Depreciation
expenses ]
[ 110,536 6,051 0 5 ]= 3.14 Ba
11,746 + 3,613 + 3,442 + 2,004 + 16,269
NOTE: Long term debt: AT&T's long term debt in 2014
Current maturities: Current maturities of long-term debt of $6,051 million in 2014 (Note 9 - AT&T consolidated financial statement)
Short term borrowings: AT&T's short term notepayable of $5 million in 2014 (Note 9 - AT&T consolidated financial statement)
Earnings from countinuing operations: AT&T's operating income in 2014.
Net interst expense: AT&T's interest expense in 2014
Tax expense: AT&T's income tax expense in 2014
Amortization expense include: $1,504 from software amortization and $500 from intangible asset amortization
Depreciation expense: is calculated by 2014 Depreciation and amortization expense in income statement of $18,273 subtracts $2,004 of amortization expense
DEBT TO BOOK CAP [ Long term debt +Current
maturities+
Commercial
paper+
Short term
borrowings ]Long term debt +
Current
maturities+
Commercial
paper+
Short term
borrowingsDeferred taxes +
Minority
interest+ Equity
[ 110,536 + 6,051 + 0 + 5 + ] 48.37%
110,536 + 6,051 + 0 + 5 + 37,544 + 554 + 86,370 Ba
NOTE: Long term debt: AT&T's long term debt in 2014
Current maturities: Current maturities of long-term debt of $6,051 million in 2014 (Note 9 - AT&T consolidated financial statement)
Short term borrowings: AT&T's short term notepayable of $5 million in 2014 (Note 9 - AT&T consolidated financial statement)
Deferred taxes: AT&T's deferred income taxes in 2014
Minority interest: AT&T's noncontrolling interest in 2014
Equity: AT&T's equity before noncontrolling interest in 2014
RETAINED CF TO DEBT [ Operating cash
flows- Dividends ]
Long term debt +Current
maturities+
Commercial
paper+
Short term
borrowings
[ 31,338 - 9,552 ] = 18.7% Ba
110536 + 6051 + 0 + 5
AT&T 2013Rating: Aa
EBITA TO AVERAGE ASSETS [Earnings from
countinuing
operations
+
Net interest
expense + Tax expense +Amortization
expense ]Average
Assets
[ 30,479 + 3,940 + 9,224 + 2,814 ] = 16.28% Aaa
Avg(292,829,277,787)
NOTE: Earnings from countinuing operations: AT&T's operating income in 2013.
Net interst expense: AT&T's interest expense in 2013
Tax expense: AT&T's income tax expense in 2013
Amortization expense include: $2,142 from software amortization and $672 from intangible asset amortization
Average assets: Average total assets of AT&T from 2013 to 2014
OPERATING MARGIN [Earnings from
countinuing
operations
+ Tax expense ]Sales
[ 30,479 + 9,224 ] = 30.84% Aaa
128,752
NOTE: Earnings from countinuing operations: AT&T's operating income in 2013.
Tax expense: AT&T's income tax expense in 2013
Sales: Operating Revenue of AT&T in 2013
EBITA MARGIN [Earnings from
countinuing
operations
+Net interest
expense+ Tax expense +
Amortization
expense ]Sales
[ 30,479 + 3,940 + 9,224 + 2,814 ] = 36.08% Aaa
128,752
NOTE: Earnings from countinuing operations: AT&T's operating income in 2013.
Net interst expense: AT&T's interest expense in 2013
Tax expense: AT&T's income tax expense in 2013
Amortization expense include: $2,142 from software amortization and $672 from intangible asset amortization
Sales: Operating Revenue of AT&T in 2013
EBITA INTEREST COVERAGE [Earnings from
countinuing
operations
+ Net interest
expense+ Tax expense +
Amortization
expense ]Gross interest expense
[ 30,479 + 3,940 + 9,224 + 2,814 ] = 11.11 Aa
4,180
NOTE: Tax expense: AT&T's income tax expense in 2013
Amortization expense include: $2,142 from software amortization and $672 from intangible asset amortization
Average assets: Average total assets of AT&T from 2013 to 2014
Gross interst expense: is included in interest expense ( http://www.marketwatch.com/investing/stock/vz/financials)
DEBT TO EBITDA [ Long term debt +Current
maturities+
Commercial
paper+
Short term
borrowings ]
[Earnings from
countinuing
operations
+ Net interest
expense+ Tax expense +
Amortization
expense+
Depreciation
expenses ]
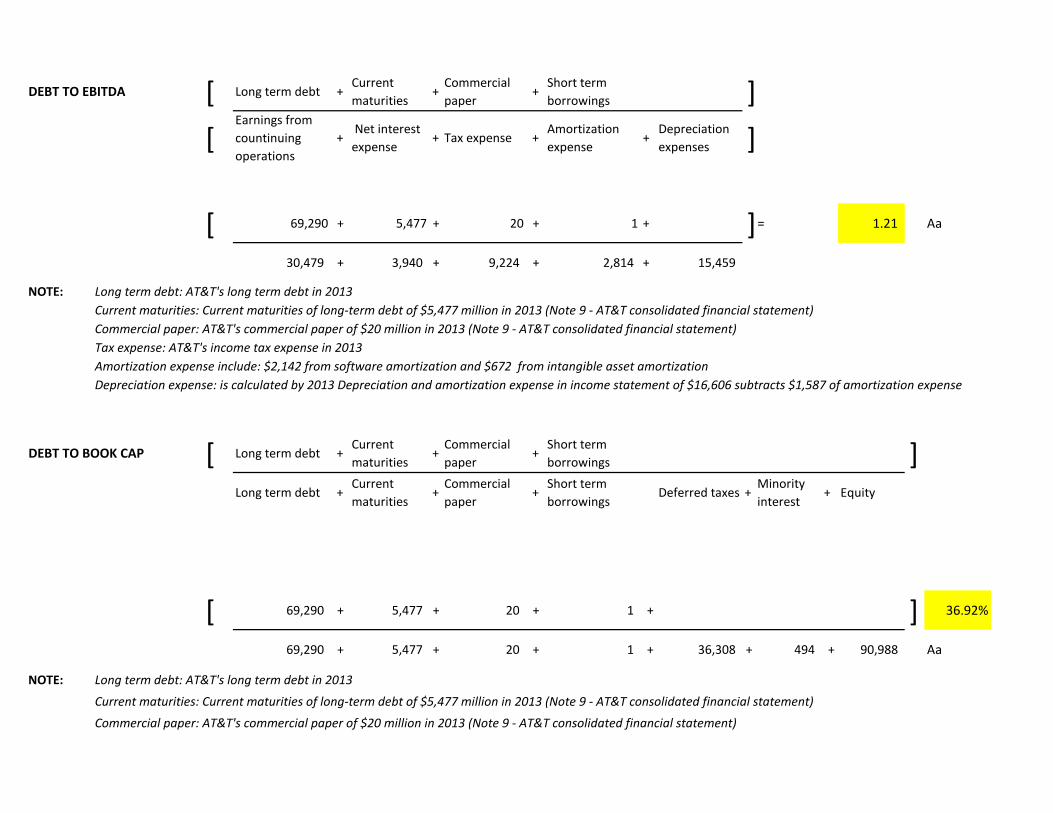
[ 69,290 + 5,477 + 20 + 1 + ]= 1.21 Aa
30,479 + 3,940 + 9,224 + 2,814 + 15,459
NOTE: Long term debt: AT&T's long term debt in 2013
Current maturities: Current maturities of long-term debt of $5,477 million in 2013 (Note 9 - AT&T consolidated financial statement)
Commercial paper: AT&T's commercial paper of $20 million in 2013 (Note 9 - AT&T consolidated financial statement)
Tax expense: AT&T's income tax expense in 2013
Amortization expense include: $2,142 from software amortization and $672 from intangible asset amortization
Depreciation expense: is calculated by 2013 Depreciation and amortization expense in income statement of $16,606 subtracts $1,587 of amortization expense
DEBT TO BOOK CAP [ Long term debt +Current
maturities+
Commercial
paper+
Short term
borrowings ]Long term debt +
Current
maturities+
Commercial
paper+
Short term
borrowingsDeferred taxes +
Minority
interest+ Equity
[ 69,290 + 5,477 + 20 + 1 + ] 36.92%
69,290 + 5,477 + 20 + 1 + 36,308 + 494 + 90,988 Aa
NOTE: Long term debt: AT&T's long term debt in 2013
Current maturities: Current maturities of long-term debt of $5,477 million in 2013 (Note 9 - AT&T consolidated financial statement)
Commercial paper: AT&T's commercial paper of $20 million in 2013 (Note 9 - AT&T consolidated financial statement)
Deferred taxes: AT&T's deferred income taxes in 2013
Minority interest: AT&T's noncontrolling interest in 2013
Equity: AT&T's equity before noncontrolling interest in 2013
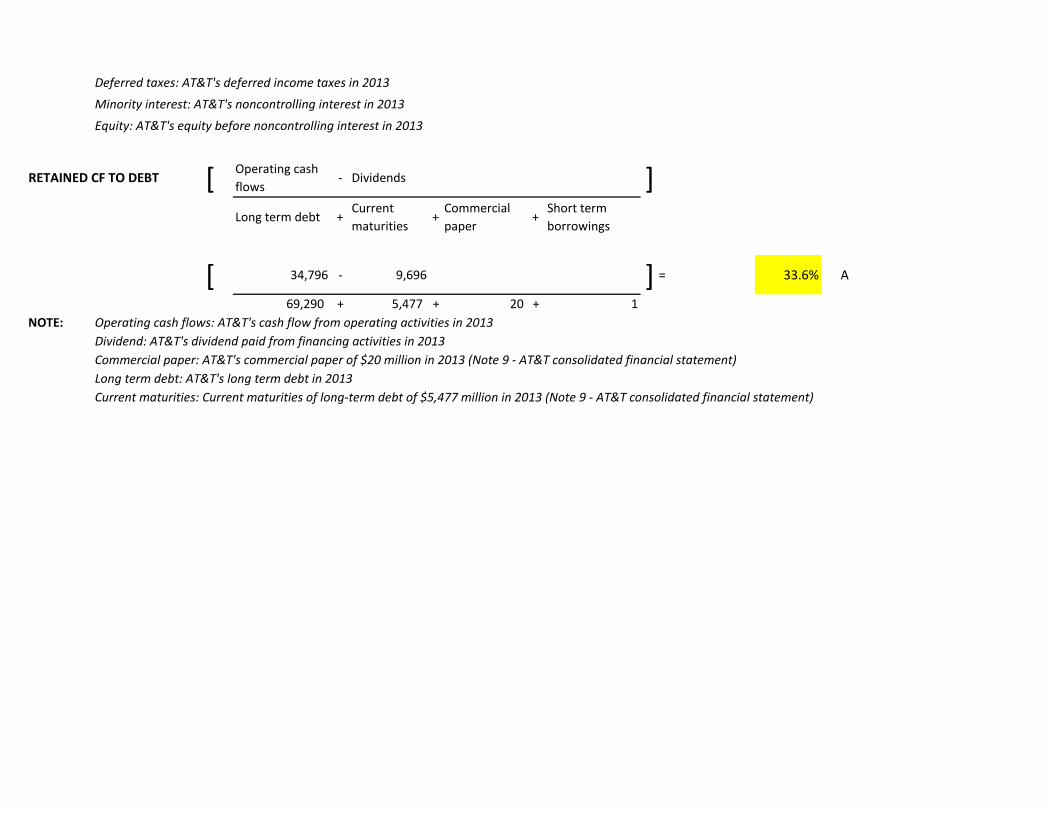
RETAINED CF TO DEBT [ Operating cash
flows- Dividends ]
Long term debt +Current
maturities+
Commercial
paper+
Short term
borrowings
[ 34,796 - 9,696 ] = 33.6% A
69,290 + 5,477 + 20 + 1
NOTE: Operating cash flows: AT&T's cash flow from operating activities in 2013
Dividend: AT&T's dividend paid from financing activities in 2013
Commercial paper: AT&T's commercial paper of $20 million in 2013 (Note 9 - AT&T consolidated financial statement)
Long term debt: AT&T's long term debt in 2013
Current maturities: Current maturities of long-term debt of $5,477 million in 2013 (Note 9 - AT&T consolidated financial statement)
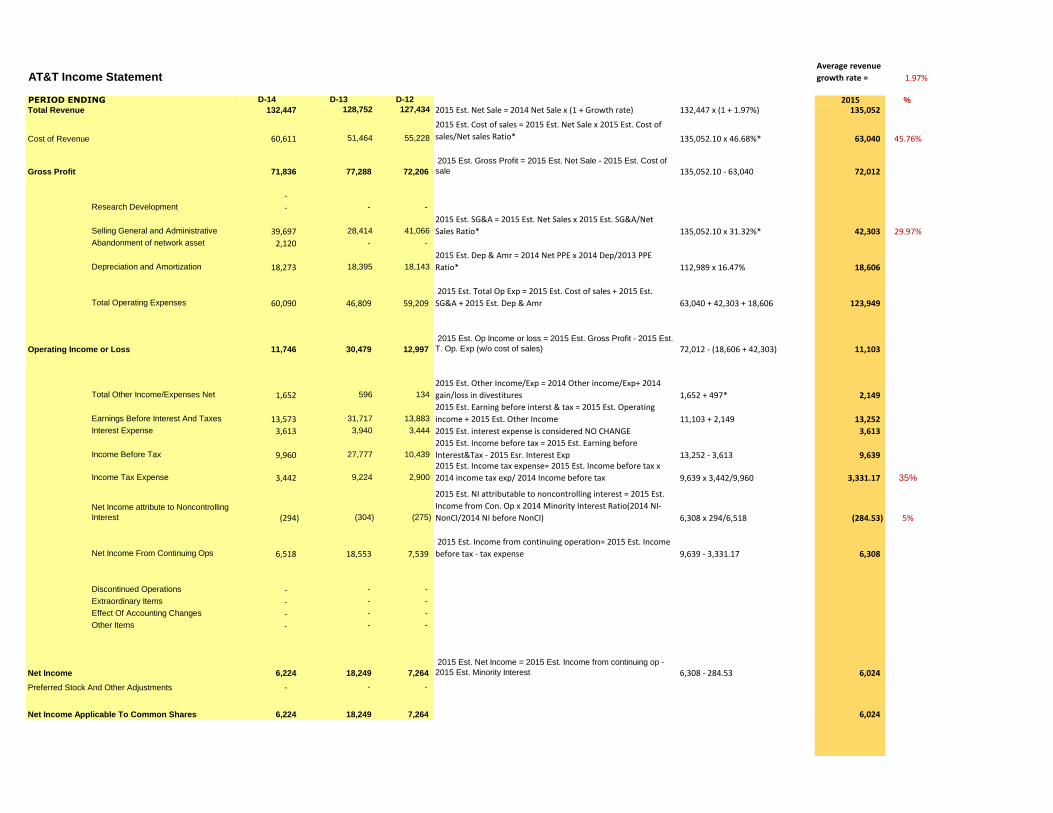
AT&T Income Statement Average revenue
growth rate = 1.97%
D-14 D-13 D-12 2015 %
132,447 128,752 127,434 2015 Est. Net Sale = 2014 Net Sale x (1 + Growth rate) 132,447 x (1 + 1.97%) 135,052
60,611 51,464 55,228
2015 Est. Cost of sales = 2015 Est. Net Sale x 2015 Est. Cost of
sales/Net sales Ratio* 135,052.10 x 46.68%* 63,040 45.76%
71,836 77,288 72,206
2015 Est. Gross Profit = 2015 Est. Net Sale - 2015 Est. Cost of
sale 135,052.10 - 63,040 72,012
- Research Development - - -
Selling General and Administrative 39,697 28,414 41,066
2015 Est. SG&A = 2015 Est. Net Sales x 2015 Est. SG&A/Net
Sales Ratio* 135,052.10 x 31.32%* 42,303 29.97%Abandonment of network asset 2,120 - -
Depreciation and Amortization 18,273 18,395 18,143
2015 Est. Dep & Amr = 2014 Net PPE x 2014 Dep/2013 PPE
Ratio* 112,989 x 16.47% 18,606
Total Operating Expenses 60,090 46,809 59,209
2015 Est. Total Op Exp = 2015 Est. Cost of sales + 2015 Est.
SG&A + 2015 Est. Dep & Amr 63,040 + 42,303 + 18,606 123,949
11,746 30,479 12,997
2015 Est. Op Income or loss = 2015 Est. Gross Profit - 2015 Est.
T. Op. Exp (w/o cost of sales) 72,012 - (18,606 + 42,303) 11,103
Total Other Income/Expenses Net 1,652 596 134
2015 Est. Other Income/Exp = 2014 Other income/Exp+ 2014
gain/loss in divestitures 1,652 + 497* 2,149
Earnings Before Interest And Taxes 13,573 31,717 13,883
2015 Est. Earning before interst & tax = 2015 Est. Operating
income + 2015 Est. Other Income 11,103 + 2,149 13,252 Interest Expense 3,613 3,940 3,444 2015 Est. interest expense is considered NO CHANGE 3,613
Income Before Tax 9,960 27,777 10,439
2015 Est. Income before tax = 2015 Est. Earning before
Interest&Tax - 2015 Esr. Interest Exp 13,252 - 3,613 9,639
Income Tax Expense 3,442 9,224 2,900
2015 Est. Income tax expense= 2015 Est. Income before tax x
2014 income tax exp/ 2014 Income before tax 9,639 x 3,442/9,960 3,331.17 35%
Net Income attribute to Noncontrolling
Interest (294) (304) (275)
2015 Est. NI attributable to noncontrolling interest = 2015 Est.
Income from Con. Op x 2014 Minority Interest Ratio(2014 NI-
NonCI/2014 NI before NonCI) 6,308 x 294/6,518 (284.53) 5%
Net Income From Continuing Ops 6,518 18,553 7,539
2015 Est. Income from continuing operation= 2015 Est. Income
before tax - tax expense 9,639 - 3,331.17 6,308
Discontinued Operations - - -
Extraordinary Items - - -
Effect Of Accounting Changes - - -
Other Items - - -
6,224 18,249 7,264
2015 Est. Net Income = 2015 Est. Income from continuing op -
2015 Est. Minority Interest 6,308 - 284.53 6,024
- - -
6,224 18,249 7,264 6,024
Preferred Stock And Other Adjustments
Net Income Applicable To Common Shares
Net Income
PERIOD ENDINGTotal Revenue
Cost of Revenue
Gross Profit
Operating Income or Loss
AT&T Balance Sheet
D-14 D-13 D-12
Cash And Cash Equivalents 8,603 3,339 4,868 2015 Est. Cash = 2015 Est. Net sales x 2014 Cash/Net sale ratio 135,052.10 x 6.5% 8,772.21 6.50%Short Term Investments - - -
Net Receivables 15,669 14,117 13,693
2015 Est. net Receivables = 2015 est. Net sale x 2014 Net
Receivable/Net sales ratio 135,052.10 x 11.83% 15,977.19 11.83%Inventory - - -
Other Current Assets 7,756 5,740 4,145
2015 Est. other CA = 2015 est. Net sale x 2014 other CA/Net
sales ratio 135,052.10 x 5.86% 7,908.55 5.86%
32,028 23,196 22,706
2015 Est. Total Current Assets = 2015 Est. Cash + ST Investment
+ Net Rec + Inv + PreExp and Other CA 8,772.21 + 15,977.19 + 7,908.55 32,657.96
250 3,860 4,581 2015 Est. Long term Investment is considered unchanged 250
112,989 110,968 109,767 2015 Est. PPE = 2014 Net PPE + 2015 CAPEX* - 2015 Dep&Amr
112,989 + 135,052.10 x 16.01% -
18,606 115,999.17 85.31% 69,692 69,273 69,773 2015 Est. Goodwill is considered unchanged 69,692 52.62% 66,963 62,212 58,775 2015 Est. Intangible asset is considered unchanged 66,963 50.56% - - - 0.00%
10,998 8,278 6,713
2015 Est. Other asset = 2015 Est. Net Sales x 2014 Other
asset/net sales ratio 135,052.10 x 8.3% 11,214.32 8.30% - - -
292,920 277,787 272,315
2015 Est. total assets = 2015 Est. Total CA + LT inv + PPE +GW +
IA + Other assets
32,657.96 +250 + 115,999.17 +
69,692 + 66,963 + 11,214.32 296,776.45
Accounts Payable 31,226 29,497 28,301
2015 Est. Account Payable = 2015 Est. Net Sales x 2014 AP/Net
sales ratio 135,052.10 x 23.58% 31,840.18 23.58%
Short/Current Long Term Debt 6,056 5,498 3,486
2015 Est. Short term debt = 2014 Short term debt - 2015
Maturity of LT debt + 2016 Maturity LT debt* + Newly short
term debt issued* 6,056 - 6,482 + 5,523 +10,937.98 16,035 Other Current Liabilities - - -
37,282 34,995 31,787
2015 Est. Total current liabilities = 2015 Est. AP + ST debt + other
CL 31,840.18 + 5,097 47,875.16
76,011 69,290 66,358
2015 Est. Long term debt = 2014 LT debt - 2016 Maturity LT
debt 76,011 - 5,523 70,488
55,068 45,712 52,984
2015 Est Other Liabilities = 2015 Est. Net sales x 2014 Other
Liabilities / net sale ratio 135,052.10 x 41.58% 56,151.13 41.58%
37,544 36,308 28,491
2015 Est De. LT Tax = 2015 Est. Net sales x 2014 De. LT tax / net
sale ratio 135,052.10 x 28.35% 38,282.45 28.35% - - -
205,905 186,305 179,620
2015 Est. Total liabilities = 2015 Est. total CL + 2015 Est. LT debt
+ other liabilities + De. LT. Taxes
36,937.18 + 70,488 + 56151.13 +
38,282.45 212,796.75
- - -
- - -
- - -
6,495 6,495 6,495 2015 Est. Common stock is unchanged 6,495
27,736 31,141 22,481
2015 Est. Retained earnings = 2015 Beg RE + 2015 Est. NI - 2015
Est. Dividend 27,736 + 6,024 - 6,024 x 153% 24,515.16 Retained Earnings
Deferred Long Term Liability Charges
Negative Goodwill
Total Liabilities
Stockholders' Equity
Misc Stocks Options Warrants
Redeemable Preferred Stock
Preferred Stock
Common Stock
Other Liabilities
Accumulated Amortization
Other Assets
Deferred Long Term Asset Charges
Total Assets
Liabilities
Current Liabilities
Total Current Liabilities
Long Term Debt
Intangible Assets
PERIOD ENDING
Assets
Current Assets
Total Current Assets
Long Term Investments
Property Plant and Equipment
Goodwill
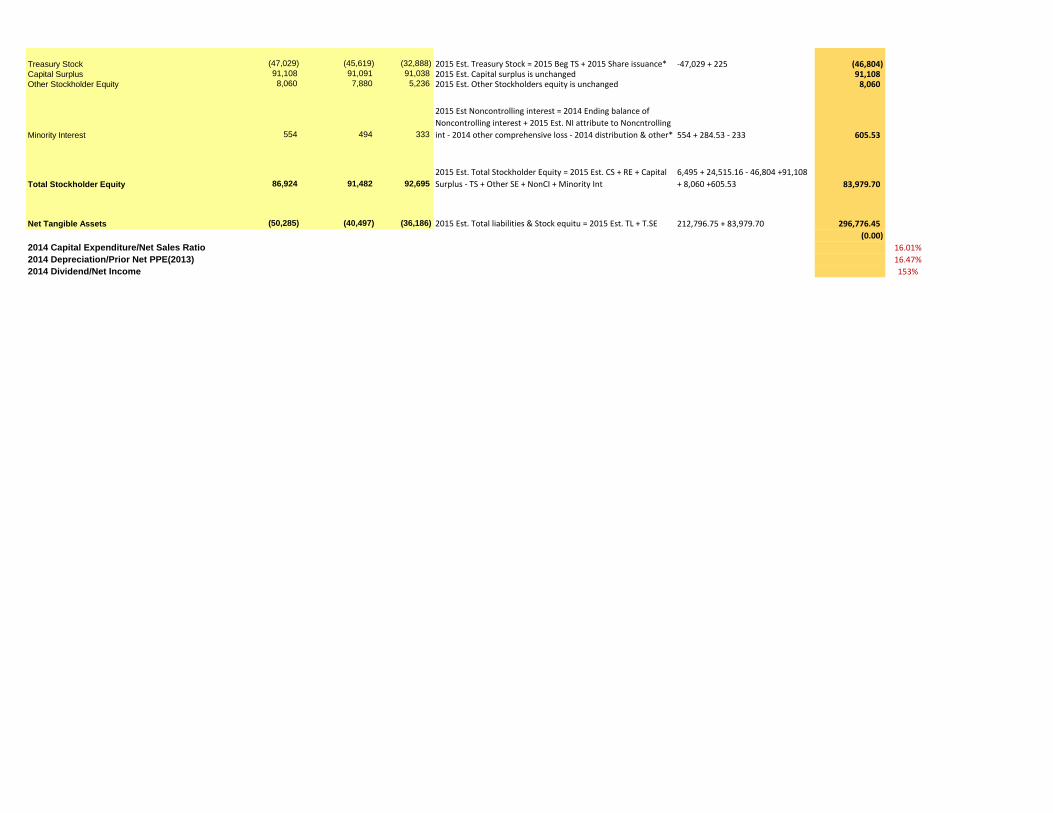
(47,029) (45,619) (32,888) 2015 Est. Treasury Stock = 2015 Beg TS + 2015 Share issuance* -47,029 + 225 (46,804) 91,108 91,091 91,038 2015 Est. Capital surplus is unchanged 91,108 8,060 7,880 5,236 2015 Est. Other Stockholders equity is unchanged 8,060
554 494 333
2015 Est Noncontrolling interest = 2014 Ending balance of
Noncontrolling interest + 2015 Est. NI attribute to Noncntrolling
int - 2014 other comprehensive loss - 2014 distribution & other* 554 + 284.53 - 233 605.53
86,924 91,482 92,695
2015 Est. Total Stockholder Equity = 2015 Est. CS + RE + Capital
Surplus - TS + Other SE + NonCI + Minority Int
6,495 + 24,515.16 - 46,804 +91,108
+ 8,060 +605.53 83,979.70
(50,285) (40,497) (36,186) 2015 Est. Total liabilities & Stock equitu = 2015 Est. TL + T.SE 212,796.75 + 83,979.70 296,776.45
(0.00)
2014 Capital Expenditure/Net Sales Ratio 16.01%
2014 Depreciation/Prior Net PPE(2013) 16.47%
2014 Dividend/Net Income 153%
Net Tangible Assets
Treasury Stock
Capital Surplus
Other Stockholder Equity
Total Stockholder Equity
Minority Interest
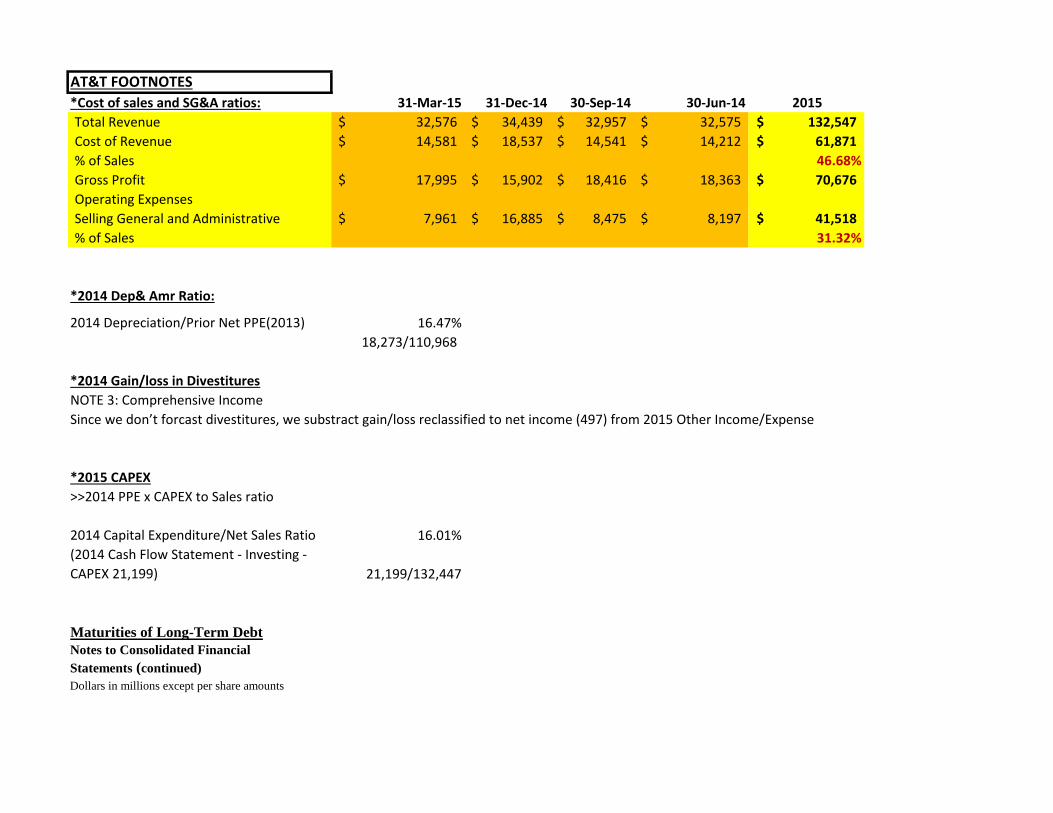
AT&T FOOTNOTES
*Cost of sales and SG&A ratios: 31-Mar-15 31-Dec-14 30-Sep-14 30-Jun-14 2015
Total Revenue 32,576$ 34,439$ 32,957$ 32,575$ 132,547$
Cost of Revenue 14,581$ 18,537$ 14,541$ 14,212$ 61,871$
% of Sales 46.68%
Gross Profit 17,995$ 15,902$ 18,416$ 18,363$ 70,676$
Operating Expenses
Selling General and Administrative 7,961$ 16,885$ 8,475$ 8,197$ 41,518$
% of Sales 31.32%
*2014 Dep& Amr Ratio:
2014 Depreciation/Prior Net PPE(2013) 16.47%
18,273/110,968
*2014 Gain/loss in Divestitures
NOTE 3: Comprehensive Income
Since we don’t forcast divestitures, we substract gain/loss reclassified to net income (497) from 2015 Other Income/Expense
*2015 CAPEX
>>2014 PPE x CAPEX to Sales ratio
2014 Capital Expenditure/Net Sales Ratio 16.01%
(2014 Cash Flow Statement - Investing -
CAPEX 21,199) 21,199/132,447
Maturities of Long-Term Debt
Notes to Consolidated Financial
Statements (continued)
Dollars in millions except per share amounts
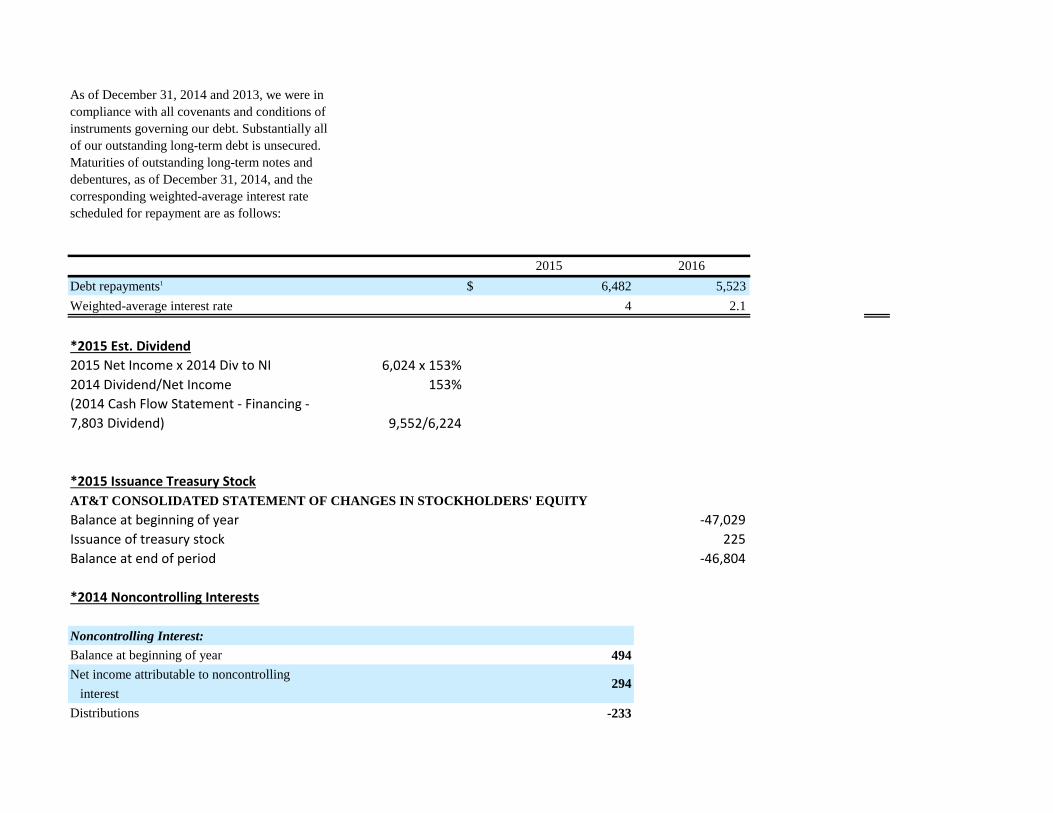
As of December 31, 2014 and 2013, we were in
compliance with all covenants and conditions of
instruments governing our debt. Substantially all
of our outstanding long-term debt is unsecured.
Maturities of outstanding long-term notes and
debentures, as of December 31, 2014, and the
corresponding weighted-average interest rate
scheduled for repayment are as follows:
Debt repayments1 $ 6,482 5,523
Weighted-average interest rate 4 2.1
*2015 Est. Dividend
2015 Net Income x 2014 Div to NI 6,024 x 153%
2014 Dividend/Net Income 153%
(2014 Cash Flow Statement - Financing -
7,803 Dividend) 9,552/6,224
*2015 Issuance Treasury Stock
AT&T CONSOLIDATED STATEMENT OF CHANGES IN STOCKHOLDERS' EQUITY
Balance at beginning of year -47,029
Issuance of treasury stock 225
Balance at end of period -46,804
*2014 Noncontrolling Interests
Noncontrolling Interest:
Balance at beginning of year 494
Net income attributable to noncontrolling
interest
Distributions -233
294
2015 2016
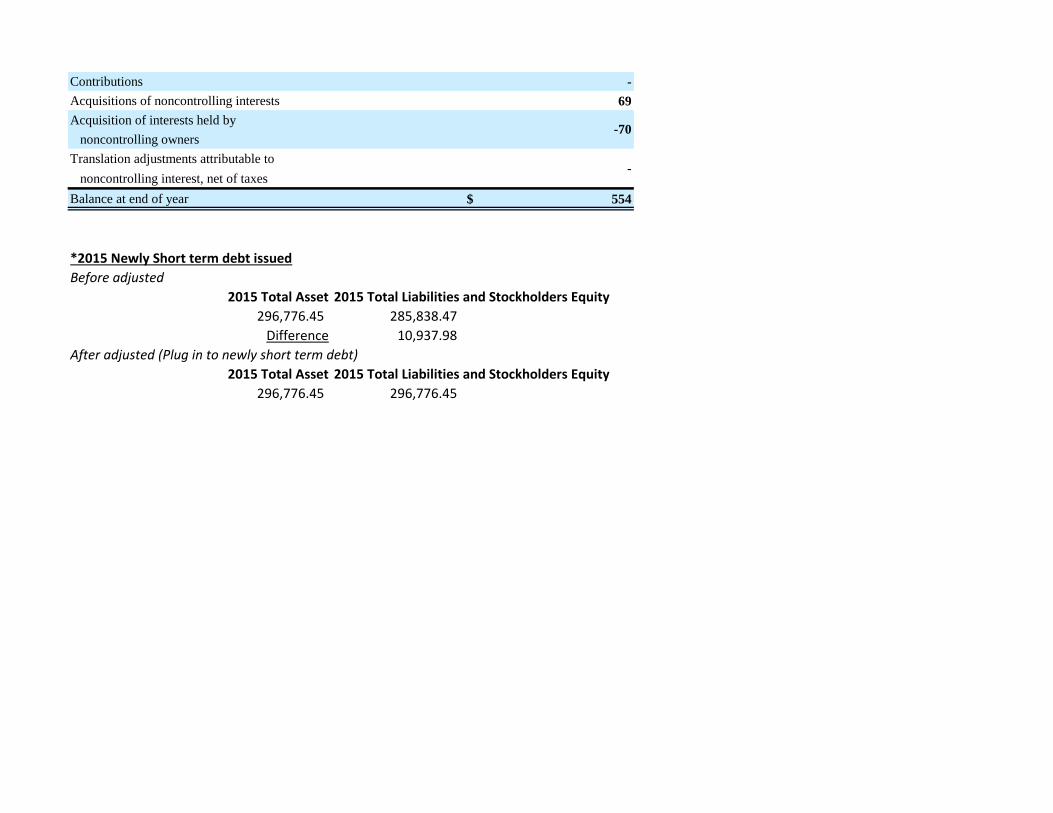
Contributions -
Acquisitions of noncontrolling interests 69
Acquisition of interests held by
noncontrolling owners
Translation adjustments attributable to
noncontrolling interest, net of taxes
Balance at end of year $ 554
*2015 Newly Short term debt issued
Before adjusted
2015 Total Asset 2015 Total Liabilities and Stockholders Equity
296,776.45 285,838.47
Difference 10,937.98
After adjusted (Plug in to newly short term debt)
2015 Total Asset 2015 Total Liabilities and Stockholders Equity
296,776.45 296,776.45
-
-70
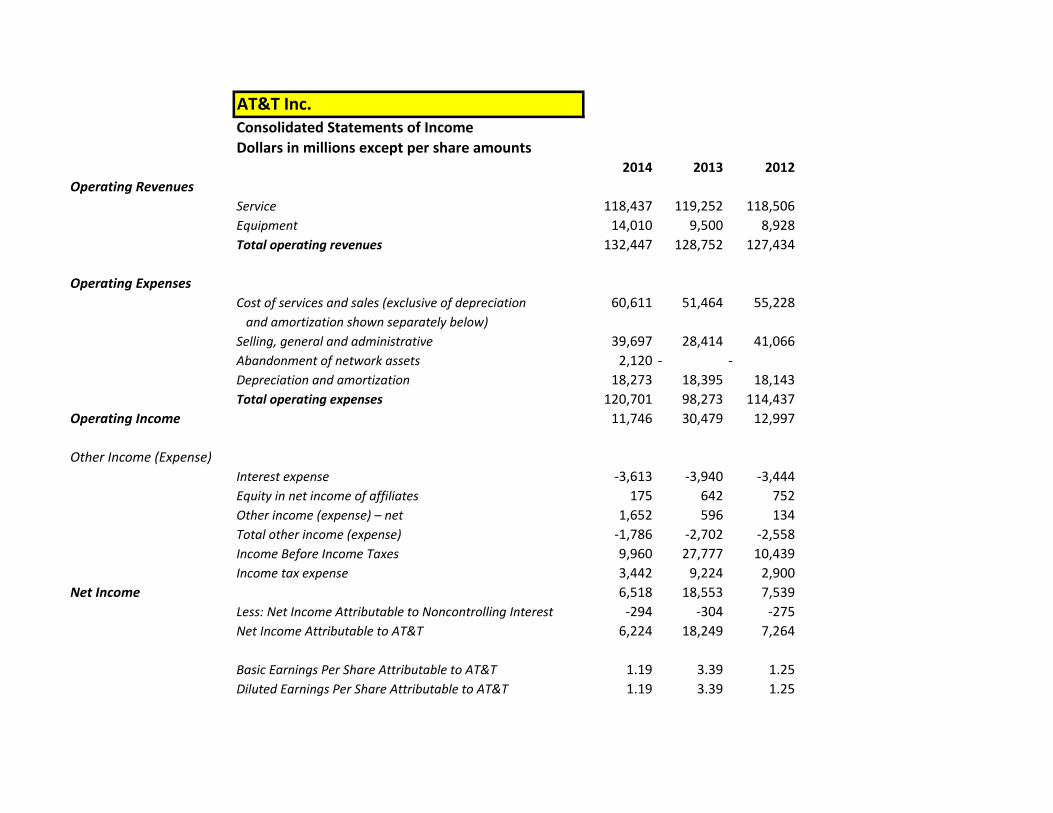
AT&T Inc.Consolidated Statements of Income
Dollars in millions except per share amounts2014 2013 2012
Operating Revenues
Service 118,437 119,252 118,506
Equipment 14,010 9,500 8,928
Total operating revenues 132,447 128,752 127,434
Operating Expenses
Cost of services and sales (exclusive of depreciation 60,611 51,464 55,228
and amortization shown separately below)
Selling, general and administrative 39,697 28,414 41,066
Abandonment of network assets 2,120 - -
Depreciation and amortization 18,273 18,395 18,143
Total operating expenses 120,701 98,273 114,437
Operating Income 11,746 30,479 12,997
Other Income (Expense)
Interest expense -3,613 -3,940 -3,444
Equity in net income of affiliates 175 642 752
Other income (expense) – net 1,652 596 134
Total other income (expense) -1,786 -2,702 -2,558
Income Before Income Taxes 9,960 27,777 10,439
Income tax expense 3,442 9,224 2,900
Net Income 6,518 18,553 7,539
Less: Net Income Attributable to Noncontrolling Interest -294 -304 -275
Net Income Attributable to AT&T 6,224 18,249 7,264
Basic Earnings Per Share Attributable to AT&T 1.19 3.39 1.25
Diluted Earnings Per Share Attributable to AT&T 1.19 3.39 1.25
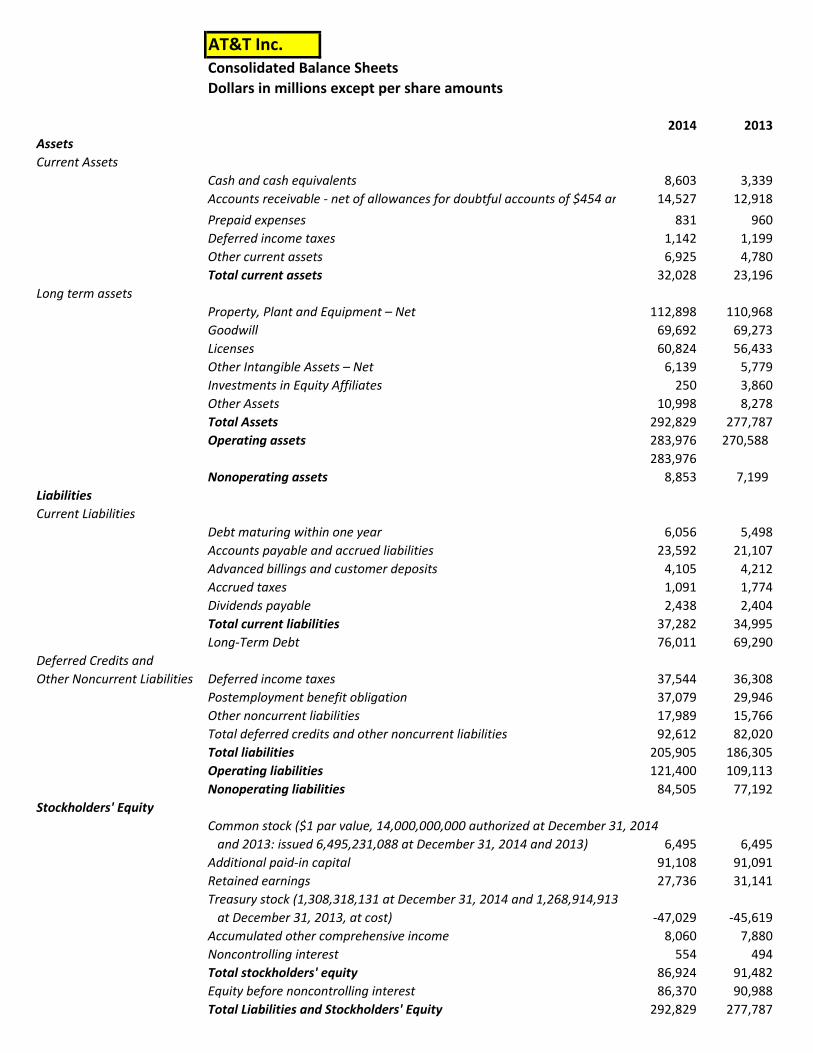
AT&T Inc.Consolidated Balance Sheets
Dollars in millions except per share amounts
2014 2013
Assets
Current Assets
Cash and cash equivalents 8,603 3,339
Accounts receivable - net of allowances for doubtful accounts of $454 and $48314,527 12,918
Prepaid expenses 831 960
Deferred income taxes 1,142 1,199
Other current assets 6,925 4,780
Total current assets 32,028 23,196
Long term assets
Property, Plant and Equipment – Net 112,898 110,968
Goodwill 69,692 69,273
Licenses 60,824 56,433
Other Intangible Assets – Net 6,139 5,779
Investments in Equity Affiliates 250 3,860
Other Assets 10,998 8,278
Total Assets 292,829 277,787
Operating assets 283,976 270,588
283,976
Nonoperating assets 8,853 7,199
Liabilities
Current Liabilities
Debt maturing within one year 6,056 5,498
Accounts payable and accrued liabilities 23,592 21,107
Advanced billings and customer deposits 4,105 4,212
Accrued taxes 1,091 1,774
Dividends payable 2,438 2,404
Total current liabilities 37,282 34,995
Long-Term Debt 76,011 69,290
Deferred Credits and
Other Noncurrent Liabilities Deferred income taxes 37,544 36,308
Postemployment benefit obligation 37,079 29,946
Other noncurrent liabilities 17,989 15,766
Total deferred credits and other noncurrent liabilities 92,612 82,020
Total liabilities 205,905 186,305
Operating liabilities 121,400 109,113
Nonoperating liabilities 84,505 77,192
Stockholders' Equity
Common stock ($1 par value, 14,000,000,000 authorized at December 31, 2014
and 2013: issued 6,495,231,088 at December 31, 2014 and 2013) 6,495 6,495
Additional paid-in capital 91,108 91,091
Retained earnings 27,736 31,141
Treasury stock (1,308,318,131 at December 31, 2014 and 1,268,914,913
at December 31, 2013, at cost) -47,029 -45,619
Accumulated other comprehensive income 8,060 7,880
Noncontrolling interest 554 494
Total stockholders' equity 86,924 91,482
Equity before noncontrolling interest 86,370 90,988
Total Liabilities and Stockholders' Equity 292,829 277,787