Embed Size (px)
Citation preview
Nebraska Department of Education Rule 24 ReportSOCIAL SCIENCE
(Content Area)Educator Preparation Content Program Review
Name of institution University of Nebraska-Lincoln
Date Submitted 3.20.2017
Contact Person Thomas Wandzilak
Phone/Fax 402-472-8626
Email [email protected]
Folio type: X Regular Mini Advanced Program

Program(s) Covered by this Folio Press tab in last column to add rows
Endorsement(s) Type Grade Level Program Level
List EndorsementsField 7-12 Baccalaureate
Social Science, Grades 7-12
Is the endorsement offered at more than one site? Yes X NoIf yes, list additional sites where endorsement is offered:
Institution Accreditation Status: X National X StateIs this a Nationally Accredited Program? X Yes No
If Yes, list Accrediting Organization: CAEP Attach National Letter to Cover Sheet
Report to the Nebraska Department of Education
University of Nebraska—Lincoln Folio Initial Level—June 2017
INTRODUCTION AND WELCOMEThe purpose of this section is to provide general background information on the University of Nebraska-Lincoln and the College of Education and Human Sciences. In addition, information is provided on the teacher education program, admission and retention standards the field experiences in which student participate, and information on the key assessments used in Section 2 concerning data that have been collected in support of our programs.
Here is a list of websites that can provide some additional information on the university, the college and our teacher education program:
http://www.unl.edu/This is the University of Nebraska-Lincoln website.
https://bulletin.unl.edu/undergraduate/This is the link for the undergraduate bulletin.
https://bulletin.unl.edu/undergraduate/college/Education+%26+Human+SciencesThis is the link for the College of Education and Human Sciences section in the Undergraduate Bulletin.
http://www.unl.edu/gradstudies/bulletinThis is the link for the Graduate Bulletin.
http://cehs.unl.edu/The is the link for the website for the College of Education and Human Sciences
http://cehs.unl.edu/ssc/undergraduate-advising/
This is the link for our program sheets for all of the programs offered through the College of Education and Human Sciences. Program sheets will also be available for multiple years.
If you have any questions, feel free to contact Tom Wandzilak, Certification Officer, College of Education and Human Sciences at:
402-472-8626 or [email protected]
SECTION 1: CONTEXTUAL INFORMATION NARRATIVE
SECTION 1A: ENDORSEMENT PROGRAM/CONTEXTUAL INFORMATION
The link to the Rule 20 Folio is:http://cehs.unl.edu/cehs/nde/Rule20.pdf
Mission Statement ion StatementThe University of Nebraska-Lincoln (UNL), chartered by the Legislature in 1869, is that part of the University of Nebraska system which serves as both the land-grant and the comprehensive public University for the State of Nebraska.
Through its three primary missions of teaching, research, and service, UNL is the state's primary intellectual center providing leadership throughout the state through quality education and the generation of new knowledge. UNL's graduates and its faculty and staff are major contributors to the economic and cultural development of the state. UNL attracts a high percentage of the most
academically talented Nebraskans, and the graduates of the University form a significant portion of the business, cultural, and professional resources of the State. The quality of primary, secondary, and other post-secondary educational programs in the state depends in part on the resources of UNL for curricular development, teacher training, professional advancement, and enrichment activities involving the University's faculty, museums, galleries, libraries, and other facilities. UNL provides for the people of the state unique opportunities to fulfill their highest ambitions and aspirations, thereby helping the state retain its most talented youth, attract talented young people from elsewhere, and address the educational needs of the nontraditional learner.
The University of Nebraska-Lincoln has been recognized by the Legislature as the primary research and doctoral degree granting institution in the state for fields outside the health professions. Through its service and outreach efforts the University extends its educational responsibilities directly to the people of Nebraska on a state-wide basis.
The College of Education and Human SciencesThe College of Education and Human Sciences (CEHS) was founded on August 18, 2004 by Teachers College and The College of Human Resources and Family Sciences with each founding college contributing extensive history and tradition. The College of Education and Human Sciences offers excellent educational advancement to both undergraduate and graduate students, serving approximately 2,800 undergraduates and 1,000 graduate students each year.
Education courses first became a part of the University curriculum in 1895 with the organization of a Department of Education designed to prepare students for teaching careers. On Valentine’s Day, 1908, the board of Regents established a Teachers College. Since that time, the College has been highly respected for its programs preparing teachers, administrators, and specialists for the education of children, youth, and adults. The quality of these programs is reflected in outstanding educational leadership in communities across the state and in the nation in teaching, administration, communication disorders, special education, and educational psychology.
Teacher Education ProgramsTeacher education programs are found in five departments in CEHS as well as in two other colleges on campus. The College of Fine and Performing Arts (CFPA) oversees Music Education whereas Agriculture Education, Horticulture Education, and Industrial Technology are located in the College of Agricultural Sciences and Natural Resources. Even though these programs are housed outside of CEHS, they must comply with state rules and regulations tied to teacher education. The majority of the teacher education programs are located in the Department of Teaching, Learning and Teacher Education (TLTE). There are currently 40 endorsement areas offered at the undergraduate and graduate levels through the University. Options exist for students to complete initial teacher certification and teaching endorsements at the undergraduate and graduate levels. All programs leading to an initial teaching certificate will also require the completion of an undergraduate or graduate degree. Individuals interested in adding one or more teaching endorsements may do so without pursuing a degree.
1B. STANDARDS OF ADMISSION, RETENTION, TRANSITION, AND COMPLETION
Admission to the University of Nebraska-LincolnAdmission to the University is based on a student’s demonstrated academic preparation for University-level work (see Appendix -- Table 1). Admission standards to the University are established by the University of Nebraska Board of Regents and apply to all new, first time degree-seeking students. This includes freshman as well as transfer students. The admission standards apply to general admission to the University as well as admission to the College of Education and Human Sciences.
Admission to the Teacher Education Program (TEP)Admission to the College of Education and Human Sciences does not guarantee admission to a teacher education program. Admission to the advanced phases of teacher education is selective and, in some endorsements, highly competitive. Selection to a TEP is based upon the following criteria:
1. Completion of at least 30 credit hours (Elementary Education) or 42 credit hours (Secondary Education) with a minimum 2.5 GPA.
2. Completion of TEAC 331 or 430 or 431 or 434 or 437 or 496 (3 hrs.) or approved course, and EDPS 250 or 251 with a 2.5 cumulative average in the two classes, no grade lower than a C.
3. Documentation of proficiency in reading, writing, and mathematics through successful completion of a basic skills examination that meets the Nebraska Department of Education competency requirement.
4. Completion of one course in communication studies selected from COMM 109, 205, 209, 210, or 341, or an approved substitute.
5. Faculty recommendations.6. Demonstration of attaining particular learning outcomes in the program.7. Completion of a personal and professional fitness self-disclosure form.
Admission to Student TeachingAll students who are candidates for an appropriately endorsed Nebraska Teacher’s certificate are required to student teach. Students who plan to student teach in the fall semester must complete the student teaching application form and submit it by the preceding March 1 to the Director of Field Experiences in 104 Henzlik Hall; students planning to student teach in the spring semester must apply by the preceding October 1. The basic program for student teaching provides for a full-day experience on a semester basis. Students enrolled in an elementary education dual major will compete requirements for student teaching in both majors. Admission to student teaching requires the following:
1. Matriculation in a teacher education program in the College of Education and Human Sciences, the Graduate College, or dual matriculation in the College of Education and Human Sciences and another college.
2. Admission to a teacher education program.3. Senior standing (89 hours or more) with a minimum cumulative GPA of 2.75.4. Application for and completion of a senior check.5. Minimum average of 2.5 in each endorsement area (in the case of Middle Grades Endorsement, a
2.5 in each academic area) with no grade below C.
6. A minimum grade point average of 2.5 in pre-professional and professional education courses with no grade below a C in pre-professional education courses and no grade below a C+ in professional education courses.
7. Completion of a criminal history check that will be conducted by an independent party (lab fee required).
Retention1. Must maintain a minimum cumulative GPA of 2.75.2. Must maintain a minimum average of 2.5 in each endorsement area (in the case of Middle Grades
Endorsement, a 2.5 in each academic area) with no grade below C.3. Must maintain a minimum grade point average of 2.5 in pre-professional and professional
education courses with no grade below a C in pre-professional education courses and no grade below a C+ in professional education courses.
4. Must meet student teaching application deadlines.5. Must meet criminal history requirements at all times.
Transition PointsA summary of the transition points can be found in the Appendix in Table 2.
Requirements to Complete the Teacher Education Program1. Successful completion of student teaching.2. Successful completion of all remaining courses as identified in the senior check with grades
meeting the minimum requirements as identified in the “Admission to Student Teaching” section as described above.
3. Satisfy any additional requirements as described under teacher education in the undergraduate bulletin.
4. Address all financial obligations tied to the University of Nebraska-Lincoln.5. Apply for the degree.
The Student Advising Sheet for the program(s) associated with this Folio can be found at: http://cehs.unl.edu/ssc/undergraduate-advising
1C. FIELD EXPERIENCES
The link to the Rule 20 Folio is:http://cehs.unl.edu/cehs/nde/Rule20.pdf
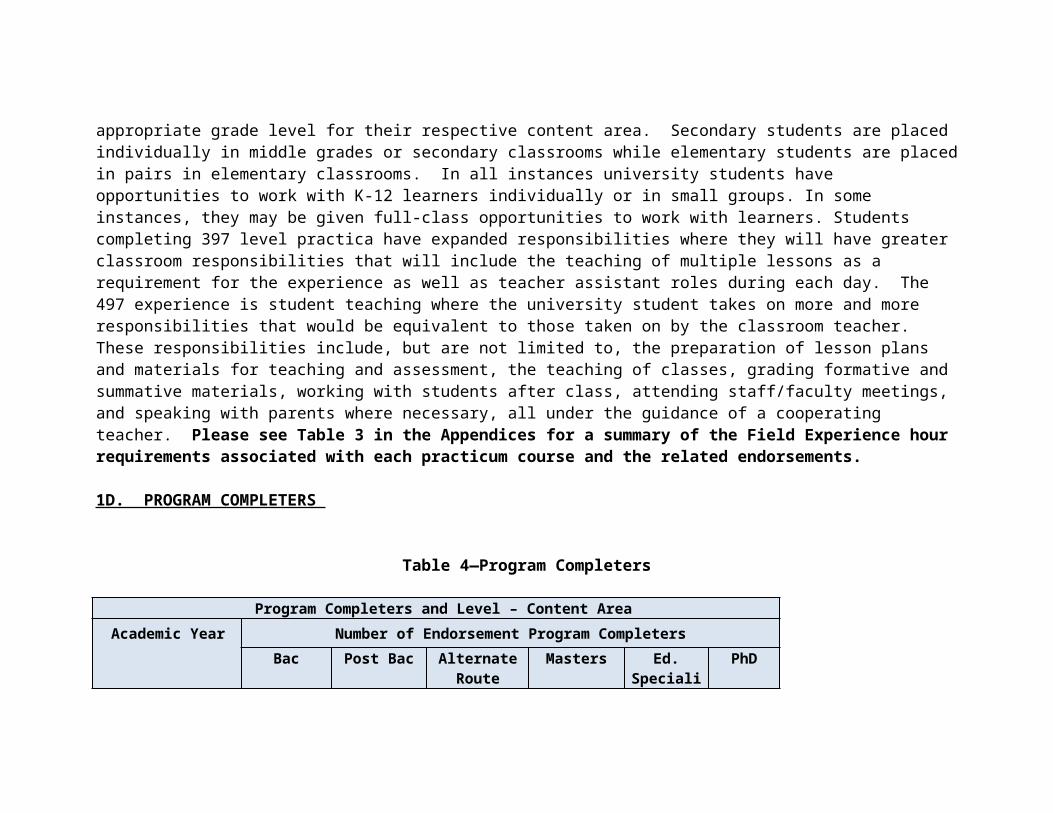
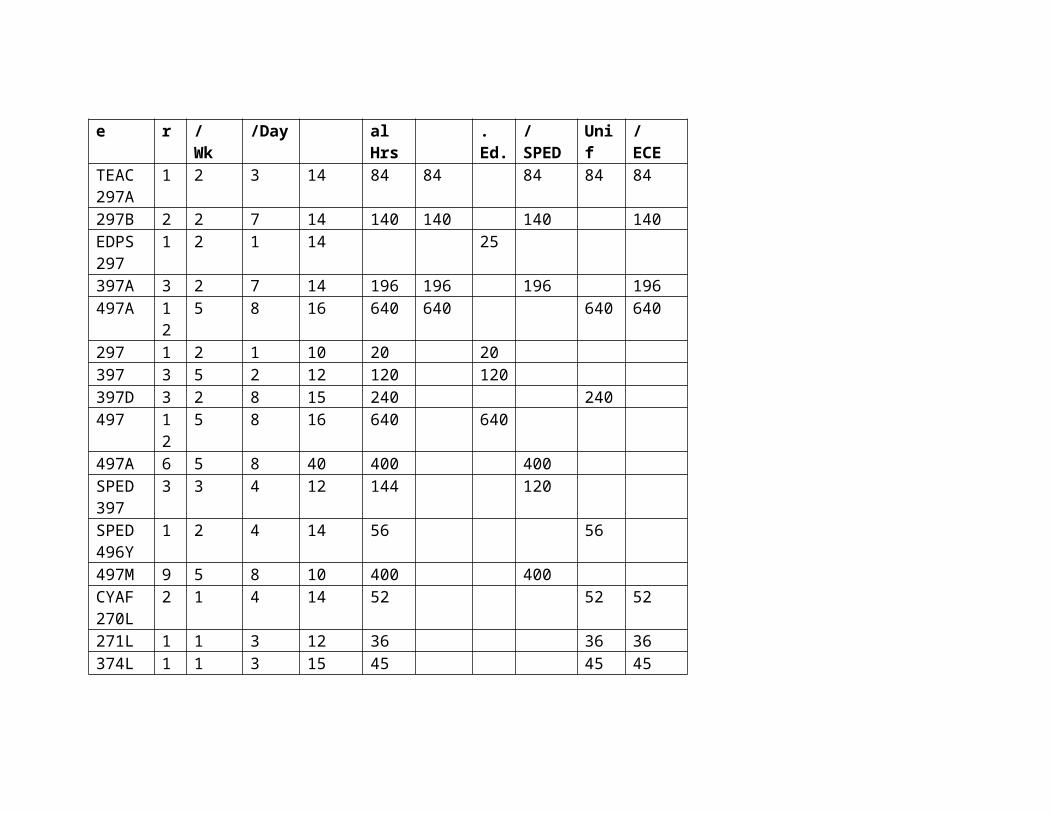
Field experience “courses” can be divided into the following areas: Early Childhood, Inclusive, Elementary Education, Elementary Education/Mild Moderate Disabilities, and Secondary Education. Practicum experiences at the 200 level are initial experiences in the schools for our students. They can be placed in a classroom with a teacher at the appropriate grade level for their respective content area. Secondary students are placed individually in middle grades or secondary classrooms while elementary students are placed in pairs in elementary classrooms. In all instances university students have opportunities to work with K-12 learners individually or in small groups. In some instances, they may be given full-class opportunities to work with learners. Students completing 397 level practica have expanded responsibilities where they will have greater classroom responsibilities that will include the teaching of multiple lessons as a requirement for the experience as well as teacher assistant roles during each day. The 497 experience is student teaching where the university student takes on more and more responsibilities that would be equivalent to those taken on by the classroom teacher. These responsibilities include, but are not limited to, the preparation of lesson plans and materials for teaching and assessment, the teaching of classes, grading formative and summative materials, working with students after class, attending staff/faculty meetings, and speaking with parents where necessary, all under the guidance of a cooperating teacher. Please see Table 3 in the Appendices for a summary of the Field Experience hour requirements associated with each practicum course and the related endorsements.
1D. PROGRAM COMPLETERS
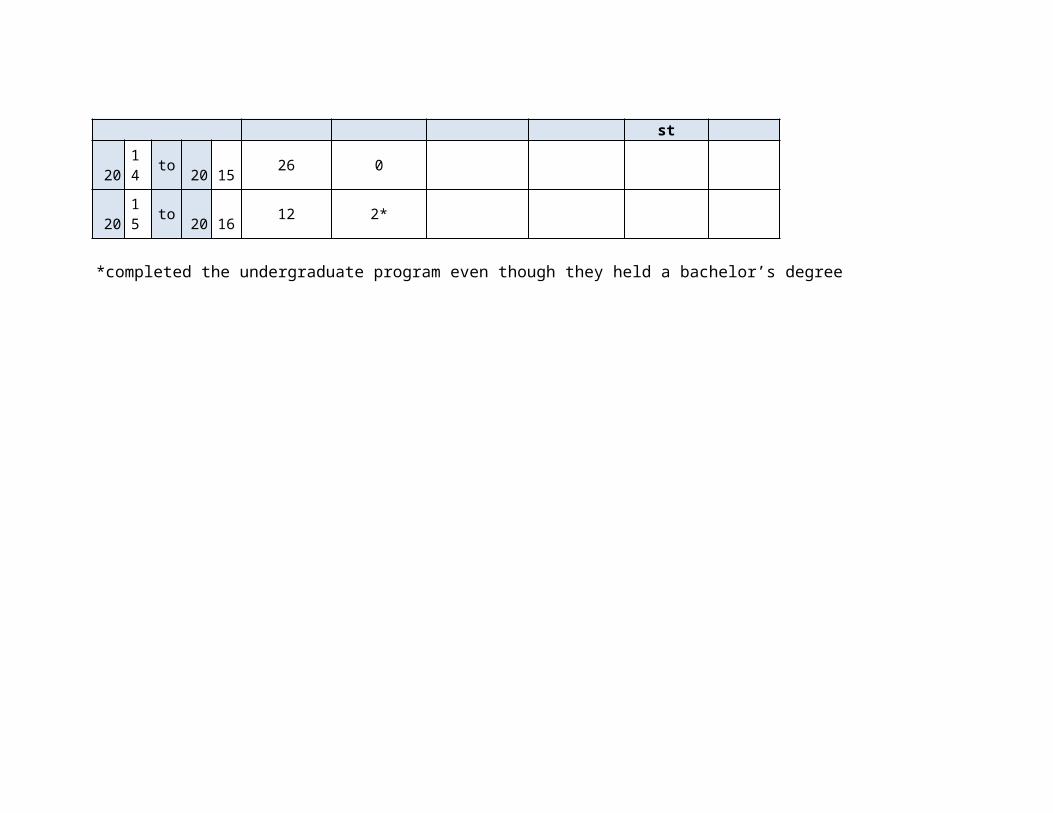
Table 4—Program Completers
Program Completers and Level – Content AreaAcademic Year Number of Endorsement Program Completers
Bac Post BacAlternate
Route Masters
Ed. Specialis
t PhD
2014 to 20 15 26 0
2015 to 20 16 12 2*
*completed the undergraduate program even though they held a bachelor’s degree
SECTION 2: ENDORSEMENT PROGRAM KEY ASSESSMENTS AND RELATED DATA
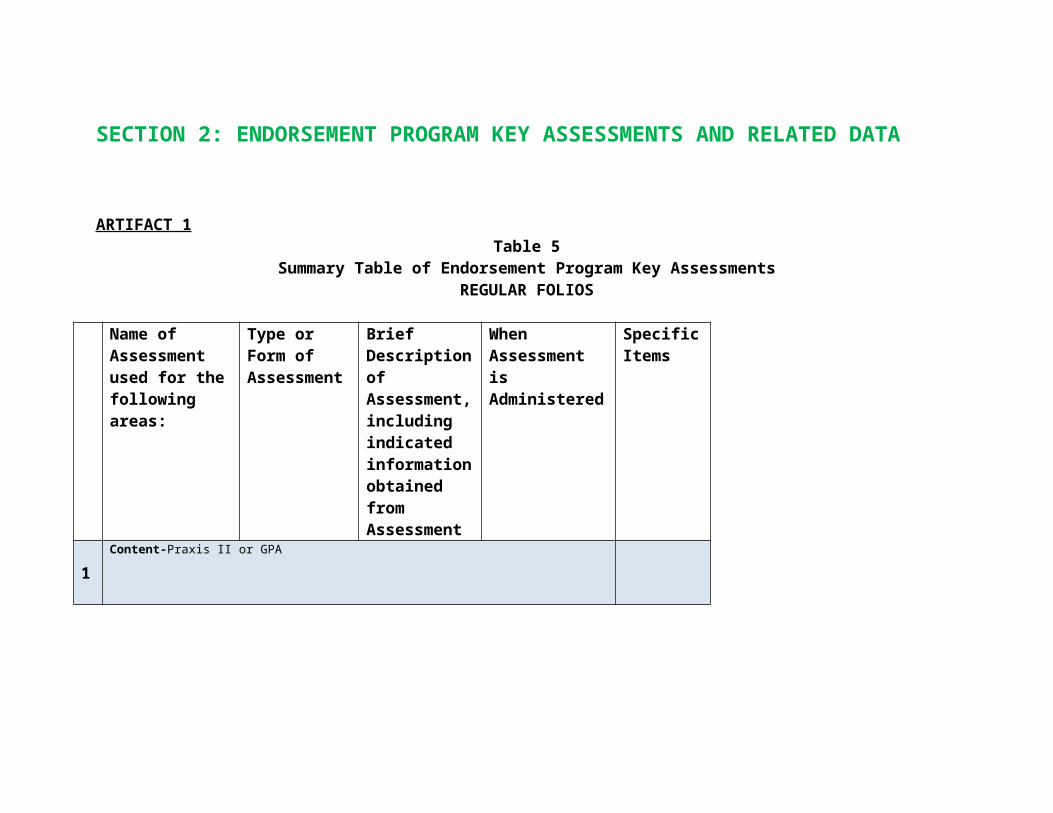
ARTIFACT 1Table 5
Summary Table of Endorsement Program Key AssessmentsREGULAR FOLIOS
Name of Assessmentused for the following areas:
Type or Form of Assessment
Brief Description of Assessment, including indicated information obtained from Assessment
When Assessment is Administered
Specific Items
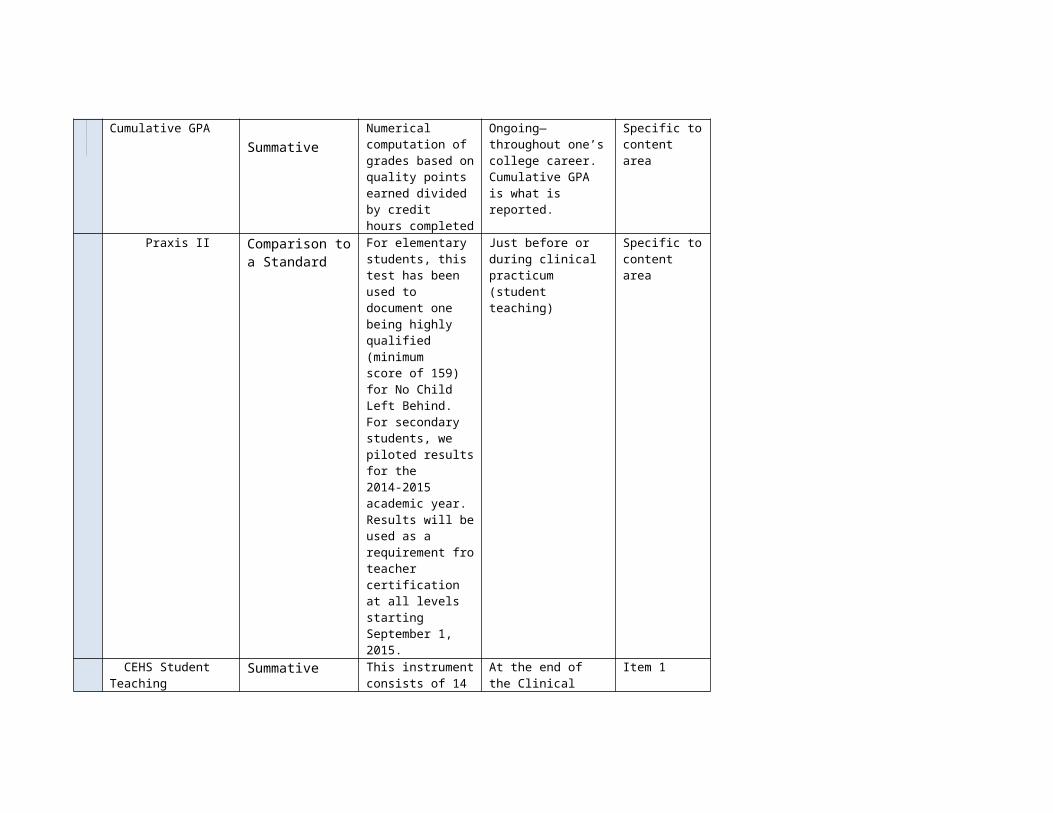
1Content-Praxis II or GPA
Cumulative GPASummative
Numerical computation of grades based onquality points earned divided by credithours completed
Ongoing—throughout one’s college career. Cumulative GPA is what is reported.
Specific to content area
Praxis II Comparison to a Standard
For elementary students, this test has been
Just before or during clinical practicum (student
Specific to content area
used todocument one being highly qualified (minimumscore of 159) for No Child Left Behind.For secondary students, we piloted results for the2014-2015 academic year. Results will be used as a requirement fro teacher certification at all levelsstarting September 1, 2015.
teaching)
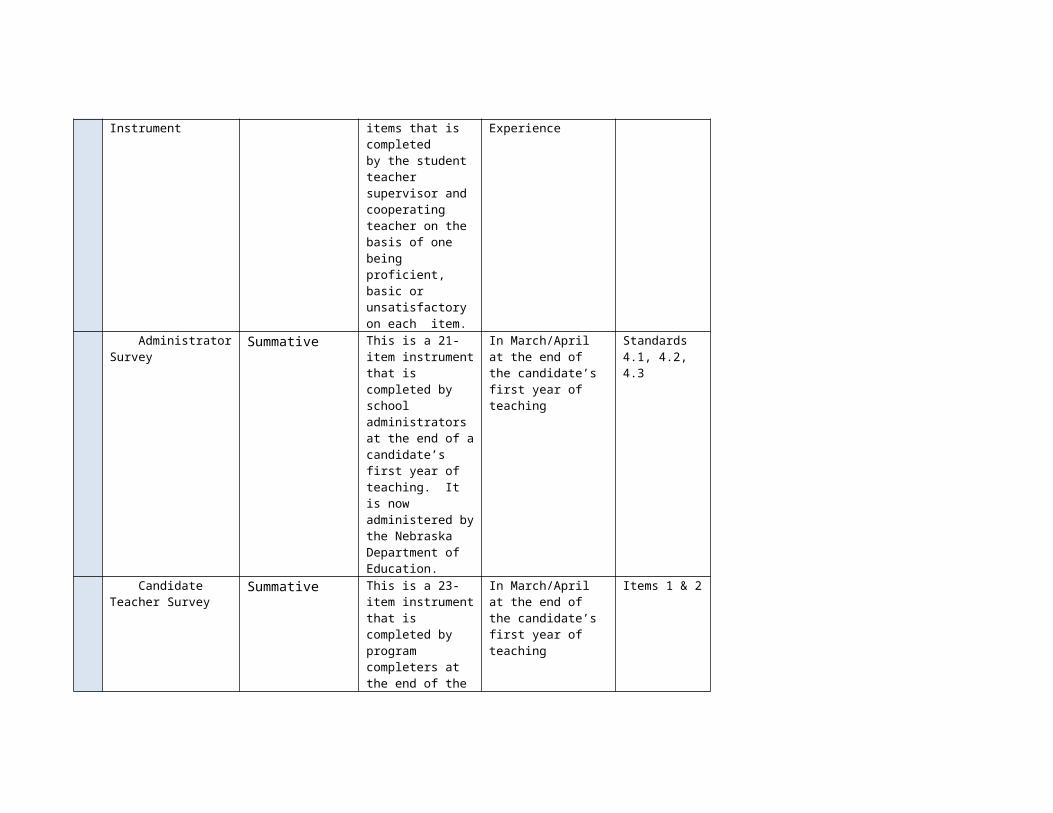
CEHS Student Teaching Instrument
Summative This instrument consists of 14 items that is completedby the student teacher supervisor and cooperatingteacher on the basis of one being proficient, basic orunsatisfactory on each item.
At the end of the Clinical Experience
Item 1
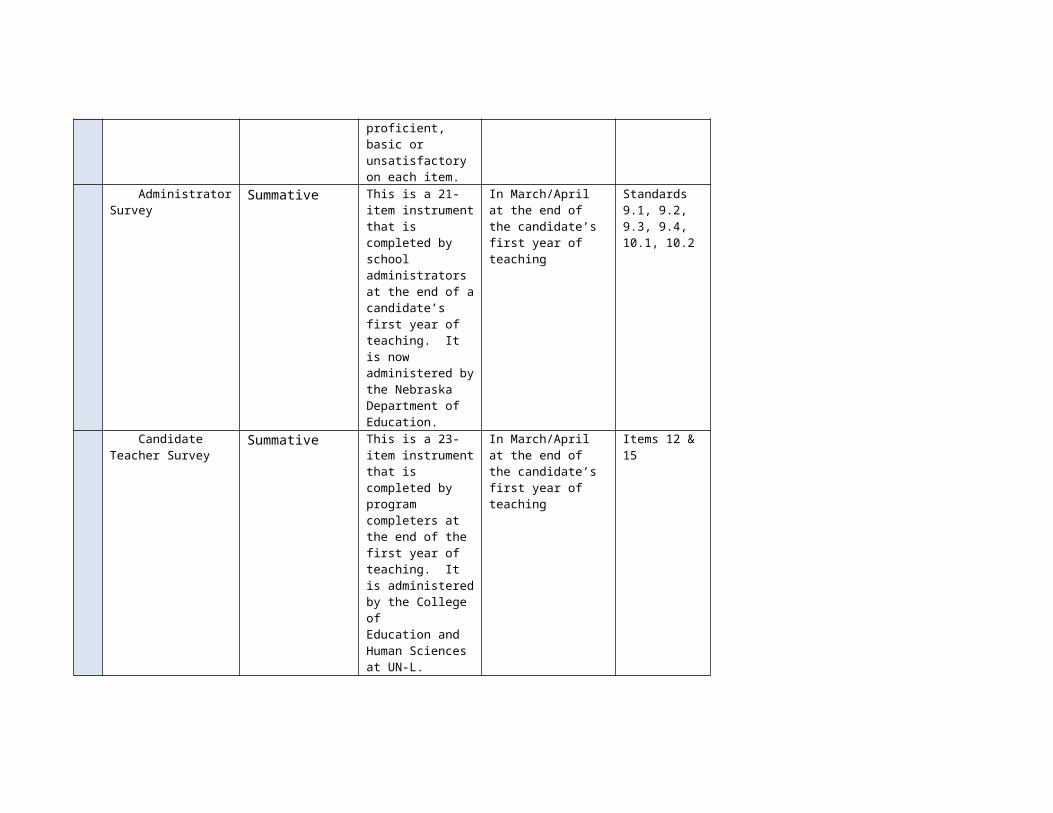
Administrator Survey
Summative This is a 21-item instrument that is completed by
In March/April at the end of the candidate’s first
Standards 4.1, 4.2, 4.3
school administrators at the end of a candidate’sfirst year of teaching. It is now administered bythe Nebraska Department of Education.
year of teaching
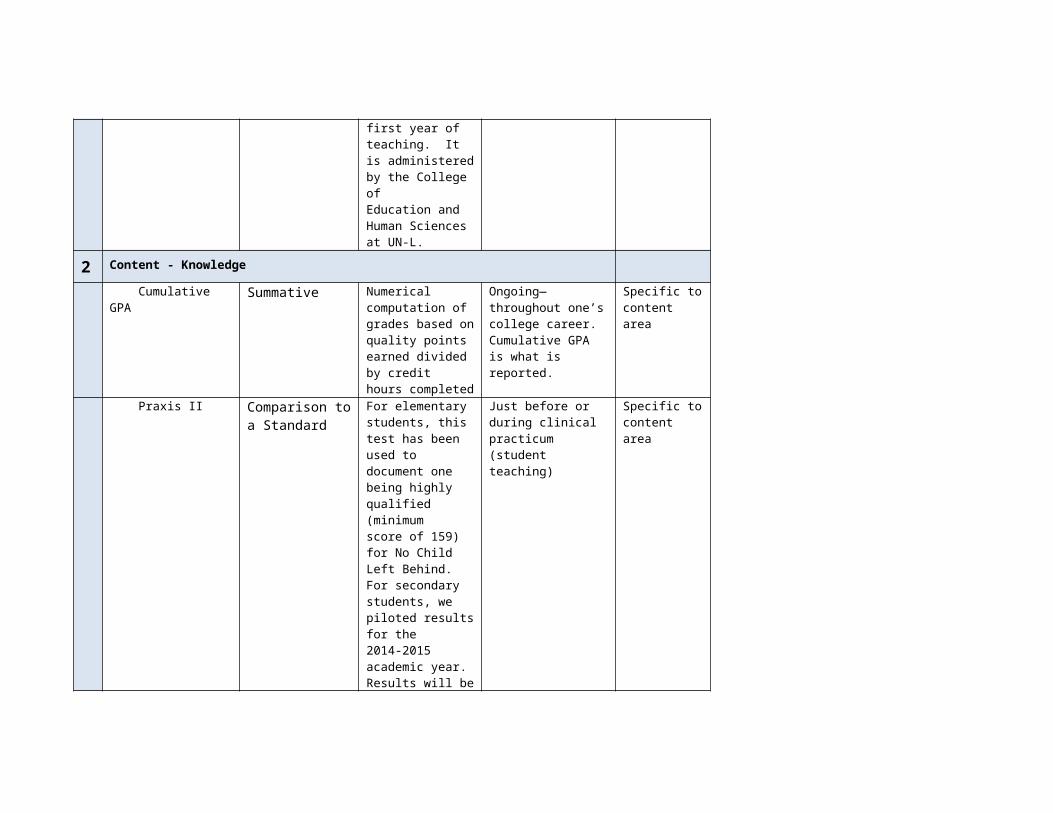
Candidate Teacher Survey
Summative This is a 23-item instrument that is completed byprogram completers at the end of the first year ofteaching. It is administered by the College ofEducation and Human Sciences at UN-L.
In March/April at the end of the candidate’s first year of teaching
Items 1 & 2
2 Content - Knowledge
Cumulative GPA Summative Numerical computation of grades based onquality points earned divided by credithours completed
Ongoing—throughout one’s college career. Cumulative GPA is what is reported.
Specific to content area
Praxis II Comparison to a Standard
For elementary students, this test has been used todocument one being highly qualified
Just before or during clinical practicum (student teaching)
Specific to content area
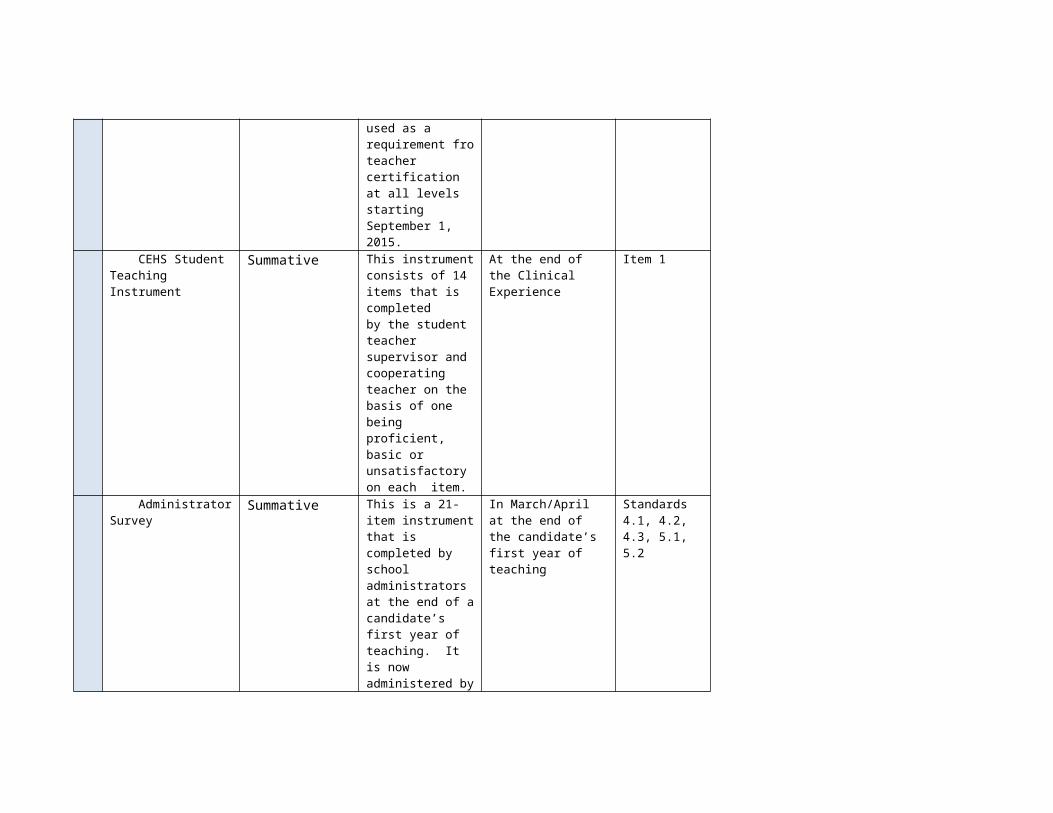
(minimumscore of 159) for No Child Left Behind.For secondary students, we piloted results for the2014-2015 academic year. Results will be used as a requirement fro teacher certification at all levelsstarting September 1, 2015.
CEHS Student Teaching Instrument
Summative This instrument consists of 14 items that is completedby the student teacher supervisor and cooperatingteacher on the basis of one being proficient, basic orunsatisfactory on each item.
At the end of the Clinical Experience
Item 1
Administrator Survey
Summative This is a 21-item instrument that is completed byschool administrators at the end of a candidate’s
In March/April at the end of the candidate’s first year of teaching
Standards 4.1, 4.2, 4.3, 5.1, 5.2
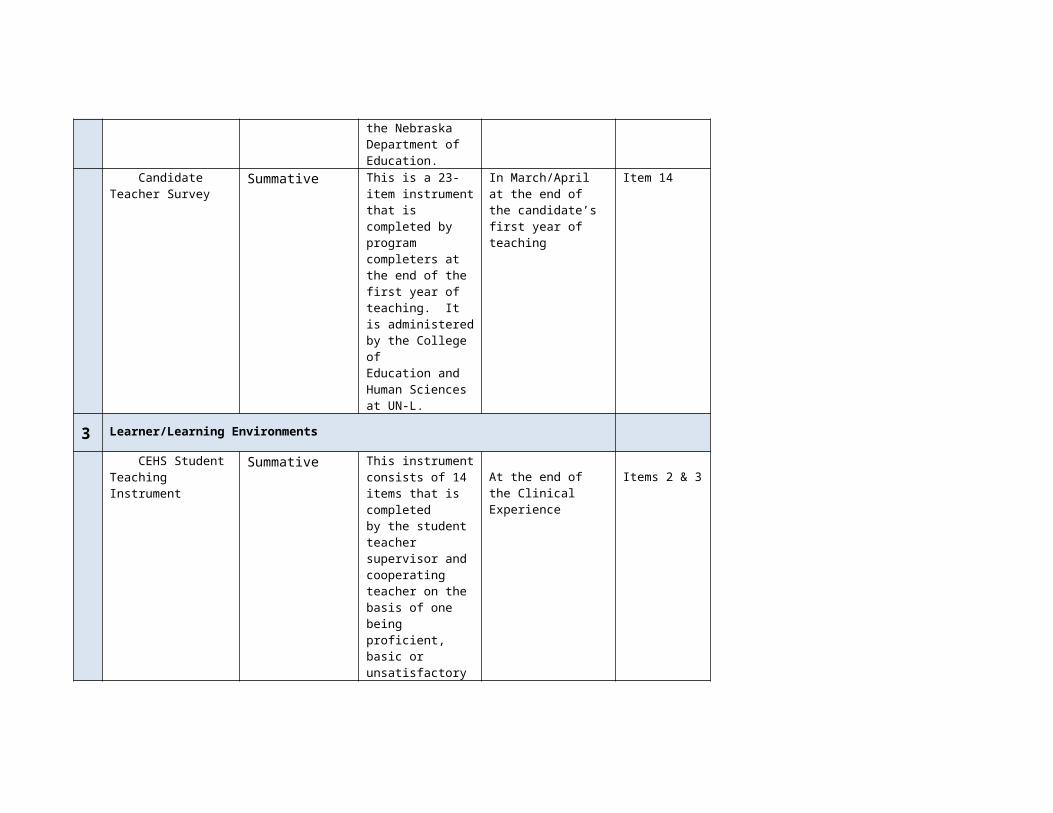
first year of teaching. It is now administered bythe Nebraska Department of Education.
Candidate Teacher Survey
Summative This is a 23-item instrument that is completed byprogram completers at the end of the first year ofteaching. It is administered by the College ofEducation and Human Sciences at UN-L.
In March/April at the end of the candidate’s first year of teaching
Item 14
3 Learner/Learning Environments
CEHS Student Teaching Instrument
Summative This instrument consists of 14 items that is completedby the student teacher supervisor and cooperatingteacher on the basis of one being proficient, basic orunsatisfactory on each item.
At the end of the Clinical Experience
Items 2 & 3
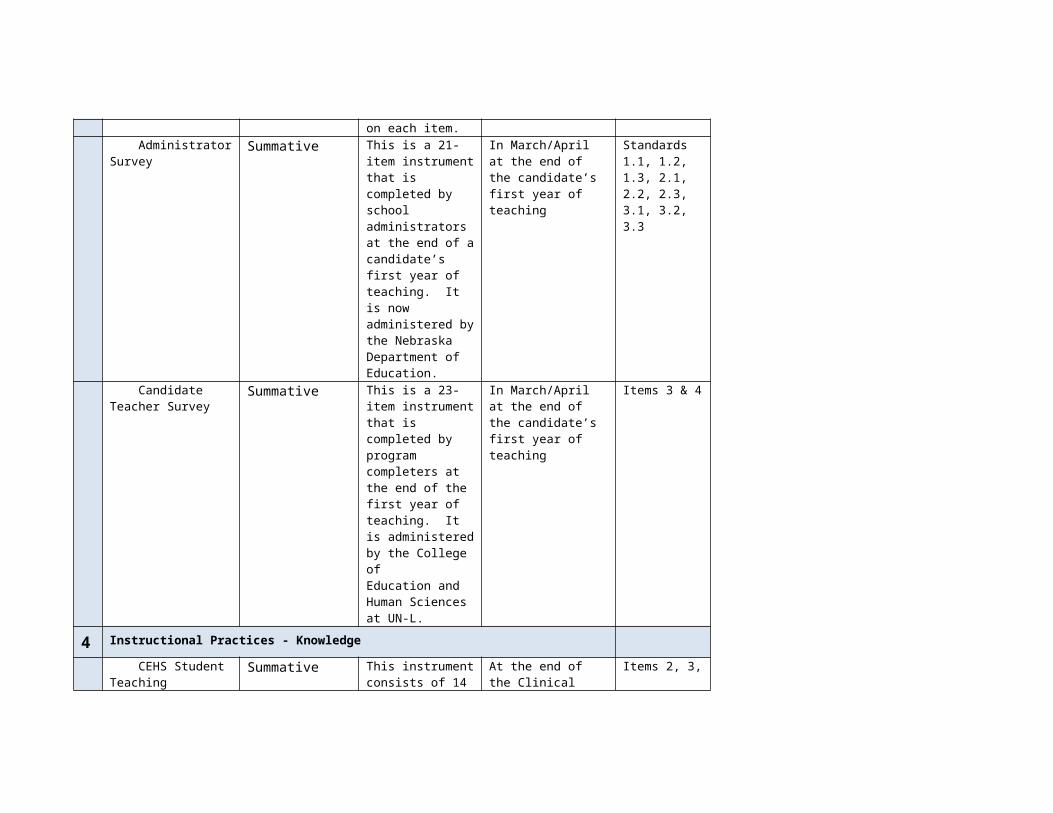
Administrator Survey
Summative This is a 21-item instrument that is completed byschool
In March/April at the end of the candidate’s first
Standards 1.1, 1.2, 1.3, 2.1, 2.2, 2.3,
administrators at the end of a candidate’sfirst year of teaching. It is now administered bythe Nebraska Department of Education.
year of teaching 3.1, 3.2, 3.3
Candidate Teacher Survey
Summative This is a 23-item instrument that is completed byprogram completers at the end of the first year ofteaching. It is administered by the College ofEducation and Human Sciences at UN-L.
In March/April at the end of the candidate’s first year of teaching
Items 3 & 4
4 Instructional Practices - Knowledge
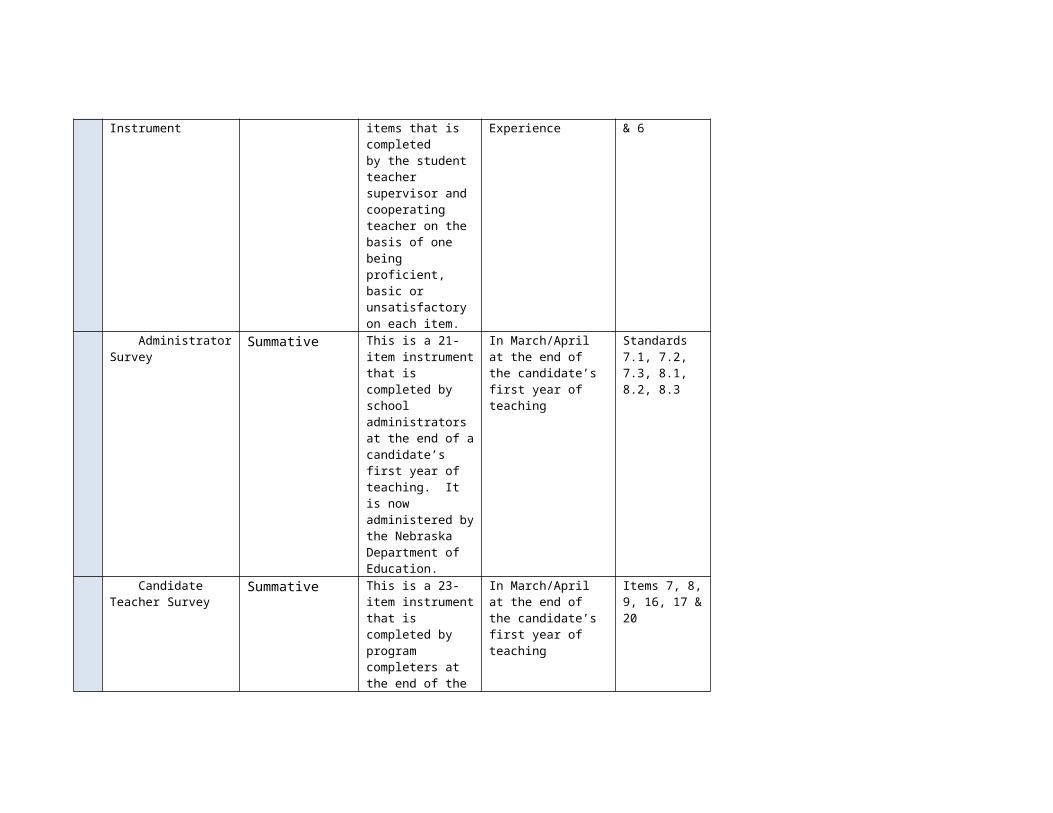
CEHS Student Teaching Instrument
Summative This instrument consists of 14 items that is completedby the student teacher supervisor and cooperatingteacher on the basis of one being proficient, basic orunsatisfactory on each item.
At the end of the Clinical Experience
Items 2, 3, & 6
Administrator Summative This is a 21-item In March/April at Standards
Survey instrument that is completed byschool administrators at the end of a candidate’sfirst year of teaching. It is now administered bythe Nebraska Department of Education.
the end of the candidate’s first year of teaching
7.1, 7.2, 7.3, 8.1, 8.2, 8.3
Candidate Teacher Survey
Summative This is a 23-item instrument that is completed byprogram completers at the end of the first year ofteaching. It is administered by the College ofEducation and Human Sciences at UN-L.
In March/April at the end of the candidate’s first year of teaching
Items 7, 8, 9, 16, 17 & 20
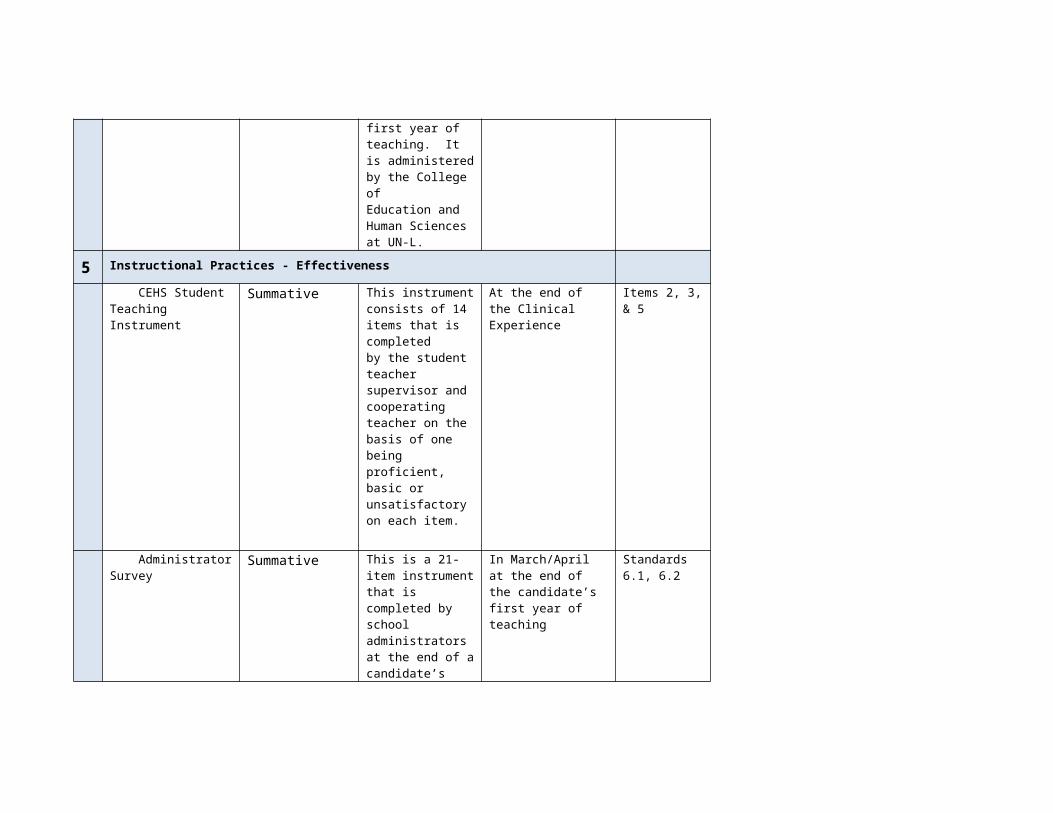
5 Instructional Practices - Effectiveness
CEHS Student Teaching Instrument
Summative This instrument consists of 14 items that is completedby the student teacher supervisor and cooperatingteacher on the basis of one being proficient, basic or
At the end of the Clinical Experience
Items 2, 3, & 5
unsatisfactory on each item.
Administrator Survey
Summative This is a 21-item instrument that is completed byschool administrators at the end of a candidate’sfirst year of teaching. It is now administered bythe Nebraska Department of Education.
In March/April at the end of the candidate’s first year of teaching
Standards 6.1, 6.2
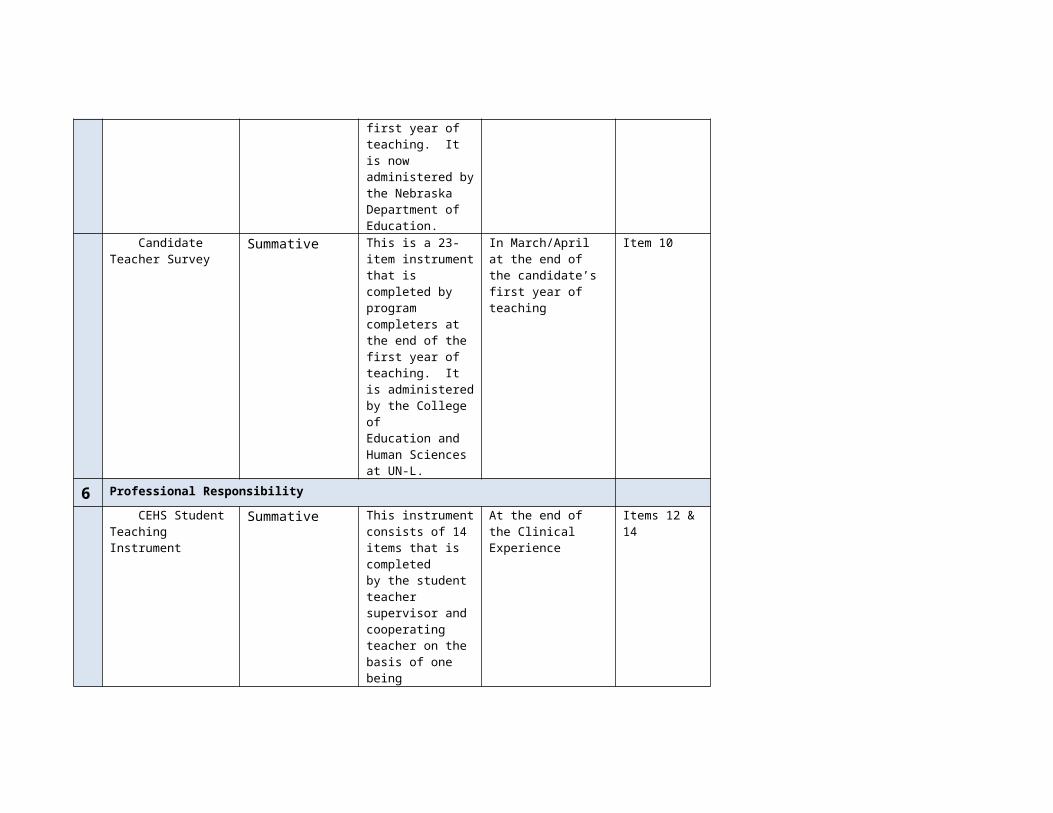
Candidate Teacher Survey
Summative This is a 23-item instrument that is completed byprogram completers at the end of the first year ofteaching. It is administered by the College ofEducation and Human Sciences at UN-L.
In March/April at the end of the candidate’s first year of teaching
Item 10
6 Professional Responsibility
CEHS Student Teaching Instrument
Summative This instrument consists of 14 items that is completedby the student teacher supervisor and cooperating
At the end of the Clinical Experience
Items 12 & 14
teacher on the basis of one being proficient, basic orunsatisfactory on each item.
Administrator Survey
Summative This is a 21-item instrument that is completed byschool administrators at the end of a candidate’sfirst year of teaching. It is now administered bythe Nebraska Department of Education.
In March/April at the end of the candidate’s first year of teaching
Standards 9.1, 9.2, 9.3, 9.4, 10.1, 10.2
Candidate Teacher Survey
Summative This is a 23-item instrument that is completed byprogram completers at the end of the first year ofteaching. It is administered by the College ofEducation and Human Sciences at UN-L.
In March/April at the end of the candidate’s first year of teaching
Items 12 & 15
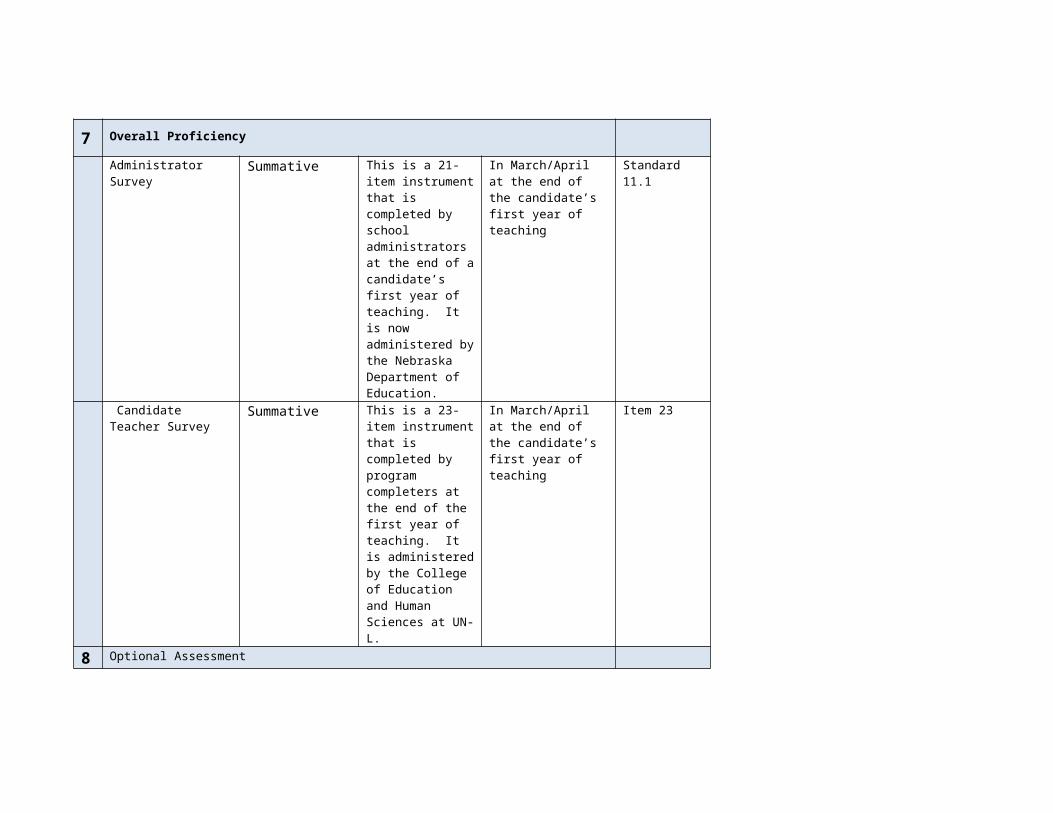
7 Overall Proficiency
Administrator Survey
Summative This is a 21-item instrument that is completed byschool administrators at
In March/April at the end of the candidate’s first year of teaching
Standard 11.1
the end of a candidate’sfirst year of teaching. It is now administered bythe Nebraska Department of Education.
Candidate Teacher Survey
Summative This is a 23-item instrument that is completed by program completers at the end of the first year of teaching. It is administered by the College of Education and Human Sciences at UN-L.
In March/April at the end of the candidate’s first year of teaching
Item 23
8 Optional Assessment
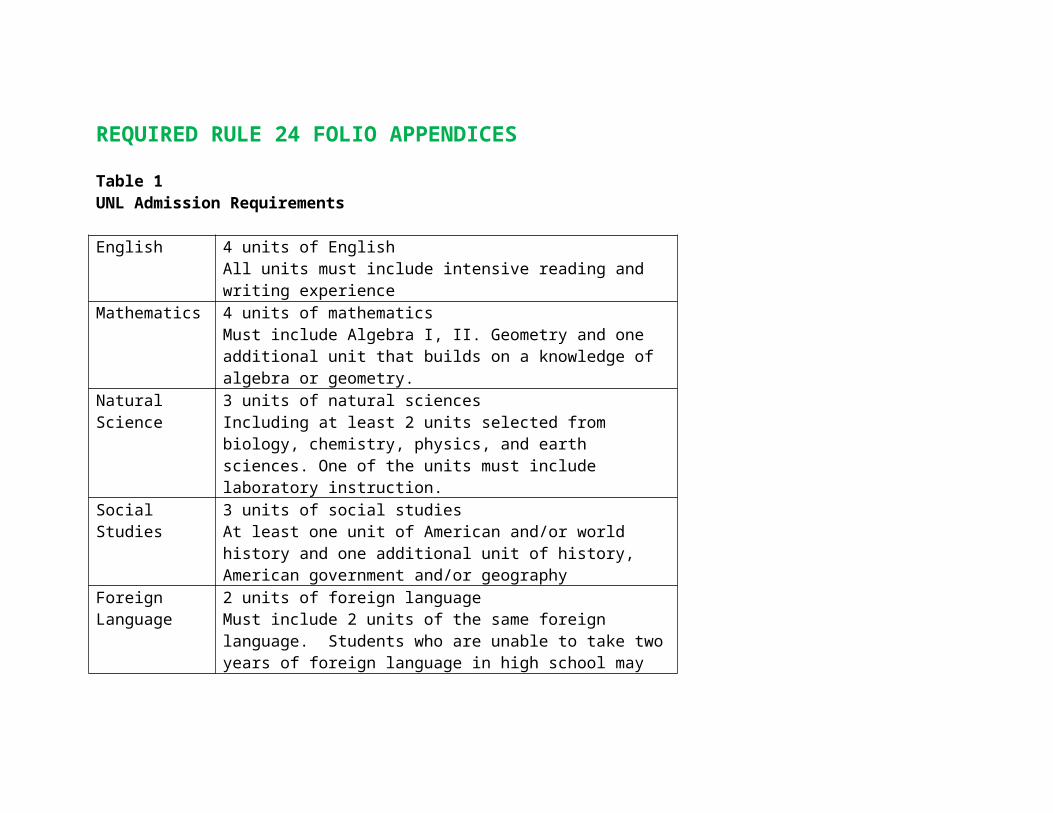
REQUIRED RULE 24 FOLIO APPENDICES
Table 1UNL Admission Requirements
English 4 units of EnglishAll units must include intensive reading and writing experience
Mathematics 4 units of mathematicsMust include Algebra I, II. Geometry and one additional unit that builds on a knowledge of algebra or geometry.
Natural Science
3 units of natural sciencesIncluding at least 2 units selected from biology, chemistry, physics, and earth sciences. One of the units must include laboratory instruction.
Social Studies
3 units of social studiesAt least one unit of American and/or world history and one additional unit of history, American government and/or geography
Foreign Language
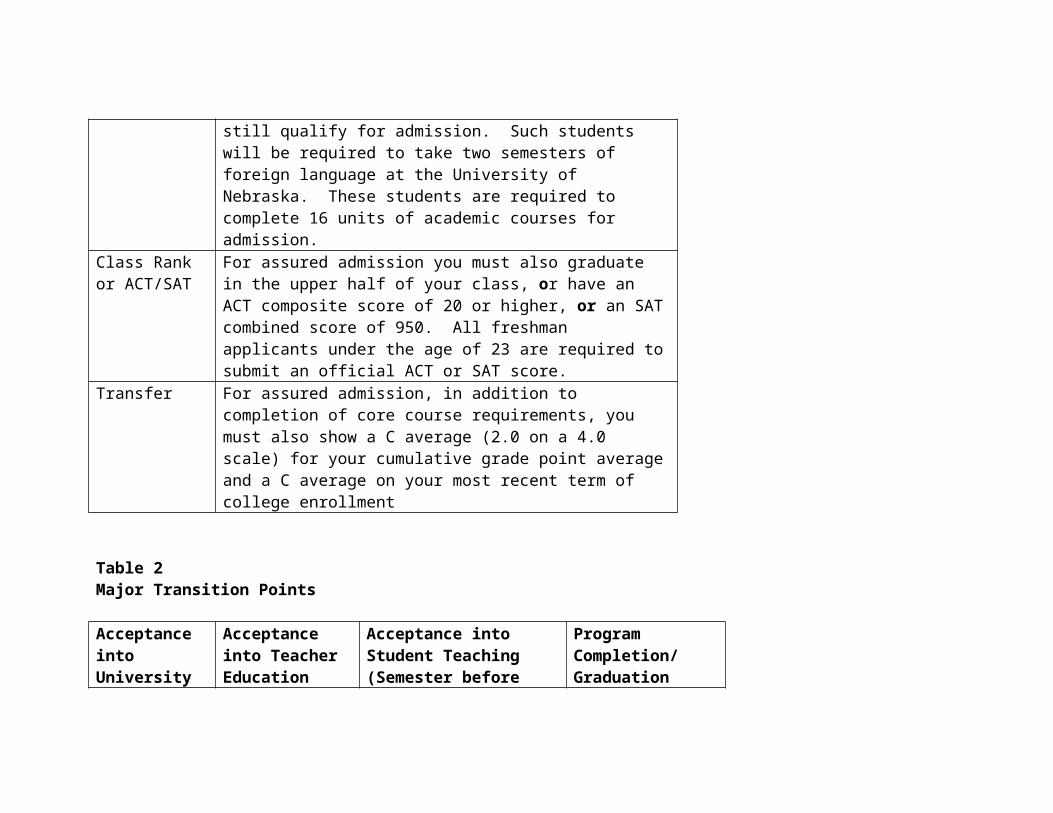
2 units of foreign languageMust include 2 units of the same foreign language. Students who are unable to take two years of foreign language in high school may still qualify for admission. Such students will be required to take two semesters of foreign language at the University of Nebraska. These students are required to complete 16 units of academic courses for admission.
Class Rank or ACT/SAT
For assured admission you must also graduate in the upper half of your class, or have an ACT composite
score of 20 or higher, or an SAT combined score of 950. All freshman applicants under the age of 23 are required to submit an official ACT or SAT score.
Transfer For assured admission, in addition to completion of core course requirements, you must also show a C average (2.0 on a 4.0 scale) for your cumulative grade point average and a C average on your most recent term of college enrollment
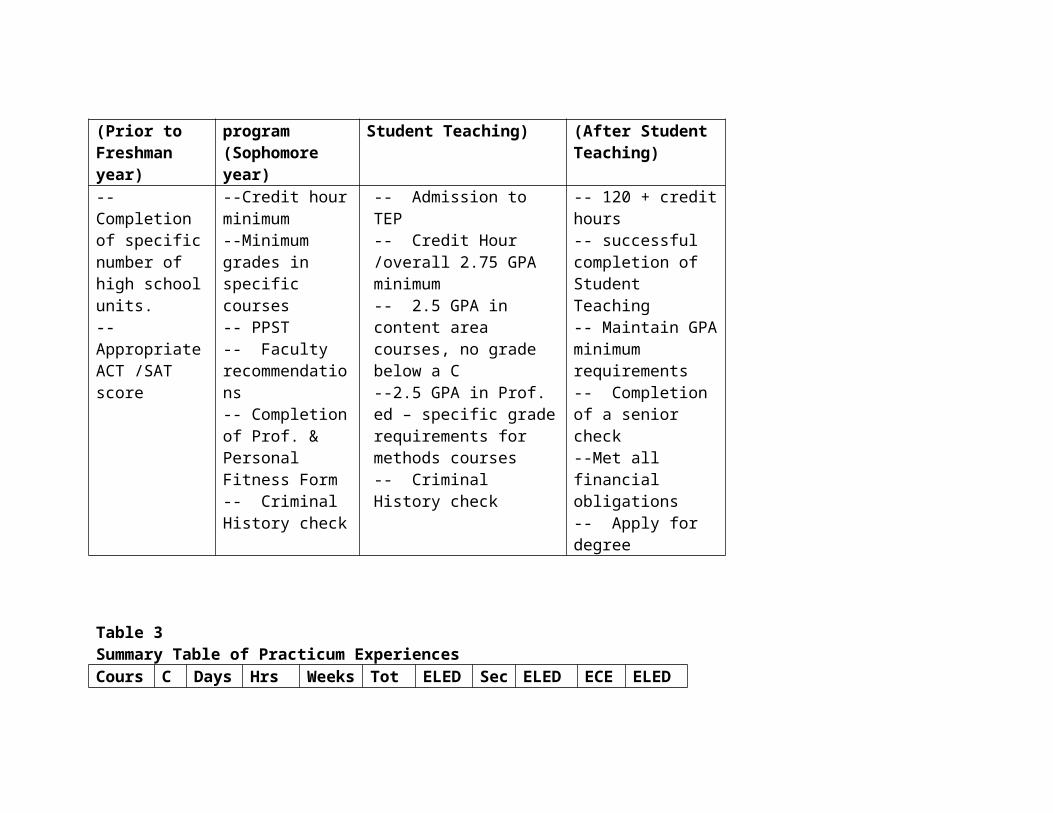
Table 2Major Transition Points
Acceptance into University(Prior to Freshman year)
Acceptance into Teacher Education program(Sophomore year)
Acceptance into Student Teaching(Semester before Student Teaching)
Program Completion/Graduation(After Student Teaching)
-- Completion of specific number of high school units.-- Appropriate ACT /SAT score
--Credit hour minimum--Minimum grades in specific courses-- PPST-- Faculty recommendations-- Completion of Prof. &
-- Admission to TEP-- Credit Hour /overall 2.75 GPA minimum-- 2.5 GPA in content areacourses, no grade below a C--2.5 GPA in Prof. ed – specific grade requirements for methods courses
-- 120 + credit hours-- successful completion of Student Teaching-- Maintain GPA minimum requirements-- Completion of a senior check--Met all financial
Personal Fitness Form-- Criminal History check
-- Criminal History check
obligations-- Apply for degree
Table 3Summary Table of Practicum ExperiencesCourse
Cr
Days/Wk
Hrs/Day
Weeks
Total Hrs
ELED
Sec. Ed.
ELED/SPED
ECE Unif
ELED/ECE
TEAC 297A
1 2 3 14 84 84 84 84 84
297B 2 2 7 14 140 140 140 140EDPS 297
1 2 1 14 25
397A 3 2 7 14 196 196 196 196497A 1
25 8 16 640 640 640 640
297 1 2 1 10 20 20397 3 5 2 12 120 12
0397D 3 2 8 15 240 240497 1
25 8 16 640 64
0497A 6 5 8 40 400 400SPED 3 3 4 12 144 120
397SPED 496Y
1 2 4 14 56 56
497M 9 5 8 10 400 400CYAF 270L
2 1 4 14 52 52 52
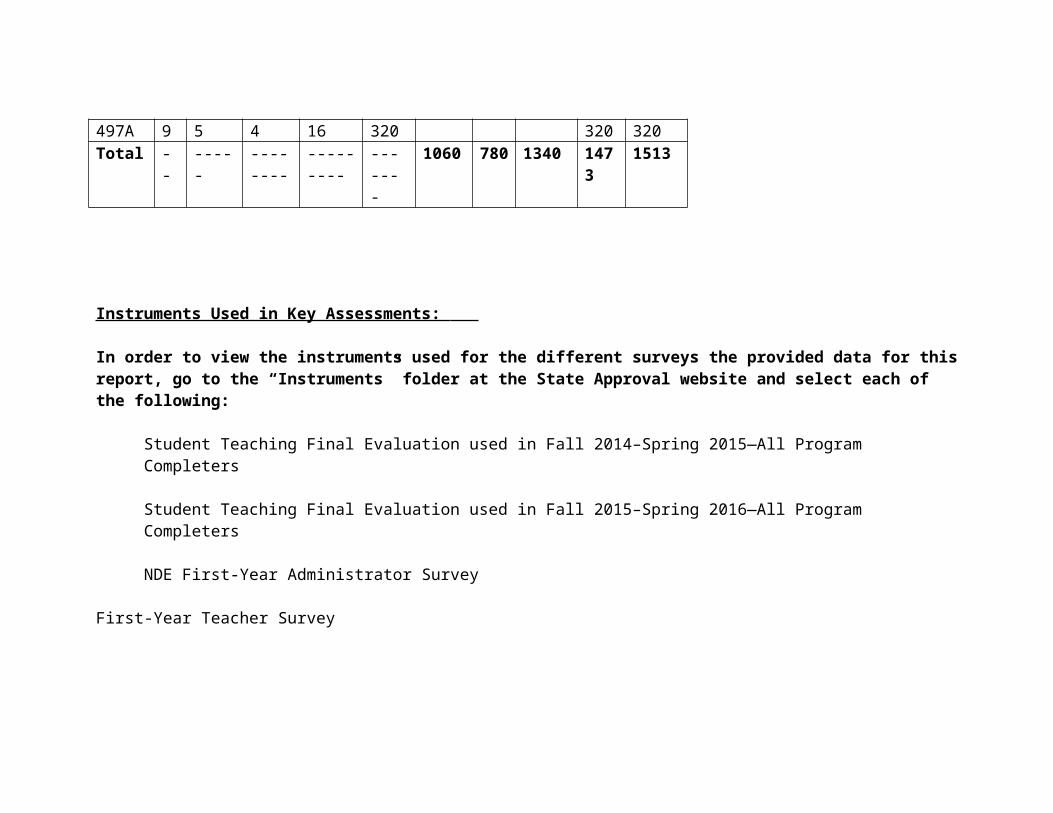
271L 1 1 3 12 36 36 36374L 1 1 3 15 45 45 45497A 9 5 4 16 320 320 320Total -- ----- -------
---------- ------- 106
0780
1340 1473
1513
Instruments Used in Key Assessments:
In order to view the instruments used for the different surveys the provided data for this report, go to the “Instruments” folder at the State Approval website and select each of the following:
Student Teaching Final Evaluation used in Fall 2014–Spring 2015—All Program Completers
Student Teaching Final Evaluation used in Fall 2015–Spring 2016—All Program Completers
NDE First-Year Administrator Survey
First-Year Teacher Survey

SECTION 2: KEY ASSESSMENTS AND FINDINGS — Artifact 2
1. Content KnowledgeBelow are the measures used specifically for addressing the content knowledge or teacher candidates at the University of Nebraska–Lincoln.
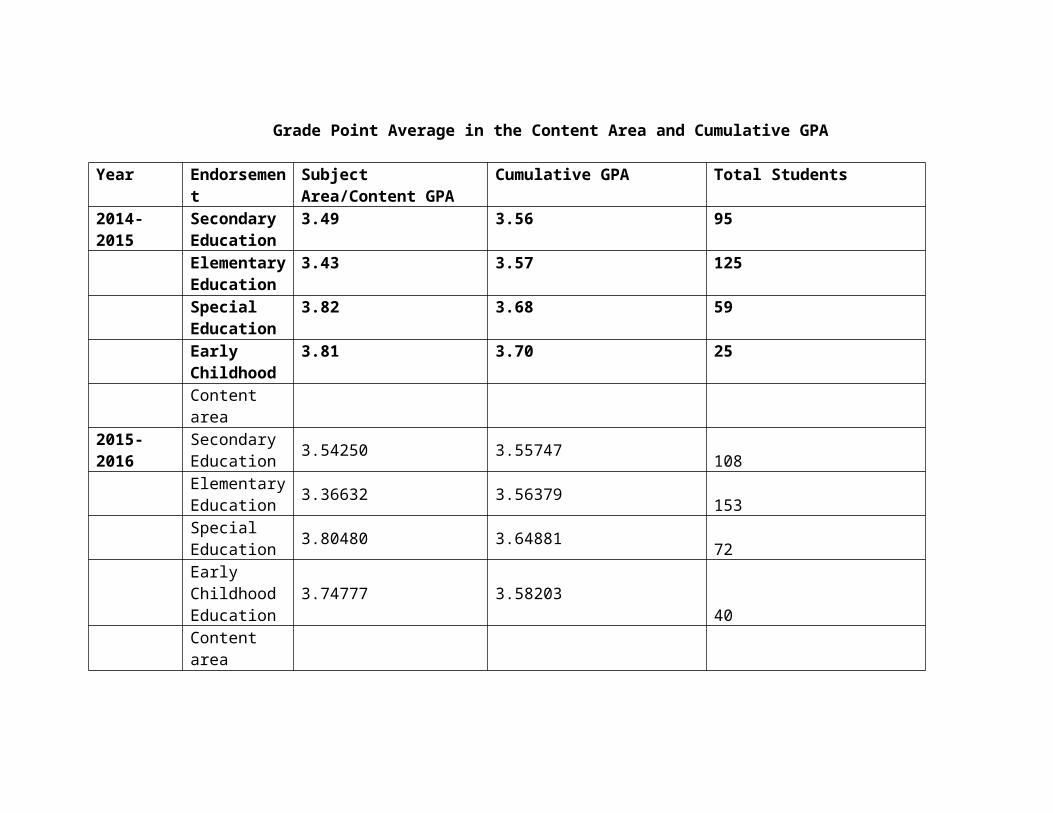
Table 1A Grade Point Average in the Content Area and Cumulative GPA
Year Endorsement
Subject Area/Content GPA
Cumulative GPA Total Students
2014- Secondary 3.49 3.56 95
2015 EducationElementary Education
3.43 3.57 125
Special Education
3.82 3.68 59
Early Childhood
3.81 3.70 25
Content area
2015-2016
Secondary Education 3.54250 3.55747 108Elementary Education 3.36632 3.56379 153Special Education 3.80480 3.64881 72Early Childhood Education
3.74777 3.5820340
Content area
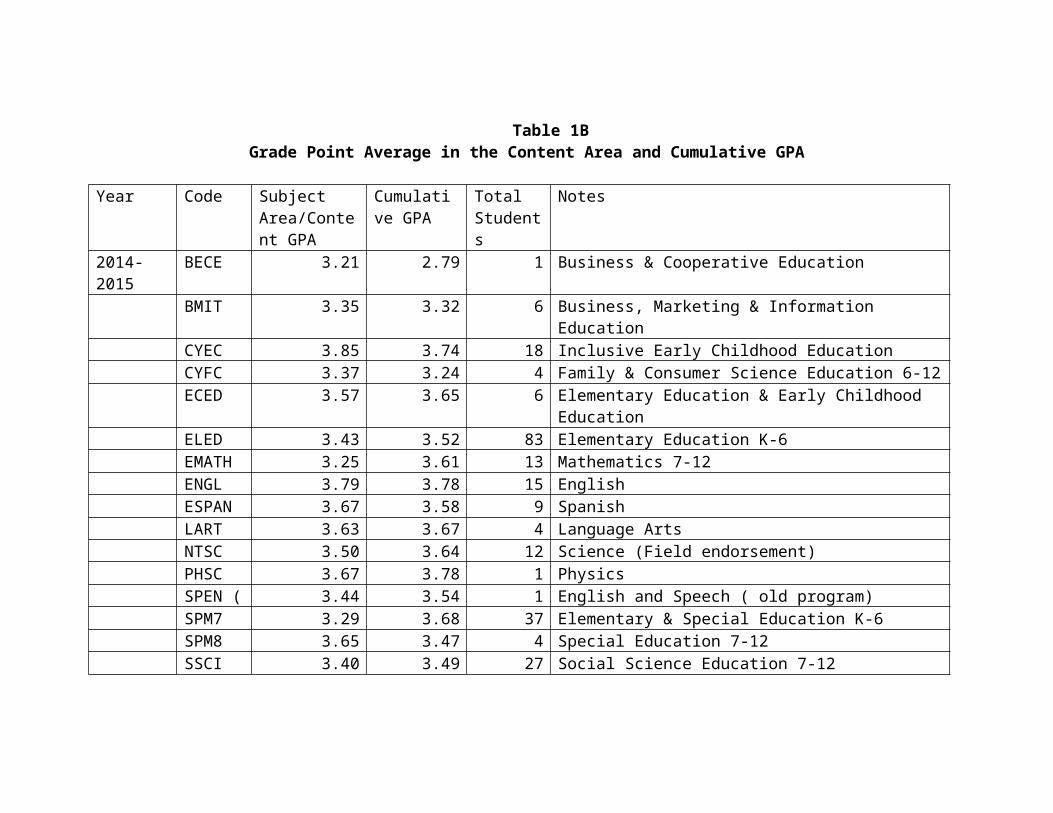
Table 1BGrade Point Average in the Content Area and Cumulative GPA
Year Code Subject Area/Content GPA
Cumulative GPA
Total Students
Notes
2014-2015
BECE 3.21 2.79 1 Business & Cooperative Education
BMIT 3.35 3.32 6 Business, Marketing & Information EducationCYEC 3.85 3.74 18 Inclusive Early Childhood EducationCYFC 3.37 3.24 4 Family & Consumer Science Education 6-12ECED 3.57 3.65 6 Elementary Education & Early Childhood
EducationELED 3.43 3.52 83 Elementary Education K-6EMATH
3.25 3.61 13 Mathematics 7-12
ENGL 3.79 3.78 15 EnglishESPAN 3.67 3.58 9 SpanishLART 3.63 3.67 4 Language ArtsNTSC 3.50 3.64 12 Science (Field endorsement)PHSC 3.67 3.78 1 PhysicsSPEN ( 3.44 3.54 1 English and Speech ( old program)SPM7 3.29 3.68 37 Elementary & Special Education K-6SPM8 3.65 3.47 4 Special Education 7-12SSCI 3.40 3.49 27 Social Science Education 7-12
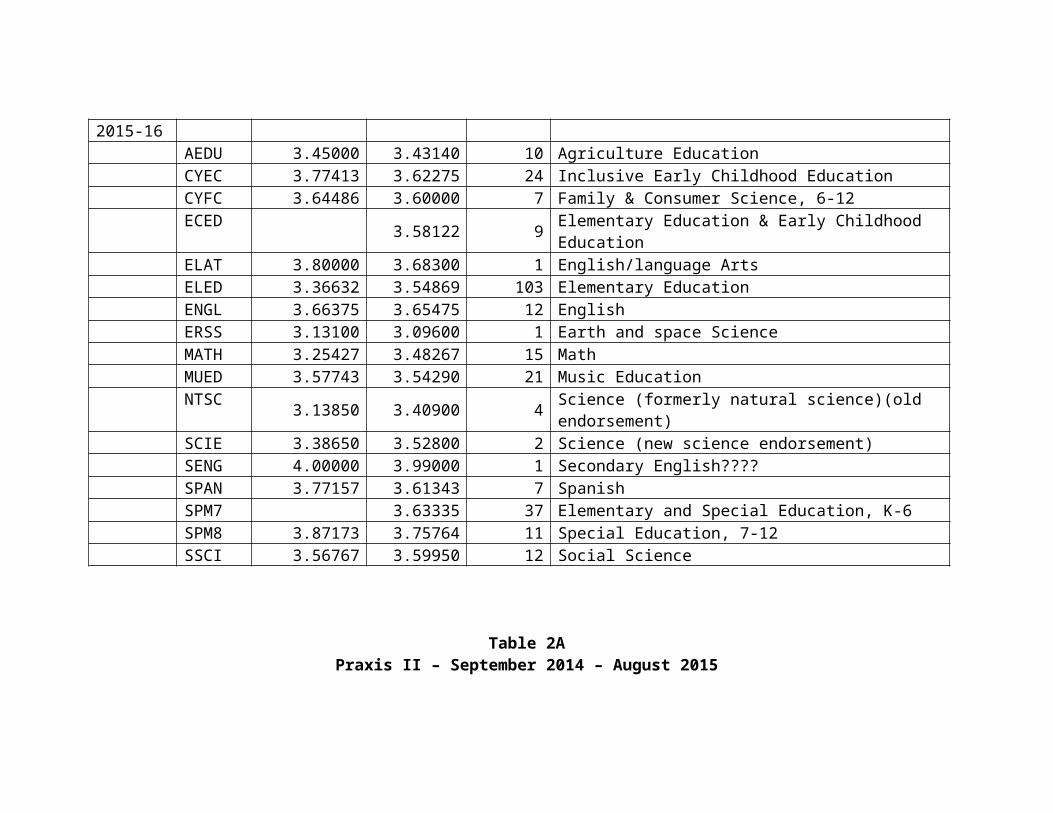
2015-16AEDU 3.45000 3.43140 10 Agriculture EducationCYEC 3.77413 3.62275 24 Inclusive Early Childhood EducationCYFC 3.64486 3.60000 7 Family & Consumer Science, 6-12ECED 3.58122 9 Elementary Education & Early Childhood
EducationELAT 3.80000 3.68300 1 English/language ArtsELED 3.36632 3.54869 103 Elementary EducationENGL 3.66375 3.65475 12 EnglishERSS 3.13100 3.09600 1 Earth and space ScienceMATH 3.25427 3.48267 15 MathMUED 3.57743 3.54290 21 Music Education
NTSC 3.13850 3.40900 4 Science (formerly natural science)(old endorsement)SCIE 3.38650 3.52800 2 Science (new science endorsement)SENG 4.00000 3.99000 1 Secondary English????SPAN 3.77157 3.61343 7 SpanishSPM7 3.63335 37 Elementary and Special Education, K-6SPM8 3.87173 3.75764 11 Special Education, 7-12SSCI 3.56767 3.59950 12 Social Science
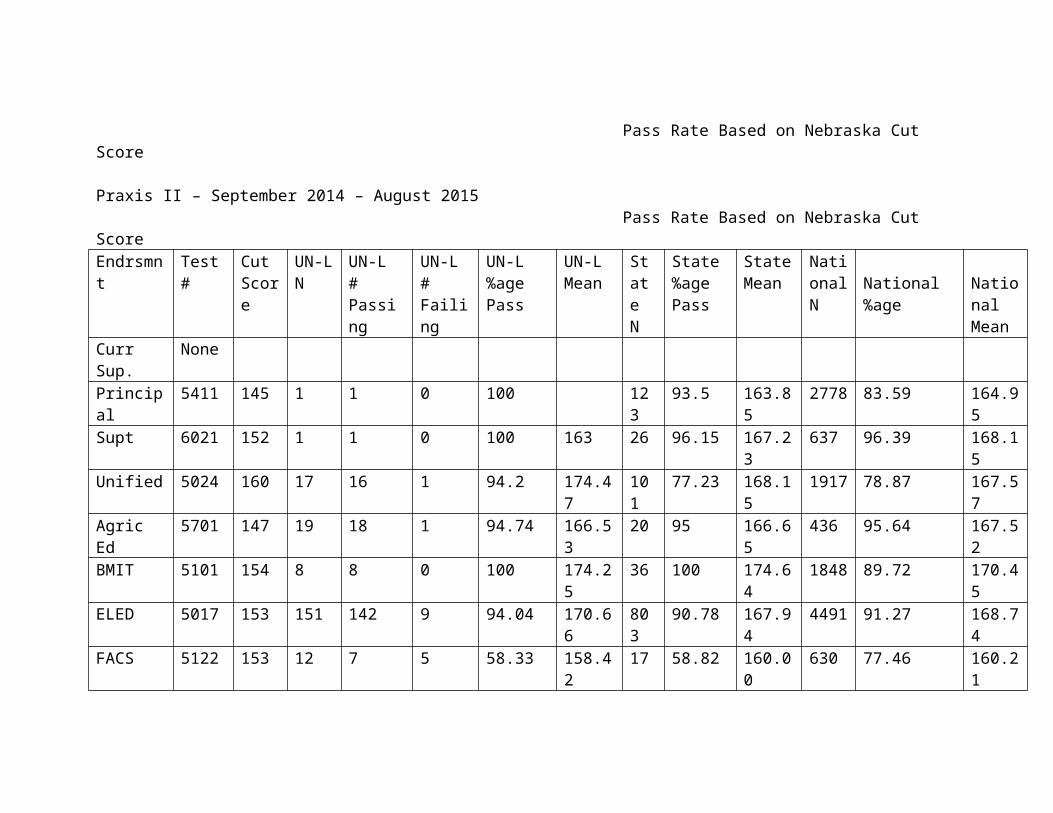
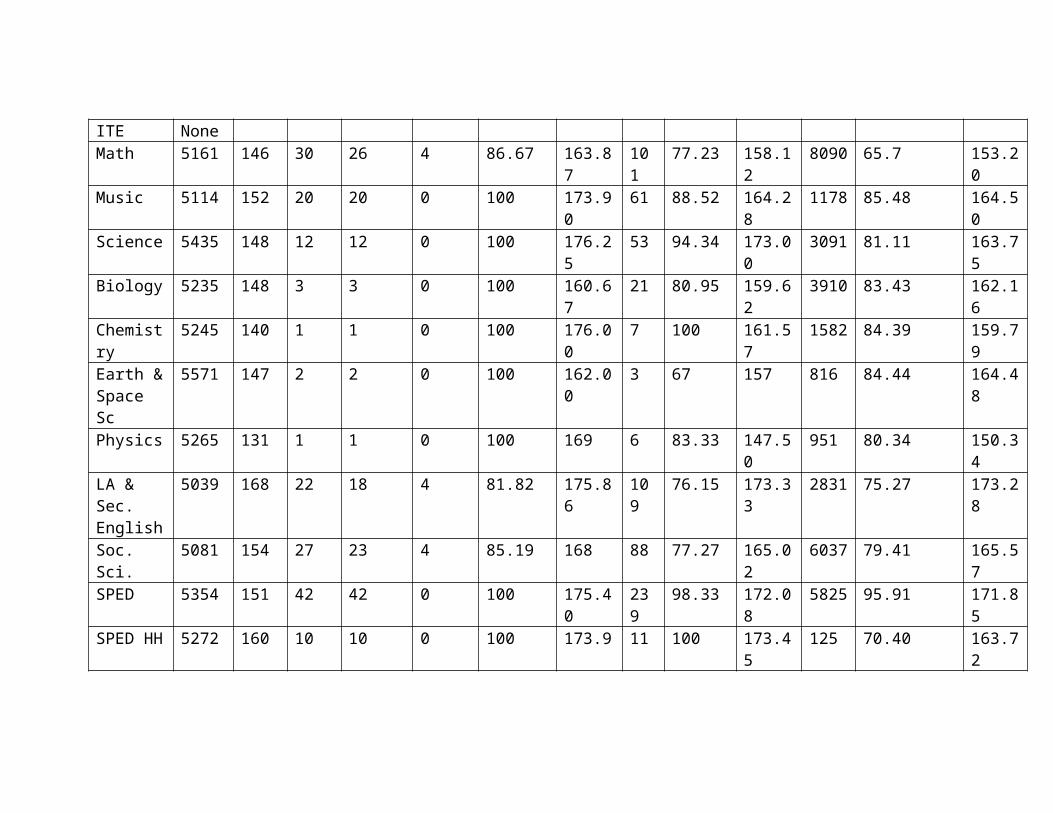
Table 2APraxis II – September 2014 – August 2015
Pass Rate Based on Nebraska Cut Score
Praxis II – September 2014 – August 2015Pass Rate Based on Nebraska Cut Score
Endrsmnt
Test #
Cut Score
UN-L N
UN-L # Passing
UN-L # Failing
UN-L %age Pass
UN-L Mean
State N
State %age Pass
StateMean
National N
National %age
National Mean
Curr Sup.
None
Principal
5411 145 1 1 0 100 123
93.5 163.85
2778
83.59 164.95
Supt 6021 152 1 1 0 100 163 26 96.15 167.23
637 96.39 168.15
Unified 5024 160 17 16 1 94.2 174.47
101
77.23 168.15
1917
78.87 167.57
Agric Ed
5701 147 19 18 1 94.74 166.53
20 95 166.65
436 95.64 167.52
BMIT 5101 154 8 8 0 100 174.25
36 100 174.64
1848
89.72 170.45
ELED 5017 153 151 142 9 94.04 170.66
803
90.78 167.94
4491
91.27 168.74
FACS 5122 153 12 7 5 58.33 158.42
17 58.82 160.00
630 77.46 160.21
ITE NoneMath 5161 146 30 26 4 86.67 163.8
7101
77.23 158.12
8090
65.7 153.20
Music 5114 152 20 20 0 100 173.90
61 88.52 164.28
1178
85.48 164.50
Science 5435 148 12 12 0 100 176.25
53 94.34 173.00
3091
81.11 163.75
Biology 5235 148 3 3 0 100 160.67
21 80.95 159.62
3910
83.43 162.16
Chemistry
5245 140 1 1 0 100 176.00
7 100 161.57
1582
84.39 159.79
Earth & Space Sc
5571 147 2 2 0 100 162.00
3 67 157 816 84.44 164.48
Physics 5265 131 1 1 0 100 169 6 83.33 147.50
951 80.34 150.34
LA & Sec. English
5039 168 22 18 4 81.82 175.86
109
76.15 173.33
2831
75.27 173.28
Soc. Sci. 5081 154 27 23 4 85.19 168 88 77.27 165.02
6037
79.41 165.57
SPED 5354 151 42 42 0 100 175.40
239
98.33 172.08
5825
95.91 171.85
SPED 5272 160 10 10 0 100 173.9 11 100 173.4 125 70.40 163.7
HH 5 2ECSE 5691 159 1 1 0 100 191 1 100 191 761 91.33 173.7
1SPED V I
5282 163 1 1 0 100 167 1 100 167 169 73.96 167.24
SLPA 5331 162 13 11 2 84.62 173 35 91.43 174.51
8384
92.20 176.41
French 5174 162 1 1 0 100 168 5 80 175.20
482 69.92 169.59
German 5183 163 1 1 0 100 183 2 100 182 122 70.49 170.50
Latin 5601 155 0 0 0 0 0 0 0 0 91 84.62 175.30
Russian NoneSpanish 5195 156 0 0 0 0 0 0 0 0 1 100 178School Counslr
5421 156 0 0 0 0 0 31 96.76 169.97
3196
90.18 168.57
School Psychlgst
5402 147 7 7 0 100 175.29
23 100 170.83
2633
97.27 169.02
TOTAL 403 373 30 92.56%
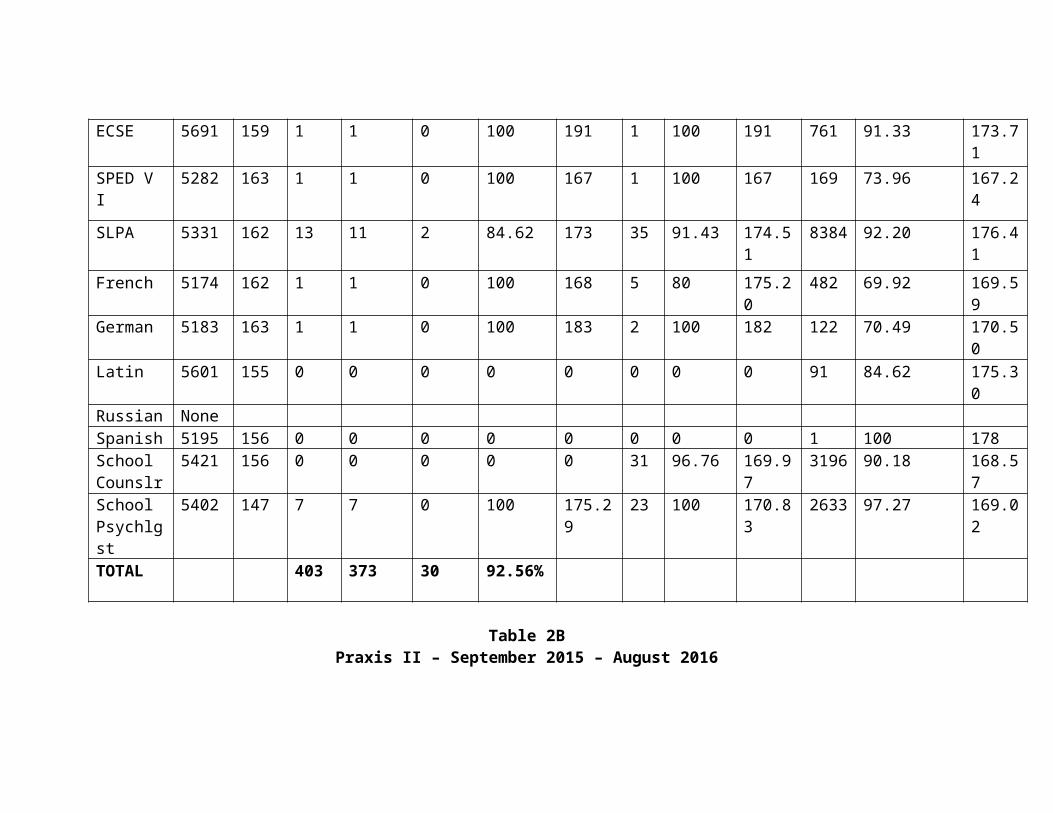
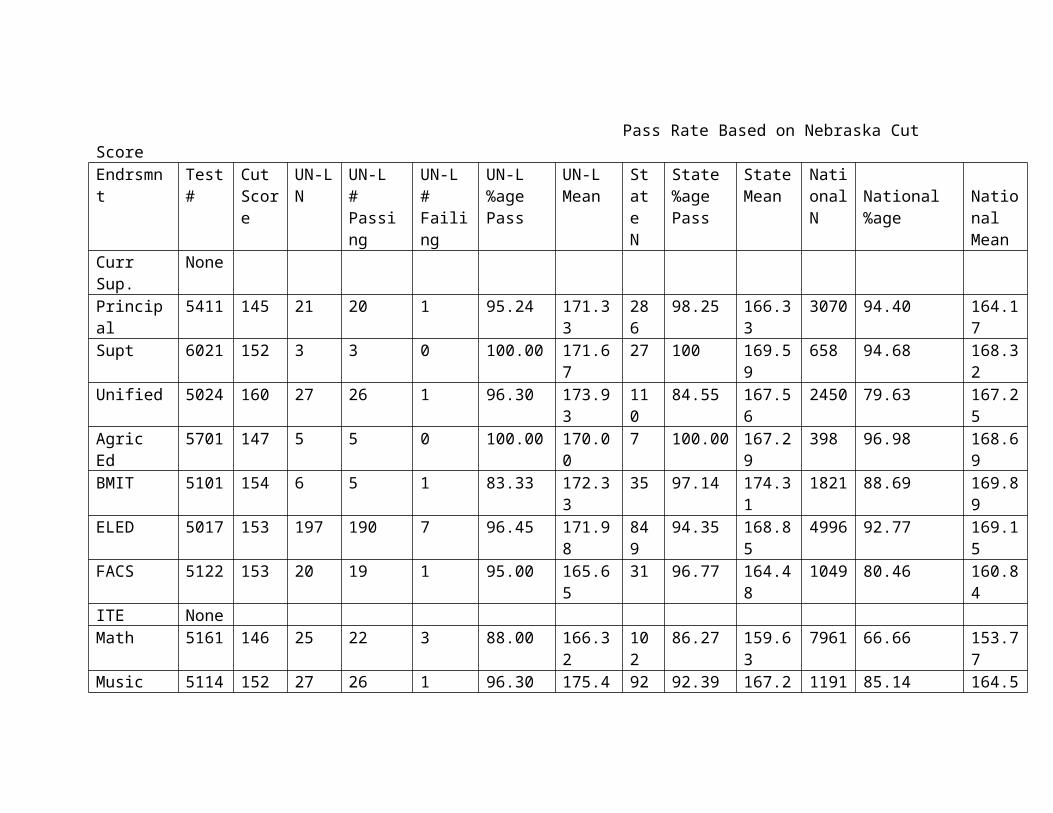
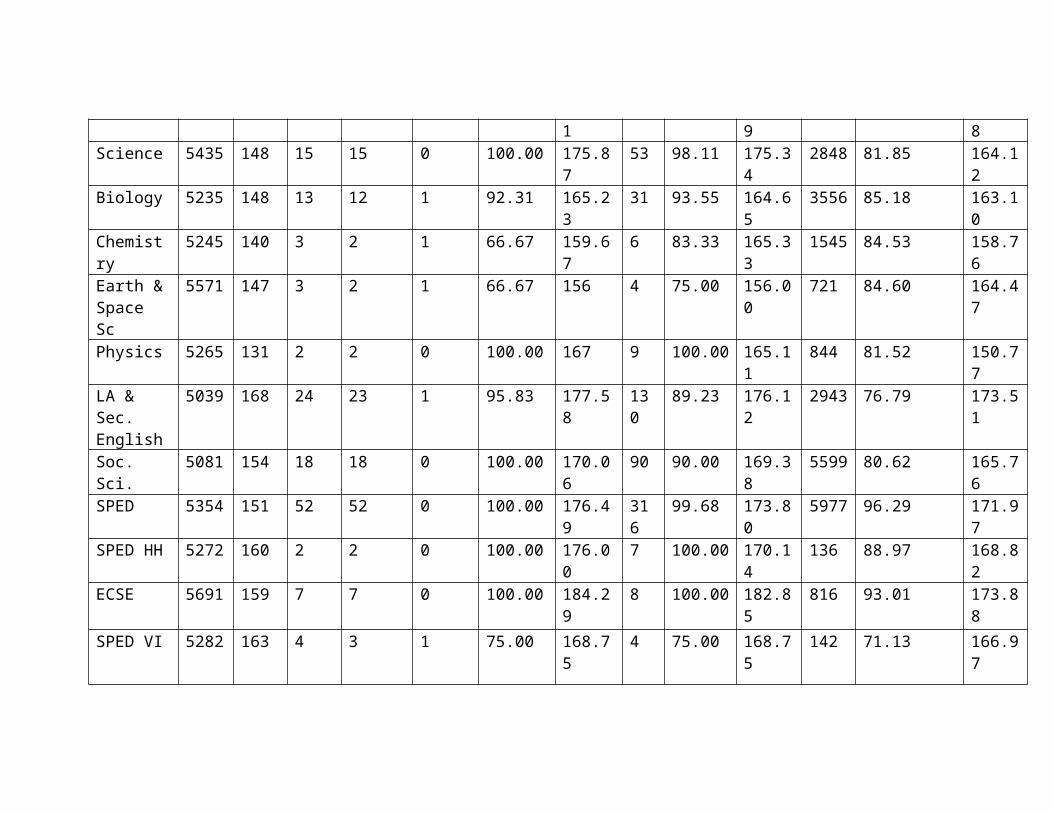
Table 2BPraxis II – September 2015 – August 2016
Pass Rate Based on Nebraska Cut Score
Endrsmnt
Test #
Cut Score
UN-L N
UN-L # Passing
UN-L # Failing
UN-L %age Pass
UN-L Mean
State N
State %age Pass
StateMean
National N
National %age
National Mean
Curr Sup.
None
Principal 5411 145 21 20 1 95.24 171.33
286
98.25 166.33
3070
94.40 164.17
Supt 6021 152 3 3 0 100.00 171.67
27 100 169.59
658 94.68 168.32
Unified 5024 160 27 26 1 96.30 173.93
110
84.55 167.56
2450
79.63 167.25
Agric Ed 5701 147 5 5 0 100.00 170.00
7 100.00 167.29
398 96.98 168.69
BMIT 5101 154 6 5 1 83.33 172.33
35 97.14 174.31
1821
88.69 169.89
ELED 5017 153 197 190 7 96.45 171.98
849
94.35 168.85
4996
92.77 169.15
FACS 5122 153 20 19 1 95.00 165.65
31 96.77 164.48
1049
80.46 160.84
ITE None
Math 5161 146 25 22 3 88.00 166.32
102
86.27 159.63
7961
66.66 153.77
Music 5114 152 27 26 1 96.30 175.41
92 92.39 167.29
1191
85.14 164.58
Science 5435 148 15 15 0 100.00 175.87
53 98.11 175.34
2848
81.85 164.12
Biology 5235 148 13 12 1 92.31 165.23
31 93.55 164.65
3556
85.18 163.10
Chemistry
5245 140 3 2 1 66.67 159.67
6 83.33 165.33
1545
84.53 158.76
Earth & Space Sc
5571 147 3 2 1 66.67 156 4 75.00 156.00
721 84.60 164.47
Physics 5265 131 2 2 0 100.00 167 9 100.00 165.11
844 81.52 150.77
LA & Sec. English
5039 168 24 23 1 95.83 177.58
130
89.23 176.12
2943
76.79 173.51
Soc. Sci. 5081 154 18 18 0 100.00 170.06
90 90.00 169.38
5599
80.62 165.76
SPED 5354 151 52 52 0 100.00 176.49
316
99.68 173.80
5977
96.29 171.97
SPED HH
5272 160 2 2 0 100.00 176.00
7 100.00 170.14
136 88.97 168.82
ECSE 5691 159 7 7 0 100.00 184.29
8 100.00 182.85
816 93.01 173.88
SPED VI 5282 163 4 3 1 75.00 168.75
4 75.00 168.75
142 71.13 166.97
SLPA 5331 162 4 3 1 75.00 173.25
9 77.78 167.89
9013
93.38 176.21
French 5174 162 1 0 1 0 159.00
4 50.00 168.00
407 67.57 168.57
German 5183 163 2 2 0 100.00 197.5 3 100.00 186.33
116 66.38 171.88
Latin 5601 155 - - - - - 2 100.00 174.5 52 84.62 176.02
Russian None
Spanish 5195 156 9 6 3 66.67 161.89
36 72.22 166 1842
73.13 167.22
School Counselor
5421 156 2 2 0 100.00 177.00
66 96.97 171.39
3327
89.93 168.90
School Psychlgst
5402 147 11 11 0 100.00 178.00
38 100.00 170.66
2586
97.56 169.36
TOTAL 503 478 25 95.03%
Response From College of Education & Human Sciences Student Teaching Instrument Teacher Candidate Summative Evaluation on Subject Matter Knowledge for the 2014-2015 Academic Year for Teaching in General (Item 1).
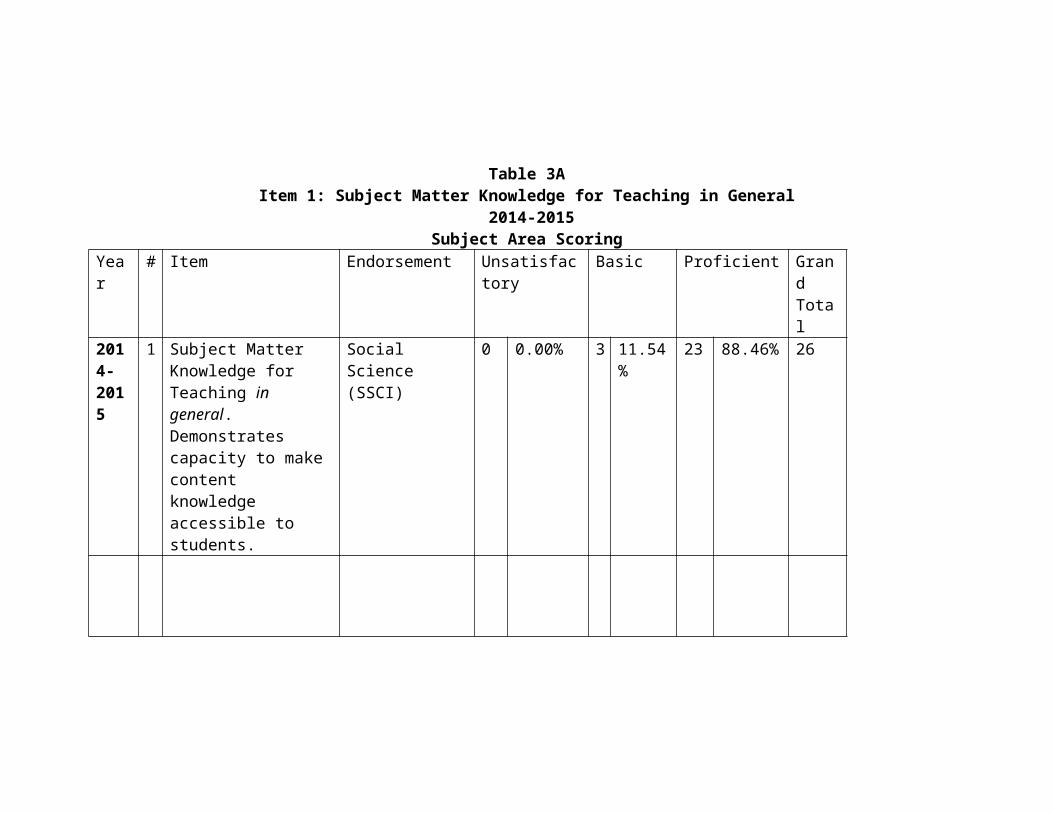
Table 3AItem 1: Subject Matter Knowledge for Teaching in General
2014-2015Subject Area Scoring
Year
# Item Endorsement Unsatisfactory
Basic Proficient Grand Total
2014- 201
1 Subject Matter Knowledge for Teaching in
Social Science (SSCI)
0 0.00% 3 11.54%
23 88.46% 26
5 general. Demonstrates capacity to make content knowledge accessible to students.
Early Childhood
0 0.0% 4 8.2% 45 91.8% 49
Elementary Education
0 0% 0 0% 121
100% 121
Secondary Education
0 0% 9 7.5% 111
92.5% 120
Special Education
0 0% 5 10.2%
44 89.8% 49
Response From College of Education & Human Sciences Student Teaching Instrument Teacher Candidate Summative Evaluation for the 2015-2016 Academic Year on Subject Matter Knowledge for Teaching (Item 3—Table 3B)—LIVETEXT version.
Table 3BItem 3: Subject Matter Knowledge for Teaching in General
2015-16Subject Area Scoring
Year
# Item Endorsement Unacceptable
Emergent
Sufficient Advanced Grand Total
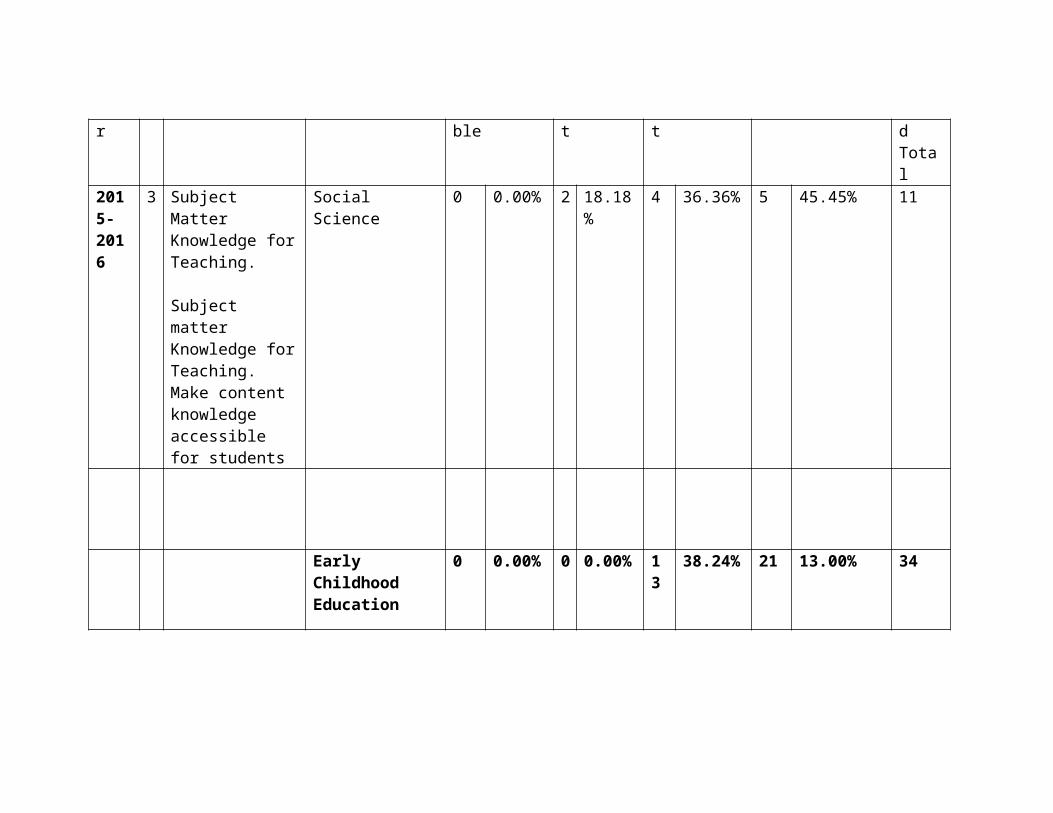
2015- 2016
3 Subject Matter Knowledge for Teaching.
Subject matter Knowledge for Teaching. Make content knowledge accessible for students
Social Science 0 0.00% 2 18.18%
4 36.36% 5 45.45% 11
Early Childhood Education
0 0.00% 0 0.00% 13
38.24% 21 13.00% 34
Elementary Education
0 0.00% 3 1.63% 71
38.59% 110
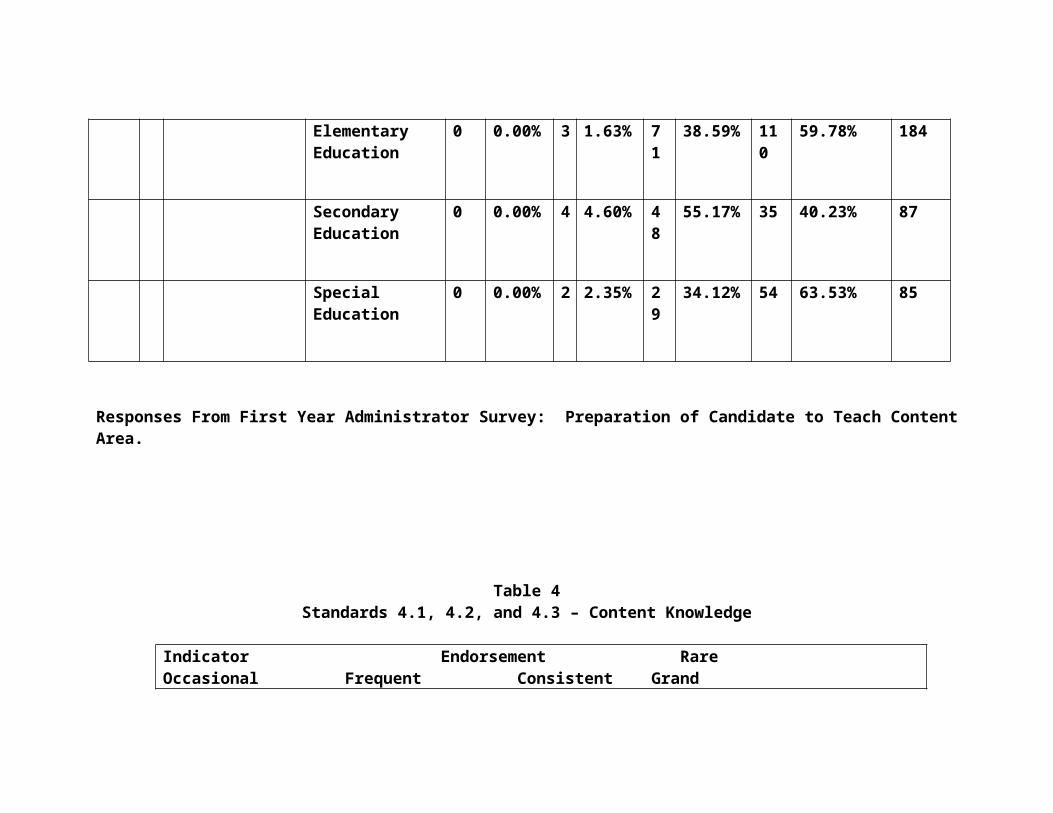
59.78% 184
Secondary Education
0 0.00% 4 4.60% 48
55.17% 35 40.23% 87
Special Education
0 0.00% 2 2.35% 29
34.12% 54 63.53% 85
Responses From First Year Administrator Survey: Preparation of Candidate to Teach Content Area.
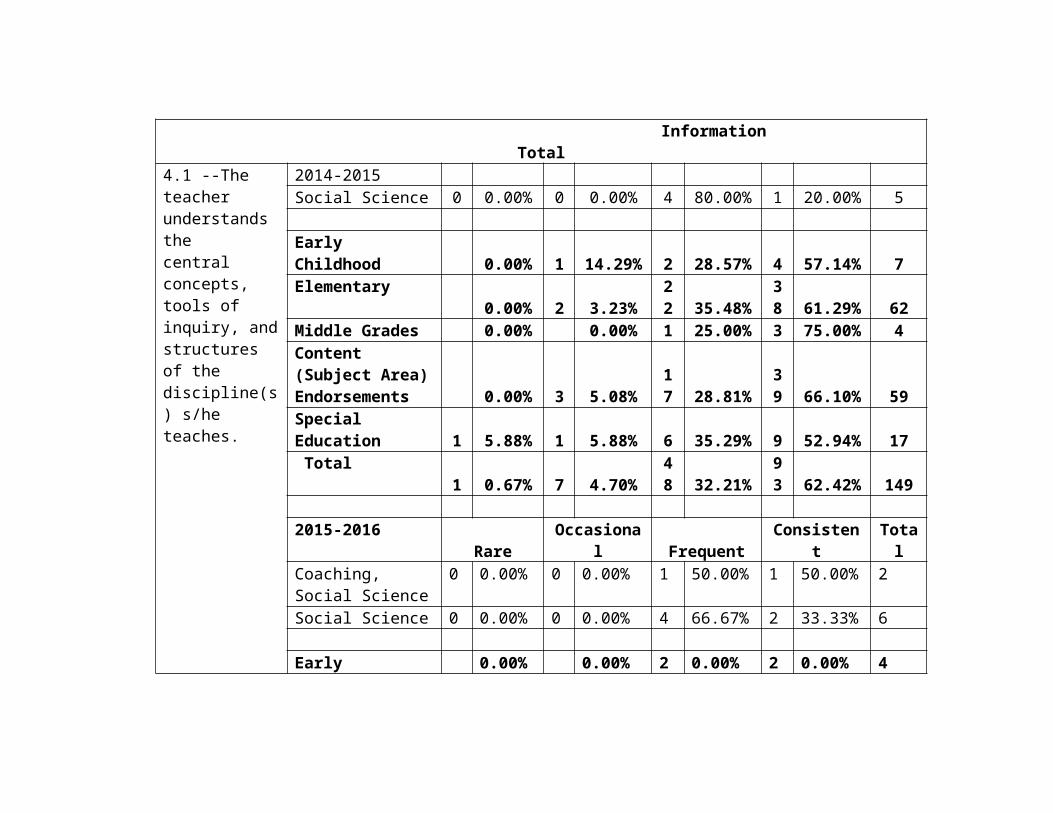
Table 4Standards 4.1, 4.2, and 4.3 – Content Knowledge
Indicator Endorsement Rare Occasional Frequent Consistent Grand
Information Total
4.1 --Theteacher understands thecentral concepts, tools of inquiry, and structuresof the discipline(s) s/he teaches.
2014-2015Social Science 0 0.00% 0 0.00% 4 80.00% 1 20.00% 5
Early Childhood 0.00% 1 14.29% 2 28.57% 4 57.14% 7Elementary 0.00% 2 3.23% 22 35.48% 38 61.29% 62Middle Grades 0.00% 0.00% 1 25.00% 3 75.00% 4Content (Subject Area) Endorsements 0.00% 3 5.08% 17 28.81% 39 66.10% 59Special Education 1 5.88% 1 5.88% 6 35.29% 9 52.94% 17 Total 1 0.67% 7 4.70% 48 32.21% 93 62.42% 149
2015-2016 Rare Occasional Frequent Consistent TotalCoaching, Social Science
0 0.00% 0 0.00% 1 50.00% 1 50.00% 2
Social Science 0 0.00% 0 0.00% 4 66.67% 2 33.33% 6
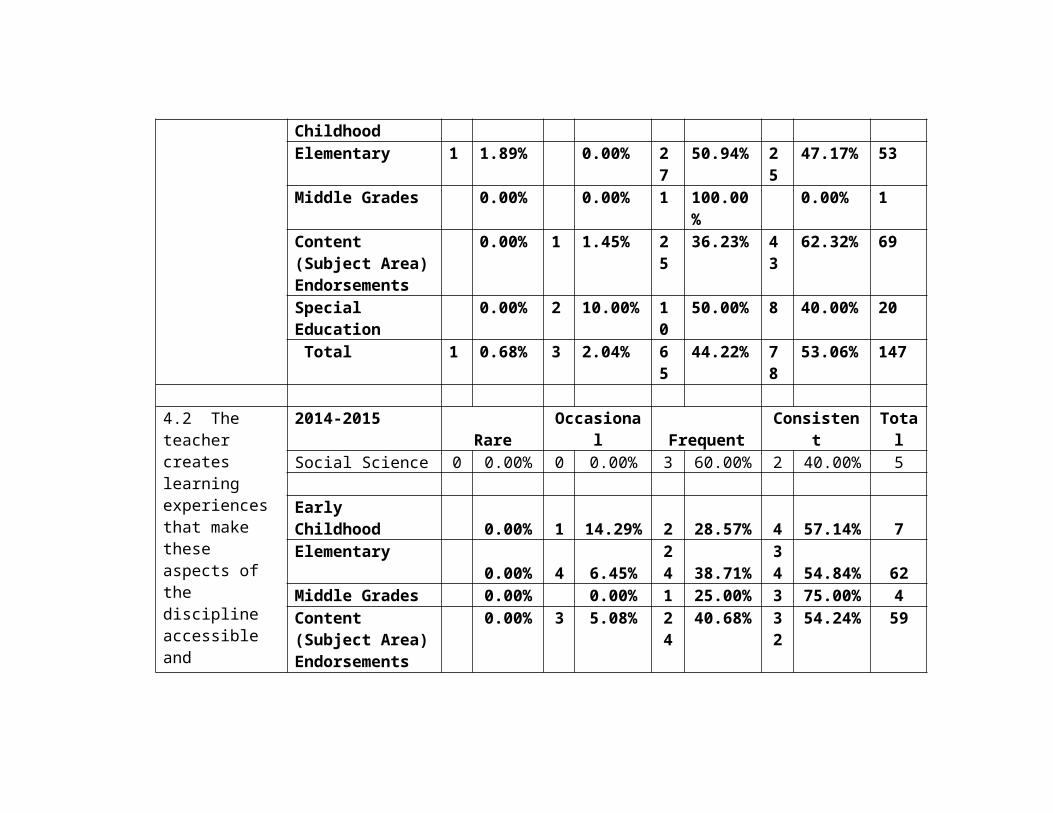
Early Childhood 0.00% 0.00% 2 0.00% 2 0.00% 4Elementary 1 1.89% 0.00% 27 50.94% 25 47.17% 53Middle Grades 0.00% 0.00% 1 100.00% 0.00% 1Content (Subject Area) Endorsements
0.00% 1 1.45% 25 36.23% 43 62.32% 69
Special Education 0.00% 2 10.00% 10 50.00% 8 40.00% 20 Total 1 0.68% 3 2.04% 65 44.22% 78 53.06% 147
4.2 Theteacher
2014-2015 Rare Occasional Frequent Consistent TotalSocial Science 0 0.00% 0 0.00% 3 60.00% 2 40.00% 5
creates learningexperiences that make these aspects of thediscipline accessible and meaningful for studentsto assure mastery of content.
Early Childhood 0.00% 1 14.29% 2 28.57% 4 57.14% 7Elementary 0.00% 4 6.45% 24 38.71% 34 54.84% 62Middle Grades 0.00% 0.00% 1 25.00% 3 75.00% 4Content (Subject Area) Endorsements 0.00% 3 5.08% 24 40.68% 32 54.24% 59Special Education 0.00% 3 17.65% 4 23.53% 10 58.82% 17 Total 0.00% 11 7.38% 55 36.91% 83 55.70% 149
2015-2016 Rare Occasional Frequent Consistent TotalCoaching, Social Science
0 0.00% 0 0.00% 1 50.00% 1 50.00% 2
Social Science 0 0.00% 0 0.00% 2 33.33% 4 66.67% 6
Early Childhood 0.00% 0.00% 2 0.00% 2 0.00% 4Elementary 1 1.89% 3 5.66% 25 47.17% 24 45.28% 53Middle Grades 0.00% 0.00% 1 100.00% 0.00% 1Content (Subject Area) Endorsements
0.00% 3 4.35% 25 36.23% 41 59.42% 69
Special Education 0.00% 1 5.00% 10 50.00% 9 45.00% 20Total
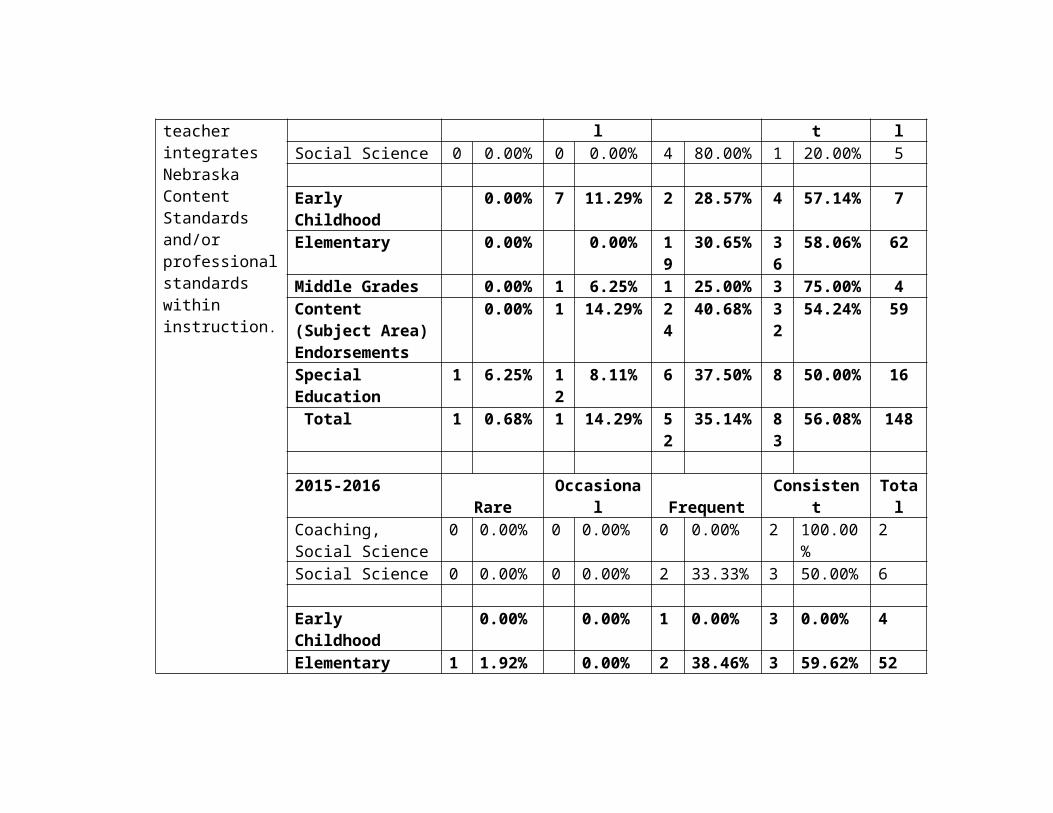
4.3 Theteacher integrates
2014-2015 Rare Occasional Frequent Consistent TotalSocial Science 0 0.00% 0 0.00% 4 80.00% 1 20.00% 5
NebraskaContent Standards and/or professional standardswithin instruction.
Early Childhood
0.00% 7 11.29% 2 28.57% 4 57.14% 7
Elementary 0.00% 0.00% 19 30.65% 36 58.06% 62Middle Grades 0.00% 1 6.25% 1 25.00% 3 75.00% 4Content (Subject Area) Endorsements
0.00% 1 14.29% 24 40.68% 32 54.24% 59
Special Education
1 6.25% 12 8.11% 6 37.50% 8 50.00% 16
Total 1 0.68% 1 14.29% 52 35.14% 83 56.08% 148
2015-2016 Rare Occasional Frequent Consistent TotalCoaching, Social Science
0 0.00% 0 0.00% 0 0.00% 2 100.00% 2
Social Science 0 0.00% 0 0.00% 2 33.33% 3 50.00% 6
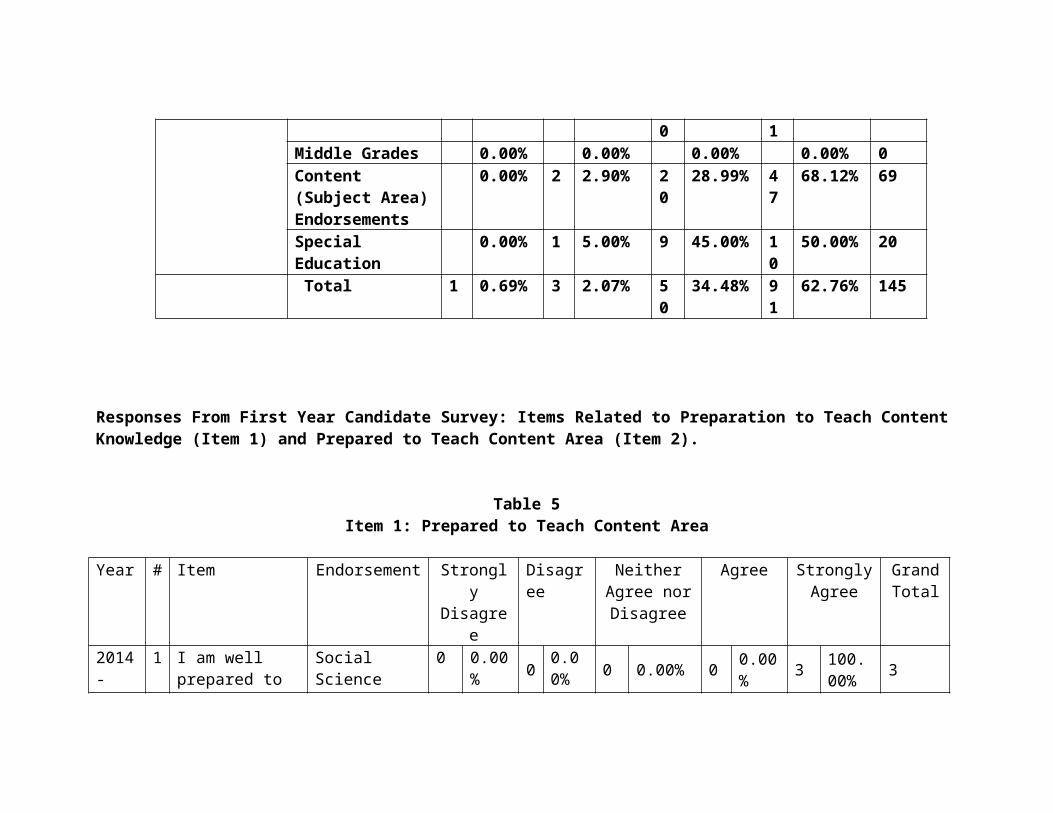
Early Childhood 0.00% 0.00% 1 0.00% 3 0.00% 4Elementary 1 1.92% 0.00% 20 38.46% 31 59.62% 52Middle Grades 0.00% 0.00% 0.00% 0.00% 0Content (Subject Area) Endorsements
0.00% 2 2.90% 20 28.99% 47 68.12% 69
Special Education 0.00% 1 5.00% 9 45.00% 10 50.00% 20 Total 1 0.69% 3 2.07% 50 34.48% 91 62.76% 145
Responses From First Year Candidate Survey: Items Related to Preparation to Teach Content Knowledge (Item 1) and Prepared to Teach Content Area (Item 2).
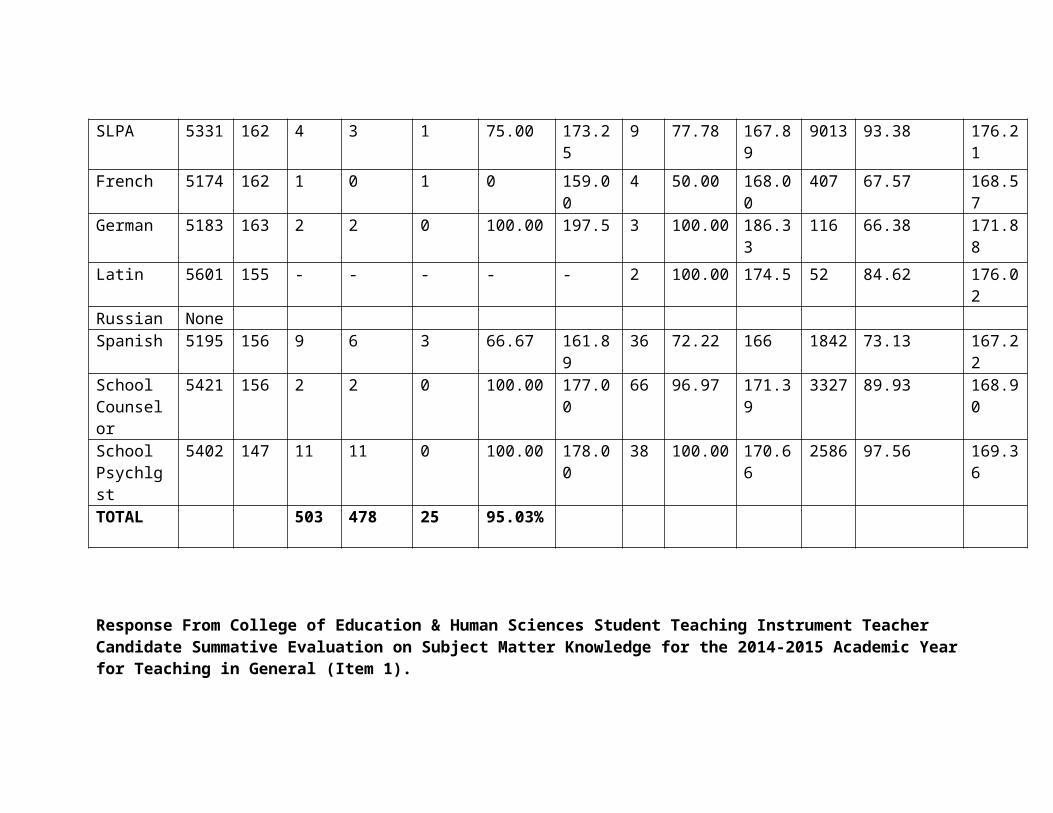
Table 5Item 1: Prepared to Teach Content Area
Year # Item Endorsement
Strongly Disagree
Disagree
Neither Agree nor Disagree
Agree Strongly Agree
Grand Total
2014 - 2015
1 I am well prepared to teach in my content area.
Social Science (SSCI)
0 0.00% 0
0.00% 0 0.00% 0 0.00
% 3 100.00% 3
Early Childhood Education
0 0% 0 0% 1 8.3% 9 75.0%
2 16.7%
12
Elementary Education
0 0% 3 6.1%
3 6.1% 30
61.2%
13
26.5%
49
Secondary Education
0 0% 1 2.0%
1 2.0% 33
67.3%
14
28.6%
49
Special Education
0 0% 2 9.5%
2 9.5% 11
52.4%
6 28.6%
21
2015 - 2016
1 I am well prepared to teach in my content area.
SSCI 0 0.00%
0 0.00%
1 9.09% 9 81.82%
1 9.09% 11
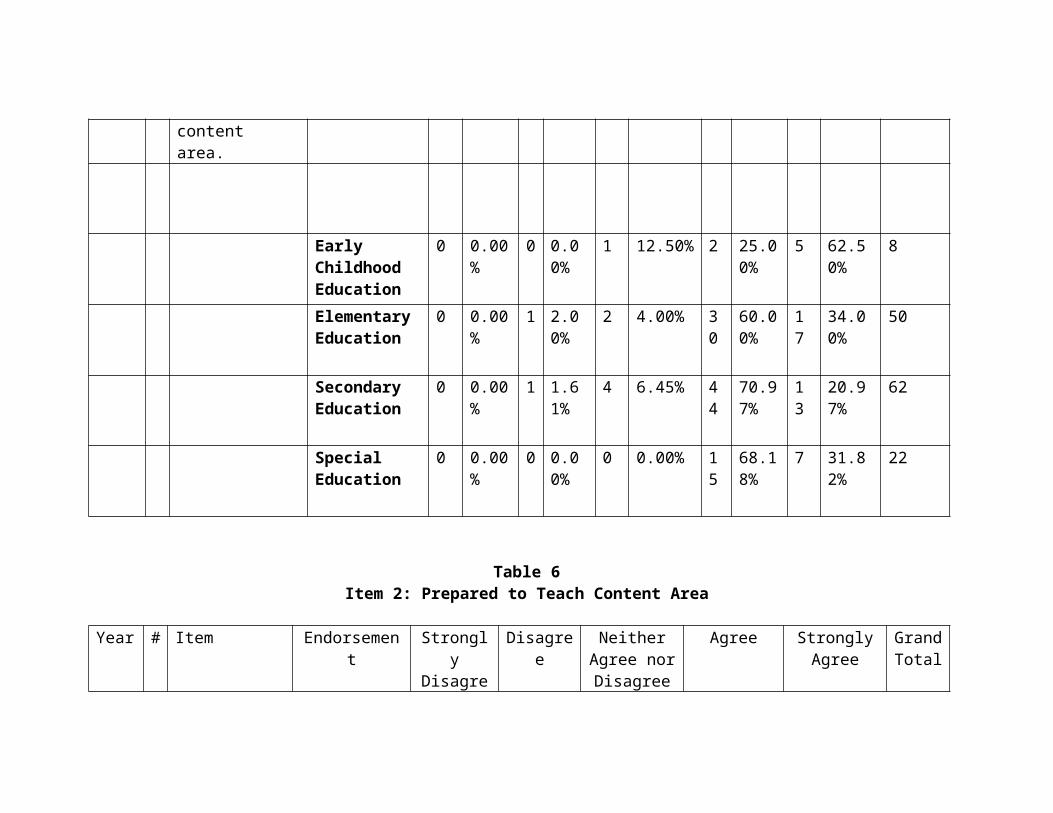
Early Childhood Education
0 0.00%
0 0.00%
1 12.50% 2 25.00%
5 62.50%
8
Elementary Education
0 0.00%
1 2.00%
2 4.00% 30
60.00%
17 34.00%
50
Secondary Education
0 0.00%
1 1.61%
4 6.45% 44
70.97%
13 20.97%
62
Special Education
0 0.00%
0 0.00%
0 0.00% 15
68.18%
7 31.82%
22
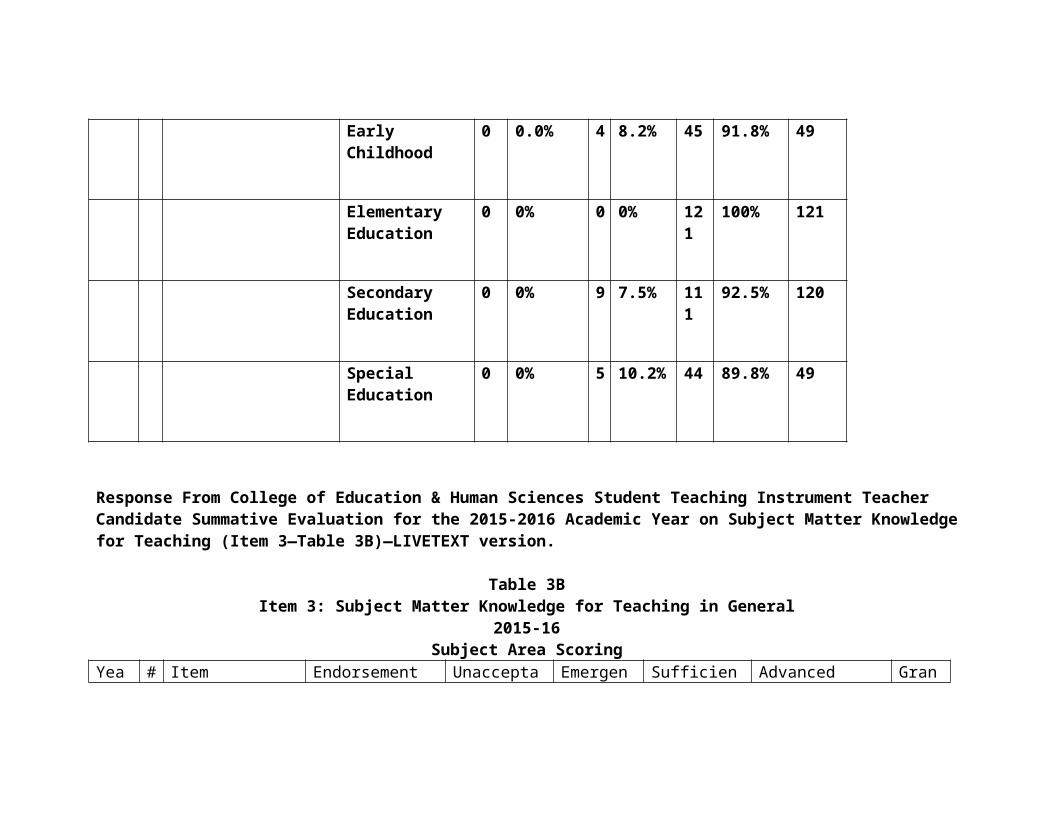
Table 6Item 2: Prepared to Teach Content Area
Year # Item Endorsement
Strongly Disagree
Disagree
Neither Agree nor Disagree
Agree Strongly Agree
Grand
Total2014 - 2015
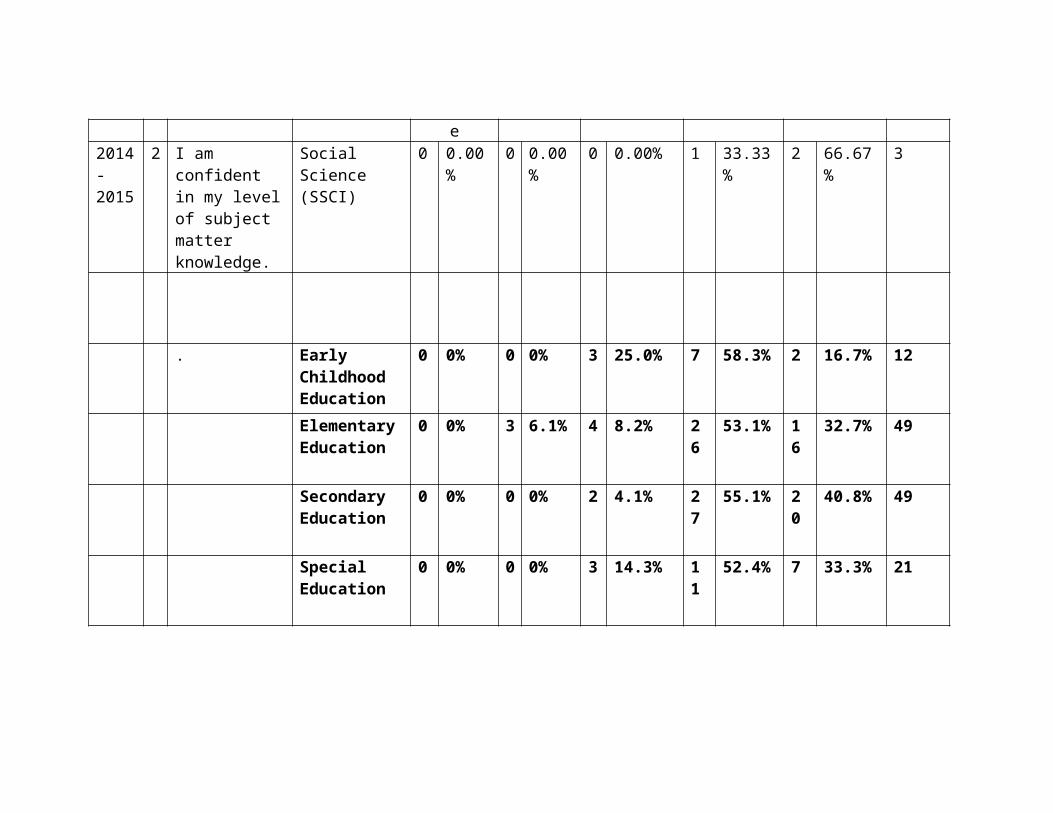
2 I am confident in my level of subject matter knowledge.
Social Science (SSCI)
0 0.00%
0 0.00%
0 0.00% 1 33.33%
2 66.67%
3
. Early Childhood Education
0 0% 0 0% 3 25.0% 7 58.3% 2 16.7% 12
Elementary Education
0 0% 3 6.1% 4 8.2% 26
53.1% 16
32.7% 49
Secondary Education
0 0% 0 0% 2 4.1% 27
55.1% 20
40.8% 49
Special Education
0 0% 0 0% 3 14.3% 11
52.4% 7 33.3% 21
2015-2016
2 I am confident in my subject matter knowledge.
SSCI 0 0.00%
0 0.00% 2 18.18% 6 54.55%
3 27.27% 11
Early Childhood Education
0 0.00%
0 0.00% 1 12.50% 4 50.00%
3 37.50% 8
Elementary Education
0 0.00%
1 2.00% 3 6.00% 26 52.00%
20 40.00% 50
Secondary Education
0 0.00%
0 0.00% 6 9.68% 31 50.00%
25 40.32% 62
Special Education
0 0.00%
0 0.00% 1 4.55% 14 63.64%
7 31.82% 22
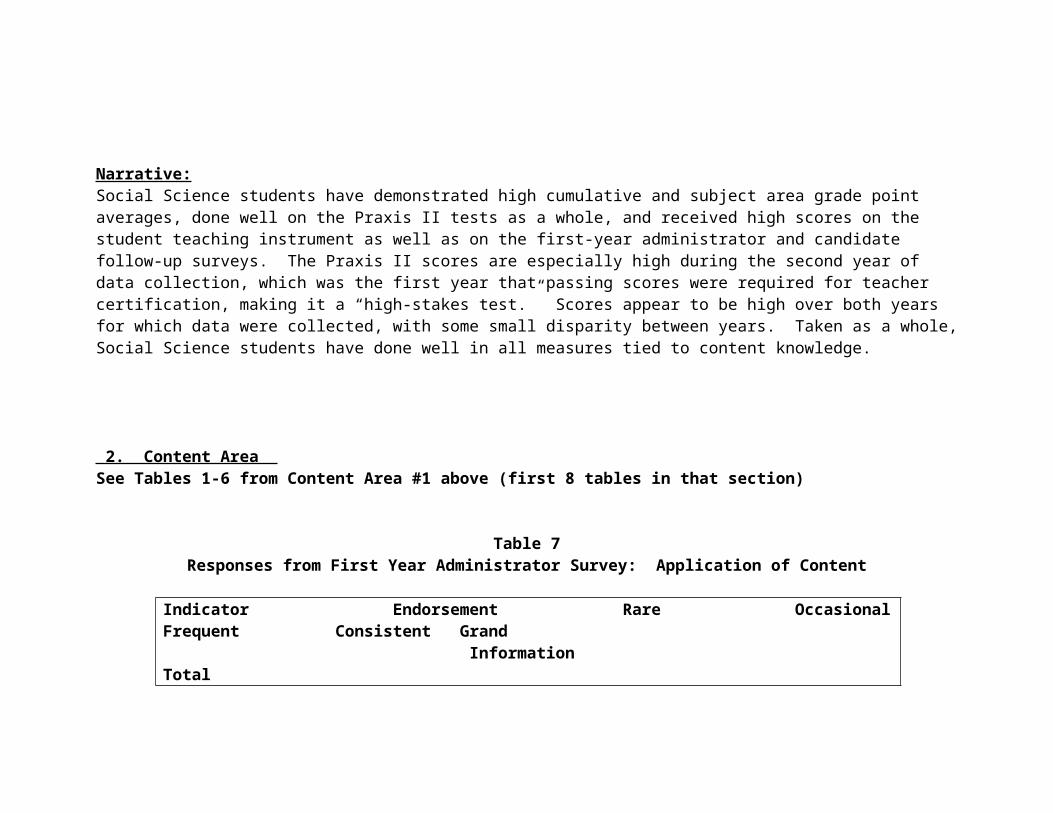
Narrative:Social Science students have demonstrated high cumulative and subject area grade point averages, done well on the Praxis II tests as a whole, and received high scores on the student teaching instrument as well as on the first-year administrator and candidate follow-up surveys. The Praxis II scores are especially high during the second year of data collection, which was the first year that passing scores were required for teacher certification, making it a “high-stakes test.” Scores appear to be high over both years for which data were collected, with some small disparity between years. Taken as a whole, Social Science students have done well in all measures tied to content knowledge.
2. Content Area See Tables 1-6 from Content Area #1 above (first 8 tables in that section)
Table 7Responses from First Year Administrator Survey: Application of Content
Indicator Endorsement Rare Occasional Frequent Consistent Grand Information Total5.1 The 2014-15
teacher candidate understands how to connect concepts across disciplines
Social Science 0 0.00% 2 40.00% 2 40.00% 1 20.00% 5
Early Childhood 0.00% 1 14.29% 3 42.86% 3 42.86% 7Elementary 1 1.61% 6 9.68% 27 43.55% 28 45.16% 62Middle Grades 0.00% 3 75.00% 0.00% 1 25.00% 4Content (Subject Area) Endorsements
0.00% 2 2.90% 20 28.99% 47 68.12% 69
Special Education 0.00% 4 23.53% 4 23.53% 9 52.94% 17 Total 1 0.67% 22 14.77% 58 38.93% 68 45.64% 149
2015-2016 Rare Occasional Frequent Consistent TotalCoaching, Social Science
0 0.00% 0 0.00% 1 50.00% 1 50.00% 2
Social Science 0 0.00% 0 0.00% 4 66.67% 2 33.33% 6
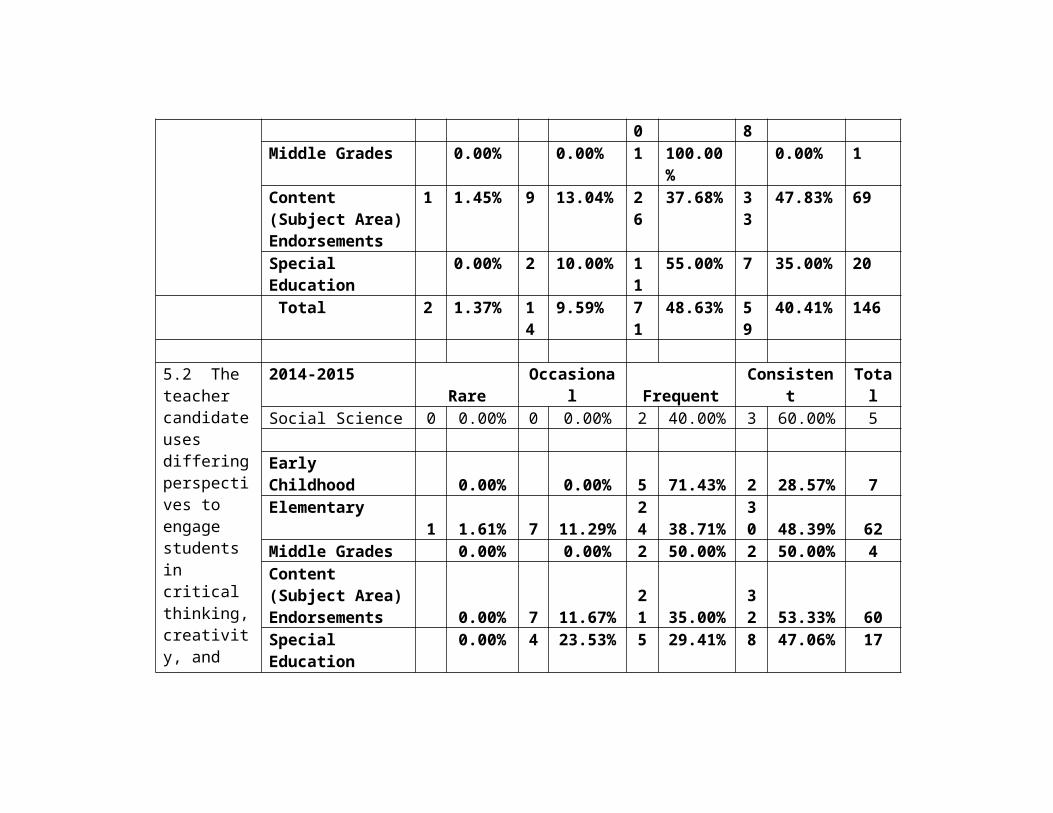
Early Childhood 0.00% 0.00% 3 0.00% 1 0.00% 4Elementary 1 1.92% 3 5.77% 30 57.69% 18 34.62% 52Middle Grades 0.00% 0.00% 1 100.00% 0.00% 1Content (Subject Area) Endorsements
1 1.45% 9 13.04% 26 37.68% 33 47.83% 69
Special Education 0.00% 2 10.00% 11 55.00% 7 35.00% 20 Total 2 1.37% 14 9.59% 71 48.63% 59 40.41% 146
5.2 The teacher candidate
2014-2015 Rare Occasional Frequent Consistent TotalSocial Science 0 0.00% 0 0.00% 2 40.00% 3 60.00% 5
uses differing perspectives to engage students in critical thinking, creativity, and collaborative problem solving related to authentic local and global issues
Early Childhood 0.00% 0.00% 5 71.43% 2 28.57% 7Elementary 1 1.61% 7 11.29% 24 38.71% 30 48.39% 62Middle Grades 0.00% 0.00% 2 50.00% 2 50.00% 4Content (Subject Area) Endorsements 0.00% 7 11.67% 21 35.00% 32 53.33% 60Special Education 0.00% 4 23.53% 5 29.41% 8 47.06% 17 Total 1 0.67% 18 12.00% 57 38.00% 74 49.33% 150
2015-2016 Rare Occasional Frequent Consistent TotalCoaching, Social Science
0 0.00% 0 0.00% 1 50.00% 1 50.00% 2
Social Science 0 0.00% 0 0.00% 1 16.67% 5 83.33% 6
Early Childhood 0.00% 0.00% 2 0.00% 2 0.00% 4Elementary 1 1.89% 4 7.55% 28 52.83% 20 37.74% 53Middle Grades 0.00% 0.00% 1 100.00% 0.00% 1Content (Subject Area) Endorsements
0.00% 9 13.04% 24 34.78% 36 52.17% 69
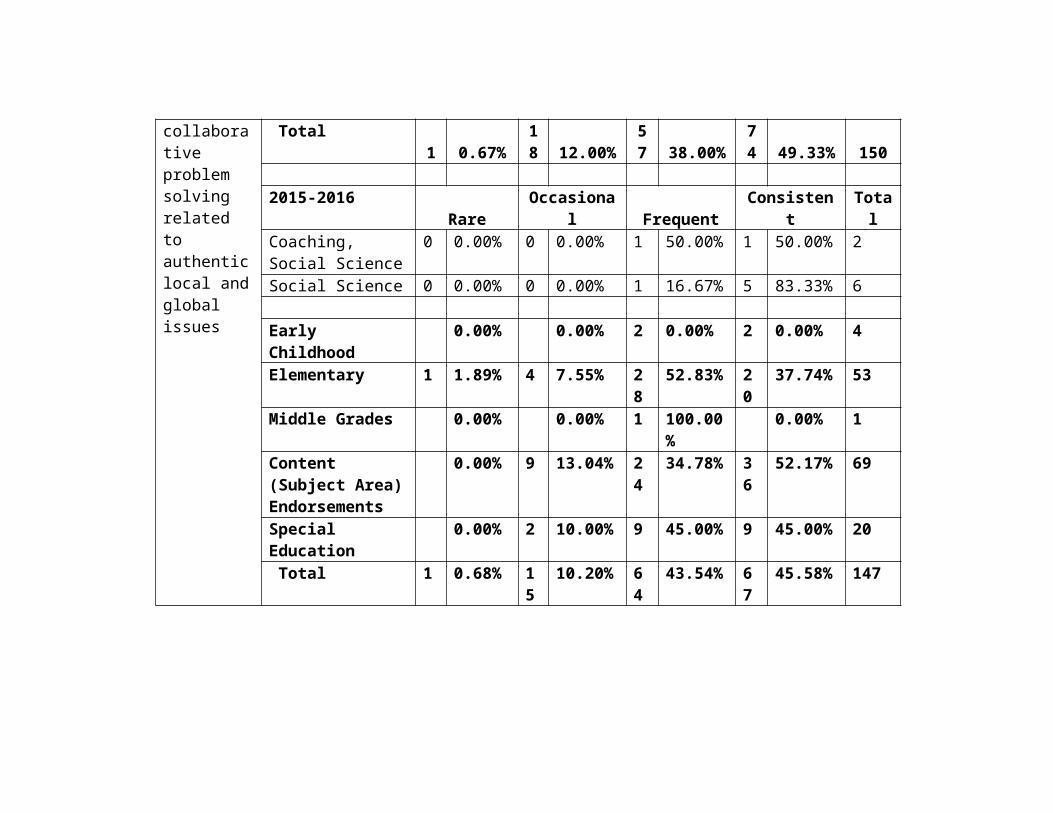
Special Education 0.00% 2 10.00% 9 45.00% 9 45.00% 20 Total 1 0.68% 15 10.20% 64 43.54% 67 45.58% 147
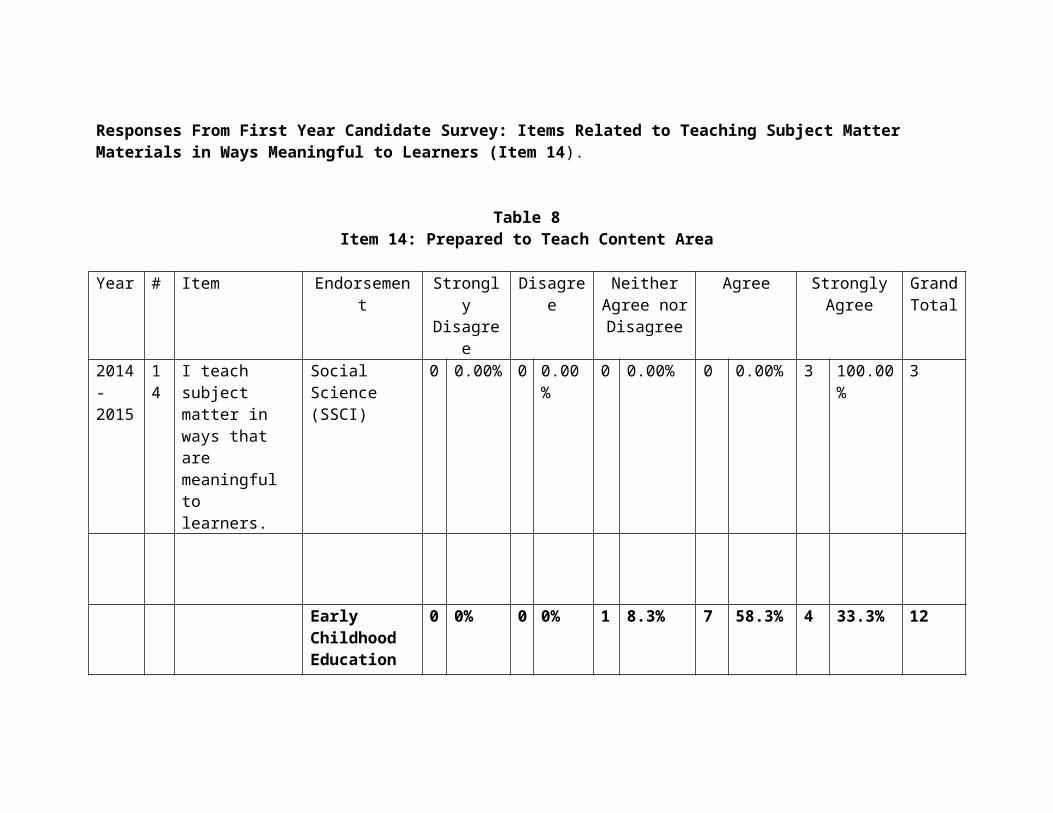
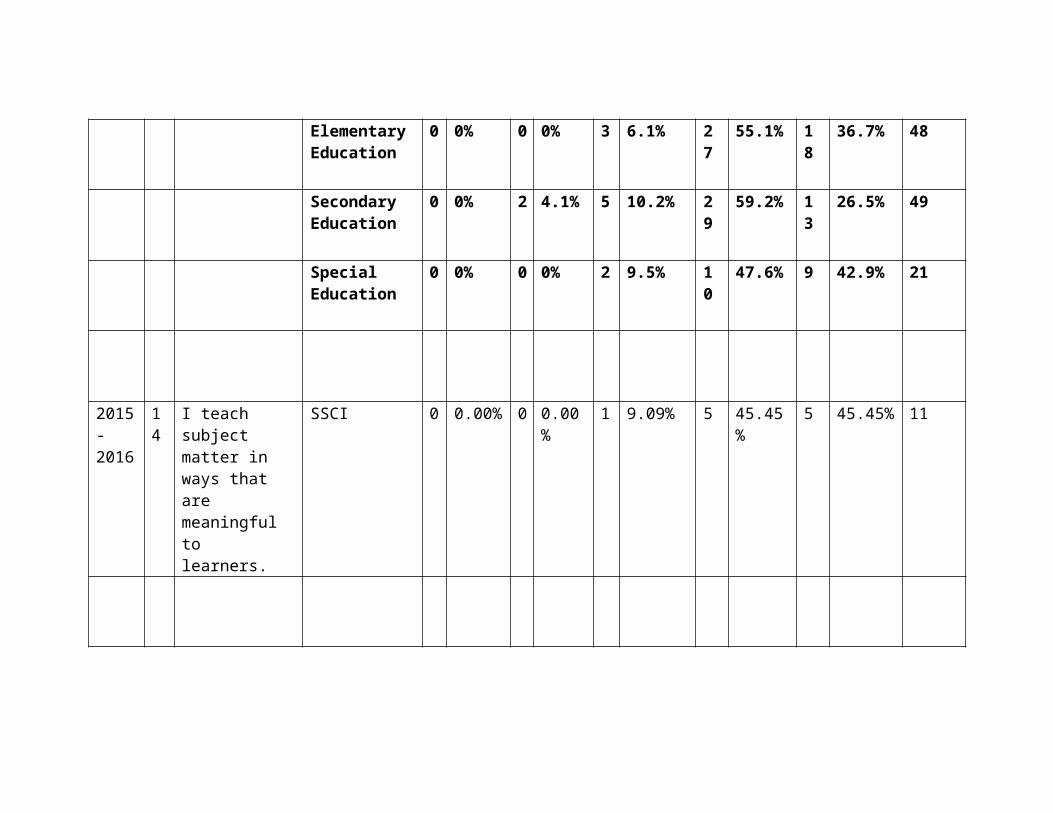
Responses From First Year Candidate Survey: Items Related to Teaching Subject Matter Materials in Ways Meaningful to Learners (Item 14).
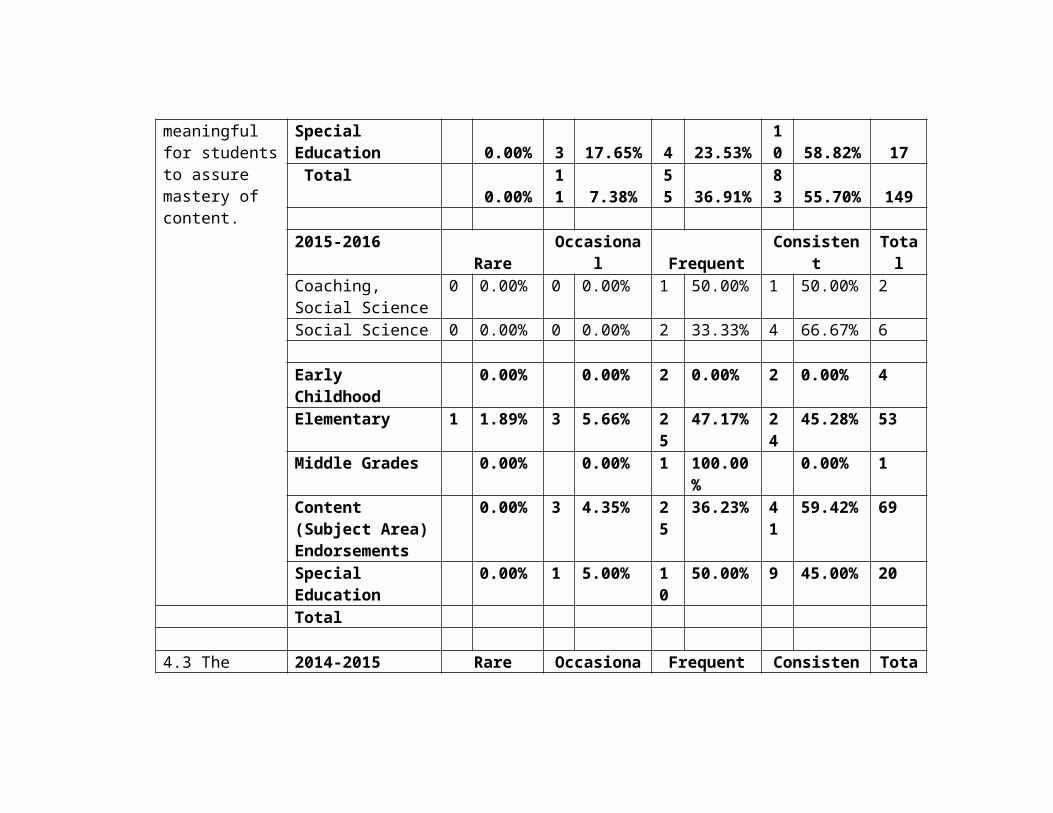
Table 8Item 14: Prepared to Teach Content Area
Year # Item Endorsemen
tStrongly Disagree
Disagree
Neither Agree nor Disagree
Agree Strongly Agree
Grand
Total2014 - 2015
14
I teach subject matter in ways that are meaningful to learners.
Social Science (SSCI)
0 0.00%
0 0.00%
0 0.00% 0 0.00% 3 100.00%
3
Early Childhood Education
0 0% 0 0% 1 8.3% 7 58.3% 4 33.3% 12
Elementary Education
0 0% 0 0% 3 6.1% 27
55.1% 18
36.7% 48
Secondary Education
0 0% 2 4.1% 5 10.2% 29
59.2% 13
26.5% 49
Special Education
0 0% 0 0% 2 9.5% 10
47.6% 9 42.9% 21
2015-2016
14
I teach subject matter in ways that are meaningful to learners.
SSCI 0 0.00% 0 0.00% 1 9.09% 5 45.45% 5 45.45% 11
Early Childhood Education
0 0.00% 0 0.00% 0 0.00% 4 50.00% 4 50.00% 8
Elementary Education
0 0.00% 0 0.00% 6 12.00% 26
52.00% 18 36.00% 50
Secondary Education
0 0.00% 0 0.00% 7 11.48% 40
65.57% 14 22.95% 61
Special Education
0 0.00% 0 0.00% 2 9.09% 13
59.09% 7 31.82% 22
Narrative:Data presented in the above tables indicate that Social Science students not only have strong content knowledge but that they are also able to apply the content in ways that are meaningful to learners. Data presented in Tables 7 and 8 indicate administrator responses show that all program completers were rated in the top two possible categories of the instrument. The candidates themselves also believe that they are able to teach content in a meaningful way. Program completers appear to be quite capable of engaging students in critical thinking, in helping their students connect concepts across disciplines, and can teach their subject matter in ways that are meaningful to their own students.
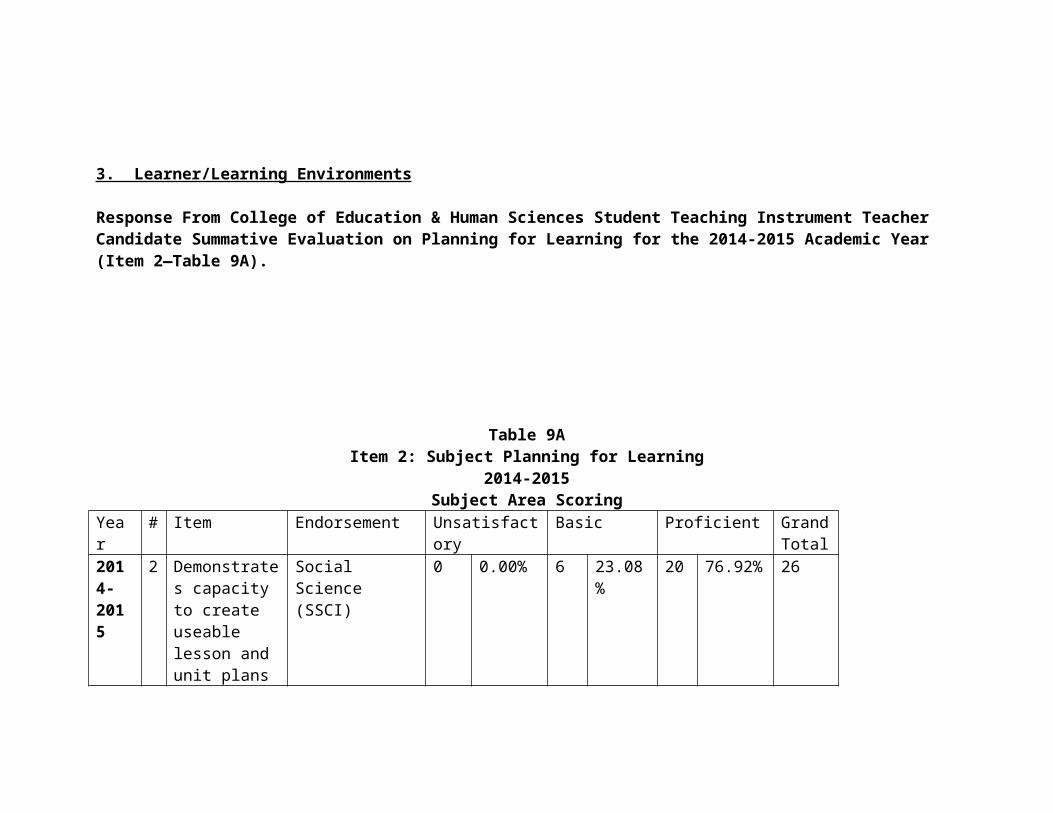
3. Learner/Learning Environments
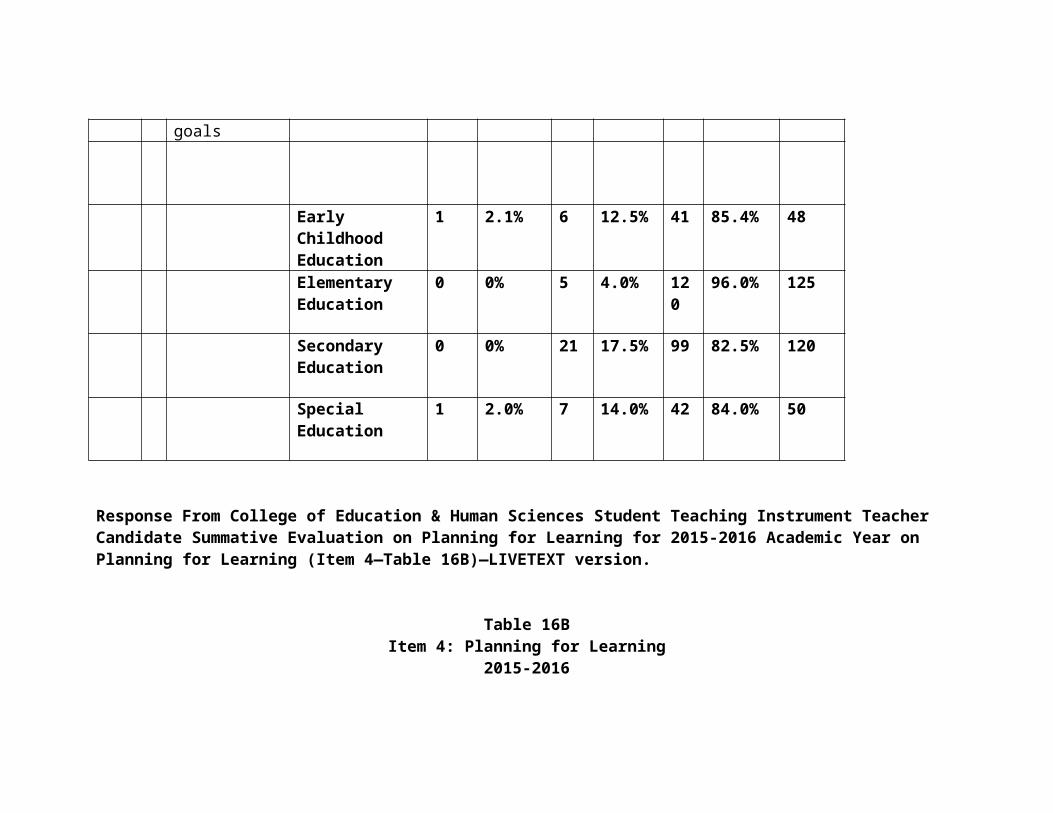
Response From College of Education & Human Sciences Student Teaching Instrument Teacher Candidate Summative Evaluation on Planning for Learning for the 2014-2015 Academic Year (Item 2—Table 9A).
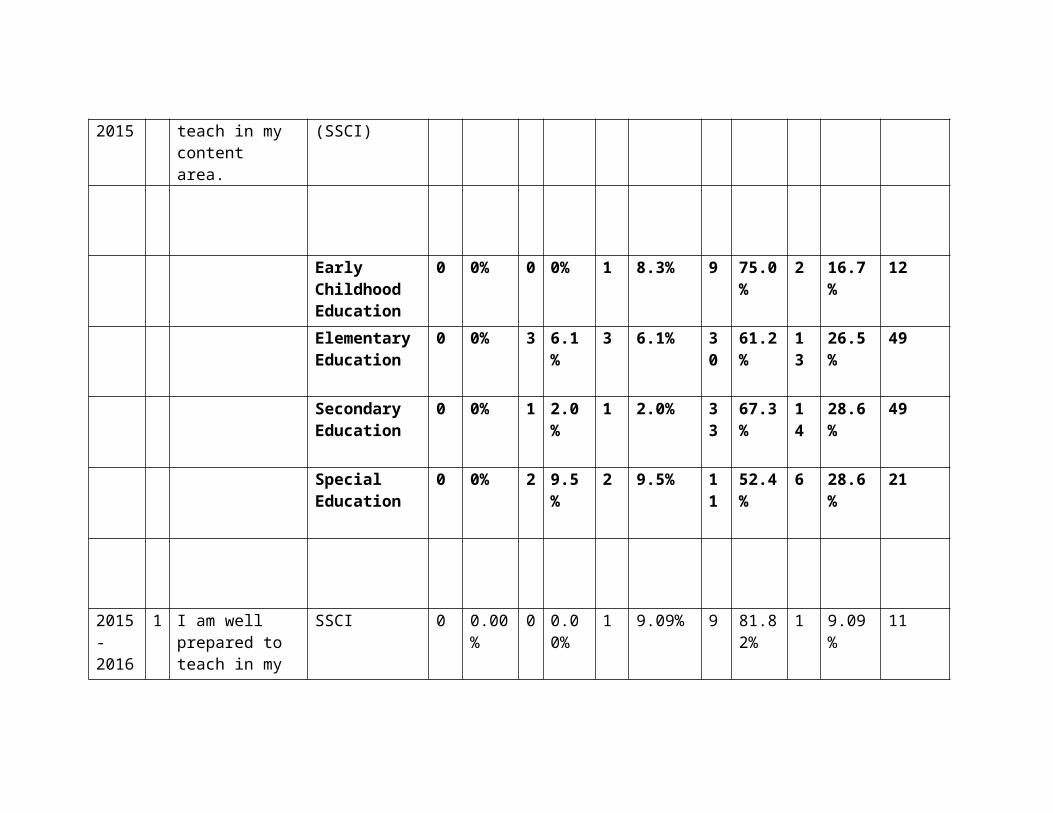
Table 9AItem 2: Subject Planning for Learning
2014-2015Subject Area Scoring
Year # Item Endorsement Unsatisfactory
Basic Proficient Grand Total
2014- 2015
2 Demonstrates capacity to create useable lesson and unit plans that are based upon knowledge of the discipline, students, and curricular goals
Social Science (SSCI)
0 0.00% 6 23.08% 20 76.92% 26
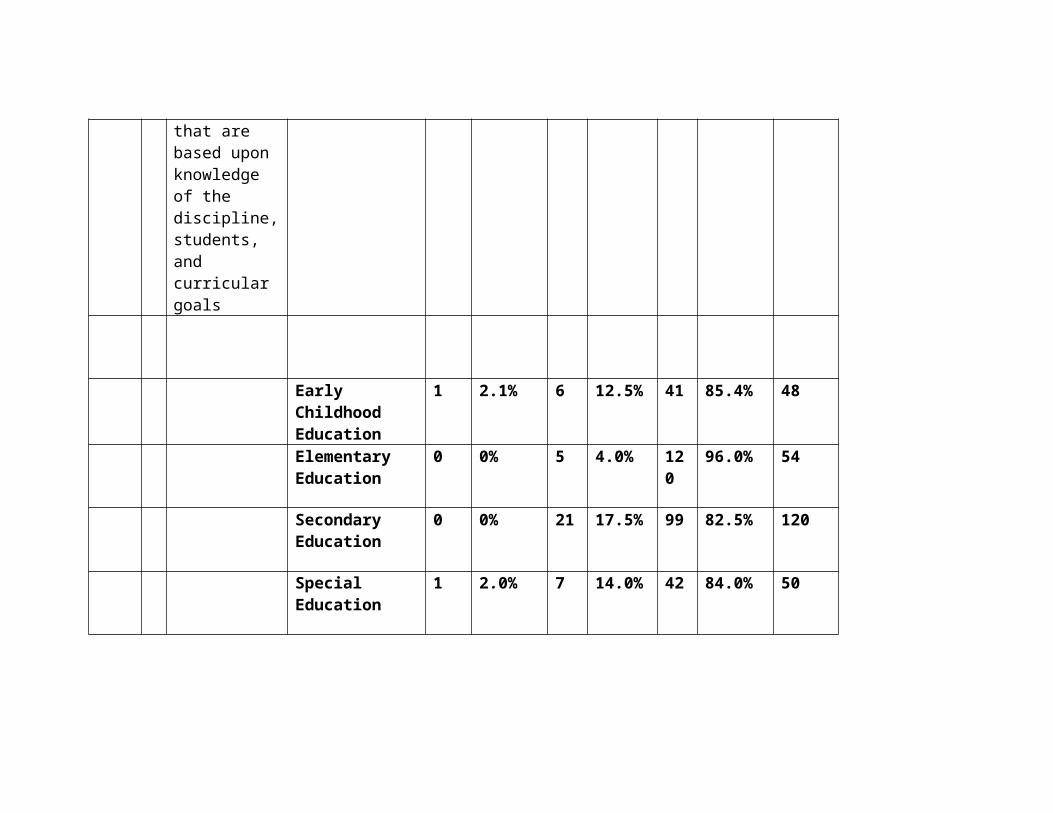
Early Childhood Education
1 2.1% 6 12.5% 41 85.4% 48
Elementary Education
0 0% 5 4.0% 120
96.0% 54
Secondary Education
0 0% 21 17.5% 99 82.5% 120
Special Education
1 2.0% 7 14.0% 42 84.0% 50
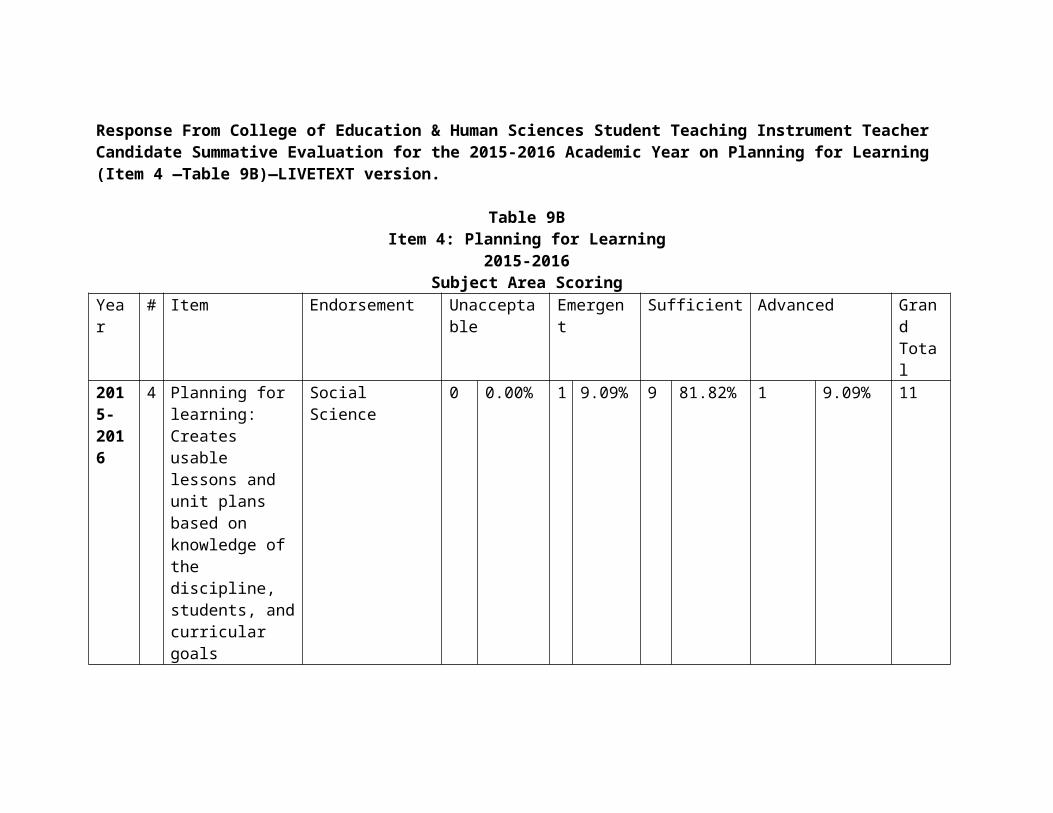
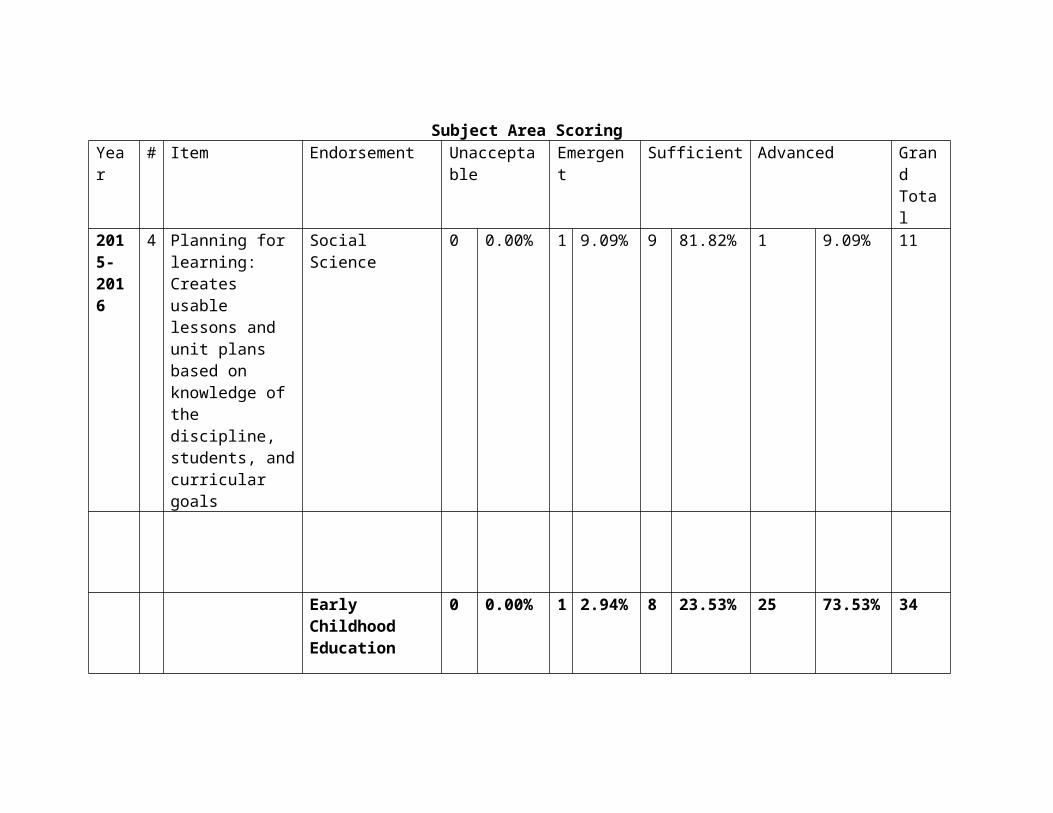
Response From College of Education & Human Sciences Student Teaching Instrument Teacher Candidate Summative Evaluation for the 2015-2016 Academic Year on Planning for Learning (Item 4 —Table 9B)—LIVETEXT version.
Table 9BItem 4: Planning for Learning
2015-2016Subject Area Scoring
Year
# Item Endorsement Unacceptable
Emergent
Sufficient Advanced Grand Total
2015- 2016
4 Planning for learning:Creates usable lessons and unit plans based on knowledge of
Social Science 0 0.00% 1 9.09% 9 81.82% 1 9.09% 11
the discipline, students, and curricular goals
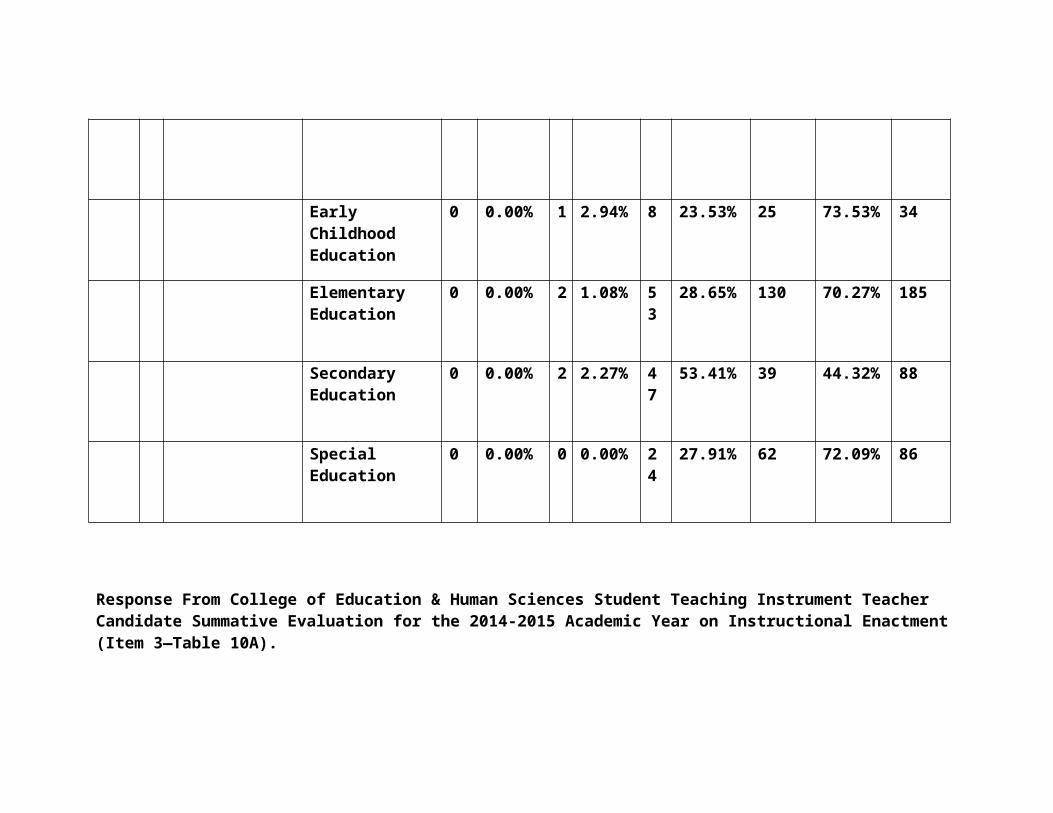
Early Childhood Education
0 0.00% 1 2.94% 8 23.53% 25 73.53% 34
Elementary Education
0 0.00% 2 1.08% 53
28.65% 130 70.27% 185
Secondary Education
0 0.00% 2 2.27% 47
53.41% 39 44.32% 88
Special Education
0 0.00% 0 0.00% 24
27.91% 62 72.09% 86

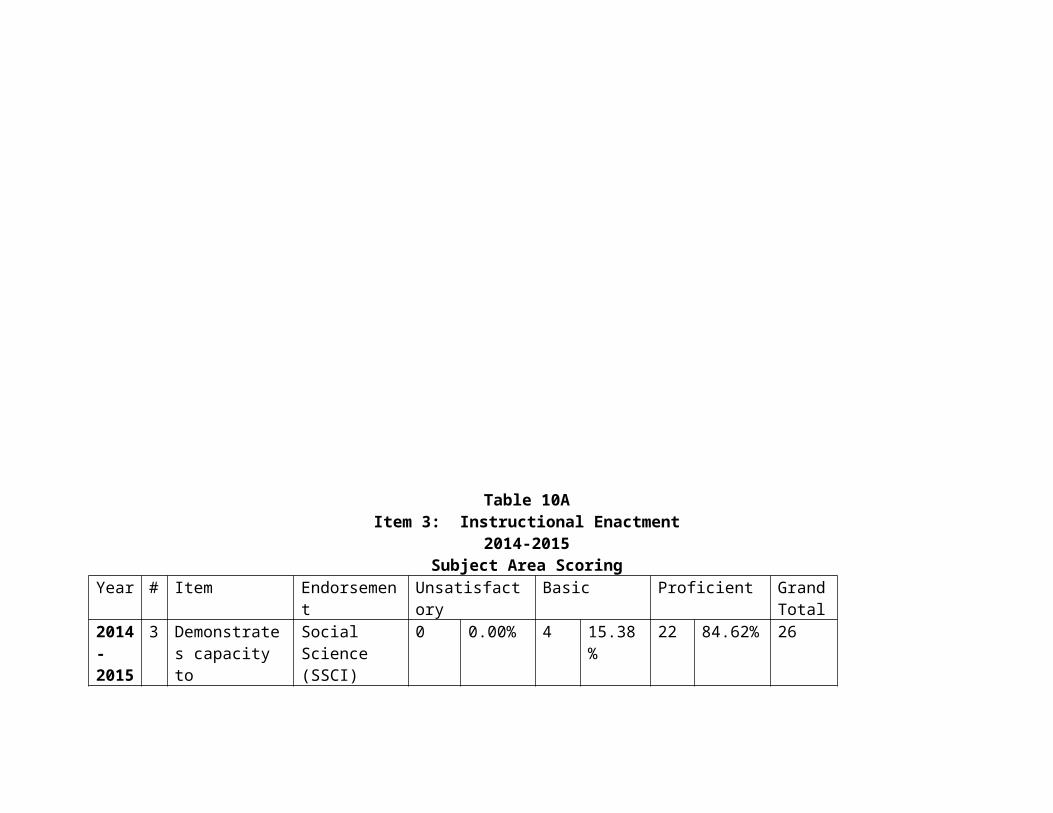
Response From College of Education & Human Sciences Student Teaching Instrument Teacher Candidate Summative Evaluation for the 2014-2015 Academic Year on Instructional Enactment (Item 3—Table 10A).
Table 10AItem 3: Instructional Enactment
2014-2015Subject Area Scoring
Year # Item Endorsement
Unsatisfactory
Basic Proficient Grand Total
2014- 201
3 Demonstrates capacity to implement,
Social Science (SSCI)
0 0.00% 4 15.38% 22 84.62% 26
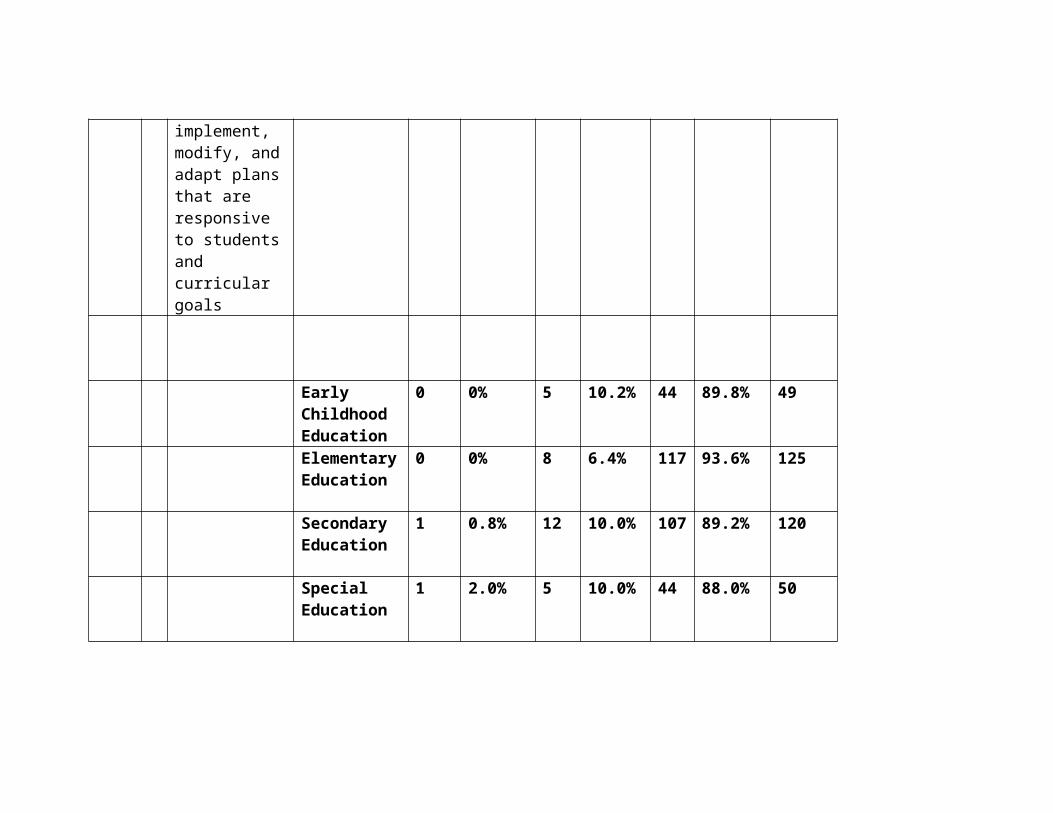
5 modify, and adapt plans that are responsive to students and curricular goals
Early Childhood Education
0 0% 5 10.2% 44 89.8% 49
Elementary Education
0 0% 8 6.4% 117
93.6% 125
Secondary Education
1 0.8% 12 10.0% 107
89.2% 120
Special Education
1 2.0% 5 10.0% 44 88.0% 50
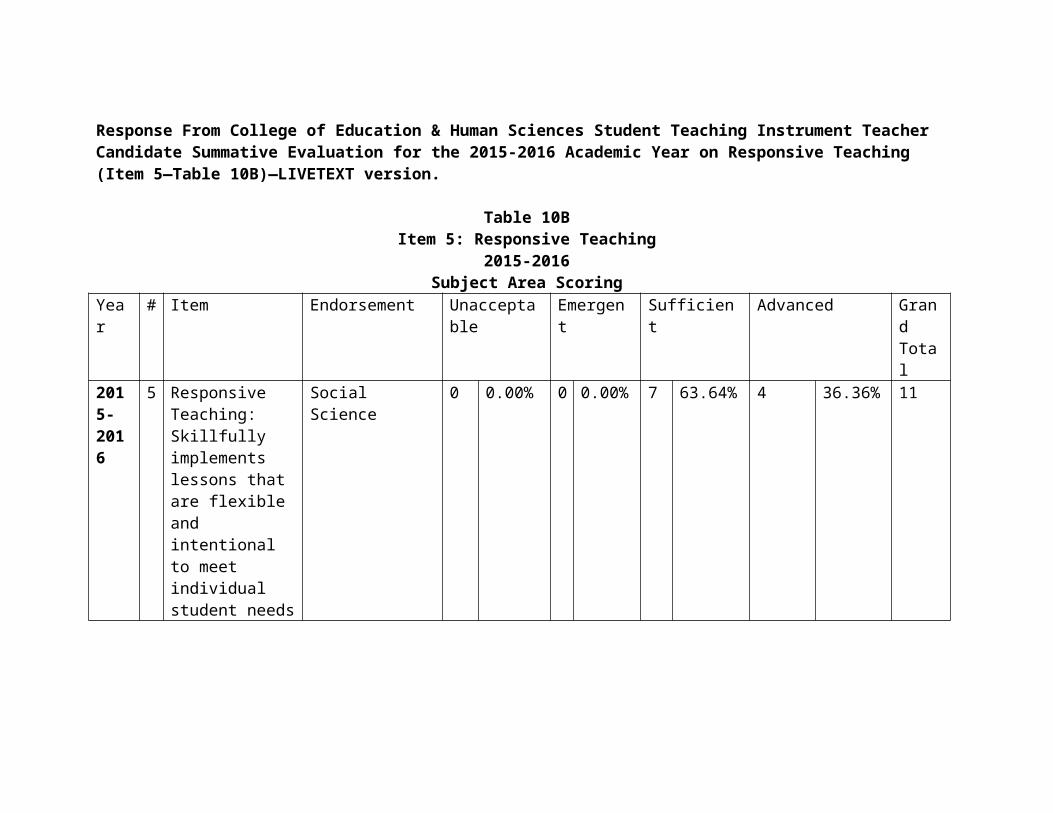
Response From College of Education & Human Sciences Student Teaching Instrument Teacher Candidate Summative Evaluation for the 2015-2016 Academic Year on Responsive Teaching (Item 5—Table 10B)—LIVETEXT version.
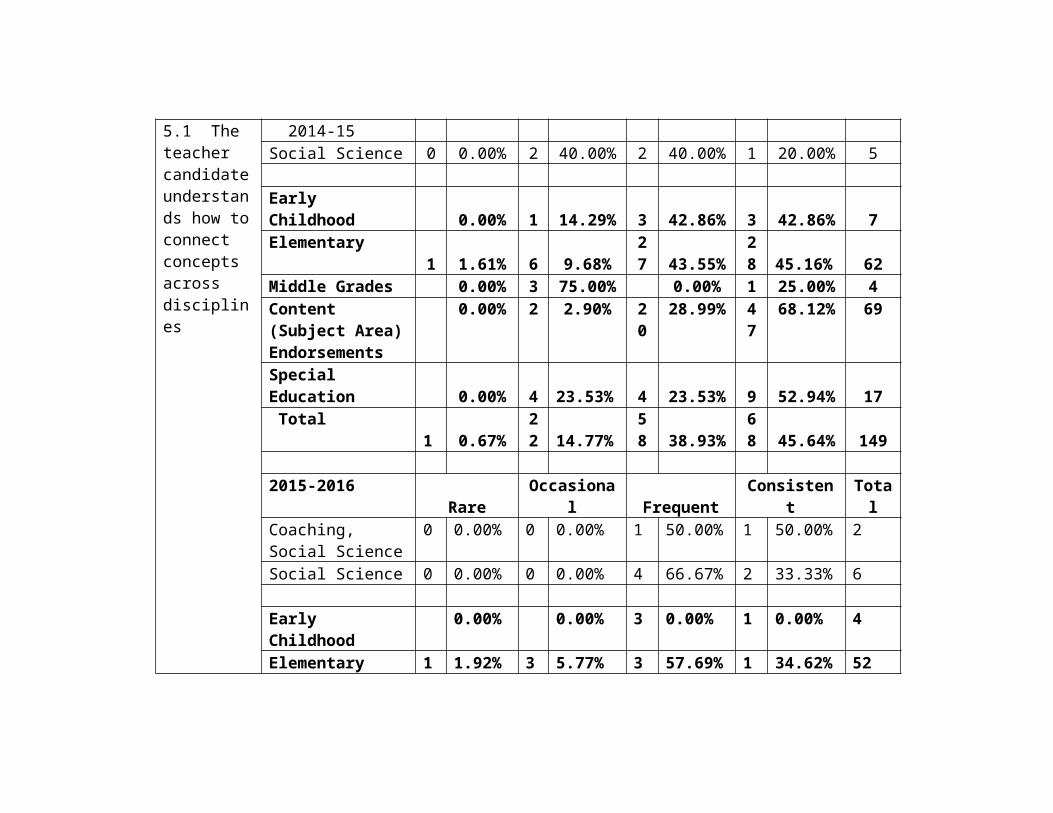
Table 10BItem 5: Responsive Teaching
2015-2016Subject Area Scoring
Year
# Item Endorsement Unacceptable
Emergent
Sufficient Advanced Grand Total
2015- 2016
5 Responsive Teaching:Skillfully implements lessons that are flexible and intentional to meet individual student needs
Social Science 0 0.00% 0 0.00% 7 63.64% 4 36.36% 11
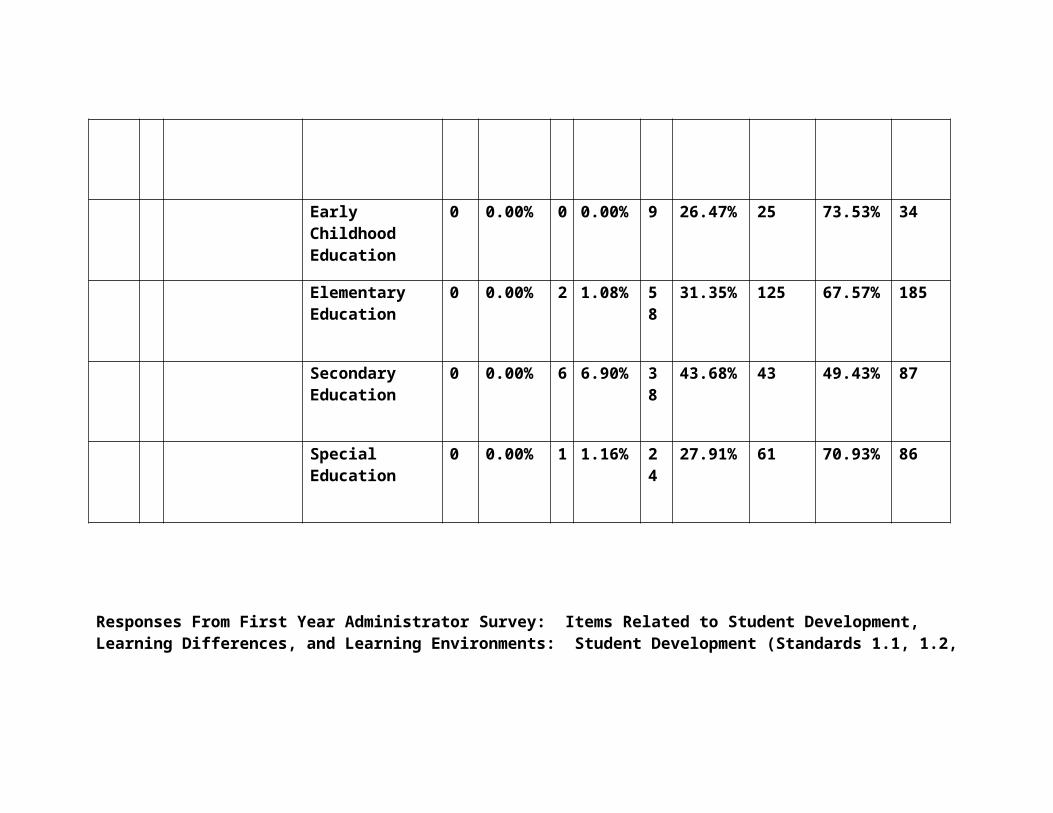
Early Childhood Education
0 0.00% 0 0.00% 9 26.47% 25 73.53% 34
Elementary Education
0 0.00% 2 1.08% 58
31.35% 125 67.57% 185
Secondary Education
0 0.00% 6 6.90% 38
43.68% 43 49.43% 87
Special Education
0 0.00% 1 1.16% 24
27.91% 61 70.93% 86
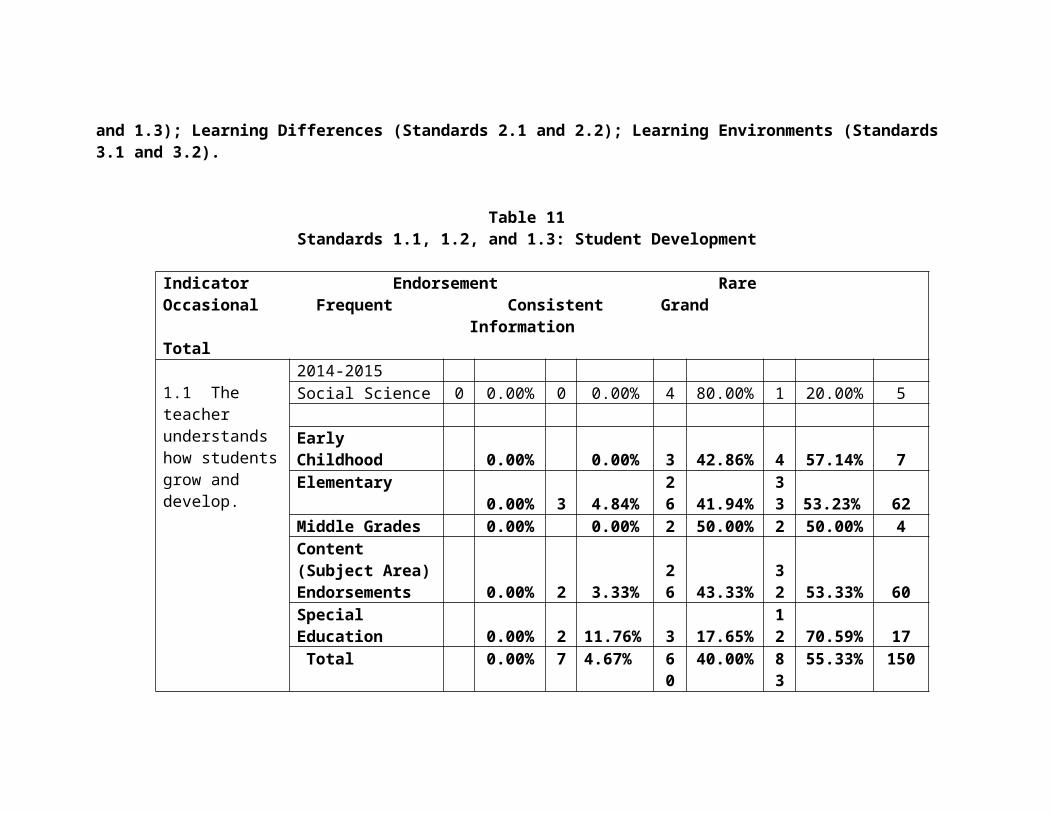
Responses From First Year Administrator Survey: Items Related to Student Development, Learning Differences, and Learning Environments: Student Development (Standards 1.1, 1.2, and 1.3); Learning Differences (Standards 2.1 and 2.2); Learning Environments (Standards 3.1 and 3.2).
Table 11Standards 1.1, 1.2, and 1.3: Student Development
Indicator Endorsement Rare Occasional Frequent Consistent Grand Information Total
1.1 The teacher understands
2014-2015Social Science 0 0.00% 0 0.00% 4 80.00% 1 20.00% 5
Early 0.00% 0.00% 3 42.86% 4 57.14% 7
how students grow and develop.
ChildhoodElementary 0.00% 3 4.84% 26 41.94% 33 53.23% 62Middle Grades 0.00% 0.00% 2 50.00% 2 50.00% 4Content (Subject Area) Endorsements 0.00% 2 3.33% 26 43.33% 32 53.33% 60Special Education 0.00% 2 11.76% 3 17.65% 12 70.59% 17 Total 0.00% 7 4.67% 60 40.00% 83 55.33% 150
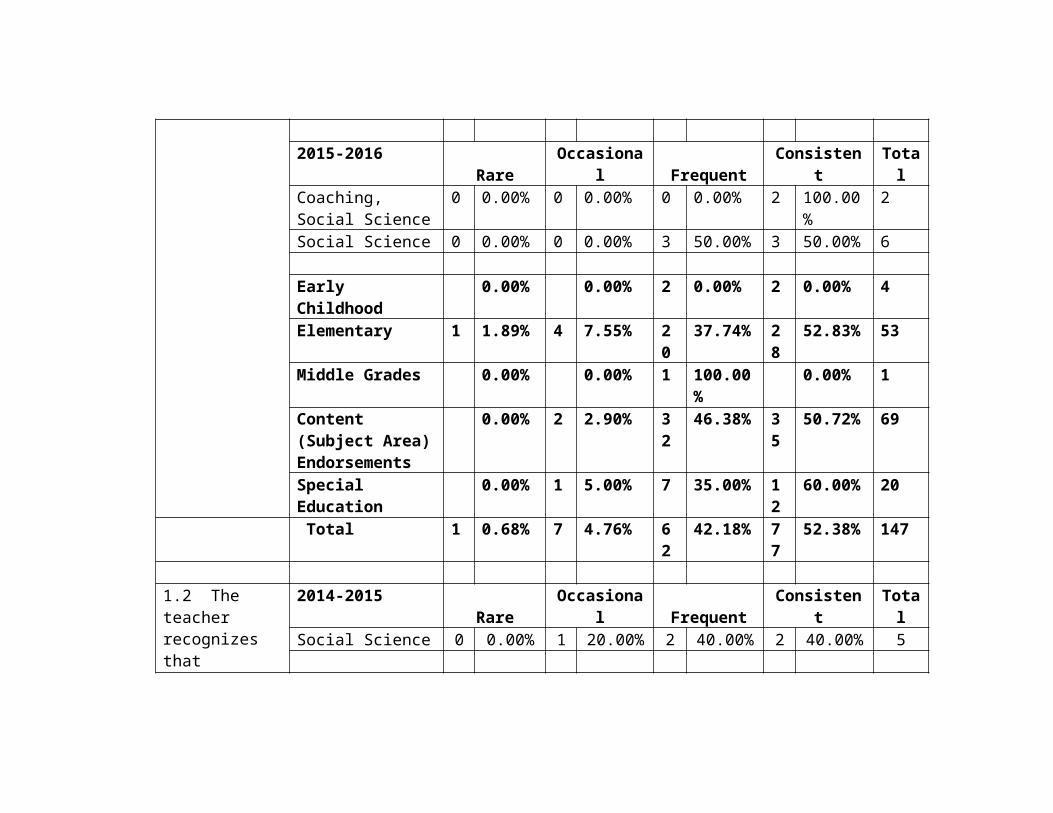
2015-2016 Rare Occasional Frequent Consistent TotalCoaching, Social Science
0 0.00% 0 0.00% 0 0.00% 2 100.00% 2
Social Science 0 0.00% 0 0.00% 3 50.00% 3 50.00% 6
Early Childhood 0.00% 0.00% 2 0.00% 2 0.00% 4Elementary 1 1.89% 4 7.55% 20 37.74% 28 52.83% 53Middle Grades 0.00% 0.00% 1 100.00% 0.00% 1Content (Subject Area) Endorsements
0.00% 2 2.90% 32 46.38% 35 50.72% 69
Special Education 0.00% 1 5.00% 7 35.00% 12 60.00% 20 Total 1 0.68% 7 4.76% 62 42.18% 77 52.38% 147
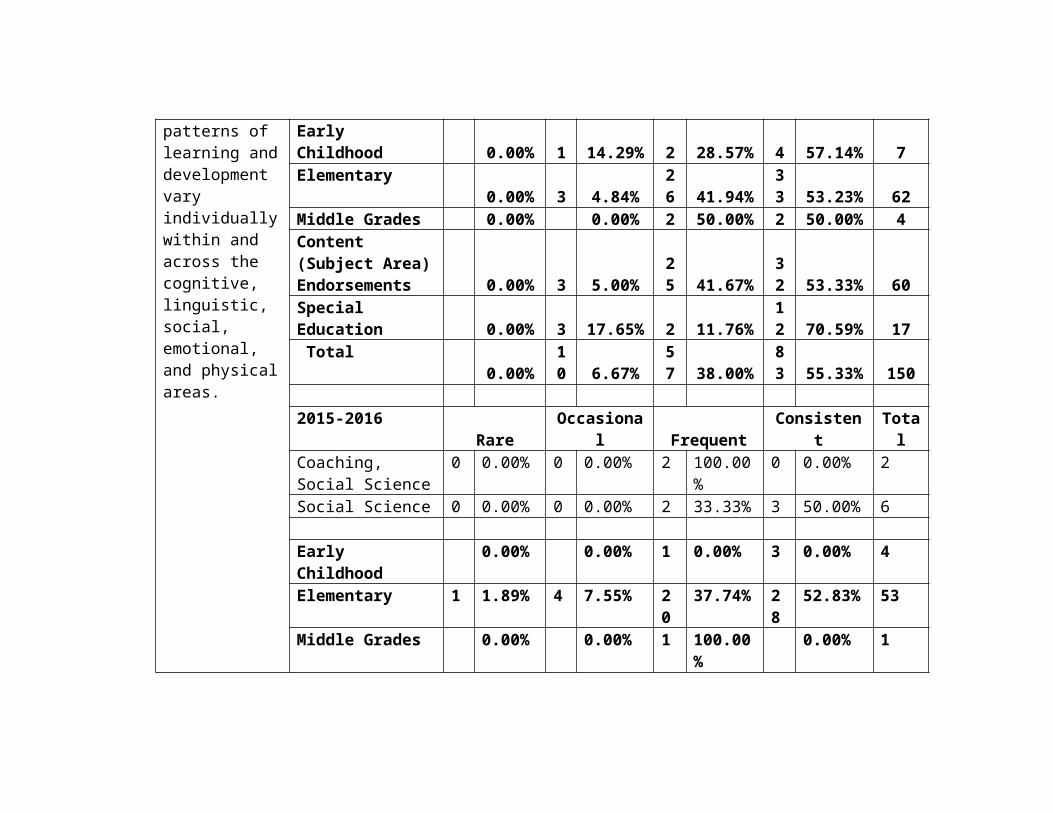
1.2 The teacher recognizes that patterns of learning
2014-2015 Rare Occasional Frequent Consistent TotalSocial Science 0 0.00% 1 20.00% 2 40.00% 2 40.00% 5
Early Childhood
0.00% 1 14.29% 2 28.57% 4 57.14% 7
and development vary individually within and across the cognitive, linguistic, social, emotional, and physical areas.
Elementary 0.00% 3 4.84% 26 41.94% 33 53.23% 62Middle Grades 0.00% 0.00% 2 50.00% 2 50.00% 4Content (Subject Area) Endorsements 0.00% 3 5.00% 25 41.67% 32 53.33% 60Special Education 0.00% 3 17.65% 2 11.76% 12 70.59% 17 Total 0.00% 10 6.67% 57 38.00% 83 55.33% 150
2015-2016 Rare Occasional Frequent Consistent TotalCoaching, Social Science
0 0.00% 0 0.00% 2 100.00% 0 0.00% 2
Social Science 0 0.00% 0 0.00% 2 33.33% 3 50.00% 6
Early Childhood 0.00% 0.00% 1 0.00% 3 0.00% 4Elementary 1 1.89% 4 7.55% 20 37.74% 28 52.83% 53Middle Grades 0.00% 0.00% 1 100.00% 0.00% 1Content (Subject Area) Endorsements
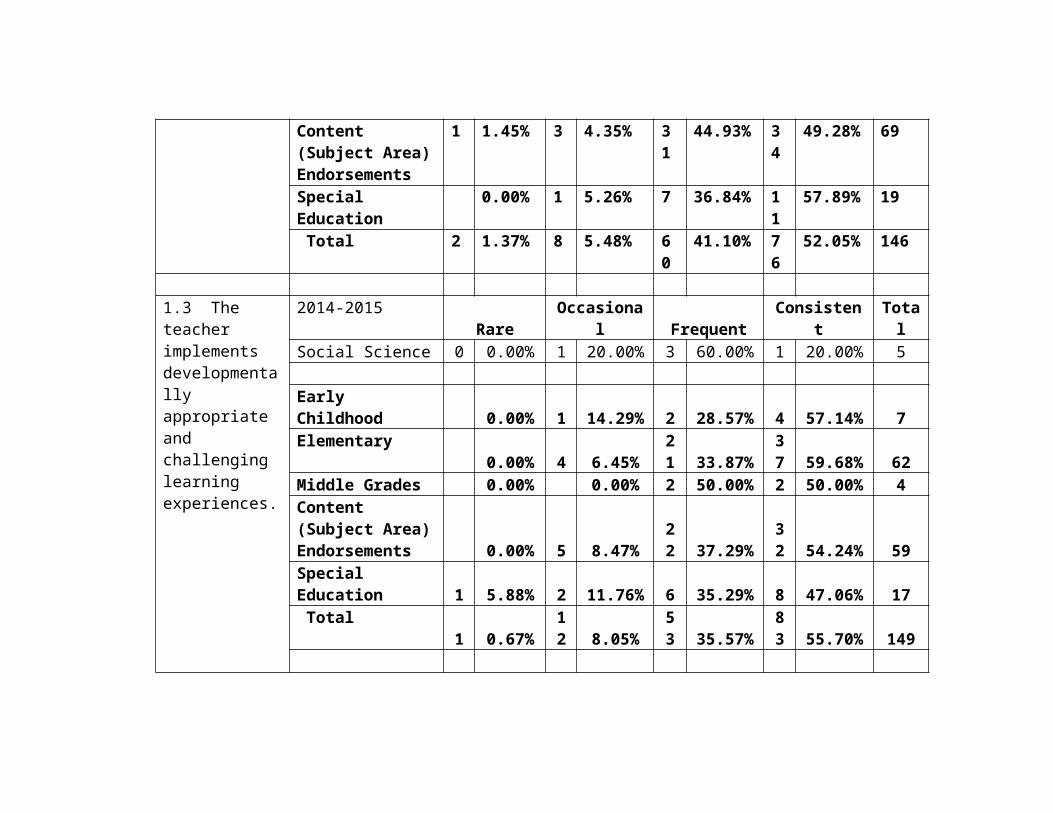
1 1.45% 3 4.35% 31 44.93% 34 49.28% 69
Special Education 0.00% 1 5.26% 7 36.84% 11 57.89% 19 Total 2 1.37% 8 5.48% 60 41.10% 76 52.05% 146
1.3 The teacher implements developmentally appropriate and challenging
2014-2015 Rare Occasional Frequent Consistent TotalSocial Science 0 0.00% 1 20.00% 3 60.00% 1 20.00% 5
Early Childhood 0.00% 1 14.29% 2 28.57% 4 57.14% 7Elementary 0.00% 4 6.45% 21 33.87% 37 59.68% 62Middle Grades 0.00% 0.00% 2 50.00% 2 50.00% 4
learning experiences.
Content (Subject Area) Endorsements 0.00% 5 8.47% 22 37.29% 32 54.24% 59Special Education 1 5.88% 2 11.76% 6 35.29% 8 47.06% 17 Total 1 0.67% 12 8.05% 53 35.57% 83 55.70% 149
2015-2016 Rare Occasional Frequent Consistent TotalCoaching, Social Science
0 0.00% 0 0.00% 1 50.00% 1 50.00% 2
Social Science 0 0.00% 0 0.00% 2 33.33% 4 66.67% 6
Early Childhood 0.00% 0.00% 2 0.00% 2 0.00% 4Elementary 1 1.89% 6 11.32% 16 30.19% 30 56.60% 53Middle Grades 0.00% 0.00% 1 100.00% 0.00% 1Content (Subject Area) Endorsements
0.00% 5 7.25% 25 36.23% 39 56.52% 69
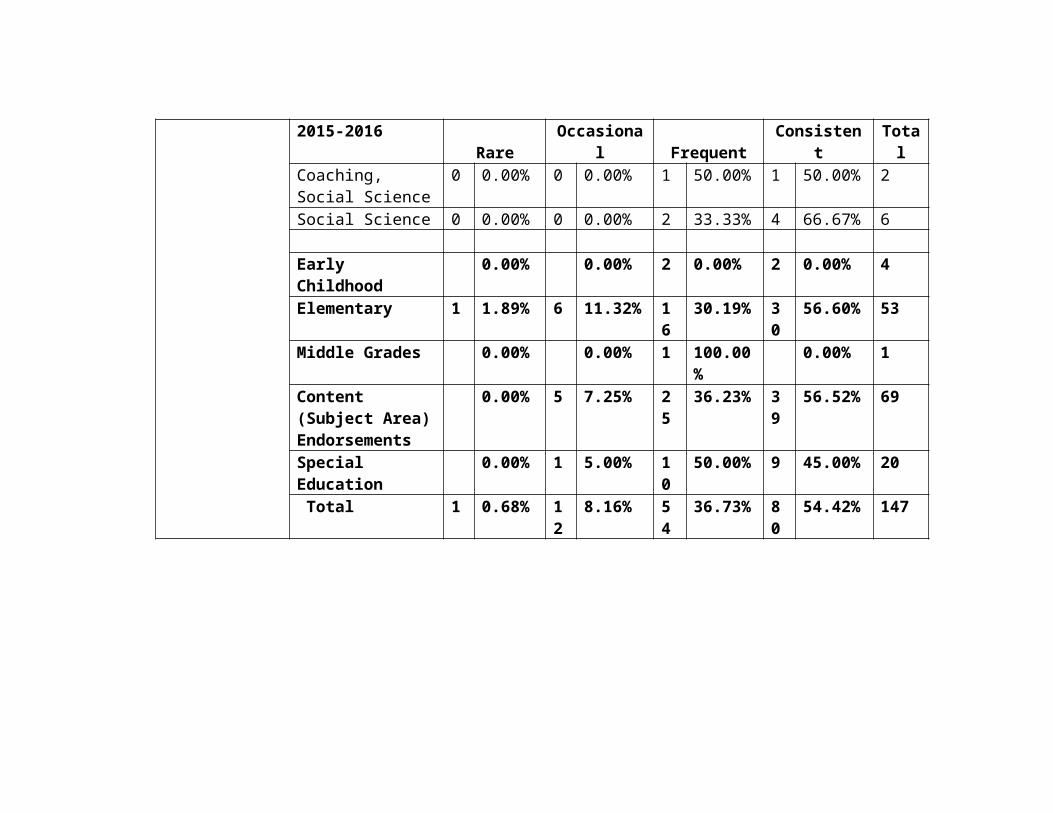
Special Education 0.00% 1 5.00% 10 50.00% 9 45.00% 20 Total 1 0.68% 12 8.16% 54 36.73% 80 54.42% 147
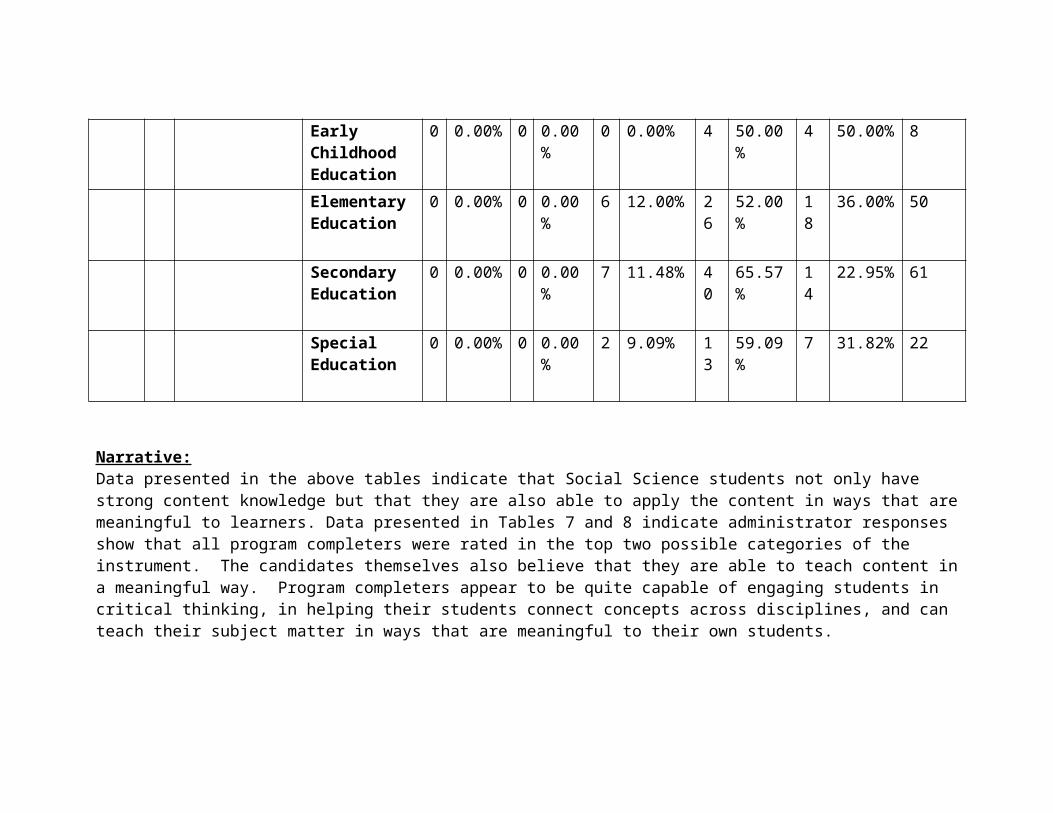
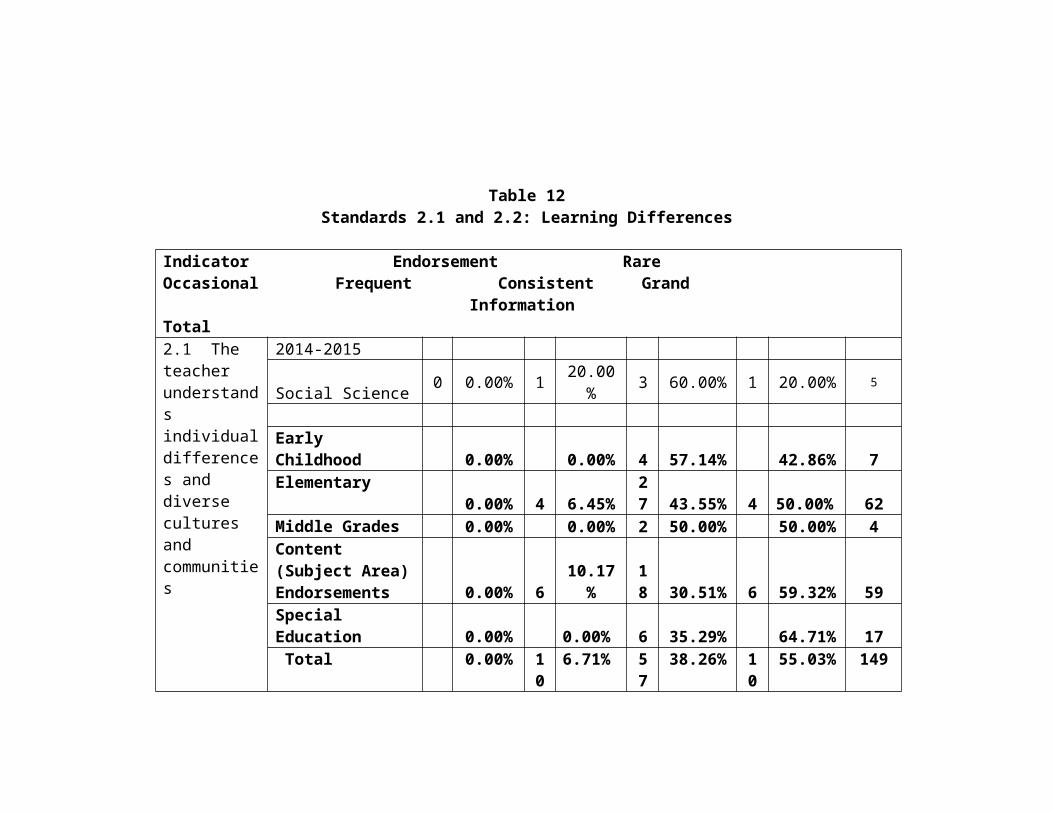
Table 12Standards 2.1 and 2.2: Learning Differences
Indicator Endorsement Rare Occasional Frequent Consistent Grand Information Total2.1 The teacher understands individual differences and diverse cultures and communities
2014-2015Social Science 0 0.00% 1 20.00% 3 60.00% 1 20.00% 5
Early Childhood 0.00% 0.00% 4 57.14% 42.86% 7Elementary 0.00% 4 6.45% 27 43.55% 4 50.00% 62Middle Grades 0.00% 0.00% 2 50.00% 50.00% 4Content (Subject Area) Endorsements 0.00% 6 10.17% 18 30.51% 6 59.32% 59Special Education 0.00% 0.00% 6 35.29% 64.71% 17 Total 0.00% 10 6.71% 57 38.26% 10 55.03% 149
2015-2016 Rare Occasional Frequent Consistent TotalCoaching, Social Science
0 0.00% 0 0.00% 1 50.00% 1 50.00% 2
Social Science 0 0.00% 0 0.00% 4 66.67% 2 33.33% 6
Early Childhood 0.00% 0.00% 2 0.00% 2 0.00% 4Elementary 1 1.89% 5 9.43% 14 26.42% 33 62.26% 53Middle Grades 0.00% 0.00% 1 100.00% 0.00% 1
Content (Subject Area) Endorsements
0.00% 7 10.14% 25 36.23% 37 53.62% 69
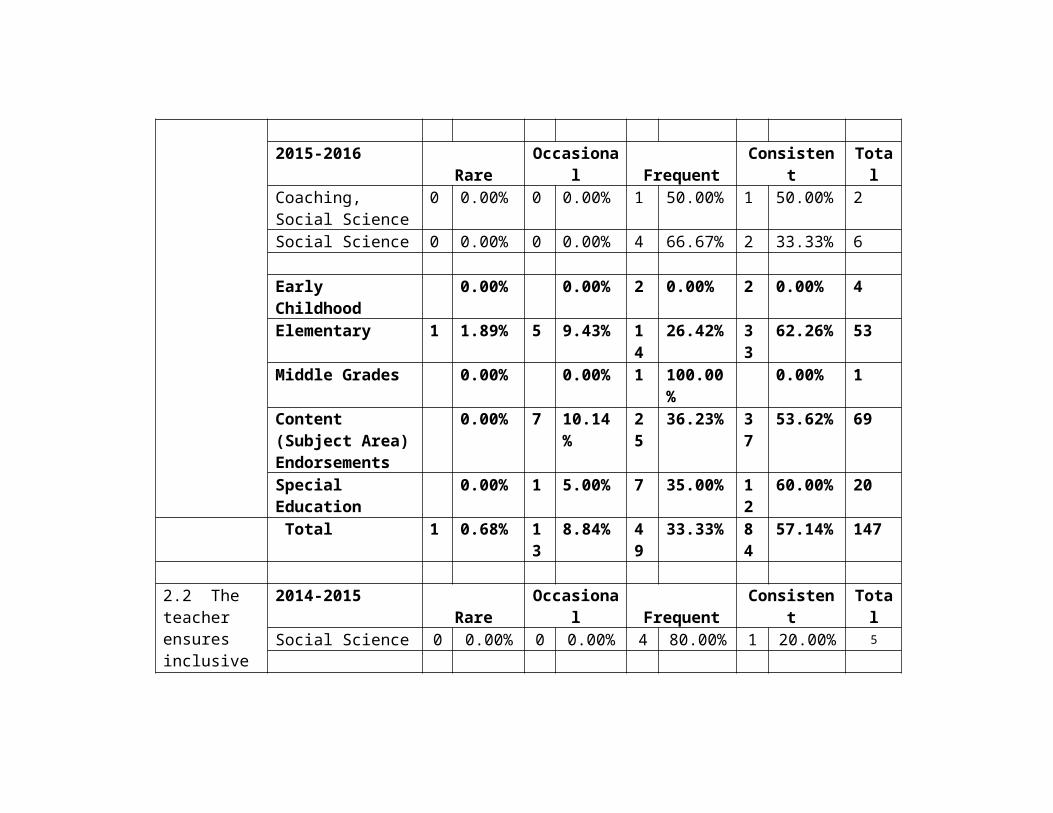
Special Education 0.00% 1 5.00% 7 35.00% 12 60.00% 20 Total 1 0.68% 13 8.84% 49 33.33% 84 57.14% 147
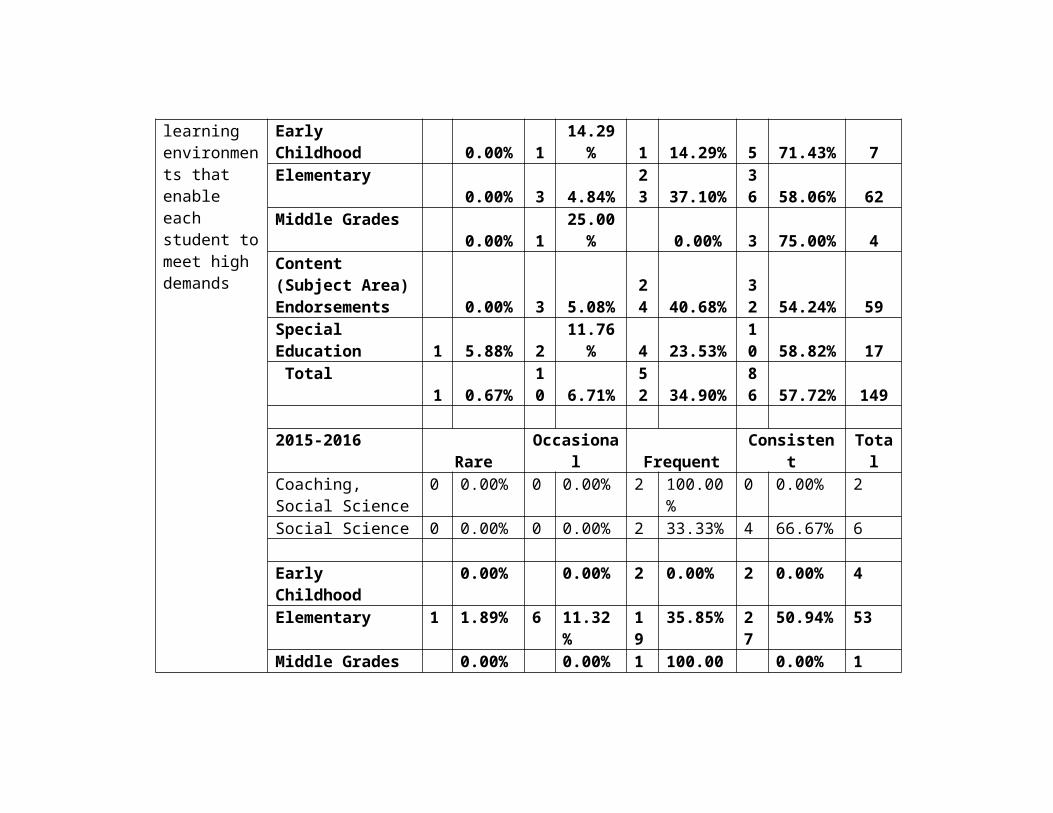
2.2 The teacher ensures inclusive learning environments that enable each student to meet high demands
2014-2015 Rare Occasional Frequent Consistent TotalSocial Science 0 0.00% 0 0.00% 4 80.00% 1 20.00% 5
Early Childhood 0.00% 1 14.29% 1 14.29% 5 71.43% 7Elementary 0.00% 3 4.84% 23 37.10% 36 58.06% 62Middle Grades 0.00% 1 25.00% 0.00% 3 75.00% 4Content (Subject Area) Endorsements 0.00% 3 5.08% 24 40.68% 32 54.24% 59Special Education 1 5.88% 2 11.76% 4 23.53% 10 58.82% 17 Total 1 0.67% 10 6.71% 52 34.90% 86 57.72% 149
2015-2016 Rare Occasional Frequent Consistent TotalCoaching, Social Science
0 0.00% 0 0.00% 2 100.00% 0 0.00% 2
Social Science 0 0.00% 0 0.00% 2 33.33% 4 66.67% 6
Early Childhood 0.00% 0.00% 2 0.00% 2 0.00% 4Elementary 1 1.89% 6 11.32% 19 35.85% 27 50.94% 53Middle Grades 0.00% 0.00% 1 100.00% 0.00% 1Content (Subject Area) Endorsements
0.00% 5 7.25% 26 37.68% 38 55.07% 69
Special Education 0.00% 1 5.00% 5 25.00% 14 70.00% 20 Total 1 0.68% 12 8.16% 53 36.05% 81 55.10% 147
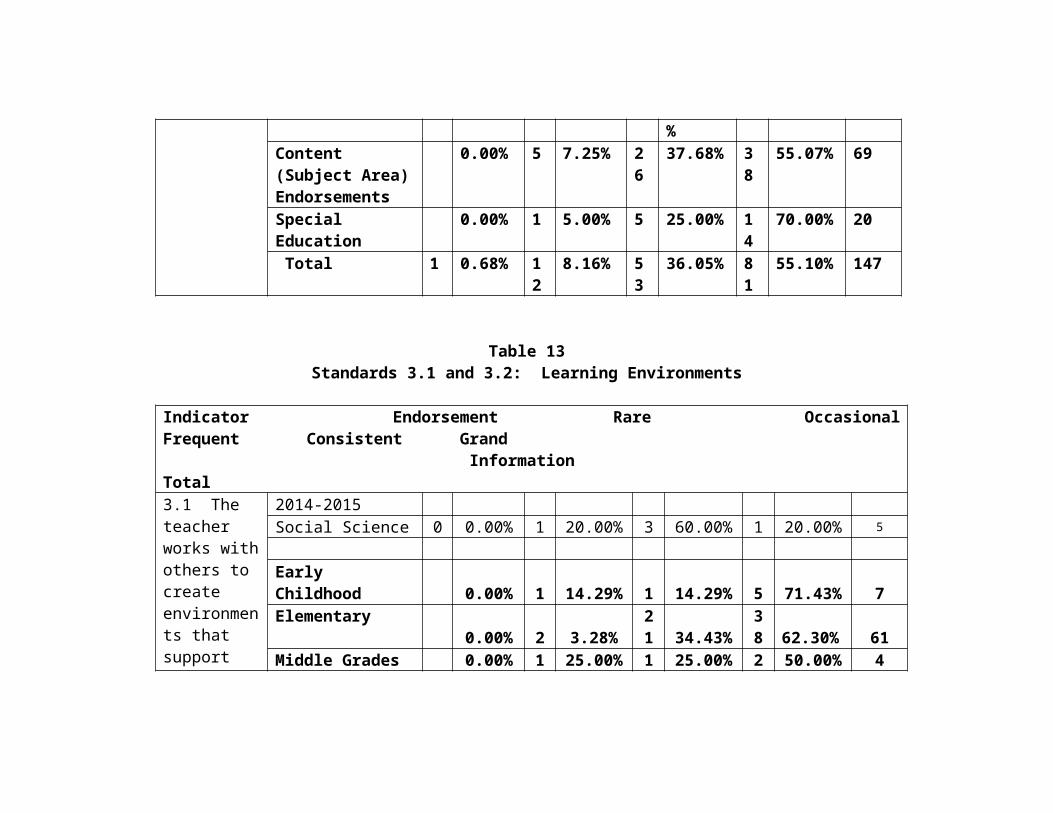
Table 13Standards 3.1 and 3.2: Learning Environments
Indicator Endorsement Rare Occasional Frequent Consistent Grand Information Total3.1 The teacher works with others to create environments that support individual and collaborative learning.
2014-2015Social Science 0 0.00% 1 20.00% 3 60.00% 1 20.00% 5
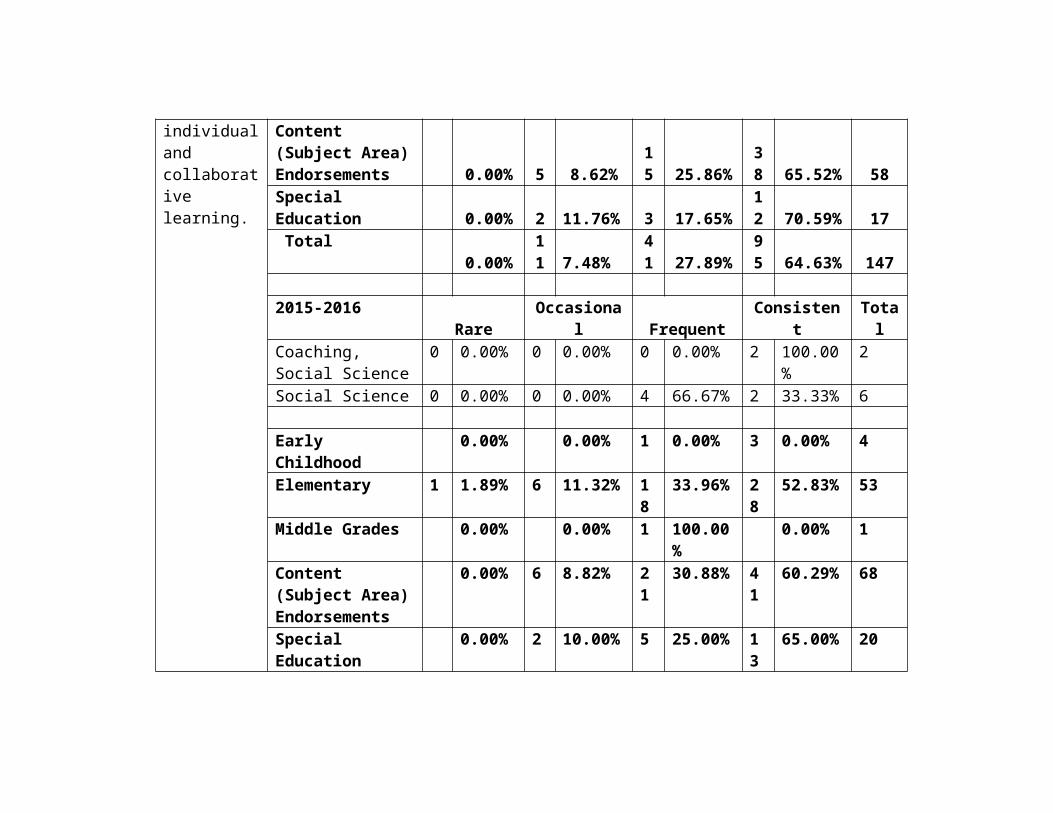
Early Childhood 0.00% 1 14.29% 1 14.29% 5 71.43% 7Elementary 0.00% 2 3.28% 21 34.43% 38 62.30% 61Middle Grades 0.00% 1 25.00% 1 25.00% 2 50.00% 4Content (Subject Area) Endorsements 0.00% 5 8.62% 15 25.86% 38 65.52% 58Special Education 0.00% 2 11.76% 3 17.65% 12 70.59% 17 Total 0.00% 11 7.48% 41 27.89% 95 64.63% 147
2015-2016 Rare Occasional Frequent Consistent TotalCoaching, Social Science
0 0.00% 0 0.00% 0 0.00% 2 100.00% 2
Social Science 0 0.00% 0 0.00% 4 66.67% 2 33.33% 6
Early Childhood 0.00% 0.00% 1 0.00% 3 0.00% 4Elementary 1 1.89% 6 11.32% 18 33.96% 28 52.83% 53Middle Grades 0.00% 0.00% 1 100.00% 0.00% 1Content (Subject Area) Endorsements
0.00% 6 8.82% 21 30.88% 41 60.29% 68
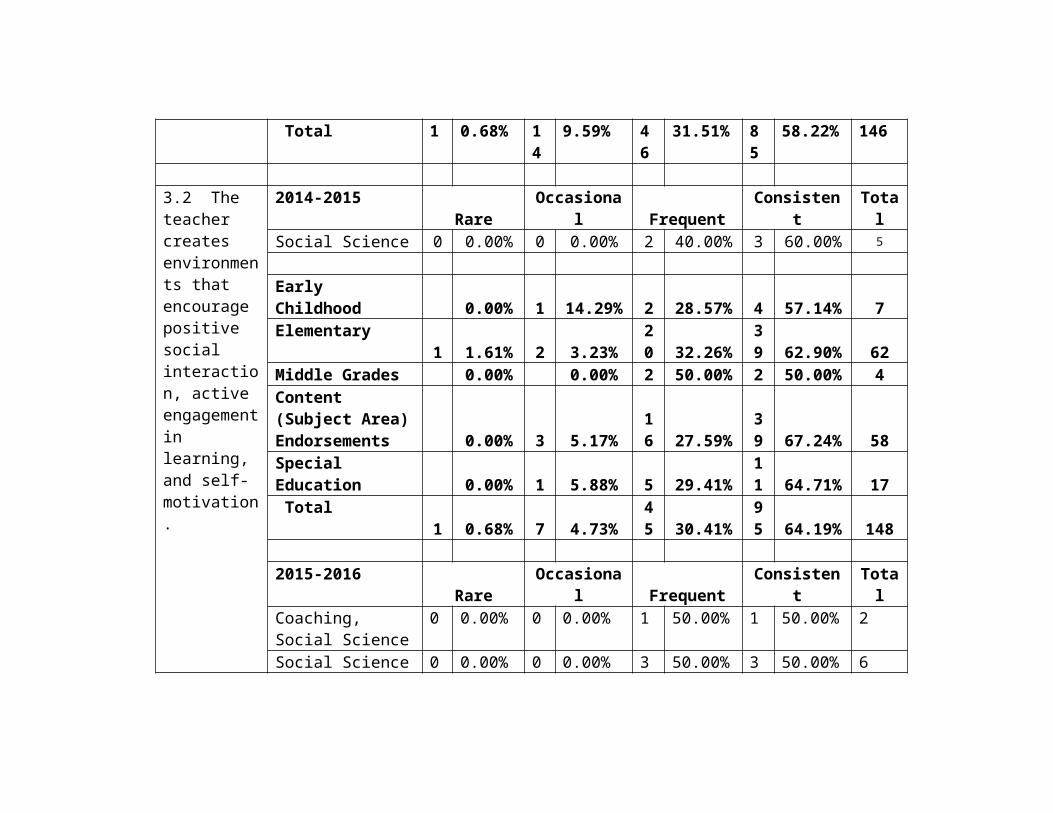
Special Education 0.00% 2 10.00% 5 25.00% 13 65.00% 20 Total 1 0.68% 14 9.59% 46 31.51% 85 58.22% 146
3.2 The teacher creates environments that encourage positive social interaction, active engagement in learning, and self-motivation.
2014-2015 Rare Occasional Frequent Consistent TotalSocial Science 0 0.00% 0 0.00% 2 40.00% 3 60.00% 5
Early Childhood 0.00% 1 14.29% 2 28.57% 4 57.14% 7Elementary 1 1.61% 2 3.23% 20 32.26% 39 62.90% 62Middle Grades 0.00% 0.00% 2 50.00% 2 50.00% 4Content (Subject Area) Endorsements 0.00% 3 5.17% 16 27.59% 39 67.24% 58Special Education 0.00% 1 5.88% 5 29.41% 11 64.71% 17 Total 1 0.68% 7 4.73% 45 30.41% 95 64.19% 148
2015-2016 Rare Occasional Frequent Consistent TotalCoaching, Social Science
0 0.00% 0 0.00% 1 50.00% 1 50.00% 2
Social Science 0 0.00% 0 0.00% 3 50.00% 3 50.00% 6
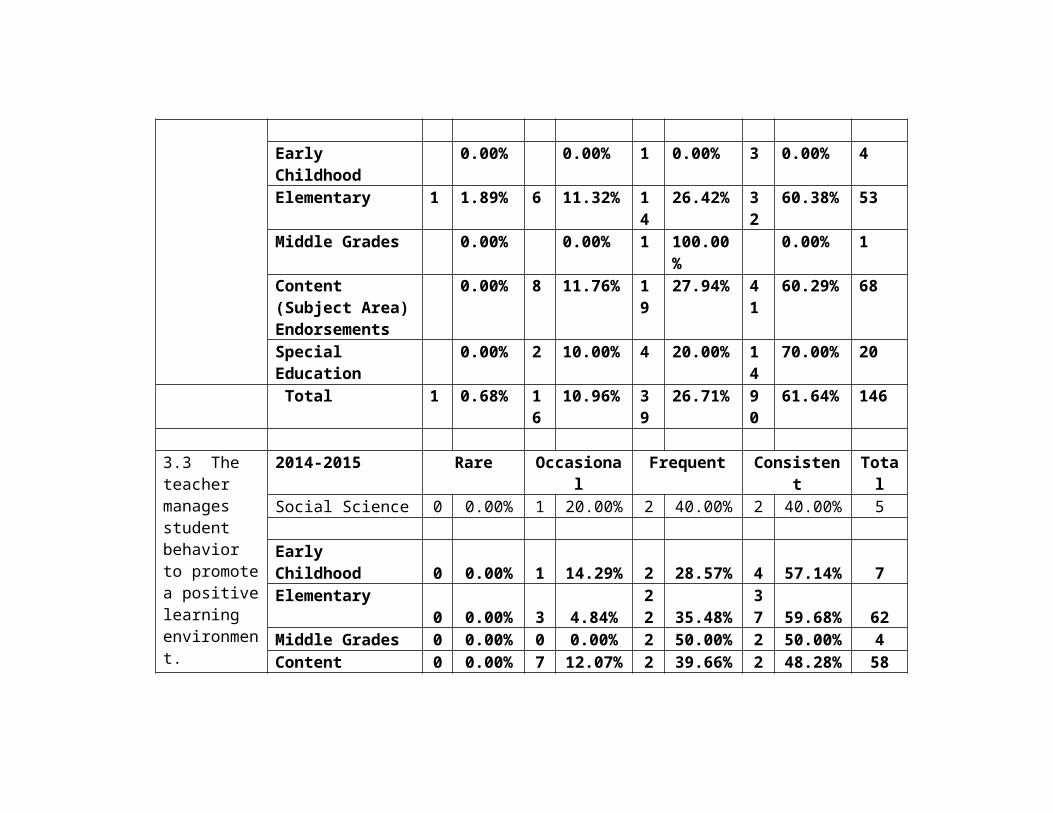
Early Childhood 0.00% 0.00% 1 0.00% 3 0.00% 4
Elementary 1 1.89% 6 11.32% 14 26.42% 32 60.38% 53Middle Grades 0.00% 0.00% 1 100.00% 0.00% 1Content (Subject Area) Endorsements
0.00% 8 11.76% 19 27.94% 41 60.29% 68
Special Education 0.00% 2 10.00% 4 20.00% 14 70.00% 20 Total 1 0.68% 16 10.96% 39 26.71% 90 61.64% 146
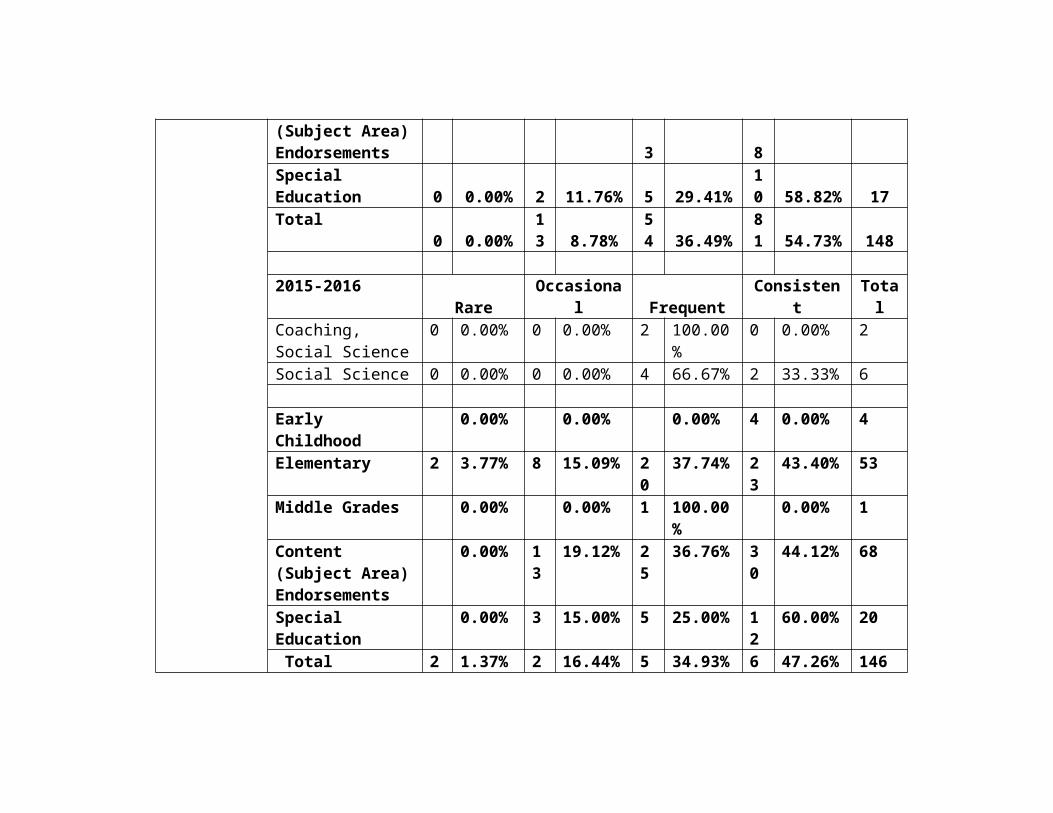
3.3 The teacher manages student behavior to promote a positive learning environment.
2014-2015 Rare Occasional Frequent Consistent TotalSocial Science 0 0.00% 1 20.00% 2 40.00% 2 40.00% 5
Early Childhood 0 0.00% 1 14.29% 2 28.57% 4 57.14% 7Elementary 0 0.00% 3 4.84% 22 35.48% 37 59.68% 62Middle Grades 0 0.00% 0 0.00% 2 50.00% 2 50.00% 4Content (Subject Area) Endorsements 0 0.00% 7 12.07% 23 39.66% 28 48.28% 58Special Education 0 0.00% 2 11.76% 5 29.41% 10 58.82% 17Total 0 0.00% 13 8.78% 54 36.49% 81 54.73% 148
2015-2016 Rare Occasional Frequent Consistent TotalCoaching, Social Science
0 0.00% 0 0.00% 2 100.00% 0 0.00% 2
Social Science 0 0.00% 0 0.00% 4 66.67% 2 33.33% 6
Early Childhood 0.00% 0.00% 0.00% 4 0.00% 4Elementary 2 3.77% 8 15.09% 20 37.74% 23 43.40% 53Middle Grades 0.00% 0.00% 1 100.00% 0.00% 1
Content (Subject Area) Endorsements
0.00% 13 19.12% 25 36.76% 30 44.12% 68
Special Education 0.00% 3 15.00% 5 25.00% 12 60.00% 20 Total 2 1.37% 24 16.44% 51 34.93% 69 47.26% 146
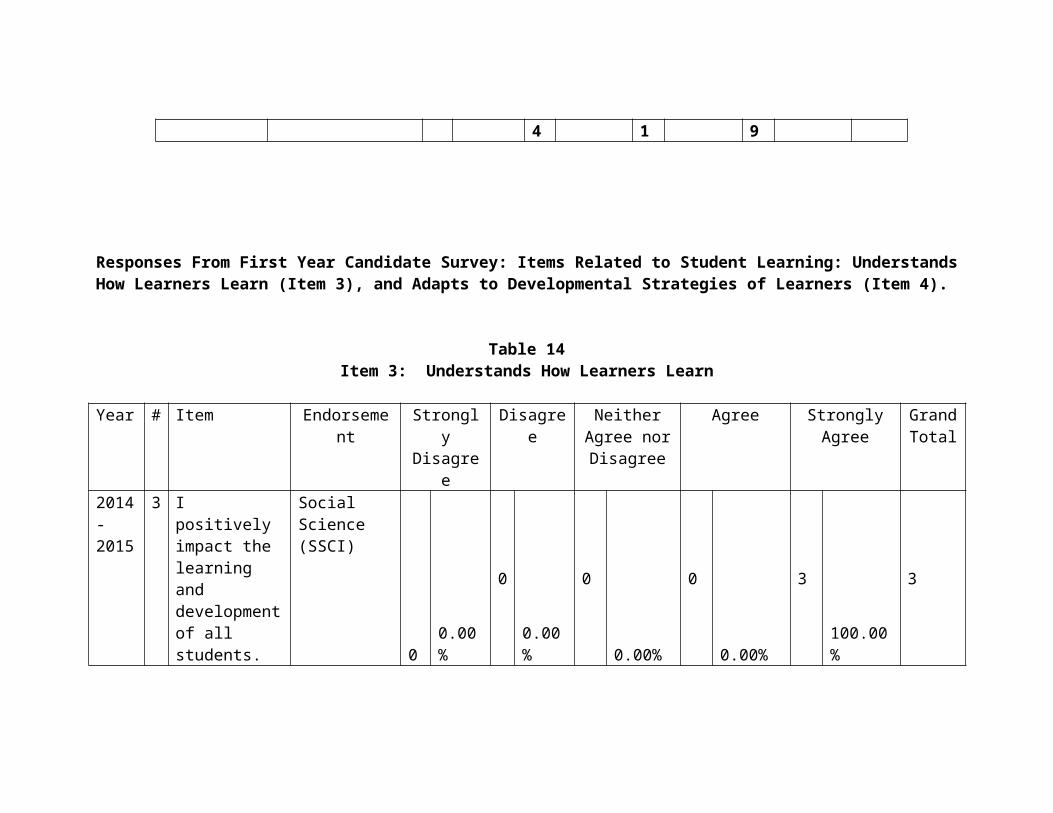
Responses From First Year Candidate Survey: Items Related to Student Learning: Understands How Learners Learn (Item 3), and Adapts to Developmental Strategies of Learners (Item 4).
Table 14Item 3: Understands How Learners Learn
Year # Item Endorsement
Strongly Disagree
Disagree
Neither Agree nor Disagree
Agree Strongly Agree
Grand Total
2014 - 2015
3 I positively impact the learning and development of all students.
Social Science (SSCI)
00.00%
00.00%
0
0.00%
0
0.00%
3100.00%
3
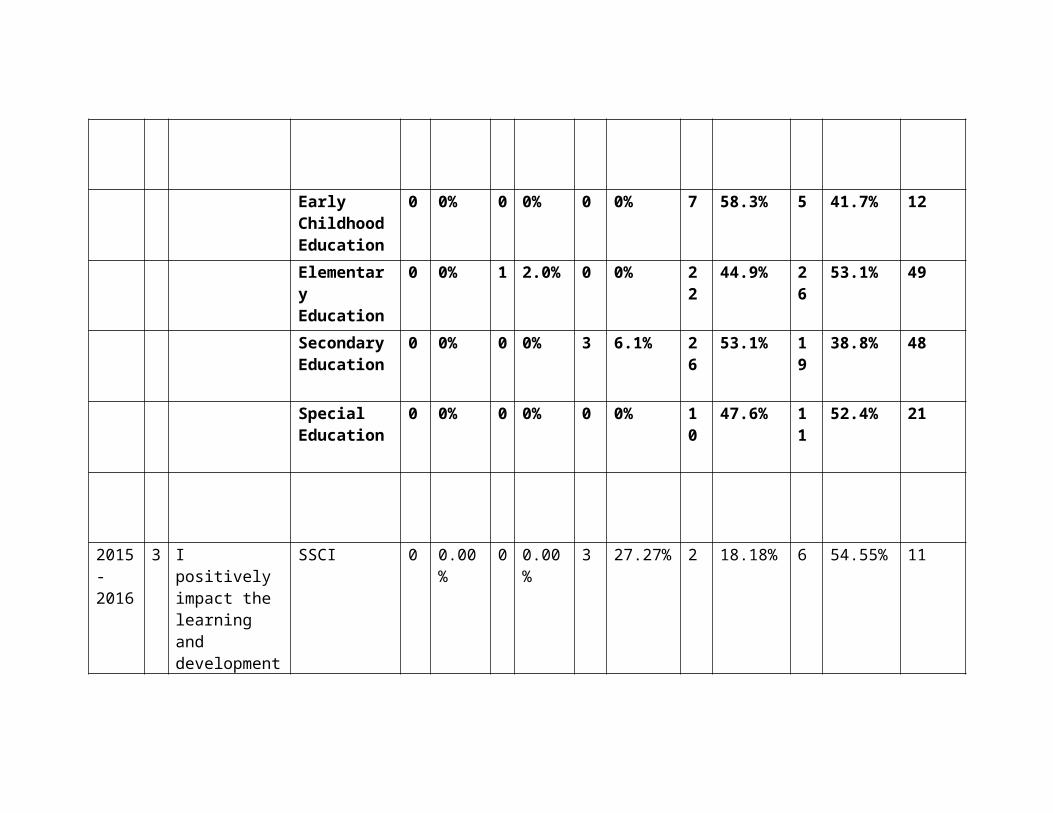
Early Childhood Education
0 0% 0 0% 0 0% 7 58.3% 5 41.7% 12
Elementary Education
0 0% 1 2.0% 0 0% 22
44.9% 26
53.1% 49
Secondary Education
0 0% 0 0% 3 6.1% 26
53.1% 19
38.8% 48
Special Education
0 0% 0 0% 0 0% 10
47.6% 11
52.4% 21
2015-2016
3 I positively impact the learning and development of all students.
SSCI 0 0.00% 0 0.00%
3 27.27% 2 18.18% 6 54.55% 11
Early Childhood Education
0 0.00% 0 0.00%
0 0.00% 2 25.00% 6 75.00% 8
Elementary Education
0 0.00% 0 0.00%
5 10.00% 21 42.00% 24 48.00% 50
Secondary Education
0 0.00% 0 0.00%
10 16.13% 33 53.23% 19 30.65% 62
Special Education
0 0.00% 0 0.00%
1 4.55% 11 50.00% 10 45.45% 22
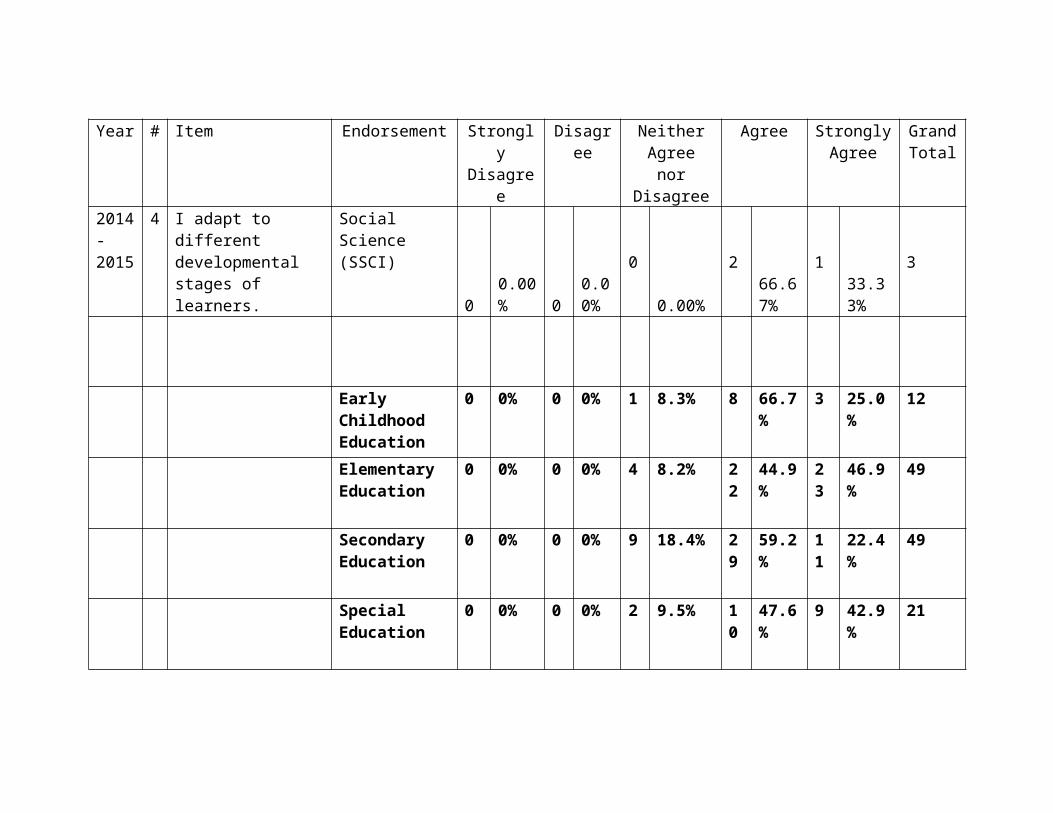
Table 15Item 4: Adapts to Developmental Strategies of Learners
Year # Item Endorsement Strongly Disagree
Disagree
Neither Agree nor Disagree
Agree Strongly Agree
Grand Total
2014 - 2015
4 I adapt to different developmental stages of
Social Science (SSCI)
0 0.00%
0 0.00%
0 0.00% 2 66.67%
1 33.33%
3
learners.
Early Childhood Education
0 0% 0 0% 1 8.3% 8 66.7%
3 25.0%
12
Elementary Education
0 0% 0 0% 4 8.2% 22
44.9%
23
46.9%
49
Secondary Education
0 0% 0 0% 9 18.4% 29
59.2%
11
22.4%
49
Special Education
0 0% 0 0% 2 9.5% 10
47.6%
9 42.9%
21
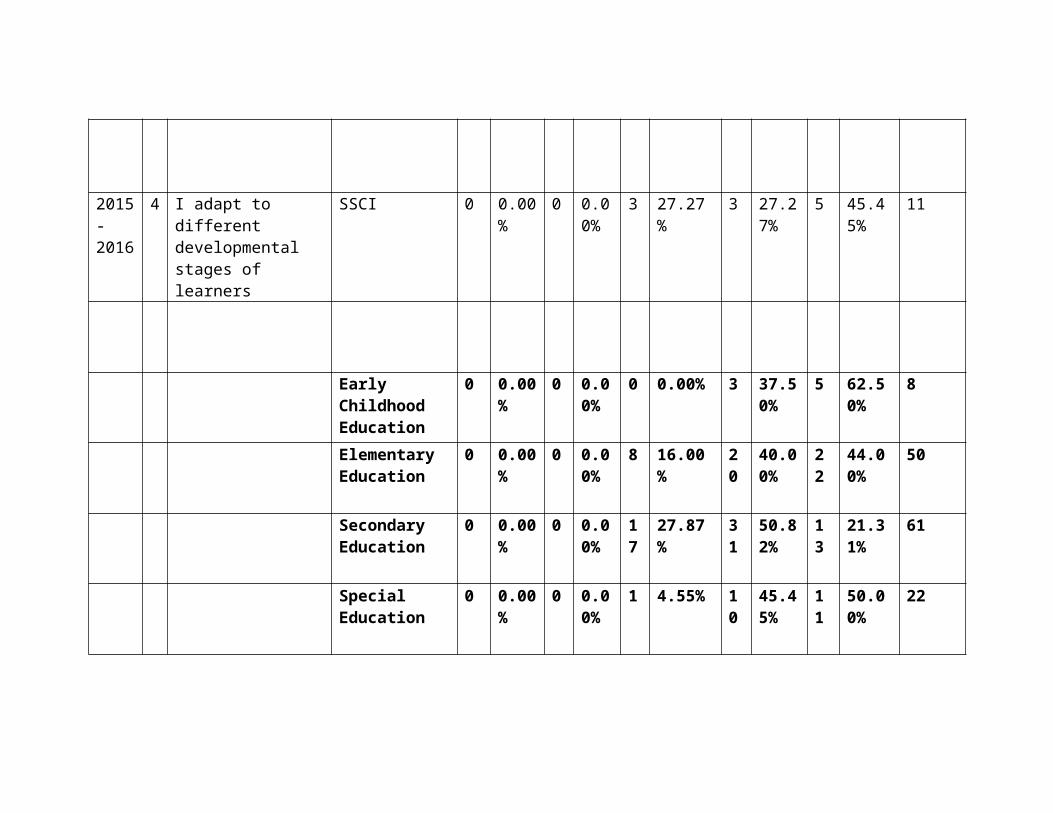
2015-2016
4 I adapt to different developmental stages of learners
SSCI 0 0.00%
0 0.00%
3 27.27% 3 27.27%
5 45.45%
11
Early Childhood Education
0 0.00%
0 0.00%
0 0.00% 3 37.50%
5 62.50%
8
Elementary Education
0 0.00%
0 0.00%
8 16.00% 20
40.00%
22 44.00%
50
Secondary Education
0 0.00%
0 0.00%
17
27.87% 31
50.82%
13 21.31%
61
Special Education
0 0.00%
0 0.00%
1 4.55% 10
45.45%
11 50.00%
22
Narrative:Responses from the student teaching instruments and from the first year administrator and first year candidate follow-up surveys support the belief that students who have completed the Social Science program have a sound grasp on the learning process and the environment that is created for learning to occur. Specifically, either all of the students in the program or the majority of students can create usable lesson plans that are based on the content of the discipline, and they can implement, modify, and adapt plans, and they can implement lessons that are flexible to meet student needs. In addition, Social Science program completers understand how students grow and develop, that students learn in different
ways, and that implementing appropriate learning experiences may be crucial to successful learning. Program completers also understand that individual differences may exist that are based on cultural and community differences. Social Science program completers are beginning to create skills to work with other teachers to develop an effective learning climate, and they are creating an environment that promotes active engagement among students. Finally, they are also beginning to develop student management skills.
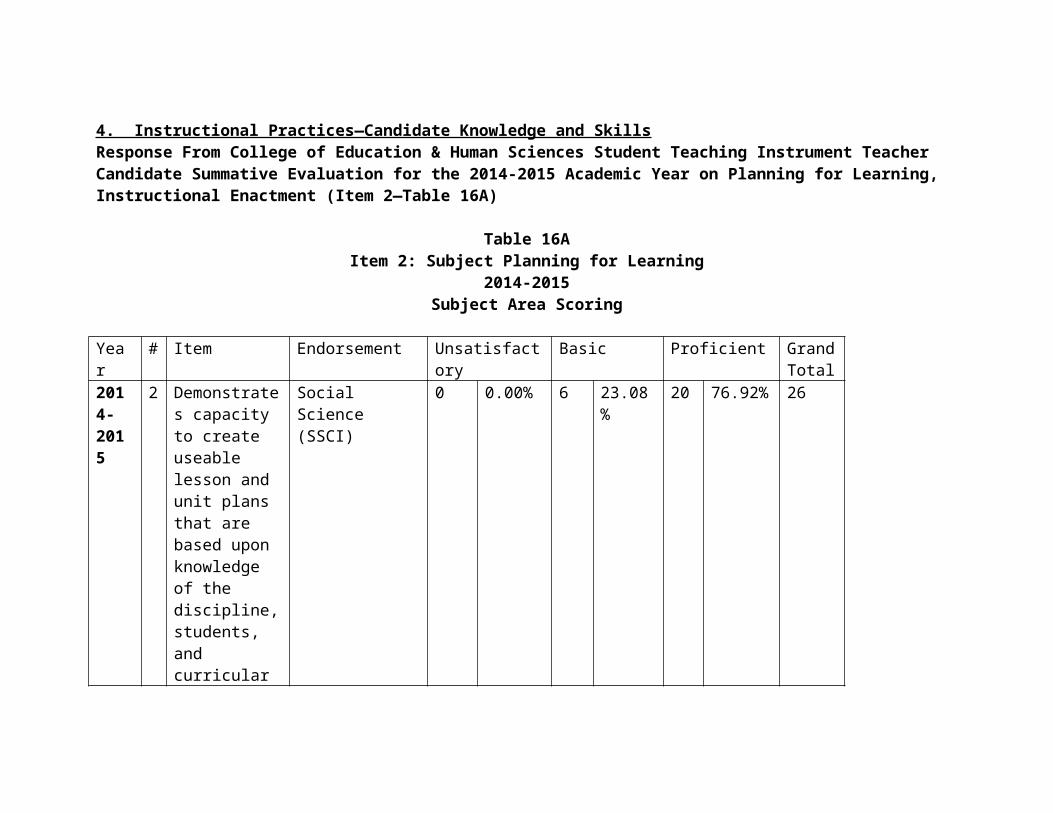
4. Instructional Practices—Candidate Knowledge and SkillsResponse From College of Education & Human Sciences Student Teaching Instrument Teacher Candidate Summative Evaluation for the 2014-2015 Academic Year on Planning for Learning, Instructional Enactment (Item 2—Table 16A)
Table 16AItem 2: Subject Planning for Learning
2014-2015Subject Area Scoring
Year # Item Endorsement Unsatisfactory
Basic Proficient Grand Total
2014- 2015
2 Demonstrates capacity to create useable lesson and unit plans that are based upon knowledge of the discipline, students, and curricular goals
Social Science (SSCI)
0 0.00% 6 23.08% 20 76.92% 26
Early Childhood Education
1 2.1% 6 12.5% 41 85.4% 48
Elementary Education
0 0% 5 4.0% 120
96.0% 125
Secondary Education
0 0% 21 17.5% 99 82.5% 120
Special Education
1 2.0% 7 14.0% 42 84.0% 50
Response From College of Education & Human Sciences Student Teaching Instrument Teacher Candidate Summative Evaluation on Planning for Learning for 2015-2016 Academic Year on Planning for Learning (Item 4—Table 16B)—LIVETEXT version.
Table 16BItem 4: Planning for Learning
2015-2016Subject Area Scoring
Year
# Item Endorsement Unacceptable
Emergent
Sufficient Advanced Grand Total
2015- 201
4 Planning for learning:Creates usable
Social Science 0 0.00% 1 9.09% 9 81.82% 1 9.09% 11
6 lessons and unit plans based on knowledge of the discipline, students, and curricular goals
Early Childhood Education
0 0.00% 1 2.94% 8 23.53% 25 73.53% 34
Elementary Education
0 0.00% 2 1.08% 53
28.65% 130 70.27% 185
Secondary Education
0 0.00% 2 2.27% 47
53.41% 39 44.32% 88
Special Education
0 0.00% 0 0.00% 24
27.91% 62 72.09% 86
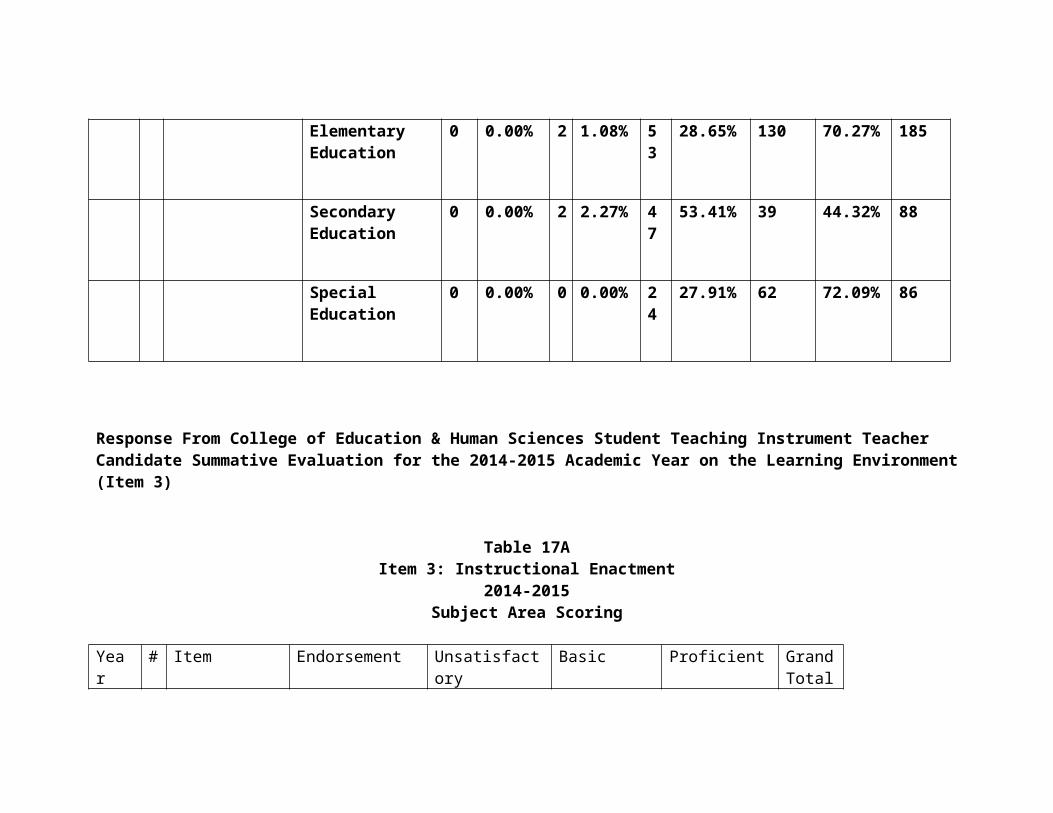
Response From College of Education & Human Sciences Student Teaching Instrument Teacher Candidate Summative Evaluation for the 2014-2015 Academic Year on the Learning Environment (Item 3)
Table 17AItem 3: Instructional Enactment
2014-2015Subject Area Scoring
Year # Item Endorsement Unsatisfactory
Basic Proficient Grand Total
2014- 2015
3 Demonstrates capacity to implement, modify, and adapt plans that are responsive to students and curricular goals
Social Science (SSCI)
0 0.00% 4 15.38% 22 84.62% 26
Early Childhood Education
0 0% 5 10.2% 44 89.8% 49
Elementary Education
0 0% 8 6.4% 117
93.6% 125
Secondary Education
1 0.8% 12 10.0% 107
89.2% 120
Special Education
1 2.0% 5 10.0% 44 88.0% 50
Response From College of Education & Human Sciences Student Teaching Instrument Teacher Candidate Summative Evaluation on Planning for Learning for the 2015-2016 Academic Year on Responsive Teaching (Item 5—Table 17B)—LIVETEXT version.
Table 17BItem 5: Responsive Teaching
2015-2016Subject Area Scoring
Year
# Item Endorsement Unacceptable
Emergent
Sufficient Advanced Grand Total
2015- 201
5 Responsive Teaching:
Social Science 0 0.00% 0 0.00% 7 63.64% 4 36.36% 11
6 Skillfully implements lessons that are flexible and intentional to meet individual student needs
Early Childhood Education
0 0.00% 0 0.00% 9 26.47% 25 73.53% 34
Elementary Education
0 0.00% 2 1.08% 58
31.35% 125 67.57% 185
Secondary Education
0 0.00% 6 6.90% 38
43.68% 43 49.43% 87
Special Education
0 0.00% 1 1.16% 24
27.91% 61 70.93% 86
Response From College of Education & Human Sciences Student Teaching Instrument Teacher Candidate Summative Evaluation for the 2014-2015 Academic Year on the Learning Environment (Item 6—Table 18A).
Table 18AItem 6: Learning Environment
2014-2015Subject Area Scoring
Year # Item Endorsement Unsatisfactory
Basic Proficient Grand Total
2014- 2015
6 Learning Environment. Demonstrates capacity to create classroom communities that invite students’ engagement and learning, encourages positive
Social Science (SSCI)
0 0.00% 4 15.38% 22 84.62% 26
social interaction and self-motivation.
Early Childhood Education
0 0% 1 2.0% 48 98.0% 49
Elementary Education
0 0% 9 7.2% 116
92.8% 125
Secondary Education
0 0.0% 12 10.0% 108
90.0% 120
Special Education
0 0% 5 10.0% 45 90.0% 50
Response From College of Education & Human Sciences Student Teaching Instrument Teacher Candidate Summative Evaluation on Planning for Learning for the 2015-2016 Academic Year on Learning Culture (Item 10—Table 18B)—LIVETEXT version.
Table 18B—Item 10: Learning Culture
2015-2016Subject Area Scoring
Year
# Item Endorsement Unacceptable
Emergent
Sufficient Advanced Grand Total
2015- 2016
10
Learning Culture:Creates classroom communities that invite student engagement and learning and encourage positive social interactions.
Social Science 0 0.00% 0 0.00%
8 72.73% 3 27.27% 11
Early Childhood Education
0 0.00% 1 2.94%
11
32.35% 22 64.71% 34
Elementary Education
0 0.00% 1 0.55%
51
28.18% 129 71.27% 181
Secondary Education
0 0.00% 0 0.00%
39
45.35% 47 54.65% 86
Special Education
0 0.00% 1 1.20%
19
22.89% 63 75.90% 83
Responses From First Year Administrator Survey: Items related to Planning for Instruction (Standards 7.1, 7.2, and 7.3) and Instructional Strategies (Standards 8.1, 8.2, and 8.3)
Table 19Standards 7.1, 7.2, and 7.3: Planning for Instruction
Indicator Endorsement Rare Occasional Frequent Consistent Grand Information Total7.1 The teacher
2014-2015Social Science 0 0.00% 0 0.00% 4 80.00% 1 20.00% 5
plans instruction that supports every student in meeting rigorous learning goals.
Early Childhood 0.00% 1 14.29% 2 28.57% 4 57.14% 7Elementary 0.00% 5 8.06% 24 38.71% 33 53.23% 62Middle Grades 0.00% 0.00% 1 25.00% 3 75.00% 4Content (Subject Area) Endorsements 0.00% 4 6.78% 22 37.29% 33 55.93% 59Special Education 1 5.88% 4 23.53% 6 35.29% 6 35.29% 17 Total 1 0.67% 14 9.40% 55 36.91% 79 53.02% 149
2015-2016 Rare Occasional Frequent Consistent TotalCoaching, Social Science
0 0.00% 0 0.00% 2 100.00% 0 0.00% 2
Social Science 0 0.00% 0 0.00% 5 83.33% 1 16.67% 6
Early Childhood 0.00% 0.00% 1 0.00% 3 0.00% 4Elementary 1 1.89% 4 7.55% 24 45.28% 24 45.28% 53Middle Grades 0.00% 0.00% 1 100.00% 0.00% 1Content (Subject Area) Endorsements
0.00% 5 7.25% 33 47.83% 31 44.93% 69
Special Education 0.00% 1 5.00% 10 50.00% 9 45.00% 20 Total 1 0.68% 10 6.80% 69 46.94% 67 45.58% 147
7.2 The teacher candidate draws
2014-2015 Rare Occasional Frequent Consistent TotalSocial Science 0 0.00% 0 0.00% 3 60.00% 2 40.00% 5
Early 0.00% 1 14.29% 3 42.86% 3 42.86% 7
upon knowledge of content areas, curriculum, cross-disciplinary skills, technology, and pedagogy.
ChildhoodElementary 0.00% 5 8.06% 23 37.10% 34 54.84% 62Middle Grades 0.00% 1 25.00% 1 25.00% 2 50.00% 4Content (Subject Area) Endorsements 0.00% 4 6.78% 23 38.98% 32 54.24% 59Special Education 1 5.88% 3 17.65% 4 23.53% 9 52.94% 17 Total 1 0.67% 14 9.40% 54 36.24% 80 53.69% 149
2015-2016 Rare Occasional Frequent Consistent TotalCoaching, Social Science
0 0.00% 0 0.00% 1 50.00% 1 50.00% 2
Social Science 0 0.00% 0 0.00% 4 66.67% 2 33.33% 6
Early Childhood 0.00% 0.00% 2 0.00% 2 0.00% 4Elementary 2 3.77% 3 5.66% 27 50.94% 21 39.62% 53Middle Grades 0.00% 0.00% 1 100.00% 0.00% 1Content (Subject Area) Endorsements
0.00% 6 8.70% 29 42.03% 34 49.28%
Special Education 0.00% 1 5.00% 11 55.00% 8 40.00% 20 Total 2 1.36% 10 6.80% 70 47.62% 65 44.22% 147
7.3 The teacher draws upon knowledge of
2014-2015 Rare Occasional Frequent Consistent TotalSocial Science 0 0.00% 0 0.00% 4 80.00% 1 20.00% 5
Early Childhood 0.00% 0.00% 4 57.14% 3 42.86% 7Elementary 0.00% 4 6.45% 23 37.10% 35 56.45% 62
students and the community context.
Middle Grades 0.00% 1 25.00% 1 25.00% 2 50.00% 4Content (Subject Area) Endorsements 1 1.69% 4 6.78% 24 40.68% 30 50.85% 59Special Education 1 5.88% 4 23.53% 3 17.65% 9 52.94% 17 Total 2 1.34% 13 8.72% 55 36.91% 79 53.02% 149
2015-2016 Rare Occasional Frequent Consistent TotalCoaching, Social Science
0 0.00% 0 0.00% 0 0.00% 2 100.00% 2
Social Science 0 0.00% 0 0.00% 4 66.67% 2 33.33% 6
Early Childhood 0.00% 0.00% 2 0.00% 2 0.00% 4Elementary 1 1.89% 6 11.32% 22 41.51% 24 45.28% 53Middle Grades 0.00% 0.00% 1 100.00% 0.00% 1Content (Subject Area) Endorsements
0.00% 8 11.59% 26 37.68% 35 50.72% 69
Special Education 0.00% 1 5.00% 10 50.00% 9 45.00% 20 Total 1 0.68% 15 10.20% 61 41.50% 70 47.62% 147
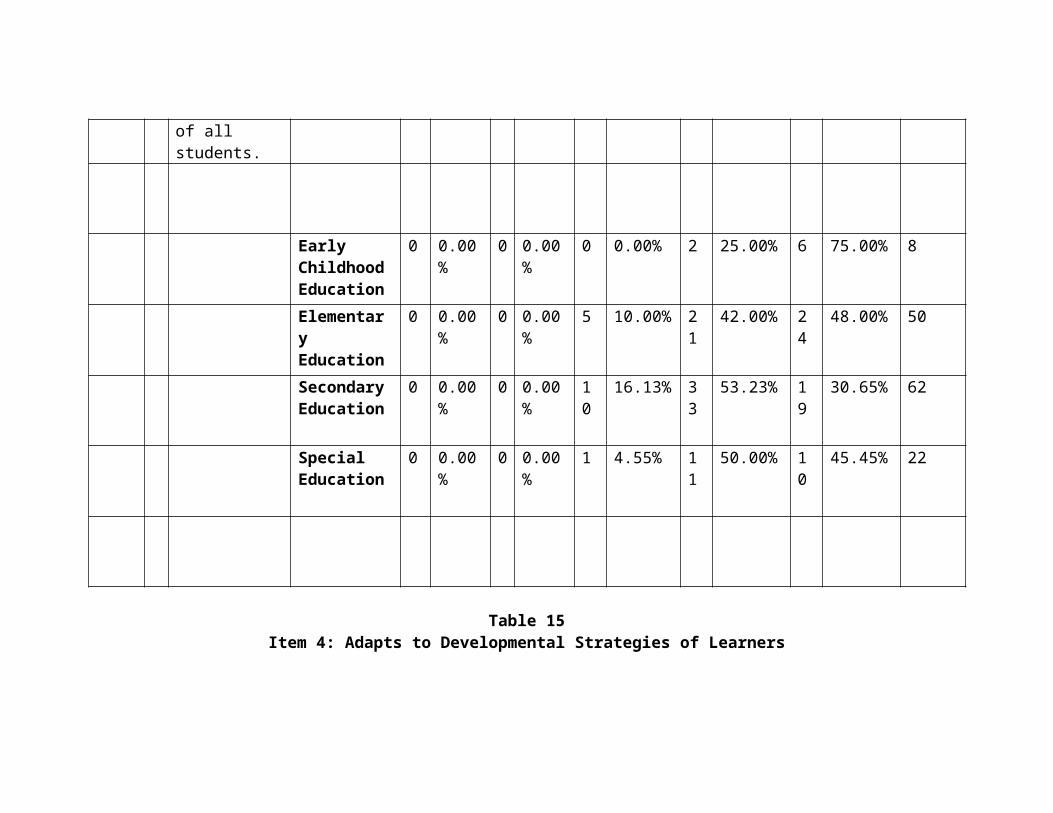
Table 20Standard 8.1, 8.2, and 8.3: Instructional Strategies
Indicator Endorsement Rare Occasional Frequent Consistent Grand Information Total8.1 The teacher understands a variety of instructional strategies.
2014-2015Social Science 0 0.00% 1 20.00% 2 40.00% 2 40.00% 5
Early Childhood 0.00% 1 14.29% 2 28.57% 4 57.14% 7Elementary 0.00% 7 11.29% 18 29.03% 37 59.68% 62Middle Grades 0.00% 0.00% 1 25.00% 3 75.00% 4Content (Subject Area) Endorsements 0.00% 6 10.00% 19 31.67% 35 58.33% 60Special Education 1 5.88% 2 11.76% 5 29.41% 9 52.94% 17 Total
1 0.67%16 10.67% 45 30.00% 88 58.67% 150
2015-2016 Rare Occasional Frequent Consistent TotalCoaching, Social Science
0 0.00% 0 0.00% 2 100.00% 0 0.00% 2
Social Science 0 0.00% 0 0.00% 2 33.33% 4 66.67% 6
Early Childhood 0.00% 0.00% 2 0.00% 2 0.00% 4Elementary 2 3.85% 1 1.92% 20 38.46% 29 55.77% 52
Middle Grades 0.00% 0.00% 1 100.00% 0.00% 1Content (Subject Area) Endorsements
0.00% 5 7.35% 27 39.71% 36 52.94% 68
Special Education 0.00% 1 5.00% 8 40.00% 11 55.00% 20 Total 2 1.38% 7 4.83% 58 40.00% 78 53.79% 145
8.2 The teacher uses a variety of instructional strategies to encourage students to develop deep understanding of content areas and their connection and to build skills to apply knowledge in meaningful ways.
2014-2015 Rare Occasional Frequent Consistent TotalSocial Science 0 0.00% 0 0.00% 4 80.00% 1 20.00% 5
Early Childhood 0.00% 1 14.29% 2 28.57% 4 57.14% 7Elementary 0.00% 7 11.29% 24 38.71% 31 50.00% 62Middle Grades 0.00% 1 25.00% 0.00% 3 75.00% 4Content (Subject Area) Endorsements 0.00% 7 11.67% 23 38.33% 30 50.00% 60Special Education 1 5.88% 2 11.76% 5 29.41% 9 52.94% 17 Total
1 0.67%18 12.00% 54 36.00% 77 51.33% 150
2015-2016 Rare Occasional Frequent Consistent TotalCoaching, Social Science
0 0.00% 0 0.00% 1 50.00% 1 50.00% 2
Social Science 0 0.00% 0 0.00% 3 50.00% 3 50.00% 6
Early Childhood 0.00% 0.00% 2 0.00% 2 0.00% 4Elementary 1 1.92% 3 5.77% 21 40.38% 27 51.92% 52Middle Grades 0.00% 0.00% 1 100.00% 0.00% 1
Content (Subject Area) Endorsements
0.00% 8 11.76% 25 36.76% 35 51.47% 68
Special Education 0.00% 1 5.00% 9 45.00% 10 50.00% 20 Total 1 0.69% 1
28.28% 58 40.00% 74 51.03% 145
8.3 The teacher utilizes available technology for instruction and assessment.
2014-2015 Rare Occasional Frequent Consistent TotalSocial Science 0 0.00% 1 20.00% 1 20.00% 3 60.00% 5
Early Childhood 0.00% 0.00% 5 71.43% 2 28.57% 7Elementary 0.00% 4 6.45% 23 37.10% 35 56.45% 62Middle Grades 0.00% 0.00% 3 75.00% 1 25.00% 4Content (Subject Area) Endorsements 1 1.67% 4 6.67% 17 28.33% 38 63.33% 60Special Education 0.00% 4 23.53% 6 35.29% 7 41.18% 17 Total
1 0.67%12 8.00% 54 36.00% 83 55.33% 150
2015-2016 Rare Occasional Frequent Consistent TotalCoaching, Social Science
0 0.00% 0 0.00% 1 50.00% 1 50.00% 2
Social Science 0 0.00% 1 0.00% 3 50.00% 2 33.33% 6
Early Childhood 0.00% 0.00% 1 0.00% 3 0.00% 4Elementary 1 1.92% 4 7.69% 19 36.54% 28 53.85% 52Middle Grades 0.00% 0.00% 1 100.00% 0.00% 1
Content (Subject Area) Endorsements
0.00% 8 11.94% 24 35.82% 35 52.24% 67
Special Education 0.00% 2 10.00% 9 45.00% 9 45.00% 20 Total 1 0.69% 1
49.72% 54 37.50% 75 52.08% 144
Responses From First Year Candidate Survey: Items Related to Creating Effective Instructional Plans (Item 7), Working Effectively as Part of an Instructional Planning Team (Item 8), Classroom Management (Item 9), Instruction Requires Problem Solving or Critical Thinking Skills (Item 16), Instruction is Adapted to the Needs of Learners with Special Needs (Item 17), and Use of Multiple Methods to Teach (Item 20).
Table 21Item 7: Create Effective Instructional Plans
Year # Item Endorsement
Strongly Disagree
Disagree
Neither Agree nor Disagree
Agree Strongly Agree
Grand Total
2014 - 2015
7 I create effective instructional plans.
Social Science (SSCI)
00.00%
0 0.00%
00.00%
00.00%
3 100.00%
3
Early Childhood Education
0 0% 0 0% 0 0% 8 66.7% 4 33.3% 12
Elementary Education
0 0% 0 0% 3 6.1% 26
53.1% 20
40.8% 49
Secondary Education
0 0% 1 2.1% 4 8.3% 27
56.3% 16
33.3% 48
Special Education
0 0% 1 4.8% 1 4.8% 13
61.9% 6 28.6% 21
2015-2016
7 I create effective new lesson plans
SSCI 0 0.00% 1 9.09% 1 9.09% 6 54.55% 3 27.27% 11
Early Childhood Education
0 0.00% 0 0.00% 1 12.50% 3 37.50% 4 50.00% 8
Elementary Education
0 0.00% 1 2.00% 7 14.00% 28
56.00% 14 28.00% 50
Secondary Education
1 1.61% 2 3.23% 6 9.68% 37
59.68% 16 25.81% 62
Special Education
0 0.00% 2 9.09% 3 13.64% 12
54.55% 5 22.73% 22
Table 22Item 8: Work Effectively as a Part of an Instructional Team
Year # Item Endorsement
Strongly Disagree
Disagree
Neither Agree nor Disagree
Agree Strongly Agree
Grand
Total2014 - 2015
8 I work effectively as part of an instructional planning team.
Social Science (SSCI)
00.00%
00.00%
0
0.00%
0
0.00%
3100.00%
3
Early Childhood Education
0 0% 0 0% 1 8.3% 4 33.3% 7 58.3% 12
Elementary Education
0 0% 2 4.1% 3 6.1% 20
40.8% 24
49.0% 49
Secondary Education
0 0% 1 2.0% 10
20.4% 23
46.9% 15
30.6% 49
Special Education
0 0% 1 4.8% 1 4.8% 9 42.9% 10
47.6% 21
2015-2016
8 I work effectively as part of an instructional team
SSCI 0 0.00% 0 0.00% 2 18.18% 3 27.27% 6 54.55% 11
Early Childhood Education
0 0.00% 0 0.00% 1 12.50% 2 25.00% 5 62.50% 8
Elementary Education
0 0.00% 3 6.00% 2 4.00% 23 46.00% 22 44.00% 50
Secondary Education
0 0.00% 1 1.61% 9 14.52% 27 43.55% 25 40.32% 62
Special Education
0 0.00% 1 4.55% 4 18.18% 9 40.91% 8 36.36% 22
Table 23Item 9: Manages Classroom Management
Year # Item Endorsement
Strongly Disagre
e
Disagree Neither Agree nor Disagree
Agree Strongly Agree
Grand
Total201 9 I apply Social 0 0.00 0 0.00% 0 0.00% 0 0.00% 3 100.00 3
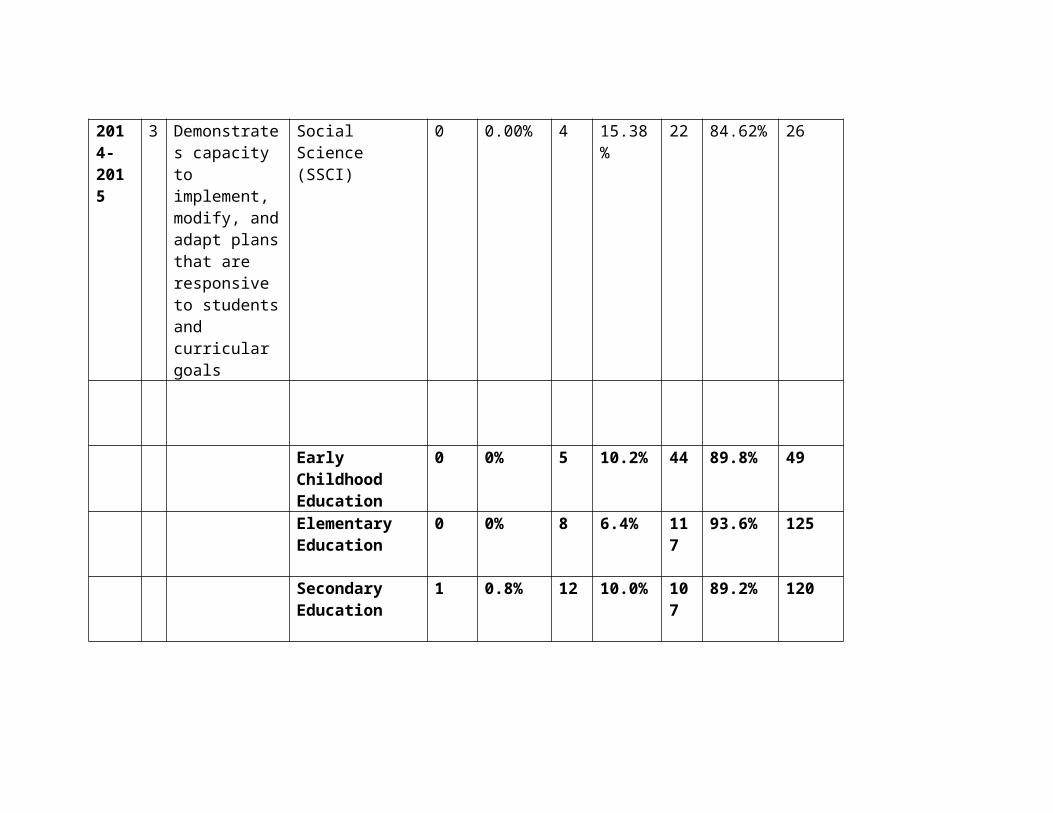
4 - 2015
effective methods to manage the classroom environment.
Science (SSCI)
% %
Early Childhood Education
0 0% 0 0% 1 8.3% 6 50.0% 5 41.7% 12
Elementary Education
0 0% 1 2.0% 4 8.2% 21
42.9% 23
46.9% 49
Secondary Education
1 2.0% 3 6.1% 11
22.4% 20
40.8% 14
28.6% 49
Special Education
0 0% 0 0% 1 4.8% 7 33.3% 13
61.9% 21
2015-
9 I apply effective
SSCI 0 0.00% 1 9.09% 3 27.27% 5 45.45%
2 18.18% 11
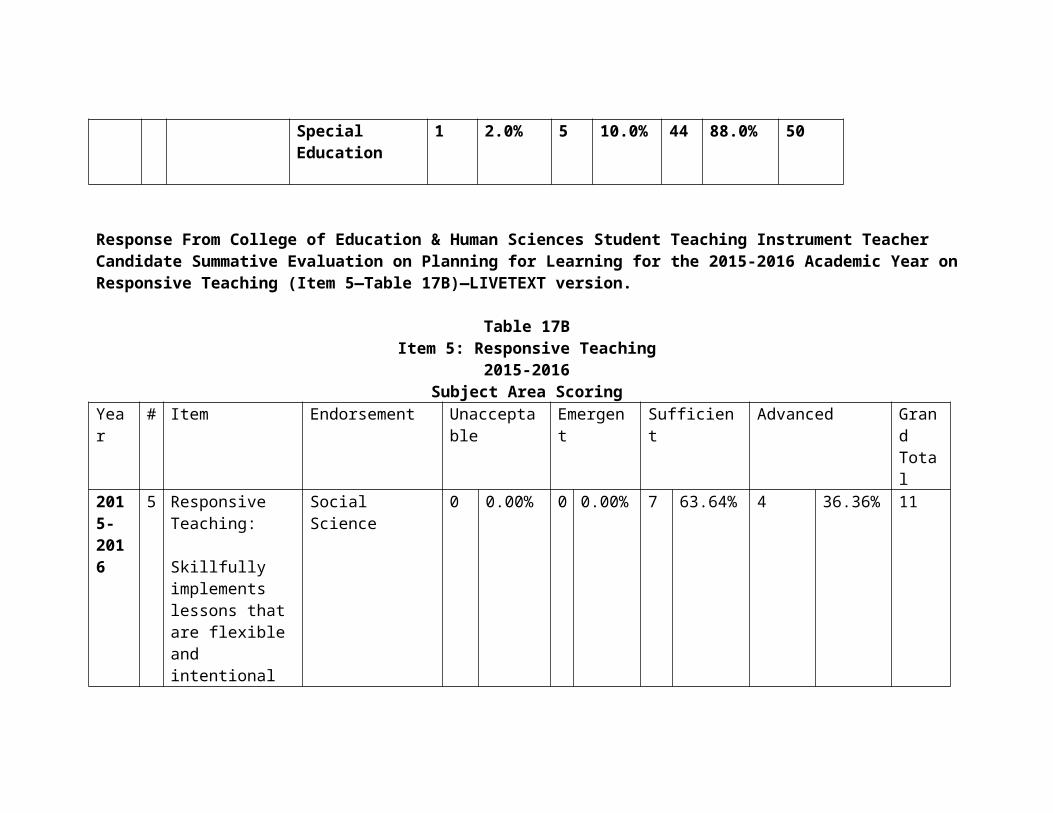
2016
methods to manage the classroom environment
Early Childhood Education
0 0.00% 0 0.00% 1 12.50% 3 37.50%
4 50.00% 8
Elementary Education
1 2.00% 1 2.00% 8 16.00% 21 42.00%
19 38.00% 50
Secondary Education
1 1.61% 8 12.90%
15 24.19% 28 45.16%
10 16.13% 62
Special Education
0 0.00% 1 4.55% 3 13.64% 8 36.36%
10 45.45% 22
Table 24Item 16: Instruction Requires Student Problem Solving and/or Critical Thinking Skills
Year # Item Endorsemen Strongly Disagre Neither Agree Strongly Gran
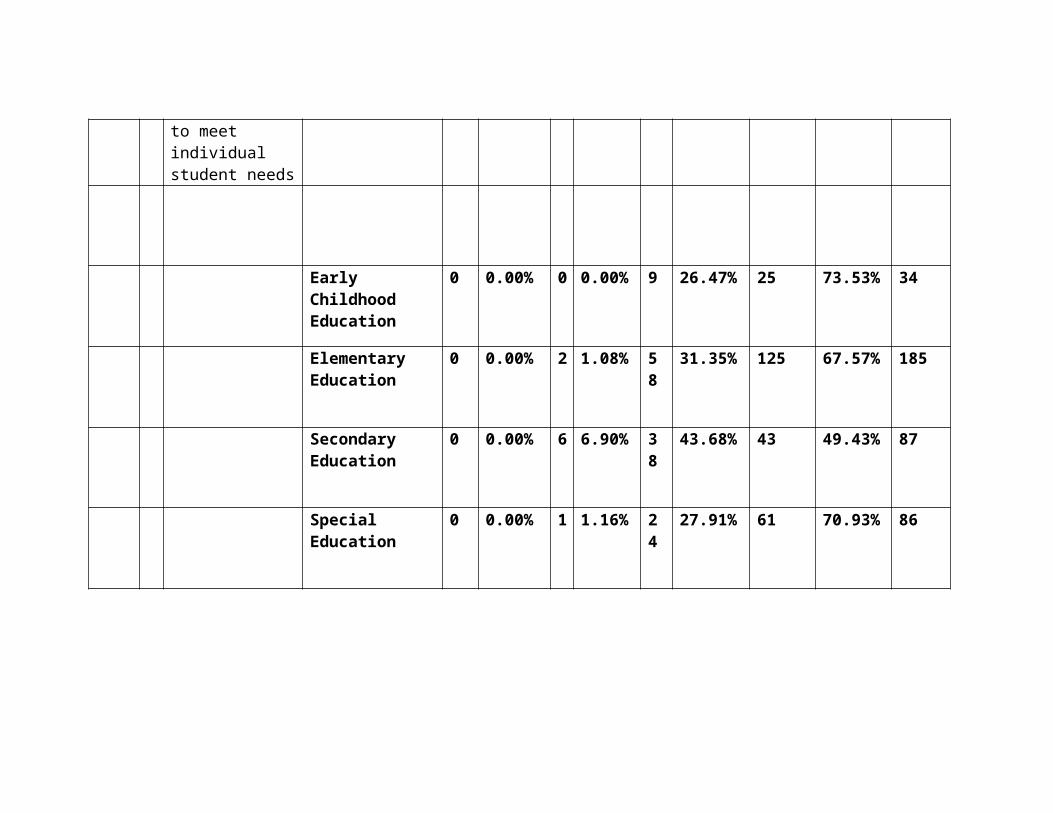
t Disagree e Agree nor Disagree
Agree d Total
2014 - 2015
16
My instruction requires student problem solving and/or critical thinking skills.
Social Science (SSCI)
0
0.00% 0 0.00
% 0 0.00% 0 0.00% 3 100.00% 3
Early Childhood Education
0 0% 0 0% 2 16.7% 6 50.0% 4 33.3% 12
Elementary Education
0 0% 0 0% 6 12.2% 27
55.1% 16
32.7% 49
Secondary Education
0 0% 3 6.1% 8 16.3% 23
46.9% 15
30.6% 49
Special Education
0 0% 0 0% 4 19.0% 11
52.4% 6 28.6% 21
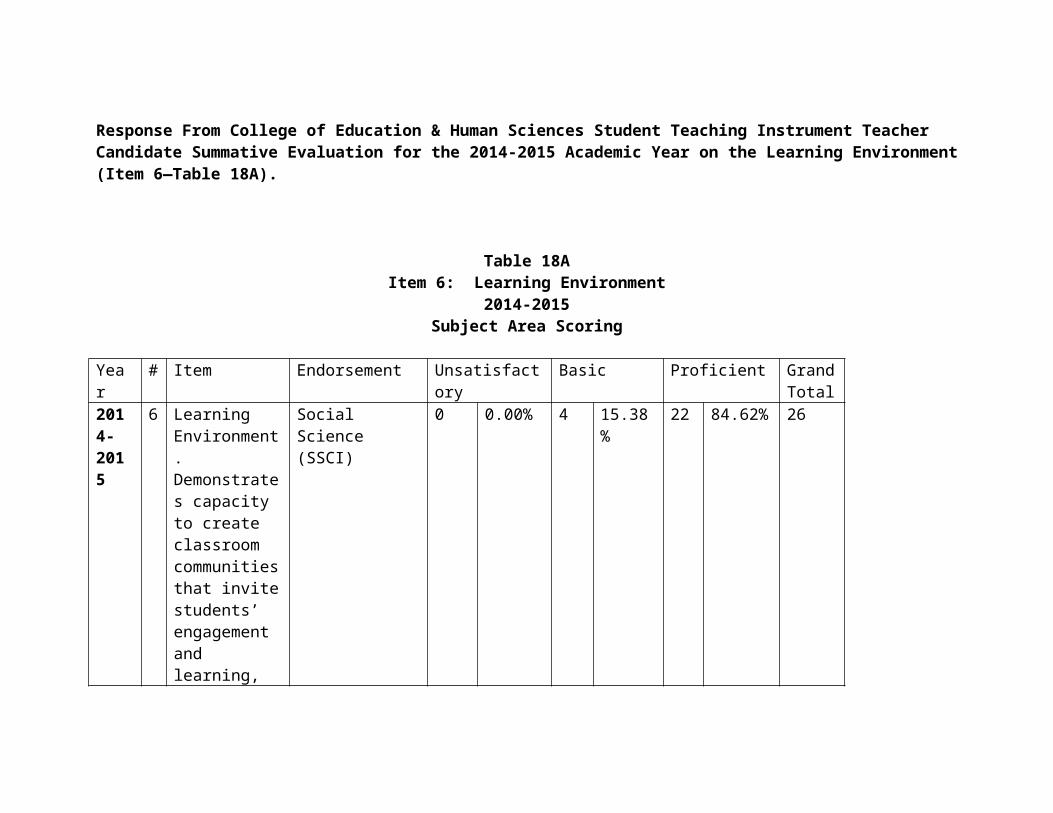
2015-2016
16
My instruction requires student problem solving and/or critical thinking skills
SSCI 0 0.00% 0 0.00% 1 9.09% 4 36.36% 6 54.55% 11
Early Childhood Education
0 0.00% 0 0.00% 0 0.00% 5 62.50% 3 37.50% 8
Elementary Education
0 0.00% 1 2.00% 5 10.00% 30 60.00% 14 28.00% 50
Secondary Education
1 1.61% 1 1.61% 8 12.90% 31 50.00% 21 33.87% 62
Special Education
0 0.00% 0 0.00% 2 9.09% 14 63.64% 6 27.27% 22
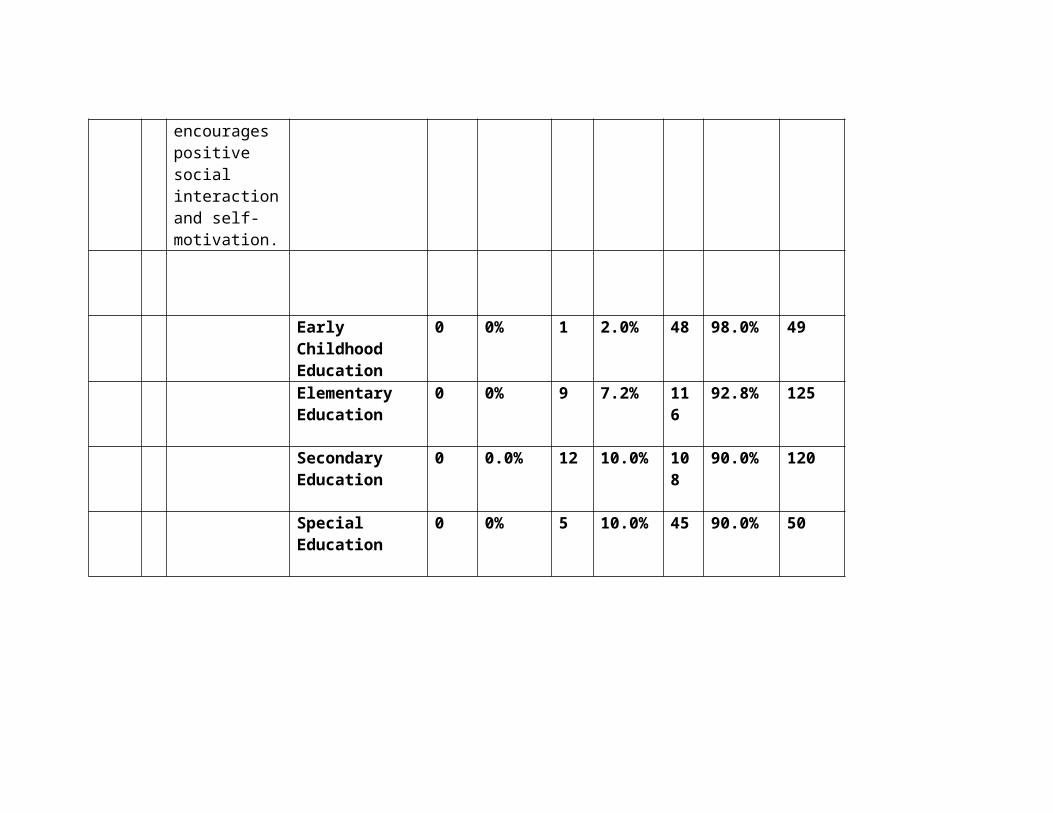
Table 25Item 17: Adapt Instruction to Meet Needs of Learners With Special Needs
Year # Item Endorsement
Strongly Disagree
Disagree
Neither Agree nor Disagree
Agree Strongly Agree
Grand
Total2014 - 2015
17
I adapt my instruction to the needs of learners with special needs.
Social Science (SSCI)
0
0.00% 0 0.00
% 0 0.00% 2 66.67% 1 33.33
% 3
Early Childhood Education
0 0% 0 0% 1 8.3% 6 50.0% 5 41.7% 12
Elementary Education
0 0% 1 2.0% 6 12.2% 22
44.9% 20
40.8% 49
Secondary Education
0 0% 2 4.1% 3 6.1% 26
53.1% 18
36.7% 49
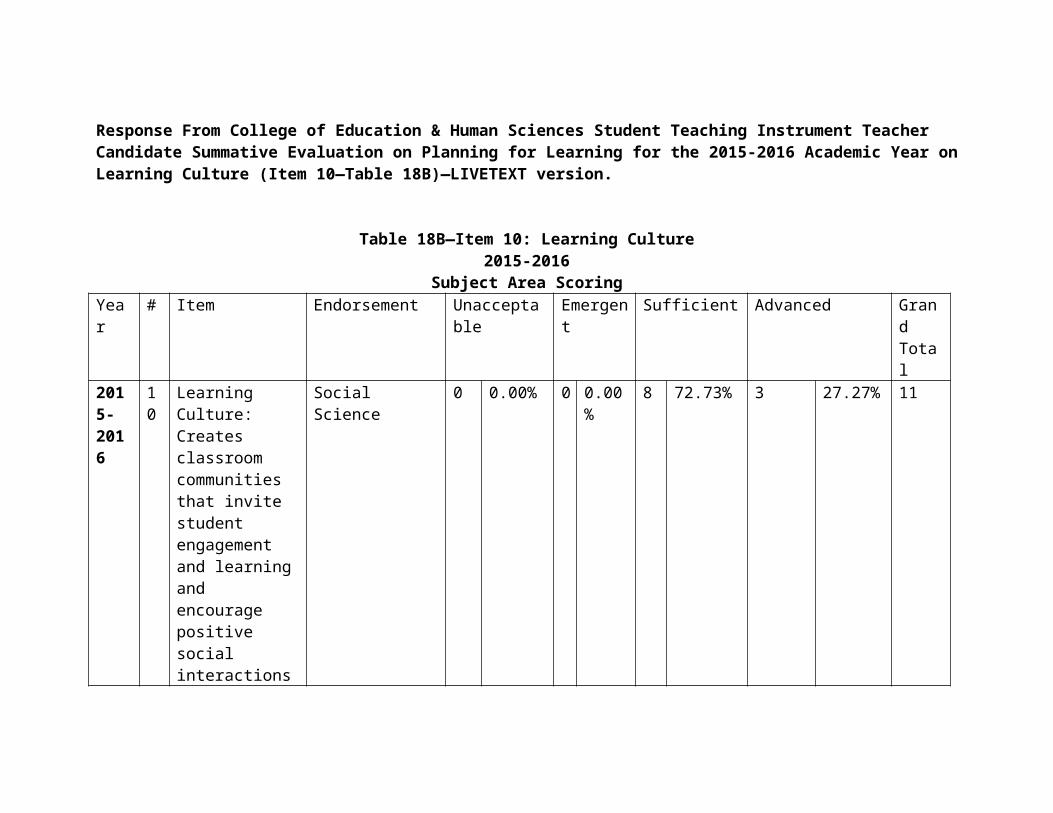
Special Education
0 0% 0 0% 0 0% 8 38.1% 13
61.9% 21
2015-2016
17
I adapt my instruction to the needs of learners with special needs.
SSCI 0 0.00% 0 0.00% 1 9.09% 7 63.64% 3 27.27% 11
Early Childhood Education
0 0.00% 0 0.00% 1 12.50% 3 37.50% 4 50.00% 8
Elementary Education
0 0.00% 0 0.00% 8 16.00% 23 46.00% 19 38.00% 50
Secondary Education
0 0.00% 1 1.61% 9 14.52% 39 62.90% 13 20.97% 62
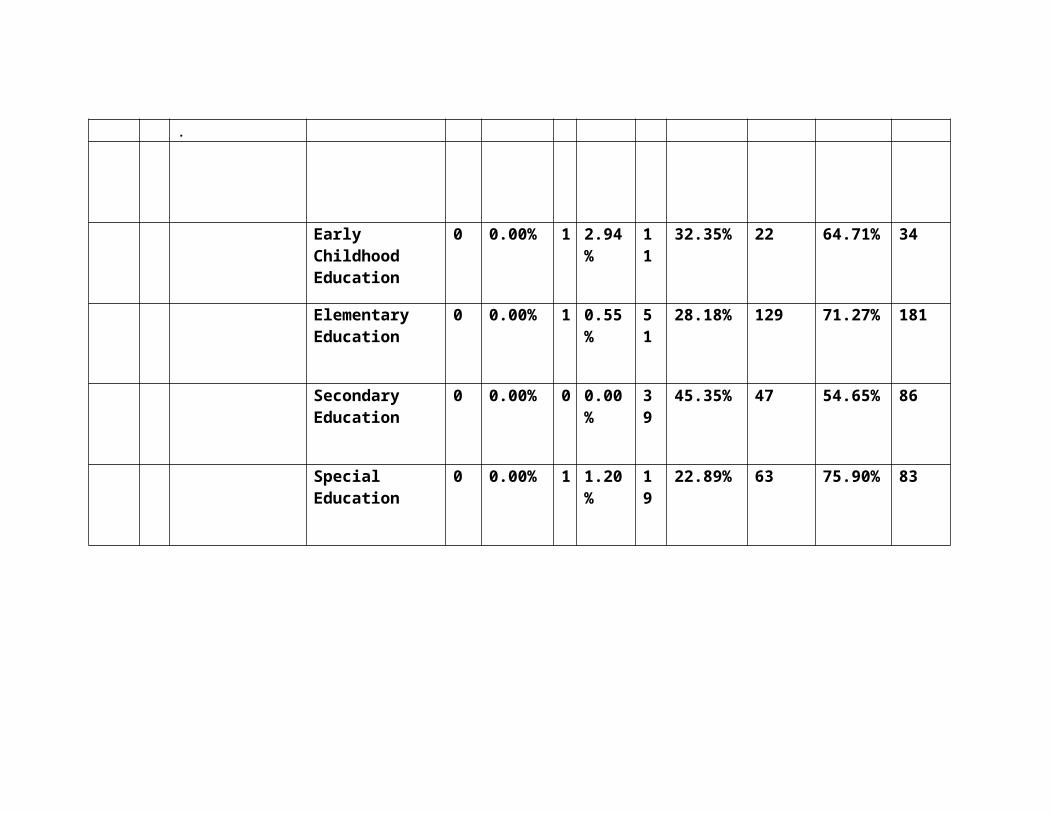
Special Education
0 0.00% 1 4.55% 1 4.55% 9 40.91% 11 50.00% 22
Table 26Item 20: Use Multiple Methods to Teach
Year # Item Endorsement Strongly Disagree
Disagree
Neither Agree nor Disagree
Agree Strongly Agree
Grand Total
2014 - 2015
20
I use multiple methods to teach.
Social Science (SSCI)
0 0.00% 00.00%
00.00%
2 66.67%
1 33.33%
3
Early Childhood Education
0 0% 0 0% 3 25.0% 2 16.7% 7 58.3% 12
Elementary Education
0 0% 0 0% 6 12.2% 21
42.9% 22
44.9% 49
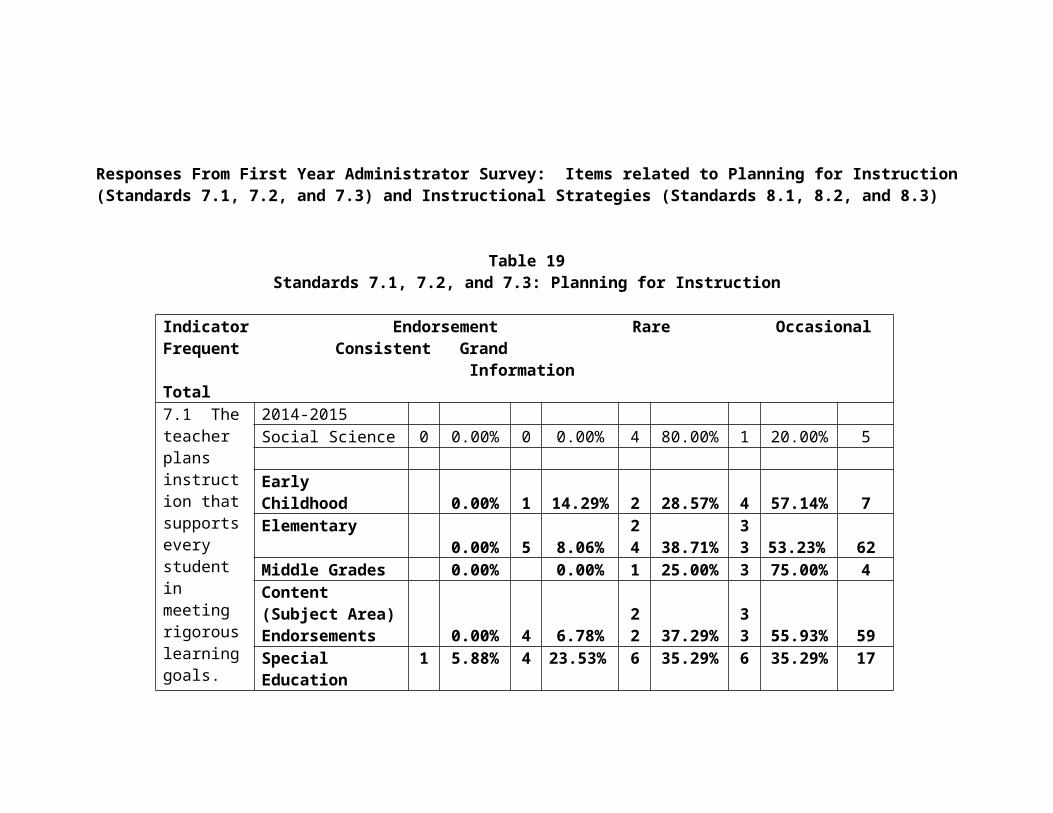
Secondary Education
0 0% 0 0% 2 4.1% 27
55.1% 2 40.8% 49
Special Education
0 0% 0 0% 4 19.0% 11
52.4% 6 28.6% 21
2015-2016
20
I use multiple methods to teach
SSCI 0 0.00% 0 0.00% 2 18.18% 3 27.27% 6 54.55% 11
Early Childhood Education
0 0.00% 0 0.00% 0 0.00% 3 37.50% 5 62.50% 8
Elementary Education
0 0.00% 1 2.00% 4 8.00% 25
50.00% 20 40.00% 50
Secondary Education
0 0.00% 1 1.61% 4 6.45% 36
58.06% 21 33.87% 62
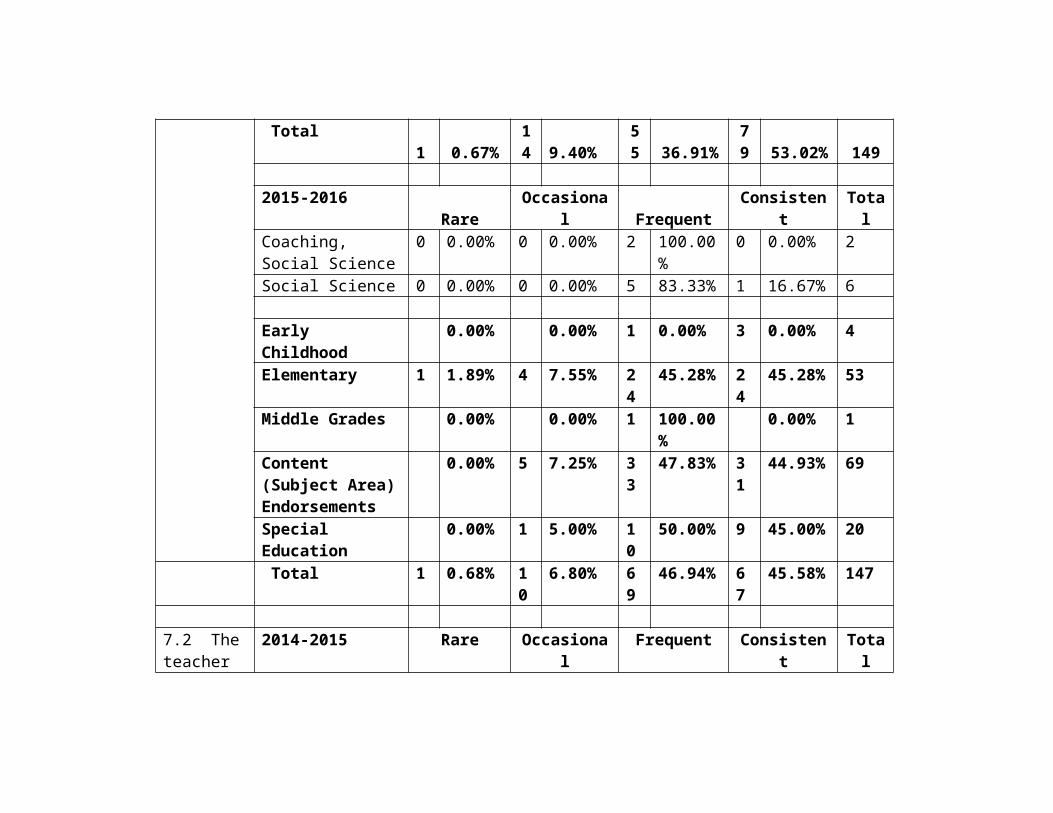
Special Education
0 0.00% 1 4.55% 1 4.55% 9 40.91% 11 50.00% 22
Narrative:Consistent with the data presented in the previous section concerning their understanding of the learning process and their ability to apply what they know to creating effective learning experiences, Social Science program completers are able to create experiences that are effective in instructional practice. Specifically, they are able to create classroom communities that invite student engagement, the lessons they create can assist all students to meet learning goals and objectives, and they can do so by using knowledge from a variety of sources. They are able to use a variety of instructional strategies, including the use and application of technology. The candidates also believe that they have the skills, knowledge, and ability to create effective instructional plans; that they can work well as a part of a team; and that the lessons they design will promote problem-solving and critical thinking skills. The data are consistent across the student teaching and first year follow-up surveys.
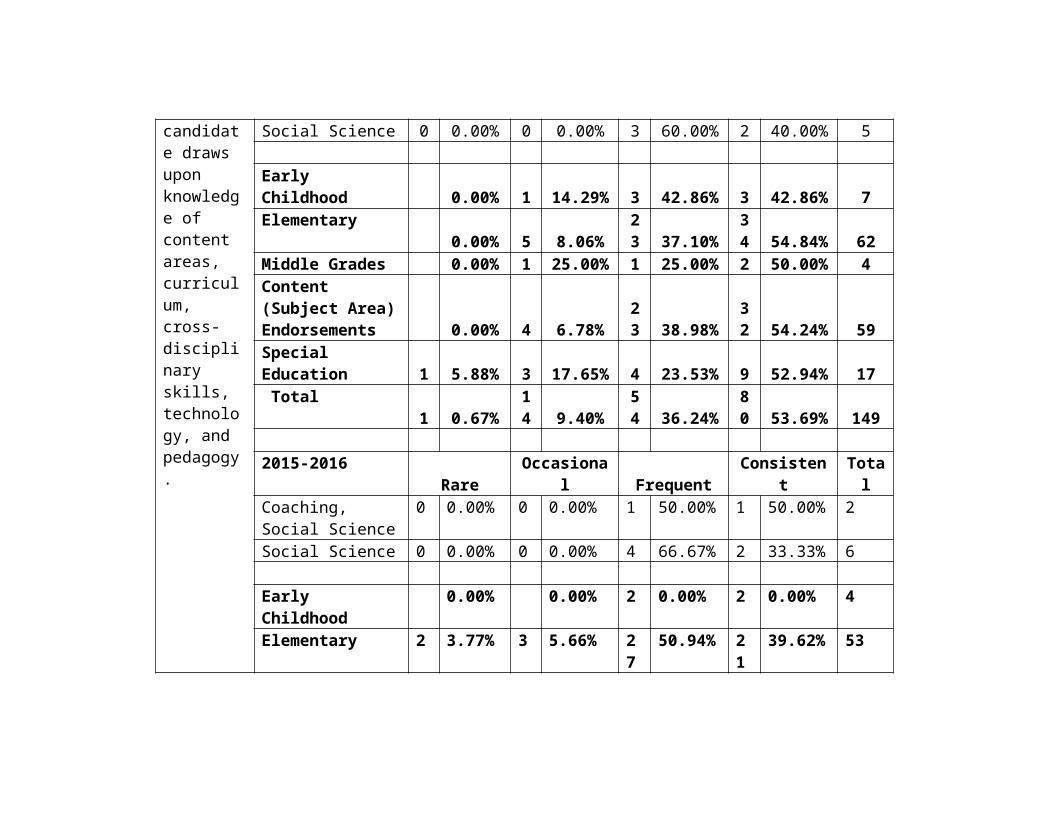
5. Instructional Practices—Assessment that Demonstrates Effects or Impact on P-12 Student Learning
Response From College of Education & Human Sciences Student Teaching Instrument Teacher Candidate Summative Evaluation for the 2014-2015 Academic Year on Planning for Learning (Item 2—Table 27A).
Table 27AItem 5: Planning for Learning
2014-2015Subject Area Scoring
Year # Item Endorsement Unsatisfactory
Basic Proficient Grand Total
2014- 2015
2 Demonstrates capacity to create useable lesson and unit plans that are based upon knowledge of the discipline, students, and curricular goals
Social Science (SSCI)
0 0.00% 6 23.08% 20 76.92% 26
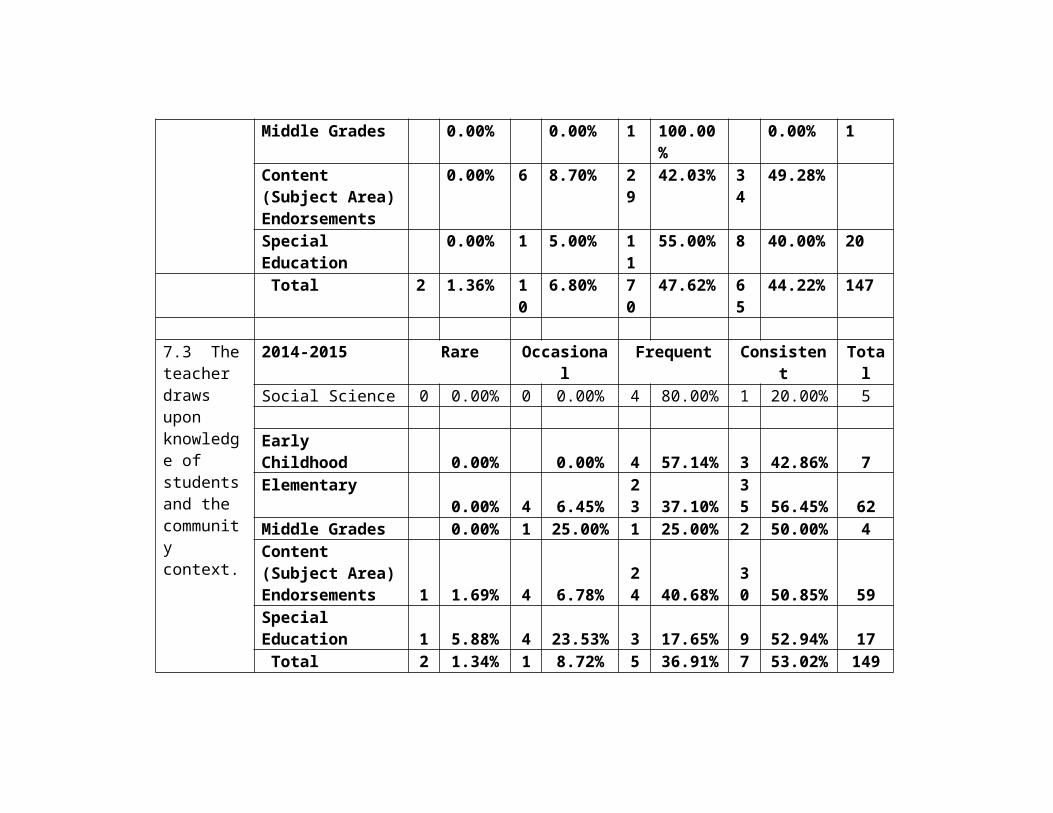
Early Childhood Education
1 2.1% 6 12.5% 41 85.4% 48
Elementary Education
0 0% 5 4.0% 120
96.0% 54
Secondary Education
0 0% 21 17.5% 99 82.5% 120
Special Education
1 2.0% 7 14.0% 42 84.0% 50
Response From College of Education & Human Sciences Student Teaching Instrument Teacher Candidate Summative Evaluation on Planning for Learning for 2015-2016 Academic Year on Planning for Learning (Item 4—Table 27B). LIVETEXT version.
Table 27B Item 4: Planning for Learning
2015-2016Subject Area Scoring
Year
# Item Endorsement Unacceptable
Emergent
Sufficient Advanced Grand
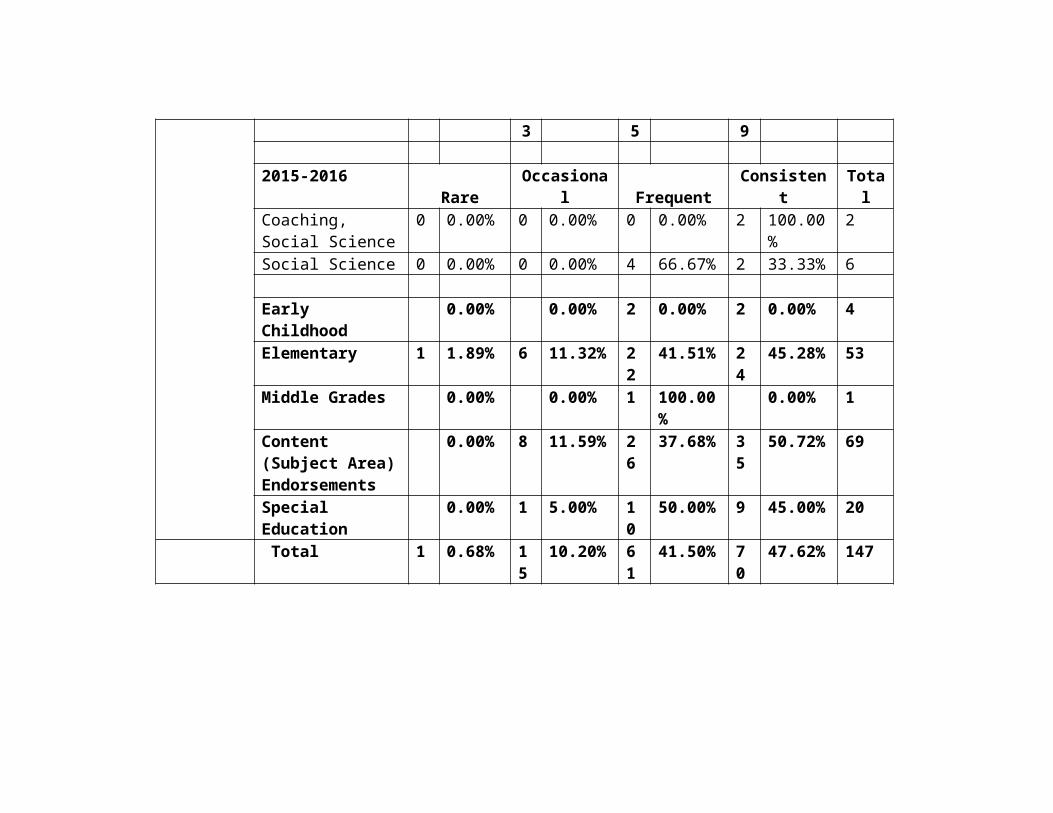
Total2015- 2016
4 Planning for learning:Creates usable lessons and unit plans based on knowledge of the discipline, students, and curricular goals
Social Science 0 0.00% 1 9.09% 9 81.82% 1 9.09% 11
Early Childhood Education
0 0.00% 1 2.94% 8 23.53% 25 73.53% 34
Elementary Education
0 0.00% 2 1.08% 53
28.65% 130 70.27% 185
Secondary Education
0 0.00% 2 2.27% 47
53.41% 39 44.32% 88
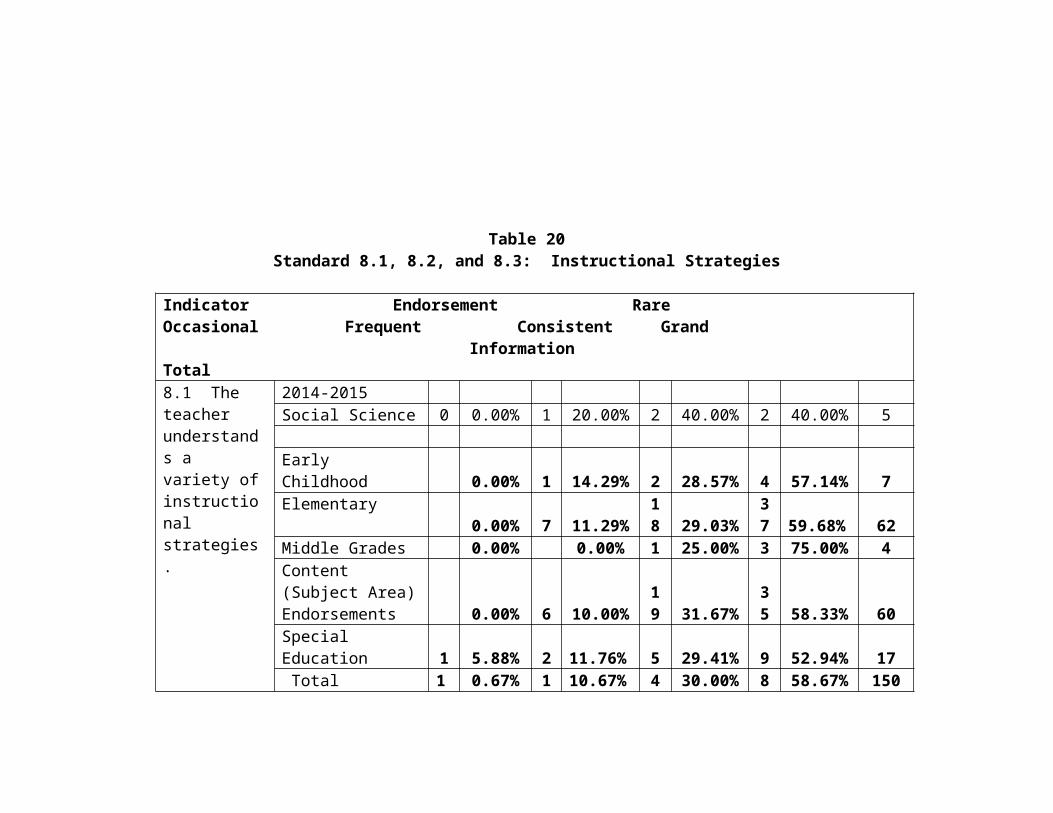
Special Education
0 0.00% 0 0.00% 24
27.91% 62 72.09% 86
Response From College of Education & Human Sciences Student Teaching Instrument Teacher Candidate Summative Evaluation for the 2014-2015 Academic Year on Instructional Enactment (Item 3—Table 28A).
Table 28AItem 3: Instructional Enactment
2014-2015Subject Area Scoring
Year # Item Endorsement Unsatisfactory
Basic Proficient Grand Total
2014- 2015
3 Demonstrates Capacity to implement, modify, and adapt plans that are responsive to students and curricular goals
Social Science (SSCI)
0 0.00% 4 15.38% 22 84.62% 26
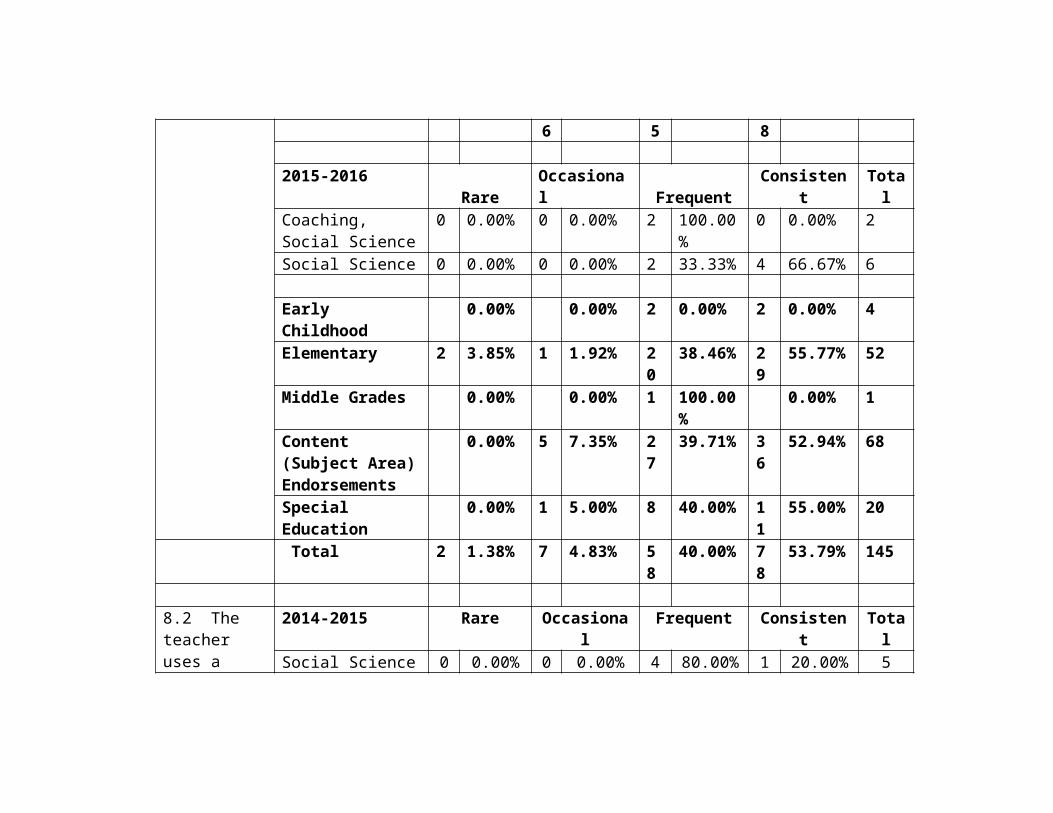
Early Childhood Education
0 0% 5 10.2% 44 89.8% 49
Elementary Education
0 0% 8 6.4% 117
93.6% 125
Secondary Education
1 0.8% 12 10.0% 107
89.2% 120
Special Education
1 2.0% 5 10.0% 44 88.0% 50
Response From College of Education & Human Sciences Student Teaching Instrument Teacher Candidate Summative Evaluation on Planning for Learning for 2015-2016 Academic Year on Responsive Teaching (Item 5—Table 28B)—LIVETEXT version.
Table 28BItem 5: Responsive Teaching
2015-2016Subject Area Scoring
Year
# Item Endorsement Unacceptable
Emergent
Sufficient Advanced Grand
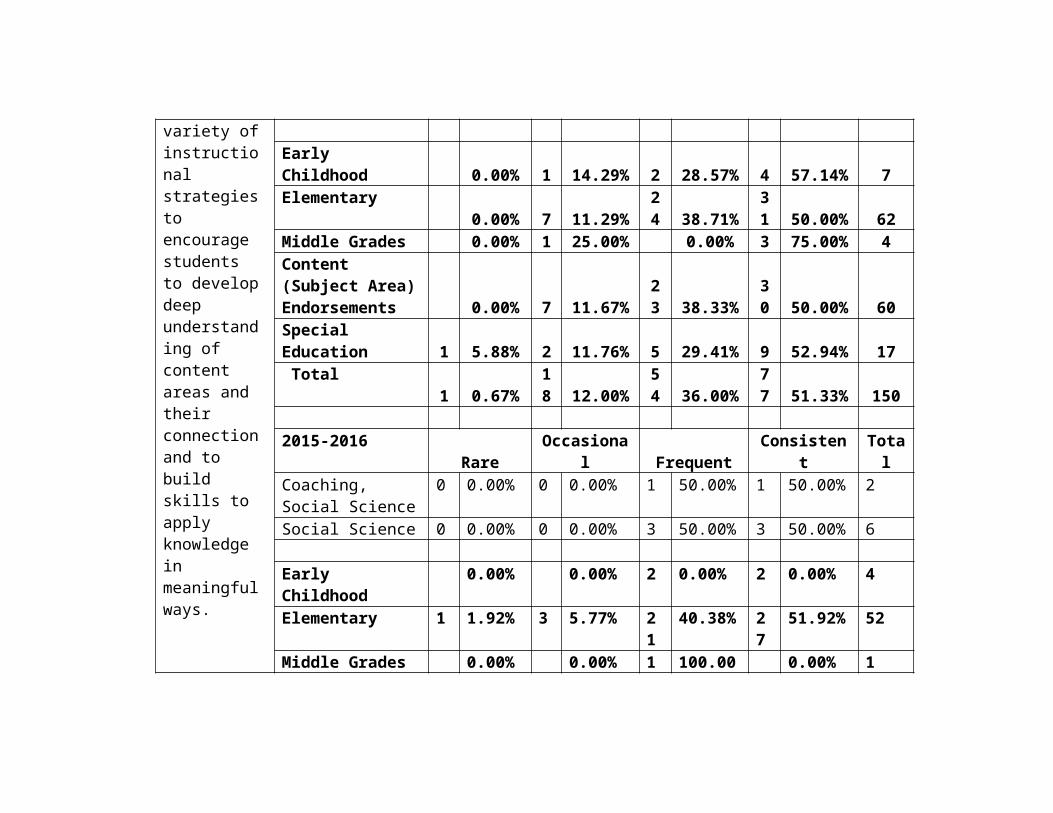
Total2015- 2016
5 Responsive Teaching:
Skillfully implements lessons that are flexible and intentional to meet individual student needs
Social Science 0 0.00% 0 0.00% 7 63.64% 4 36.36% 11
Early Childhood Education
0 0.00% 0 0.00% 9 26.47% 25 73.53% 34
Elementary Education
0 0.00% 2 1.08% 58
31.35% 125 67.57% 185
Secondary Education
0 0.00% 6 6.90% 38
43.68% 43 49.43% 87
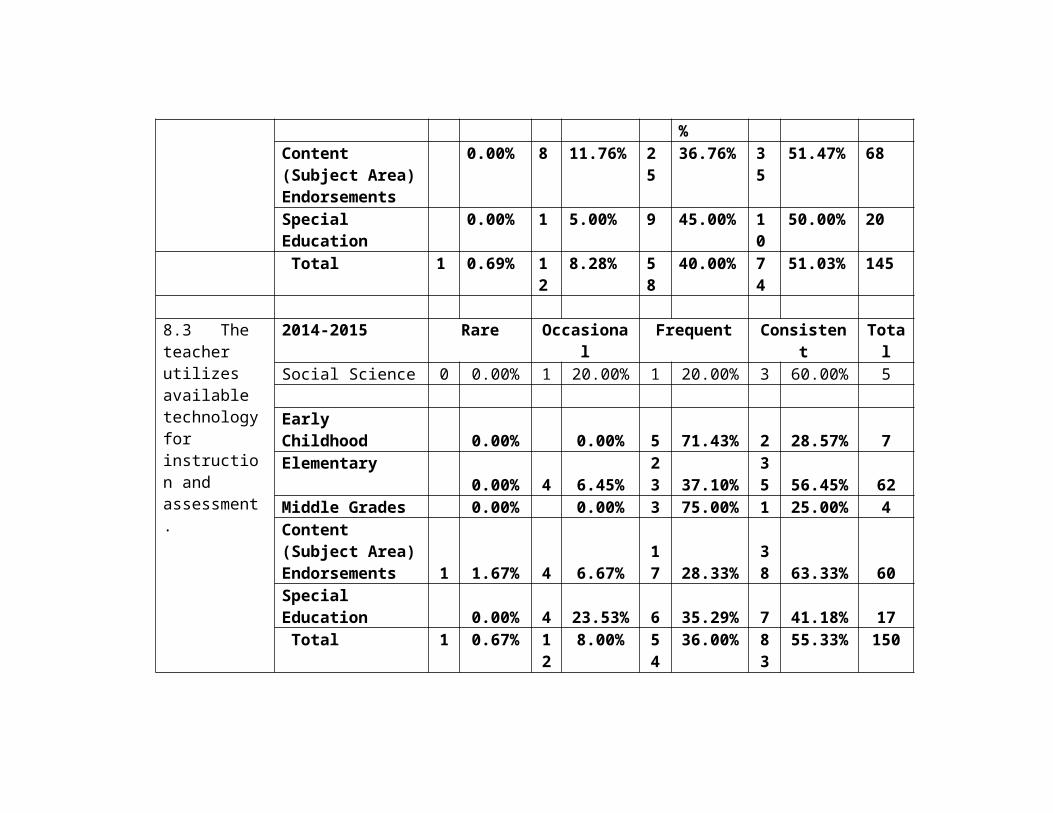
Special Education
0 0.00% 1 1.16% 24
27.91% 61 70.93% 86
Response From College of Education & Human Sciences Student Teaching Instrument Teacher Candidate Summative Evaluation for the 2014-2015 Academic Year on Classroom Interaction with Students (Item 5—Table 29A).
Table 29AItem 5: Classroom Interaction With Students
2014-2015Subject Area Scoring
Year # Item Endorsement Unsatisfactory
Basic Proficient Grand Total
2014- 2015
5 Demonstrate a capacity to interact with learners in supportive and constructive ways
Social Science (SSCI)
0 0.00% 3 11.54% 23 88.46% 26
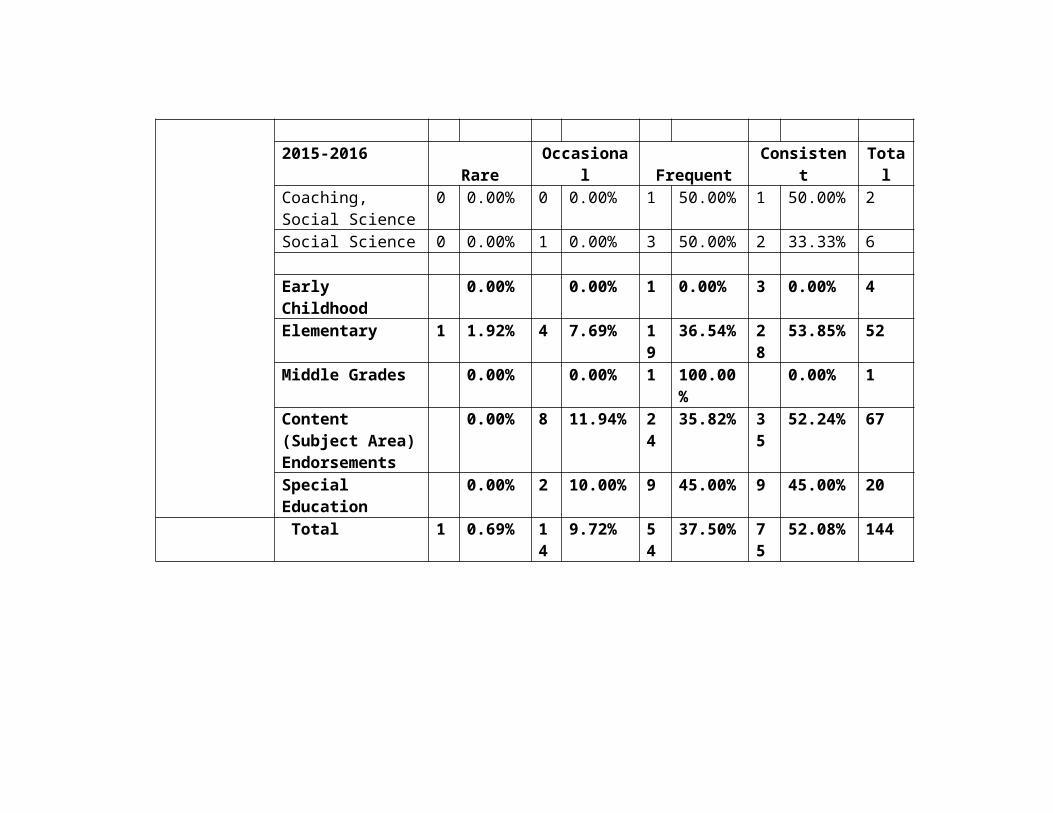
Early Childhood Education
0 0% 1 2.0% 48 98.0% 49
Elementary Education
0 0% 2 1.6% 123
98.4% 125
Secondary Education
0 0% 8 6.7% 112
93.3% 120
Special Education
0 0% 1 2.0% 49 98.0% 50
Response From College of Education & Human Sciences Student Teaching Instrument Teacher Candidate Summative Evaluation on Planning for Learning for the 2015-2016 Academic Year on Relationships with Students (Item 7—Table 29B)—LIVETEXT Version.
Table 29BItem 7: Relationships With Students
2015-2016Subject Area Scoring
Year
# Item Endorsement Unacceptable
Emergent
Sufficient Advanced Grand Total
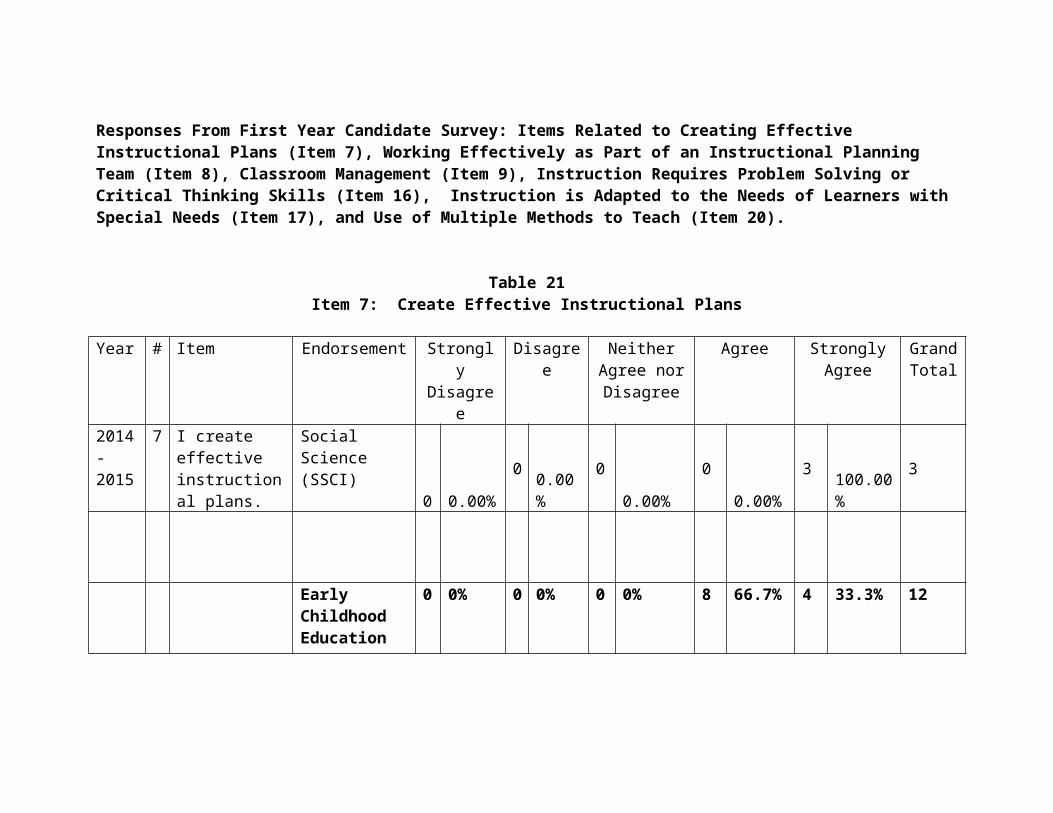
2015- 2016
7 Relationships with Students:Develops and Maintains rapport with individual and groups of students
Social Science 0 0.00% 2 18.18%
1 9.09% 8 72.73% 11
Early Childhood Education
0 0.00% 0 0.00% 4 11.76% 30 88.24% 34
Elementary Education
0 0.00% 1 0.54% 27
14.59% 157 84.86% 185
Secondary Education
0 0.00% 4 4.55% 25
28.41% 59 67.05% 88
Special Education
0 0.00% 1 1.16% 8 9.30% 77 89.53% 86
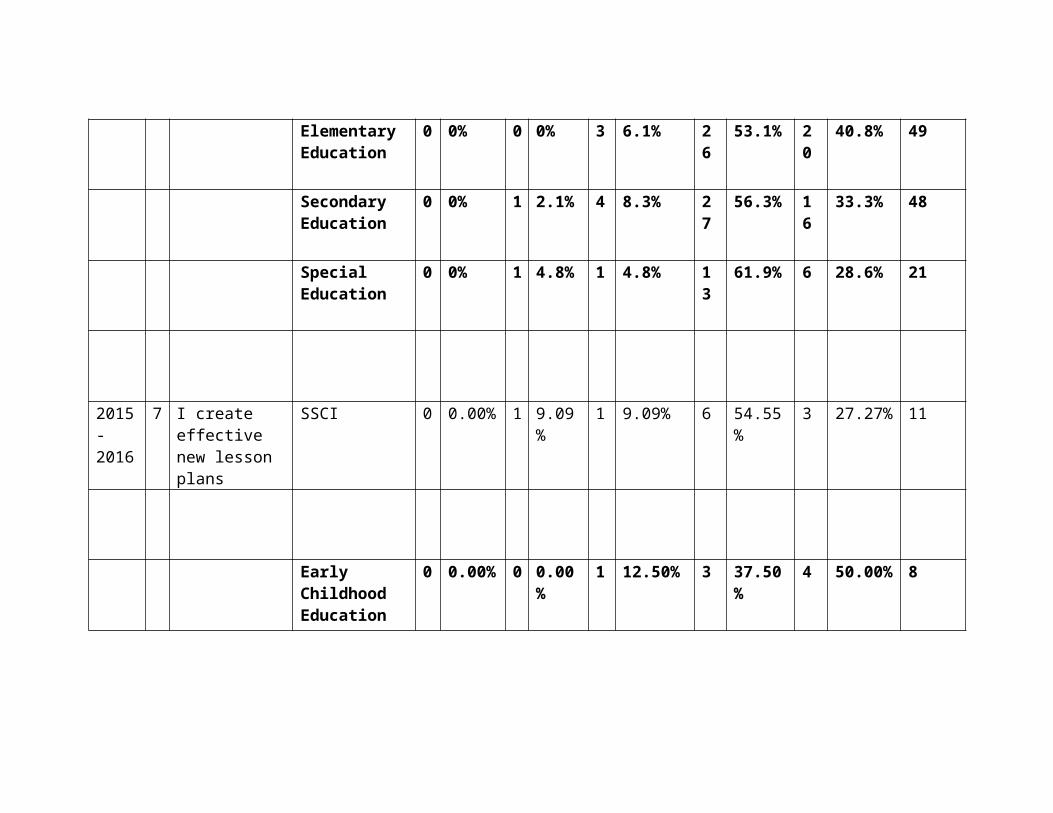
Responses From First Year Administrator Survey on Assessment (Items 6.1 and 6.2)
Table 30Standard 6.1 and 6.2: Assessment
Indicator Endorsement Rare Occasional Frequent Consistent Grand Information Total6.1 The teacher understands multiple methods of assessment
2014-2015Social Science 0 0.00% 2 40.00% 1 20.00% 2 40.00% 5
Early Childhood 0.00% 0.00% 4 57.14% 3 42.86% 7Elementary 0.00% 5 8.06% 26 41.94% 31 50.00% 62Middle Grades 0.00% 1 25.00% 0.00% 3 75.00% 4Content (Subject Area) Endorsements 1 1.67% 8 13.33% 24 40.00% 27 45.00% 60Special Education 1 5.88% 2 11.76% 5 29.41% 9 52.94% 17 Total 2 1.33% 16 10.67% 59 39.33% 73 48.67% 150
2015-2016 Rare Occasional Frequent Consistent TotalCoaching, Social Science
0 0.00% 0 0.00% 1 50.00% 1 50.00% 2
Social Science 0 0.00% 1 0.00% 4 66.67% 1 16.67% 6
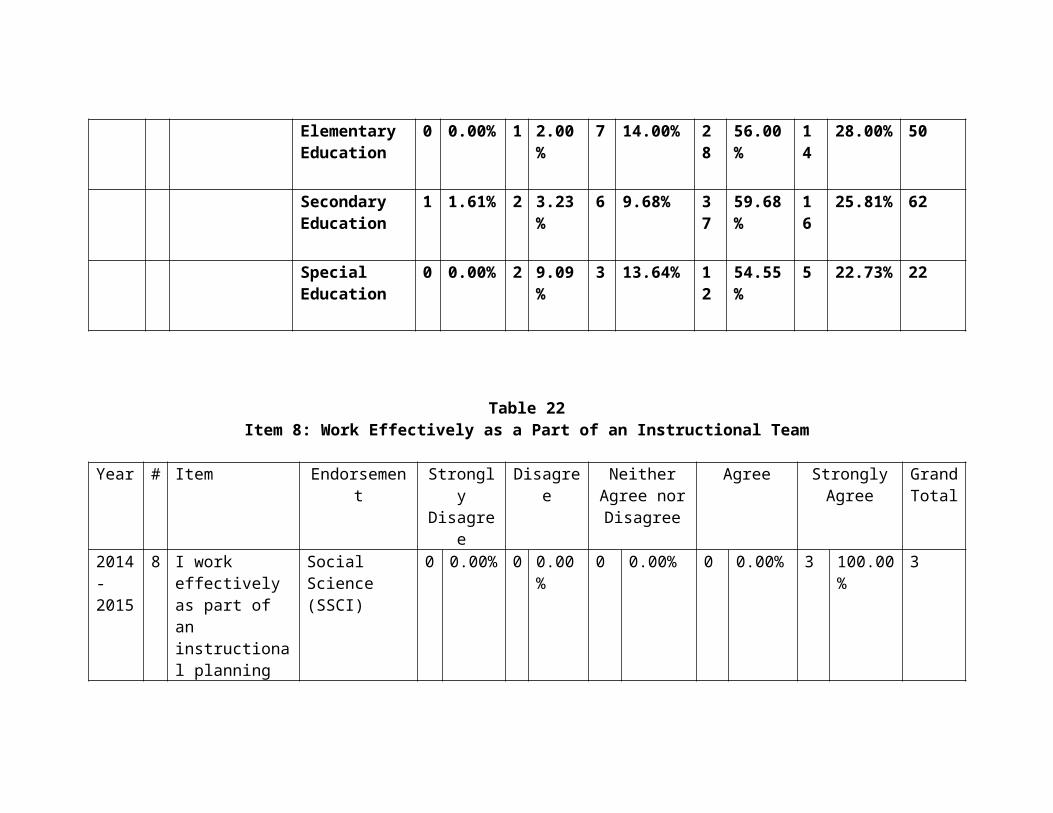
Early Childhood 0.00% 0.00% 1 0.00% 3 0.00% 4Elementary 1 1.89% 6 11.32% 23 43.40% 23 43.40% 53Middle Grades 0.00% 0.00% 1 100.00% 0.00% 1Content (Subject Area) Endorsements
0.00% 7 10.29% 29 42.65% 32 47.06% 68
Special Education 0.00% 3 15.00% 9 45.00% 8 40.00% 20 Total 1 0.68% 16 10.96% 63 43.15% 66 45.21% 146
6.2 The teacher uses multiple methods of assessment to engage students in their own growth, to monitor student progress, and to guide the teacher candidate’
2014-2015 Rare Occasional Frequent Consistent TotalSocial Science 0 0.00% 2 40.00% 1 20.00% 2 40.00% 5
Early Childhood 0.00% 0.00% 4 57.14% 3 42.86% 7Elementary 0.00% 4 6.45% 27 43.55% 31 50.00% 62Middle Grades 0.00% 1 25.00% 1 25.00% 2 50.00% 4Content (Subject Area) Endorsements 1 1.67% 8 13.33% 30 50.00% 21 35.00% 60Special Education 1 5.88% 3 17.65% 5 29.41% 8 47.06% 17 Total 2 1.33% 16 10.67% 67 44.67% 65 43.33% 150
2015-2016 Rare Occasional Frequent Consistent TotalCoaching, Social Science
0 0.00% 0 0.00% 0 0.00% 2 100.00% 2
Social Science 0 0.00% 0 0.00% 5 83.33% 1 16.67% 6
Early Childhood 0.00% 0.00% 2 0.00% 2 0.00% 4
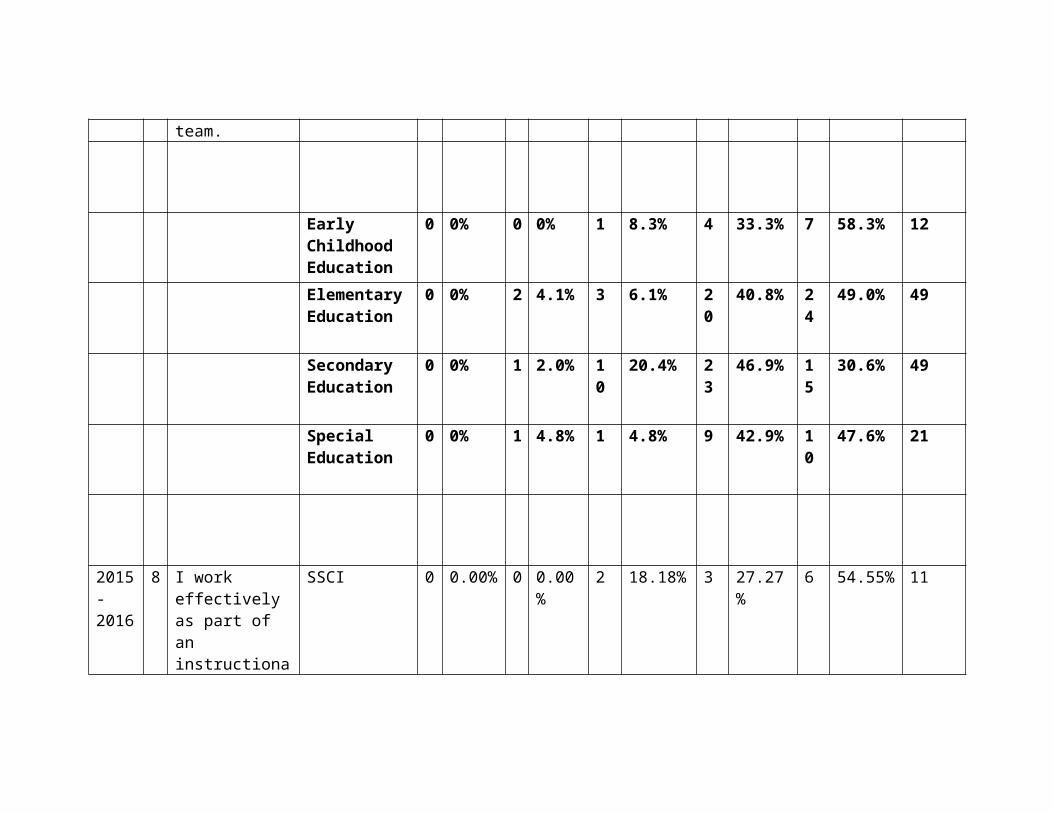
s and student’s decision making.
Elementary 1 1.89% 9 16.98% 25 47.17% 18 33.96% 53Middle Grades 0.00% 0.00% 1 100.00% 0.00% 1Content (Subject Area) Endorsements
0.00% 8 11.76% 24 35.29% 36 52.94% 68
Special Education 0.00% 2 10.00% 10 50.00% 8 40.00% 20 Total 1 0.68% 19 13.01% 62 42.47% 64 43.84% 146
Responses From First Year Candidate Survey: Items Related to Assessment: Creates Effective Assessments to Measure Learning (Item 10).
Table 31 Standard 10: Creates Effective Assessments to Measure Learning
Year # Item Endorsement
Strongly Disagree
Disagree
Neither Agree nor Disagree
Agree Strongly Agree
Grand
Total2014 - 2015
10
I create effective assessments to measure learning.
Social Science (SSCI) 0
0.00%
00.00%
0
0.00%
133.33%
266.67%
3
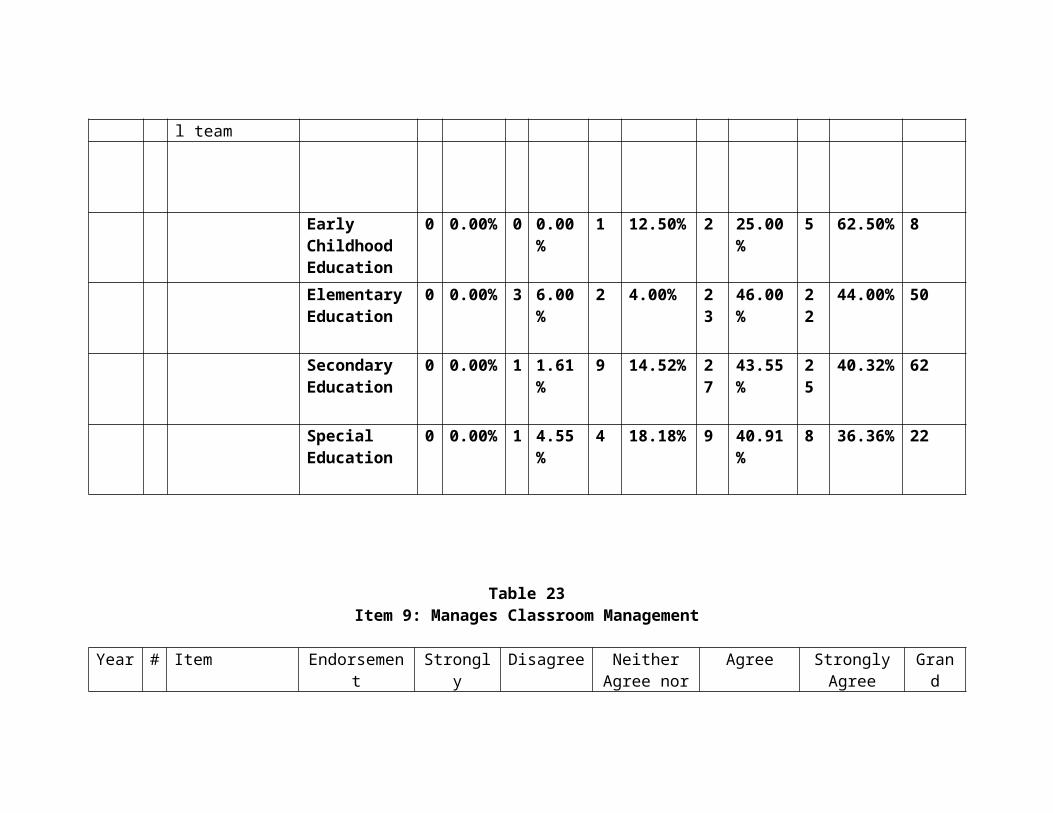
Early Childhood Education
1 8.3% 2 16.7%
2 16.7% 5 41.7% 2 16.7% 12
Elementary Education
0 0% 3 6.1% 4 8.2% 33
67.3% 9 18.4% 49
Secondary Education
0 0% 1 2.0% 8 16.3% 33
67.3% 7 14.3% 49
Special Education
0 0% 4 19.0%
2 9.5% 11
52.4% 4 19.0% 21
2015-2016
10
I create effective assessments to measure learning
SSCI 0 0.00% 1 9.09%
1 9.09% 4 36.36% 5 45.45% 11
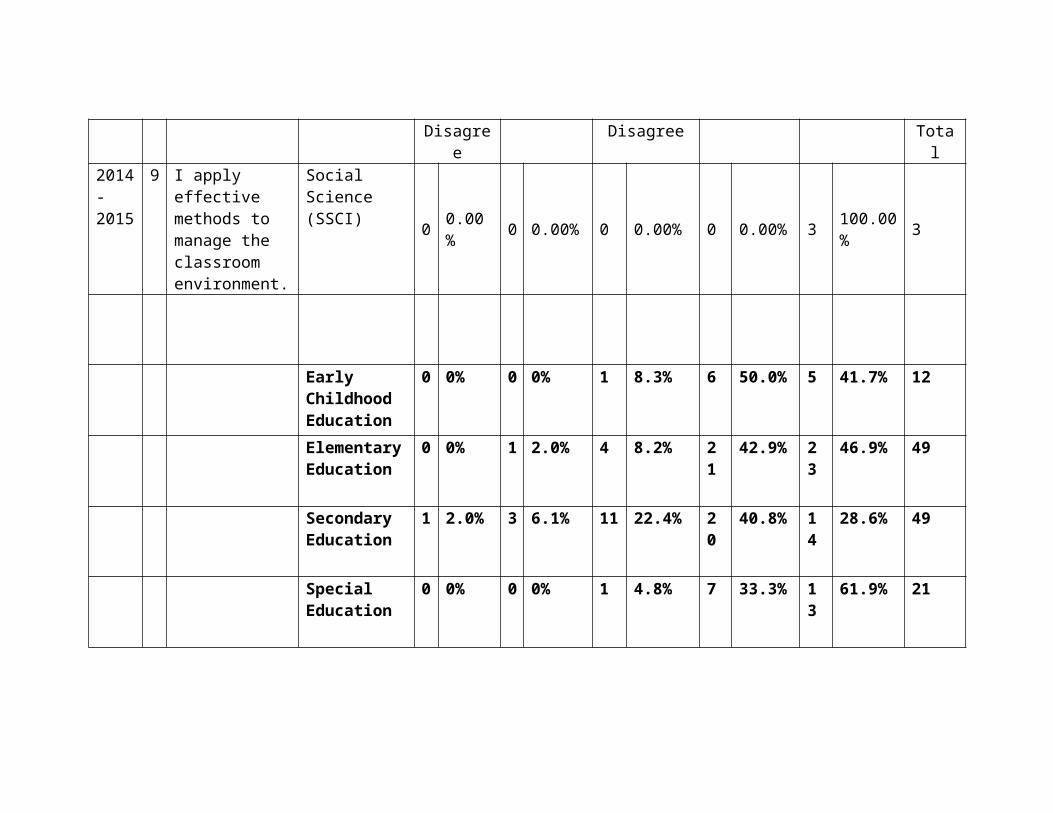
Early Childhood Education
0 0.00% 0 0.00%
0 0.00% 4 50.00% 4 50.00% 8
Elementary Education
0 0.00% 2 4.08%
5 10.20% 29
59.18% 13 26.53% 49
Secondary Education
0 0.00% 2 3.23%
10 16.13% 37
59.68% 13 20.97% 62
Special Education
0 0.00% 0 0.00%
2 9.09% 15
68.18% 5 22.73% 22
Narrative:Social Science program completers are able to create an environment that promotes communication in a manner that motivates students to be effective learners. The creation of a positive atmosphere then allows these candidates to utilize multiple methods of assessment that can monitor the learning process, the progress that students are making, and to make modifications in one’s teaching. Both administrators and the candidates themselves believe that creative assessments are being utilized and applied appropriately.
6. Professional Responsibility
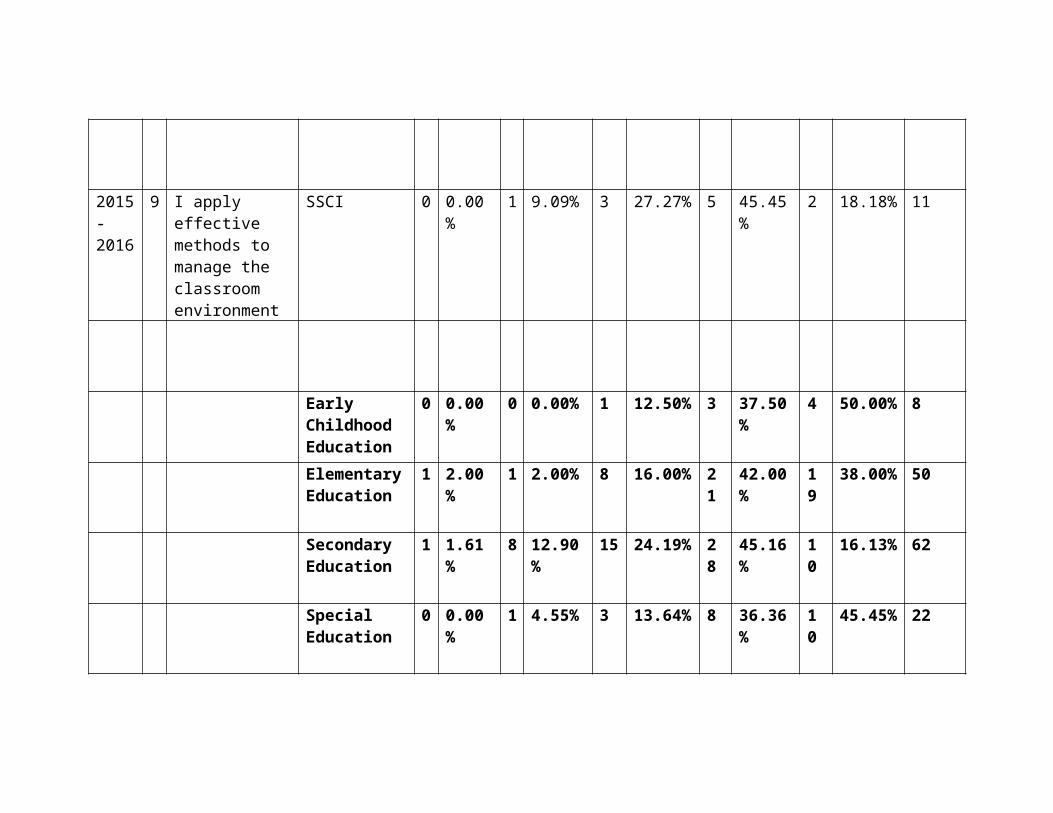
Response From College of Education & Human Sciences Student Teaching Instrument Teacher Candidate Summative Evaluation for the 2014-2015 Academic Year on Collaborative Relationships (Item 12—Table 32A).
Table 32AItem 12: Collaborative Relationships and Professional Conduct
2014-2015Subject Area Scoring
Year # Item Endorsement Unsatisfactory
Basic Proficient Grand Total
2014- 2015
12
Collaborative Relations and Professional Conduct. Demonstrates a capacity to work with other practitioners to improve teaching for the benefit of students’ learning.
Social Science (SSCI)
0.00% 3 11.54% 23 88.46% 26
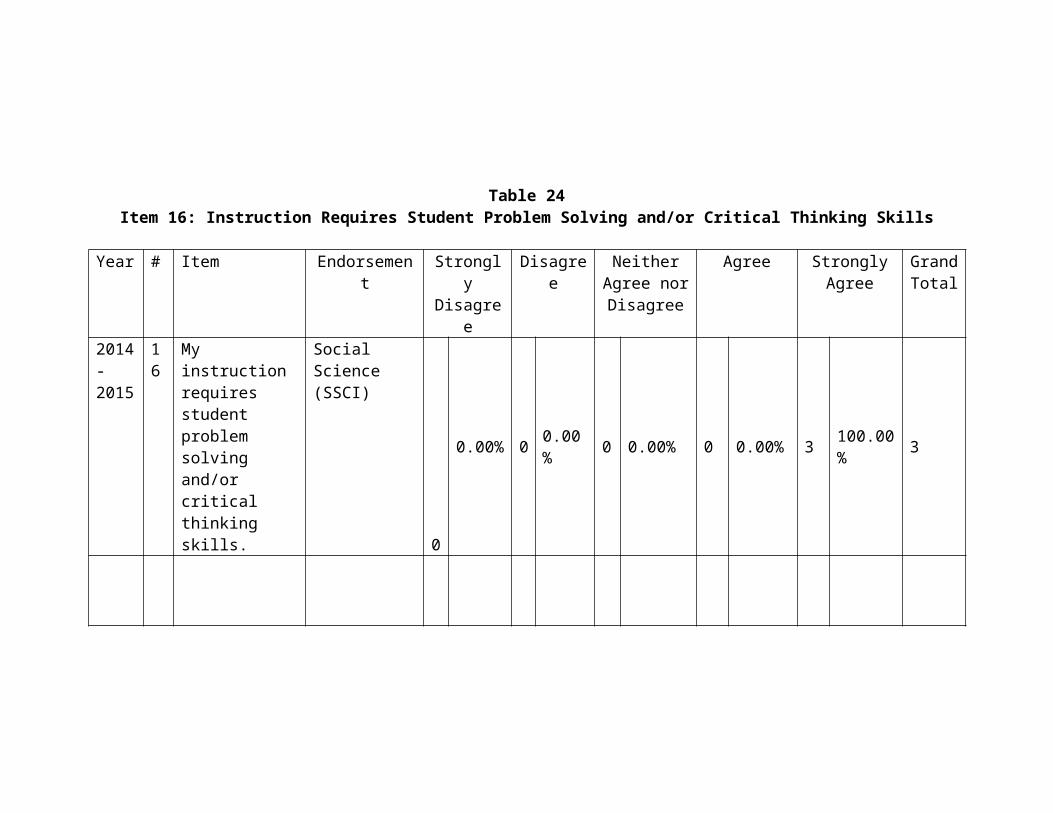
Early Childhood Education
0 0% 2 4.1% 47 95.9% 49
Elementary Education
0 0% 8 6.4% 117
93.6% 125
Secondary Education
0 0% 13 10.8% 107
89.2% 120
Special Education
0 0% 5 10.0% 45 90.0% 50
Response From College of Education & Human Sciences Student Teaching Instrument Teacher Candidate Summative Evaluation on Planning for Learning for 2015-2016 Academic Year on Collaborative Relations and Professional Conduct (Item 13—Table 32B)—LIVETEXT Version.
Table 32BItem 13: Collaborative Relations and Professional Conduct
2015-2016Subject Area Scoring
Yea # Item Endorsement Unaccepta Emergen Sufficient Advanced Gran
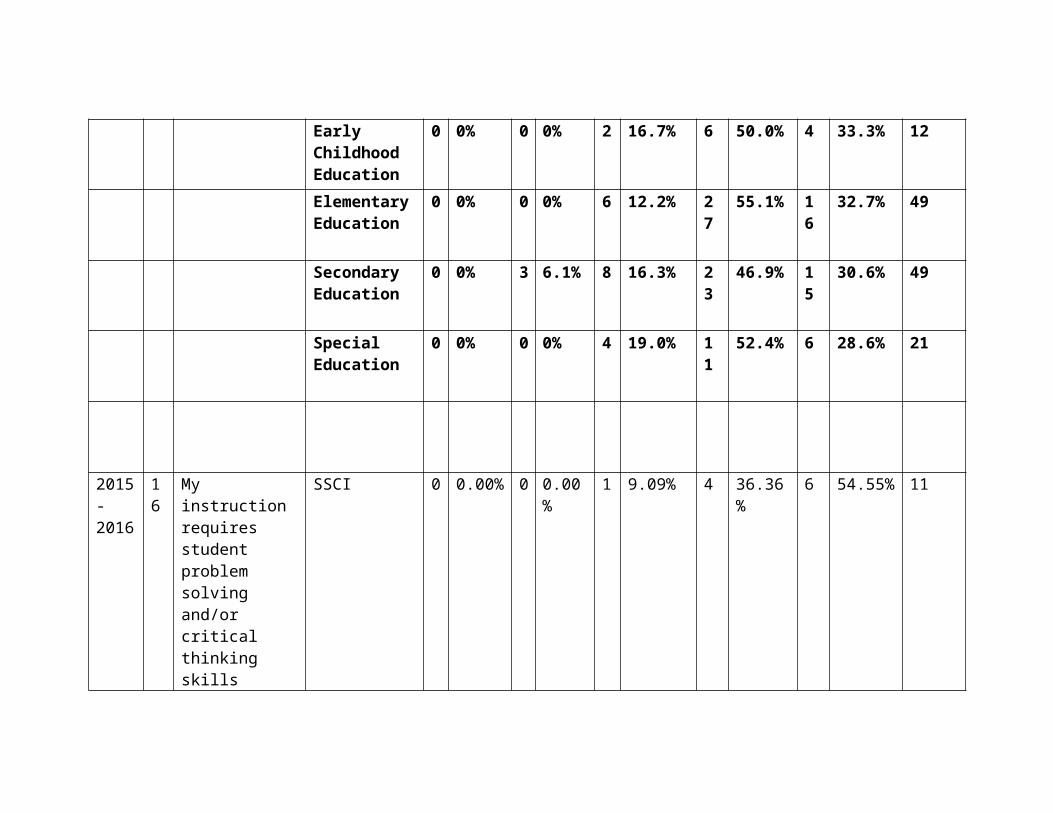
r ble t d Total
2015- 2016
13
Collaborative Relations and Professional Conduct:Uses effective communication and consultation techniques with other professionals and families for the benefit of student learning
Social Science 0 0.00% 0 0.00% 8 72.73% 3 27.27% 11
Early Childhood Education
0 0.00% 0 0.00% 13
38.24% 21 61.76% 34
Elementary Education
0 0.00% 1 0.54% 66
35.68% 118 63.78% 185
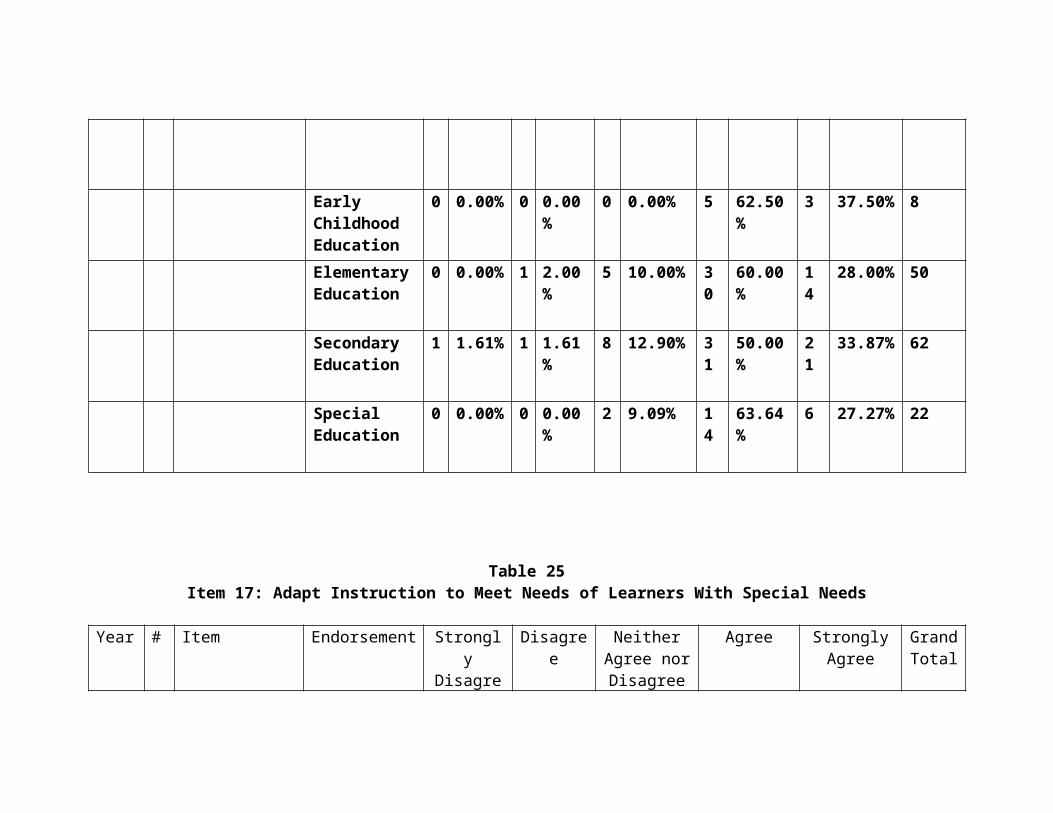
Secondary Education
0 0.00% 2 2.30% 56
64.37% 29 33.33% 87
Special Education
0 0.00% 1 1.16% 28
32.56% 57 66.28% 86
Response From College of Education & Human Sciences Student Teaching Instrument Teacher Candidate Summative Evaluation Relationships for the 2014-2015 Academic Year on Reflection and Professional Growth (Item 14—Table 33A).
Table 33AItem 14: Reflection and Professional Growth
2014-2015Subject Area Scoring
Year # Item Endorsement Unsatisfactory
Basic Proficient Grand Total
2014- 2015
14
Reflection and Professional Growth.
Social Science (SSCI)
0 0.00% 2 7.69% 24 92.31% 26
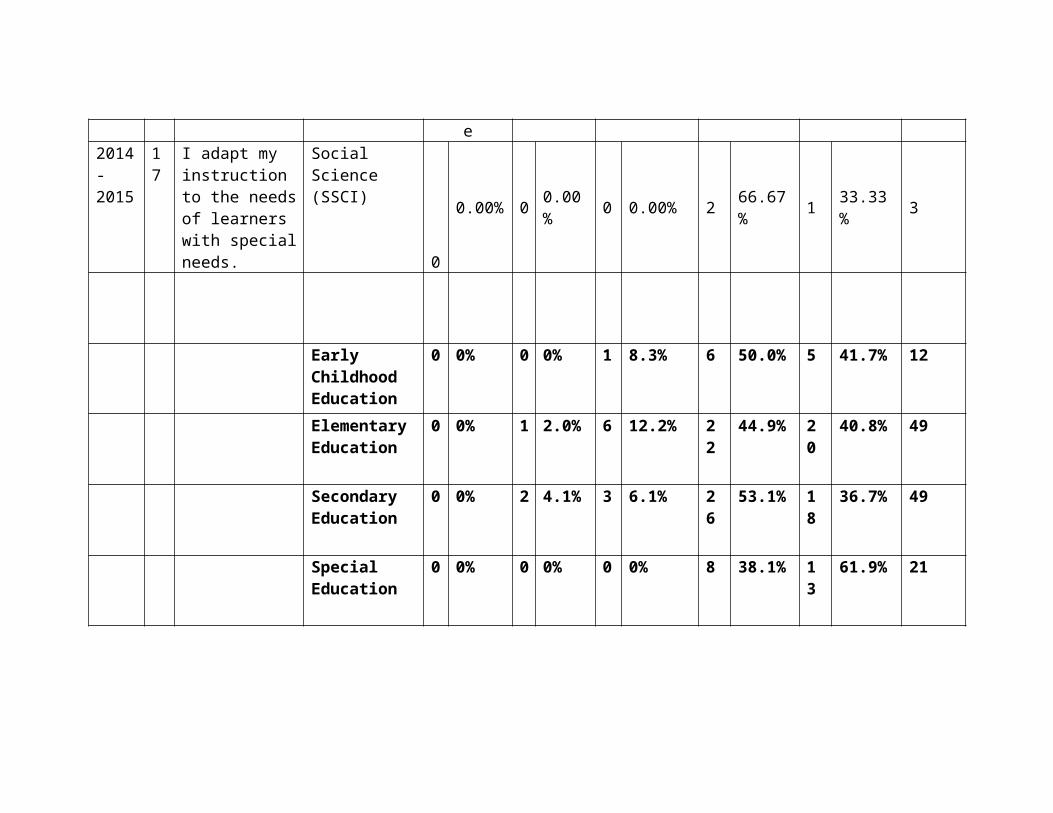
Demonstrates capacity to continually evaluate how choices and actions affect students and others in the learning community and actively seeks opportunities to grow professionally.
Early Childhood Education
0 0% 3 6.1% 46 93.9% 49
Elementary Education
0 0% 9 7.2% 116
92.8% 125
Secondary Education
0 0% 9 7.5% 111
92.5% 120
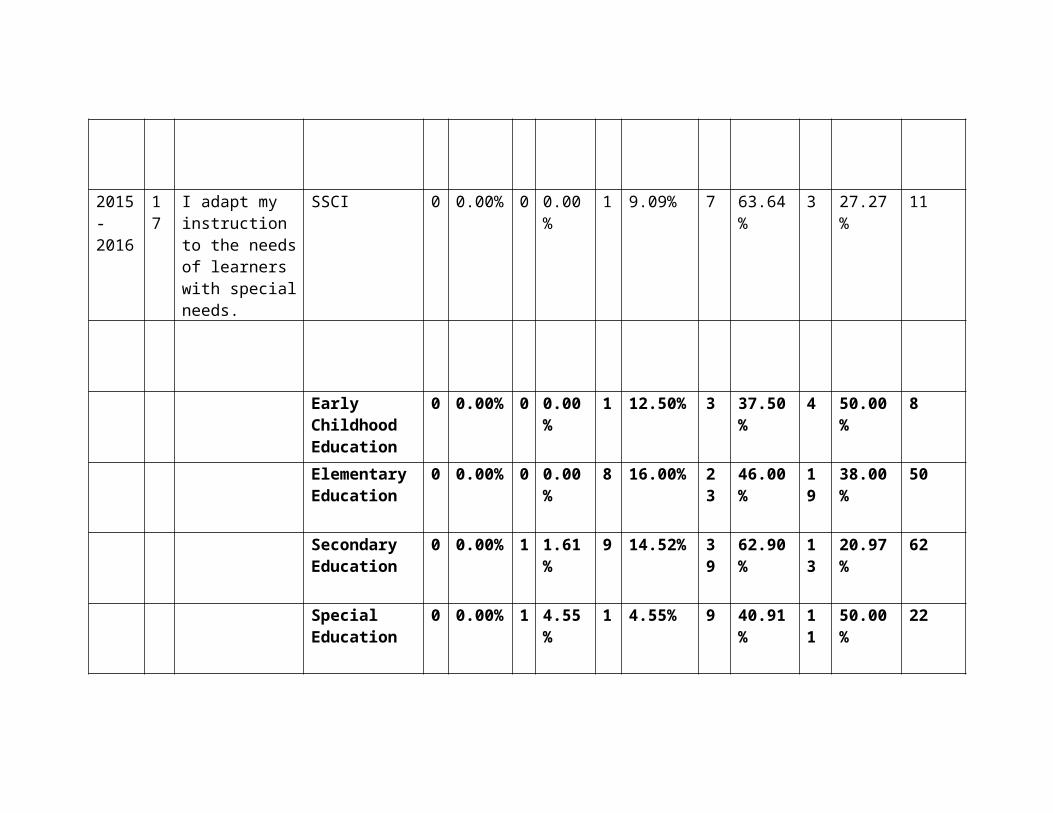
Special Education
0 0% 5 10.0% 45 90.0% 50
Response From College of Education & Human Sciences Student Teaching Instrument Teacher Candidate Summative Evaluation for the 2015-2016 Academic Year—Reflective Practices and Professional Growth (Item 14— Table 33B)—LIVETEXT Version.
Table 33BItem 14: Reflective Practices and Professional Growth
2015-16Subject Area Scoring
Year
# Item Endorsement Unacceptable
Emergent
Sufficient Advanced Grand Total
2015- 2016
14
Reflective Practices and Professional Growth:Continually evaluates how choices and actions affects students and others in the learning community, makes
Social Science 0 0.00% 3 30.00%
5 50.00% 2 20.00% 10
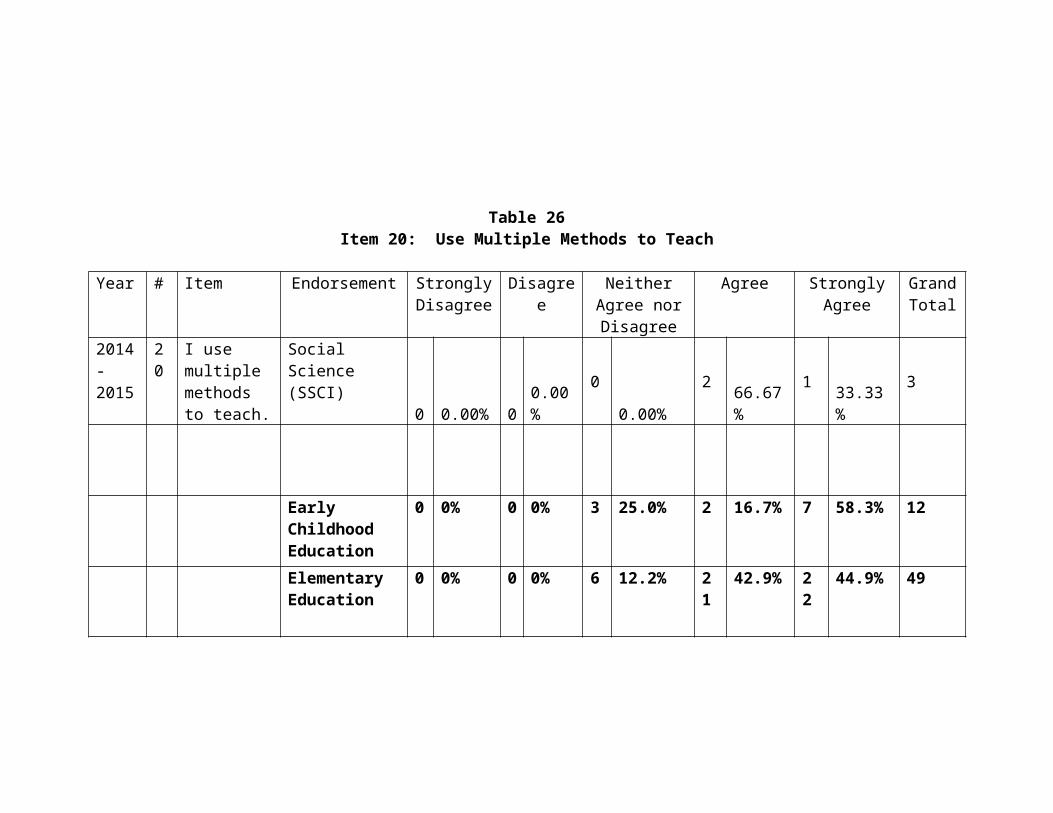
necessary adjustments and actively seeks opportunities to grow professionally
Early Childhood Education
0 0.00% 0 0.00% 16
47.06% 18 52.94% 34
Elementary Education
1 0.54% 1 0.54% 66
35.68% 117 63.24% 185
Secondary Education
0 0.00% 5 6.25% 47
58.75% 28 35.00% 80
Special Education
1 1.16% 0 0.00% 31
36.05% 54 62.79% 86
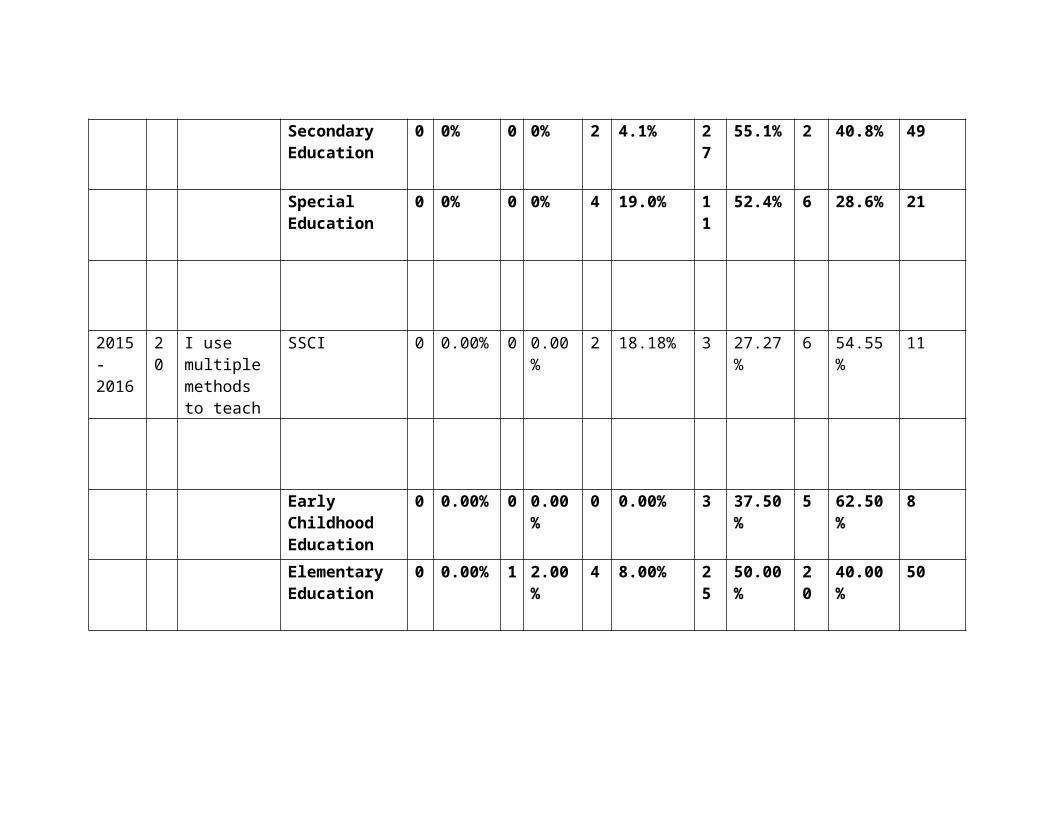
Responses From First Year Administrator Survey: Items Related to Professional Learning and Ethical Practice (Standards 9.1, 9.2, 9.3, and 9.4) and Leadership and Collaboration (Standards 10.1 and 10.2)
Table 34Standards 9.1, 9.2, 9.3, and 9.4: Professional Learning and Ethical Practice
Indicator Endorsement Rare Occasional Frequent Consistent Grand Information Total9.1 The teacher engages in ongoing professional learning.
2014-2015Social Science 0 0.00% 0 0.00% 3 60.00% 2 40.00% 5
Early Childhood 0.00% 0.00% 3 42.86% 4 57.14% 7Elementary 0.00% 9 14.52% 12 19.35% 41 66.13% 62Middle Grades 0.00% 1 25.00% 0.00% 3 75.00% 4Content (Subject Area) Endorsements
0.00% 2 3.33% 18 30.00% 40 66.67% 60
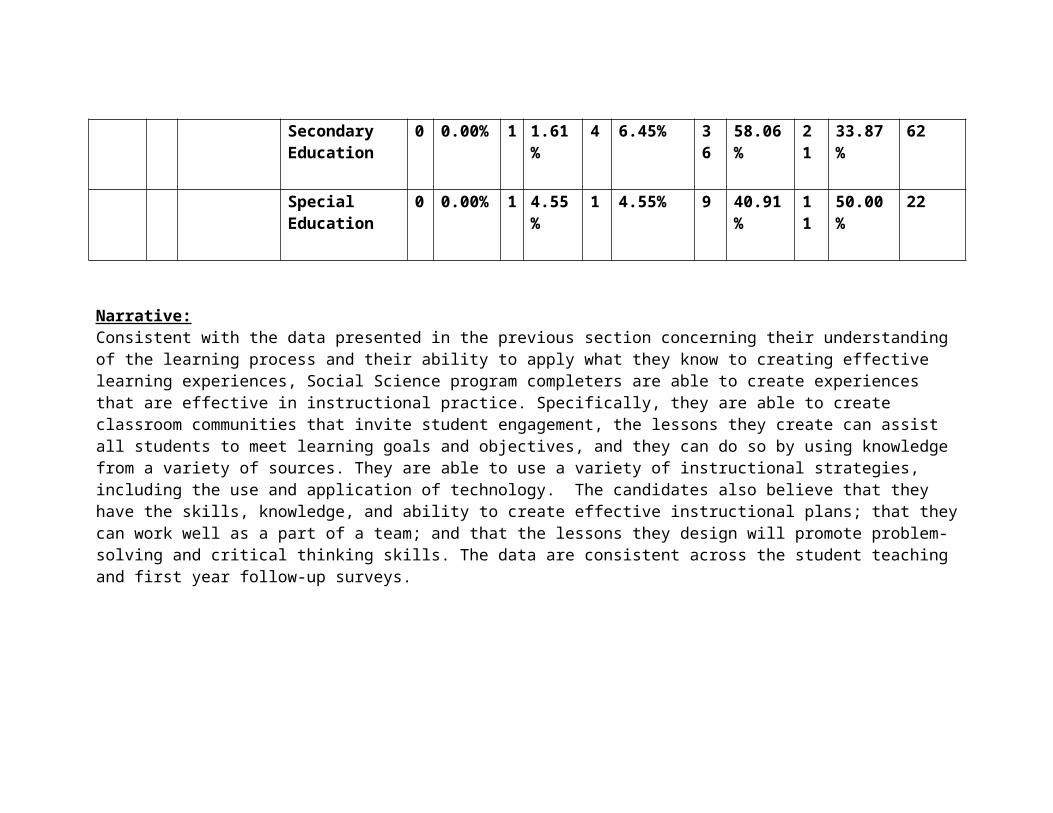
Special Education 1 5.88% 2 11.76% 3 17.65% 11 64.71% 17 Total
1 0.67%14 9.33% 36 24.00% 99 66.00% 150
2015-2016 Rare Occasional Frequent Consistent TotalCoaching, Social Science
0 0.00% 0 0.00% 1 50.00% 1 50.00% 2
Social Science 0 0.00% 1 0.00% 2 33.33% 3 50.00% 6
Early Childhood 0.00% 0.00% 2 0.00% 2 0.00% 4Elementary 1 1.89% 4 7.55% 12 22.64% 36 67.92% 53Middle Grades 0.00% 0.00% 1 100.00% 0.00% 1Content (Subject Area) Endorsements
0.00% 2 2.90% 25 36.23% 42 60.87% 69
Special Education 0.00% 4 20.00% 4 20.00% 12 60.00% 20 Total 1 0.68% 1
06.80% 44 29.93% 92 62.59% 147
9.2 The teacher models ethical professional practice.
2014-2015 Rare Occasional Frequent Consistent TotalSocial Science 0 0.00% 0 0.00% 1 20.00% 4 80.00% 5
Early Childhood 0.00% 0.00% 2 28.57% 5 71.43% 7Elementary 0.00% 4 6.45% 10 16.13% 48 77.42% 62Middle Grades 0.00% 0.00% 1 25.00% 3 75.00% 4Content (Subject Area) Endorsements
0.00% 2 3.33% 14 23.33% 44 73.33% 60
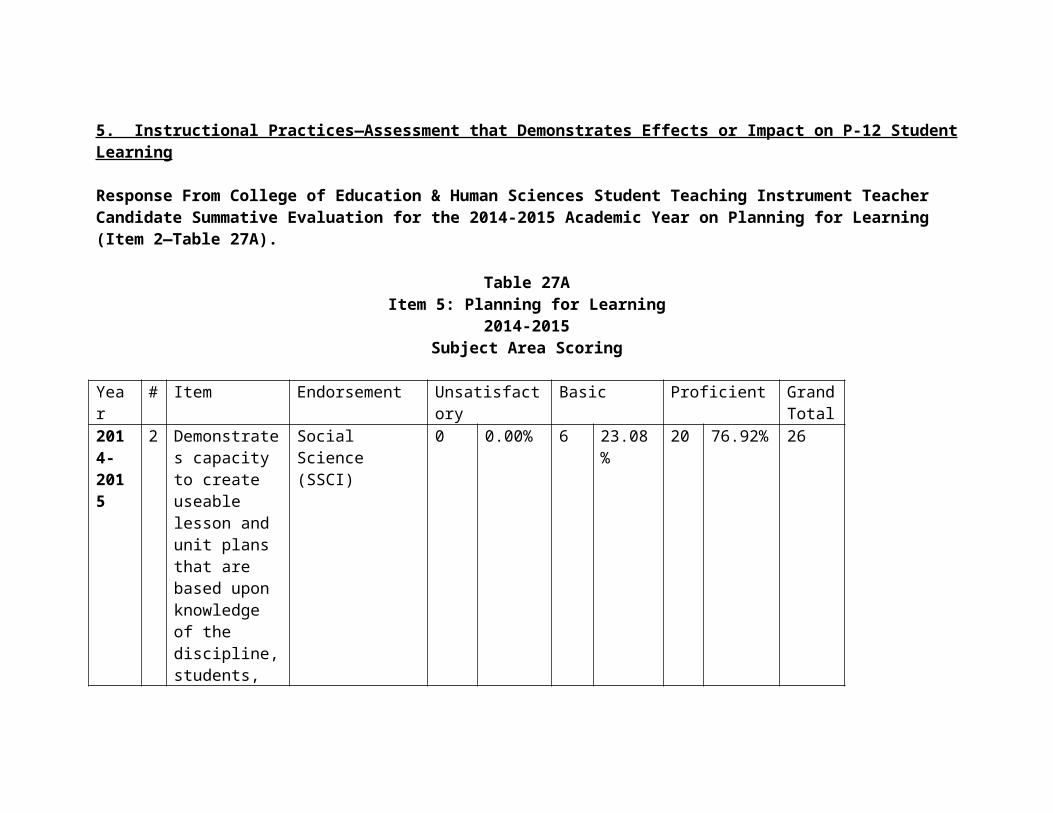
Special Education 0.00% 1 5.88% 4 23.53% 12 70.59% 17 Total
0.00% 7 4.67% 31 20.67%112 74.67% 150
2015-2016 Rare Occasional Frequent Consistent TotalCoaching, Social Science
0 0.00% 0 0.00% 0 0.00% 2 100.00% 2
Social Science 0 0.00% 0 0.00% 2 33.33% 4 66.67% 6
Early Childhood 0.00% 0.00% 0.00% 4 0.00% 4Elementary 1 1.89% 0.00% 14 26.42% 38 71.70% 53Middle Grades 0.00% 0.00% 1 100.00% 0.00% 1Special Education 0.00% 1 5.00% 5 25.00% 14 70.00% 20Content (Subject Area) Endorsements
0.00% 1 1.45% 8 11.59% 60 86.96% 69
Total 1 0.68% 2 1.36% 28 19.05% 116
78.91% 147
9.3 The teacher uses evidence to continually evaluate his/her practice, particularly the effects of his/her
2014-2015 Rare Occasional Frequent Consistent TotalSocial Science 0 0.00% 0 0.00% 2 40.00% 3 60.00% 5
Early Childhood 0.00% 0.00% 3 42.86% 4 57.14% 7Elementary 1 1.61% 0.00% 28 45.16% 33 53.23% 62Middle Grades 0.00% 1 25.00% 1 25.00% 2 50.00% 4Content (Subject Area) Endorsements
0.00% 1 1.67% 26 43.33% 33 55.00% 60
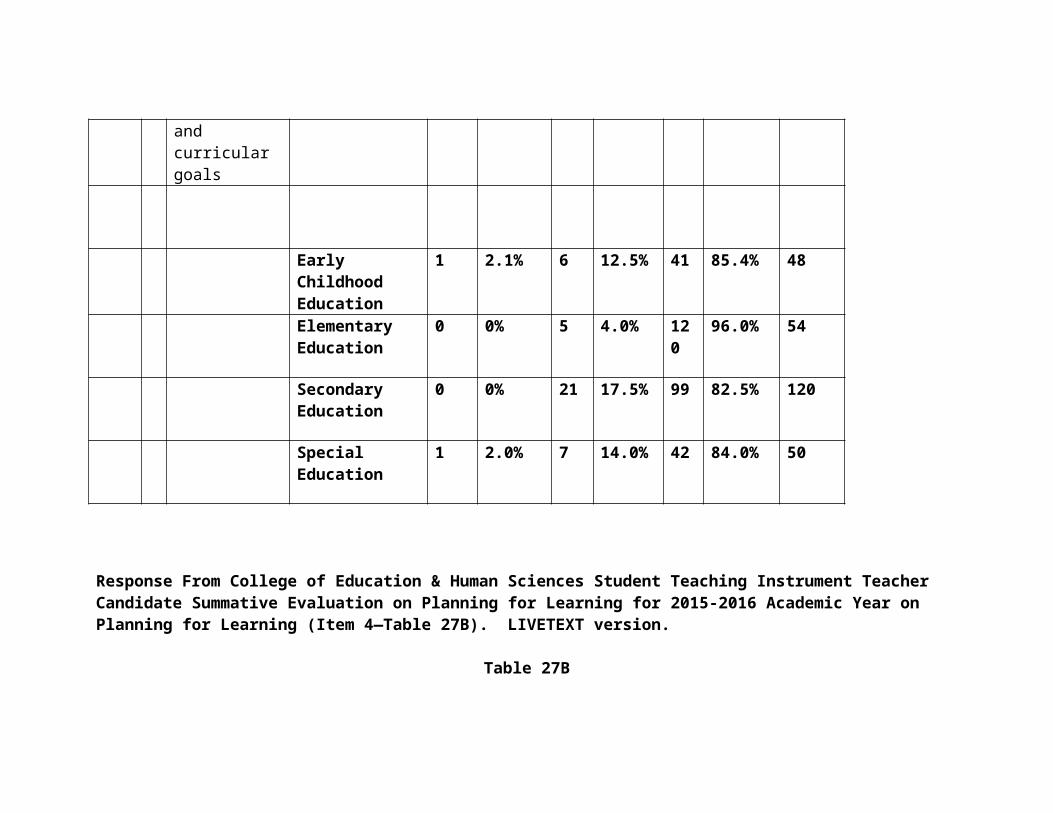
choices and actions on others (students, families, other professionals, and the community), and adapts practice to meet the needs of each student.
Special Education 0.00% 3 17.65% 4 23.53% 10 58.82% 17 Total 1 0.67% 5 3.33% 62 41.33% 82 54.67% 150
2015-2016 Rare Occasional Frequent Consistent TotalCoaching, Social Science
0 0.00% 0 0.00% 2 100.00% 0 0.00% 2
Social Science 0 0.00% 1 0.00% 3 50.00% 2 33.33% 6
Early Childhood 0.00% 0.00% 1 0.00% 3 0.00% 4Elementary 1 1.89% 3 5.66% 19 35.85% 30 56.60% 53Middle Grades 0.00% 1 100.00% 0.00% 0.00% 1Content (Subject Area) Endorsements
0.00% 4 5.80% 27 39.13% 38 55.07% 69
Special Education 0.00% 1 5.26% 8 42.11% 10 52.63% 19 Total 1 0.68% 9 6.16% 55 37.67% 81 55.48% 146
9.4 The teacher models professional dispositions for teaching.
2014-2015 Rare Occasional Frequent Consistent TotalSocial Science 0 0.00% 0 0.00% 2 40.00% 3 60.00% 5
Early Childhood 0.00% 0.00% 2 28.57% 5 71.43% 7Elementary 1 1.61% 2 3.23% 15 24.19% 44 70.97% 62Middle Grades 0.00% 0.00% 2 50.00% 2 50.00% 4Content (Subject Area) Endorsements 0.00% 4 6.78% 15 25.42% 40 67.80% 59Special Education
0.00% 2 11.76% 4 23.53% 11 64.71% 17
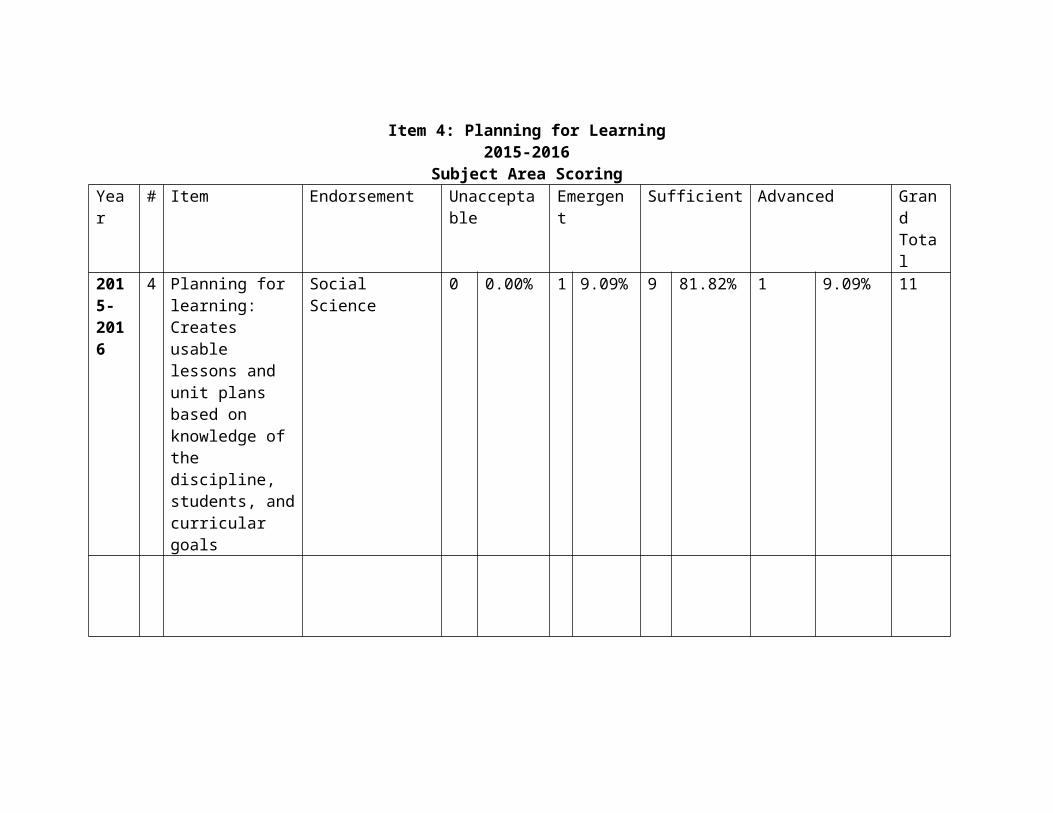
Total1 0.67% 8 5.37% 38 25.50%
102 68.46% 149
2015-2016 Rare Occasional Frequent Consistent TotalCoaching, Social Science
0 0.00% 0 0.00% 1 50.00% 1 50.00% 2
Social Science 0 0.00% 0 0.00% 2 33.33% 4 66.67% 6
Early Childhood 0.00% 0.00% 0.00% 4 0.00% 4Elementary 1 1.89% 2 3.77% 18 33.96% 32 60.38% 53Middle Grades 0.00% 0.00% 1 100.00% 0.00% 1Content (Subject Area) Endorsements
0.00% 1 1.45% 14 20.29% 54 78.26% 69
Special Education 0.00% 1 5.00% 7 35.00% 12 60.00% 20 Total 1 0.68% 4 2.72% 40 27.21% 10
269.39% 147
Table 35Standards 10.1 and 10.2: Leadership and Collaboration
Indicator Endorsement Rare Occasional Frequent Consistent Grand
Information Total
10.1 The teacher seeks
Social Science 0 0.00% 0 0.00% 4 80.00% 1 20.00% 5
Early 0.00% 0.00% 3 42.86% 4 57.14% 7
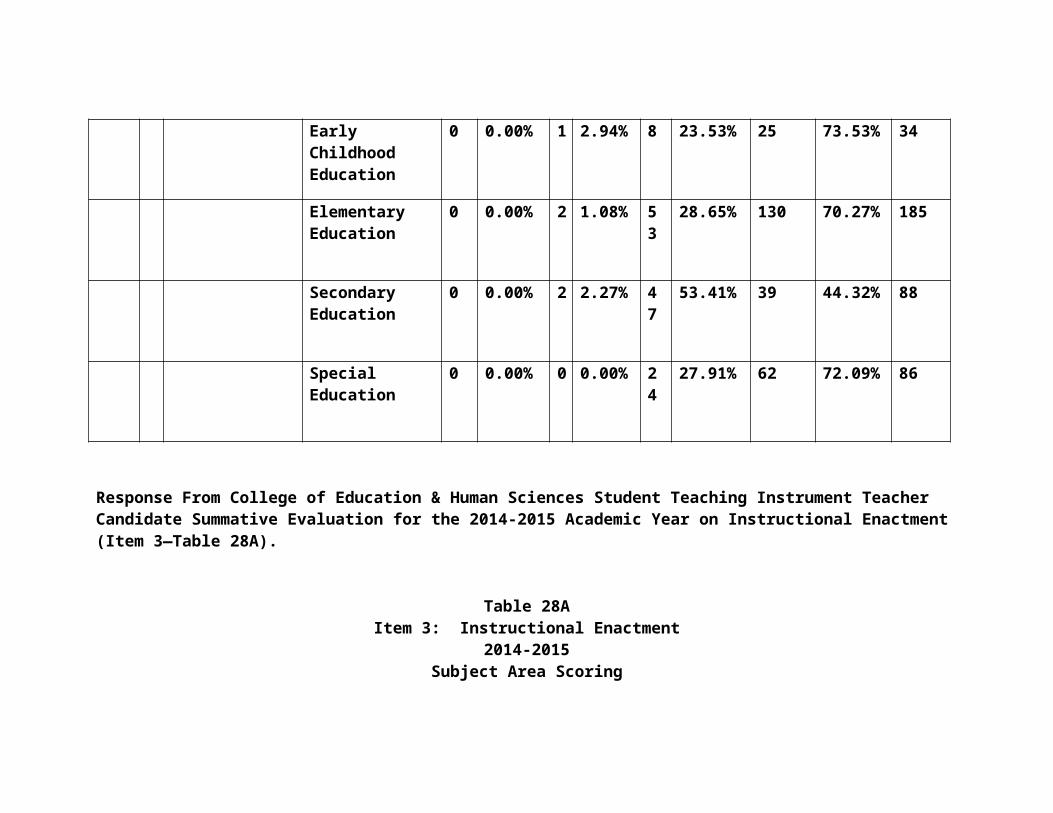
opportunities to take responsibility for student learning.
ChildhoodElementary 0.00% 5 8.06% 19 30.65% 38 61.29% 62Middle Grades 0.00% 1 33.33% 0.00% 2 66.67% 3Content (Subject Area) Endorsements 0.00% 4 6.78% 17 28.81% 38 64.41% 59Special Education 0.00% 3 17.65% 5 29.41% 9 52.94% 17 Total 0.00% 13 8.78% 44 29.73% 91 61.49% 148
2015-2016 Rare Occasional Frequent Consistent TotalCoaching, Social Science
0 0.00% 0 0.00% 1 50.00% 1 50.00% 2
Social Science 0 0.00% 0 0.00% 2 33.33% 4 66.67% 6
Early Childhood 0.00% 0.00% 1 0.00% 3 0.00% 4Elementary 1 1.89% 6 11.32% 17 32.08% 29 54.72% 53Middle Grades 0.00% 0.00% 1 100.00% 0.00% 1Content (Subject Area) Endorsements
0.00% 1 1.45% 25 36.23% 43 62.32% 69
Special Education 0.00% 2 10.00% 5 25.00% 13 65.00% 20 Total 1 0.68% 9 6.12% 49 33.33% 88 59.86% 147
10.2 The teacher seeks opportunities, including
2014-2015 Rare Occasional Frequent Consistent TotalSocial Science 1 20.00% 0 0.00% 3 60.00% 1 20.00% 5
Early Childhood 0.00% 0.00% 4 57.14% 3 42.86% 7Elementary 0.00% 3 4.92% 25 40.98% 33 54.10% 61
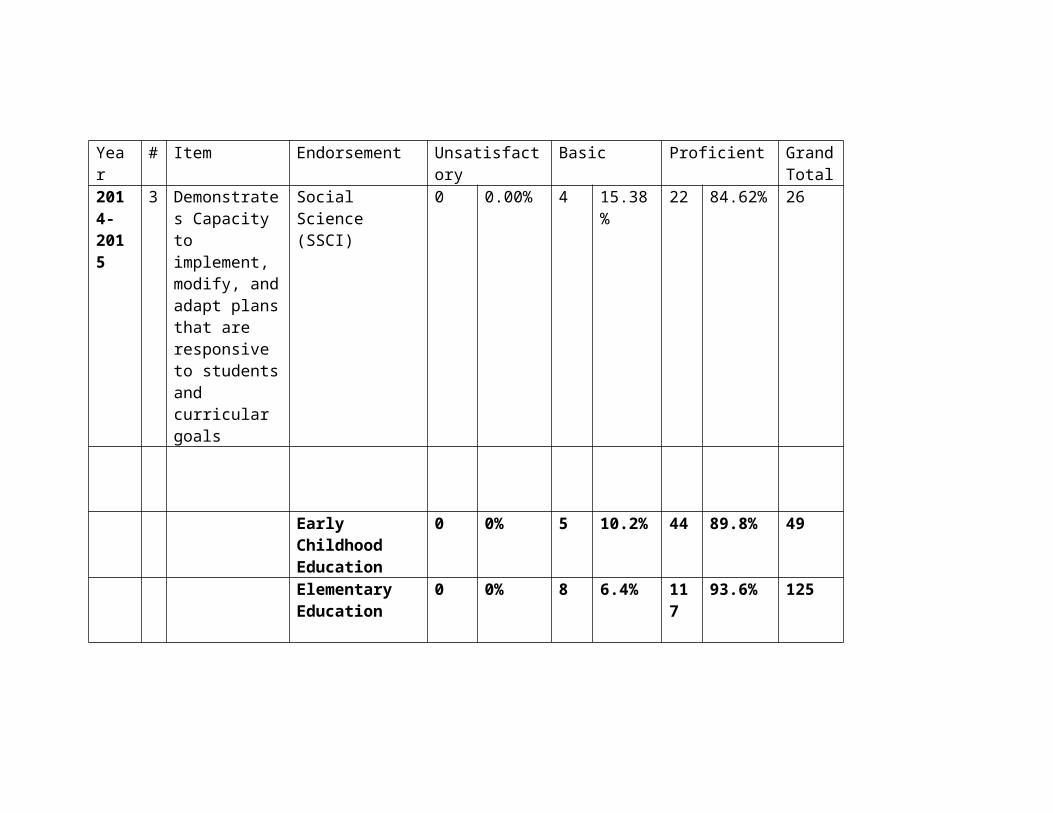
appropriate technology, to collaborate with students, families, colleagues, and other school professionals, and community members to ensure student growth
Middle Grades 0.00% 1 33.33% 1 33.33% 1 33.33% 3Content (Subject Area) Endorsements 1 1.72% 2 3.45% 23 39.66% 32 55.17% 58Special Education 0.00% 3 17.65% 5 29.41% 9 52.94% 17 Total 1 0.68% 9 6.16% 58 39.73% 78 53.42% 146
2015-2016 Rare Occasional Frequent Consistent TotalCoaching, Social Science
0 0.00% 0 0.00% 1 50.00% 1 50.00% 2
Social Science 0 0.00% 0 0.00% 3 50.00% 3 50.00% 6
Early Childhood 0.00% 0.00% 3 0.00% 1 0.00% 4Elementary 1 1.89% 6 11.32% 17 32.08% 29 54.72% 53Middle Grades 0.00% 0.00% 1 100.00% 0.00% 1Content (Subject Area) Endorsements
0.00% 4 5.80% 22 31.88% 43 62.32% 69
Special Education 0.00% 4 20.00% 3 15.00% 13 65.00% 20 Total 1 0.68% 14 9.52% 46 31.29% 86 58.50% 147
Responses From First Year Candidate Survey: Items Related to Professional Responsibility: Works Effectively With Parents (Item 12) and Takes Advantage of Opportunities to Grow Professionally (Item 15).
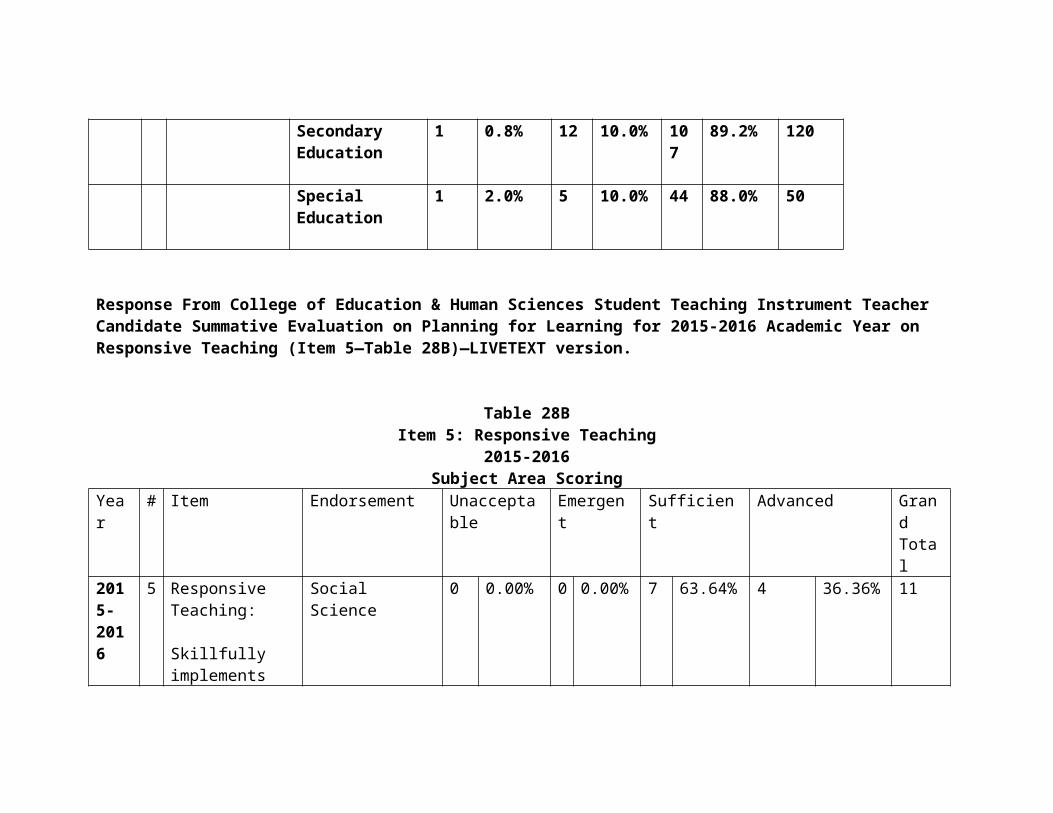
Table 36Item 12: Works Effectively with Parents
Year # Item Endorsement Strongly Disagree
Disagree
Neither Agree nor Disagree
Agree Strongly Agree
Grand Total
2014 - 2015
12
I work effectively with parents
Social Science (SSCI) 0
0.00%0 0.00
%0
0.00%2 66.67
%1 33.33
%3
Early Childhood Education
0 0% 0 0% 1 8.3% 8 66.7% 3 25.0% 12
Elementary Education
0 0% 0 0% 2 4.1% 24
49.0% 23
46.9% 49
Secondary Education
1 2.0% 3 6.1% 9 18.4% 15
30.6% 21
42.6% 49
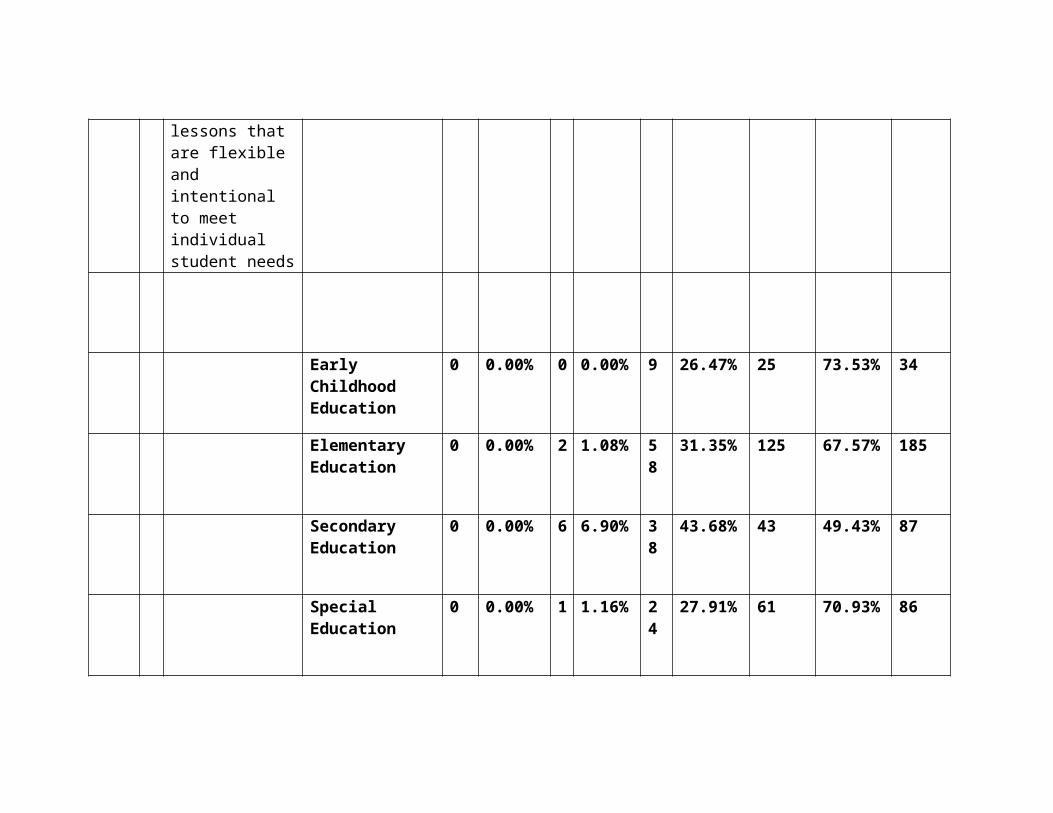
Special Education
0 0% 0 0% 0 0% 11
52.4% 10
47.6% 21
2015-2016
12
I work effectively with parents
SSCI 0 0.00% 0 0.00% 5 45.45% 4 36.36% 2 18.18% 11
Early Childhood Education
0 0.00% 0 0.00% 0 0.00% 4 50.00% 4 50.00% 8
Elementary Education
0 0.00% 2 4.00% 6 12.00% 30 60.00% 12 24.00% 50
Secondary Education
1 1.64% 2 3.28% 15 24.59% 33 54.10% 10 16.39% 61
Special Education
0 0.00% 0 0.00% 2 9.09% 15 68.18% 5 22.73% 22
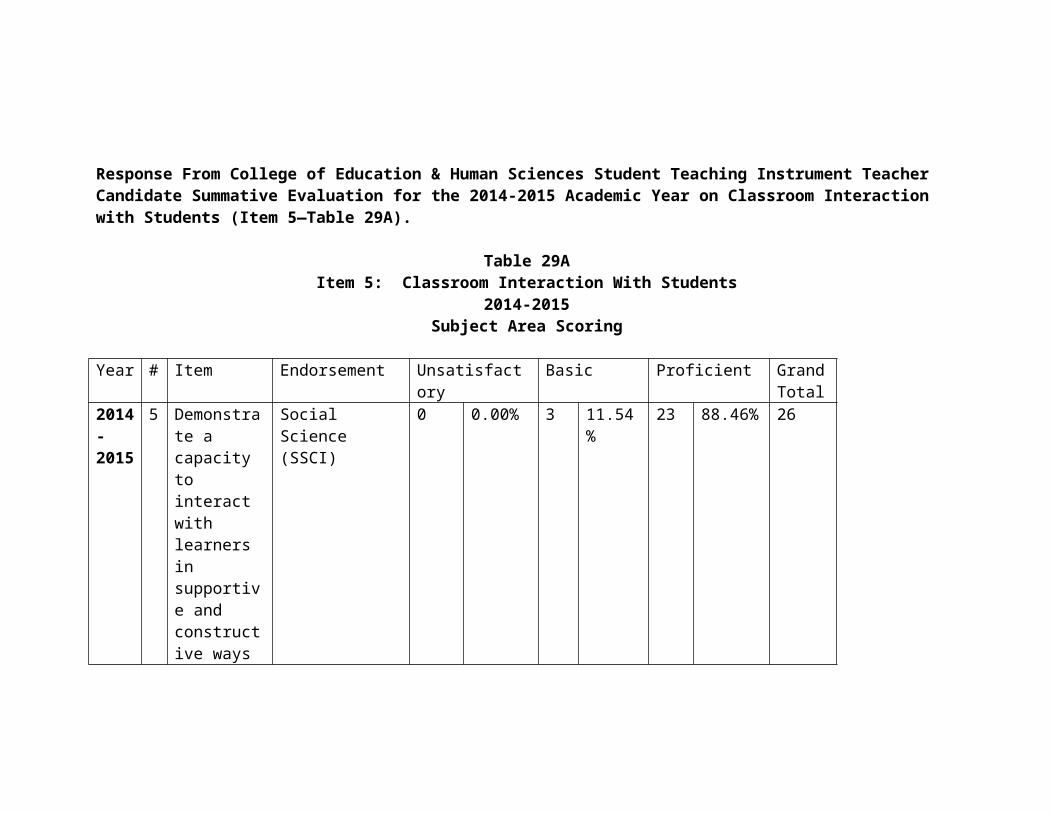
Table 37Item 15: Takes Advantage of Opportunities to Grow Professionally
Year # Item Endorsement
Strongly Disagree
Disagree
Neither Agree nor Disagree
Agree Strongly Agree
Grand
Total2014 - 2015
15
I take advantage of opportunities to grow professionally.
Social Science (SSCI)
00.00% 0
0.00%
0
0.00%
0
0.00%
3100.00%
3
Early Childhood Education
0 0% 0 0% 1 8.3% 5 41.7% 6 50.0% 12
Elementary Education
0 0% 0 0% 2 4.1% 21
42.9% 26
53.1% 49
Secondary Education
0 0% 0 0% 2 4.1% 21
42.9% 26
53.1% 49
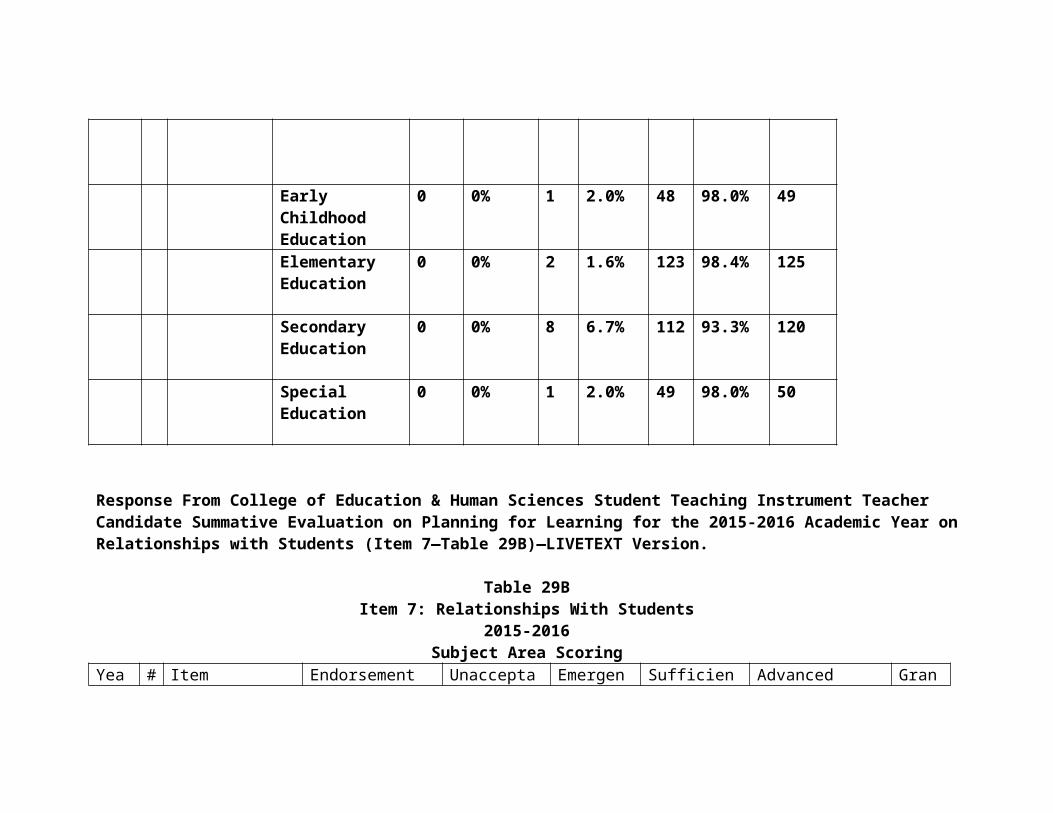
Special Education
0 0% 0 0% 2 9.5% 8 38.1% 11
52.4% 21
2015-2016
15
I take advantage of opportunities to grow professionally
SSCI 0 0.00% 0 0.00% 3 27.27% 2 18.18% 6 54.55% 11
Early Childhood Education
0 0.00% 0 0.00% 1 12.50% 3 37.50% 4 50.00% 8
Elementary Education
0 0.00% 1 2.00% 1 2.00% 30 60.00% 18 36.00% 50
Secondary Education
0 0.00% 0 0.00% 7 11.29% 32 51.61% 23 37.10% 62
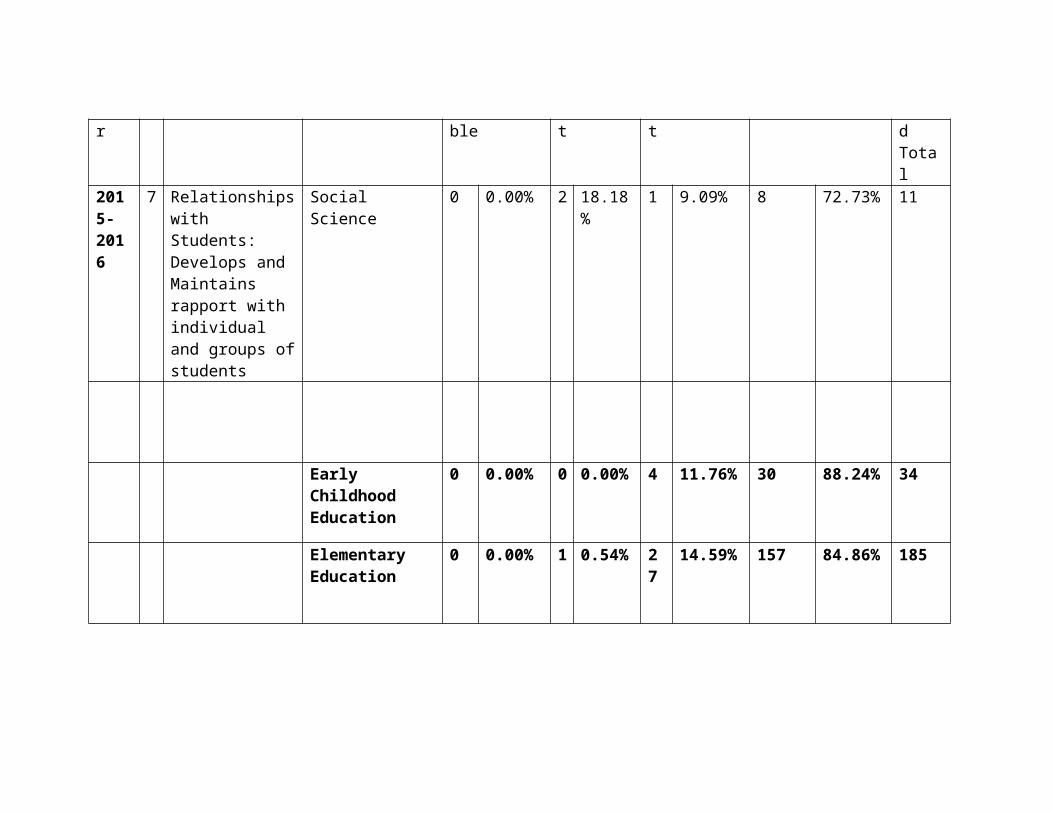
Special Education
0 0.00% 0 0.00% 1 4.55% 14 63.64% 7 31.82% 22
Narrative:Based on the evidence provided in this section, it appears that the Social Science program completers understand the concept of professionalism and professional growth. They are willing to work with colleagues, parents, and families to design the most effective learning experiences to promote learning. They are also willing to use what they learn about their own teaching to improve as a teacher. They also understand their responsibility to attend professional meetings and to learn from others so that they can become more effective educators.
7. Overall Proficiency
Response to Administrative Survey: Items on Impact of Student Learning and Development (Standard 11.1)
Table 38 Standard 11.1: Impact of Student Learning and Development
Indicator Endorsement Rare Occasional Frequent Consistent Grand Information Total11.1 The teacher positively
2014-2015Social Science 0 0.00% 0 0.00% 1 20.00% 4 80.00% 5
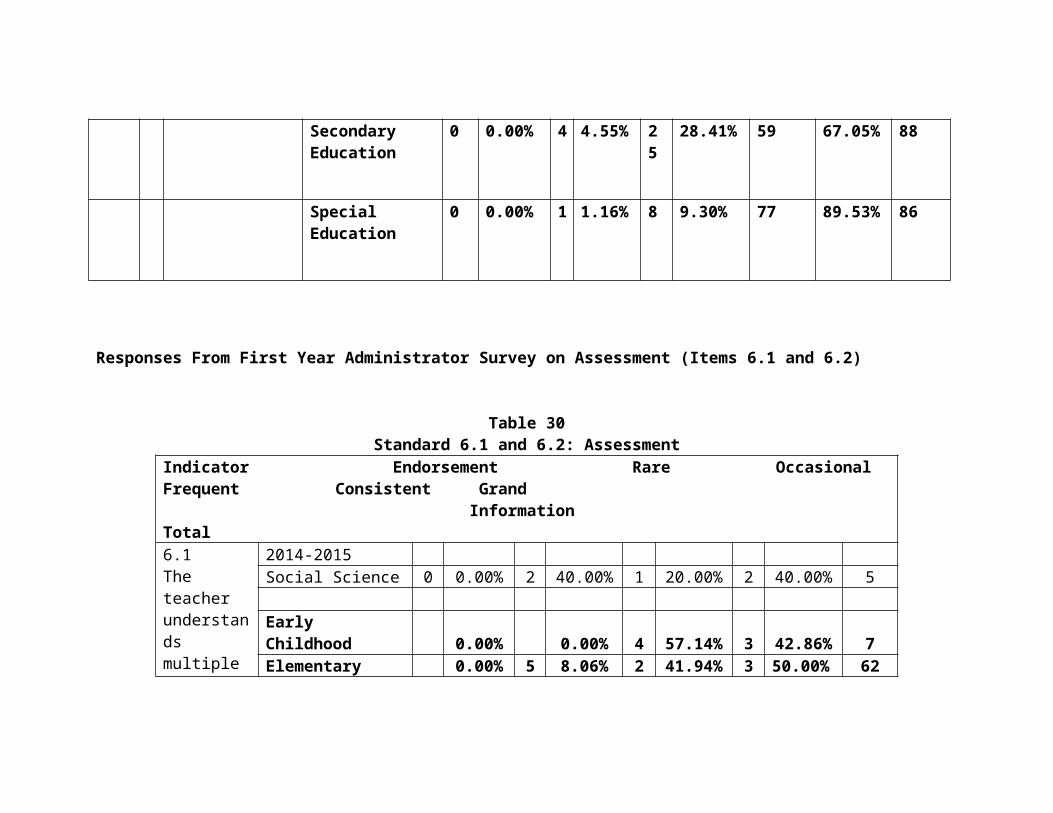
impacts the learning and development for all students
Early Childhood 0.00% 1 14.29% 1 14.29% 5 71.43% 7Elementary 0.00% 2 3.23% 18 29.03% 42 67.74% 62Middle Grades 0.00% 0.00% 2 50.00% 2 50.00% 4Content (Subject Area) Endorsements 0.00% 2 3.33% 16 26.67% 42 70.00% 60Special Education 0.00% 3 17.65% 4 23.53% 10 58.82% 17 Total 0.00% 8 5.33% 41 27.33% 101 67.33% 150
2015-2016 Rare Occasional Frequent Consistent TotalCoaching, Social Science
0 0.00% 0 0.00% 0 0.00% 2 100.00% 2
Social Science 0 0.00% 0 0.00% 2 33.33% 4 66.67% 6
Early Childhood 0.00% 0.00% 1 0.00% 3 0.00% 4Elementary 1 1.89% 4 7.55% 18 33.96% 30 56.60% 53Middle Grades 0.00% 0.00% 1 100.00% 0.00% 1Content (Subject Area) Endorsements
0.00% 2 2.90% 19 27.54% 48 69.57% 69
Special Education 0.00% 1 5.00% 3 15.00% 16 80.00% 20 Total 1 0.68% 7 4.76% 42 28.57% 97 65.99% 147
Responses From First Year Candidate Survey: Items Related to Overall Proficiency: I Am an Excellent Teacher (Item 23).
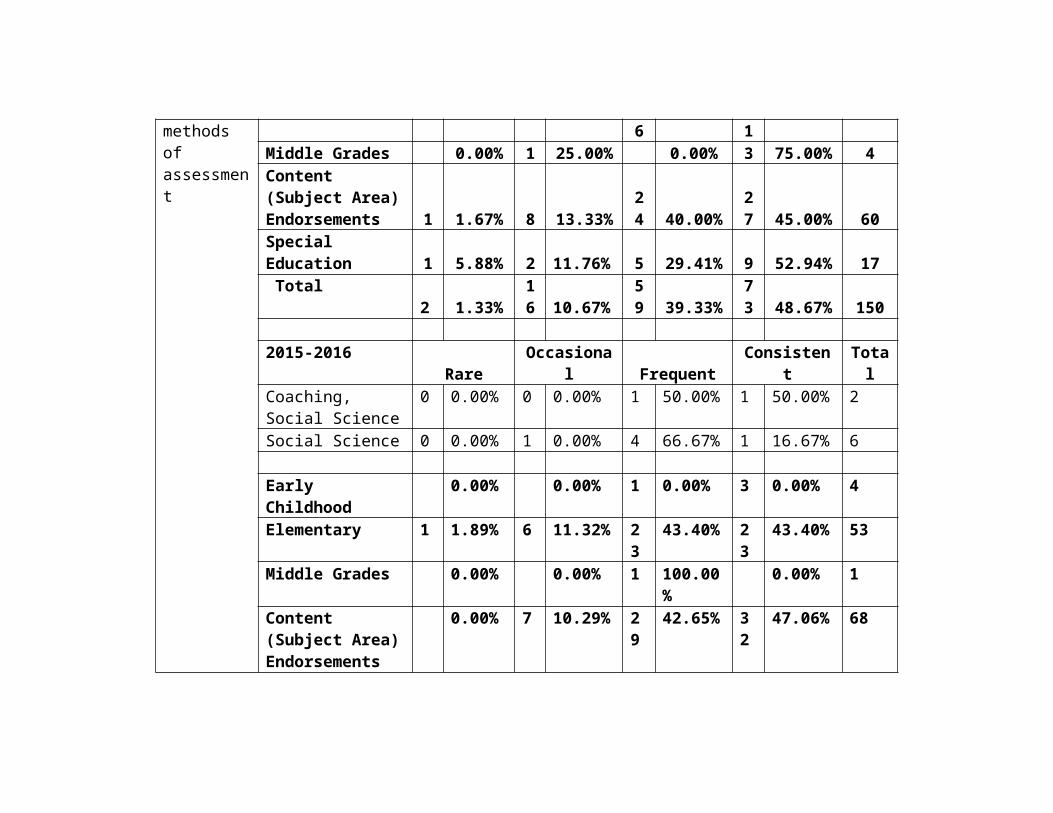
Table 39Item 23: I am an Excellent Teacher
Year # Item Endorsement Strongly Disagree
Disagree Neither Agree nor Disagree
Agree Strongly Agree
Grand Total
2014 - 2015
23
I am an excellent teacher.
Social Science (SSCI) 0
0.00%1 33.33
%1
33.33%0
0.00%1 33.33
%3
Early Childhood Education
0 0% 0 0% 2 16.7% 8 66.7% 2 16.7% 12
Elementary Education
1 2.0% 2 4.1% 11 22.4% 27
55.1% 8 16.3% 49
Secondary Education
0 0% 3 6.1% 9 18.4% 28
57.1% 9 18.4% 49
Special Education
0 0% 2 9.5% 5 23.8% 11
52.4% 3 14.3% 21
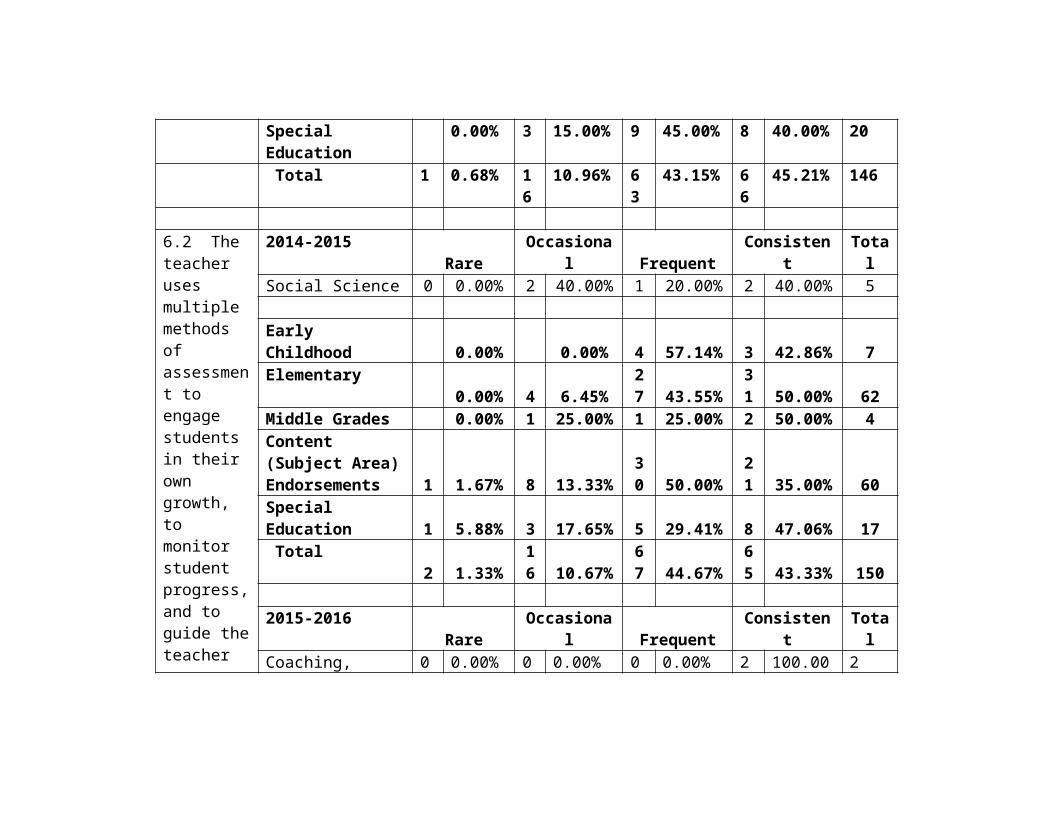
2015-2016
23
I am an excellent teacher
SSCI 0 0.00% 1 9.09% 3 27.27% 5 45.45% 2 18.18% 11
Early Childhood Education
0 0.00% 0 0.00% 1 12.50% 2 25.00% 5 62.50% 8
Elementary Education
0 0.00% 3 6.00% 7 14.00% 29 58.00% 11 22.00% 50
Secondary Education
1 1.61% 4 6.45% 19 30.65% 35 56.45% 3 4.84% 62
Special Education
0 0.00% 2 9.09% 4 18.18% 9 40.91% 7 31.82% 22
Narrative:
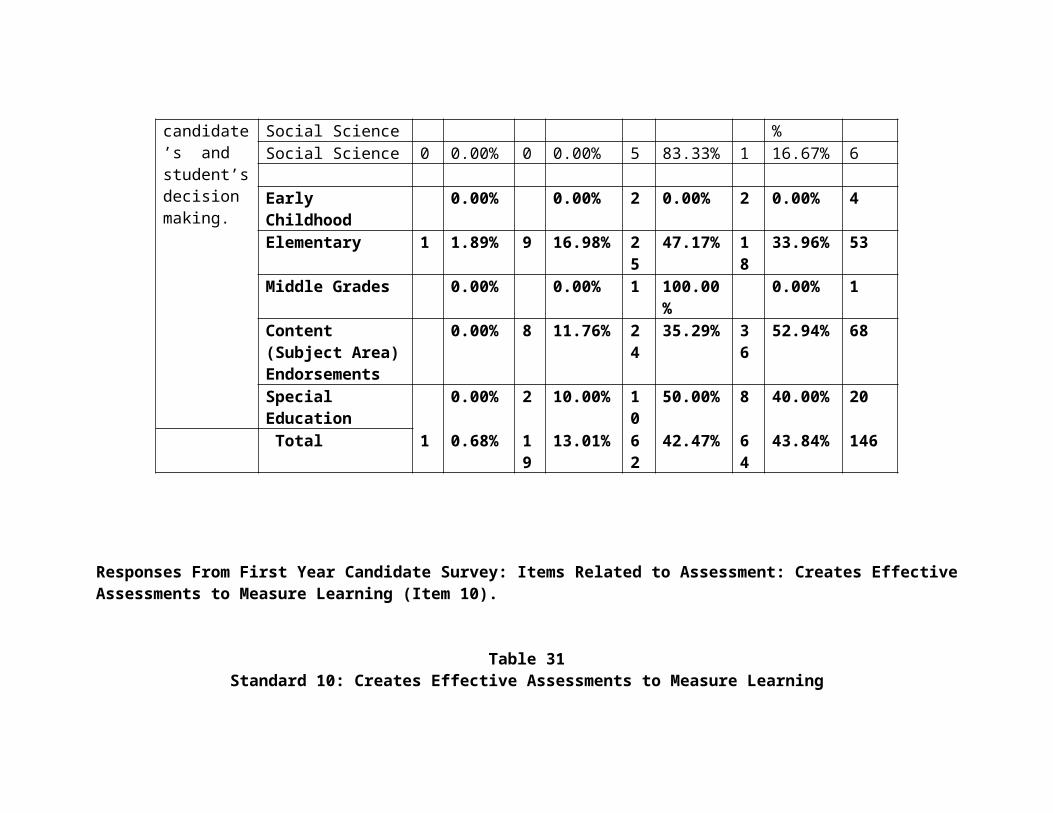
Evidence presented from the first-year administrator follow-up and the first-year candidate survey indicate that the program completers in the Social Science program indicate that these individuals are effective in providing experiences that promote learning for all of their students. The candidates themselves believe they are excellent teachers—or are at least on their way to becoming excellent teachers.
SECTION 3: USE OF RELATED DATA AND INFORMATION FOR CONTINUOUS PROGRAM IMPROVEMENT OF ENDORSEMENT PROGRAM — Artifact 3
Summary Narrative:The Social Science teaching program continues to be one of the most popular options within our teacher education program. It is a highly competitive program for students to enter and one must have a high cumulative and content grade point average to enter. Students must continue to perform well throughout the program in order to become a program completer. Nationally and within Nebraska, this would be considered to be a high supply/low demand teaching area. However, these students can be successful in becoming employed as long as they are willing to move where there are teaching positions.
Based on the information provided in this folio, Social Science students have demonstrated high cumulative and subject area grade point averages, performed well on the Praxis II tests as a whole, and received high scores on the student teaching instrument as well as on the first-year administrator and candidate follow-up surveys. The Praxis II scores are especially high during the second year of data collection, which was the first year that passing scores were required for teacher certification, making it a “high-stakes test.” Scores appear to be high over both years for which data were collected, with some small disparity between years. Taken as a whole, Social Science students have done well in all measures tied to content knowledge.
Social Science students not only have strong content knowledge but they are also able to apply the content in ways that are meaningful to learners. Data presented in Table 7 and 8 indicate that administrator responses show that all program completers were rated in the top two possible categories
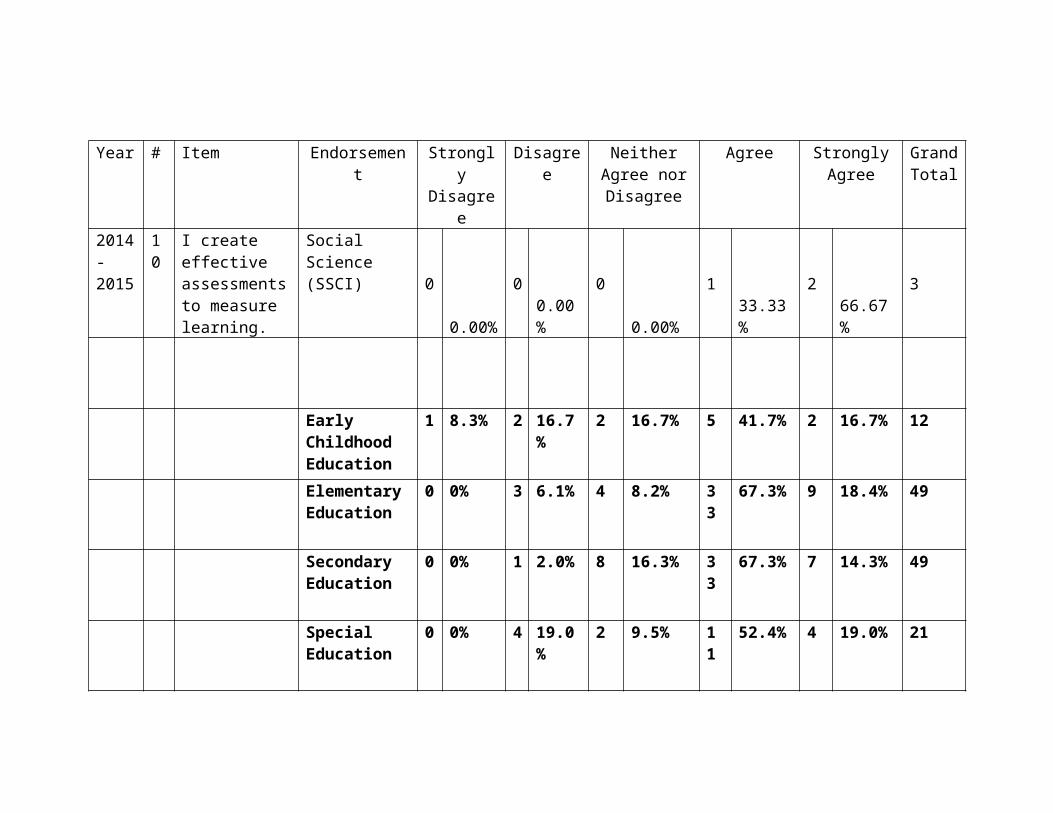
of the instrument. The candidates themselves also believe that they are able to teach content in a meaningful way. Program completers appear to be quite capable of engaging students in critical thinking, in helping their students connect concepts across disciplines, and can teach their subject matter in ways that are meaningful to their own students.
Responses from the student teaching instruments and from the first administrator and candidate follow-ups support the belief that students who have completed the Social Science program have a sound grasp on the learning process and the environment that is created for learning to occur. Specifically, either all of the students in the program or the majority of students can create usable lesson plans that are based on the content of the discipline; they can implement, modify, and adapt plans; and they can implement lessons that are flexible to meet student needs. In addition, Social Science program completers understand how students grow and develop, that students learn in different ways, and that implementing appropriate learning experiences may be crucial to successful learning. Program completers also understand that individual differences may exist that are based on cultural and community differences. Social Science program completers are beginning to create skills to work with other teachers to develop an effective learning climate, and they are creating an environment that promotes active engagement among students. Finally, they are also beginning to develop student management skills.
Social Science program completers are able to create experiences that are effective in instructional practice. Specifically, they are able to create classroom communities that invite student engagement, the lessons they create can assist all students to meet learning goals and objectives, and they can do so by using knowledges from a variety of sources. They are able to use a variety of instructional strategies, including the use and application of technology. The candidates also believe that they have the skills, knowledge, and ability to create effective instructional plans; that they can work well as individuals and as part of a team; and that the lessons they design will promote problem solving and critical thinking skills. The data are consistent across the student teaching and first year follow-up surveys.
These program completers are able to create an environment that promotes communication in a manner that motivates students to be effective learners. The creation of a positive atmosphere then allows these candidates to utilize multiple methods of assessment that can monitor the learning process and the
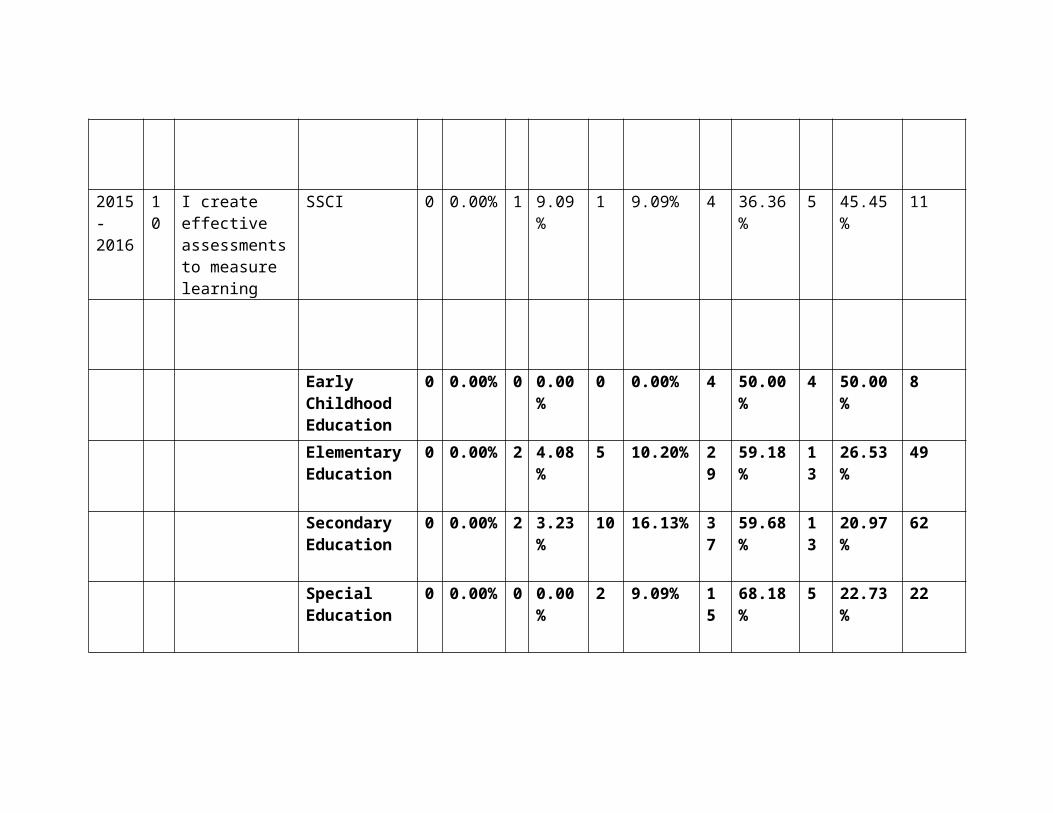
progress that students are making and to make modifications in one’s teaching. Both administrators and the candidates themselves believe that creative assessments are being utilized and applied appropriately.
It also appears that the Social Science program completers understand the concept of professionalism and professional growth. They are willing to work with colleagues, parents, and families to design the most effective learning experiences to promote learning. They are willing to use what they learn about their own teaching to improve as a teacher. They also understand their responsibility to attend professional meetings and to learn from others so that they can become more effective educators.
Finally, evidence presented from the first-year administrator follow-up and the first-year candidate survey indicate that the program completers in the Social Science program indicate that these individuals are effective in providing experiences that promote learning for all of their students. The candidates themselves believe they are excellent teachers—or are at least on their way to becoming excellent teachers.
Issue to AddressThe program appears to be solid at this time, but there are a number of transitional steps that need to be taken in the next few years. Recently, a new faculty member was hired to oversee the Social Science program. As with any new leader, there will be adjustments that will be made to allow this program to develop the next level of effectiveness. At the same time, the secondary education program is now moving more towards becoming more effective at working with grade 6-12 learners who do not have English as their primary language. This will call for a number of changes in the next few years concerning expectations for teacher education candidates. Candidates will be expected, for example, to apply for admission to the professional education curriculum sooner than in past years. Through an earlier admission date, prospective candidates not earning admission can be advised to strengthen credentials and to engage in related professional work experiences (e.g., summer camps, tutoring, Big Brothers-Big Sisters, scouting, etc.).
It is our belief that this particular program will remain strong and will make the necessary adjustments to develop effective teachers. We expect to engage with our critical school partners in dialogs to determine adjustments that will be of mutual benefit.