Embed Size (px)
Citation preview

-......7"
IDOCUMENT RESUME
ED 025 399RE 001 532
By- StIberberg, Norman E.; And OthersThe Effects of Kindergarten Instruction in Alphabet and Numbers on First Grade Reading. Final Report.
Kenny Rehabilitation Inst., Minneapolis, Minn
Spons Agency-Office of Economic Opportunit.. Washington, D.C.
Pub Date 27 Sep 68Contract- B89-4468Note- 76p.EDRS Price MF-S0.50 HC-$3.40Descriptors-*Beginning Reading, *Kindergartem Kindergarten Childrem *Predictive Ability (Testing), Predictive
Measurement, Predictive Validity, Reading Achievement, Reading Readiness, Reading Readiness Tests, *Word
RecognitionThis research was done to determine whether formal kindergarten training in
alphabet and number names would result in a higher reading level for children at the
end of grade 1. As part of an earlier research project, two classes of primarily
middle-class kindergarten children received 8 weeks of training in alphabet and
number names. Two control classes participated in the regular informal kindergarten
program. Preliminary analyses at the beginning of grade 1 showed that theexperimental group responded to the training with a higher level of number and letter
recognition than the control group. The followup study Involved an analysis of The
Metropolitan Achievement Test subtest scores and the reading subtest scores of the
Wide Range Achievement Test which were administered at the end of grade 1
Statistical analyses measured the differential impact of the experimental procedure
separately for boys and girls on scores of the Draw-a-Man Test and the Gates
Reading Readiness Test,--administered as pretest, post-test-I, and post-test-II. The
beneficial effects of kindergarten training were dissipated by the end of grade 1.
The use of reading readiness tests for individual prediction of first-grade
achievement was concluded to be risky. The complete project proposal and statistical
data are appended. (CM)

1D. S. DEPARTMENTOF HEALTH,
EDUCATION & WELFARE
OFFICE OF EDUCATION
THIS DOCUMENTHAS BEEN REPRODUCED
EXACTLY AS RECEIVED FROM THE
PERSON OR ORGANFZATIONORIGINAMG IT. POINTS OF VIEW OR OPINIONS'
STATED DO NOf NECESSARILY REPRESENTOFFICIAL OFFICE OF EDUCATION
POSITION OR POLICY
FINAL REPORT: THE EFFECTS OF KINDERGARTEN INSTRUCTION IN
ALPHABET AND NUMBERS ON FIRST GRADE READING
CONTRACT NUMBER B89-4468
Issued By: The Office of Economic Opportunity
1200 - 19th Street, N.W.Washingtons D.C. 20506
DATE: September 27, 1968
ROVillgrrnlire717;77, Ph.D.
Co.;Prolect Director
612-333-251, Extention 347
,21.4
I.Z7;;;'n,.", "..,Co-Project Director612-333-4251, Extension 348
AO%
,!.>°..7
6-7---4--,-...) r ' '''.7-,-C.- ---C.. V), <--)
YII1Pri
I:Orer:w"A, .T.TnsIA714 i'l-crier,tcril"."--.....---
Kenny Relii--,Vlitatic% Institute
© 1C00 Chicago Avenue
©Minneapolis, Minnesota 55404
41
612-333-4251s Exterwdon 300
IX;

TABLE OF CONTENTS
Page
TABLE OF CONTENTS i
ABSTRACT ii
FINAL REPORT 1
.Experimental Procedure 2
Results 7
Summary and Conclusions 13
Project Proposal Appendix I
Statistical Report Appendix II

ABSTRACT
Earlier research has,demonstrated that the ability to recognize
letters and numbers in kindergarten is a better predictor of end-of-
first-grade reading skills than either IQ or "readiness skills."
Children who are able to recognize letters and numbers respond better
to beginning reading instruction than children who do not possess
these skills. It therefore seemed logical to postulate that, if reading
letters and numbers were taught in kindergarten, this instruction would
result in an increment to reading level at the end of first grade,
As part of an earlier research project, two classes of/kindergarten
children were given eight weeks of training in alphabet and number names.
Two control classes participated in the regular informal kindergarten
program. The majority_of the children in both experimental and control
groups were from middle-class families. Preliminary analyses at the
beginning of first grade showed that the experimental group did respond
to the training and that their level of recognition of numbers an' letters
was higher than that of the control group.
The current research involved a follow-up of the children in 1:oth
the experimental and control groups to assess the effects of the special
training on end-of-first-grade reading. This included testing the
Children with both group and individually administered reading tests.
The statistical analyses were designed to measure the differential impact
of the experimental procedure separately for boys and girls on scores on
reading readiness tests administered in kindergarten. In addition, the
analyses were designed to improve the efficiency of prediction of reading
scores at the,end of first grade from variables measured in kindergarten.
It was found that the beneficial effects of kindergarten training in
letters and numbers were dissipated by the end of the first grade. From
this information, together with the results of earlier studies, one could
hypothesize that formalized training in reading readiness does not affect
subsequent ability to read, but rather affects only the scores achieved
on reading readiness tests following completion of the training period.
Thus, special training in reading readiness may have only the effect of
teaching children how to take reading readiness tests rather than teaching
them skills that can be applied to new learning.

THE EFFECTS OF KINDERGARTEN INSTRUCTION IN
ALPHABET AND NUMBERS ON FIRST GRADE READING
FINAL REPORT
September 27, 1968
The purpose of this research was to determine whether formal
kindergarten training in alphabet and number names would result in
children's reading at a higher level at the end of first grade.
The research was initiated to follow up a previous study in which
dhildren in an experimental group were given eight weeks of formal
training in alphabet and number names, while a control group was
exposed only to the usual informal kindergarten program. The
follow-up of the same children at the end of first grade was based
on a group test of achievement and an individually administered
test of word recognition.
The rationale behind this research was presented in consider-
able detail it the project proposal. Rather than repeat for this
report the details of problem definition, background, purpose,
related research, specific objectives, experimental procedure,
instrumentation, analytic method, and timing of the study, these
aspects of the proposal are reproduced in Appendix I. The statistical
analyses (in addition to being a self-contained report) are also
quite lengthy and are therefore presented separately in Appendix II.

- 2
The final report of this project consists of a description of
the experimental procedure, and a summarization of the results and
conclusions.
EXPERIMENTAL PROCEDURE
The Metropolitan7Achievement Test (M.A.T.) and the Reading Subtest
of the Wide Range Achievement Test (W.R.A.T.) were administered by the
project staff to the 110 children comprising the experimental and
control groups at the end of first grade. The Metropolitan Achieve-
ment Test was given during the week of April 15, 1968. The indivi-
dually administered Wide Range Achievement Test was given during the
week of May 20, 1968. The dhildren were located in eight schools
in the St. Paul area, predominantly in a middle-class area. Follow-
up vits to all but one school were.necessary in both cases to test
those children who had been absent at the test sessions scheduled
for their school.
Success in testing the children is indicated in Tables 1 and 2.
TABLE 1
Metro olitan Achievement Test
N in Group N Tested % Tested
Experimental Boys 30 30 100.0
Experimental Girls 24 24 100.0
Control Boys 29 28 96.5
Control Girls 27 27 100.0

TABLE 2
Wide Range Achievement Test
N in Group N Tested % Tested
Experimental Boys 30 30 100.0
Experimental Girls 24 24 100.0
Control Boys 29 29 100.0
Control Girls , 27 27 100,0
Because of illness and other scheduling problems, several follow-
up visits were required in certain schools. All children were located
for testing with the Wide Range Achievement Test; and all but one
child was located for testing with the Metropolitan Achievement Test.
The tests were scored by the project staff following administra-.
tion, and the scores were made available to the schools that partici-
pated. The test scores were then trInsferred to punched cards in
preparation for statistical analysis. (The test scores are listed in
Appendix II, "Statistical Report.")
Tables 3 and 4, on the pages following, present separately for
the experimental and control groups the distributional characteristics
of the Metropolitan Achievement Test subtest scores and the Wide
Range Achievement Test scores, It should be noted that, on the
Metropolitan Achievement Test, norms for total scores are not provided
by the test author. Three of the four subtests of the Metropolitan
Achievement Test, however, are almost exclusively tests of reading
skills and the remaining subtest is basic arithmetic knowledge. Fop
this reason, the total score for the Metropolitan Achievement Test,
listed in Tables 3 and 4, consists of the sum of the raw scores on
the first three subtests only, thus presumably yielding a score in

reading. The Arithmetic Subtest is treated separately.
It will be noted from Tables 3 and 4 that the cumulative distri-
butions of scores on the Metropolitan Achievement Test and the Wide
Range Achievement Test appear to be quite similar; a comparison of
the medians and quartiles presented in these two tables validates
this impression. The total M.A.T. score and W.R.A.T. score correlated
.73 for boys and .69 for girls, suggesting that the two tests are nct
assessing exactly the same skills.

TABIE 3
Distributional Characteristics of Test Scores
(Experimental Group)
Experimental Boys Experimental Girls
(N = 30) (N = 24)
Metro olitan Achievement Test
Word Knowledge Subtest25th Percentile: 20 25
Median: 27 29
75th Percentile: 30 32
Range: lo-34 13-35
Word Discrimination Subtest25th Percentile: 22
Median: 26
75th Percentile: 31
Range: 10-35
2430
32
11-34
Reading Satest25th Percentile: 17 20
Median: 21 28
75th Percnntile: 30 32
Range: 7-44 7-42
Arithmetic Subtest25th Percentile: 40 44
Median: 52 52
75th Percentile: 57 55
Range: 17-60 19-63
Total Score Less Arithmetic25th Percentile: 59 73
Median: 75 85
75th Percentile: 88 95
Range: 38-113 31-109
Wide Range Achievement Test
25th Percentile: 34 35
Median: 4° 39
75th Percentile: 45 43
Range 23-65 19-54

6
TABLE 4
Distributional Charecteristics of Test Scores
(Control Group)
Metropolitan Achievement Test
Word Knowledge Subtest25th Percentile:
Median:75th Percentile:
Range:
Control Boys
(N = 28)
Control Girls
(N = 27)
25 28
30 3331 35
15-35 9-35
Word Discrimination Subtest25th Percentile: 23
Median: 28
75th Percentile: 30
Range: 16-35
RI ling Subtest
25th Percentile:
Median:
75th Percentile:
, Range: 9-45 12-46
283132
14-35
16 23
19 29
25 37
Arithmetic Subtest25th Percentile:Median:
75th Percentile:
Range:
Total Score Less Arithmetic25th Percentile:
Median:75th Percentile:
Range:
42 44
118 51
56 57
23-61 35-61
62 8o
78 9184 105
45-115 43-113
Wide RanzeAcM_aentTest
25th Percentile: 36 37
Median: 39 41
75th Percentile: 42 46
Range: 26-56 34-62

RESULTS
All analyses were done twice, once for boys and once for girls.
This has previously been demonstrated as necessary with young
children by such studies as Silberberg, Iversen, and Silberberg
(1968) and Silberbnrg and Feldt (1965).
The results are summarized below, with specific reference to
the analyses specified in the contract proposal (pages 16-18,
Appelidix I). The proposal's specifications have been excerpted in
the following discussion to eliminate the need for cross-referencing.
aesiliztion No. 1
"1. Comparicon cf experimental versus control group.
"A. Group Reading Test: A two-way analysis of variance
will be done to accomplish this end. The two columns will be
scores for the experimental and control groups on the criterion
measure (the Metropolitan,Achievement Test score, excluding
Arithmetic). The three rows would consist of leveling pre-te-
scores inte eval thirds. In this way, it could be determined,
if there is a difference between the experimental and control
groups on end-of-first-grade reading, whether this difference
occurs for children with low, averages and high readiness
equally or whether this difference is due to a differential
response on the part of one of these three groups. Separate
analyses will be performed for boys and girls.
"B. The analyses in lA will be repeated using the sum of
scores on four of the five subtests (excluding Letters and
Numbers) of the Gates Reading Readiness Test as the pre-test
score.
"C. The analyses would again be repeated, except that
onathe Letters and Numbers Subtest of the Gates Reading
Readiness Test would be used as the pre-test score."
Results (Reference: Tables 1-:, 1-b, and 1-c of Appendix II).
1.A. Pre-test level (based on all five subtests) and sex were
significantly related to the group (M.A.T. less Arithmetic)
reading test scores.
1.B. Pre-test level (based on the four subtests and excluding
Letters and Numbers) and sex were significantly related
to the group (M.A.T. less Arithmetic) reading score.

1.C. Pre-test level (based on the Letters and Numbers Subtest
alone) and sex were significantly related to the group
(M.A.T. less Arithmetic) reading score.
In none of the three analyses were group (experimental versus
control) effects or any interaction effects found.
Conclusion
Kindergarten letters-and-numbers training had no effect on the
end-of-first-grade group reading scores. However, children's pre-
reading (reading readiness) skills were found to be related to subse-
quent reading ability. Also, girls scored higher than boys on the
(N.M.) group test of reading ability at the end of the first grade.
Specification No. 2
"2. The same-analyses as described in,Number 1 above would be
run again, except the individually administered Wide Range
Achievement Test would be used as the criterion measure."
Results
2.A. Pre-test level (based on all five subtests) was signifi.
cantly related to the individually administered (W.R.A.T.)
test score.
2.B. Pre-test level (based on four subtests and excluding
Letters and Numbers) was significantly related to the
individually administered (W.R.A.T.) test score.
2.C. Pre-test level (based on the Letters and Numbers Subtest
alone) was significantly related to the individually
administered (W.R.A.T.) test score.
In none of the three analyses were group (experimental versus
control) effects, sex effects, or any interaction effects found.
Conclusion
Kindergarten letters-and-numbers training had no effect on the
end-of-first-grade individua:, reading test scores.
Specification No. 3
"3. The form of the relationship between the pre-test and both
post-tests, between the two post-tests, and between the
pre-test and the two criterion tests would be investigated
mathematically."
Results
Pre-test versus Post-test I:
Control Group: The relationship is linear.
rv94,1,4vArntAl Groups The relationship is quadratic.

Pre-test versus Post-test II:
Control Group: The relationship is linear.
Experimental Group: The relationship is quadratic.
Post-test I versus Post-test II:
Control Group: The relationship is linear.
Experimental Group: The relationship is linear.
Pre-test versus M.A.T. (less Arithmetic):
Control Group: The relationship is linear.
Experimental Group: The relationship is linear.
Pre-test versus W.R.A.T.:
Control Group: The relationship is linear.
Experimental Group: The relationship is linear.
Comment
Linear relationships were Observed in all comparisons except
those between the pretest and the two post-tests for the experimental*
group. In the latter tests, the relationship was quadratic, indicat-
ing that letters-and-numberstraining produces bcth immediatc and
lasting effects on scores on the Letters and Numbers Subtest. The
linear relationships observed in the control and experimental groups
in comparing the pre-test with the two tests of reading ability,
however, leads to the conclusion that letters-and-numbers training
in kindergarten has no effect on subsequent ability to learn to read.
Specification No.4
"4. The relationships discovered in Number 3 (above) would
dictate the manner in which this part of the analysis
would be done. Adjustments would be required if relation-
ships are not linear. Transformations would be used when
necessary to yield important educational data. This
phase of the analysis would involve a series of step-wise
regression analyses predicting to the two criterion
measures.
"Predictor variables will include: the five subscale
scores on the Gates Reading Readiness Test, the score on
ihe Draw-A-Man Test (all measured in kindergarten), and the
child's Chronological Age as of March 271 19674 The
following prediction equations would be obtained:

"a. Predicting to end-of-first-grade reading on the group
reading test for children who have been taught the
alphabet and number names in kindergarten.
"b. Predicting to end-of-first-grade reading on the group
reading test for children who were not taught alphabet
and number names in kindergarten.
c. Predicting to end-of-first-grade readi4g on the
individulally administered reading tests for children
who have' been taught alphabet and number names in
kindergarten.
"d. Predicting to end-of-first-grade reading on the
individually administered reading tests for children
who were not taught alphabet and number names in
kindergarten.
"These equations should be useful, not only in further assessing
th f! impact of training in alphabet and numbers in kindergarten,
but also in evaluating the relative merits of the two types of
reading tects (group versus individual)."
Results
Since no end-of-first-grade reading differences were found between
the experimental and contrul groups, but were found between boys
and girls, the four regression equations obtained were differen-
tiated according to sex rather than experimental/control group.
Boys (M.A.T,, N=58; W.R.A.T., N:59); Prediction Equations:
M.A.T. = .453 (L&N) + .942 (PD) + 38.7 (R = .54)
W.R.A.T. = .194 (UN) + .664 (Rhym) + 27.9 (R = .62)
Girls (N = 51); Prediction Equaticas:
M.AJ. = 1.46 (PD) + .339 (L&N) + 36.6 (R = .68)
W.R.A.T. = .105 (1,0) + .442 (DAM) + .565 (Rhym) + 24.7 (R = .65)
Key: L&N = Pre-test Letters and Numbers
PD = Pre-Test Picture Directions
Rhym = Pre-test RhymingDAM = Draw-A-Man
Comment
The need to predict separately for boys and girls was seen pre-
viously (Silberberg, tversen, and Silberberg, 1968). The multiple
correlations obtained in that study were of the same order of magnitude
as those obtained in the present study. The predicted end-of-first-
vade M.A.T. scores for girls correlated .68 with actual scores. A
correlation of about the same order of magnitude, .65, was found with

^
the W.R.A.T. servic.g as the test criterion. For boys, however, marked
differences were observed; predicted scores for the_M.A.T. correlated
54 with actual scores as opposed to .62 for the W.R.A.T. This
finding, together with the previously observed sex difference on M.A.T.
scores, would tend to indicate that group testing may not be as
successful, at least for boys, as individual testing. In the previous
study, as in the present one, the Letters and Numbers Subtest survived
as a predictor of end-of-first-grade reading ability.
Specification No. 5
"5. The Gates Reading Readiness Test consists of five subtests.
Subtest Number 5, Naming Letters and Numbers, will be
examined intensively in thib section of the research. The
total possible score on this subtest is 62, one point
gained for each recognition of the 26 capital letters, one
point for correct recognition of the 26 lower case letters,
and,ten points for correct recognition for the numbers 0
through 9. The relationship between this subtest and end-
of-first-grade reading has been demonstrated previously
(Silberberg, Iversen, and Silberberg, 1968). However,
the experience of the project consultants has led them to
hypothesize that children who know the name of one number
probably know the names of many numbers, a condition which
does not appear to exist in the naminc r.)f alphabet lems.Therefore, it would be valuable to exaHine separately the
relationships between the 52 letter names and the 10 number
names with the criterion variables.
"The analyses described in Number 4 would be repeated,
'except that each of the analyses would be done twice, once
using the child's raw score on naming letters alone, and
the other time using the child's raw score on naming
numbers alone,"
Results
There was, indeed, a tendency for dhildren to know essentially
all numbers 0 through 9 on Pre-test. Forty-four of the fifty-
nine boys (74.6%) knew at least eight numbers, as opposed to
thirty-three of the fifty-one girls (64.7%).
Sex differences were even more striking, and in the op osite
direction, when the fifty-two (upper and lower case fletters
were considered. Only twenty-two of the fifty-nine boys
(37.3%) knew at least sixteen letters, but thirty of the
fifty-one girls (58.8%) knew at least sixteen letters.
Step-wise regressions were obtained, as specified above, but
the equations are not reproduced here. The eight equations .
can be found in Appendix II. Of interest here is that the
multiple regression coefficients for the boys' predictor

- 12 -
equations are generally smaller than those for the girls'
predictor equations. This phenomenon was observed also in the
previous (Silberberg, Iversen, and Silberberg, 1968) study. It
may possibly be explained on the basis of the widely held
tenet that, due to earlier maturation, girls are better students
than boys at the earlier stages of formal training. In addition,
the present study showed that boys start out with less knowledge
of (and perhaps less interest in) the alphabet than girls, and
.therefore pose a more difficult prediction problem.
Another explanation can be offered based on some further
inspection of the data. Since Stanford Binet or WPPSI IQ's
were not available for the subjects, the Draw-A-Man Test was
used to approximate IQ. The girls as a group had a significantly
higher mean raw score on the D.A.N. than did boys (1 = 16.5 fo.1 .
girls versus r 14.7 for boys). It was found (see tables 6-a
through 6-1in Appendix II) that the sex effect was due to a
significantly higher score on one subtest of the M.A.T., the
Reading Subtest, which is the only criterion test in this
study in which contextual cues can be used. Thus, the sex
effect may well be, in truth, an IQ effect. This result is
consistant with the cauticm expressed by some educational
psychologists in the use of group tests. With most group
achievement tests, it is _difficult -- if not impossible -- to
determine how much of a child's score is a function of his skill
in the tested subject and how much is a function of his IQ.
Additional Findings
Appendix II Contains a section on analyses not called for in the
proposal specifications, but conducted because of their interest
to this study. These cover correlation matrices, analyses of the
M.A.T. subtest scores, and further analyses relating to post-
testing.
Although certain experimental/control main effects and inter-
actions were uncovered in these additional analyses, it must be
pointed out that these may be Cie result of chance since multiple
and finely detailed analyses on the same sample can be expected
to turn out some "significant" findings in error. The interested
reader who pursues the additional analyses of Appendix II should
keep this caution in mind.
To summarize the major findings of this study, two comments would
tend to suffice. First, the prediction results of a previous study
(Silberberg, Iversen, and Silherberg, 1968) were confirmed. End-of-
first-grade reading achievement can be predicted with as much relia-
bility using portions, particularly the Letters and Numbers Subtest,

of the Gates Reading Readiness Test as using all five subtests,
although in neither case is this predictive ability'of noteworthy
utility. And, second, training in letters and numbers in kinder-
garter. contributes no competitive edge to children given such
trainIng. The effects of this training are, at best, transitory
and disappear by the end of the first grade.
SUMMARY AND CONCLUSIONS
Earlier research in the training of reading readiness skills
has demonstrated that this training does not carry over to end-of-
first-grade reading skills. However, it was also founa that dbility
to recognize letters and numbers in kindergarten is a better predic-
tor of end-of-first-grade reading skills than are IQ or scores on
reading readiness tests. It was therefore deemed logical to postulate
that the recognition of letters and numbers can be taught in kinder-
garten, and that the result of this instruction would be an incre-
ment in reading level at the end of first grade.
As part of an earlier.research project, two classes of kinder-
garten children were given eight weeks of training in alphabet and
number names.' Two control classes participated in the regular infor-
mal kindergarten 1.rogram. Scores on reading readiness tests adminis-
tered at the beginning of first grade showed that the kindergarten
training had a beneficial effect in that the experimental group was
able to recognize numbers and letters at a higher level than could
the control group.
The two groups of children, totaling 110 children, were followed
up at the end of first grade. All children were admiListered the
Wide Range Achievement Test, an individually administered tesi of

word recognition, and the Metropolitan Achievement Test, a group test
for primary grade children. It was found that the beneficial effects
of the kindergarten training were dissipated by the end of first
grade. It was again demonstrated that prediction of end-of-first-grade
reading scores from kindergarten testing was a risky matter because
of the large amount of variability which can occur over the course
of that time. Even though the relationship bntween kindergarten and
first grade tests is linear, the low multiple correlation (approxi-
mately .60) between kindergarten variables and end-of-first-grade
reading obviates the use of reading readiness tests for individual
From the results of this study and those experiments leading up
to it, it would appear that formalized training in reading readiness .
does not affect subsequent ability to read, but rather affects only
the scores achieved on reading readiness tests administered immediately
following completion of the training period. Quite possibly, special
training in reading readiness has the effect of teaching children how
to take reading readiness tests, rather than teaching them skills
which can be applied to new learning.
This research was accomplished on middle class children. Given
this limitation, it would appear that children who receive sufficient
verbal and intellectual stimulation in their immediate environment
learn more according to their physiological readiness than to this
type of training. Many children have learned letter and number names
spontaneously before entering kindergarten while others, despite
attempts to teach them,cannot learn such information at that time.

- 15 -
Artificially introducing formalized instruction at an early age,
therefore, does not seem to have any permanent effect; the children
achieve the same level they would have been expected to achieve had
they not been given any special training.
This study points out the weaknesses inherent in much of the
research which underlies educational thinking in several areas.
The results of cross-sectional studies can be very optimistic when
attempting to evaluate new training procedures. However, longitudinal
research often indicates that these benefits are transitory, if not
artifacts of the training situation.
It would seen from this and earlier studies that, for middle
class children, readiness training in kindergarten and, if kinder-
garten is perceived as a readiness experience, perhaps even kinder-
garten itself rRy be a questionable e& tional practice, when
end-ofirst-grade reading achievement i3 deemed the appropriate
criterion of utility. One might speculate that current plans to
popularize pre-kindergarten training for children (down to age 39
or even age 2) may not have potential benefits for middle class
children, given the same criterion of utility.

APPENDIX I
PROJECT PROPOSAL

PROBLEM
The current popularity of pre-schcol programs to stimulate growth in language
arts, compensatory instruction for children deficient in these areas, and enriched
curricula within the kindergarten and primary grades has stimulated many research
projects. Foremost among these programs has been the Head-Start Program. Although
there is a considerable amount of arreement that such programs should exist despite
their great expense, the question of what to include within those programs has
remained a topic of debate (Reading Teacher, 1966). Typical questions have revol-
ved around whether such programs shoulcf be formal or informal and, in either case,
on which skills to focus. This diversity of curricula nay be partly responsible
for the lack of positive outcomes in many experimental studies (Jones, et al, 19671
In general, pre-school and kindergarten programs emphasize readiness activi-
ties. These programs, although temporarily useful, bave not served to increase
school functioning. The concept of Iria utilizing a "head start," that is, merely
beginning formal training early, has not been rigidly examined. The proposed
research is designed to assess the effects of formal kindergarten training in
letter and number names on ene. of first grade reading skills, If the effects of
accelerated learning in kindf,garten survive the first year in the elementary
grades, an increment will have been added to the evidence supporting head-start
programs. If the advantages gained in kindergarten training "wash out" after first
grade, the content of first Trade programs should be examined to determine tha
reason for this. In addition, this should lead to examination of methods of
maintaining the early advantages through the formalized program encountered in
primary grades.
BACKGROUND
The teaching of readiness activities may not yield a transferrable positive
outcome to the actual reading process. M. Silberberg (1966) conducted an experi-
ment during the last eight weeks of the kinderFarten year in seven representative
Minneapolis, Minnesota, public schools and concluded that "The results of this
study indicate that formal reading readiness training in kindergarten does not
affect measured reading level at the end of first grade reading instruction." ghe
did find, however, "that formal reading readiness training in kinderFarten does
affect measured reading readiness after three weeks of regular first grade readi-
ness activities." In other words, the effect of reading readiness training seems
to be to increase the children's performance on reading readiness tests, but it has
no effect on their end of first grade reading scores. In a further study, utiliz-
ing the same data, step-wise regression analysis was used to predict to end of
first grade reading scores, bag-Jd on psychometric variables obtained in the spring
of the kindergarten year, that is, before the experimental procedure had been
initiated (N. Silberberg, Iversen, and M. Silberberg, 1968). A similar analysis
was also done to predict to end of first grade reading scores from reading readi-
ness tests administered at the beginning of first grade. The variables utilized as
predictors included the five subtest scores on the Gates Reading Readiness Test,
Stanford-Binet IQ, and Chronological Age. The results of this study indicated
that ". the Letters and Numbers Subtest alone is nearly as efficient as all

- 2 -
five subtest scores (of the Gates Reading Readiness Test) in predicting end-of-
first-grade reading scores, and the additional information, age and IQ, contributes
little if anything to increased precision in prediction. This is not
entirely unexpected, since the Letters and Numbers Subtest consists of the child
actually reading capital lettere, lower case letters, and numbers." In other words,
most of the variance which could be accounted for by the prediction equations was
attributable to the child's actually reading letters and numbers prior to formal
reading instruction, while the other subtests, which do not involve reading Emse
did not provide much additional information on how a child will actually read at
the end of first grade,
PURPOSE
The obvious question to follow the results of these two earlier experiments is:
Will the teaching of alphabet and numbers in kindergarten yield more transferrable
skills to the actual reading process than does "readiness" (non-reading) training.
To determine the answer to this question, a new project was initiated in fall, 1966,
as part of a Master's thesis (Orensteen, 1969). A group of children in kindergar-
ten was given eight weeks of formal instruction in learning alphabet and number
names. Analysis of preliminary data gathered at the beginning of first grade
indicates that (1) these children did learn the alphabet and numbers, when compared
to a control proup, and (2) there TaTa relationship between measured reading
readiness level before the initiation of the experimental treatment and the child's
reaction to the treatment. These findings were consistent with Marmon's (1966)
who found that kindergarten training in reading was especially beneficial for low
socio-economic children in increasing their word recognition scores at the end of
kindergarten. However, the permanence of these outcomes, in terms of end of first
grade reading skills, has not been evaluated. Therefore,
1, It is hypothesized that children who received instructlon in alphabet and
numbers in kindergarten will perform at a higher level in measured word recogni-
tion at the end of first grade than do children in a control group who receive no
formal reading instruction.
2. It is further hypothesized that the children who have the lowest rate of
incidental learning prior to L'eginning the experimental procedure will benefit
most from the formalized training in alphabet and numbers.
At the present time, as a result of Orensteen's study (196C), data are
available for the children in the experimental and control (Troupe on Gates Reading
Readiness Tests administered immediately before the experimental procedure,
inmediately after the experimental procedure, and at the beginning of first grade.
It is therefore proposed that a follow-up study be done at the end of first grade
to examine the above hypotheses. This would involve a re-evaluation of the
readiness data, an examination of all children with an individually administered
test of word recognition, and statistical analysis to establish relationships
between the variables of interest.

RELATED RESEARN
Most of the research in the area of reading readiness in general can be
categorized in three areas: effects of kindergarten training versus non-kindergar-
ten attendance, early reading studies, and reading readiness and training studiese
After reviewing the research in the first area, M. Silberberg (1966) concluded
that "much of the research concerning differential functioning of kindergarten
trained versus non-trained children suffers because of a variety of factors. Many
of the early studies had socio-economic bias, raising the question c: whether the
training or the cultural level of the enviraament was the crucial issue. Lack of
adequate control groups, small sample size, and educational and occupational level
differences of the families among groups studied placed limitations on conclusions
of most studies in this area."
Durkin's work (1961) has given impetus to early training of reading. She
found that children with IQs ranging from 91 to 161 learned to read before attend-
ing school, but that none of these children learned without having some kind of
help, either from parents or siblings. Durkin's work seems to suggest that all
children can learn to read early. However, Silberberg and Silberberg (1967) found
a group of children who seemed to have learned to read in an incidental or spon-
taneous way, and suggested that in some children at least reading ability was a
"physiological variant."
Concerning the third category of studies, M. Silberberg (1966) found that
"Most studies (of reading readiness training in kindergarten) found a negligible
effect of such training on later reading skills. Again, the only groups that do
have significant benefit from such training were children from bilingual homes.
Conceivably, if reading readiness training could be effective, the evidence for
this effectiveness may have been lost in the comparison of heterogeneous groups."
(n, Silberberg, 1966, page 31.)
Recently, several doctoral dissertations have dealt with effects of reading
readiness training in kindergarten. Angus (1962), Rosen (1965), Rutherford (196c),
and Simpson (1%0) all found that reading iladiness training in kindergarten,
whether it be varied ,::... limited to certain visual-perceptual tasks, all seem to
increase the tested reading readiness of the groups receiving such training when
compared to the controls. Further, Angus (1962) also found that a formalized
reading readiness program was superior to an incidental approach to teaching
children readiness skills.
Possibly the best controlled study in this area was tha one done by M. Silber-
berg (1966), Because of its relationship to the hypotheses stated in the proposed
study, the findings of the study will be discussed in some detail. M. Silberberg
summarizes her findings in this way:
"The main purpose of this study was to measure the effect of
formal ;leading readiness training at kindergarten level on reading
readiness levels in first grade and on reading Success at the end
of first grade. This was accomplished by comparing an experimental
group, which was given a formal reading readiness program, with a
control group, which had the usual informal kindergarten program.

- 4
The experiment was conducted during the last eight weeks of the
kindergarten year in seven representative Minneapolis, Minnesota,
public schools. The experimental treatment was randomly assigned
to either an A.M. or P.M, kindergarten class, with the alternate
class taught by the same teacher constituting the control. Prior
to beginning the readiness training, standardized test of
readiness level was administered as a pre-test. The experimental
treatment lasted eight weeks. Supervision and direction were
supplied by the experimenter.
"Post Test I, the Gates Reading Readiness Tests, was admini-
stered immediately following the experimental treatment, to deter-
mine immediate effects of the readiness training on readiness level.
The Gates Reading Readiness Tests were administered again (Post
Test II) at the beginning of the first grads following three weeks
of readiness instruction given to all first grade children. A test
of reading level, The Bond-Clymer-Hoyt Developmental Reading Test
(Post Test III), was administered at the end of the first grade.
Comparisons were made separately for boys and girls. Tha scores on
the three criterion measures were compared by first, six separate
analyses of variance, and then, by six separate analyses of covariance,
In each analysis, the data were grouped according to levels of pro-
ficiency in one of the two pre-test measures (reading readiness and
intelligence). These levels consisted of approximately the high,
middle, and low third of the entire sample of children. The influence
of the interrelatedness of the two pre-test measures was controlled
by using one measure as the criterion of inclusion within a level and
the other measure as a covariate in the six analyses cf covariance.
The .05 level of confidence was used for all statistical tests.
H The investigation was designed to answer three specific
questions:
1. Does reading readiness training affect measured
reading readiness immediately following formal
reading readiness training in kindergarten?
"The results of this study indicate that formal reading readiness
training does not affect measured reading readiness at the end of
kindergarten.
2. Does reading readiness training in kindergarten
affect measured reading readinsss after three
weeks of regular first grads readiness activities?
"The results of thistudy indicate that formal reading readiness
training in kindergarten does affect measured reading readiness after
three weeks of regular first grade readiness activities,
3. Does reading readiness training in kindergarten
affect reading success as measured at the end of
first grade reading instruction?

"The results of this study indicate that formal reading readiness
training in kindergarten does not affect measured reading level at the
end of ftrst tends reading instruction.
"Incideutal to the major findings of this study, it was found that
girls, in general, exceeded boys in reading readiness and in final
reading. This finding is consistent with other studies in which this
factor has been considered.
"These results consistently appearsd in all of the analyses of
variance and covariance carried out in this study, except one. It
was found that, when the data were leveled by IQ utilizing the pre-
test readiness scores as the covariate, there was no significant sex
difference on the mean scores for Post Test I."
M. Silberberg's findinls are consistent with those of other studies, and
suggest that reading readiness training merely prepares students for reading readi-
ness tests, rather than demonstrating any carry-over into the actual reading
process. This observation is reinforced hy the lack of any research evidence in
the literature which isolates any factors in a readiness program which prepare a
child for reading at a more advanced level than he would read had he not received
this training. (This statement, of course, does not apply TO such special situa-
tions as children from bilineual homes or other environments whsre verbal stimula-
tion is artificially minimized.)
In a re-analysis cf M. Silberberg's (1966) data, data from April of the kin-
dergarten year and October of the first grade year were used to predict to end-of-
first-grade reading on the Developmental Reading Tests (Silberberg, Iversen, and
Silberberg, 1968). Step-wise linear regression procedures were used to predict
from the Gates Reading Readiness Tests administered in April and October to the
criterion variable. Stanford-Binet IQ and Chronological Age were included with the
five subtests of the Gates Reading Readiness Tests as independent variables.
Separate equations were obtained for boys and girls.
"Corresponding equations were obtained for the conditions:
(a) all seven independent variables being represented on the left
side of the equation(aven those making an inconsequential contri-
bution to prediction), (b) only tha five reading readiness subtests
scores being represented, and (c) only the Letters and Numbers sub.
test score. These equations are of no particular interest, and
they are nct presented here; but the multiple correlation coefficients,
which serve as measures of the reduction in the error variance
associated with the estimate -- or prediction -- of end-of-first-grade
reading ability are of interest and are presented in Table 1:

- 6 -
TABLE 1
Prediction of First Grade Reading Ability
(from Silberberg et al, 1968)
Boys Girls11111111.1181Mr
Independent Variables April October April October
Represented on the testing testing testing testing
Left Side of Equation (N:115) (Ne55) (Ne107) (N=59)
All seven .5e .78 .70 .72
Only the "best" of the
seven .59 .76 .69 .70
Only the five subtest
scores .57 .78 .69 .71
Only the "best" of the
five subtest scores .56 .76 .67 .70
Only the letters &numbers subtest score .51 .76 .58 .67
"As seen in Table 1, the Lettere ani Numbers subtest alone is
nearly as efficient as all five subtent scores in predicting end-of-
first-grade reading scores, and the additional information, aee and
IQ, contributes little ic anything to increased precision in prediction.
"This is not entirely unexpected, since the Letters and Numbers
subtest consists of the child actually reading capital letters, lower
case letters, and numbers. It could be postulated that the closer a
predictor variable is in context to a criterion variable, the higher
the correlation. Similar results have been found for high school
students (Manchester & Silberberg, 1962, pp. 131-132). For a quick
test, which may be nearly as valid as the complete test, only the
Letters and Numbers subtast need be administered, and probably without
significant loss of information." (r. Silberberg, Iversen, and
M. Silberberg, 1967.)
The importance of actually reading alphabet and numbers as predictive of later
reading success has been validated in several other studies. Abbott (1963) found
that "the two best predictors were the Numbers Subtest of the Metropolitan Readi-
ness Test and the Stanford-Binet Intelligence Scale for readine achievement and the
Reading Subtest and the Numbers Sebtest of the Metropolitan Readiness Tests for
numbers achievement." Barrett (1962) utilized multiple regression analysis and
found that the Reading Letters and Numbers Subtests of the Gates Reading Readiness
Tests was the best single predictor of first grade reading achievement. Barrett
also found that predictive relationships were imprcved by increasing the similarity
of the reading readiness task to the actual reading process, Kerfoot (1964) also

- 7 -
found that the Word Matching and Naming Letters and Numbers Subtests on the Gates
were highly correlated with first grade reading. Richardson (1963) found that
children who later became outstanding readers couldoven prior to kindergarten,
recognize their names and could form letters of the alphabet more readily than
could pupils who encountered less SUCCEas in reading.
No studies were found in the literature which involved the teaching of letters
and number names before first grade in an effort to improve first grade reading
skills.
OBJECTIVES
1. To determine the effects of kindergarten instruction in letters and
number names on reading level at the end of first grade.
2. To determine the influence of tested reading readiness level and /etter
recognition level before initiation of alphabet and number instruction on
children's response to this instruction.
3. To contrast the emergence of the effects of the experimental instruction
when children are administered a group reading test (normal procedure) versus an
individually administered test of word recognition (special procedure).
4. To more accurately predict end-of-first-grade word recognition level from
kindergarten information by finding "b2st" combinations of scores on kindergarten
testing.
5. To determine the mathematical relationship between kimdergartan and first
grade tests.

PROCEDURE
Sample
The sample consisted of four kindergarten classes who ware taught in two
schools in the St. Paul, Minnesota, school district. Each kindergarten class had
a different teacher. The four classes consisted of 35 experimental boys, 28
experimental girls, 32 control boys, and 30 control girls. Attrition (moving,
inability to locate the child, etc.) occurred between kindergarten and the first
grade and reduced the pool to a total of 111 students, consisting of 30 experimen-
tal boys, 24 experimental girls, 29 control boys, and 28 control girls.
Experimental Procedure
During the period between April 3, 1967, and May 269 19679 the experimental
group received eight weeks of special instruction. This instruction consisted of
15 minutes of formal lessons specifically concerned with teaching letter and number
names. In addition, appropriate learning materials were made available so that
the children within the experimental group could play with these materials during
their free time. These materiala were designed to reinforce the experimental
instruction and, based on subjective impressions, it appearmito the teachers in the
experimental group that the materials were very popular with the children. A copy
of the lesson plan is found in Appendix A. The control teachers were not awars of
the existence of an experiment but were merely informed that some special testing
would take place as part of a research project, Therefore, the control teachers
adhered to the regular informal St. Paul kindergarten program.
Method
Prior to the initiation of the experimental procedure, all of ths subjects
were administered the Gates Readinl Reading Tests.* This administration of the
Gates, the pre-test, was accomplished between March 27 and March 29, 1967.
Immediately following the experimental procedure (June 5 and 6, 1967), another
administration of the Gates Reading Readiness Test was adimiaistared as a first
poet-test. The Gates Reading Readiness Test was again administered as a second
post-test between September 19 and 22, 1967, during the children's first month in
first grade. In addition, each child was administered a Draw-A-Man Test between
April 3 and 20, 1967. This Draw-A-Man Test was scored using the Harris (1963)
technique.
*All testing was administered and scored by Margaret C. Silberbere, Ph.D.,
certified school psychologist, who is a special consultant to the proposed project.
The procedures for scoring th Gates Reading Readiness Test are sufficiently
objective to significantly reduce the possibility of a systematic bias.

50
?. 0
x
*
)..
X
EXP. GIRLS
x EXP. BOYS
Pt6 V
x
ex
Is o
I
w
P RE TF. 5-r
Figure 1. Relationship of scores between Pre-test and the first
Post-test--Experimental Group.

-10-
6c
So
)1D
Hv-
& li
:i 30wt- x
r,4
10
0
.
I
X A
x
y
CONTROL GIRLSx CONTROL BOYS
If
to
V
X It
x
to a?.o 3o
PRts rksrFigure 2, Relationship of scores between the Pre-test and first
Post-testControl Group.
EXP. GIRLSx EXP. BOYS
1 I
I 0 .20 30 40 SO
Prk."TSST
Figure 3. Relationship of scores between the Pre-test and the
second Post-test--Experimental Group.
LO
.--

60 -
50-f
JO-
*1
*
*
-12-. CONTROL GIRLS
x CONTROL BOYS
4
10 JO /I) A4 0 JO GO
POLL T f- CI-
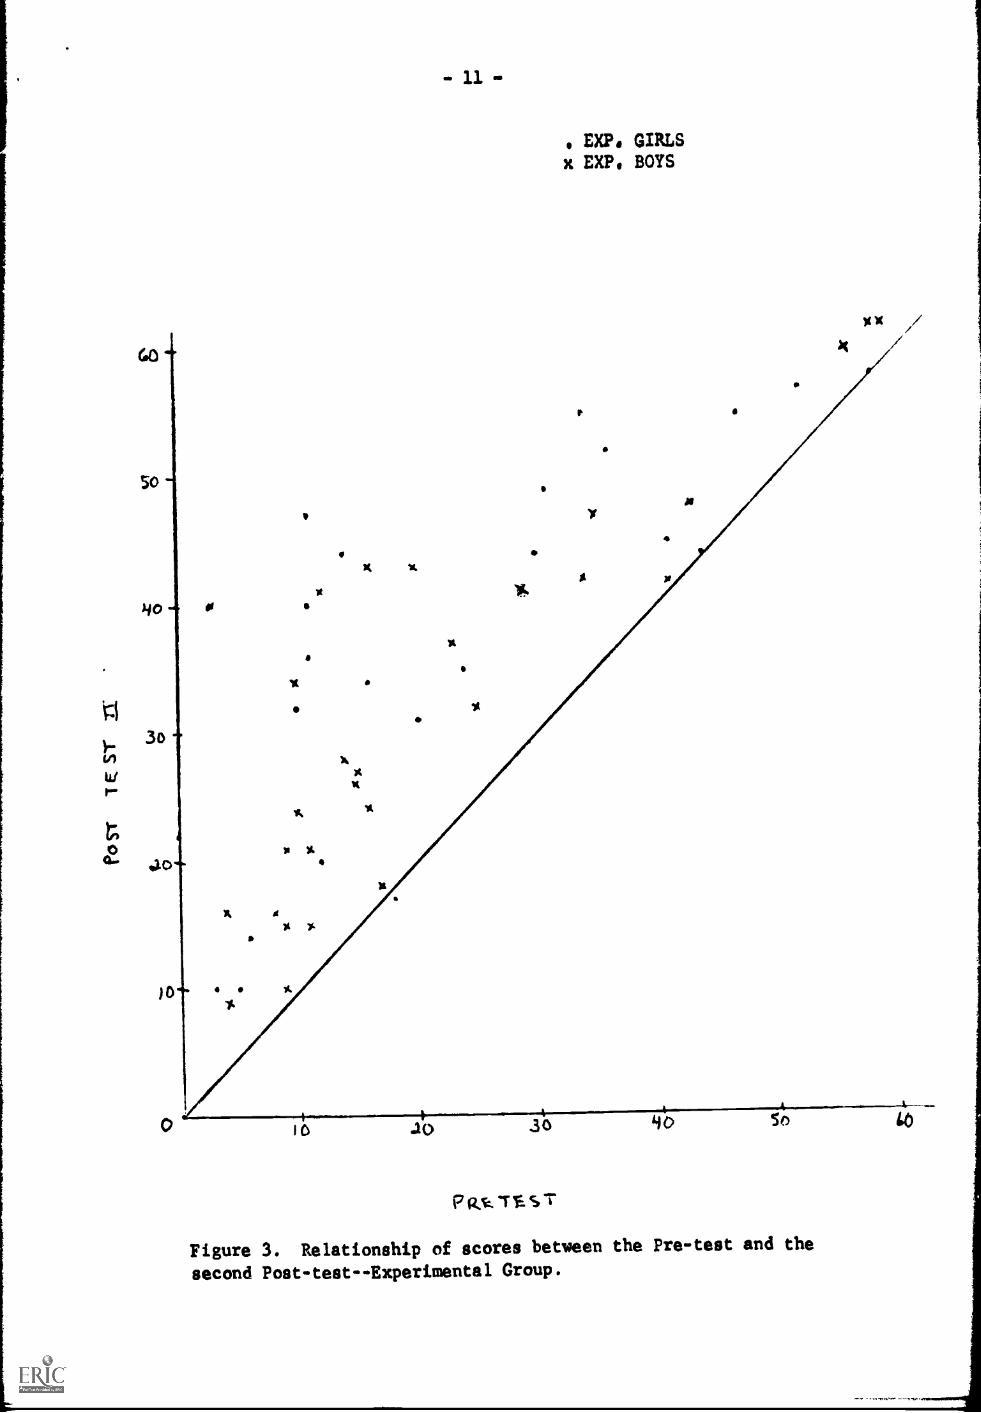
Figure 4. Relationship oUseeres between the Pre-test and the
Second Post-test--Control Group.

- 13 -
Figures 1 and 2 demonstrate the relationship of each child's score on the
pre-test with his score on the first post-test. Figures3 and 4 demonstrate the
relationship between the pre-test and the second post-test. It can be seen from
Figures 1 and 2 that the children in the experimental group did learn the names of
the alphabet letters and numbers through the experimental procedure while the
control children did not learn the same information through incidental learning.
Figures 3 and 4 demonstrate that this learning did not appear to be transitory but
that the experimental group's superiority maintained over the three months of
summer which occurred between Post-test I and Post-test II.
It is therefore proposed that the children in both the experimental and
control groups be followed-up in first grade to assess the relative effects of the
experimental procedure on first grade reading. This would involve the administra-
tion of two more tests: (1) the Gates Primary Reading Test would be administered
to the children in April of the first grade. The purpose of this criterion measure
would be to simulate as closely as possible the normal process for decisionmaking
in the first grade. TYP ically, gimp tests are administered to children in the
spring of their first grade to aid the teacher in decisions concerning retention
versus non-retention as well as whether or not to place the child in special
programs, if they are available. However, group reading tests at the first grade
level ars very susceptible to chance and the contextual cues more easily recognized
by children with high IQs. For this reason, (2) the Wide Range Achievement Test
(WRAT) Reading Section would be administered to all children during May of the
first grade. By using a test of recognizing words in isolation and without contex-
tual cues, the effects of trainine in alphabet and numbers could more validly be
assessed in terms of its carry-over in the beginning reading process. The
administration of the individually administered WRAT as a test of word recognition
would appear to be the most efficient means of measuring this skill.

-14-
INSTRUMENTATION
1. Gates Readinff Readiness Tests
See Gates, Arthur, Manual of Directions for Gates Reading
Readiness Tests (N.Y.: Teac ers College, 1942
These tests were administered as a pre-test and Post-Tost I and Post-Test II
to assess the reading readiness level of all the children. The tests, developed
following a series of investigations extending over several years, are intended for
use at ending kindergarten or beginning first grade level.
The Gates Reading Readiness Tests consist of the following five subtests:
Test 1 -- Picture Directions, requests pupils to carry out verbal instructions
about situations or objects in a picture. Thi7. test attempts to assess, in general,
the pupil's ability to listen, understand, remember and follow verbal directions.
Test 2 -- Word Matching, requires the pupil to draw lines between similar
words. It measures the child's knowledge of familiarity with printed words.
Test.3 -- Word-Card Matching, requires the pupil to match a flash card with a
word in the test booklet.
Test 4 -- Rhyming, assesses the pupil's ability to recognize words which sound
alike. No printed words ars used in this test. The child is required to mavk the
picture which ends in the same sound as the word given by the examiner.
Test 5 -- Reading Letters and Numbers tests the child's familiarity vial
printed letters of the alphabet and numbers from 0 to 9. Letters are presented in
both upper and lower cases.
The manual for the Gates Reading Readiness Tests gives the reliability
coefficients, determined by computing split-halves of each test and applying the
Spearman-Brown correction with a population of 174 New York City children tested
during the third and fourth weeks after enteeng the first grade, as follows:
Test 1. Picture Directions, .84; Test 2, Word Matching, .78; Test 3. Word-Card
Matching, .82; Test 4. Rhyming, .84; Test 5. Letters and Numbers, 696; whole
test, .974.
The correlations of the Reading Readiness Tests given at the beginning of the
first grade and reading ability measured at the end of first grade by means of the
Gates Primary Reading Test, Types I and II, were obtained .for seven New York City
public school classes. They are as followss .89, .81, .78, .699 .57; average .706,
2. Wide RIEELAnhievement Test
See J. S. Jastak and S. R. Jastak, Manual for the Wide Ran
Achievement Test (Bloomington, Delaware: Gu dance Assoc ates,
19651.

- 15 -
The Wide Range Achievement Test (WRAT) is an individually administered
achievement test which first appeared in 1936. Despite sparse information on it,
its convenience and ease of administration led to its wide use among school
Psychologists. In 1965 a revised edition appeared which provided more information
and certain revisions. In addition to arithmetic and spelling subtests, the WRAT
assesses reading (word recognition) which is the subtest used in the project.
Theoretically, word recognition is seen by some lducators as the purest approach
tc the measurement of reading skills in that contextual cues are absent when
presented in isolation rather than in sentences. The standardizationcf the revised
test is based on a total of 5868 subjects ranging tpcm 5 years of age to adults.
No information is presented describing the adult groups, although it appears from
the manual that this group consists mostly of college students and a clinic popula-
tion. The test yields scores both in grade equivalents and also in standard
scores corresponding to the WAIS and WISC distributions; that is, with a mean of
100 and a standard deviation of 15.
The authors report split half correlation coefficients over all age brackets
ranging from .983 to .993 in the reading subtest. The authors also administered
levels I and II simultaneously to those age ranges for which this was possible and
correlated the results of these administrations. For the reading subtest, this was
done with subjects ranging in age from 9-0 to 14-11; correlation coefficients
ranged from .883 to .936. Due to the newness of the revised form, no other
reliability information is yet available.
The authors present several examples of the validity of the WRAT. In one case,
the reading scores of 29 fifth gradc students were correlated with the teachers'
ratings of their achievtment on a 9-point scale, yielding a coefficient of .78.
The authors also report that further evidences of validity are its sensitivity to
chronological age and its agreements with the WAIS and WISC in differentiating
subgroups such es culturally advantaFed or disadvantaged groups. Correlations
between the WRAT reading and the new Stanford Paragraph Reading and Dictation tests
yielded a coefficient of .81. Seventy-four children between the ages of five and
fifteen also were tested on both the WRAT and the California Maturity Tests. A
correlation coefficient of .81 was obtained between the California Mental Maturity
test and the WRAT reading test.
3. Gates PrImary ReadIn Test
See Gates, Arthur, Manual for the Gates Prary Tests
(New York: Bureau of Publications, Columbia Teac
College, 1958)
The Primary Reading Tests is a group test which consist of three subtests --
PWR (Word-Recognition), PSR (Sentence Reading) and PR (Paragraph Reading). Thess
three tests take 55 minutes to administer. The test yields scores in reading
grade equivalent and reading ages, thess norms being based on medians. The author,
in a Su pplement to the Manual for the Gates Readin7 Tests, provides information cn
the reliability of these su tests. T s t res subtests tYpically intercorrelate
somewhere in the .80 range while ths split-half reliability correlations range from
.85 to .97, as reported in the Supplement to the Manual. The author also reports
alternate fcrm correlations based óiiI several samples. For all three subtests,
when testing children on the second-grads level, alternate form reliabilities
typically approximate .86. The author provides little direct information on the
validity of the 1958 revision of the test. The earlier revision had been subjected

- 16 -
to many studies, and it is expected that the new addition is of acceptable validity.
In fact, group tests such as this are often used as the criterion measure for
assessing reading level in primary schools. Such tests typically depend on
content validity which is, in these cases, the teacher's decision.
4% Draw A Man Test
See Harris, Dale, Children's Drawings as Measures of
Intellectual Matur ty New or : Harcoüi, BraceiiAI
World, 19631
The Draw A Man Test has been a popular psychometric instrument since the
publication of Measure of Intellispnce by Drawings by Florence Goodenough in 1926,
Recently, Harris has devoted a complete volume to the research and rationale
surrounding this instrument and has revised the scoring scheme to conform to the
improved statistical methods evolved since the test had first been in operation.
In addition, Harris has established a standard score method of scaling the child's
performance whicb corresponds to precedent set by Wechsler for the WISC. Harris
reports test-retest correlations for second graders (retest occurring after a
one-week time interval) ranging from .81 to $86. The research on the validity of
this instrument is too extensive to approach here. Suffice to say, most of Harris'
book concerns aspect of the measure's validity and 20 pages of bibliography are
devoted to research studies on it. In general, the test is a relatively culture-
free test which correlates well with IQ and school success. Standard score conver-
sions are possible and these standard scores would be utilized in the input data
for this research. Most generally, the instrument is seen as a test of visual
motor coordination and non-verbal intelligence,
ANALYSES
All analyses described below would be done twice, once for boys and once for
girls. This has been demonstrated as necessary with young children by such studies
as Silberbarg, Iversen, and Silberberg (1968) and Silberberg and Feldt (1965),
The following statistical analyses will be done,
1. Comparison of experimental versus control group.
A. Group Reading Test: A two-way analysis of variance will be
done to accomplish this end, Ths two columns will be scores for the
experimental and control groups on the criterion measure (the Gates
Primary Reading Test score). The three rows would consist of leveling
pre-test scores into equal thirds. In this way, it could be deter-
mined, if there is a difference between the experimental and control
group on end-of-first-grade reading, whether this difference occurs
for children with low, average, and high readiness equally or whether
this difference is due to a differential response on the part of one
of these thyee groups. Separate analyses will be performed for boys
and girls.

- 17 -
B. The analyses in lA will be repeated using the swa of scores
on four of the five subtests (excluding Letters and Numbers) of the
Gates Reading Readiness Test as the pre-test score.
C. The analyses would again be repeated, except that gaLthe
Letters and Numbers Subtest of the Gates Reading Readiness Test
would be used as the pre-test score.
2. The same analyses as described in Number 1 above would be run again,
except the individually administered Wide Range Achievement Test would be used as
the criterion measure,
3. The form of the relationship between the pre-test and both post-tests,
between the two post-tests, and the pre-test and the two criterion tests would be
investigated mathematically.
4. The relationships discovered in Number 3 (above) would dictate the manner
in which this part of the analysis wc.uld be done. Adjustments would be required if
relationships are not linear. Transformations would be used when necessary to
yield important educational data. This phase of the analysis would involve a
series of step-wise regression analyses*predicting to the two criterion measures,
*The mathematics of step-wise multiple regression as applied to each criterion
variable can be presented briefly as follows:
.
A
Denoting yj as the 3th child's reading score and Yi = co + xij as a
linear combination of the predictor variables (the xi's) for that child, let
yj = ao + xij represent the set of 'ifs for which 1E(yi - Y1)2 is a minimum.
AThe set of y_.3 's then provides the best estimate in the sense of least squares of
the observed yi's.
With only seven possible predictor variables, the equation ;j=a0+1Eal xij
would not be unnecessarily cumbersome, Building that equation one variable at a
time until the incremental predictivecontribution of each added variable has an
approximately one-in-seven or greater probability of resulting from chance effects
would, however, eliminate redundancies in the !nformation contained in the set of
independent variables.
The first variable entered as a predictor is that variable most hirlay corre-
lated with the criterion variable. Additional variables are then entered (and
deleted) according to the extent to which they contribute to an increasing multiple
regressioncoefficient, subject to a pre-specified significance level,
This very sketchy discussion of step-wise regressionanalysis can be supple-
mented by any of the more recent references in mathematical or applied statistics.

- 18 -
Predictor variables will include: the five subscale scores on the Gates Reading
Readiness Test, the score on the Draw-A-Man Test, and the child's Chronological
Age (all neasured in kinderrfArten). The following prediction equations would be
obtained:
a. Predicting to end-of-first-grade reading on the group
reading test for children who have been taught the alphabet
and number names in kindergarten.
b. Predicting to end-of-first-grade reading on the group
reading test for children who were not taught alphabet and number
names in kindergarten.
c. Predicting to end-of-first-grads reading on the indivi-
dually administered reading tests for children who have been
taught alphabet and number names in kindergarten.
d. Predicting to end-of-first-grade reading on the indivi-
dually administered reading tests for children who were not
taught alphabet and number names in kindergarten.
These equations should be useful, not only in further assessing the impact of
training in alphabet and numbers in kindergarten, but also in evaluating the
relative merits of the two types of reading tests (group versus individual).
5. The Gates Reading Readiness Test consists of five subtests. Subtest
Number 5, Naming Letters and Numbers, will be examined intensively in this section
of the research. The total possible score on this subtest is 62, one point gained
for each recognition of the 26 capital letters, one point for correct recognition
of the 26 lower case letters, and ten points for correct recognition for the
numbers 0 through 9. The relationship bstween this subtest and end-of-first-grade
reading has been demonstrated previously (Silberberg, Iversen, and Silberberg,
1958). However, the experience of the project consultants has led them to
hypothesize that children who know the name of one number probably know the names
of many numbers, a condition which does not appear to exist in the naming of
alphabet letters. Therefore, it would be valuable to examine separately the
relationships between the 52 letter names and the 10 number names with the
criterion variables.
The analyses described in number 4 would be repeated, except that each of
the analyses would be dons twice, once usine the child's raw score on naming
letters alone, and the other time using th.,4; child's raw score on naming numbers
alone.

Already Completed
March 27 - 29
-19-
TIME SCHEDULE
1967
Pre-test administered (by project consul-
tants)
April 3 - May 26 Special instruction for experimental group
April 3 - 20
J u n e 5 - 6
September 19 - 22
April 1 - November 1
Draw-A-Man Test administered (by project
consultants)
First Post-test administered (by project
consultants)
Second Post-test administered (by project
consultants)
Tests scored (by project consultants)
November 1 - December 1Preliminary analyses (by Droject consul-
tantz)
Proposed Research
April 1 - 15
1968
Group Reading Test administered (by N.
M. Silberberg)
April 15 - 30Group Reading Test Scored (by research
assistant)
May 1 - 30
June 1 - 15
June 15 - July 30
August 1 - September 30
Statistical Analysis of Group Relding Test
(by project directors and research assis-
tant)
Individual Reading Tests administered (by
N. S M. Silberberg)
Statistical Analyses Completed (by project
directors)
Write reports (by project directors)

APPENDIX I I
STATIST 1CAL APPENDIX

FINAL REPORT: THE EFFECTS OF KINDERGARTEN INSTRUCTION IN
ALPHABET AND NUMBERS ON FIRST GRADE READING
STATISTICAL APPENDIX
This appendix covers in detail the analyses summarized in the
Results section of the final project report. The authors felt
that not all readers would have the same degree of interest in the
statistical detail supporting the results of the project and that
the present departure from the usual reporting format would facili-
tate a more readable report.
INTRODUCTION
The two experimental classes, given formal training in letters
and numbers, contained 24 girls and 30 boys. The two control classes,
given no such training, contained 27 girls and 29 boys. Metropolitan
Achievement Test scores were not available for one boy in the control
group, and in all analyses involving the M.A.T. reference is made to
a sample totaling 109 rather than 110.
Supplement A of this appendix contains data listings which the
reader may use to verify certain results of immediate interest or to
pursue additional analyses not covered in this report. (Note that
the missing M.A.T. scores for the one control boy mentioned above are
represented by blanks.)
The reporting format of this statistical appendix follows closely
the specifications for analyses contained in the project proposal
(Appendix I).

1. ANALYSIS OF GROUP READING TEST RESULTS
This section is intended to investigate the effects of training
in letters and numbers on subsequent reading achievement as measured
by a group reading test. The Metropolitan Achievement Test,
administered at the end of the first grade, provided the criterion
for assessing reading achievement; to this end, the total of the
three non-arithmetic subtest scores (reading, word knowledge, and
word discrimination) is defined as the M.A.T. reading score. It is
this score that is represented by the symbol "T" in the data listings
contained in Supplement A. e specification for analyses, as
contained in the project pr(,::.sal, are as follows:
"1. Comparison of experimental versus control group.
"A. Group Reading Test: A two-way analysis of variance
will be done to accomplish this end. The two columns will be
scores for the experimental and control groups on the criterion
measure (the Metropolitan Achievement Test score, excluding
Arithmetic). The three rows would consist of leveling pre-test
scores into equal thirds. In this way, it could be determined,
if there is a difference between the experimental and control
groups on end-of-first-grade reading, whether this difference
occurs for children with low, average, and high readiness
equally or whether this difference is due to a differential
response on the part of one of these three groups. Separate
analyses will be performed for boys and girls.
"B. The analyses in lA will be repeated using the sum of
scores on four of the five subtests (excluding Letters and
Numbers) of the Gates Reading Readiness Test as the pre-test
score.
"C. The analyses would again be repeated, except that
gathe Letters and Numbers Subtest of the Gates Reading
Readiness Test would be used as the pre-test score."
1.A. Reading Readiness Pre-Test Score (Based on all Five Subtests)MIIIIMIDORIMMIIill1111104.1.MMENIIIMMMINN,
AZAMMIIIIIIMINUMMalar 11.
Grouping the 109 children according to low, intermediate, or high
scores on their Gates Reading Readiness Pre-test total scores, and
separating each of the three pre-test groups into the four experimental-
control/boy-girl categories, the twelve cells of Table 1-a are obtained.

The i in each cell is the mean M.A.T. end-of-first-grade reading
scores for the children in that cell.
TABLE 1-a
Metro olitan Achievement Test -- End of First Grade
Total Score Less Arithmetic
Reading ReadinessPre-Test Score
(All Subtests)
Low (0-71)
Middle (72-99)
High (100 +)
Exp. Boys Exp Girls Cont. Boys Con Girls
N=13
R=65.6
N=11R=73.9
N=8
R=64.2
N=4R=63.2
N=11 N=6 N=13 N=7
R=74.3 R=88.6 R=81.7 R=89.7
N=6 N=7 N=7 N=16
R=92.3 R=91.1 R=84.1 R=97.2
Difference S.E.
Sex Effect 6.87- 3.17 .05
Exp. Effect .94 3.17 ---
Level Effect 24.44- 3.97 .01
Sex/Exp. Interaction .23- 3.17 ---
Sex/Level Interaction 1.14 3.97 ...
Exp./Level Interaction 2.46 3.97 ---
(Note 1: In this table, and in those to follow, the techniques used
are those usually applied in analysis of variance situations with
unequal sample sizes. Sex effect, for example, was calculated as
the difference between,the average of the six cell means for boys and
the average of the six for girls. For each comparison, or difference,
the standard error-of the difference is also given. The significance
probability for sex effect, PS05, is obtained by calculating the sex
effect in units of its standard error (-6.87/3.17 = 2.17) and referring
to tables of Students "t" distribution. Only high-low differences
were considered in calculating level effect, or any of till interactions
involving level, so that readily interpretable one-degree-of-freedom
comparisons could be obtained.)
(Note 2: Standard errors were presented in Table 1-a for illustra-
tive purposes. They are not included in the remaining tables.)
As expected, reading readiness was found to be significantly
related to end-of-first-grade reading achievement. Girls were also
found to have achieved a reading level generally higher than that

achieved by boys. There was, however, no experimental effect.
Also, no interaction effects of significance were found.
Thus, given a group of boys and girls of approximately the
same level of reading readiness, some of whom are given intensive
training in letters and numbers and some not, one could expect
the following: (1) Girls would tend to perform better than boys
on subsequent group tests of reading achievement and (2) the
effects of the specialized training would tend to wash out with
time.
1.B. ileading Readiness Pre-Test Score (Based on the Four Subtests
rrawirfarrirtim er s
The analyses of 1.A. were repeated, with one modification. The
Gates Reading Readiness Pre-test scores were recomputed with the
Letters and Numbers subtest excluded, and the 109 children were grouped
according to this new measure into low, intermediate, and high reading
readiness levels. Table 1-b presents the equivalent of Table 1-a with
this one modification.
TABLE 1-b
Metro olitan Achievement Test -- End of First Grade
Total Score Less AriTEM777-
Reading Readiness
Pre-Test Score(4 Subtests)
Low (0-55)
Middle (56-66)
High (67 +)
Ex . Bo s Ex . Girls C'ont. Bo s Cont. Girls
N=14:7=64.5
N=11;=76.4
N=7
Tc=70.0
N=6;=71.7
N=6
;=960N=9
;=79.7
N=7
x=80.1
....-.......N=14
x=80.8
N=7x=86.4
N=6
X=96.8.............................
N=7
;=77.7
..........
N=15
x=g5.3
Sex Effect
Exp. Effect
Level Effect
Sex-Exp. Interaction
Sex-Level Interaction
Exp.-Level Interaction
Difference9.50-
1.25-
18.42-
1.92
3.60
2.73-
.05
0 1
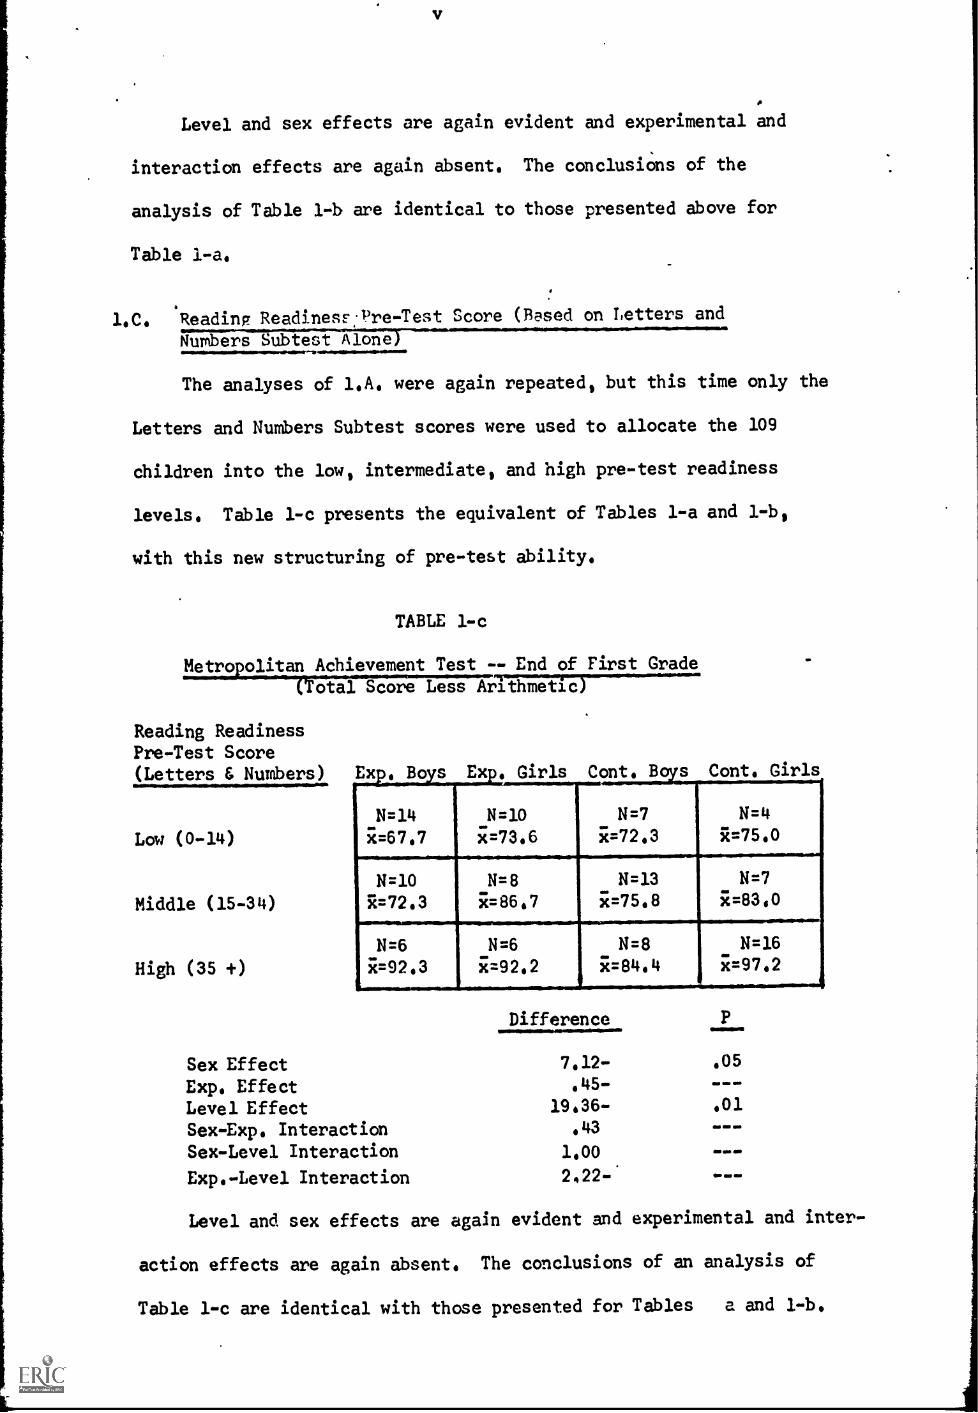
Level and sex effects are again evident and experimental and
interaction effects are again absent. The conclusions of the
analysis of Table 1-b are identical to those presented above for
Table 1-a.
1.C. 'Reading Readiness-Pre-Test Score (Based on Letters and
Numbers Subtest Alone111=111I MIIM111111.1,1/1
The analyses of 1.A. were again repeated, but this time only the
Letters and Numbers Subtest scores were used to allocate the 109
children into the low, intermediate, and high pre-test readiness
levels. Table 1-c presents the equivalent of Tables 1-a and 1-b,
with this new structuring of pre-test ability.
TABLE 1-c
Metro olitan Achievement Test -- End of First Grade
otal Score Less ArriglaT77-'
Reading ReadinessPre-Test Score(Letters & Numbers) Ex . Bo s Exp. Girls Cont. Bo s Cont. Girls
Low (0-14)
Middle (15-34)
High (35 +)
N=14 N=10
.........
N=7 N=4
x=67.7 x=73.6 R=72.3 i=75.0
N=10 N=8 N=13 N=7
x=72.3 R=86.7 i=75.8 R=83,0
N=6 N=6 N=8 N=16
R=92.3 i=92.2 R=84.4 i=97.2
Sex Effect
Exp. EffectLevel EffectSex-Exp. InteractionSex-Level Interaction
Exp.-Level Interaction
Difference
7.12-
.45-
19.36-.43
1.00
2.22-*
.0541 ale
401.10.11000
Level and sex effects are again evident and experimental and inter-
action effects are again absent. The conclusions of an analysis of
Table 1-c are identical with those presented for Tables a and 1-b.

Remarks
The three analyses presented in this section demonstrate that
whether reading readiness is measured according to the total Gates
Reading Readiness score, the total score including Letters and
Numbers, or the Letters and Numbers Subtest score alone, the same
result is obtained. End-of-first-grade reading is definitely a
function of this readiness measure; girls tended to achieve a higher
level of reading ability than do boys with the same degree of
initial readiness; and specialized training in letters and numbers
had no lasting influence on reading ability.
The criterion for assessing reading ability was the M.A.T.
reading score -- a group test. In the next section, we shall sce
that when the critericn is an individually administered reading
test, the differential reading ability between boys and girls
disappears.
2. ANALYSIS OF INDIVIDUALLY ADMINISTERED READING TEST RESULTS
The purpose of this section is precisely the same as that of
the preceding section, except that an individually administered
ling test -- the Wide Range Achievement Test -- was used as the
iterion for assessing end-of-first-grade reading achievement.
The W.R.A.T. scores are listed in Supplement A, and the sample size,
110, reflects no missing data. The specifications for this section
of the statistical appendix were stated in the project proposal as
follows:
"2. The same analyses as described in Number 1 above
would be run again, except the individually
administered Wide Range Achievement Test would
be used as the criterion measure."

2.A. Reading Readiness Pre-Test Score (Based on al* ;'ive Subtc-;ts)1.1.1.0M
em.erwIsMIN.
Grouping the 110 children exactly the same way as was done in LA.,
above, the twelve cells of Table 2-a are obtained. The R's are now,
however, the mean W.R.A.T. end-of-first-grade reading scores for the
children in the respective cells.
TABLE 2-a
Wide Range Achievement Test -- End of First Grade.a.a!.INMM~11.IIW.IMW
Reading ReadinessPr,3-Test Score
(All Subtests)
Low (0-71)
Middle (72-99)
High (100 )
/MarExp . Boys Exp, Girls Cont. s Cont. Girls
N=13R=37.0
N=11R=36.7
......
N=8R=35.1
N=4
R=36.2
N=11 N=6 N=13 N=7
R=40.2 R=42.5 R=39.7 R=39.7
N=6 N=7 N=7 N=16
R=47.7 R=41.8 R=45.0 R=45.1
Sex Effect
Exp. EffectLevel EffectSex-Exp. InteractionSex-Level InteractionExp.-Level Interaction
Difference
.41
.83
8.63-
.83
1.63-
.74
4.10411111
COW
.01.0.0411.111
4111114110.1
411111100
Only the level effect was found to be of significance; achievement
on the W,.R.A.T. at the end of the first grade is an increasing function
of reading readiness one year earlier. No sex, experimental, or any
interaction effects of significance were found.
These resulis pa)allel closely the results Obtained when reading
achievement was measured using a group test, except that no sex differ-
ences were found. Where girls achieved significantly better than did
boys on the grct7, rezlding) test, they achieved no bet4er or
worse than Aid hc.-is on an individuallyadministered (W.R.A.T.) test,

2.B.
viii
Reading ReadinPss Pre-Test Score (Based on the Four Subtests
Excludinr LettPrs and Numbers
The analyses of 2.A, were repeated with the same modification
as in 1.A., above. The Gates Reading Readiness Pre-Test scores were
recomputed with the Letters and Numbers Subtest excluded, and the 110
children were grouped according to this new measure into low,
intermediate, and high levels of reading readiness. Table 2-b presents
the equivalent of Table 1-b with this one modification.
TABLE 2-b
Wide Range Achievement Test -- End of First Grade
Reading ReadinessPre-Test Score(4 Subtests)
Low (0-55)
Middle (56-66)
Nigh (67 +)
Exp. Bo s Girls Cont. Bo s Cont. Girls
N=14R=36.9
N=115E=37.5
N=7
R=87.3-..-
N=6
R=37.2
N=9 N=7 N=14 N=6
x=42.7 x=40.3 R=39.3 ;=43.0
N=7 N=6 N=7 N-15
R=44.0 R=42.8 R=42.8 Tc=44.3
Sex EffectExp. EffectLevel EffectSex-Exp, InteractionSex-Level Interaction
Exp.-Level Interaction
Difference
.33-
.05
6.26-
1.30.06-
.07
-.MOD
.01
Level effects are again evident, and sex, experimental, and inter-
action effects are again absent. The conclusions of the analysis of
Table 2-b are identical to those presented above for Table 2-a.

2.C. Reading Readiness Pre-Test Score (Based on the Letters and4Numbers Subtest Alone)
The analyses of 2,A, were again repeated, but with only the
Letters and Numbers Subtest scores as a basis for allocation into
the low, intermediate, and high reading readiness levels.
Table 2-c presents the equivalent of Tables 2-a and 2-b, with
this new measure of readiness.
TABLE 2-c
Wide Ran e Achievement Test -- End of First Grade
Reading ReadinessPre-Test Score(Letters & Numbers)
Low (0-14)
Middle (15-34)
High (35 +)
Exp. Bo s Exn. Girls Cont. Boys Cont. Girls
N=14 N=10 N=7 N=4
x=37.5 R=37.1 R=35.3 R=37.7
N=10 N=8 N=13 N=7
R=39.8 R=40.1 R=38.8 R=38.8
N=6 N=6 N=8 N=16
R=47.7 R=43.3 R=45.0 R=45.1
Difference1Sex Effect
Exp. EffectLevel EffectSex-Exp. InteractionSex-Level InteractionExp.-Level Interaction
.30
.77
8.37-
1.16
1.57-
.17
Level effect is again the only effect of significance. The con-
clusions of an analysis of Tablf are identical with those present-
ed for Table 2-a and 2-b.

Remarks
The three analyses presented in this section again demonstrate
that the same result is obtained whether reading readiness is measured
according to the total Gates Reading Readiness score, the total score
excluding Letters and Numbers, or the Letters and Numbers Subtest
alone: end-of-first-grade reading is a function of the readiness
measure and specialized training in letters and numbers has no lasting
effect.
The superiority of girls over boys on the group reading test, but
not on the W.R.A.T., is discussed in conjunction with Table 6-n.
3. LINEAR/QUADRATIC RELATIONSHIPS
The specificions listed below call 5cr a mathematical investi-
gation of the rek- Mips among the pre-test and post-test reading
reaeiness scores a. the two reading achievement tests.
"3. The form of the relationship between the pre-test andboth post-tests, between Lae two post-tests, andbetween the pre-test and the two criterion testswould be investigated mathematically."
Figures 1 and 2, on the pages following, show obvious linear
relationships between the Gates Reading Readiness (total) scores and
the M.A.T. reading (total less arithmetic) scores for both the
experimental and control groups. Linear relationships are also
evident from Figures 3 and 4, in which the Gates Reading Readiness
(total) scores are compared to the W.R.A.T. scores for the experi-
mental and control groups.
The figures displayed in the project proposal on pages 9-12
(Appendix I) show linear relationships between pre-test and post-test
Letters-and-Numbers subtest scores for the control group (Figures 2

ra
3 6
P //
if 4
KnI
til:1
5.3"
/WE
-rPs
r 0-
erm
vs,
/9./1
,7:
(Ter
A.L
..L
rrr.
- 46
7,af
f...7
-r/c
)tt
14, E
CN
1/O
L ag
etJP
xce
0
00
x:::a
oYa
7: C
IgL
o
000
-.J
C
:.~?0
Vo
50G
o.
7e,
/4:1
f/:,
..t1
/Yo
/S6
RirM
-5;:t
14 _
RE
AD
1Nrs
.s"
Prq
(7
7..c
r-(r
erea
,.) g
r.:p
Ac
Fig
ure
1

/to
yo 30t
"-1
271'
0
FfP
aIi .
;
0
0 X0 0
X0
X
XX
0
pRe
-re
r (T
orA
z) s
-cor
r,%
;)
5
,-. r
ew r
:Jr
0
X
X
-Co
4070
ZO
TO
Me
/10
/26
lye)
/50
RE
AD
IN4
t./PR
6-7c
r-C
r(T
orA
4)
Figure 2

(1 v.at P.L)
vYd
_:-::;:rm':t1.31
ri I dv3ei
ob1c. I/
fit/as
ohor
);0
);s,
OA
logx
xxFo
g 14x
X
72119 = 0
'<Q
S
- d/4)
r/C72
y 0.;;# '01
CA
(.C
..c.w '14 ;4;1 ty
t..-)ti(.7 fl,;;;;,-/
V av

tieardiT
a
<1
.9..z -5141-cf.:Jr/at/3,V
7/vIeVaW
oldG
C I
or/7II
gole4
o2oh-
as-oh
oE0'8
X
000
0
oX14
C)
CI(
X
xxoxX
AC
O =
X
doc7vv-7/4/1/34,1,301X
.9
Qet)
A
)t
1rpf
el (.13 3
0

and 4) and quadratic relationships for the experimental group (Figures
1 and 3).
To summarize, the following relationships were found to hold
between pairs of test scores:
Pre-test versus Post-test I:
Control Group: The relationship is linear.
Experimental Group: The relationship is quadratic.
Pre-test versus Post-test II:
Control Group: The relationship is linear.
Experimental Group: The relationship is quadratic.
Post-test I versus Post-test II:
Control Group: The relationship is linear.
Experimental Group: The relationship is linear.
Pre-test versus M.A.T. (less Arithmetic):
Control Group: The relationship is linear.
Experimental Group: The relationship is linear.
Pre-test versus W.R.A.T.:
Control Group: The relationship is linear.
Experimental Group: The relationship is linear.
The regression equations presented in the next section (Section 4)
are mathematical representations of the linear relationships of pre-
test subtest scores to the reading achievement (M.AJ. and W.R.A.T.)
criteria.
Although further investigation of the precise form of the quadra-
tic relationships listed above (pre-test versus post-test scores)
would be an interesting mathematical exercise, with a transformation
of the formucx+yandw=x-yfacilitating construction of a
quadratic regression function, it is obvious that the results of such
an exercise would be of little, if any, clinical consequence. For
example, knowing that training in letters and numbers would provide

post-training scores on the Gates Letters and Numbers Subtest that
were a quadratic function of the equivalent pre-training subtest
scores may be of interest in itself. However, the precise form of
that relationship could not conceivably be of interest in the absence
of any lasting effects of such training.
4. PREDICTION OF READING TEST RESULTS
The specifications for this section of the statistical appendix
are as follows:
"4. The relationships discovered in Number 3 (above) would
dictate the manner in Which this part of the analysis
would be done. Adjustments would be required if rela-
tionships are not linear. Transformations would be
used when necessary to yield important educational data.This phase of the analysis would involve a series ofstep-wise regression analyses predicting to the two
criterion measures.
"Predictor variables will include:. the five subscale
scores on the Gates Reading Readiness Test, the score
on the Draw-A-Man Test, and the child's Chronological
Age (all measured in kindergarten). The following
prediction equations would be obtained:
11a. Predicting to end-of-first-grade reading on the
group reading test for children who have been
taught the alphabet and number names in kinder-
garten.
"b. Predicting to end-of-first-grade reading on the
group reading test for children who were not
taught alphabet and number names in kindergarten.
?I C. Predicting to ena-of-first-grade reading on theindividually administered reading tests forchildren who have been taught alphabet and number
names in kindergarten.
"d. Predicting to end-of-first-grade reading on the
individually administered reading tests for
children who were not taught alphabet and number
names in kindergarten.
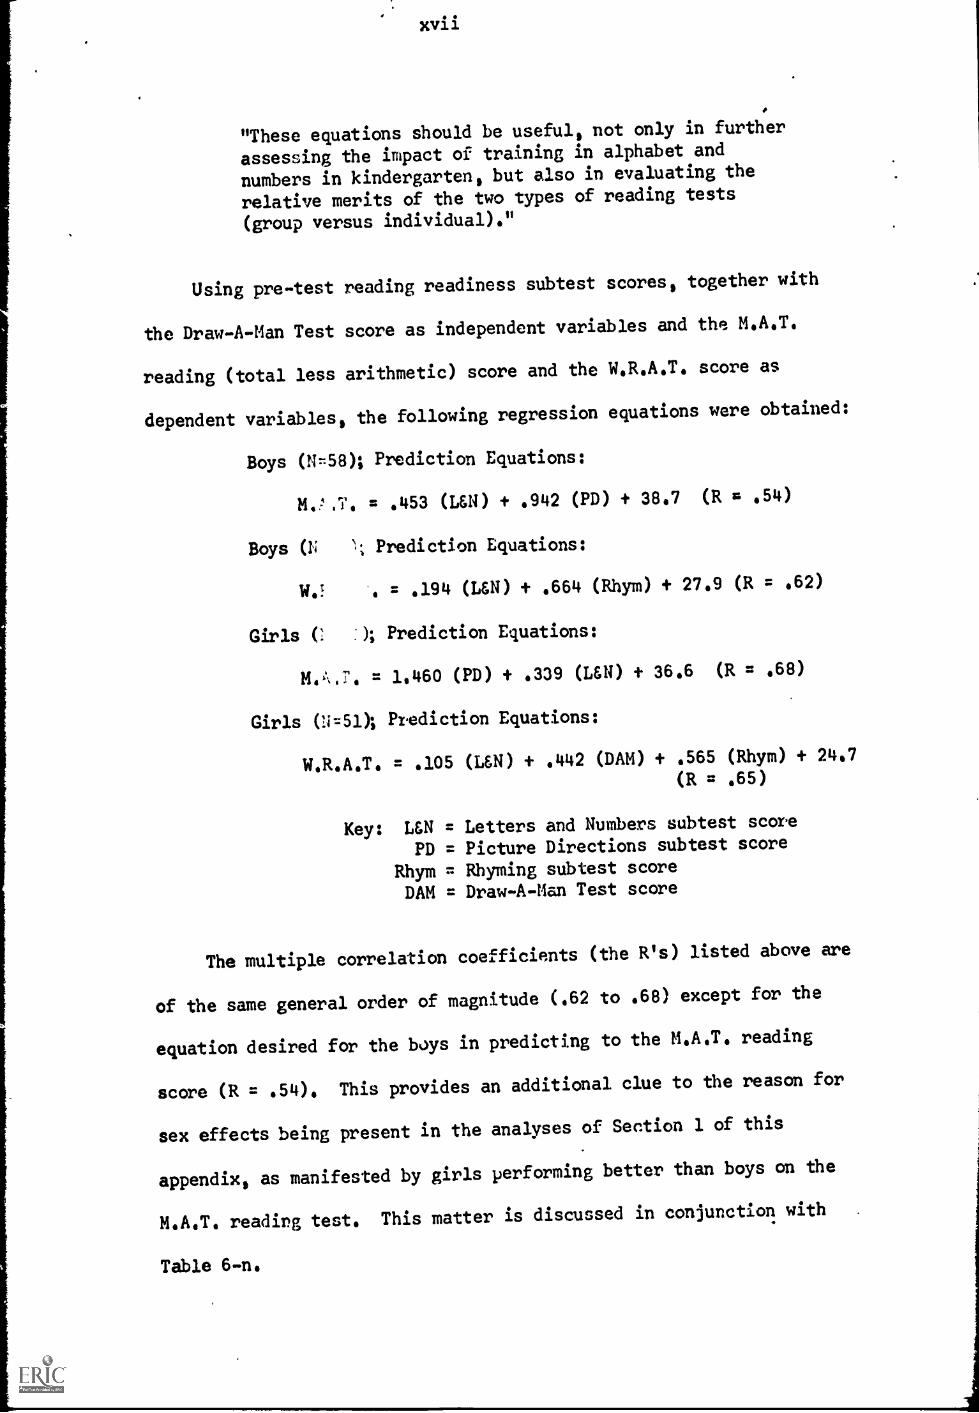
"These equations should be useful, not only in further
assessing the impact of training in alphabet and
numbers in kindergarten, but also in evaluating the
relative merits of the two types of reading tests
(group versus individual)."
Using pre-test reading readiness subtest scores, together with
the Draw-A-Man Test score as independent variables and the M.A.T.
reading (total less arithmetic) score and the W.R.A.T. score as
dependent variables, the following regression equations were obtained:
Boys (N=56); Prediction Equations:
= .453 (L&N) + .942 (PD) + 38.7 (R a .54)
Boys (N Prediction Equations:
W.1 . = .194 (LEN) + .664 (Rhym) + 27.9 (R = .62)
Girls (: :); Prediction Equations:
M44,7. = 1.460 (PD) + .339 (LEN) + 36.6 (R = .68)
Girls (N=5l); Prediction Equations:
W.R.A.T. = .105 (UN) + .442 (DAM) + .565 (Rhym) + 24.7
(R = .65)
Key: UN = Letters and Numbers subtest score
PD = Picture Directions subtest score
Rhym = Rhyming subtest scoreDAM = Draw-A-Man Test score
The multiple correlation coefficients (the R's) listed above are
of the same general order of magnitude (.62 to .68) except for the
equation desired for the boys in predicting to the M.A.T. reading
score (R = .54). This provides an additional clue to the reason for
sex effects being present in the analyses of Section 1 of this
appendix, as manifested by girls performing better than boys on the
M.A.T. reading test. This matter is discussed in conjunction with .
Table 6-n.

5. ANALYSIS: LETTERS VERSUS NUMBERS
This section represents an extension of Section 4, with the
letters portion and the numbers portion of the Letters and Numbers
Subtest treated separately. The following are the specifications
for this section:
"5. The Gates Reading Readiness Test consists of five
subtests. Subtest Number 5, Naming Letters and
Numbers, will be examined intensively in this
section of the research The total possible score
on this subtest is 62, one point gained for each
recognition of the 26 capital letters, one point
for correct recognition of the 26 lower case letters,
and ten points for correct recognition for the
nvmbers 0 through 9. The relationship letween this
subtest and end-of-first-grade reading has been
demonstrated previously (Silberberg, Iversen, and
Silberberg, 1968). However, the experience of the
project consultants has led them to hypothesize that
dhildren who know the name of one number probablyknow the names of many numbors, a condition which does
not appear to exist in the naming of alphabet letters.
Therefore, it would be valuable to examine separately
the relationships between the 52 letter names and the
10 number names with the criterion variables.
"The analyses described in Number 4 would be repeated,
except that each of the analyses would be done twice,
once using the child's raw score on naming letters
alone, and the other time using the dhild's raw score
on naming numbers alone."
The regression procedures of Section 4 were repeated with one
modification: The numbers portion was deleted from the Letters and
Numbers Subtest score, thus providing a "letters subtest" score. All
othei subtest scores and the Draw-A-Man Test score remained the same.
The following regression equations were obtained:

Boys (N=58); Prediction Equations:
M.A.T. - .492 (L) + .918 (Rhym) + 42.4 (R = .54)
Boys (N=59); Prediction Equations:
W.R.A.T. = .206 (L) + .666 (Rhym) + 29.2 (R = .61)
Girls (N=51); Prediction Equations:
M.A.T. = 1.54 (PD) + .352 (2) + 36.6 (R = .68)
Girls (N=51); Prediction Equations:
W.R.A.T. = .107 (L) + .454 (DAM) + .603 (Rhym) t 24.3
(R = .64)
Key: L = "Letters Subtest" scoreAll others as above
The regression procedures were again repeated, using only the
"Numbers Subtest" portion of the Letters and Numbers Subtest score:
Boys (N-58); Prediction Equations:
M.A.T. = 1.47 (WM) + 1.57 (Rhym) + 42.7 (R = .47)
Boys (r=59); Prediction Equations:
W. k.T. = 1.00 (Rhym) + .812 (N) + 22.3 (R = .53)
Girls (N=51); Prediction Equations:
M.A.T. = 2.71 (N) + 1.13 (PD) + 34.8 (R = .67)
Girls (N=51); Prediction Equations:
W.R.A.T. = .777 (N) + .432 (DAM) + .497 (Rhym) + 22.6(R = .64)
Key: N = "Numbers Subtest" scoreWM = "Word Matching Subtest" score
All others as above
These two sets of regression equations are probably of but inci-
dental interest. Only two items of interest stand out: (1) The
minimal shrinkage of the multiple regression coefficients with the
"Letters Subtest" score; and (2) the corresponding shrinkage, minimal
for girls but marked for boys, with the "Numbers Subtest" score.

XX
This suggests that there may be differences between boys and
girls in their pre-test knowledge of letters that are unlike the
corresponang differences in pre-test knowledge of numbers. Figures
5 and 6 on the pages following demonstrate that this.is the case.
Boys seem to have an edge in knowing nugers, but are far behind girls
in knowing letters.
Forty-four of the fifty-nine boys (74.6%) knew at least eight
numbers, as opposed to thirty-three of the fifty-one girls (64.7%).
Only twenty-two of the fifty-nine boys (37.3%) knew at least
sixteen letters.; but thirty of the fifty-one girls (58.8%) knew at
least sixteen letters.
Since the range of chronological ages was restricted due to all
children being in kindergarten at the time of testing, chronological
age did not emerge as a predictor in any of the regression equations.

7 0
a
I) Al ?"
13 Y 80 /OD
P 1 17 10
I I r:!.a
poic,5:71:
I
1.1
1?
4 14)
01: ,Jp.)14...ril: ',41rt,
r.
r I7
104' d ei 5 LI;AA'ilr.
Figure 5
2
)7
---1...- --9

2,
14
e,1
4,1/4
ii
,N 1 siff.:.
1":R c N/'etd/i v/i
t4y S
7 ,
L.1
.
_Wabc I-10 P-2.0 2)-30 31-qo
Alpmeeg tiF 2rilEtr 2 2T;1 t '4.5 k
N 5)
10
1- 10 11-20
t10/)
Figure 6
3140
1,47 , " no r -11.7'
1
I)
. Ell51-5 2.
t
W-56
I
r-.)-p-

6. ADDITIONAL FINDINGS
The four subtests of the M.A.T. were examined separately in
this section. Tables 6-a through 6-d represent analyses of variance
of subtest scores, with a grouping of children according to total
reading readiness scores.;
Tables 6-e through 6-h represent equivalent analyses, but with
grouping on the basis of the four reading readiness subtests exclud-
ing the Letters\and Numbers Subtests.
Tables 6-i through 6-1 again represent equivalent analyses, but
mith grouping on the basis of the Letters and Numbers Subtest alone.
The previously observed sex effects (in Section 1 where the
analyses concerned the total M.A.T. score but without the arithmetic
subtest) are evident in only one of the M,A.T. subtest analyses
reading. Tables 6-c, 6-g, and 6-k all show significant sex effects;
none of the other tables do.

TABLE 6-a
'Metro olitan Achievement Test
Word Knowledge Subtest
Reading Readiness
Fre-Test Score
(All Subtests)
Low (0-71)
Middle (72-99)
High (100 0
ExD. Bo s Ex . Girls Cont. Bo s Cont Girls
R=24.5 R=25.4 R=24.2 R=23.2
R=24.2 R=29.0 R=29.5 R=30.0
x=31.2 R=30.4 R=30.7 R=33.0
Difference SeEll
-MAIM
-MOM
.01-NOD
INIMM
a.MI OP
Sex Effect'Group Effect
Le/el EffectSex/Group InteractionSex/Level Interaction
Group/Level Interaction
1.10-101-6.97-.52-
.43
1.13
1.011011.26
1.01.
1.26
1.26
TABLE 6 -b
ttiltrace.:11 )ievemer, 1.2,,est
Word Discrimination Subtest
Reading ReadinessPre-Test Score
(All Subtests)
Low (0-71)
Middle (72-99)
High (100 t)
Ex . Bo s Ex . Girls Cont. Bo s Cont. Girls
R=21.7 R=24.8 R=23.6 R=21.7
R=25.4 R=27.8 7029.3 R=29.1
R=30.3 R=31.0 R=27.4 R=31.0
..............g...................L...
Difference
Sex Effect 1.28-
Group Effect .18-
Level Effect 6.97-
Sex/Group Interaction .76-
Sex/Level Interaction .75
Group/Level Interaction .44-
SSE.
1.03
1.03
1.28
1.03
1.28
1.28
MOM-
alarm.
.01

TABLE 6-c
Metro olitan Achievement TestReadlng Subtest
Reading Readiness
Pre-Test Score
(All Subtests)
Low 4(0-71)
Middle (72-99)
High (100 0
Ex . Bo s Ex . Girls Cont. Bo s Cont. Girls
. R=1984 R=2387 R=1684 R=18.2
R=2487 R=31.8 R=2289 R=3086
R=3088 R=2987 R=2680 R=3382
ISex Effect
Zroup 'Effect
Level EffectSex/Group InteractionSex/Level InteractionGroup/Level Interaction
Difference SSE. P
4.48-
'2.14
10.50-1.05
,04-
1.78
1.75
1.752.19
1.75
2.192.19
805GIB OW all
.01
Gamin
=IMMO
TABLE 6-d
Metropolitan Achievement TestArithmetic Subtest
Reading ReadinessPre-Test Score(All Subtests)
Low (0-71)
Middle (72-99)
High (100 0
Ex . Bo s Ex . Girls Cont. Bo s Cont Girls
R=4188 R=4584 R=4581 ii=4500
R=4984 R=5085 R=5084 R=5101
R=5883 R=5586 R=4883 R=5280
Sex EffectGroup Effect
Level EffectSex/Group InteractionSex/Level Interaction
Group/Level Interaction
Difference S.E. PIMS11111MMIINIIIIIIIIIMPYININNUINIMM
1.03-
1.50
9.21-.40
.61-
4.13-
1.85
1.85
2831
1.852.312.31
la GIB .11111
GIB GO
.01SIIM
IROMMI
MOill

xxvi
TABLE 6-e
Metropolitan Achievement Test
Word Knowledge Subtest
Reading ReadinessPre-Test Score
(Four Subtests)
Low6(0-55)
Middle (56-60
High (67 0
Ex . Bo s Ex . Girls Cont. Bo s Cont. Girls
,7 R=23.6 R=25.6 R=26.6 5=24.7
R:27.3 R=27.4 R=28.5 R=31.5
R=28.0 R=324 R=29.7 R=32.9
Sex EffectExp. EffectLevel EffectSox/Exp. InteractionSex/Level InteractionExp./Level Interaction
Difference P
1.73-
5.55-
.30-
1.76.15
001
TABLE 6-f
Metropolitan Achievement Test
Word Discrimination Subtest
Reading ReadinessPre-Test Score(Four Subtests)
Low (0-55)
Middle (56-66)
High (67 )
Ex . Bo s Ex . Cirls Cont. Bo s Cont. Girls
R=21.7 R=24.7 R=25.3 R=25.2
R=25.9 R=28.4 R=27.8 x 31.3
-.....R=29.6 R=31.0 R=28.0 x=29.9
DifferenceOMNI. V
Sex Effect 2.03-
Exp. Effect 1.01-
Level Effect 5.39-
Sex/Exp. Interaction .28-
Sex/Level Interaction .10
Exp./Level Interaction 1.68-
P
.01

Reading ReadinessPre-Test Score
(Four Subtests)
Low (0-55)
Middle (56-66)
High (67 0
TABLE 67g
Reading Subtest
Ex Bo s Ex . Girls Cant Bo i Cont. Girl........R=2661 R=1861 R=2108
R=2604 R=24.3
R=3368
R=2466 R=3362
1."..R=2868 5=20.0 ;1=3265
Sex Effect
Exp. EffectLevel EffectSex/Exp. InteractionSex/Level InteractionExp./Level Interaction
Difference
5.72-
1:407.48-
2.50
1.73
1-20-
.014
.01MIMI=
0001110ill
TABLE 6-h
Metropolitan Achilven-Arithmetic Subtest
Reading ReadinessPre-Test Score(Four Subtests)
Low (0-55)
Middle (56-66)
High (67 0
.10
EX 6 Bo s Ex Girls Cont. Bo C n . Girlsr.....
R=4267 R=45.8 R=48.0 R=47.0
R=5265 R=5167 R=5001 R=49.8
R=5263 R=54.2 R=4563 R=5266
Sex EffectExp. Effect
Level EffectSex-Exp. InteractionSex-Level Interaction
Difference
1.69-
1.06
5.20-.32
1.77
.05
Exp.-Level Interaction 3.76-

TABLE 6-i
Metropolitan Achievement Test
Word Knowledge Subtest
Reading ReadinessPre-Test Score(Letters & Numbers)
Low (0-14)
Middle (15-34)
High (35 +)
Ex . Bo s Ex . Girls Cont. Bo s Cont Girls...........................,..........
R=2462 R=2566 R=2560 3=2467
R=2466 R=2862 R=2866 R=2961
R=3162 R=3067 R=3067 R=3360
Sex Effect
,Exp. Effect
Level EffectSex-Exp. EffectSex-Level EffectExp.-Level Effect
Difference P
1617..
.1.226650...
633.
615
649
-MO.
.01
011110
TABLE 6-j
21=22a521142114=22-LIstWord Discrimination Subtest
Reading ReadinessPre-Test Score(Letters & Numbers)
Low (0-14)
Niddle (14-34)
High (35 +)
Ex 6 Bo s Ex . Girls Cont. Bo s Cont. Girls
Rz2263 R=2469 R=2666 R=2567.
R=2469 R=2769 R=2669 R=2668
R=3063 R=3068 R=2862 R=3160
Sex EffectExp. EffectLevel EffectSex-Exp. Interaction
Sex-Level InteractionExp.-Level Interaction
Difference0.1.1110.,III
1.30-.69-
5.21-
. 8.9.
638
1.74..
P

xix
TABLE 6-k
Lietz.mona..itarstIchievement TestReadlng Sub test
Reading ReadinessPre-Test Score(Letters & Numbers) x . P: S Ex Girls Cont. Bo s Cont. Girls
Low (0-14)
Middle (15-34)
High (35 +)
R=21.1 R=23.1 R=20.7 R=24.5
R=22.8 R=30.6 R=20.2 R=27.0-
R=30.8 R=30.7 R=25.4 R=33.2
Difference
Sex Effect 4.64-
,Exp. Effect 2.35
Level Effect 7.64-
Sex -Exp. Interaction 1.45
Sex-Level Interaction .47
Exp.-Level Interaction .97-
Reading ReadinessPre-Test Score(Letters & Numbers)
Low (0-14)
Middle (15-34)
High (35 0
TABLE 6-1
rithmetic ubtest
.05UM all sir
.01
R=41.3 R=45.0 R=48.1 R=48.5
R=50.9 R=49.5 R=48.5 R=49.1
R=58.3 F=57.5 R=48.2 R=52.0
.................
Sex EffectExp. Effect
Level EffectSex-Exp. Interaction
Sex-Level Interaction
Difference P.
1.03-
1.31
8.29-.53
.29-
.......01.........
Exp.-Level Interaction 6.48
.
.05
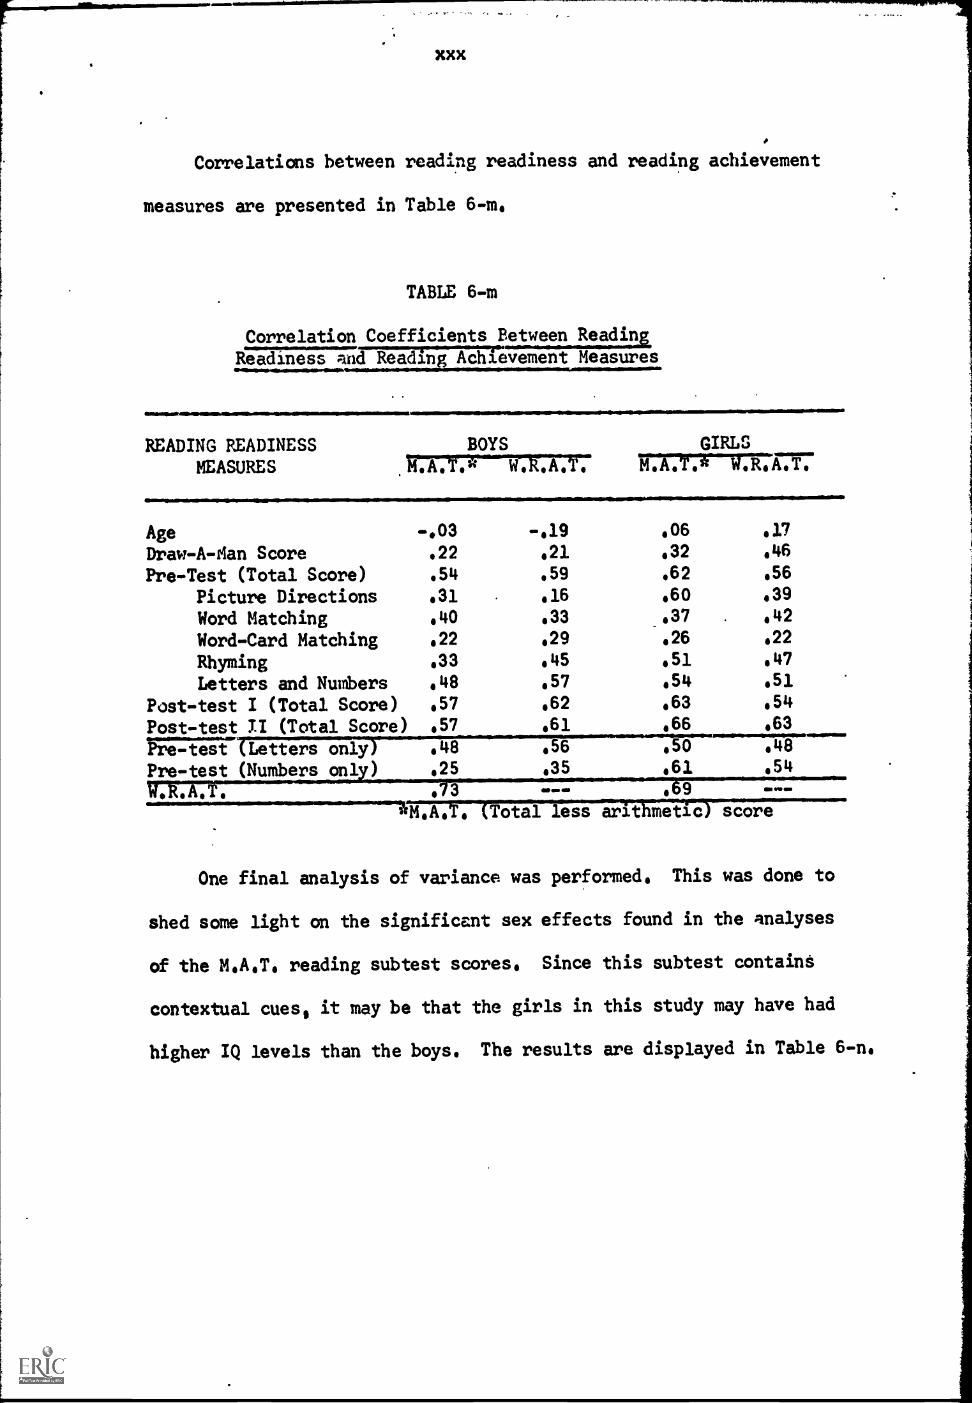
XXX
Correlations between reading readiness and reading achievement
measures are presented in Table 6-m.
TABLE 6-m
Correlation Coefficients Between Reading
Readiness and-Talralhimevement Measures
READING READINESSMEASURES
BOYS GIRLS
.177;77717-1-71.7777 R1777--7:171.T.
AgeDraw-A-Man ScorePre-Test (Total Score)
Picture DirectionsWord Matching
Word-Card MatchingRhymingLetters and Numbers
Post-test I (Total Score)Post-test II (Total Score)Pre-test Letters onlyPre-test (Numbers onl )
ir.Tall.r. s 3 --- '-'7161---""7,'-'irff.,t,T7( E)'-'
-.03 -.19 .06 .17
.22 .21 32 .46
.54 .59 .62 56
.31 .16 .60 .39
.40 .33 .37 . .42
22 .29 26 .22
.33 .45 .51 .47
.48 .57 .54 .51
.57 .62 .63 .54
.57 .61 .66 .63
.48 .56 .50 .48
.25 .3 .61 .54
Total less arlt metic score
One final analysis of variance was performed. This was done to
shed some light on the significant sex effects found in the analyses
of the M.A.T. reading subtest scores. Since this subtest containt
contextual cues, it may be that the girls in this study may have had
higher IQ levels than the boys. The results are displayed in Table 6-n.

Boys
Girls
Total
TABLE 6-n
Draw-A-Man Test Scores011/0111.11100.111111bExperimental Control Total
N=30
R=14.67
........
N=29R=14.69
N=59R=14.68
N=24 N=27 N=51
R=15.67 R=17.33 R=16.55
N=54 N=56 Null0
R=15.11 R=15.96 R=15.55
Source of Variation
Groups
d.f.
3
S.S.
131
M.S.
43.7
F
2.52
P
.06
Sex 1 96 96 5.54 .02
Group 1 20 20 *1.15 ---
Sex x group 1 15 15 87
Error 106 1838 17.34
Total 109 1969
Table 6-n shows that the girls did have significantly higher IQ's
(as msasured by the Draw-A-Man Test) than did the boys. This probably
is the factor accounting for the sex differences and is a reflection
of the better use and comprehension of contextual cues by the more
academically apt girls.

SUPPLEMENT A
Data Listings

KEY FOR DATA LISTS
C.A. = Chronological Age (in months)
D.A.M. = Draw-A-Man
41.GATES READING READINESS TEST
PRE.I = Pre-Test I
POST.I = Post-Test I
POST.II = Post-Test II
1 a Picture Direction
2 = Word Matching
3 = Word-Card Matching
4 - Rhyming
5 = Reading Letters and Numbers
T = Total Score
111111.1111111 1011111MNIIIMINO
Prea Alphabet = Pre-Test Alrhabet Only
Pre.I Numbers = Pre-Test Numbers Only
Alphab. Hi-Lo = Alphabet High-Low
Numbers Hi-Lo = Numbers High-Low
1111,011AVIMMINIIIINIi ,ANNIPM111
METROPOLITAN MAIEVEMENT TEST
1 = Word Knowledge2 = Word Discrimination3 = Reading
4 = ArithmeticT = Total Score (Less Arithmetic)
W.R.A.T. = WIDE RANGE ACHIEVEMENT TEST

<C 6
101 67
102 68
103 63
104 68
105 71
106 66
107 74
10R 69
109 73
11(1 74
111 65
112 76
0113 74
cfl
114 71
IA
115 70
116 72
FL!
117 73
1-4
119 72
w a120 67
Ix w
121 77
122 73
123 66
124 75
125 65
126 64
127 68
128 72
129 71
133 73
134 72
.. z
GATES PRE. I
GATES POST. I.
GATES POST. II
4. 4
12
34
5T
12
34
5T
12
3
12
33
16
16
13
58
136
34
18
20
13
61
146
33
18
17
15
32
17
13
09
56
127
32
15
15
13
62
137
36
17
17
16
26
15
11
13
59
124
30,14
20
1?
62
138
31
17
19
12
31
15
11
13
43
113
33
16
06
10
50
115
31
13
06
14
20
16
14
12
41
103
35
15
07
13
46
116
32
18
12
20
26
15
14
13
35
103
31
15
15
14
51
126
32
15
OS
18
31
10
11
12
34
092
30
06
07)
34
4?
097
32
17
10
17
31
08
08
13
29
089
24
12
10
12
45
103
29
15
09
12
31
12
11
14
16
084
33
06
12.14
26
091
35
14
op
12
30
16
09
12
14
081
31
14
09
12
28
094
3?
15
16
14
27
08
16
12
16
079
33
13
14
1?
54
126
291307
14
31
07
07
10
23
078
31
OR
10
12
45
106
28
13
14
13
32
16
10
11
:)9
078
29
15
1210
22
088
29
16
11
16
25
13
10
14
15
077
32
15
07
14
31
099
31
15
08
14
25
14
12
14
10
075
32
18
14
12
36
112
31
18
12
19
25
14
09
07
17
072
19
14
10
07
18
068
22
17
16
29
19
09
08
11
25
072
30
17
10
1?
5?
121
22
15
01
13
25
14
12
07
10
OAP
32
1.5
11
12
37
107
31
15
10
11
24
15
OH
05
15
067
29
13
11
08
23
084
29
10
OR
09
27
08
09
11
11
066
32
01
11
13
28
085
28
04
07
12
29
03
10
10
14
066
34
08
09
OR
35
094
26
07
06
13
19
02
10
13
20
064
29
05
05
14
40
093
32
09
06
10
22
13
11
06
12
064
33
10
06
10
34
093
32
08
10
15
32
04
11
11
04
062
29
06
06
08
17
066
29
12
00
16
24
01
10
14
11
060
79
07
00
OR
18
062
29
12
11
17
31
04
07
07
09
058
30
OR
11
09
15
073
34
13
17
11
28
06
10
05
09
058
28
12
OR
12
13
073
31
10
07
18
33
04
04
12
03
056
30
OP
04
14
28
084
27
07
05
12
21
06
07
07
08
049
22
07
08
0?
16
055
29
10
06
16
17
08
09
07
04
045
28
OR
06
0c409
060
25
12
14
4 13 17
11 141014
131214 14
10
11 1312
1412
06 OP1010
131?
12121311
34131212
MET ACH. TEST
.
5T
4.1 0 0 03 = i
r-4 < I
-4 0 w a.,
C00
0O
tt.0 = I-4 0 p.--(o0
a
m.0
s4
5 0
...3
,0
a a >4
..tcztn1
23
4T
WRAT
62
143
49
09
11
134
35
44
56
113
55
60
142
46
10
11
133
31
30
59
094
43
6?
140
49
10
11
134
3?
42
59
108
65
48
112
33
10
11
120
23
17
52
060
34
42
114
31
10
11
133
28
23
60
084
411
47
116
27
OR
11
133
33
29
58
095
49 -
4?
114
25
09
11
117
22
14
54
053
39
41
106
20
oy
i1
128
27
40
56
095
43
24
095
07
09
21
130
32
32
60
0911
49
22
109
04
10
?2
128
31
31
32
090
45
43
102
n6
10
22
121
24
1%
48
063
37
37
103
14
09
12
127
3?
29
53
082
46
10
079
02
07
22
118
2?
19
43
059
34
27
093
10
09
22
130
27
184
075
39
34
109
02
OR
22
126
26
34
57
OW,
Z.
18
085
07
10
22
110
10
21
52
041
23
32
076
15
10
12
131
27
16
43
074
45
24
088
00
10
22
131
26
18
50
075
42
26
083
06
09
22
172
25
22'58
069
36
21
070
04
07
22
114
15
()%
17
038
35
28
080
09
05
22
125
28
28
52
081
32
43
102
11
09
22
130
23
18
40
071
42
41
103
06
06
22
127
30
27
94
084
39
16
069
04
04
:'
21
26
21
31
44,078
36
15
080
OA
07
22
129
24
07
33
060
z,7
21
096
01
02
22
116
77
70
50
oilp
33
15
077
01
08
22
122
17
16
40
055
37
40
092
02
01
22
131
26
17
30
074
42
16
073
00
OR
?2
176
14
21
54
061
33
09
072
00
04
22
120
11
18
2?
049
27

265
266
267
268
270
271
272
273
274
275
276
277
279
280
281
282
283
284
285
286
287
288
289
290
GA
TE
S PR
E. I
11G
AT
ES
POST
. IG
AT
ES
POST
. II
12
45
T1
23
45
T1
23
4
64
15
32
17
20
14
52
135
34
18
18
14
59
143
36
17
11
14
73
14
30
15
18
10
41
114
32
13
19
14
56
134
35
15
13
13
64
23
18
13
12
13
58
114
30
16
06
12
61
125
31
16
OR
09
74
12
28
16
20
14
36
114
33
16
14
14
48
125
30
18
13
13
71
16
31
17
18
14
31
111
36
17
17
14
46
130
34
18
17
14
78
14
35
17
14
10
34
110
35
18
12
13
57
135
33
15
13
1?
67
16
29
11
08
09
44
101
33
04
OR
10
48
103
28
15
13
07
65
10
22
11
05
10
47
095
30
13
06
14
54
117
27
14
08
14
76
31
31
16
12
13
18
090
33
15
14
10
18
090
34
16
12
13
731529
OR
11
07
29
084
34
13
14
13
43
117
34
17
14
13
70
15
31
13
12
03
24
083
30
10
15
09
34
098
35
16
14
09
72
15
27
14
10
13
16
080
33
18
13
12
34
11-0
34
17
14
13
68
OR
25
0?
OR
11
30
076
24
07
04
09
37
081
28
08
08
07
65
21
28
08
11
13
11
071
34
07
04
13
36
094
31
1?
08
12
68
17
27
10
08
06
20
071
33
11
14
13
32
103
29
10
12
32
67
15
25
16
13
05
11
070
31
17
12
09
31
100
35
14
14
08
67
23
27
04
10
13
10
064
27
12
01
09
18
067
31
14
12
14
72
09
26
08
12
10
06
062
27
09
03
09
11
059
27
14
13
10
63
15
26
04
08
10
12
060
26
15
14
13
2?
100
32
14
10
13
64
20
14
05
08
09
14
050
23
05
03
06
51
088
30
13
02
12
68
18
25
09
04
05
05
048
29
08
02
07
10
056
26
14
09
12
66
13
21
01
01
12
11
046
24
10
11
10
36
091
29
12
09
11
64
12
13
07
07
04
03
034
25
06
06
01
02
040
25
11
06
06
70
09
09
04
09
04
00
026
21
05
13
01
23
063
27
05
13
04
5T
0 t-1
741
57
135
42
10
11
2
45
121
32
09
11
2
58
122
4F1
10
11
2
5?
126
26
10
11
2
49
132
21
10
1.1
2
55
128
74
10
11
2
46
107
34
:JO
11
2
55
118
39
08
11
2
17
092
11
07
21
2
41
119
20
09
11
2
35
109
18
06
11
2
34
112
07
09
22
2
44
095
25
05
12
2
40
103
04
07
22
2
31
094
17
03
22
2
47
118
03
OR
22
2
32
103
03
07
22
2
14
078
04
0?
22
2
20
089
03
09
22
2
44
101
08
06
22
2
10
071
00
OS
22
2
36
097
06
05
22
2
10
058
0?
01
22
2
22
071
00
00
22
HET. ACH. TEST
12
34
TW
RM
35
32
42
63
109
48
32
32
34
59
09k
4?
27
30
20
61
077
39
29
27
22
52
078
39
29
3?
28
49
089
4432
3?
38
50
102
40
29
3?
24
55
02
41
32
32
42
55
lo6
51
35
31
39
52
105
44
27
18
28
60
0/3
35
30
29
36
54
095
43
29
31
29
50
089
47
21
26
17
32
0645
26
24
19
44
069
42
23
24
30
49
077
33
29
31
24
44
084
37
32
34
3?
53
098
54
22
22
18
54
06?
33
25
19
29
45
073
37
28
29
31
42
088
39
26
25
23
57
074
37
3?
30
31
54
093
39
13.
11
07
19
031
19
23
24
17
3};064
34

493
71 2
649
5 74
23
496
75 1
649
7 64
16
498
75 1
249
9 75
22
400
72 2
040
1 74
19
402
67 2
340
3 63
14
404
74 1
440
5 74
21
406
64 2
240
7 69
16
408
65 1
640
9 64
19
411
72 1
741
2 73
24
413
71 2
241
4 74
12
415
67 1
041
6 72
12
417
64 1
641
8 63
12
419
76 1
642
0 65
11.
471
70 1
7
GA
TE
S PR
E .
IG
AT
ES
POST
.I
GA
TE
S PO
ST .
II
12
34
5T
12
34
5T
12
34
2918
1713
5813
528
1819
1461
140
3318
1814
2817
1712
6013
430
1817
3.4
6013
934
1711
1.4
3114
1714
54-
130
3217
1414
4917
635
1611
14
3414
1314
5513
035
1514
1458
136
3511
1014
3710
1814
5012
431
1011
1356
121
2916
1314
2415
1313
5712
228
1516
1356
128
2518
1414
3514
1111
5112
234
1718
1458
141
3517
161.
4
3413
1614
4412
131
17n
1.4
4411
729
1808
14
2413
1606
6112
027
1319
1461
134
3015
1212
3215
1814
4112
032
1712
1443
118
3217
1012
3317
1213
4311
836
1713
1347
126
3318
1?14
3112
0814
5111
633
1115
1449
122
3316
0914
3211
1214
4511
428
1413
1243
110
2813
1014
3316
0414
4711
436
1716
1447
130
3418
1414
2316
1411
4410
874
1606
1345
104
2917
0912
2802
161?
5010
831
0416
1458
123
31.
1712
14
3406
1613
2309
233
1011
1331
098
3616
0013
2918
1507
19O
RR
2917
1414
2410
033
1616
13
2917
1612
1(7,
085
2916
0814
1808
532
1609
14
2914
0814
1307
R32
1509
1121
088
3210
1713
3214
1412
0507
732
1611
1308
080
3116
1614
-
3104
1106
2507
732
1.0
0307
2?07
429
1009
1.2
271?
02O
R27
076
3314
1414
3310
834
1610
14
2509
0908
1706
825
0615
1217
075
3208
0211
7508
0706
1606
230
0610
1446
106
2610
0714
2409
0110
0404
871
0207
0612
048
2601
1109
1511
0607
0804
727
0904
1?11
063
2316
0407
5T
0 0
o-3
14I
Itr
.1r-
I...
. =
6214
549
093
12
6013
650
101
12
5112
745
091
12
5812
845
101
12
571.
2440
101
17
4811
947
101
12
5914
141
101
12
5912
834
101
12
5912
851
101
12
4211
331
101
12
4712
435
081
12
4912
141
101
12
3510
035
101
12
4912
937
103
12
4611
335
091
12
5212
64?
OR
11
2
3109
613
101
1.?
781.
0612
072
12
2?09
307
092
12
??09
404
092
?2
0908
600
052
22
2708
216
091
22
4712
120
071
22
14 '
067
1007
22
2
3509
708
082
22
1806
500
042
22
1306
304
042
22
ME
T.
AM
A. T
EST
a
12
34
TW
RA
T
3534
4256
111
6234
2926
4908
947
3278
2041
080
3635
3543
6111
34f
.34
3324
5709
147
3032
2347
085
4135
3146
5911
246
3433
425?
309
5031
3?34
5009
744
3525
2752
087
3433
2528
5408
640
3533
4044
108
5034
3437
6010
542
3331
.41
.53
.10
553
2829
2144
078
4730
3237
5909
937
3230
3457
096
4128
1879
3507
54c
3231
7.3
570R
638
3530
4460
109
39, :
I
2831
2647
085
37'
1
2130
2251
073
3734
3436
5110
441
,33
3129
4409
335
2414
1644
054
3577
2016
4306
335
0922
1244
043
40

336
74
337
70
338
74
339
70
340
63
341
64
342
73
343
6975
345
71
346
69
347
79
348
7349
75
350
72
351
68
352
71
353
73
30,469
355
71
356
74
357
68
358
69
359
67
360
64
361
74
362
67
363
70
364
65
14
15
221913
11 16
21 1616
15
11 12
11 1517
15181718
12 15
1315
123510
09 13
GA
TE
S PR
E. I
12
34
5
32
17
17
13
61
30
15
14
13
53
33
12
09
12
57
35
13
10
14
50
32
13
16
14
44
31
13
09
13
52
24
09
11
13
60
31
12
08
13
40
15
10
11
14
49
28
14
11
14
31
29
16
04
14
31
25
09
14
12
33
32
11
18
13
18
34
07
08
14
26
34
11
09
14
20
29
10
11
14
23
31
11
10
07
21
30
14
12
13
13
26
11
08
07
27
28
1?
09
12
22
34
12
Os
09
12
24
08
06
14
18
25
09
10
10
15
26
10
10
09
14
27
10
07
13
11
35
06
06
12
06
29
13
05
12
00
18
05
02
Os
17
21
03
08
03
02
T
140
125
123
122
119
118
117
104
099
098
094
093
092
089
088
087
080
ORO
079
084
075
070
069
069
068
065
059
050
037
GA
TE
S PO
ST. I
GA
TE
S PO
ST. I
I
12
3-4
5T
12
31
16
12
13
58
130
34
17
31
15
05
13
55
119
28
17
33
14
00
1?
55
114
33
15
32
12
12
13
52
121
55
16
34
13
15
14
47
123
33
14
31
15
12
14
55
127
31
17
30
07
08
13
50
108
31
13
36
14
11
14
46
121
31
17
32
13
10
14
57
326
29
14
30
15
11
13
35
104
29
15
29
15
07
10
31
n92
25
16
31
13
10
00
39
10]
29
13
30
15
08
14
23
090
33
14
36
15
11
14
31
107
35
14
35
10
10
14
21
Oct)
30
15
30
07
09
04
26
076
30
16
32
15
09
OR
20
084
34
17
31
13
13
13
16
086
30
14
36
15
12
08
26
097
31
15
34
17
08
14
28
101
33
16
33
06
16
14
16
085
35
15
31
06
OS
14
18
077
30
09
33
10
10
09
21
083
31
12
33
09
14
13
23
092
28
1]
33
OR
04
OR
05
058
26
03
30
07
09
13
OR
067
35
14
26
14
00
12
03
055
78
15
26
01
02
11
20
060
21
OR
30
00
01
09
03
043
28
05
34
5T
14
14
56
135
51
10
1
10
12
57
124
44
09
11
1
16
14
61
139
47
10
11
1
10
5?
126
40
10
11
1
11
09
44
1 11
35
09
11
1
1?
1?
57
129
4?
10
11
1
15
13
51
123
50
10
11
1.
04
13
44
109
31
1(1*.:
101
11
49
104
40
1
1?
14
4?
112
23
08
11
1
04
11
23
C2?
09
1
1:
1
05
11
41
099
24
09
11
15
1?
29
103
09
09
21
1
02
14
26
091
16
10
1i
09
13
19
086
11
09
21
1
12
00
22
OSO
13
10
11
1
09
1?
18
090
12
09
22
1
12
14
13
083
04
07
72
1
10
Os
22
086
20
07
12
1
07
12
18
086
13
09
21
1
13
13
13
089
03
09
22
1
09
13
17
078
09
09
22
1
09
11
16
079
06
09
22
1
12
13
22086
n 6
08
22
1
OR
08
06
051
08
03
22
1
05
12
10
076
03
03
22
1
04
10
04
061
00
00
22
1
09
13
13
064
07
10
22
1
00
03
02
038
00
02
22
1
elw
zos
4P
MT
: AC
H. T
EST
12
34
TW
RA
T
31
35
37
52
103
56
?2
24
15
53
061
39
39
39
49
1.1.
549 26
32
19
09
31
060
39
g;19&
2(1-)
35
26
22
42
0M3
46
31
34
21
48
086
45
30
23
17
42
070
38
30
29
23
4?
082
39
20
25
17
54
062
33
31
-;C:4
1;17
188
29
31
11
39
071
46
30
30
18
47
078
40
29
29
36
61
094
42
33
34
33
54
100
I-2
32
34
33
56
099
4?
29
23
30
57
082
38
31
30
23
48
084
35
32
27
22
45
081
37
28
24
10
58
062
37
25
24
19
5q
068
36
25
31
16
51
072
45
?5
26
25
40
076
29
21
23
17
38
061
33
23
16
10
23
049
37
15
18
12
47
045
27