Embed Size (px)
Citation preview
AT-TARIQ INC. - Steffen Demos
2
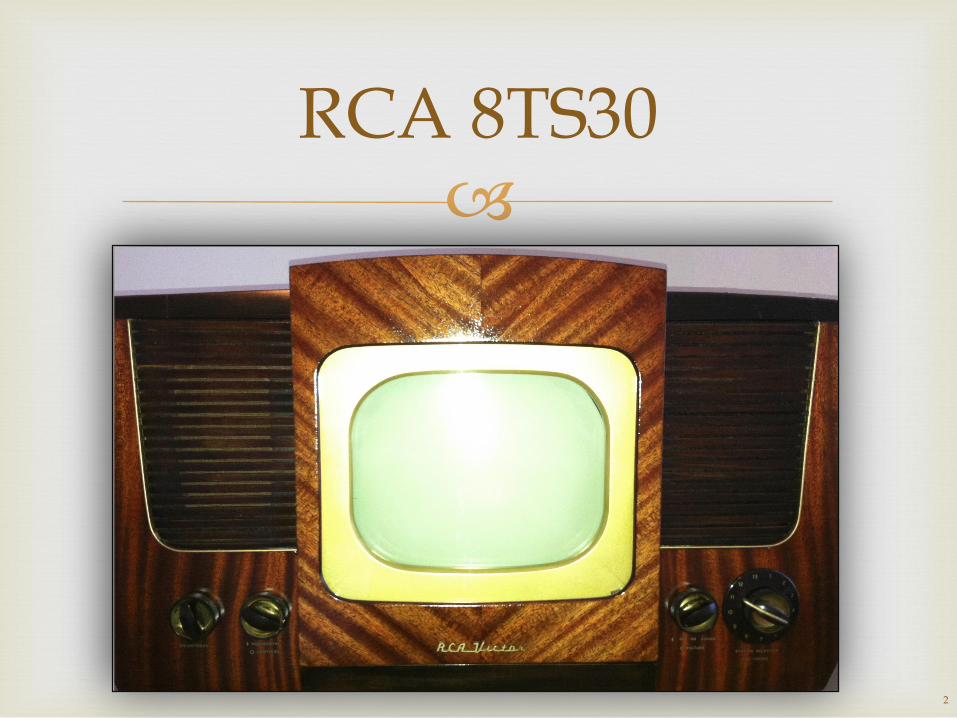
RCA 8TS30
3
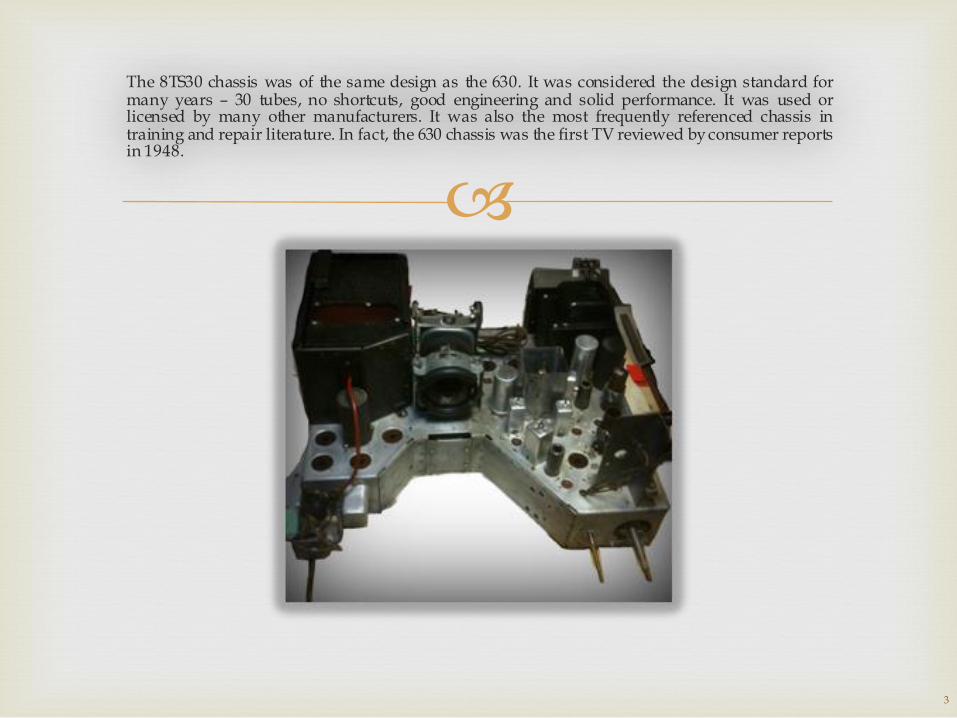
The 8TS30 chassis was of the same design as the 630. It was considered the design standard for many years – 30 tubes, no shortcuts, good engineering and solid performance. It was used or licensed by many other manufacturers. It was also the most frequently referenced chassis in training and repair literature. In fact, the 630 chassis was the first TV reviewed by consumer reports in 1948.
4
The “Split” Chassis
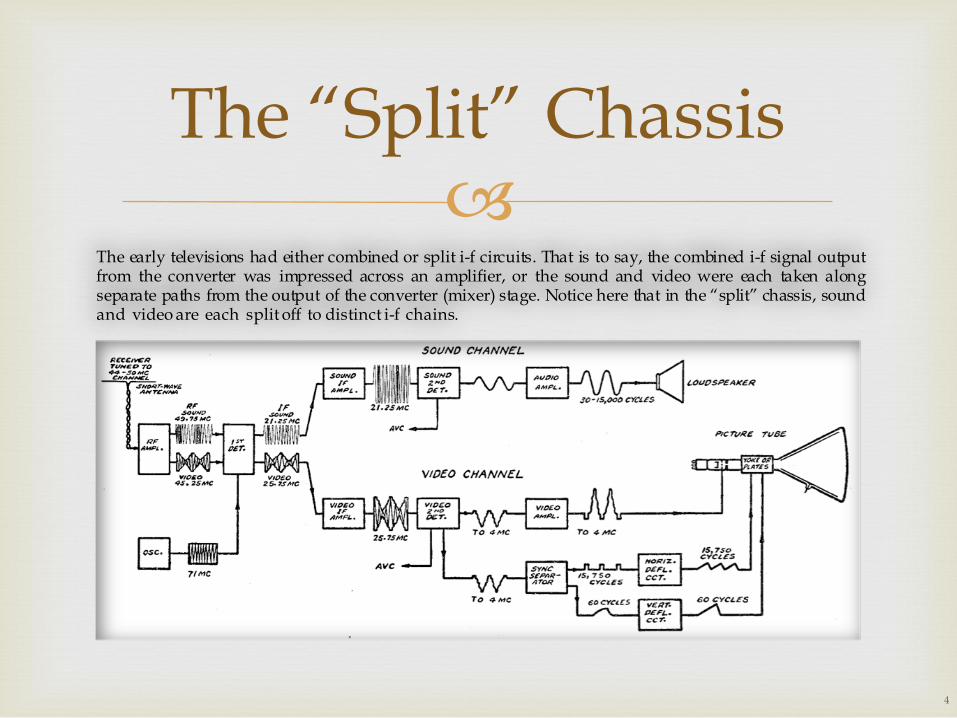
The early televisions had either combined or split i-f circuits. That is to say, the combined i-f signal output from the converter was impressed across an amplifier, or the sound and video were each taken along separate paths from the output of the converter (mixer) stage. Notice here that in the “split” chassis, sound and video are each split off to distinct i-f chains.
5
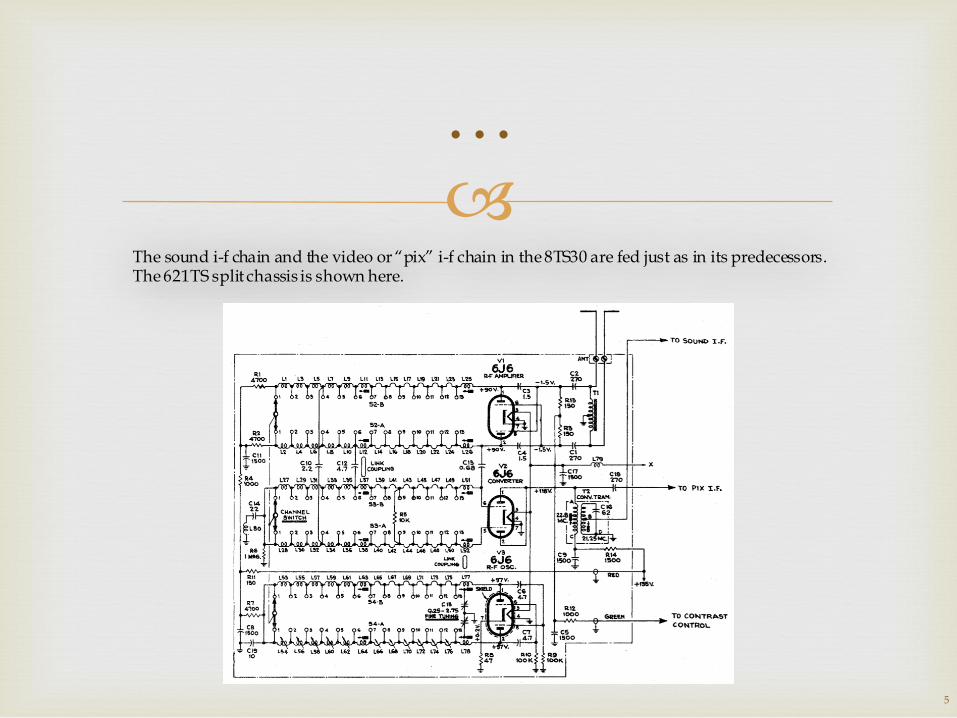
The sound i-f chain and the video or “pix” i-f chain in the 8TS30 are fed just as in its predecessors. The 621TS split chassis is shown here.
…
6
General Theory
Sound and video signals can both be received by the same antenna due to the nature of f-m and video signals. The circuits of the f-m sound section of a television receiver (i.e. i-f section, detector section) are very similar to those of regular f-m receivers.
The video modulation frequencies are reproduced in the television receiver such that they have the same relative amplitudes as when modulating the carrier at the transmitter. This is important so that the reproduced picture at the receiver takes on the same appearance as the scene at the studio.
When a high frequency carrier is modulated with a video signal, the carrier undergoes
changes in amplitude. Just as in regular AM broadcasting, the resultant modulated signal results in a center frequency component (equal in frequency to the carrier) and two sideband components (upper and lower sidebands equal to in frequency to the carrier plus and minus the modulating frequency). The relative amplitudes of the components are equal to the % modulation.
The video intelligence is actually completely vested in the sidebands with each sideband
containing the intelligence but with half the power.
Video frequencies have a much broader range than audio signals! The video frequencies vary
between 30 cycles and 4,000,000 cycles. The maximum bandwidth at 100% modulation would be approximately 8MHz without sound when each television channel is allocated only 6MHz!
If only one sideband were used, one would think that the intelligence would be intact with only a loss in power. However, in the case of a video signal, it would be extremely hard to design and implement a filter with a sharp enough cutoff to completely suppress one sideband.
Furthermore, the use of a single sideband would actually produce distortion in the output of the detector system.
The result of such an approach would be decreased signal with significant distortion and 2MHz of bandwidth wasted (6MHz allocated channel width – ½ 8MHz = 2MHz extra, discounting the small bandwidth required for the audio portion).
The “pix” stages must offer the desired gain combined with broad selectivity and an over-all flat response curve within a 6MHz bandwidth.
7
Problem Domain
The solution to the above set of problems is the use of “vestigal-sideband” (i.e. sesqui-
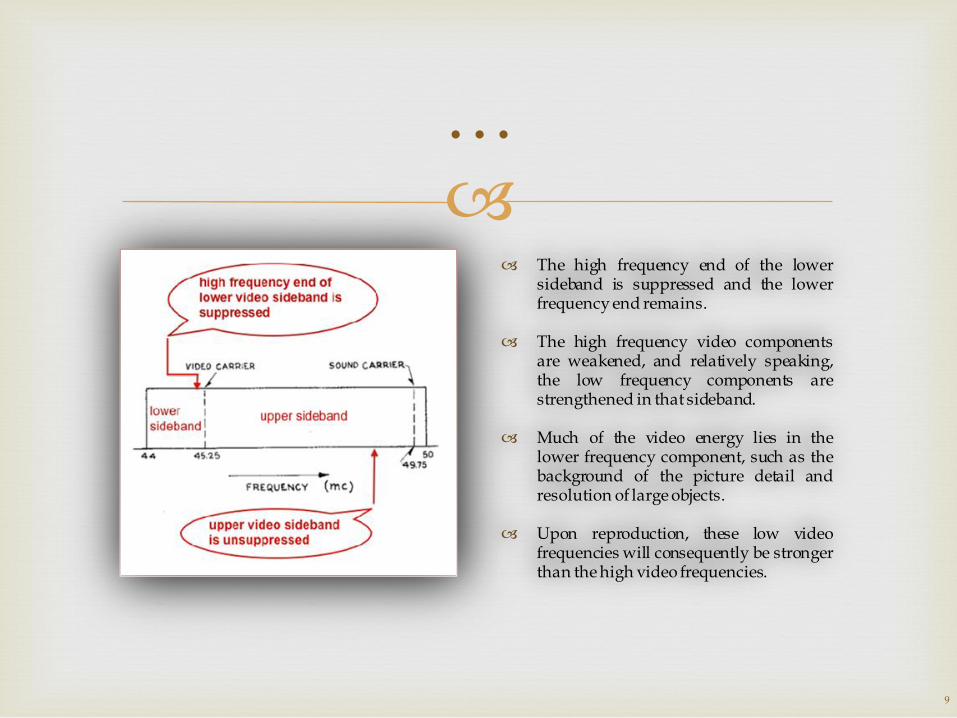
sideband” or “quasi-single-sideband”) transmission. This is the transmission of one complete sideband and part of another. Therefore, one sideband (lower) is suppressed and the other not at all, such that the transmitted video modulated signal and the 50 KHz sound FM signal occupy a space within the 6 MHz channel allocation.
However, the FCC imposes further complexity on our problem domain. According to the FCC, the sound carrier shall have a frequency 0.25 MHz lower than the upper frequency of the channel in question. It also stipulates that the video carrier shall be 4.5 MHz lower than the sound carrier frequency. This means that for channel 1 (44-50 MHz) the sound carrier frequency would be at 49.75 MHz.
Therefore, since each channel is 6 MHz wide, and we have already used 4.75 MHz of it (45.25 – 50 MHz), all that remains is 1.25 MHz at the lower end of the channel. Once again, for channel 1, this 1.25 MHz limit would be between 44 and 45.25 MHz.
8
…
9
…
The high frequency end of the lower sideband is suppressed and the lower frequency end remains.
The high frequency video components are weakened, and relatively speaking, the low frequency components are strengthened in that sideband.
Much of the video energy lies in the lower frequency component, such as the background of the picture detail and resolution of large objects.
Upon reproduction, these low video frequencies will consequently be stronger than the high video frequencies.
10
…
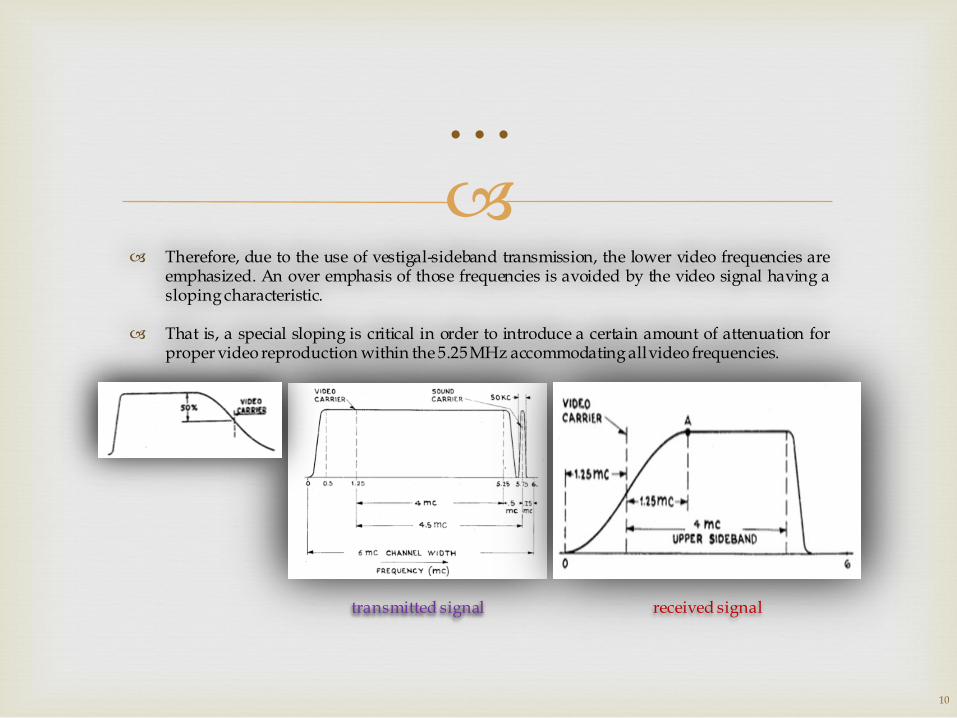
Therefore, due to the use of vestigal-sideband transmission, the lower video frequencies are emphasized. An over emphasis of those frequencies is avoided by the video signal having a sloping characteristic.
That is, a special sloping is critical in order to introduce a certain amount of attenuation for proper video reproduction within the 5.25 MHz accommodating all video frequencies.
transmitted signal received signal
11
…
The broad bandwidth and sloping are accomplished by either over coupling of stages or stagger tuned i-f stages.
The RCA 8TS30 employed stagger tuned video i-f stages to accomplish a broad bandwidth, selectivity, an over-all flat response curve and the required sloping.
Therefore, the alignment of the receiver (particularly the video i-f stages) is not simply a matter of adjusting for highest gain or peak signal voltage at any one stage. Each stage contributes to the over-all shape of the waveform, and are thus interdependent.

The alignment process requires patience and time. Furthermore, you must expect a steep
learning curve if you are not experienced with certain test equipment.
You should be sure the television is in otherwise good working order.
It is important to clean tube sockets thoroughly. You may use a wire brush and WD-40, but not steel wool.
All necessary test equipment must be in calibrated working order. (You must know how to use it effectively or you will just be chasing your tail.) It is not cheating to use non-vintage equipment on a vintage restoration project.
All cables used must be correctly terminated or results will be inconsistent.
An analog VTVM or a FET VM should be used – DVMs have oscillators that interfere with results and it is hard to track min and max voltage changes on a digital readout.
It is equally important to make your workbench, chassis placement and test equipment access as convenient as possible. Remember that cable position can affect signals and waveforms.
Prerequisites
12
It is very helpful to work with a print out of the schematic and alignment procedure. You
should not have to get up to go to a computer screen, or constantly page up and down to reference the current step. This will only lead to confusion and mistakes.
You need a pack of core alignment tools with proper blade types and widths. Never attempt to use a metal screwdriver – misalignment and damage can result!
You must completely understand the theory behind what you are doing.
Follow all instructions exactly - no shortcuts.
Don't move off one step until it is perfectly completed.
Perform the “family room” test before declaring success.
13
…
Concepts
The general idea is to send a signal into a circuit, and display the response of that circuit on the oscilloscope.
The signal is a combination of two signals – one wave sweeping between two frequencies about 1MHz apart and a sine wave at a single frequency. The single frequency sine wave serves as a “marker” frequency.
The two signals are combined in a “marker adder” circuit in the alignment equipment.
The oscilloscope will plot the spectrum of frequencies in the sweep against the amplitude of the sweeping wave (X-Y mode). It will also depict the marker as a “pip” on that sweeping wave.
For example, a signal generator sine wave of 21.25MHz is added to a sine wave that sweeps between 20.75MHz and 21.75MHz (1MHz sweep width).
The 21.25MHz sine wave appears as a “pip” on the sweep waveform. The pip on the sweep exactly marks 21.25MHz.
The primary and secondary of the 2nd sound i-f transformer T112 is adjusted so that the response wave at terminal A of T112 is peaked at the marker frequency of 21.25MHz.
14
Example
+
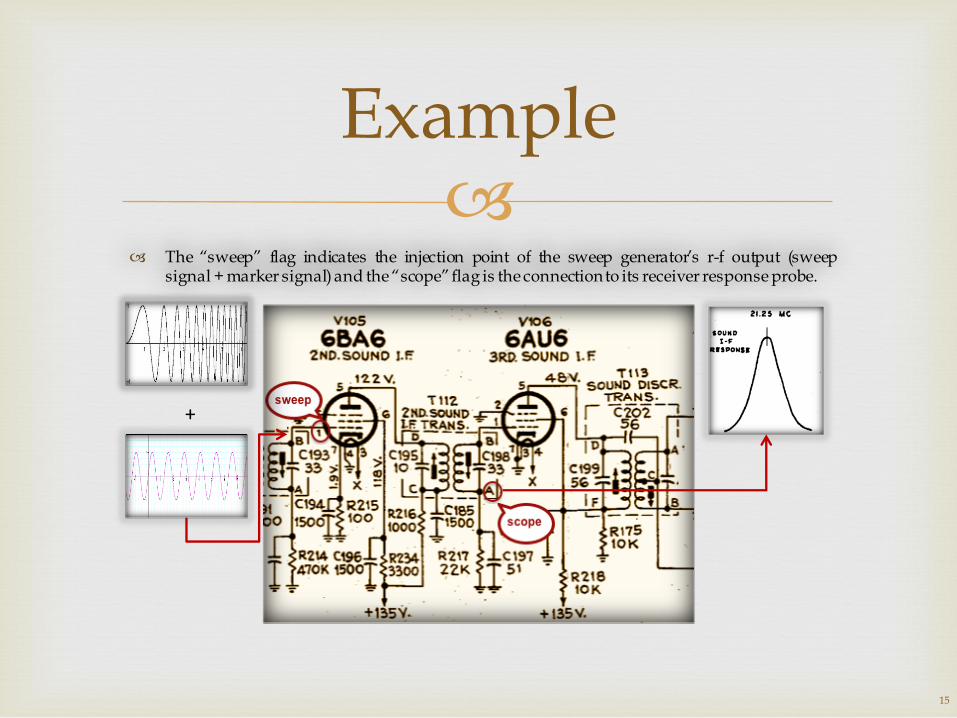
The “sweep” flag indicates the injection point of the sweep generator’s r-f output (sweep signal + marker signal) and the “scope” flag is the connection to its receiver response probe.
15
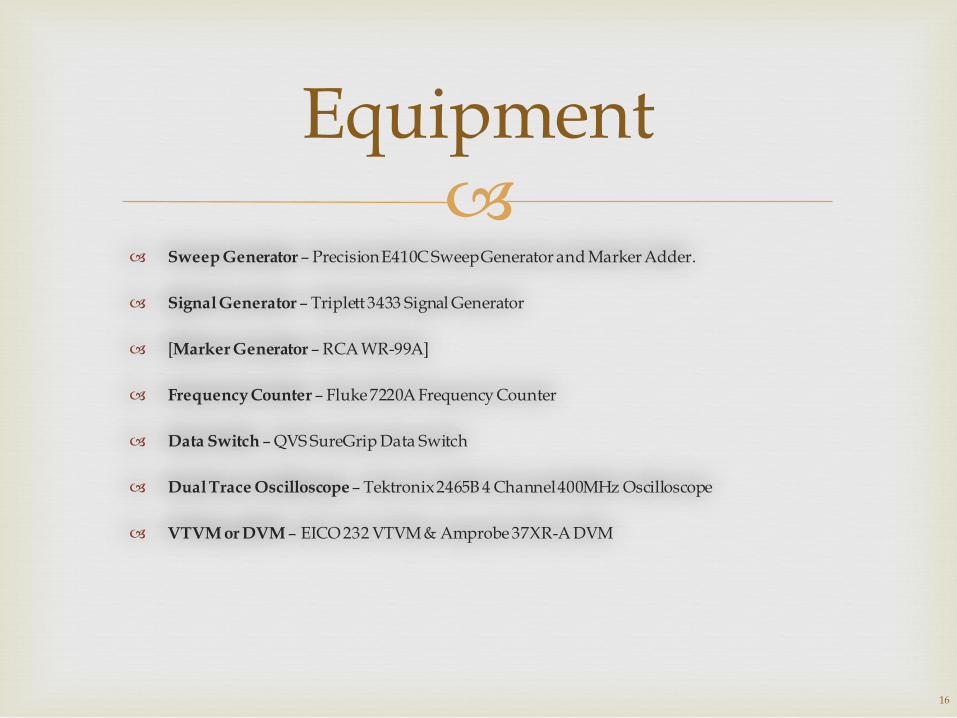
Sweep Generator – Precision E410C Sweep Generator and Marker Adder.
Signal Generator – Triplett 3433 Signal Generator
[Marker Generator – RCA WR-99A]
Frequency Counter – Fluke 7220A Frequency Counter
Data Switch – QVS SureGrip Data Switch
Dual Trace Oscilloscope – Tektronix 2465B 4 Channel 400MHz Oscilloscope
VTVM or DVM – EICO 232 VTVM & Amprobe 37XR-A DVM
Equipment
16
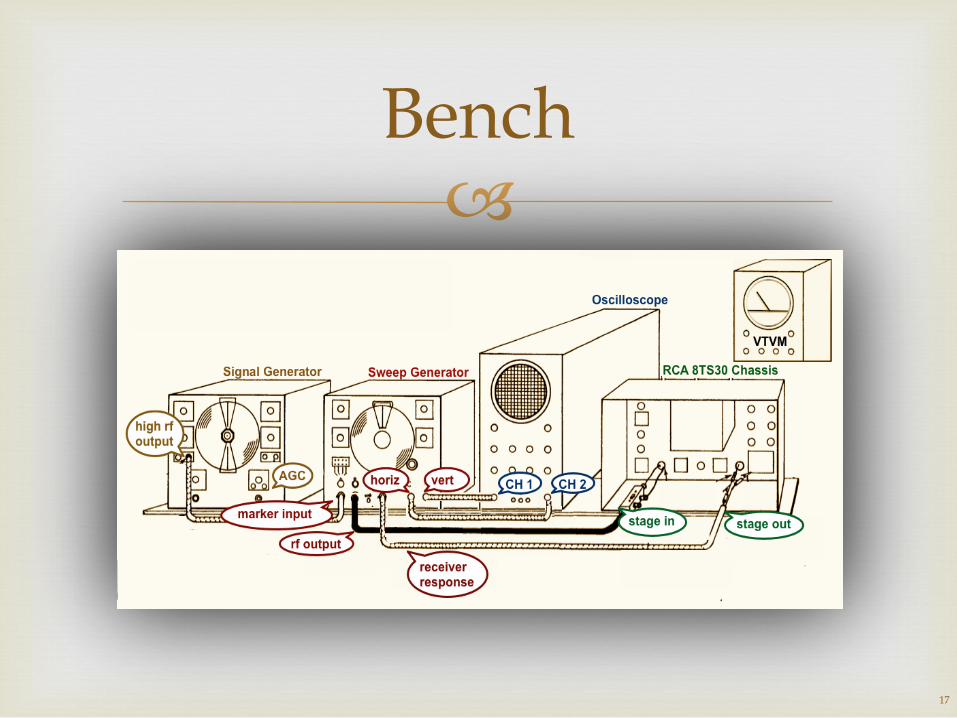
Bench
17
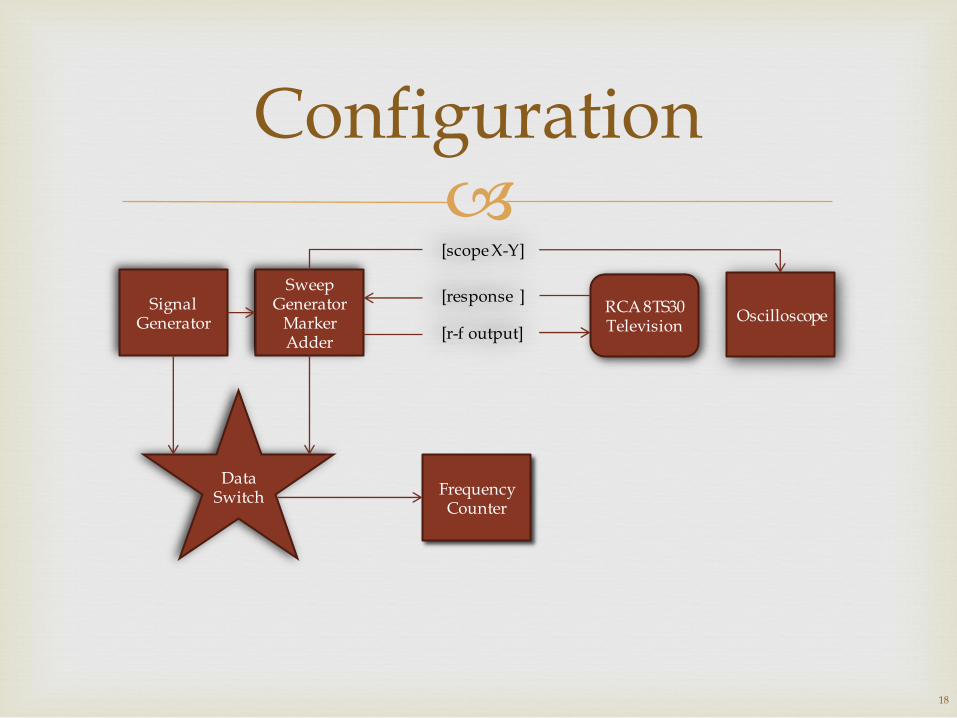
Signal Generator
Sweep Generator
Marker Adder
Frequency Counter
Oscilloscope
Data Switch
RCA 8TS30 Television [r-f output]
[response ]
[scope X-Y]
Configuration
18
Caveat
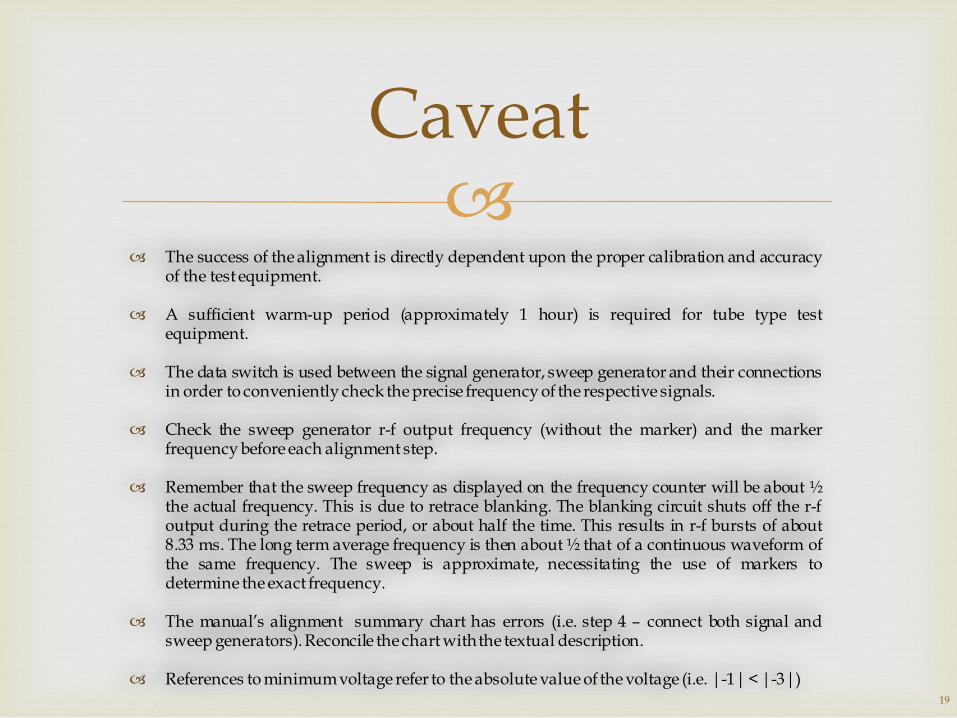
The success of the alignment is directly dependent upon the proper calibration and accuracy of the test equipment.
A sufficient warm-up period (approximately 1 hour) is required for tube type test equipment.
The data switch is used between the signal generator, sweep generator and their connections in order to conveniently check the precise frequency of the respective signals.
Check the sweep generator r-f output frequency (without the marker) and the marker frequency before each alignment step.
Remember that the sweep frequency as displayed on the frequency counter will be about ½ the actual frequency. This is due to retrace blanking. The blanking circuit shuts off the r-f output during the retrace period, or about half the time. This results in r-f bursts of about 8.33 ms. The long term average frequency is then about ½ that of a continuous waveform of the same frequency. The sweep is approximate, necessitating the use of markers to determine the exact frequency.
The manual’s alignment summary chart has errors (i.e. step 4 – connect both signal and sweep generators). Reconcile the chart with the textual description.
References to minimum voltage refer to the absolute value of the voltage (i.e. |-1| < |-3|) 19
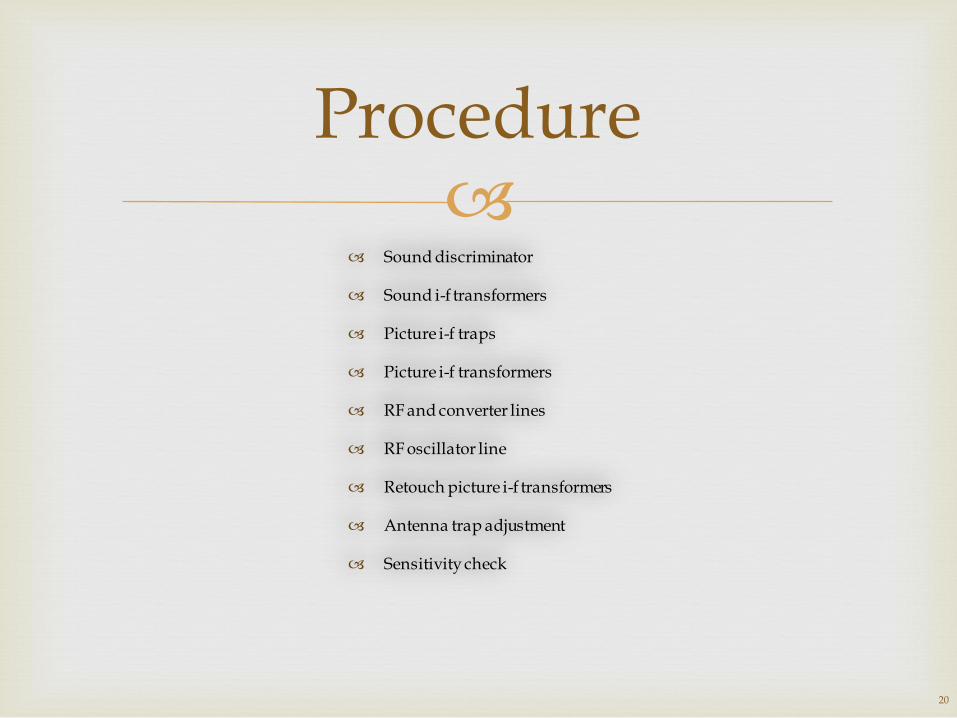
Procedure
Sound discriminator
Sound i-f transformers
Picture i-f traps
Picture i-f transformers
RF and converter lines
RF oscillator line
Retouch picture i-f transformers
Antenna trap adjustment
Sensitivity check
20
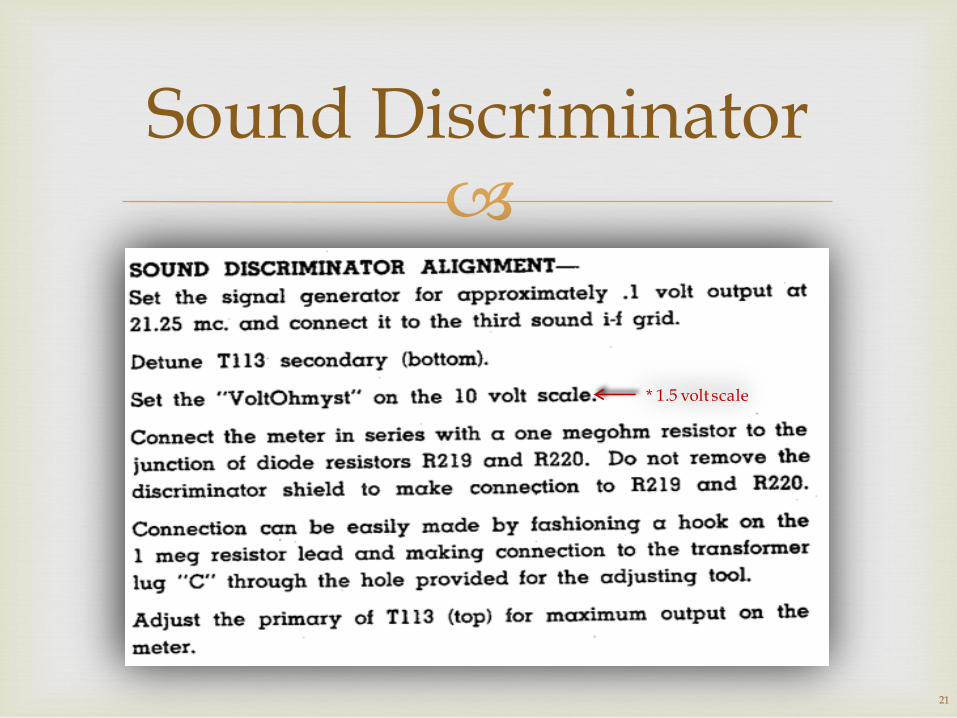
Sound Discriminator
21
* 1.5 volt scale
…
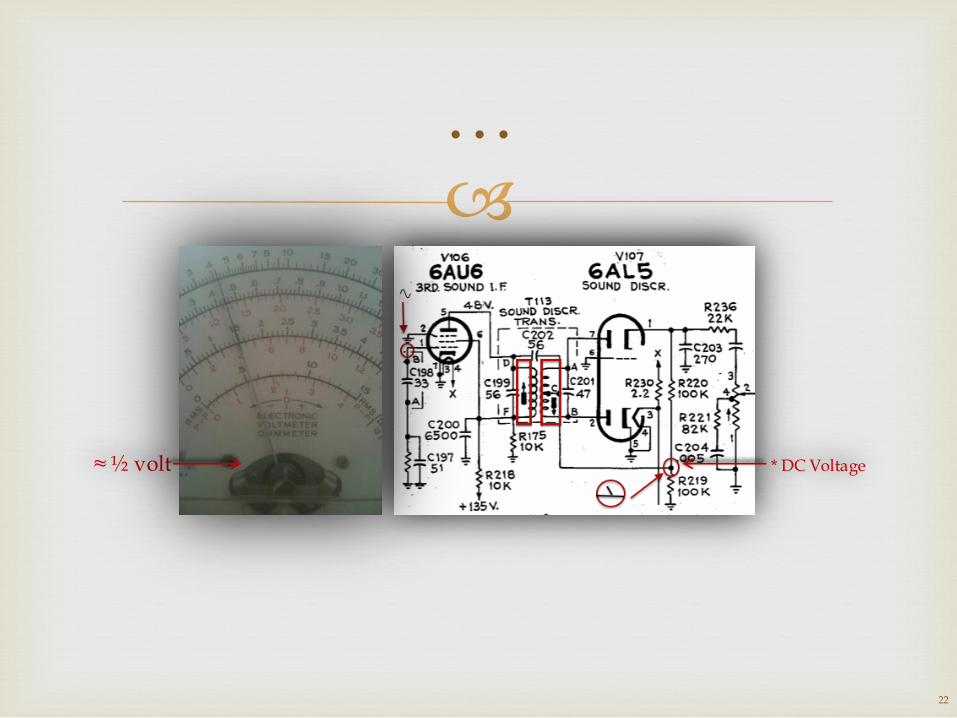
* DC Voltage ≈ ½ volt
22
…
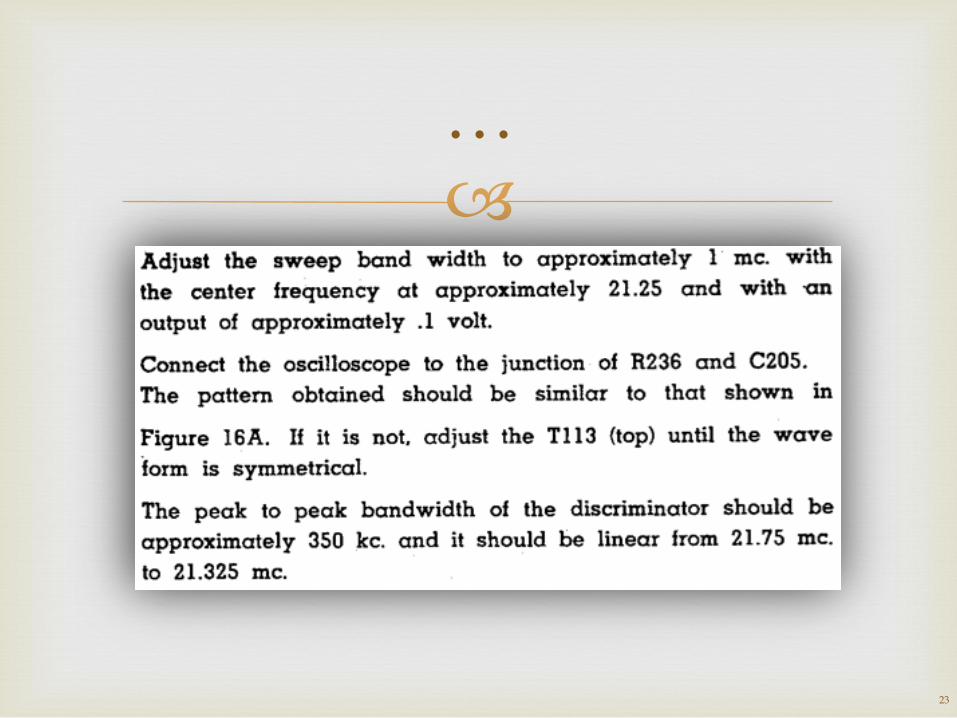
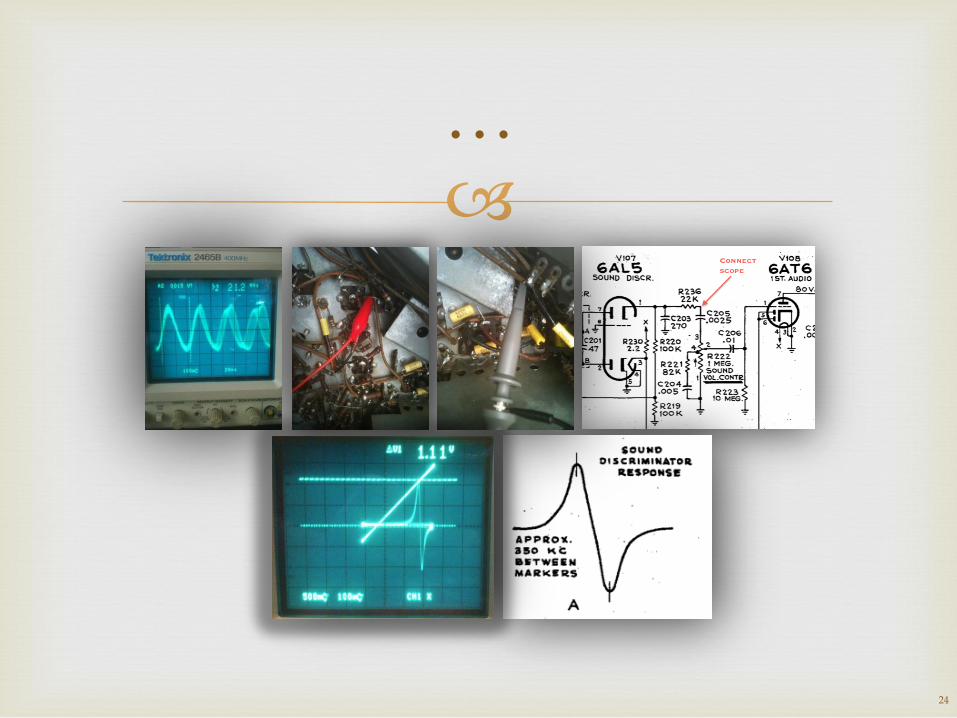
23
…
24
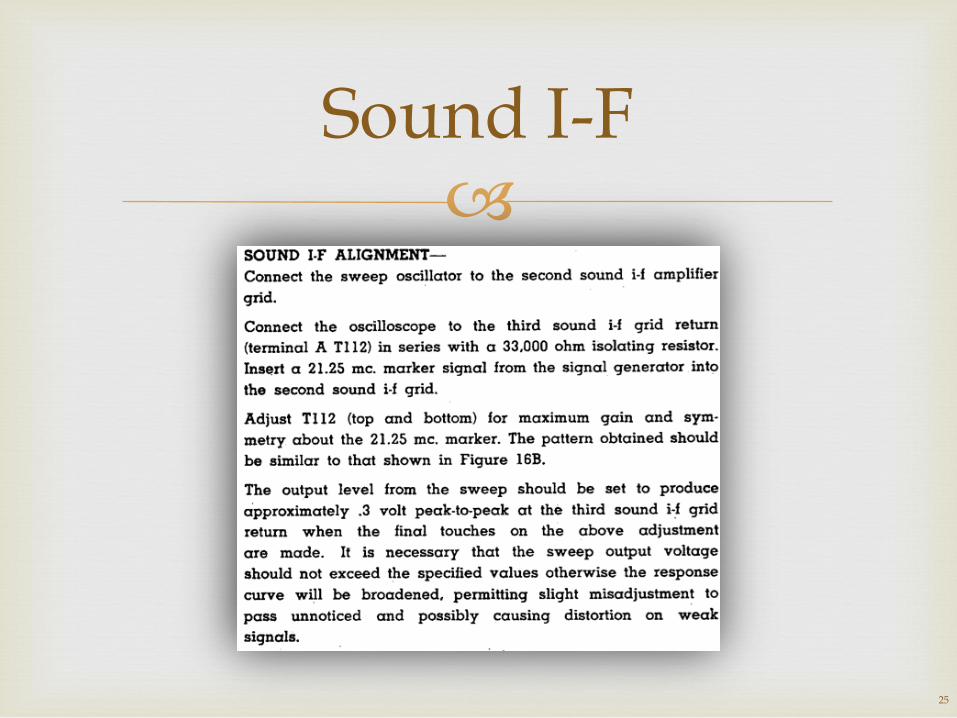
Sound I-F
25
…
26
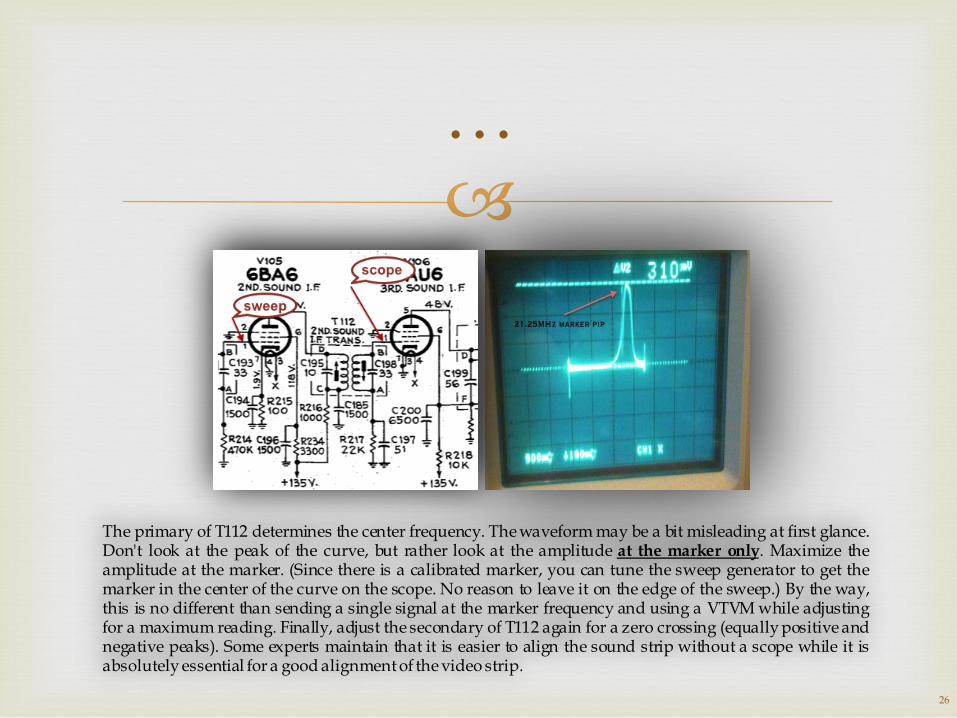
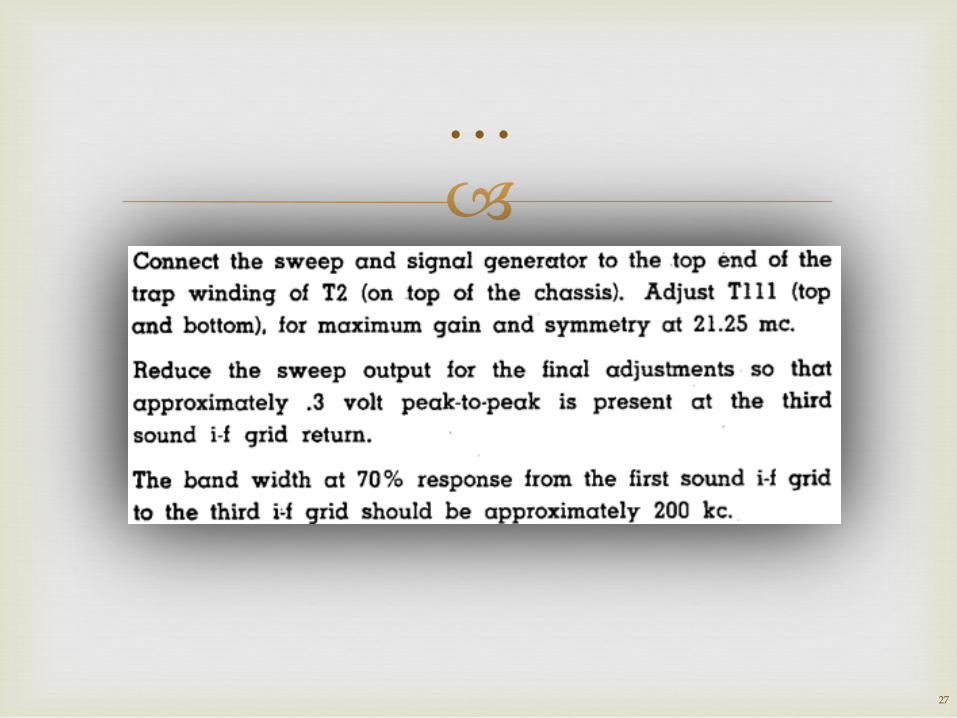
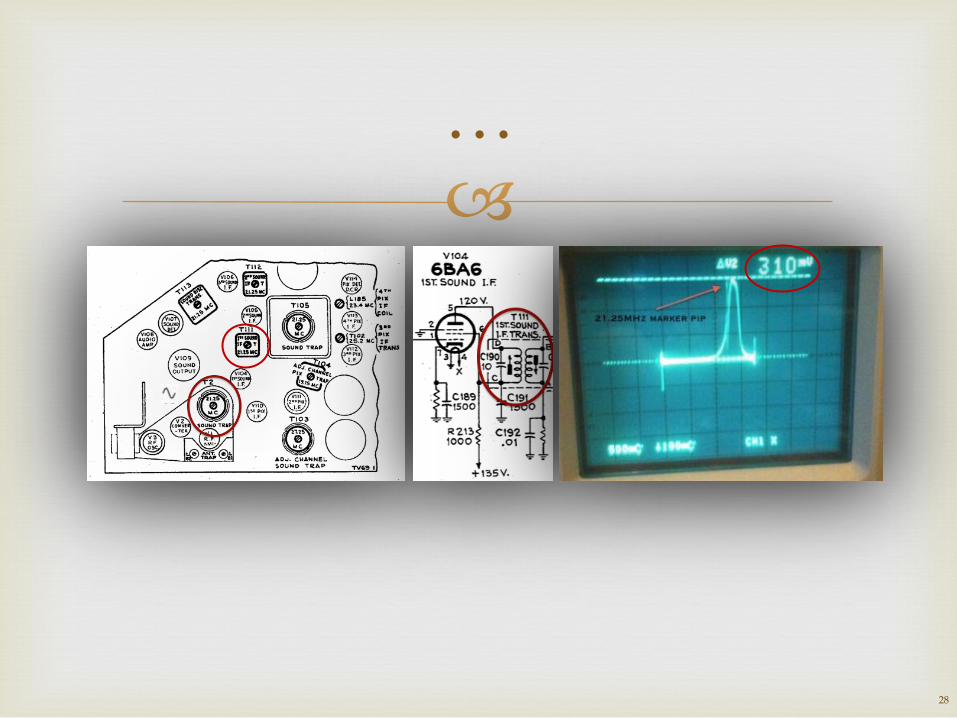
The primary of T112 determines the center frequency. The waveform may be a bit misleading at first glance. Don't look at the peak of the curve, but rather look at the amplitude at the marker only. Maximize the amplitude at the marker. (Since there is a calibrated marker, you can tune the sweep generator to get the marker in the center of the curve on the scope. No reason to leave it on the edge of the sweep.) By the way, this is no different than sending a single signal at the marker frequency and using a VTVM while adjusting for a maximum reading. Finally, adjust the secondary of T112 again for a zero crossing (equally positive and negative peaks). Some experts maintain that it is easier to align the sound strip without a scope while it is absolutely essential for a good alignment of the video strip.
…
27
…
28
Pix I-F
29
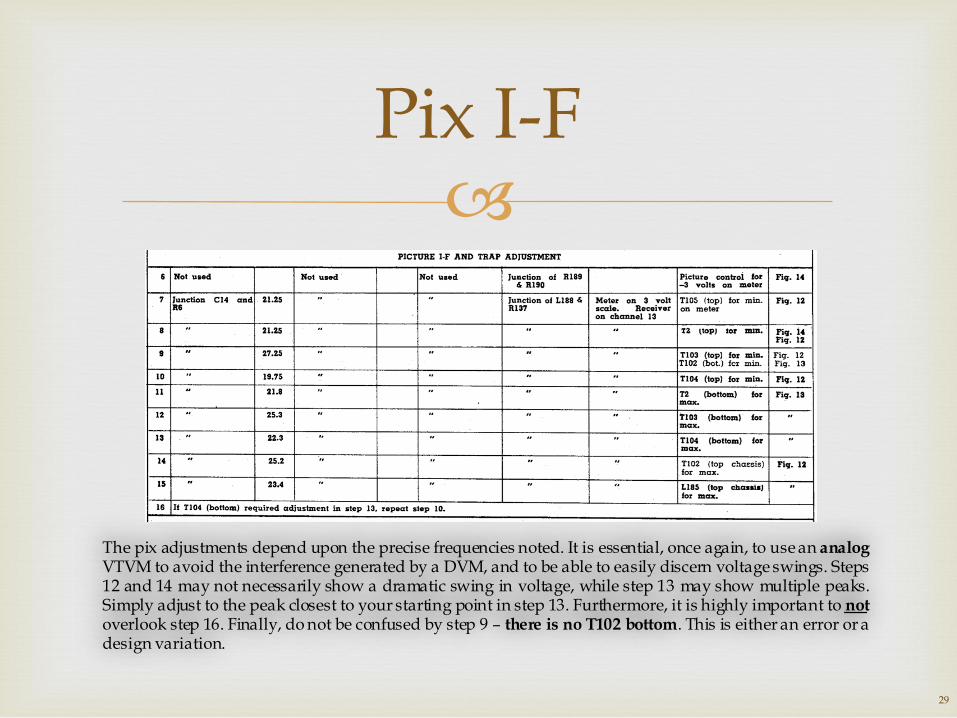
The pix adjustments depend upon the precise frequencies noted. It is essential, once again, to use an analog VTVM to avoid the interference generated by a DVM, and to be able to easily discern voltage swings. Steps 12 and 14 may not necessarily show a dramatic swing in voltage, while step 13 may show multiple peaks. Simply adjust to the peak closest to your starting point in step 13. Furthermore, it is highly important to not overlook step 16. Finally, do not be confused by step 9 – there is no T102 bottom. This is either an error or a design variation.