Embed Size (px)
Citation preview
Winter Precipitation and Snowpack-melt with Temperature and Elevationat Solang Valley, IndiaAnand Verdhen1*, Chahar BR1 and Sharma OP2
1Department of Civil Engineering, Indian Institute of Technology, New Delhi, India2Centre for Atmospheric Sciences, Indian Institute of Technology Delhi, New Delhi, India*Corresponding author: Anand Verdhen, Department of Civil Engineering, Indian Institute of Technology, Hauz Khas, New Delhi-110 016, India, Tel: +919911960776; E-mail: [email protected]
Rec date: Jan 26, 2016; Acc date: May 11, 2016; Pub date: May 18, 2016
Copyright: © 2016 Verdhen A, et al. This is an open-access article distributed under the terms of the Creative Commons Attribution License, which permits unrestricteduse, distribution, and reproduction in any medium, provided the original author and source are credited.
Abstract
Knowledge about variability of temperature, precipitation, snowpack and snowmelt with temperature andelevation are essential to prepare input data for hydrological models. The study presents characteristics andvariability of these input variables during springtime at three elevations (Bhang, Solang and Dhundi stations in theSolang Valley of the western Himalaya) with respect to mean temperature (Tm) at Bhang using weekly data within aperiod of 27 years with initial (1982 and 1983) and later (2008 and 2009) consecutive years including decadal years1993 and 2003. Methodology comprises of process integration using regression, simulation, cluster analysis,transformation, projection and inter-annual comparison. Study shows that temperature lapse rate (TLR) in stretchesbetween snow-free to snow cover area (1.2°C/100 m) is more than the TLR in stretch of continued snow cover.Temperature, snowfall, rainfall and snow depth per 100 m of rise in elevation have been estimated as -1.09°C, 31.2cm, -7.72 mm and 27.95 cm, respectively. The snowfall and rainfall mixed precipitation occurs within 0.65 and11.5°C of weekly Tm for which distribution pattern has been developed. Temperature degree-day melt factors,determined in water equivalent term, vary between 2 and 11.5 mm°C-1d-1 and it may rise up to 13 mm°C-1d-1 fornon-zero snow condition. The snow depth excess at Solang (2450 m amsl) in relation to Bhang (2190 m) hasreduced by 50% over three decades while the snow depth excess at Dhundi (2950 m) from the snow depth atBhang has increased by 15%. Furthermore, disappearance of the snow cover has been experienced earlier by 5weeks in the region.
Keywords: Temperature lapse rate; Rainfall; Snowfall; Normalisedsnowpack; Linear and cluster analysis; Snowmelt rate variability
IntroductionInvestigation of processes related to temperature, precipitation,
snowpack and snowmelt with temperature are important for snowmelthydrological modelling [1-6]. The study on end-of-winter (spring)snow cover and topographic influence are noteworthy [7]. Uncertaintyarises when input variables and parameters are desired for distributedwatershed models, while regular observation at higher altitude isdifficult [8-10]. Variability in temperature, precipitation, snow coverand melt became more significant due to urbanisation and land usechanges during last three decades [11-15]. Pepin [12] documentedcooling above 3750 m, but warming between 2500 and 3100 m since1952 in the Rocky Mountains of Colorado Front Range, whereasShekhar et al. [14] found a decrease of 280 cm in snowfall along withrise in maximum and minimum temperatures by 0.8°C and 0.6°C,respectively since 1988 in the Pir-Panjal Range. Snowmelt reduces tozero during snowfall whereas shallow snow begins to melt earlier [16].Under such condition of unavailability and uncertainty in data due tolack of observation, change in landscape and climate, it becameessential to establish relationship during the period of ablation forprojection, interpolation and reliable decision.
The altitude constitutes an important factor in the Himalayan typeclimatic regions, but lack of observational network necessitatesprojection and spatial distribution of snow and meteorological inputvariables. Monthly multiple linear regression relations and modular
modelling system (MMS) were used [17] for precipitation andtemperature distributions to each homogeneous response units (HRU)whereas Mernild [18] applied Micro-Met for projection andinterpolation of precipitation and temperature at higher elevations.Ferguson [19] used frequency distribution analysis for snow waterequivalent (SWE). More studies are required to understand the processand its variability with respect to temperature due to change in place,pattern and climatic conditions which has not been attempted andpresented adequately.
Temperature is an index to differentiate the snowfall and rainfallphase (snow/rain) and needs site specific relations [20-22]. Researchers[23,24] show drop in temperature due to presence of snow cover(fortnightly depressions of 6°C in Tmax and 5°C in Tmin) and snowfall(by 4°C from the mean winter air temperature). Therefore,temperature can be also an indicator to distinguish presence andabsence of snow cover. Furthermore, temperature based regressionanalysis was found better than one that is based on precipitation orsnow depth [25-27], but the behaviour of precipitation or snow depthwith temperature is needed to be explored. Various researchers founddifferent melt factor and needed adjustment in its seasonal and spatialvariations [28-33]. Moore and Owens used melt factor in the range of 4to 8 mm/°C /day [29]. It has been realized that temperature basedprecipitation partition, snow cover and snowmelt factors suitable to aregion and in general are important to ascertain for application inforecasting, hydrological and water resources development.
Verdhen, et al., Hydrol Current Res 2016, 7:2 DOI: 10.4172/2157-7587.1000245
Research Article Open Access
Hydrol Current ResISSN:2157-7587 HYCR, an open access journal
Volume 7 • Issue 2 • 1000245
HydrologyCurrent Research
Hyd
rolog
y: Current Research
ISSN: 2157-7587
Uncertainties in variability of variables and parameters with time,temperature and elevation under varying climatic conditions inviteattention to investigate the data deficient Himalayan watershed forrelations and processes involved in snow precipitation and meltcomponents. Therefore, the objective of this study is to determine thetemperature, precipitation and snow-depth and snowmelt factorvariability with height and weekly spring Tm at base station. To meetthis objective analysis has been performed for two higher stations(Solang and Dhundi) and a base station (Bhang). The study alsoestablishes relation for proportioning rainfall and snowfall amount.
Materials and Methods
Study region
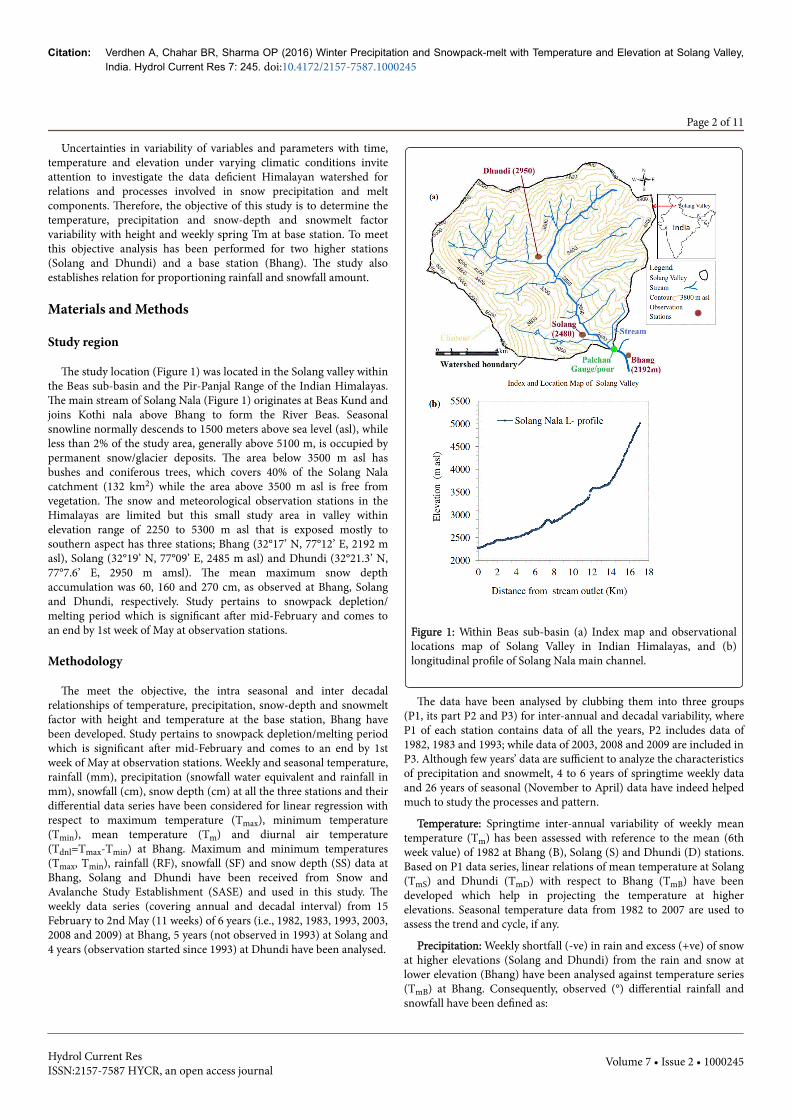
The study location (Figure 1) was located in the Solang valley withinthe Beas sub-basin and the Pir-Panjal Range of the Indian Himalayas.The main stream of Solang Nala (Figure 1) originates at Beas Kund andjoins Kothi nala above Bhang to form the River Beas. Seasonalsnowline normally descends to 1500 meters above sea level (asl), whileless than 2% of the study area, generally above 5100 m, is occupied bypermanent snow/glacier deposits. The area below 3500 m asl hasbushes and coniferous trees, which covers 40% of the Solang Nalacatchment (132 km2) while the area above 3500 m asl is free fromvegetation. The snow and meteorological observation stations in theHimalayas are limited but this small study area in valley withinelevation range of 2250 to 5300 m asl that is exposed mostly tosouthern aspect has three stations; Bhang (32°17’ N, 77°12’ E, 2192 masl), Solang (32°19’ N, 77°09’ E, 2485 m asl) and Dhundi (32°21.3’ N,77°7.6’ E, 2950 m amsl). The mean maximum snow depthaccumulation was 60, 160 and 270 cm, as observed at Bhang, Solangand Dhundi, respectively. Study pertains to snowpack depletion/melting period which is significant after mid-February and comes toan end by 1st week of May at observation stations.
Methodology
The meet the objective, the intra seasonal and inter decadalrelationships of temperature, precipitation, snow-depth and snowmeltfactor with height and temperature at the base station, Bhang havebeen developed. Study pertains to snowpack depletion/melting periodwhich is significant after mid-February and comes to an end by 1stweek of May at observation stations. Weekly and seasonal temperature,rainfall (mm), precipitation (snowfall water equivalent and rainfall inmm), snowfall (cm), snow depth (cm) at all the three stations and theirdifferential data series have been considered for linear regression withrespect to maximum temperature (Tmax), minimum temperature(Tmin), mean temperature (Tm) and diurnal air temperature(Tdnl=Tmax-Tmin) at Bhang. Maximum and minimum temperatures(Tmax, Tmin), rainfall (RF), snowfall (SF) and snow depth (SS) data atBhang, Solang and Dhundi have been received from Snow andAvalanche Study Establishment (SASE) and used in this study. Theweekly data series (covering annual and decadal interval) from 15February to 2nd May (11 weeks) of 6 years (i.e., 1982, 1983, 1993, 2003,2008 and 2009) at Bhang, 5 years (not observed in 1993) at Solang and4 years (observation started since 1993) at Dhundi have been analysed.
Figure 1: Within Beas sub-basin (a) Index map and observationallocations map of Solang Valley in Indian Himalayas, and (b)longitudinal profile of Solang Nala main channel.
The data have been analysed by clubbing them into three groups(P1, its part P2 and P3) for inter-annual and decadal variability, whereP1 of each station contains data of all the years, P2 includes data of1982, 1983 and 1993; while data of 2003, 2008 and 2009 are included inP3. Although few years’ data are sufficient to analyze the characteristicsof precipitation and snowmelt, 4 to 6 years of springtime weekly dataand 26 years of seasonal (November to April) data have indeed helpedmuch to study the processes and pattern.
Temperature: Springtime inter-annual variability of weekly meantemperature (Tm) has been assessed with reference to the mean (6thweek value) of 1982 at Bhang (B), Solang (S) and Dhundi (D) stations.Based on P1 data series, linear relations of mean temperature at Solang(TmS) and Dhundi (TmD) with respect to Bhang (TmB) have beendeveloped which help in projecting the temperature at higherelevations. Seasonal temperature data from 1982 to 2007 are used toassess the trend and cycle, if any.
Precipitation: Weekly shortfall (-ve) in rain and excess (+ve) of snowat higher elevations (Solang and Dhundi) from the rain and snow atlower elevation (Bhang) have been analysed against temperature series(TmB) at Bhang. Consequently, observed (°) differential rainfall andsnowfall have been defined as:
Citation: Verdhen A, Chahar BR, Sharma OP (2016) Winter Precipitation and Snowpack-melt with Temperature and Elevation at Solang Valley,India. Hydrol Current Res 7: 245. doi:10.4172/2157-7587.1000245
Page 2 of 11
Hydrol Current ResISSN:2157-7587 HYCR, an open access journal
Volume 7 • Issue 2 • 1000245
-ΔRF [rainfall shortfall at Solang (RF°)]=rainfall at [Solang (RF°)-Bhang (RF°)]
-ΔRF at Dhundi (RF°)=rainfall at [Dhundi (RF°)-Bhang (RF°)] (1b)
ΔSF [snowfall excess at Solang (SF°)]=snowfall [Solang (SF°)-Bhang(SF°)]
ΔSF at Dhundi (SF°)=snowfall at [Dhundi (SF°)-(SF°)] (1d)
When coefficient of determination for regression is less than 0.5, acluster based analysis has been envisaged to relate the shift ingeometric-centroids of rectangular-clusters, representing impact ofclimate variability, if any over the period of data group between P2 andP3. The shape of the cluster-geometry may depend on the distributionof data points while we preferred rectangular shape to enclose allpoints (leaving outliers) to represent mean value and displacementthrough its centroid.
Snowpack and melt: Similar to the snowfall excess (ΔSF); weeklysnow depth excess (ΔSS) has been defined:
ΔSS [snow depth excess at Solang (SS°)]=snow depth [Solang (SS°)-Bhang (SS°)] (2a)
ΔSS [snow depth excess at Dhundi (SS°)]=snow depth [Dhundi (SS°)-(SS°)] (2b)
Regressions have been performed for ΔSS of Equations (2a and 2b)and SS of each station with TmB to establish the relation for datagroups P1, P2 and P3. It helps in predicting the variables for differentstations and variability over periods based on the temperature of thebase station. The centroid of each rectangle enclosing the cluster of P1,P2 and P3 data group for ΔSF, SS and ΔSS have been identified for thedifferent stations. Local variations of precipitation and snowpack withtemperature have been quantified by quantifying the shift in position(change in distance, slope and direction) of the centroid for stationsand over period from plot P2 to P3.
The point snowmelt rates (cm or mm of SWE°C-1d-1) have beendetermined for snow depths at different elevations (SSB, SSS and SSD),stretches (SSS-B and SSD-B) and periods (P1, P2, and P3) based on theslope of regression with TmB. Furthermore, the snow depth has beennormalised with weekly Tm and diurnal range of temperature (Tdnl) tocompare the snowpack and its ablation at different stations within 11weeks of 5 different years (1983, 1993, 2003, 2008 and 2009) :
SSN(i)={SS(i) × Tm(i)/Tdnl(i)} (3)
where SSN=normalised snow depth at stations [cm]; i=weekly count[1 to 11]; SS=snow depth at Bhang, Solang or Dhundi [cm]; Tm andTdnl=mean and diurnal temperature of concerned stations [°C]. Thetemperature in Kelvin to enhances the resolution of SSN.
Projection to higher elevation: There is lack of information andobservation for higher elevation. Therefore, relations to project thevariables for the higher elevations in the Solang Valley have beenestablished. Similar to variability over period with P2 (past group) andP3 (recent group) data set, the orographic effect has been determinedusing P1 data set with reference to temperature at base station.Furthermore, the rate of projection factor (per 100 m elevation) forTm, RF, SF and SS variables have been determined with reference totheir values at Bhang:
(Y-X)/dZ=[(m-1)X+C]/dZ (4)
where Y=value at higher location; X=value at base location,dZ=difference in elevation [m asl] between locations divided by 100; mand C are the slope and intercept of the linear regression.
Study on presence of precipitation and snowpack data: Occasionally,there is absence of weekly snowfall, rainfall or snowpack during thestudy period. Analysing together with repeated zero values maymislead the result. Therefore, the whole data series containing values ofRF, SF and SS have been considered for an ideal behaviour of RF, SFand SS with the temperature. In other words it is a particular set oftemperatures for rainfall, snowfall and snow depth under which thesnowpack development and ablation takes place. Free from zero valuesof RF and SF trendlines with Tm have provided critical temperatures(for snowfall and rainfall) and weekly rainfall percent distribution withTm (different from TmB). The study has been extended to develop arelation for precipitation partition (rainfall or snowfall percent) andthe result have been compared with UBC [34] and Kienzle’s [21]approaches and field data. The free from zero weekly SS regressiontrendline with corresponding weekly Tm series has provided themaximum degree-day point-melt factor, irrespective of station orchange in elevation.
Results and Discussion
The key results from the analysis of temperature, precipitation(rainfall and snowfall), snow depth and snowmelt variability at basestation Bhang and at higher stations (Solang and Dhundi) withreference to temperature and other variables at Bhang are presentedand discussed below. Estimation of precipitation partition and changesin variables of data group P2 and P3 over years is also presented.
Temperature
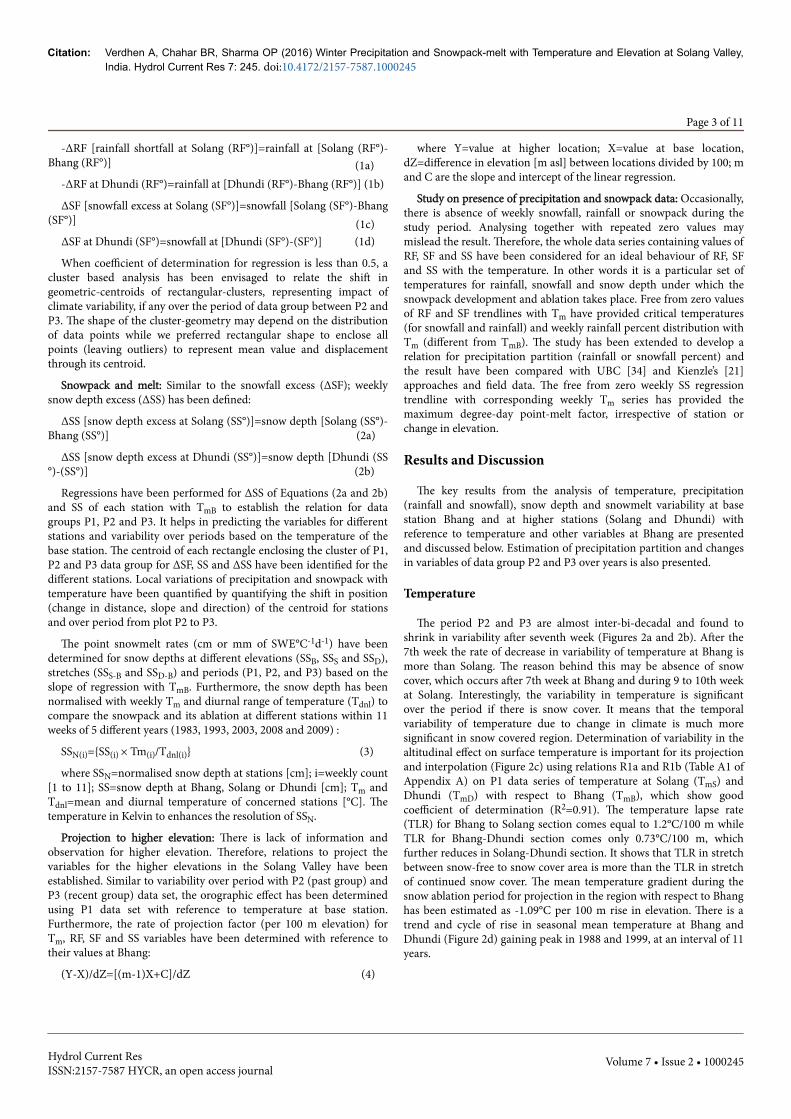
The period P2 and P3 are almost inter-bi-decadal and found toshrink in variability after seventh week (Figures 2a and 2b). After the7th week the rate of decrease in variability of temperature at Bhang ismore than Solang. The reason behind this may be absence of snowcover, which occurs after 7th week at Bhang and during 9 to 10th weekat Solang. Interestingly, the variability in temperature is significantover the period if there is snow cover. It means that the temporalvariability of temperature due to change in climate is much moresignificant in snow covered region. Determination of variability in thealtitudinal effect on surface temperature is important for its projectionand interpolation (Figure 2c) using relations R1a and R1b (Table A1 ofAppendix A) on P1 data series of temperature at Solang (TmS) andDhundi (TmD) with respect to Bhang (TmB), which show goodcoefficient of determination (R2=0.91). The temperature lapse rate(TLR) for Bhang to Solang section comes equal to 1.2°C/100 m whileTLR for Bhang-Dhundi section comes only 0.73°C/100 m, whichfurther reduces in Solang-Dhundi section. It shows that TLR in stretchbetween snow-free to snow cover area is more than the TLR in stretchof continued snow cover. The mean temperature gradient during thesnow ablation period for projection in the region with respect to Bhanghas been estimated as -1.09°C per 100 m rise in elevation. There is atrend and cycle of rise in seasonal mean temperature at Bhang andDhundi (Figure 2d) gaining peak in 1988 and 1999, at an interval of 11years.
Citation: Verdhen A, Chahar BR, Sharma OP (2016) Winter Precipitation and Snowpack-melt with Temperature and Elevation at Solang Valley,India. Hydrol Current Res 7: 245. doi:10.4172/2157-7587.1000245
Page 3 of 11
Hydrol Current ResISSN:2157-7587 HYCR, an open access journal
Volume 7 • Issue 2 • 1000245
(1a)
(1c)
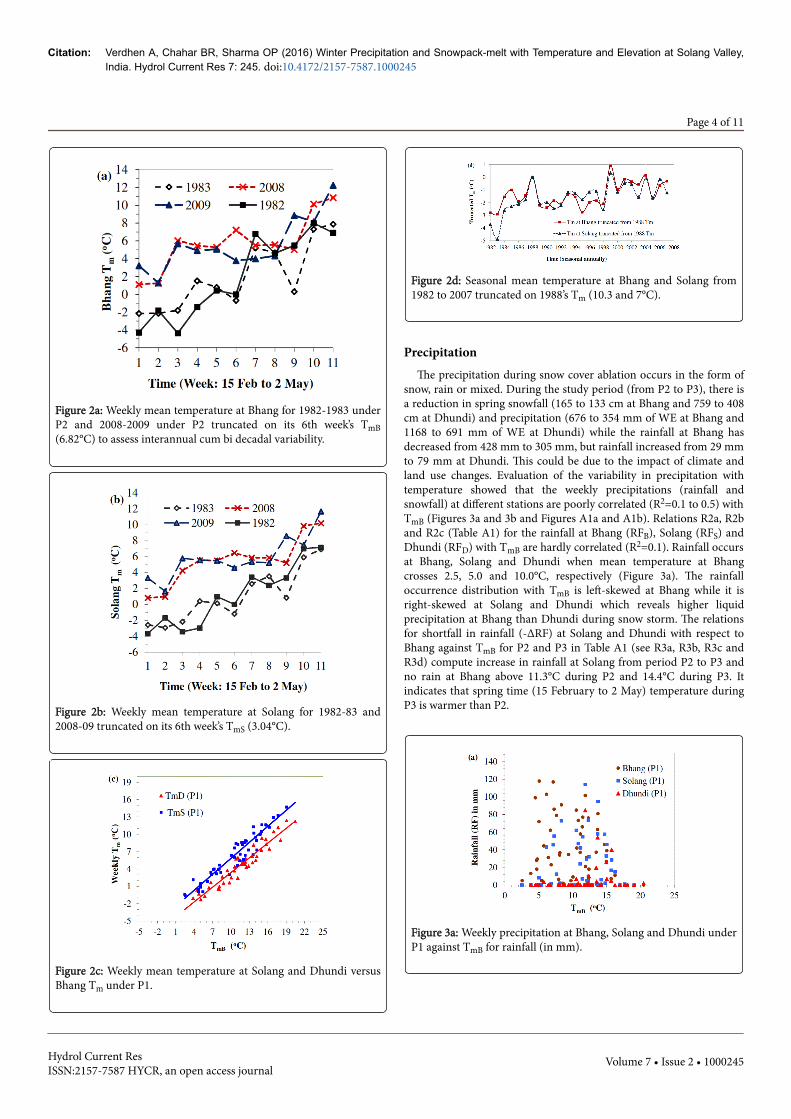
Figure 2a: Weekly mean temperature at Bhang for 1982-1983 underP2 and 2008-2009 under P2 truncated on its 6th week’s TmB(6.82°C) to assess interannual cum bi decadal variability.
Figure 2b: Weekly mean temperature at Solang for 1982-83 and2008-09 truncated on its 6th week’s TmS (3.04°C).
Figure 2c: Weekly mean temperature at Solang and Dhundi versusBhang Tm under P1.
Figure 2d: Seasonal mean temperature at Bhang and Solang from1982 to 2007 truncated on 1988’s Tm (10.3 and 7°C).
PrecipitationThe precipitation during snow cover ablation occurs in the form of
snow, rain or mixed. During the study period (from P2 to P3), there isa reduction in spring snowfall (165 to 133 cm at Bhang and 759 to 408cm at Dhundi) and precipitation (676 to 354 mm of WE at Bhang and1168 to 691 mm of WE at Dhundi) while the rainfall at Bhang hasdecreased from 428 mm to 305 mm, but rainfall increased from 29 mmto 79 mm at Dhundi. This could be due to the impact of climate andland use changes. Evaluation of the variability in precipitation withtemperature showed that the weekly precipitations (rainfall andsnowfall) at different stations are poorly correlated (R2=0.1 to 0.5) withTmB (Figures 3a and 3b and Figures A1a and A1b). Relations R2a, R2band R2c (Table A1) for the rainfall at Bhang (RFB), Solang (RFS) andDhundi (RFD) with TmB are hardly correlated (R2=0.1). Rainfall occursat Bhang, Solang and Dhundi when mean temperature at Bhangcrosses 2.5, 5.0 and 10.0°C, respectively (Figure 3a). The rainfalloccurrence distribution with TmB is left-skewed at Bhang while it isright-skewed at Solang and Dhundi which reveals higher liquidprecipitation at Bhang than Dhundi during snow storm. The relationsfor shortfall in rainfall (-ΔRF) at Solang and Dhundi with respect toBhang against TmB for P2 and P3 in Table A1 (see R3a, R3b, R3c andR3d) compute increase in rainfall at Solang from period P2 to P3 andno rain at Bhang above 11.3°C during P2 and 14.4°C during P3. Itindicates that spring time (15 February to 2 May) temperature duringP3 is warmer than P2.
Figure 3a: Weekly precipitation at Bhang, Solang and Dhundi underP1 against TmB for rainfall (in mm).
Citation: Verdhen A, Chahar BR, Sharma OP (2016) Winter Precipitation and Snowpack-melt with Temperature and Elevation at Solang Valley,India. Hydrol Current Res 7: 245. doi:10.4172/2157-7587.1000245
Page 4 of 11
Hydrol Current ResISSN:2157-7587 HYCR, an open access journal
Volume 7 • Issue 2 • 1000245
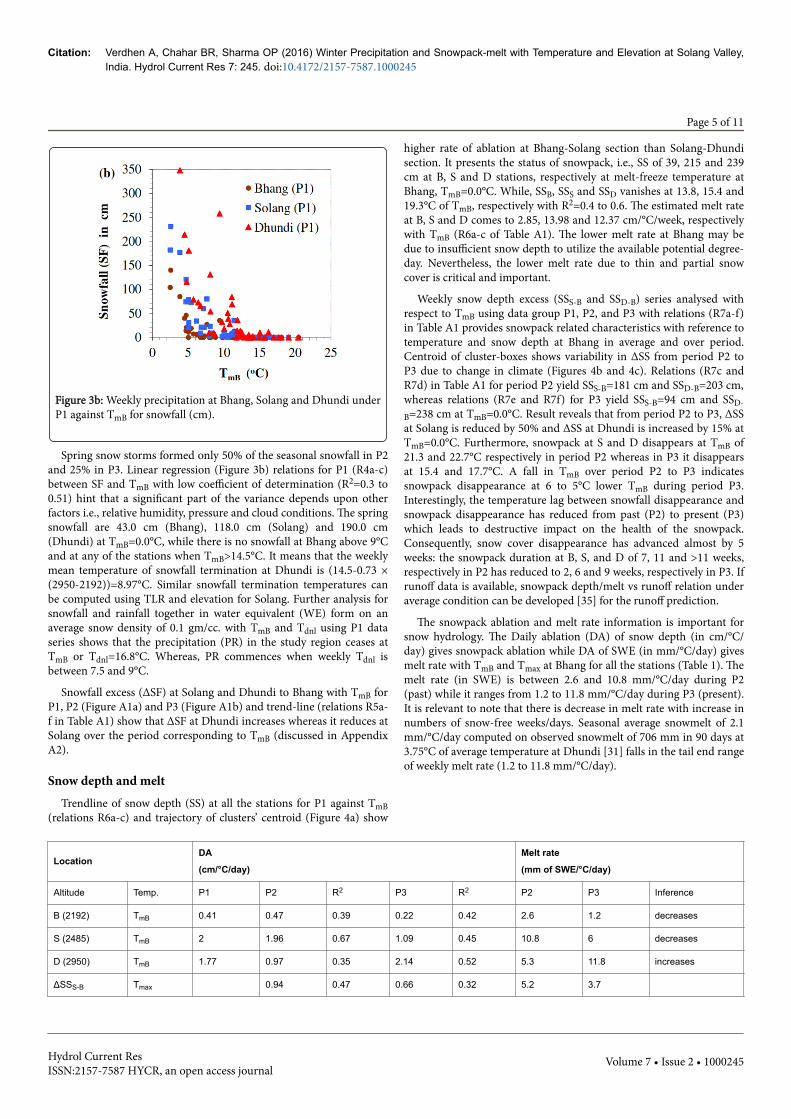
Figure 3b: Weekly precipitation at Bhang, Solang and Dhundi underP1 against TmB for snowfall (cm).
Spring snow storms formed only 50% of the seasonal snowfall in P2and 25% in P3. Linear regression (Figure 3b) relations for P1 (R4a-c)between SF and TmB with low coefficient of determination (R2=0.3 to0.51) hint that a significant part of the variance depends upon otherfactors i.e., relative humidity, pressure and cloud conditions. The springsnowfall are 43.0 cm (Bhang), 118.0 cm (Solang) and 190.0 cm(Dhundi) at TmB=0.0°C, while there is no snowfall at Bhang above 9°Cand at any of the stations when TmB>14.5°C. It means that the weeklymean temperature of snowfall termination at Dhundi is (14.5-0.73 ×(2950-2192))=8.97°C. Similar snowfall termination temperatures canbe computed using TLR and elevation for Solang. Further analysis forsnowfall and rainfall together in water equivalent (WE) form on anaverage snow density of 0.1 gm/cc. with TmB and Tdnl using P1 dataseries shows that the precipitation (PR) in the study region ceases atTmB or Tdnl=16.8°C. Whereas, PR commences when weekly Tdnl isbetween 7.5 and 9°C.
Snowfall excess (ΔSF) at Solang and Dhundi to Bhang with TmB forP1, P2 (Figure A1a) and P3 (Figure A1b) and trend-line (relations R5a-f in Table A1) show that ΔSF at Dhundi increases whereas it reduces atSolang over the period corresponding to TmB (discussed in AppendixA2).
Snow depth and meltTrendline of snow depth (SS) at all the stations for P1 against TmB
(relations R6a-c) and trajectory of clusters’ centroid (Figure 4a) show
higher rate of ablation at Bhang-Solang section than Solang-Dhundisection. It presents the status of snowpack, i.e., SS of 39, 215 and 239cm at B, S and D stations, respectively at melt-freeze temperature atBhang, TmB=0.0°C. While, SSB, SSS and SSD vanishes at 13.8, 15.4 and19.3°C of TmB, respectively with R2=0.4 to 0.6. The estimated melt rateat B, S and D comes to 2.85, 13.98 and 12.37 cm/°C/week, respectivelywith TmB (R6a-c of Table A1). The lower melt rate at Bhang may bedue to insufficient snow depth to utilize the available potential degree-day. Nevertheless, the lower melt rate due to thin and partial snowcover is critical and important.
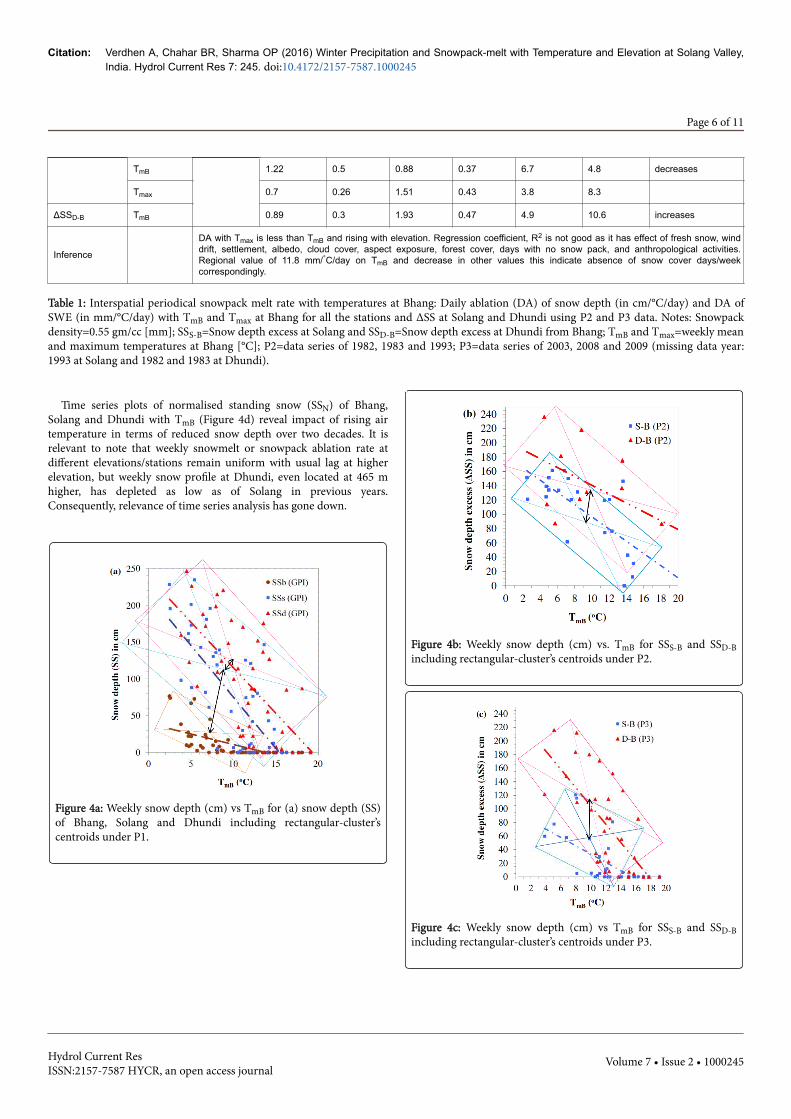
Weekly snow depth excess (SSS-B and SSD-B) series analysed withrespect to TmB using data group P1, P2, and P3 with relations (R7a-f)in Table A1 provides snowpack related characteristics with reference totemperature and snow depth at Bhang in average and over period.Centroid of cluster-boxes shows variability in ΔSS from period P2 toP3 due to change in climate (Figures 4b and 4c). Relations (R7c andR7d) in Table A1 for period P2 yield SSS-B=181 cm and SSD-B=203 cm,whereas relations (R7e and R7f) for P3 yield SSS-B=94 cm and SSD-B=238 cm at TmB=0.0°C. Result reveals that from period P2 to P3, ΔSSat Solang is reduced by 50% and ΔSS at Dhundi is increased by 15% atTmB=0.0°C. Furthermore, snowpack at S and D disappears at TmB of21.3 and 22.7°C respectively in period P2 whereas in P3 it disappearsat 15.4 and 17.7°C. A fall in TmB over period P2 to P3 indicatessnowpack disappearance at 6 to 5°C lower TmB during period P3.Interestingly, the temperature lag between snowfall disappearance andsnowpack disappearance has reduced from past (P2) to present (P3)which leads to destructive impact on the health of the snowpack.Consequently, snow cover disappearance has advanced almost by 5weeks: the snowpack duration at B, S, and D of 7, 11 and >11 weeks,respectively in P2 has reduced to 2, 6 and 9 weeks, respectively in P3. Ifrunoff data is available, snowpack depth/melt vs runoff relation underaverage condition can be developed [35] for the runoff prediction.
The snowpack ablation and melt rate information is important forsnow hydrology. The Daily ablation (DA) of snow depth (in cm/°C/day) gives snowpack ablation while DA of SWE (in mm/°C/day) givesmelt rate with TmB and Tmax at Bhang for all the stations (Table 1). Themelt rate (in SWE) is between 2.6 and 10.8 mm/°C/day during P2(past) while it ranges from 1.2 to 11.8 mm/°C/day during P3 (present).It is relevant to note that there is decrease in melt rate with increase innumbers of snow-free weeks/days. Seasonal average snowmelt of 2.1mm/°C/day computed on observed snowmelt of 706 mm in 90 days at3.75°C of average temperature at Dhundi [31] falls in the tail end rangeof weekly melt rate (1.2 to 11.8 mm/°C/day).
LocationDA
(cm/°C/day)
Melt rate
(mm of SWE/°C/day)
Altitude Temp. P1 P2 R2 P3 R2 P2 P3 Inference
B (2192) TmB 0.41 0.47 0.39 0.22 0.42 2.6 1.2 decreases
S (2485) TmB 2 1.96 0.67 1.09 0.45 10.8 6 decreases
D (2950) TmB 1.77 0.97 0.35 2.14 0.52 5.3 11.8 increases
ΔSSS-B Tmax 0.94 0.47 0.66 0.32 5.2 3.7
Citation: Verdhen A, Chahar BR, Sharma OP (2016) Winter Precipitation and Snowpack-melt with Temperature and Elevation at Solang Valley,India. Hydrol Current Res 7: 245. doi:10.4172/2157-7587.1000245
Page 5 of 11
Hydrol Current ResISSN:2157-7587 HYCR, an open access journal
Volume 7 • Issue 2 • 1000245
TmB 1.22 0.5 0.88 0.37 6.7 4.8 decreases
Tmax 0.7 0.26 1.51 0.43 3.8 8.3
ΔSSD-B TmB 0.89 0.3 1.93 0.47 4.9 10.6 increases
Inference
DA with Tmax is less than TmB and rising with elevation. Regression coefficient, R2 is not good as it has effect of fresh snow, winddrift, settlement, albedo, cloud cover, aspect exposure, forest cover, days with no snow pack, and anthropological activities.Regional value of 11.8 mm/°C/day on TmB and decrease in other values this indicate absence of snow cover days/weekcorrespondingly.
Table 1: Interspatial periodical snowpack melt rate with temperatures at Bhang: Daily ablation (DA) of snow depth (in cm/°C/day) and DA ofSWE (in mm/°C/day) with TmB and Tmax at Bhang for all the stations and ΔSS at Solang and Dhundi using P2 and P3 data. Notes: Snowpackdensity=0.55 gm/cc [mm]; SSS-B=Snow depth excess at Solang and SSD-B=Snow depth excess at Dhundi from Bhang; TmB and Tmax=weekly meanand maximum temperatures at Bhang [°C]; P2=data series of 1982, 1983 and 1993; P3=data series of 2003, 2008 and 2009 (missing data year:1993 at Solang and 1982 and 1983 at Dhundi).
Time series plots of normalised standing snow (SSN) of Bhang,Solang and Dhundi with TmB (Figure 4d) reveal impact of rising airtemperature in terms of reduced snow depth over two decades. It isrelevant to note that weekly snowmelt or snowpack ablation rate atdifferent elevations/stations remain uniform with usual lag at higherelevation, but weekly snow profile at Dhundi, even located at 465 mhigher, has depleted as low as of Solang in previous years.Consequently, relevance of time series analysis has gone down.
Figure 4a: Weekly snow depth (cm) vs TmB for (a) snow depth (SS)of Bhang, Solang and Dhundi including rectangular-cluster’scentroids under P1.
Figure 4b: Weekly snow depth (cm) vs. TmB for SSS-B and SSD-Bincluding rectangular-cluster’s centroids under P2.
Figure 4c: Weekly snow depth (cm) vs TmB for SSS-B and SSD-Bincluding rectangular-cluster’s centroids under P3.
Citation: Verdhen A, Chahar BR, Sharma OP (2016) Winter Precipitation and Snowpack-melt with Temperature and Elevation at Solang Valley,India. Hydrol Current Res 7: 245. doi:10.4172/2157-7587.1000245
Page 6 of 11
Hydrol Current ResISSN:2157-7587 HYCR, an open access journal
Volume 7 • Issue 2 • 1000245
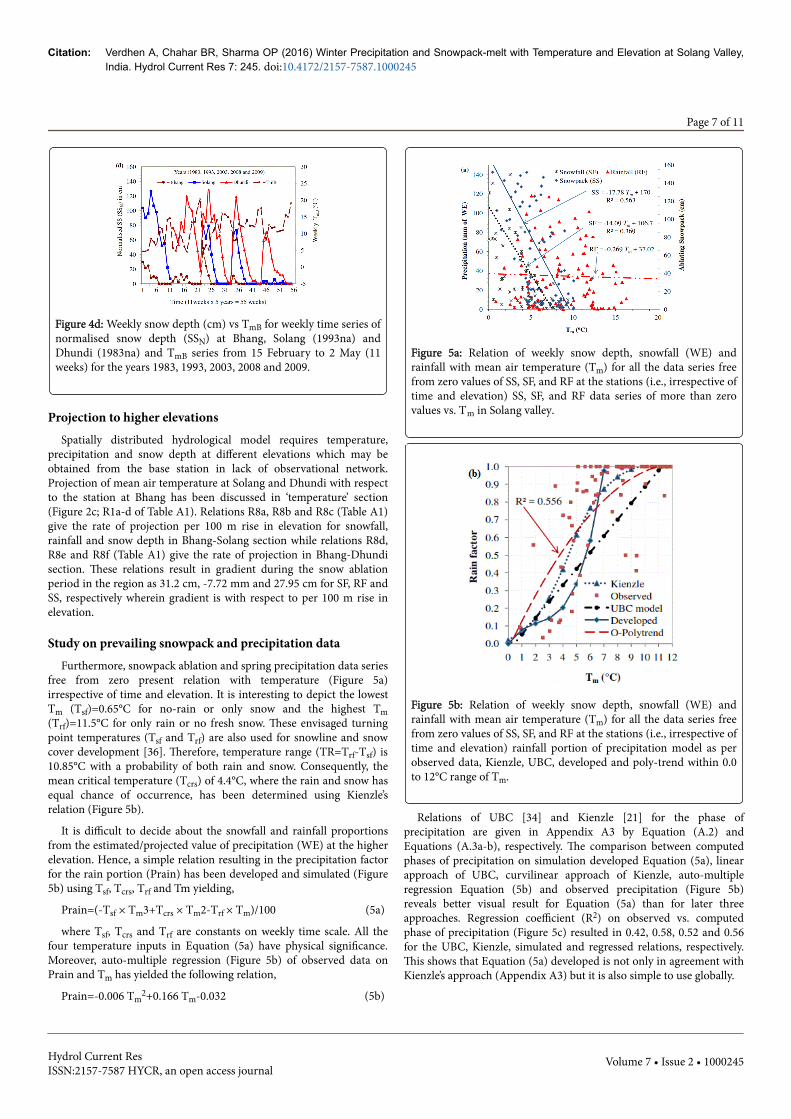
Figure 4d: Weekly snow depth (cm) vs TmB for weekly time series ofnormalised snow depth (SSN) at Bhang, Solang (1993na) andDhundi (1983na) and TmB series from 15 February to 2 May (11weeks) for the years 1983, 1993, 2003, 2008 and 2009.
Projection to higher elevationsSpatially distributed hydrological model requires temperature,
precipitation and snow depth at different elevations which may beobtained from the base station in lack of observational network.Projection of mean air temperature at Solang and Dhundi with respectto the station at Bhang has been discussed in ‘temperature’ section(Figure 2c; R1a-d of Table A1). Relations R8a, R8b and R8c (Table A1)give the rate of projection per 100 m rise in elevation for snowfall,rainfall and snow depth in Bhang-Solang section while relations R8d,R8e and R8f (Table A1) give the rate of projection in Bhang-Dhundisection. These relations result in gradient during the snow ablationperiod in the region as 31.2 cm, -7.72 mm and 27.95 cm for SF, RF andSS, respectively wherein gradient is with respect to per 100 m rise inelevation.
Study on prevailing snowpack and precipitation dataFurthermore, snowpack ablation and spring precipitation data series
free from zero present relation with temperature (Figure 5a)irrespective of time and elevation. It is interesting to depict the lowestTm (Tsf)=0.65°C for no-rain or only snow and the highest Tm(Trf)=11.5°C for only rain or no fresh snow. These envisaged turningpoint temperatures (Tsf and Trf) are also used for snowline and snowcover development [36]. Therefore, temperature range (TR=Trf-Tsf) is10.85°C with a probability of both rain and snow. Consequently, themean critical temperature (Tcrs) of 4.4°C, where the rain and snow hasequal chance of occurrence, has been determined using Kienzle’srelation (Figure 5b).
It is difficult to decide about the snowfall and rainfall proportionsfrom the estimated/projected value of precipitation (WE) at the higherelevation. Hence, a simple relation resulting in the precipitation factorfor the rain portion (Prain) has been developed and simulated (Figure5b) using Tsf, Tcrs, Trf and Tm yielding,
Prain=(-Tsf × Tm3+Tcrs × Tm2-Trf × Tm)/100 (5a)
where Tsf, Tcrs and Trf are constants on weekly time scale. All thefour temperature inputs in Equation (5a) have physical significance.Moreover, auto-multiple regression (Figure 5b) of observed data onPrain and Tm has yielded the following relation,
Prain=-0.006 Tm2+0.166 Tm-0.032 (5b)
Figure 5a: Relation of weekly snow depth, snowfall (WE) andrainfall with mean air temperature (Tm) for all the data series freefrom zero values of SS, SF, and RF at the stations (i.e., irrespective oftime and elevation) SS, SF, and RF data series of more than zerovalues vs. T in Solang valley.
Figure 5b: Relation of weekly snow depth, snowfall (WE) andrainfall with mean air temperature (Tm) for all the data series freefrom zero values of SS, SF, and RF at the stations (i.e., irrespective oftime and elevation) rainfall portion of precipitation model as perobserved data, Kienzle, UBC, developed and poly-trend within 0.0to 12°C range of Tm.
Relations of UBC [34] and Kienzle [21] for the phase ofprecipitation are given in Appendix A3 by Equation (A.2) andEquations (A.3a-b), respectively. The comparison between computedphases of precipitation on simulation developed Equation (5a), linearapproach of UBC, curvilinear approach of Kienzle, auto-multipleregression Equation (5b) and observed precipitation (Figure 5b)reveals better visual result for Equation (5a) than for later threeapproaches. Regression coefficient (R2) on observed vs. computedphase of precipitation (Figure 5c) resulted in 0.42, 0.58, 0.52 and 0.56for the UBC, Kienzle, simulated and regressed relations, respectively.This shows that Equation (5a) developed is not only in agreement withKienzle’s approach (Appendix A3) but it is also simple to use globally.
Citation: Verdhen A, Chahar BR, Sharma OP (2016) Winter Precipitation and Snowpack-melt with Temperature and Elevation at Solang Valley,India. Hydrol Current Res 7: 245. doi:10.4172/2157-7587.1000245
Page 7 of 11
Hydrol Current ResISSN:2157-7587 HYCR, an open access journal
Volume 7 • Issue 2 • 1000245
m
Subsequently, the ideal snowpack melt gradient (dSS/dT) or meltfactor (Mf) has been determined from (SS vs. Tm) trend-line (Figure 5aand R9) or from the following equation:
SS=-17.78 Tm+170 :{Mf=dSS/dT=17.78} (6)
where Mf=17.78=standing snow depletion per degree temperature[cm/°C/week or 0.714 mm/°C/d of SWE]. This point-melt includes theevaporation, sublimation; condensation and ground melt of thehydrological processes. The range of daily snowmelt on weekly averagebasis using different melt algorithms [37] shows conformity with thisresult.
Figure 5c: Relation of weekly snow depth, snowfall (WE) andrainfall with mean air temperature (Tm) for all the data series freefrom zero values of SS, SF, and RF at the stations (i.e., irrespective oftime and elevation) efficiency verification of precipitation (rain/snow) partition models of Kienzle and developed under this studywith the observed data.
ConclusionsTemperature lapse rate, rainfall, snowfall, snow depth and melt rate
data are important for snowmelt modelling. Linear regression withtemperature has been found quite good to be adopted for spatialprojection, interpolation and variability detection. SS, SF, RF, and Tmprojections from the base station (Bhang) in 100 m of rise in elevationare 27.95 cm, 31.2 cm,-7.72 mm and -1.09°C, respectively. The R2 forSF, RF, SS and Tm analysis falls in the range of 0.4 to 0.6, 0.60 to 0.9,<0.5 and >0.9, respectively. The lower value of R2, i.e., SS and RFnecessitates for envisaged cluster based analysis to track the variabilityon mean of the scatter. The inter-decadal variability of springtemperature in the region is telescopic from the first week of spring toeleventh week. This means that the air temperature over ablating snowis more sensitive to climate variability than the temperature over snow-free area.
The snowpack at Solang and Dhundi disappears earlier and at about5°C lower weekly mean temperature at Bhang at present (P3) inrelation to past (P2 data set). Snowfall at Dhundi/Solang/Bhang ceasesby 9°C and rainfall occasionally occurs whenever TmB exceeds 14.9°C.The precipitation and snowfall amount at each station attain maximumfor Tm=4°C and Tdnl=7.5°C; however spring precipitation is minimalwhen TmB or Tdnl reaches 16.8°C. It has also been noted that there isno rainfall below 0.65°C and no snowfall above 11.5°C of weekly Tm sorelation of mixed phase of precipitation has been developed, whichmay be valid for all the snowy watersheds.
Study reveals that the melting away of complete snow has beenadvanced by 5 weeks at lower stations (Bhang/Solang) and the snowaccumulation has been reduced by 50% at Solang over the studyduration (1982-2009). Degree-day snowpack ablation (melt) variesbetween 1.2 and 11.8 mm of SWE°C-1 d-1. Degree-day melt decreasesin the Bhang-Solang section, due to discontinued and low snow depth.However, the maximum snowmelt rate has gone up by 12.7 mm ofSWE°C-1 d-1 irrespective of elevation.
The relationships of snowfall, rainfall, snowpack and melt-rate withtemperature developed for the Solang valley provide sufficientunderstanding for the snowmelt hydrological component processes ofthe Beas sub-basin and are applicable in the data deficientmountainous region.
AcknowledgmentsAuthors acknowledge Mr. Ashwagosha Ganju, Director and Mr. N.
K. Thakur, Deputy Director of Snow and Avalanche StudyEstablishment, India for data.
Appendix A. Inter-station Temperature andPrecipitation-phases
A1. Temperature lapse rate variabilityTLR between Bhang and Solang section comes equal to,
TLR=[100 × (3.66+3.37)/(2 × (2485-2192)]=1.2°C/100 m (A.1a)
While for Solang and Dhundi section,
TLR=[100 × (6.0+5.09)/(2 × (2950-2192)]=0.73°C/100 m (A.1b)
Where Dhundi, Solang and Bhang stations are at 2950, 2485 and2192 m asl, respectively.
A2. Variability of precipitationThe difference in precipitations between two stations with
temperature series for P2 and P3 provide spatio-temporal variability inprecipitation. The rainfall shortfall (ΔRF) at Solang and Dhundiagainst TmB for P2 and P3 are given by relations R3a-d of Table A1.The shortfall in rainfall at Solang below 11°C at Bhang is more in P2
Regression Relation R2 Rel. No. Regression Relation (Rel.) R2 Rel. No. Group: Figure Reference
TmD=0.847TmB-5.09 0.92 R1a TmS=0.92TmB-3.367 0.92 R1b Tm P1; Figure 2c
dT/dZ|BS=-0.03TmB-1.15 0.9 R1c dT/dZ|BD=-0.02TmB-0.67 0.9 R1d TLR P1; Figure 2c
Citation: Verdhen A, Chahar BR, Sharma OP (2016) Winter Precipitation and Snowpack-melt with Temperature and Elevation at Solang Valley,India. Hydrol Current Res 7: 245. doi:10.4172/2157-7587.1000245
Page 8 of 11
Hydrol Current ResISSN:2157-7587 HYCR, an open access journal
Volume 7 • Issue 2 • 1000245
RFB=-2.53TmB+60.2 nc R2a RFS=1.13TmB+7.98 nc R2b RF P1; Figure 3a
RFD=0.67 TmB-1.67 nc R2c RF P1; Figure 3a
RFB-S=-2.598TmB+46.01 nc R3a RFB-D=-3.66TmB+60.5 0.46 R3b ΔRF P2
RFB-S=-4.73 TmB+68.0 0.42 R3c RFB-D=-4.65TmB+76.5 0.31 R3d ΔRF P3
SFB=-3.161TmB+42.6 0.3 R4a SFS=-8.71TmB+117.7 0.51 R4b) SF P1; Figure 3b
SFD=-12.51Tm+190.2 0.45 R4c SF P1; Figure 3b
SFS-B=-4.67TmB+64.92 0.61 R5a SFD-B=-10.62TmB+163.6 0.47 R5b ΔSF P1
SFS-B=-6.41TmB+86.5 0.74 R5c SFD-B=-8.10TmB+142.6 0.32 R5d ΔSF P2; Figure A1a
SFS-B=-1.20TmB+17.96 0.46 R5e SFD-B=-12.27TmB+181.72 0.56 R5f ΔSF P3; Figure A1b
SSB=- 2.85TmB+39.39 0.41 R6a SSS=-13.98TmB+215.1 0.59 R6b SS P1; Figure 4a
SSD=-12.37TmB+238.7 0.45 R6c SS P1; Figure 4a
SSS-B=-10.36TmB+166.4 0.5 R7a SSD-B=11.25TmB+222.5 0.41 R7b ΔSS P1
SSS-B=-8.55TmB+182 0.5 R7c SSD-B=-6.2TmB+202.6 0.3 R7d ΔSS P2; Figure 4b
SSS-B=-6.13TmB+94.49 0.37 R7e SSD-B=-13.48TmB+238.4 0.47 R7f ΔSS P3; Figure 4c
dSF/dZ|BS=0.19SFB+9.6 0.93 R8a dSF/dZ|BD=0.38SFB+7.2 0.84 R8d SF P1
dRF/dZ|BS=-0.15RFB+2.4 0.47 R8b dRF/dZ|BD=-0.08RFB+0.3 nc R8e RF P1
dSS/dZ|BS=0.07SSB+34 nc R8c dSS/dZ|BD=-0.07SSB+21.8 nc R8f SS P1
SS=-17.78Tm+170 0.56 R9a SF=-14.09Tm+106.7 nc R9b SS/F P1; Figure 5a
RF=-0.269Tm+37.02 nc R9c RF P1; Figure 5a
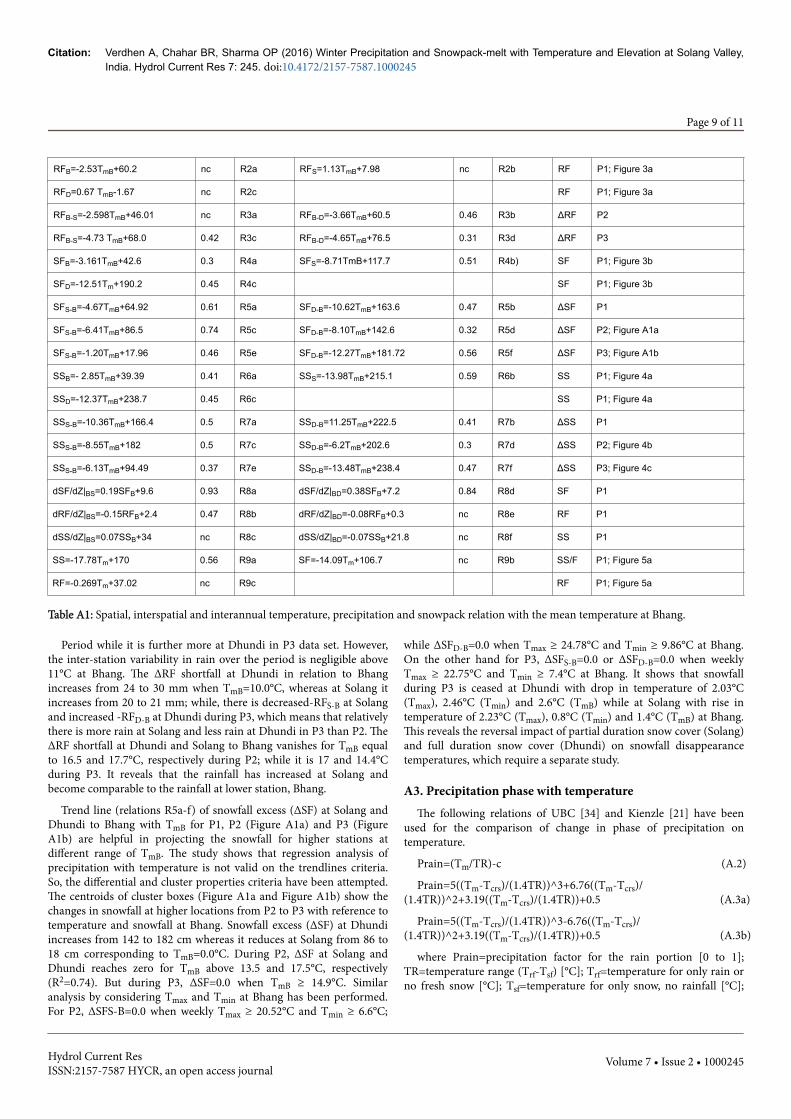
Table A1: Spatial, interspatial and interannual temperature, precipitation and snowpack relation with the mean temperature at Bhang.
Period while it is further more at Dhundi in P3 data set. However,the inter-station variability in rain over the period is negligible above11°C at Bhang. The ΔRF shortfall at Dhundi in relation to Bhangincreases from 24 to 30 mm when TmB=10.0°C, whereas at Solang itincreases from 20 to 21 mm; while, there is decreased-RFS-B at Solangand increased -RFD-B at Dhundi during P3, which means that relativelythere is more rain at Solang and less rain at Dhundi in P3 than P2. TheΔRF shortfall at Dhundi and Solang to Bhang vanishes for TmB equalto 16.5 and 17.7°C, respectively during P2; while it is 17 and 14.4°Cduring P3. It reveals that the rainfall has increased at Solang andbecome comparable to the rainfall at lower station, Bhang.
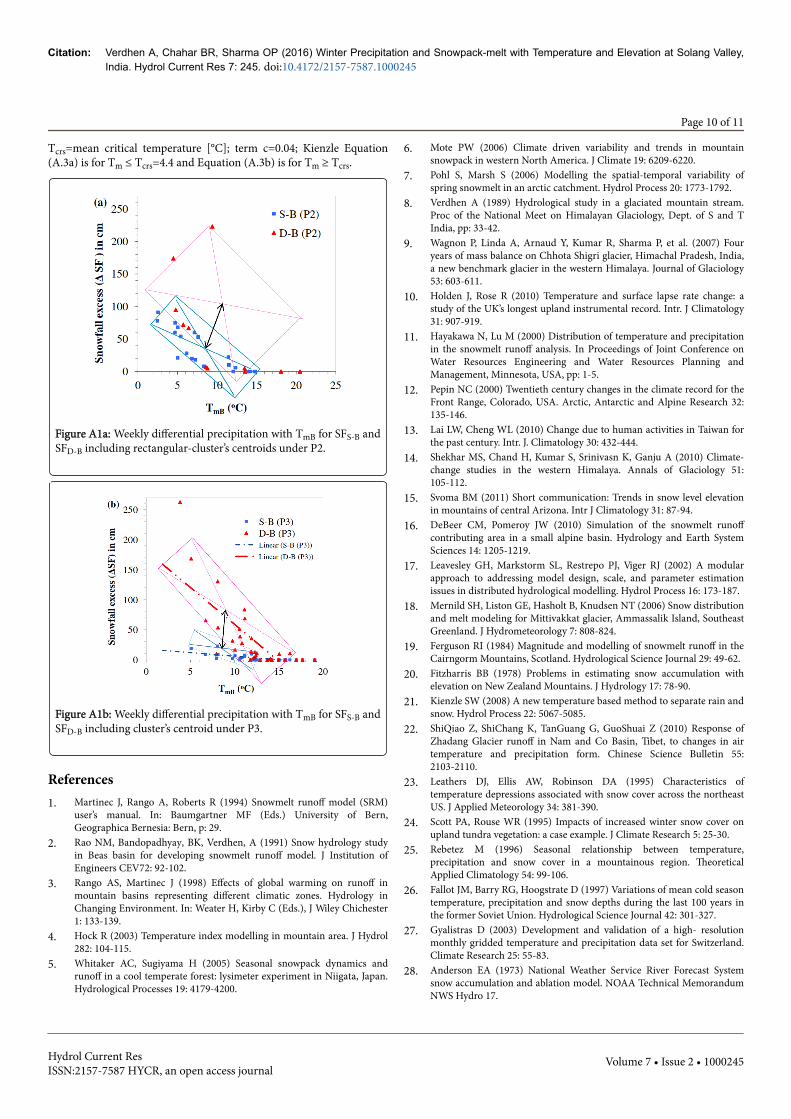
Trend line (relations R5a-f) of snowfall excess (ΔSF) at Solang andDhundi to Bhang with TmB for P1, P2 (Figure A1a) and P3 (FigureA1b) are helpful in projecting the snowfall for higher stations atdifferent range of TmB. The study shows that regression analysis ofprecipitation with temperature is not valid on the trendlines criteria.So, the differential and cluster properties criteria have been attempted.The centroids of cluster boxes (Figure A1a and Figure A1b) show thechanges in snowfall at higher locations from P2 to P3 with reference totemperature and snowfall at Bhang. Snowfall excess (ΔSF) at Dhundiincreases from 142 to 182 cm whereas it reduces at Solang from 86 to18 cm corresponding to TmB=0.0°C. During P2, ΔSF at Solang andDhundi reaches zero for TmB above 13.5 and 17.5°C, respectively(R2=0.74). But during P3, ΔSF=0.0 when TmB ≥ 14.9°C. Similaranalysis by considering Tmax and Tmin at Bhang has been performed.For P2, ΔSFS-B=0.0 when weekly Tmax ≥ 20.52°C and Tmin ≥ 6.6°C;
while ΔSFD-B=0.0 when Tmax ≥ 24.78°C and Tmin ≥ 9.86°C at Bhang.On the other hand for P3, ΔSFS-B=0.0 or ΔSFD-B=0.0 when weeklyTmax ≥ 22.75°C and Tmin ≥ 7.4°C at Bhang. It shows that snowfallduring P3 is ceased at Dhundi with drop in temperature of 2.03°C(Tmax), 2.46°C (Tmin) and 2.6°C (TmB) while at Solang with rise intemperature of 2.23°C (Tmax), 0.8°C (Tmin) and 1.4°C (TmB) at Bhang.This reveals the reversal impact of partial duration snow cover (Solang)and full duration snow cover (Dhundi) on snowfall disappearancetemperatures, which require a separate study.
A3. Precipitation phase with temperatureThe following relations of UBC [34] and Kienzle [21] have been
used for the comparison of change in phase of precipitation ontemperature.
Prain=(Tm/TR)-c (A.2)
Prain=5((Tm-Tcrs)/(1.4TR))^3+6.76((Tm-Tcrs)/(1.4TR))^2+3.19((Tm-Tcrs)/(1.4TR))+0.5 (A.3a)
Prain=5((Tm-Tcrs)/(1.4TR))^3-6.76((Tm-Tcrs)/(1.4TR))^2+3.19((Tm-Tcrs)/(1.4TR))+0.5 (A.3b)
where Prain=precipitation factor for the rain portion [0 to 1];TR=temperature range (Trf-Tsf) [°C]; Trf=temperature for only rain orno fresh snow [°C]; Tsf=temperature for only snow, no rainfall [°C];
Citation: Verdhen A, Chahar BR, Sharma OP (2016) Winter Precipitation and Snowpack-melt with Temperature and Elevation at Solang Valley,India. Hydrol Current Res 7: 245. doi:10.4172/2157-7587.1000245
Page 9 of 11
Hydrol Current ResISSN:2157-7587 HYCR, an open access journal
Volume 7 • Issue 2 • 1000245
Tcrs=mean critical temperature [°C]; term c=0.04; Kienzle Equation(A.3a) is for Tm ≤ Tcrs=4.4 and Equation (A.3b) is for Tm ≥ Tcrs.
Figure A1a: Weekly differential precipitation with TmB for SFS-B andSFD-B including rectangular-cluster’s centroids under P2.
Figure A1b: Weekly differential precipitation with TmB for SFS-B andSFD-B including cluster’s centroid under P3.
References1. Martinec J, Rango A, Roberts R (1994) Snowmelt runoff model (SRM)
user’s manual. In: Baumgartner MF (Eds.) University of Bern,Geographica Bernesia: Bern, p: 29.
2. Rao NM, Bandopadhyay, BK, Verdhen, A (1991) Snow hydrology studyin Beas basin for developing snowmelt runoff model. J Institution ofEngineers CEV72: 92-102.
3. Rango AS, Martinec J (1998) Effects of global warming on runoff inmountain basins representing different climatic zones. Hydrology inChanging Environment. In: Weater H, Kirby C (Eds.), J Wiley Chichester1: 133-139.
4. Hock R (2003) Temperature index modelling in mountain area. J Hydrol282: 104-115.
5. Whitaker AC, Sugiyama H (2005) Seasonal snowpack dynamics andrunoff in a cool temperate forest: lysimeter experiment in Niigata, Japan.Hydrological Processes 19: 4179-4200.
6. Mote PW (2006) Climate driven variability and trends in mountainsnowpack in western North America. J Climate 19: 6209-6220.
7. Pohl S, Marsh S (2006) Modelling the spatial-temporal variability ofspring snowmelt in an arctic catchment. Hydrol Process 20: 1773-1792.
8. Verdhen A (1989) Hydrological study in a glaciated mountain stream.Proc of the National Meet on Himalayan Glaciology, Dept. of S and TIndia, pp: 33-42.
9. Wagnon P, Linda A, Arnaud Y, Kumar R, Sharma P, et al. (2007) Fouryears of mass balance on Chhota Shigri glacier, Himachal Pradesh, India,a new benchmark glacier in the western Himalaya. Journal of Glaciology53: 603-611.
10. Holden J, Rose R (2010) Temperature and surface lapse rate change: astudy of the UK’s longest upland instrumental record. Intr. J Climatology31: 907-919.
11. Hayakawa N, Lu M (2000) Distribution of temperature and precipitationin the snowmelt runoff analysis. In Proceedings of Joint Conference onWater Resources Engineering and Water Resources Planning andManagement, Minnesota, USA, pp: 1-5.
12. Pepin NC (2000) Twentieth century changes in the climate record for theFront Range, Colorado, USA. Arctic, Antarctic and Alpine Research 32:135-146.
13. Lai LW, Cheng WL (2010) Change due to human activities in Taiwan forthe past century. Intr. J. Climatology 30: 432-444.
14. Shekhar MS, Chand H, Kumar S, Srinivasn K, Ganju A (2010) Climate-change studies in the western Himalaya. Annals of Glaciology 51:105-112.
15. Svoma BM (2011) Short communication: Trends in snow level elevationin mountains of central Arizona. Intr J Climatology 31: 87-94.
16. DeBeer CM, Pomeroy JW (2010) Simulation of the snowmelt runoffcontributing area in a small alpine basin. Hydrology and Earth SystemSciences 14: 1205-1219.
17. Leavesley GH, Markstorm SL, Restrepo PJ, Viger RJ (2002) A modularapproach to addressing model design, scale, and parameter estimationissues in distributed hydrological modelling. Hydrol Process 16: 173-187.
18. Mernild SH, Liston GE, Hasholt B, Knudsen NT (2006) Snow distributionand melt modeling for Mittivakkat glacier, Ammassalik Island, SoutheastGreenland. J Hydrometeorology 7: 808-824.
19. Ferguson RI (1984) Magnitude and modelling of snowmelt runoff in theCairngorm Mountains, Scotland. Hydrological Science Journal 29: 49-62.
20. Fitzharris BB (1978) Problems in estimating snow accumulation withelevation on New Zealand Mountains. J Hydrology 17: 78-90.
21. Kienzle SW (2008) A new temperature based method to separate rain andsnow. Hydrol Process 22: 5067-5085.
22. ShiQiao Z, ShiChang K, TanGuang G, GuoShuai Z (2010) Response ofZhadang Glacier runoff in Nam and Co Basin, Tibet, to changes in airtemperature and precipitation form. Chinese Science Bulletin 55:2103-2110.
23. Leathers DJ, Ellis AW, Robinson DA (1995) Characteristics oftemperature depressions associated with snow cover across the northeastUS. J Applied Meteorology 34: 381-390.
24. Scott PA, Rouse WR (1995) Impacts of increased winter snow cover onupland tundra vegetation: a case example. J Climate Research 5: 25-30.
25. Rebetez M (1996) Seasonal relationship between temperature,precipitation and snow cover in a mountainous region. TheoreticalApplied Climatology 54: 99-106.
26. Fallot JM, Barry RG, Hoogstrate D (1997) Variations of mean cold seasontemperature, precipitation and snow depths during the last 100 years inthe former Soviet Union. Hydrological Science Journal 42: 301-327.
27. Gyalistras D (2003) Development and validation of a high- resolutionmonthly gridded temperature and precipitation data set for Switzerland.Climate Research 25: 55-83.
28. Anderson EA (1973) National Weather Service River Forecast Systemsnow accumulation and ablation model. NOAA Technical MemorandumNWS Hydro 17.
Citation: Verdhen A, Chahar BR, Sharma OP (2016) Winter Precipitation and Snowpack-melt with Temperature and Elevation at Solang Valley,India. Hydrol Current Res 7: 245. doi:10.4172/2157-7587.1000245
Page 10 of 11
Hydrol Current ResISSN:2157-7587 HYCR, an open access journal
Volume 7 • Issue 2 • 1000245

29. Moore RD, Owens IF (1984) Modelling Alpine snow accumulation andablation using daily climate observations. J Hydrology 23: 73-83.
30. Hannah DM, McGregor GR (1997) Evaluating the impact of climate onsnow- and ice-melt dynamics in the Taillon basin, French Pyrenees. JGlaciology 43: 563-568.
31. Datt P, Srivastava PK, Negi PS, Satyawali PK (2008) Surface energybalance of seasonal snow cover for snowmelt estimation in NWHimalaya. J Earth System Science 117: 567-573.
32. Kasurak A, Kelly R, Brenning A (2011) Linear mixed modelling of snowdistribution in the central Yukon. Hydrol Process 25: 3332-3346.
33. Verdhen A (2013) Snow and glacier melt simulation for hydrology in atypical Himalayan watershed. PhD Thesis, Indian Institute of TechnologyDelhi, India.
34. Pipes A, Quick MC (1977) UBC Watershed Model Users Guide.Department of Civil Engineering, University of British Columbia:Vancouver, British Columbia Canada.
35. Verdhen A, Chahar BR, Sharma OP (2014) Spring time snowmelt andstreamflow predictions in the Himalayan Mountains. J Hydrol Engrg 19:1452-1461.
36. Verdhen A, Chahar BR, Ganju A, Sharma OP (2015) Modeling snow linealtitudes in the Himalayan Watershed. J Hydrol Engineering 21: 1-10.
37. Verdhen A, Chahar BR, Sharma OP (2014) Snowmelt modellingapproaches in watershed models: computation and comparison ofefficiencies under varying climatic conditions. Water Resour Manage 28:3439-3453.
Citation: Verdhen A, Chahar BR, Sharma OP (2016) Winter Precipitation and Snowpack-melt with Temperature and Elevation at Solang Valley,India. Hydrol Current Res 7: 245. doi:10.4172/2157-7587.1000245
Page 11 of 11
Hydrol Current ResISSN:2157-7587 HYCR, an open access journal
Volume 7 • Issue 2 • 1000245


![Weekly Report Drought Monitor / Snowpack Update€¦ · Weekly Report - Snowpack / Drought Monitor Update Date: 29 December 2011 [End of Year Edition] SNOTEL SNOWPACK AND PRECIPITATION](https://img.pdfslide.us/doc/110x75/5f14161a6565b54157769b36/weekly-report-drought-monitor-snowpack-update-weekly-report-snowpack-drought.jpg)