Embed Size (px)
Citation preview

IDEX CORPORATION1925 WEST FIELD COURT, SUITE 200LAKE FOREST, ILLINOIS 60045 USA
WWW.IDEXCORP.COM
Paragraphs #91556
6 Page Cover Outside 2.19.2013
BLK PMS285 SILVER FOIL BLACK FOIL
ABOUT IDEX Headquartered in Lake Forest, IL, USA, IDEX was founded in 1987 and stands for Innovation, Diversity and Excellence. Our company trades under the symbol “IEX” on the New York Stock Exchange and Chicago Stock Exchange. We have operating facilities across five continents with 6,717 dedicated employees worldwide.
MARKETSIDEX is an applied solutions provider serving niche markets worldwide. Our served markets include process industry and infrastructure-related applications, life sciences, research, semi-conductor, security, defense and medical technologies, industrial and municipal fire and rescue, and equipment associated with the retail dispensing of architectural paints and coatings. From leak detection within water infrastructure to enabling the push towards personalized medicine, IDEX is a leader in creating enabling technology, and improving business prospects for a diverse customer set across the globe.
STRATEGY Our expertise is in products that facilitate customer specific solutions in attractive niche markets. We are focused on growth by reinvesting in new products and markets to drive organic growth, acquiring complementary technologies to our existing offerings, and building a culture of excellence to deliver exceptional performance. Our commitment is to provide lasting value to our customers, challenging and rewarding work environments for our employees, and profitable long term growth for our shareholders. A strong foothold in developed countries has allowed us to make great strides to expand our footprint in emerging markets, where we see tremendous potential for growth across all our segments.
FINANCIAL HIGHLIGHTS(DOLLARS IN THOUSANDS, EXCEPT PER SHARE AMOUNTS)
RESULTS OF OPERATIONS 2012 2011
Net sales $1,954,258 $1,838,451
Adjusted operating income* 359,210 332,770
Adjusted net income* 224,067 213,855
Adjusted free cash flow* 294,847 226,071
FINANCIAL POSITION 2012 2011
Total assets $2,785,390 $2,836,107
Total borrowings 786,576 808,810
Shareholders’ equity 1,464,998 1,513,135
PERFORMANCE MEASURES 2012 2011
Percent of net sales:
Adjusted operating income* 18.4% 18.1%
Adjusted net income* 11.5% 11.6 %
Return on average assets* 8.0% 8.2%
Net debt as a percent of capitalization 24.2% 27.7%
Return on average shareholders’ equity* 15.0% 14.8%
PER SHARE DATA 2012 2011
Adjusted net income (diluted)* $2.68 $2.56
Cash dividends declared 0.80 0.68
Shareholders’ equity 17.71 18.18
OTHER DATA 2012 2011
Employees at year end 6,717 6,814
Shareholders at year end 6,700 7,000
Diluted weighted average shares outstanding (in 000s) 83,641 83,543
YEARS ENDED DECEMBER 31
* Refer to Non-GAAP Disclosures within Stockholder Information
At a Glance
IDEX CORPORATION 2012 ANNUAL REPORT

Paragraphs #91556
6 Page Cover Inside 2.19.2013
BLK PMS285
END MARKETS BRANDS PRODUCTS
Energy & fuels Corken / Faure Herman / Liquid Controls / SAMPI / Sponsler / Toptech Systems
Leading supplier of flow meters, electronic registration and control products, rotary vane and turbine pumps, reciprocating piston compressors and terminal automation systems
Water services Accusonic / ADS / Hydra-Stop / IETG / iPEK Detection and improvement of inefficiencies in the water, wastewater and power generation industries through flow monitoring & measurement, asset surveys, leak detection, line stopping, valve insertion and CCTV inspection systems
Aerospace, biopharma chemical, food & beverage, laundry, mining, oil & gas, petrochem, power generation, pulp & paper, semiconductor, solar, wastewater and water treatment
Knight / OBL / PeriFlo / Pulsafeeder / Trebor / Warren Rupp (which includes the SANDPIPER, Versa-Matic, Blagdon and Pumper Parts brands)
Pumps, heaters, controllers, systems, accessories and process equipment used for diaphragm and dosing pump applications. Technologies include: air-operated double-diaphragm pumps, ultra-pure chemical pumps, quartz de-ionized water heaters, peristaltic, precision hydraulic and mechanical diaphragm metering pumps, sliding vane, centrifugal, cooling tower, boiler controllers and timers. Products manufactured under Diaphragm & Dosing assist with movement, measurement, metering, mixing, dispensing and heating of various chemicals, water and other fluids through pumps, flow monitors and controls
Chemical, food processing and personal care Richter / Viking / Wright Flow Technologies Pumps, valves and accessories used in industrial and hygienic process applications; pump technologies include: rotary gear, centrifugal, lobe, vane and circumferential piston pumps; in addition they offer industrial valves, accessories and services.
Life sciences, analytical instrumentation, biotechnology and diagnostics
IDEX Health & Science / Eastern Plastics / Ismatec / Isolation Technologies / Rheodyne / Systec / Sapphire Engineering / Upchurch Scientific / ERC
Fluid processing components and fluidic sub-systems include; pumps, valves, tubing, fittings, degassers, manifolds, and machined materials; our integrated solutions approach enables optimization of the fluid path through multi-component subsystem design, development and production
Life sciences and medical instrumentation, scientific instrumentation, industrial materials processing and measurement, semiconductor manufacturing and wafer processing, environmental monitoring and defense and security
AT Films / Precision Photonics / CVI Laser / Melles Griot / Semrock
Advanced coating technologies for high performance applications, including Ion Beam Sputtering (IBS), Electron beam (EB), and Plasma Ion-assisted Deposition (PIAD), a wide range of innovative photonic and optical components and subsystems including solid-state and gas lasers and laser light engines, filters, lenses, mirrors, beam-splitters, waveplates, polarizers, shutters and opto-mechanical assemblies, and custom Optical and Electro-optic Assemblies (EOAs)
Industrial machinery, pharmaceuticals, food, laboratory, medical and dental
Fitzpatrick / Gast / JUN-AIR / Microfluidics / Quadro Engineering / Matcon
Clean, quiet compressors, air motors, regenerative blowers, vacuum pumps and generators; highly engineered material handling systems, size reduction mills, roll compacters, mixers, emulsifiers, powder dispensing and dispersion equipment
Printing & specialty seals Micropump / Precision Polymer Engineering High-efficiency miniature magnetically and electromagnetically driven gear pumps delivering pulse-free flow and exceptional life; high performance sealing solutions for demanding applications
Public and private fire and rescue agencies, nuclear power and petrochemical facilities, mining, transit bus and specialty vehicle applications
Class 1 / Godiva / HaleTruck-mounted and portable fire pumps, pump modules and pump kits, skidded and trailer mounted engine-driven pumping systems, marine pumps, foam and compressed-air foam systems, electronic controls and information systems, conventional and networked electrical systems and mechanical components
Fire services, civil defense, military, machine manufacturing, infrastructure providers such as railways, airports and public transportation systems
Dinglee / HURST Jaws of Life / LUKAS / Vetter Hydraulic and battery powered rescue tools, re-railing equipment, lifting & positioning devices for various industrial applications; pneumatic lifting bags and emergency shoring equipment
Agriculture, civil infrastructure, electrical transmission and distribution, manufacturing, mining, municipal, oil & gas, auto, petrochemical and chemical
Banjo / BAND-ITInjection-molded high quality, chemical and corrosion resistance valves and other liquid handling products designed for specific agricultural applications; engineered fastening systems consisting of band clamping products, manufactured from a variety of stainless steel and other corrosion-resistant materials and related installation tools
DIY retail stores and professional paint stores Fast & Fluid Management / Fluid Management Manual and automatic precision dispensing and mixing systems, software and service solutions for custom formulations at the point-of-sale
IDEX Overview Stockholder Information
CORPORATE OFFICEIDEX Corporation, 1925 West Field Court, Suite 200 Lake Forest, Illinois 60045 USA, 847.498.7070
INVESTOR INFORMATION Inquiries from shareholders and prospective investors should be directed to: Heath Mitts, Vice President and Chief Financial Officer, at the Corporate Office. Further information may also be obtained at www.idexcorp.com.
REGISTRAR AND TRANSFER AGENT Inquiries about stock transfers, address changes or IDEX’s dividend reinvestment program should be directed to:
Computershare P.O. Box 43006 Providence, Rhode Island 02940-3006 866.282.4944 www.computershare.com/investor
INDEPENDENT REGISTERED PUBLIC ACCOUNTING FIRMDeloitte & Touche LLP 111 S. Wacker Drive, Chicago, Illinois 60606
DIVIDEND POLICY IDEX paid a quarterly dividend of $0.20 per share on its common stock on January 31, 2013. The declaration of future dividends is within the discretion of the Company’s Board of Directors and will depend upon, among other things, business conditions, and IDEX’s earnings and financial condition.
STOCK MARKET INFORMATION IDEX common stock was held by an estimated 6,700 shareholders at December 31, 2012, and is traded under the symbol, “IEX” on the New York Stock Exchange and Chicago Stock Exchange.
PUBLIC FILINGS Shareholders may obtain a copy of any Form 10-K, 8-K, or 10-Q filed with the United States Securities and Exchange Commission by written request to the attention of Mark Zanichelli, Director, Financial Planning and Analysis at the Corporate Office or through our website at www.idexcorp.com.
ANNUAL MEETING The Annual Meeting of IDEX shareholders will be held on April 9, 2013, at 9:00 a.m. Central Time at: Lake Forest Graduate School 1905 West Field Court, Lake Forest, Illinois 60045
CERTIFICATIONS IDEX Corporation has included as Exhibit 31 to its Annual Report on Form 10-K for fiscal year 2012 filed with the Securities and Exchange Commission certificates of its Chief Executive Officer and Chief Financial Officer certifying the quality of IDEX Corporation’s public disclosure. IDEX Corporation has also submitted to the New York Stock Exchange (NYSE) a certificate of its Chief Executive Officer certifying that he was not aware of any violation by IDEX Corporation of NYSE corporate governance listing standards as of the date of the certification.
NON-GAAP DISCLOSURES (Dollars in thousands)
income of $128,218 plus a $198,519 impairment charge and $32,473 of restructuring expenses, while fiscal year 2011 adjusted operating income calculated as operating income of $304,656 plus a $15,800 non-cash fair value inventory charge and $12,314 of restructuring expenses.
plus a $163,511 impairment charge and $22,926 of restructuring expenses, both net of tax, while fiscal year 2011 adjusted net income calculated as net income of $193,857 plus an $11,278 non-cash fair value inventory charge and $8,720 of restructuring expenses, both net of tax.
expenditures plus excess tax benefit from stock-based compensation plus the forward starting interest rate swap settlement (in 2011 only).
share of $0.45 plus a $1.96 impairment charge and $0.27 of restructuring expenses, while fiscal year 2011 adjusted earnings per share calculated as earnings per share of $2.32 plus a $0.14 non-cash fair value inventory charge and $0.10 of restructuring expenses.
QUARTERLY STOCK PRICE FIRST SECOND THIRD FOURTH
2012 HIGH $43.15 $44.14 $43.96 $46.69 LOW 36.73 36.91 34.06 39.74 CLOSE 42.13 38.98 41.77 46.53
2011 HIGH $43.78 $47.50 $47.28 $38.36 LOW 38.02 41.90 30.09 29.29 CLOSE 43.65 45.85 31.16 37.11
Brand names shown in this report are registered trademarks of IDEX Corporation and/or its subsidiaries.
Des
ign:
par
agra
phs.
com
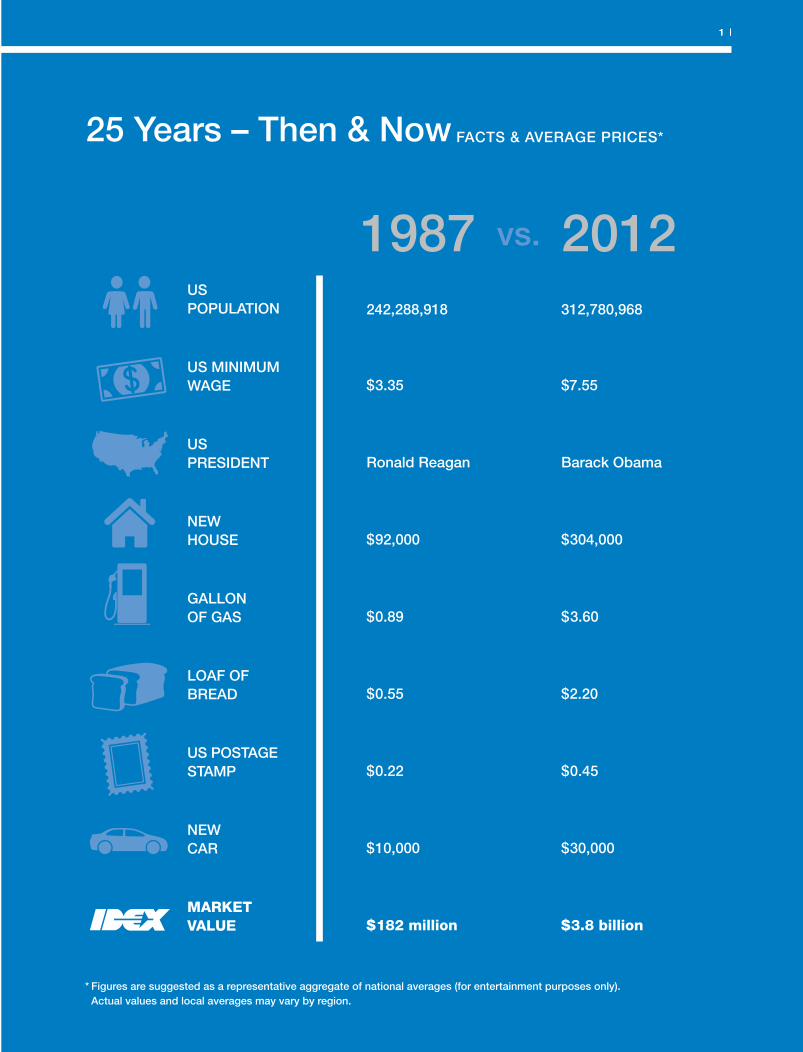
242,288,918
$3.35
Ronald Reagan
$92,000
$0.89
$0.55
$0.22
$10,000
$182 million
1 |1 |
25 Years – Then & Now FACTS & AVERAGE PRICES*
312,780,968
$7.55
Barack Obama
$304,000
$3.60
$2.20
$0.45
$30,000
$3.8 billion
1987 2012vs.US POPULATION
US MINIMUM WAGE
US PRESIDENT
NEW HOUSE
GALLON OF GAS
LOAF OF BREAD
US POSTAGE STAMP
NEW CAR
MARKET VALUE
* Figures are suggested as a representative aggregate of national averages (for entertainment purposes only). Actual values and local averages may vary by region.
Paragraphs #95945
Editorials PG 1 2.26.2013
CYAN MAG YELL BLK PMS285

IDEX CORPORATION 2012 ANNUAL REPORT
Dear Fellow Shareholders,25 Years of Innovation, Diversity & EXcellence
In 2012, IDEX reached an important milestone as we completed our 25th year since taking our very first steps as a corporation.
Looking back, there is much to celebrate about the steady growth and value creation IDEX has achieved for its shareholders over the last 25 years. More importantly, looking forward, given the strength of our strategic businesses, corporate balance sheet and alignment with end markets, there are many more reasons to be optimistic about IDEX’s potential for the next 25 years.
Our goal as a leadership team is to continue to build on this distinguished legacy and capitalize on our opportunities in 2013 and beyond.
Many aspects of IDEX’s business have evolved over the years, but what has remained constant is our ability to produce consistent return on investment for our shareholders. Consider, that since going public, IDEX has delivered 10% CAGR in revenue and 12% in net income, as revenues grew from $220 million to nearly $2 billion while net income expanded from $18 million to $224* million. We were able to achieve this while transforming our portfolio from a 70% industrial, heavy equipment and auto-based company with 24% of our sales coming from outside the United States to a diversified technology and industrial applications provider with higher growth, less cyclical businesses and over half our revenues generated via international markets. Moreover, $1,000 invested in IDEX in 1988 would be worth more than triple that same investment in the S&P 500 over the same period.
This is the rich and defining heritage of IDEX – Innovation, Diversity and EXcellence – that I have the privilege to lead. Our tradition of winning as a team for our customers, our shareholders, and our fellow employees continues with distinction today.
While we take a moment to recognize these achievements during our “silver anniversary” and thank those that have made these accomplishments possible, we look forward to an even brighter future. We are passionate about building on our foundation to create an IDEX that is even more dynamic, formidable and high-performing.
2012 – Financial Performance, Platforms & Positioning
IDEX generated nearly $2.0 billion in sales in 2012, resulting in adjusted net income of $224 million*. This represented an increase over 2011 of 6% and 5%, respectively. Free cash flow for the year of $295 million was 132% of adjusted net income* and an all-time high for the Company. Adjusted Earnings Per Share of $2.68* increased 5% over the prior year. Across the enterprise, adjusted operating margins remain strong at 18.4%*, 30 basis points higher than 2011 performance levels. Similarly, our balance sheet remains extremely favorable with a Net Leverage ratio of 1.1 and Net Debt to capitalization at 24%. It is a testament to the employees of IDEX that this strong financial performance was achieved within a volatile, global macroeconomic environment. Generating cash flow and profitability through disciplined execution enabled us to more aggressively repurchase shares last year while still delivering a dividend to shareholders for the 73rd consecutive quarter.
The future for IDEX is bright with over one billion dollars of available capital which will allow us to remain committed to our capital deployment objectives of which our first priority is to fund organic growth opportunities around the globe. Consistent with the past, we will continue to pay an attractive dividend as well as augment our organic investments with strategic acquisitions that enable our platforms. Our investors should also expect us to repurchase shares regularly and more aggressively when appropriate.
Andrew K. Silvernail
Paragraphs #95945
Editorials PG 2 2.27.2013
CYAN MAG YELL BLK PMS285

Chairman and Chief Executive OfficerMarch 6, 2013
Business by business, we’re positioned to win and IDEX advanced its position within its three business segments during 2012.
In 2012, FMT posted revenues of $833 million in 2012, a slight increase from 2011. While organic sales growth for the year was 2%, productivity and strong execution enabled FMT to increase its adjusted operating margin. Within the segment, Agriculture and Energy enjoyed strong years in North America, while Chemical, Food and Process rebounded nicely this past year. The Water market remains a challenge, but we believe we are well positioned to win business when municipal funding restraints begin to ease. We believe FMT will continue to perform at historic margin levels as we see a rebound with both the Asian and European markets.
HST produced annual sales of $695 million, an increase of 14% from 2011. We continue to bolster this segment with the acquisitions of Matcon Group, Ltd. and ERC. Matcon adds to IDEX’s Materials Processing Technologies platform – an identified area of strategic growth for IDEX, while Japan-based ERC adds market- leading capabilities serving analytical instrumentation customers. Both acquisitions are expected to be accretive to earnings going forward.
FSD recorded strong performance across all of the diversified businesses with annual revenues of $437 million. This represents a 9% increase over the prior year including an increase of 11% in organic sales, driven in part by large dispensing replacement orders secured during the year. Adjusted operating margins, already the highest of IDEX’s three business units, increased from last year. North American fire, rescue and dispensing markets stabilized in 2012 while European and Asian markets remain slow. However, we are expecting to see some growth within our international markets going forward. As usual, our band clamping business, Band-It, continues to innovate and deliver top notch solutions to its customers. Lastly, cost actions taken in 2012 should generate positive volume and margin leverage for FSD in 2013.
Our businesses are poised to capitalize on the opportunities available across the globe, and we will continue to strive to be the partner of choice in every market we serve. As we invest to accelerate profitable growth, we will keep our discipline in the development of our outstanding team and keep our focus on excellence in execution. It is through this discipline and focus that we will position ourselves for the next quarter century of success.
The Next 25 Years: Growth & Gratitude
I want to thank all of the people that help to make IDEX successful – from our Board of Directors and shareholders, to our customers, suppliers and employees on five continents around the world. We could not have grown into the company we are today without your active involvement and our collective striving for excellence. Thank you. Know that our plan is to enhance our leadership positions, build on our global platforms and make 2013 IDEX’s best year.
When IDEX celebrates its golden anniversary, we will have evolved as we did in the past quarter century. We will be more global, more competitive, and more successful, but we will have retained the essence of our culture. Amidst the inevitable business changes over time, we’ll still recognize the immutable and lasting core principles of Innovation, Diversity and EXcellence that is IDEX.
3 |
Silver Anniversary Fact:
$1,000 invested in IDEX in 1988 would be worth more than triple the same amount invested in the S&P over the same period.
* Refer to Non-GAAP Disclosure within Stockholder Information
Paragraphs #95945
Editorials PG 3 2.26.2013
CYAN MAG YELL BLK PMS285

IDEX CORPORATION 2012 ANNUAL REPORT
1987 1988
IDEX becomes a public company with its shares listed on the New York Stock Exchange
1989
IDEX Corporation organized under Delaware Law by Kohlberg Kravis Roberts & Co. (KKR)
History of IDEX Corporation
IDEX purchases the stock of BAND-IT (above), Lubriquip, Strippit, Vibratech (f.k.a. Hydraulics), Viking Pump & Warren Rupp from Houdaile Industries, Inc.
Our Fluid and Metering Technologies business segment features highly engineered products including pumps, meters and systems that help in the processing, distribution and measurement of liquids, gases and solids. These products support a wide array of industries and serve diverse end markets in both developed and emerging regions around the world. The key strategic components within FMT include: 1) Chemical, Food and Process, 2) Energy, 3) Water Services and 4) Agriculture.
In 2012, Chemical, Food and Process as a whole delivered balanced performance. The agriculture end market was particularly strong in North America during the year, while chemical project activity slowed. Similarly, Energy generated favorable results in North America, while markets in Europe and Asia lagged comparatively. Water experienced softness in deal flow during the year as funding for water and wastewater projects from municipal sources was delayed. For each of these FMT businesses, rising global markets offer terrific opportunities for growth as local economies demand infrastructure systems to support their steadily expanding food, water and energy needs.
Fluid & Metering Technologies
The Fluid & Metering Technologies segment was established at the inception of IDEX and still continues to service many of the same customers.
Paragraphs #95945
Editorials PG 4 2.26.2013
CYAN MAG YELL BLK PMS285
5 |
1990 1991 1992
Acquisition of Corken (above)
Over 25% of IDEX revenue is based outside the US
Acquisition of Viking Pump Canada (above) and Pulsafeeder
27% Industrial
24% Energy
19% Chemical Processing
17% Water
7% Food & Pharma
6% Agriculture
2012 End Markets Served by FMT Businesses
27%
24%
17%
7%
6%
19%
Paragraphs #95945
Editorials PG 5 2.26.2013
CYAN MAG YELL BLK PMS285
IDEX CORPORATION 2012 ANNUAL REPORT
1994 1995
IDEX lists its common stock on the Chicago Stock Exchange
IDEX surpases $500 million in net sales
Acquisition of Fluid Management
1996
Acquisition of Hale Products (above)
IDEX declares first dividend
Acquisition of Micropump (above) & Lukas
Over 35% of IDEX revenue is based outside the US
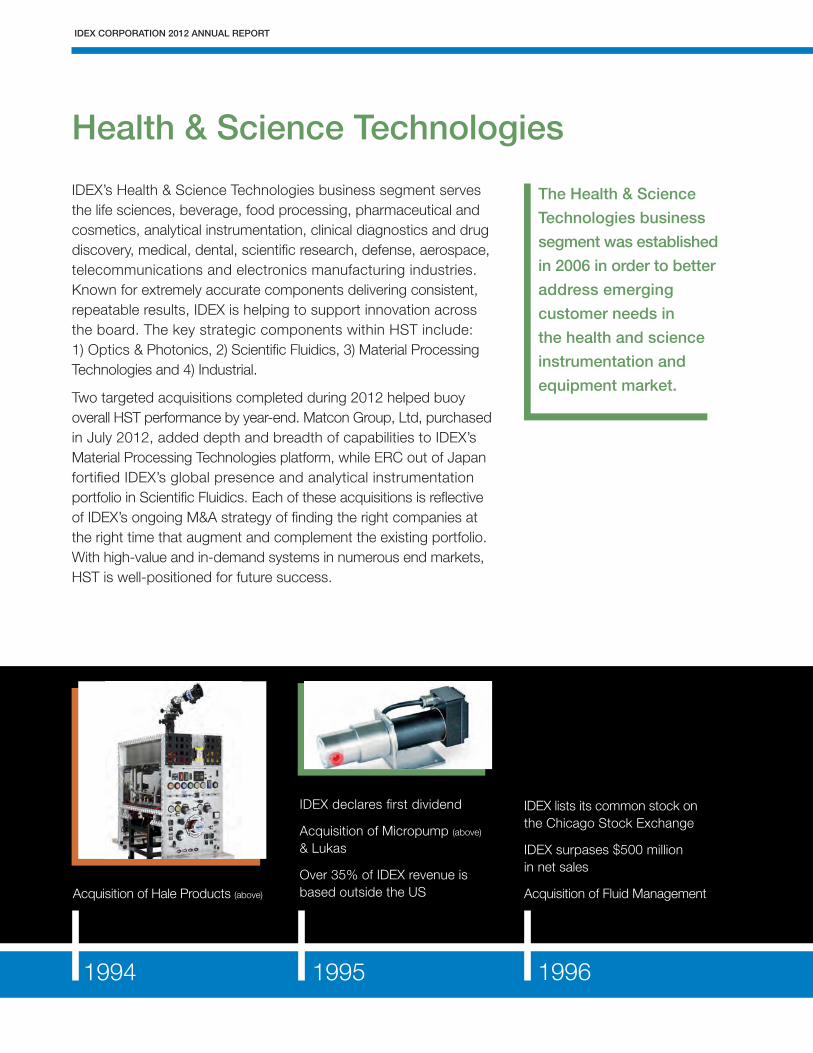
IDEX’s Health & Science Technologies business segment serves the life sciences, beverage, food processing, pharmaceutical and cosmetics, analytical instrumentation, clinical diagnostics and drug discovery, medical, dental, scientific research, defense, aerospace, telecommunications and electronics manufacturing industries. Known for extremely accurate components delivering consistent, repeatable results, IDEX is helping to support innovation across the board. The key strategic components within HST include: 1) Optics & Photonics, 2) Scientific Fluidics, 3) Material Processing Technologies and 4) Industrial.
Two targeted acquisitions completed during 2012 helped buoy overall HST performance by year-end. Matcon Group, Ltd, purchased in July 2012, added depth and breadth of capabilities to IDEX’s Material Processing Technologies platform, while ERC out of Japan fortified IDEX’s global presence and analytical instrumentation portfolio in Scientific Fluidics. Each of these acquisitions is reflective of IDEX’s ongoing M&A strategy of finding the right companies at the right time that augment and complement the existing portfolio. With high-value and in-demand systems in numerous end markets, HST is well-positioned for future success.
Health & Science Technologies
The Health & Science Technologies business segment was established in 2006 in order to better address emerging customer needs in the health and science instrumentation and equipment market.
Paragraphs #95945
Editorials PG 6 2.26.2013
CYAN MAG YELL BLK PMS285
7 |
1997 1998
Acquisition of Blagdon Pumps & Knight Equipment (above)
Acquisition of GAST Manufacturing (above)
1999
Acquisition of FAST S.p.a. (above)
Standard & Poor’s announces IDEX to be added to S&P Small Cap 600 Index
37% Analytical Instruments
18% Industrial
12% Medical/Dental
10% Food & Pharma
8% Life Sciences
8% Semiconductor/ Electronics
4% Military/Defense
3% Printing
2012 End Markets Served by HST Businesses
37%
18%
10%
8%
12%
8%
4% 3%
Paragraphs #95945
Editorials PG 7 2.26.2013
CYAN MAG YELL BLK PMS285
The Fire & Safety/Diversified Products business segment at IDEX includes a broad range of high-value, in-demand niche products serving discerning and geographically diverse end market customers. Featuring a few well-known branded products like the Jaws of Life® and BAND-IT, FSD supports a wide array of industries and applications found in everyday life. The four segment components of FSD include: 1) Rescue, 2) Fire, 3) Fastening Systems and 4) Dispensing.
Across the board, each business performed exceptionally well for FSD in 2012. Organic growth in both North America and global markets, in conjunction with restructuring activities completed by year-end, helped to lift segment results. Dispensing realized long-awaited and large system replenishment orders in North America, even as European markets remained uncertain. Rescue grew in North America and the Middle East, offsetting order delays in China. Fire also drove organic growth in North America. Fastening Systems kept pace with continued growth in emerging markets. The future prospects for FSD remain positive as the highest margin segment of IDEX takes advantage of market demand increases to leverage productivity and volume.
IDEX CORPORATION 2012 ANNUAL REPORT
2000 2001
Fire & Safety / Diversified Products
The Fire & Safety / Diversified Products segment houses some of the companies most well-known brands including the Jaws of Life® and BAND-IT.
Acquisition of Halox Technologies, Rheodyne & Wright Flow
KKR exits
2002
Acquisition of Ismatec & Trebor (above)
IDEX deploys Operational Excellence across all business units
Acquisition of Class 1, Liquid Controls (above) & Versa-Matic
Paragraphs #95945
Editorials PG 8 2.26.2013
CYAN MAG YELL BLK PMS285
9 |
32% Dispensing
27% Rescue Tools
21% Fire Suppression
20% Band Clamping
2012 End Markets Served by FSD Businesses
32%
27%
20%
2003 20052004
IDEX Technology (Suzhou) received business license
Acquisition of Sponsler & Classic Engineering
First pumps assembled in Suzhou facility
21%
IDEX surpasses $1 billion in net sales
Acquisition of Manfred Vetter, Systec, Scivex & Dinglee (above)
IDEX surpasses $1 billion in total assets
Official Grand Opening of Suzhou facility
Paragraphs #95945
Editorials PG 9 2.26.2013
CYAN MAG YELL BLK PMS285
Sustainability Efforts
IDEX OPERATING MODEL A key element of the IDEX Operating Model is the deployment of value stream-based rapid improvement events that are focused on driving the highest value to our customers, shareholders, and employees. Improvements in health, safety, and environmental sustainability at IDEX are achieved through the deployment of this process, which includes safety being the first topic of discussion in our manufacturing facilities’ daily management meetings.
Our Environment, Health & Safety (EHS) policy sets the expectations for compliance with country and local regulations, as well as company-wide standards, procedures and best practices. IDEX business leaders continuously review our results and evaluate our business practices to identify and act on new opportunities for improving our sustainability.
SUCCESSESHere are a few representative success stories from across the IDEX enterprise. Read more at www.idexcorp.com.
BAND-IT: BAND-IT in Denver, Colorado, USA reduced their 480V electrical consumption by 27% in 2012 by adding a 150hp variable speed compressor and by replacing old occluded iron piping with more efficient aluminum air lines.
The combination of changes allowed for an increased air flow at critical production processes while at the same time reducing the amount of energy required to produce the air.
Banjo Corporation: Banjo Corporation in Crawfordsville, Indiana, USA reduced 60% of their lighting load and 10% of total energy usage by replacing older existing metal halide and T12 fluorescent lighting with modern high efficiency fluorescent and occupancy sensors in warehouse areas. The project also resulted in improved workplace light levels and much higher color rendering for better visual acuity.
Faure Herman: Faure Herman in La Ferté-Bernard, France reduced petroleum hydrocarbons used in test equipment by 69% over two years by identifying and stopping system leakage, and by improving waste collection methods. Faure Herman also increased waste recycling to 80% facility-wide, which resulted in a 76% cost reduction for dangerous waste disposal.
IDEX Technology (Suzhou) Co, Ltd: IDEX Technology (Suzhou) Co, Ltd in Suzhou, China reduced electricity consumption of air compressors by 150,000 KwH (37%) annually by installing an inverter and making other compressor system alterations.
IDEX CORPORATION 2012 ANNUAL REPORT
2006 2007 2008
Acquisition of Faure Herman & Quadro Engineering (above)
IDEX surpasses $2 billion in total assets
Acquisition of ADS, Richter Chemie-Technik, iPEK, IETG & Semrock
Acquisition of JUN-AIR, Eastern Plastics, Banjo & Toptech
IDEX deploys Commercial Excellence across all business units
The Health & Science Technologies segment was established
Paragraphs #95945
Editorials PG 10 2.26.2013
CYAN MAG YELL BLK PMS285
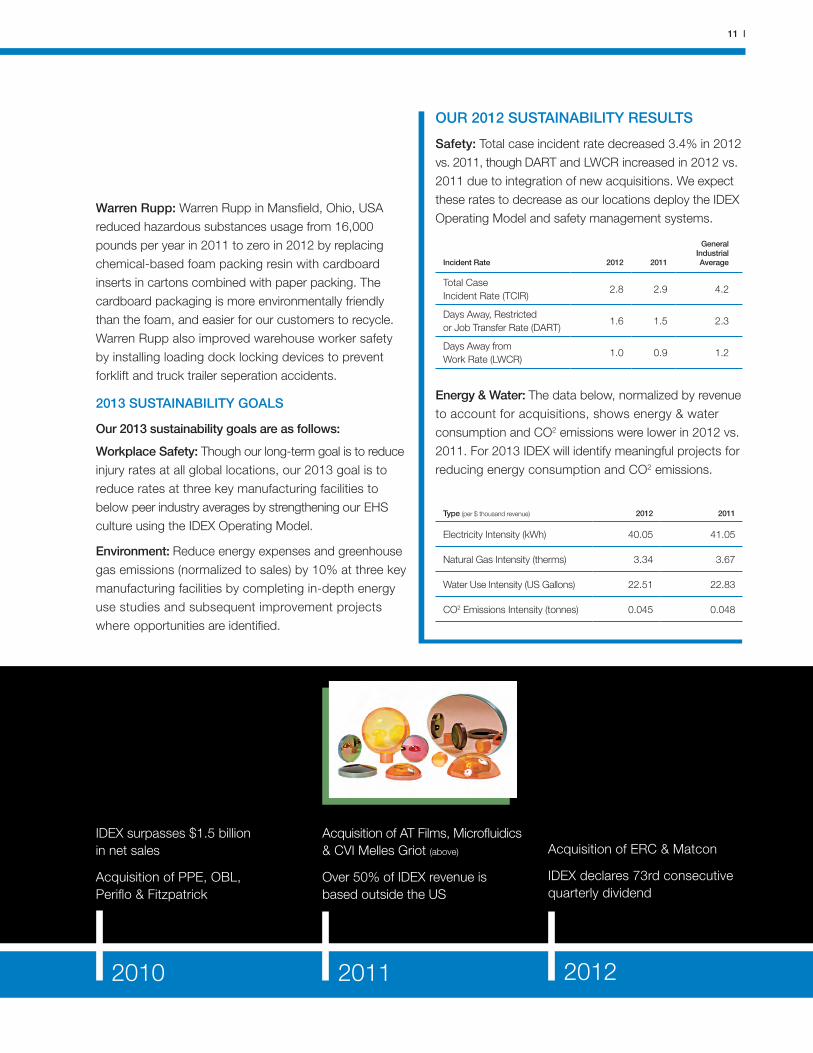
OUR 2012 SUSTAINABILITY RESULTS
Safety: Total case incident rate decreased 3.4% in 2012 vs. 2011, though DART and LWCR increased in 2012 vs. 2011 due to integration of new acquisitions. We expect these rates to decrease as our locations deploy the IDEX Operating Model and safety management systems.
Energy & Water: The data below, normalized by revenue to account for acquisitions, shows energy & water consumption and CO2 emissions were lower in 2012 vs. 2011. For 2013 IDEX will identify meaningful projects for reducing energy consumption and CO2 emissions.
11 |
2010 20122011
IDEX surpasses $1.5 billion in net sales
Acquisition of PPE, OBL, Periflo & Fitzpatrick
Acquisition of AT Films, Microfluidics & CVI Melles Griot (above)
Over 50% of IDEX revenue is based outside the US
Incident Rate 2012 2011
General Industrial Average
Total Case Incident Rate (TCIR)
2.8 2.9 4.2
Days Away, Restricted or Job Transfer Rate (DART)
1.6 1.5 2.3
Days Away from Work Rate (LWCR)
1.0 0.9 1.2
Type (per $ thousand revenue) 2012 2011
Electricity Intensity (kWh) 40.05 41.05
Natural Gas Intensity (therms) 3.34 3.67
Water Use Intensity (US Gallons) 22.51 22.83
CO2 Emissions Intensity (tonnes) 0.045 0.048
Warren Rupp: Warren Rupp in Mansfield, Ohio, USA reduced hazardous substances usage from 16,000 pounds per year in 2011 to zero in 2012 by replacing chemical-based foam packing resin with cardboard inserts in cartons combined with paper packing. The cardboard packaging is more environmentally friendly than the foam, and easier for our customers to recycle. Warren Rupp also improved warehouse worker safety by installing loading dock locking devices to prevent forklift and truck trailer seperation accidents.
2013 SUSTAINABILITY GOALS
Our 2013 sustainability goals are as follows:
Workplace Safety: Though our long-term goal is to reduce injury rates at all global locations, our 2013 goal is to reduce rates at three key manufacturing facilities to below peer industry averages by strengthening our EHS culture using the IDEX Operating Model.
Environment: Reduce energy expenses and greenhouse gas emissions (normalized to sales) by 10% at three key manufacturing facilities by completing in-depth energy use studies and subsequent improvement projects where opportunities are identified.
Acquisition of ERC & Matcon
IDEX declares 73rd consecutive quarterly dividend
Paragraphs #95945
Editorials PG 11 2.27.2013
CYAN MAG YELL BLK PMS285

Corporate Headquarters Lake Forest, IL
United StatesHuntsville, ALCarlsbad, CALake Forest, CARohnert Park, CABoulder, CO Denver, COBristol, CTLongwood, FLOcala, FLPunta Gorda, FLCedar Falls, IAAlsip, ILElmhurst, ILLake Bluff, ILWheeling, ILCrawfordsville, INMiddleboro, MANewton, MA Wareham, MABenton Harbor, MIShelby, NCAlbuquerque, NMRochester, NY
Mansfield, OHOklahoma City, OKConshohocken, PAHouston, TXWest Jordan, UTOak Harbor, WAVancouver, WA
AustraliaGuildford West Melbourne Sydney Unanderra
AustriaHirschegg
BelgiumAntwerpSint-Niklass
BrazilRio Grande Do Sol
CanadaAbbotsford, BC Edmonton, ONWaterloo, ONWindsor, ONMississauga, ON
ChinaBeijingGuangzhouShanghaiSichuanSuzhouTianjin
FranceLa Ferté BernardLyon
GermanyErlangen BensheimKempenWertheim-MondfeldSulzbergZülpich
Hong Kong
India MumbaiVadodara
IrelandShannon, County Clare
Isle of Man
ItalyAltopascioLucca
JapanKanagawaSaitama Tokyo
JordanAmman
MexicoColonia Polanco
The NetherlandsBreda DidamSassenheimWoerden
New ZealandAuckland
Puerto RicoSan Juan
Singapore
South KoreaBucheon
SpainBarcelona
SwedenStockholm
SwitzerlandGlattbrugg Zürich
United Arab EmiratesDubai
United KingdomBlackburnEastbourne, East SussexLeeds, Yorkshire LeicesterStaveley, DerbyshireWarwick, WarwickshireRedditch, West MidlandsWorcesterSeven OaksSt. NeotsAberdeen
Global Footprint
IDEX CORPORATION 2012 ANNUAL REPORT
Paragraphs #95945
Editorials PG 12 2.26.2013
CYAN MAG YELL BLK PMS285
UNITED STATES SECURITIES AND EXCHANGE COMMISSIONWashington, D.C. 20549
Form 10-KÍ ANNUAL REPORT PURSUANT TO SECTION 13 OR 15(d)
OF THE SECURITIES EXCHANGE ACT OF 1934For the Fiscal Year Ended December 31, 2012
‘ TRANSITION REPORT PURSUANT TO SECTION 13 OR 15(d) OF THE SECURITIESEXCHANGE ACT OF 1934For the Transition Period From to
Commission file number 1-10235
IDEX CORPORATION(Exact Name of Registrant as Specified in its Charter)
Delaware 36-3555336(State or other jurisdiction ofincorporation or organization)
(I.R.S. EmployerIdentification No.)
1925 West Field Court, Lake Forest, Illinois 60045(Address of principal executive offices) (Zip Code)
Registrant’s telephone number:(847) 498-7070
Securities Registered Pursuant to Section 12(b) of the Act:Title of Each Class Name of Each Exchange on Which Registered
Common Stock, par value $.01 per share New York Stock Exchangeand Chicago Stock Exchange
Securities Registered Pursuant to Section 12(g) of the Act:None
Indicate by check mark if the registrant is a well-known seasoned issuer, as defined in Rule 405 of the SecuritiesAct. Yes Í No ‘
Indicate by check mark if the registrant is not required to file reports pursuant to Section 13 or Section 15(d) of theAct. Yes ‘ No Í
Indicate by check mark whether the registrant: (1) has filed all reports required to be filed by Section 13 or 15(d) of theSecurities Exchange Act of 1934 during the preceding 12 months (or for such shorter period that the registrant was required to filesuch reports), and (2) has been subject to such filing requirements for the past 90 days. Yes Í No ‘
Indicate by check mark whether the registrant has submitted electronically and posted on its corporate Web site, if any, everyInteractive Data File required to be submitted and posted pursuant to Rule 405 of Regulation S-T (§ 232.405 of this chapter) duringthe preceding 12 months (or for such shorter period that the registrant was required to submit and post suchfiles). Yes Í No ‘
Indicate by check mark if disclosure of delinquent filers pursuant to Item 405 of Regulation S-K is not contained herein, andwill not be contained, to the best of registrant’s knowledge, in definitive proxy or information statements incorporated by referencein Part III of this Form 10-K or any amendment to this Form 10-K. Í
Indicate by check mark whether the registrant is a large accelerated filer, an accelerated filer, a non-accelerated filer, or asmaller reporting company. See the definitions of “large accelerated filer,” “accelerated filer” and “smaller reporting company” inRule 12b-2 of the Exchange Act. (Check one):Large accelerated filer Í Accelerated filer ‘ Non-accelerated filer ‘ Smaller reporting company ‘
(Do not check if a smaller reporting company)Indicate by check mark whether the registrant is a shell company (as defined in Rule 12b-2 of the Act). Yes ‘ No ÍThe aggregate market value of the common stock (based on the June 29, 2012 closing price of $38.98) held by non-affiliates
of IDEX Corporation was $3,228,621,602.The number of shares outstanding of IDEX Corporation’s common stock, par value $.01 per share, as of February 15, 2013
was 82,523,658.DOCUMENTS INCORPORATED BY REFERENCE
Portions of the 2012 annual report to stockholders of IDEX Corporation the (“2012 Annual Report”) are incorporated byreference to Part II of this Form 10-K and portions of the proxy statement of IDEX Corporation with respect to the 2013 annualmeeting of stockholders (the “2013 Proxy Statement”) are incorporated by reference into Part III of this Form 10-K.


Table of Contents
PART I.Item 1. Business . . . . . . . . . . . . . . . . . . . . . . . . . . . . . . . . . . . . . . . . . . . . . . . . . . . . . . . . . . . . . . . . . . . . . . 1Item 1A. Risk Factors . . . . . . . . . . . . . . . . . . . . . . . . . . . . . . . . . . . . . . . . . . . . . . . . . . . . . . . . . . . . . . . . . . . . 8Item 1B. Unresolved Staff Comments . . . . . . . . . . . . . . . . . . . . . . . . . . . . . . . . . . . . . . . . . . . . . . . . . . . . . . . 10Item 2. Properties . . . . . . . . . . . . . . . . . . . . . . . . . . . . . . . . . . . . . . . . . . . . . . . . . . . . . . . . . . . . . . . . . . . . . 10Item 3. Legal Proceedings . . . . . . . . . . . . . . . . . . . . . . . . . . . . . . . . . . . . . . . . . . . . . . . . . . . . . . . . . . . . . . . 10Item 4. Mine Safety Disclosures . . . . . . . . . . . . . . . . . . . . . . . . . . . . . . . . . . . . . . . . . . . . . . . . . . . . . . . . . . 10
PART II.Item 5. Market for Registrant’s Common Equity, Related Stockholder Matters and Issuer Purchases of
Equity Securities . . . . . . . . . . . . . . . . . . . . . . . . . . . . . . . . . . . . . . . . . . . . . . . . . . . . . . . . . . . . . . . . 11Item 6. Selected Financial Data . . . . . . . . . . . . . . . . . . . . . . . . . . . . . . . . . . . . . . . . . . . . . . . . . . . . . . . . . . . 13Item 7. Management’s Discussion and Analysis of Financial Condition and Results of Operations . . . . . . 14Item 7A. Quantitative and Qualitative Disclosures About Market Risk . . . . . . . . . . . . . . . . . . . . . . . . . . . . . 28Item 8. Financial Statements and Supplementary Data . . . . . . . . . . . . . . . . . . . . . . . . . . . . . . . . . . . . . . . . . 29Item 9. Changes in and Disagreements with Accountants on Accounting and Financial Disclosure . . . . . . 70Item 9A. Controls and Procedures . . . . . . . . . . . . . . . . . . . . . . . . . . . . . . . . . . . . . . . . . . . . . . . . . . . . . . . . . . 70Item 9B. Other Information . . . . . . . . . . . . . . . . . . . . . . . . . . . . . . . . . . . . . . . . . . . . . . . . . . . . . . . . . . . . . . . 70
PART III.Item 10. Directors, Executive Officers and Corporate Governance . . . . . . . . . . . . . . . . . . . . . . . . . . . . . . . . 70Item 11. Executive Compensation . . . . . . . . . . . . . . . . . . . . . . . . . . . . . . . . . . . . . . . . . . . . . . . . . . . . . . . . . . 70Item 12. Security Ownership of Certain Beneficial Owners and Management and Related Stockholder
Matters . . . . . . . . . . . . . . . . . . . . . . . . . . . . . . . . . . . . . . . . . . . . . . . . . . . . . . . . . . . . . . . . . . . . . . . 71Item 13. Certain Relationships and Related Transactions, and Director Independence . . . . . . . . . . . . . . . . . 71Item 14. Principal Accountant Fees and Services . . . . . . . . . . . . . . . . . . . . . . . . . . . . . . . . . . . . . . . . . . . . . . 71
PART IV.Item 15. Exhibits and Financial Statement Schedules . . . . . . . . . . . . . . . . . . . . . . . . . . . . . . . . . . . . . . . . . . 72Signatures . . . . . . . . . . . . . . . . . . . . . . . . . . . . . . . . . . . . . . . . . . . . . . . . . . . . . . . . . . . . . . . . . . . . . . . . . . . . . . 73Exhibit Index . . . . . . . . . . . . . . . . . . . . . . . . . . . . . . . . . . . . . . . . . . . . . . . . . . . . . . . . . . . . . . . . . . . . . . . . . . . . 74
PART I
Item 1. Business.
IDEX Corporation (“IDEX” or the “Company”) is a Delaware corporation incorporated on September 24,1987. The Company is an applied solutions business that sells an extensive array of pumps, flow meters andother fluidics systems and components and engineered products to customers in a variety of markets around theworld. All of the Company’s business activities are carried out through wholly-owned subsidiaries.
IDEX has three reportable business segments: Fluid & Metering Technologies, Health & ScienceTechnologies and Fire & Safety/Diversified Products. Reporting units in the Fluid & Metering Technologiessegment consist of: Banjo; Energy & Fuels (“Energy”); Chemical, Food & Process (“CFP”); Diaphragm &Dosing Pump Technology (“DDPT”) and Water Services & Technology (“WST”). Reporting units in theHealth & Science Technologies segment consist of: IDEX Health & Science (“IH&S”); IDEX Optics &Photonics (“IOP”); Containment; Gast; Micropump and Materials Process Technologies (“MPT”). Reportingunits in the Fire & Safety/Diversified Products segment consist of: Fire Suppression; Rescue; Band-It; andDispensing Equipment.
In the fourth quarter of 2012, the Company reorganized the reporting units under CFP and Water &Wastewater (“Water”) reporting units within the Fluid & Metering Technologies segment. The DDPT reportingunit was created to focus on the product technology platform around our core diaphragm and dosing pumps andwill consist of Knight and Pulsafeeder from the Water reporting unit and Trebor and Warren Rupp from the CFPreporting unit. The WST reporting unit was created to focus on services provided to end customers in themunicipal end markets and will include ADS, IETG, and iPEK from the Water reporting unit. The remainingbusiness units in CFP will consist of Viking and Richter.
IDEX believes that each of its reporting units is a leader in its product and service areas. The Company alsobelieves that its strong financial performance has been attributable to its ability to design and engineerspecialized quality products, coupled with its ability to identify and successfully consummate and integratestrategic acquisitions.
FLUID & METERING TECHNOLOGIES SEGMENT
The Fluid & Metering Technologies Segment designs, produces and distributes positive displacementpumps, flow meters, injectors, and other fluid-handling pump modules and systems and provides flowmonitoring and other services for the water and wastewater industries. Fluid & Metering Technologiesapplication-specific pump and metering solutions serve a diverse range of end markets, including industrialinfrastructure (fossil fuels, refined & alternative fuels, and water & wastewater), chemical processing,agricultural, food & beverage, pulp & paper, transportation, plastics and resins, electronics and electrical,construction & mining, pharmaceutical and bio-pharmaceutical, machinery and numerous other specialty nichemarkets. Fluid & Metering Technologies accounted for 43% of IDEX’s sales and 82% of IDEX’s operatingincome in 2012, with approximately 46% of its sales to customers outside the U.S.
Banjo. Banjo is a provider of special purpose, severe-duty pumps, valves, fittings and systems used inliquid handling. Banjo is based in Crawfordsville, Indiana and its products are used in agricultural and industrialapplications. Approximately 11% of Banjo’s 2012 sales were to customers outside the U.S.
Energy & Fuels. Energy consists of the Company’s Corken, Faure Herman, Liquid Controls, S.A.M.P.I.and Toptech businesses. Energy is a leading supplier of flow meters, electronic registration and control products,rotary vane and turbine pumps, reciprocating piston compressors, and terminal automation control systems.Headquartered in Lake Bluff, Illinois (Liquid Controls and Sponsler products), Energy has additional facilities inLongwood, Florida and Zwijndrech, Belgium (Toptech products); Oklahoma City, Oklahoma (Corken products);
1
La Ferté Bernard, France (Faure Herman products); and Altopascio, Italy (S.A.M.P.I. products). Applications forLiquid Controls and S.A.M.P.I. positive displacement flow meters, electronic, registration and control productsinclude mobile and stationary metering installations for wholesale and retail distribution of petroleum andliquefied petroleum gas, aviation refueling, and industrial metering and dispensing of liquids and gases. Corkenproducts consist of positive-displacement rotary vane pumps, single and multistage regenerative turbine pumps,and small horsepower reciprocating piston compressors. Toptech supplies terminal automation hardware andsoftware to control and manage inventories, as well as transactional data and invoicing, to customers in the oil,gas and refined-fuels markets. Faure Herman is a leading supplier of ultrasonic and helical turbine flow metersused in the custody transfer and control of high value fluids and gases. Approximately 53% of Energy’s 2012sales were to customers outside the U.S.
Chemical, Food & Process. CFP consists of the Company’s Richter and Viking businesses. CFP is aproducer of fluoroplastic lined corrosion-resistant magnetic drive and mechanical seal pumps, shut-off, controland safety valves for corrosive, hazardous, contaminated, pure and high-purity fluids, as well as rotary internalgear, external gear, vane and rotary lobe pumps, custom-engineered OEM pumps, strainers, gear reducers andengineered pump systems. Richter’s corrosion resistant fluoroplastic lined products offer superior solutions fordemanding applications in the process industry. Viking’s products consist of external gear pumps, strainers andreducers, and related controls used for transferring and metering thin and viscous liquids sold under the Viking®and Wright Flow brands. Viking products primarily serve the chemical, petroleum, pulp & paper, plastics, paints,inks, tanker trucks, compressor, construction, food & beverage, personal care, pharmaceutical and biotechmarkets. CFP maintains operations in Kempen, Germany (Richter products); Cedar Falls, Iowa (Richter andViking products); Eastbourne, East Sussex, England and Shannon, Ireland (Viking products). CFP primarily usesindependent distributors to market and sell its products. Approximately 54% of CFP’s 2012 sales were tocustomers outside the U.S.
Diaphragm & Dosing Pump Technology. DDPT consists of the Company’s Knight, Pulsafeeder, Treborand Warren Rupp businesses. DDPT is a leading provider of ultra-pure chemical pumps, liquid heating systems,air-operated and natural gas-operated double diaphragm pumps, high-pressure pumps, alloy and non-metallicgear pumps, centrifugal pumps, special purpose rotary pumps, peristaltic pumps, transfer pumps, as well asdispensing equipment for industrial laundries, commercial dishwashing and chemical metering. Knight is aleading manufacturer of pumps and dispensing equipment for industrial laundries, commercial dishwashing andchemical metering. Pulsafeeder products (which also include OBL products) are used to introduce preciseamounts of fluids into processes to manage water quality and chemical composition, as well as peristaltic pumps.Its markets include water and wastewater treatment, oil and gas, power generation, pulp and paper, chemical andhydrocarbon processing, and swimming pools. Trebor is a leader in high-purity fluid handling products,including air-operated diaphragm pumps and deionized water-heating systems. Trebor products are used inmanufacturing of semiconductors, disk drives and flat panel displays. Warren Rupp products (which also includePumper Parts and Versa-Matic products) are used for abrasive and semisolid materials as well as for applicationswhere product degradation is a concern or where electricity is not available or should not be used. Warren Ruppproducts primarily serve the chemical, paint, food processing, electronics, construction, utilities, mining andindustrial maintenance markets. DDPT maintains operations in Salt Lake City, Utah (Trebor products);Mansfield, Ohio (Warren Rupp products); Rochester, New York, Punta Gorda, Florida and Milan, Italy(Pulsafeeder products); Lake Forest, California, Mississauga, Ontario, Canada, Eastbourne, East Sussex,England, and Unanderra, Australia (Knight products); and a maquiladora in Ciudad Juarez, Chihuahua, Mexico(Knight products). Approximately 47% of DDPT’s 2012 sales were to customers outside the U.S.
Water Services & Technology. WST consists of the Company’s ADS, IETG and iPEK businesses. WST isa leading provider of metering technology and flow monitoring products and underground surveillance servicesfor wastewater markets. ADS’s products and services provide comprehensive integrated solutions that enableindustry, municipalities and government agencies to analyze and measure the capacity, quality and integrity ofwastewater collection systems, including the maintenance and construction of such systems. IETG’s products andservices enable water companies to effectively manage their water distribution and sewerage networks, while its
2

surveillance service specializes in underground asset detection and mapping for utilities and other privatecompanies. iPEK supplies remote controlled systems used for infrastructure inspection. WST maintainsoperations in Huntsville, Alabama and various other locations in the United States and Australia (ADS productsand services); Leeds, England (IETG products and services); and Hirschegg, Austria, and Sulzberg, Germany(iPEK products). Approximately 40% of WST’s 2012 sales were to customers outside the U.S.
HEALTH & SCIENCE TECHNOLOGIES SEGMENT
The Health & Science Technologies Segment designs, produces and distributes a wide range of precisionfluidics, rotary lobe pumps, centrifugal and positive displacement pumps, roll compaction and drying systemsused in beverage, food processing, pharmaceutical and cosmetics, pneumatic components and sealing solutions,including very high precision, low-flow rate pumping solutions required in analytical instrumentation, clinicaldiagnostics and drug discovery, high performance molded and extruded, biocompatible medical devices andimplantables, air compressors used in medical, dental and industrial applications, optical components andcoatings for applications in the fields of scientific research, defense, aerospace, telecommunications andelectronics manufacturing, laboratory and commercial equipment used in the production of micro and nano scalematerials, precision photonic solutions used in life sciences, research and defense markets, and precision gear andperistaltic pump technologies that meet exacting original equipment manufacturer specifications. The segmentaccounted for 35% of IDEX’s sales and (35)% of operating income in 2012, with approximately 54% of its salesto customers outside the U.S.
IDEX Health & Science. IH&S consists of Eastern Plastics, Rheodyne, Ismatec, Sapphire Engineering,Upchurch Scientific and ERC, which was acquired in April 2012. IH&S has facilities in Rohnert Park, California(Rheodyne products); Bristol, Connecticut (Eastern Plastics products); Wertheim-Mondfeld, Germany (Ismatecproducts); Middleboro, Massachusetts (Sapphire Engineering products); Oak Harbor, Washington (Ismatec andUpchurch Scientific products); and Kawaguchi, Japan (ERC products). Eastern Plastics products, which consistof high- precision integrated fluidics and associated engineered plastics solutions, are used in a broad set of endmarkets including medical diagnostics, analytical instrumentation, and laboratory automation. Rheodyneproducts consist of injectors, valves, fittings and accessories for the analytical instrumentation market. Rheodyneproducts are used by manufacturers of high pressure liquid chromatography equipment servicing thepharmaceutical, biotech, life science, food & beverage, and chemical markets. Ismatec products includeperistaltic metering pumps, analytical process controllers, and sample preparation systems. Sapphire Engineeringand Upchurch Scientific products consist of fluidic components and systems for the analytical, biotech anddiagnostic instrumentation markets, such as fittings, precision-dispensing pumps and valves, tubing andintegrated tubing assemblies, filter sensors and other micro-fluidic and nano-fluidic components, as well asadvanced column hardware and accessories for the high performance liquid chromatography (“HPLC”) market.Sapphire Engineering and Upchurch Scientific products primarily serve the pharmaceutical, drug discovery,chemical, biochemical processing, genomics/proteomics research, environmental labs, food/agriculture, medicallab, personal care, and plastics/polymer/rubber production markets. ERC manufactures gas liquid separations anddetection solutions for the life science, analytical instrumentation and clinical chemistry markets. ERC’s productsconsist of in-line membrane vacuum degassing solutions, refractive index detectors and ozone generationsystems. Approximately 52% of IH&S’s 2012 sales were to customers outside the U.S.
IDEX Optics and Photonics. IOP consists of CVI Melles Griot (“CVI MG”), Semrock and AT Films (thePrecision Photonics portion of the AT Films business was acquired in April 2012). CVI MG is a global leader inthe design and manufacture of precision photonic solutions used in the life sciences, research, semiconductor,security and defense markets. CVI MG’s innovative products are focused on the generation, control andproductive use of light for a variety of key science and industrial applications. Products consist of specialty lasersand light sources, electro-optical components, specialty shutters, opto-mechanical assemblies and components. Inaddition, CVI MG produces critical components for life science research, electronics manufacturing, military andother industrial applications including lenses, mirrors, filters and polarizers. These components are utilized in anumber of important applications such as spectroscopy, cytometry (cell counting), guidance systems for target
3
designation, remote sensing, menology and optical lithography. CVI MG is headquartered in Albuquerque, NewMexico, with additional manufacturing sites located in Carlsbad, California; Rochester, New York; Isle of Man,British Isles; Leicester, England; Kyongki-Do, Korea; Tokyo, Japan; Didam, The Netherlands; and Singapore.Semrock is a provider of optical filters for biotech and analytical instrumentation in the life sciences markets.Semrock’s optical filters are produced using state-of-the-art manufacturing processes which enable it to offer itscustomers significant improvements in instrument performance and reliability. Semrock is located in Rochester,New York. AT Films specializes in optical components and coatings for applications in the fields of scientificresearch, defense, aerospace, telecommunications and electronics manufacturing. AT Films’ core competence isthe design and manufacture of filters, splitters, reflectors and mirrors with the precise physical propertiesrequired to support their customers’ most challenging and cutting-edge optical applications. The PrecisionPhotonics portion of its business specializes in optical components and coatings for applications in the fields ofscientific research, aerospace, telecommunications and electronics manufacturing. AT Films is headquartered inBoulder, Colorado. Approximately 57% of IOP’s 2012 sales were to customers outside the U.S.
Containment. Containment consists of Precision Polymer Engineering (“PPE”). PPE, which is located inBlackburn, England, is a provider of proprietary high performance seals and advanced sealing solutions for adiverse range of global industries and applications, including hazardous duty, analytical instrumentation,semiconductor/solar, process technologies, pharmaceutical, electronics, and food applications. Approximately79% of PPE’s 2012 sales were to customers outside the U.S.
Gast. Gast consists of the Company’s Gast and Jun-Air businesses. The Gast business is a leadingmanufacturer of air-moving products, including air motors, low-range and medium-range vacuum pumps,vacuum generators, regenerative blowers and fractional horsepower compressors. Gast products are used in avariety of long-life applications requiring a quiet, clean source of moderate vacuum or pressure. Gast productsprimarily serve the medical equipment, environmental equipment, computers and electronics, printingmachinery, paint mixing machinery, packaging machinery, graphic arts, and industrial manufacturing markets.The Jun-Air business is a provider of low-decibel, ultra-quiet vacuum compressors suitable for medical, dentaland laboratory applications. Based in Benton Harbor, Michigan, Gast also has a logistics and commercial centerin Redditch, England. Approximately 27% of Gast’s 2012 sales were to customers outside the U.S.
Micropump. Micropump, headquartered in Vancouver, Washington, is a leader in small, precision-engineered, magnetically and electromagnetically driven rotary gear, piston and centrifugal pumps. Micropumpproducts are used in low-flow abrasive and corrosive applications. Micropump products primarily serve theprinting machinery, medical equipment, paints and inks, chemical processing, pharmaceutical, refining,laboratory, electronics, pulp and paper, water treatment, textiles, peristaltic metering pumps, analytical processcontrollers and sample preparation systems markets. Approximately 77% of Micropump’s 2012 sales were tocustomers outside the U.S.
Materials Process Technologies. MPT consists of Quadro, Fitzpatrick, Microfluidics and Matcon GroupLimited (“Matcon”), which was acquired in July 2012. Quadro is a leading provider of particle control solutionsfor the pharmaceutical and bio-pharmaceutical markets. Based in Waterloo, Ontario, Canada, Quadro’s corecapabilities include fine milling, emulsification and special handling of liquid and solid particulates forlaboratory, pilot phase and production scale processing within the pharmaceutical and bio-pharmaceuticalmarkets. Fitzpatrick is a global leader in the design and manufacture of process technologies for thepharmaceutical, food and personal care markets. Fitzpatrick designs and manufactures customized size reduction,roll compaction and drying systems to support their customers’ product development and manufacturingprocesses. Fitzpatrick is headquartered in Elmhurst, Illinois. Microfluidics is a global leader in the design andmanufacture of laboratory and commercial equipment used in the production of micro and nano scale materialsfor the pharmaceutical and chemical markets. Microfluidics is the exclusive producer of the Microfluidizer®family of high shear fluid processors for uniform particle size reduction, robust cell disruption and nanoparticlecreation. Microfluidics has offices in Newton, Massachusetts. Matcon is a global leader in material processingsolutions for high value powders used in the manufacture of pharmaceuticals, food, plastics, and fine chemicals.
4
Matcon’s innovative products consist of the original cone valve powder discharge system and filling, mixing andpackaging systems, all of which support its customers’ automation and process requirements. Matcon’s productsare critical to its customers’ need to maintain clean, reliable and repeatable formulations of prepackaged foodsand pharmaceuticals while helping them achieve lean and agile manufacturing. Matcon is located in Evesham,Worcestershire, England. Approximately 61% of MPT’s 2012 sales were to customers outside the U.S.
FIRE & SAFETY/DIVERSIFIED PRODUCTS SEGMENT
The Fire & Safety/Diversified Products segment produces firefighting pumps and controls, rescue tools,lifting bags and other components and systems for the fire and rescue industry, engineered stainless steel bandingand clamping devices used in a variety of industrial and commercial applications, and precision equipment fordispensing, metering and mixing colorants and paints used in a variety of retail and commercial businessesaround the world. The segment accounted for 22% of IDEX’s sales and 53% of IDEX’s operating income in2012, with approximately 56% of its sales to customers outside the U.S.
Fire Suppression. Fire Suppression consists of the Company’s Class 1, Hale and Godiva businesses,which produce truck-mounted and portable fire pumps, stainless steel valves, foam and compressed air foamsystems, pump modules and pump kits, electronic controls and information systems, conventional and networkedelectrical systems, and mechanical components for the fire, rescue and specialty vehicle markets. FireSuppression’s customers are primarily OEMs. Fire Suppression is headquartered in Ocala, Florida (Class 1 andHale products), with additional facilities located in Warwick, England (Godiva products). Approximately 41% ofFire Suppression’s 2012 sales were to customers outside the U.S.
Rescue. Rescue consists of the Company’s Dinglee, Hurst Jaws of Life, Lukas and Vetter businesses,which produce hydraulic, battery, gas and electric-operated rescue equipment, hydraulic re-railing equipment,hydraulic tools for industrial applications, recycling cutters, pneumatic lifting and sealing bags for vehicle andaircraft rescue, environmental protection and disaster control, and shoring equipment for vehicular or structuralcollapse. Rescue Tool’s customers are primarily public and private fire and rescue organizations. Rescue hasfacilities in Shelby, North Carolina (Hurst Jaws of Life products); Tianjin, China (Dinglee products); Erlangen,Germany (Lukas products); and Zulpich, Germany (Vetter products). Approximately 75% of Rescue’s 2012 saleswere to customers outside the U.S.
Band-It. Band-It is a leading producer of high-quality stainless steel banding, buckles and clampingsystems. The BAND-IT® brand is highly recognized worldwide. Band-It products are used for securing exhaustsystem heat and sound shields, industrial hose fittings, traffic signs and signals, electrical cable shielding,identification and bundling, and in numerous other industrial and commercial applications. Band-It productsprimarily serve the automotive, transportation equipment, oil and gas, general industrial maintenance,electronics, electrical, communications, aerospace, utility, municipal and subsea marine markets. Band-It is basedin Denver, Colorado, with additional operations in Staveley, Derbyshire, England, and a IDEX sharedmanufacturing facility in China. Approximately 39% of Band-It’s 2012 sales were to customers outside the U.S.
Dispensing Equipment. Dispensing Equipment produces precision equipment for dispensing, metering andmixing colorants and paints used in a variety of retail and commercial businesses around the world. DispensingEquipment is a global supplier of precision-designed tinting, mixing, dispensing and measuring equipment forauto refinishing and architectural paints. Dispensing Equipment products are used in retail and commercialstores, hardware stores, home centers, department stores, automotive body shops as well as point-of-purchasedispensers. Dispensing Equipment is headquartered in Wheeling, Illinois with additional facilities in Sassenheim,The Netherlands; Unanderra, Australia; and Milan, Italy, as well as IDEX shared manufacturing facilities in Indiaand China. Approximately 59% of Dispensing Equipment’s 2012 sales were to customers outside the U.S.
5
INFORMATION APPLICABLE TO THE COMPANY’S BUSINESS IN GENERAL AND ITSSEGMENTS
Competitors
The Company’s businesses participate in highly competitive markets. IDEX believes that the principalpoints of competition are product quality, price, design and engineering capabilities, product development,conformity to customer specifications, quality of post-sale support, timeliness of delivery, and effectiveness ofour distribution channels.
Principal competitors of the Fluid & Metering Technologies Segment are the Pump Solutions Group (Maag,Blackmer and Wilden products) of Dover Corporation (with respect to pumps and small horsepower compressorsused in liquified petroleum gas distribution facilities, rotary gear pumps, and air-operated double-diaphragmpumps); Milton Roy (with respect to metering pumps and controls); and Tuthill Corporation (with respect torotary gear pumps).
Principal competitors of the Health & Science Technologies Segment are the Thomas division of GardnerDenver, Inc. (with respect to vacuum pumps and compressors); Thermo Scientific Dionex products (with respectto analytical instrumentation); Parker Hannifin (with respect to sealing devices); Valco Instruments Co., Inc.(with respect to fluid injectors and valves); and Gooch & Housego PLC (with respect to electro-optic andprecision photonics solutions used in the life sciences market).
The principal competitors of the Fire & Safety/Diversified Products Segment are Waterous Company, a unitof American Cast Iron Pipe Company (with respect to truck-mounted firefighting pumps), Holmatro, Inc. (withrespect to rescue), CPS Color Group Oy, which is owned by Nordic Capital (with respect to dispensing andmixing equipment for the paint industry) and Panduit Corporation (with respect to stainless steel bands, bucklesand tools).
Employees
At December 31, 2012, the Company had 6,717 employees. Approximately 8% of employees wererepresented by labor unions, with various contracts expiring through June 2015. Management believes that theCompany’s relationship with its employees is good. The Company historically has been able to renegotiate itscollective bargaining agreements satisfactorily, with its last work stoppage in March 1993.
Suppliers
The Company manufactures many of the parts and components used in its products. Substantially allmaterials, parts and components purchased by the Company are available from multiple sources.
Inventory and Backlog
The Company regularly and systematically adjusts production schedules and quantities based on the flow ofincoming orders. Backlogs typically are limited to one to one and a half months of production. While totalinventory levels also may be affected by changes in orders, the Company generally tries to maintain relativelystable inventory levels based on its assessment of the requirements of the various industries served.
Raw Materials
The Company uses a wide variety of raw materials which are generally available from a number of sources.As a result, shortages from any single supplier have not had, and are not likely to have a material impact onoperations.
6
Shared Services
The Company has production facilities in Suzhou, China and Vadodara, India that support multiple businessunits. IDEX also has personnel in China, India and Singapore that provide sales and marketing, product design andengineering, and sourcing support to its business units, as well as personnel in various locations in Europe, SouthAmerica, the Middle East and Japan to support sales and marketing efforts of IDEX businesses in those regions.
Segment Information
For segment financial information for the years 2012, 2011, and 2010, see, “Management’s Discussion andAnalysis of Financial Condition and Results of Operations” and Note 11 of the Notes to Consolidated FinancialStatements in Part II, Item 8, “Financial Statements and Supplementary Data.”
Executive Officers of the Registrant
Set forth below are the names of the executive officers of the Company, their ages, years of service, thepositions held by them, and their business experience during the past 5 years.
Name AgeYears ofService Position
Andrew K. Silvernail . . . . . . . . 42 4 Chairman of the Board, President and Chief Executive OfficerHeath A. Mitts . . . . . . . . . . . . . . 42 7 Vice President and Chief Financial OfficerFrank J. Notaro . . . . . . . . . . . . . 49 15 Vice President-General Counsel and SecretaryDaniel J. Salliotte . . . . . . . . . . . 46 8 Vice President-Mergers, Acquisitions and TreasuryMichael J. Yates . . . . . . . . . . . . 47 7 Vice President and Chief Accounting Officer
Mr. Silvernail has served as Chief Executive Officer since August 2011 and as Chairman of the Board sinceJanuary 2012. Prior to that, Mr. Silvernail was Vice President-Group Executive Health & Science Technologies,Global Dispensing and Fire & Safety/Diversified Products since January 2011. From February 2010 to December2010, Mr. Silvernail was Vice President-Group Executive Health & Sciences Technologies and GlobalDispensing. Mr. Silvernail joined IDEX in January 2009 as Vice President-Group Executive Health & ScienceTechnologies. Prior to joining IDEX, Mr. Silvernail served as Group President at Rexnord Industries from April2005 to August 2008.
Mr. Mitts has served as Vice President and Chief Financial Officer since March 2011. Mr. Mitts was hiredas Vice President-Corporate Finance in September 2005.
Mr. Notaro has served as Vice President-General Counsel and Secretary since March 1998.
Mr. Salliotte has served as Vice President-Mergers, Acquisitions and Treasury since February 2011.Mr. Salliotte joined IDEX in October 2004 as Vice President-Strategy and Business Development.
Mr. Yates has served as Vice-President and Chief Accounting Officer since February 2010. Mr. Yates washired as Vice President-Controller in October 2005.
The Company’s executive officers are elected at a meeting of the Board of Directors immediately followingthe annual meeting of stockholders, and they serve until the next annual meeting of the Board, or until theirsuccessors are duly elected and qualified or their death, resignation or removal.
Public Filings
Copies of the Company’s annual report on Form 10-K, quarterly reports on Form 10-Q, current reports onForm 8-K and amendments to those reports are made available free of charge at www.idexcorp.com as soon asreasonably practicable after being filed electronically with the SEC. Our reports are also available free of charge onthe SEC’s website, www.sec.gov. Information on the Company’s website is not incorporated into this Form 10-K.
7

Item 1A. Risk Factors.
For an enterprise as diverse and complex as the Company, a wide range of factors present risks to theCompany and could materially affect future developments and performance. In addition to the factors affectingspecific business operations identified in connection with the description of our operations and the financialresults of our operations elsewhere in this report, the most significant of these factors are as follows:
Changes in U.S. or International Economic Conditions Could Adversely Affect the Revenues andProfitability of Any of Our Businesses.
In 2012, 49% of the Company’s revenue was derived from domestic operations while 51% was derivedfrom international operations. The Company’s largest end markets include life sciences and medicaltechnologies, fire and rescue, petroleum LPG, paint and coatings, chemical processing, water and wastewatertreatment and optical filters and components. A slowdown in the U.S. or global economy and in particular any ofthese specific end markets could reduce the Company’s revenues and profitability.
Conditions in Foreign Countries in Which We Operate Could Adversely Affect Our Business.
In 2012, approximately 51% of our total sales were to customers outside the U.S. We expect ourinternational operations and export sales to continue to be significant for the foreseeable future. Our sales frominternational operations and our sales from export are both subject in varying degrees to risks inherent in doingbusiness outside the United States. These risks include the following:
• possibility of unfavorable circumstances arising from host country laws or regulations;
• risks of economic instability;
• currency exchange rate fluctuations and restrictions on currency repatriation;
• potential negative consequences from changes to taxation policies;
• disruption of operations from labor and political disturbances;
• changes in tariff and trade barriers and import or export licensing requirements; and,
• insurrection or war.
Any of these events could have an adverse impact on our business and operations.
Our Inability to Continue to Develop New Products Could Limit Our Revenue Growth.
The Company’s revenue grew 3% organically in 2012 and 9% in 2011. Approximately 14% of our revenuewas derived from new products developed over the past three years. Our ability to continue to grow organically istied in large part to our ability to continue to develop new products.
Our Growth Strategy Includes Acquisitions and We May Not be Able to Make Acquisitions of SuitableCandidates or Integrate Acquisitions Successfully.
Our historical growth has included, and our future growth is likely to continue to include acquisitions. Weintend to continue to seek acquisition opportunities both to expand into new markets and to enhance our positionin existing markets throughout the world. We may not be able to successfully identify suitable candidates,negotiate appropriate acquisition terms, obtain financing needed to consummate those acquisitions, completeproposed acquisitions or successfully integrate acquired businesses into our existing operations. In addition, anyacquisition, once successfully integrated, may not perform as planned, be accretive to earnings, or provebeneficial to us.
8
Acquisitions involve numerous risks, including the assumption of undisclosed or unindemnified liabilities,difficulties in the assimilation of the operations, technologies, services and products of the acquired companiesand the diversion of management’s attention from other business concerns. In addition, prior acquisitions haveresulted, and future acquisitions could result, in the incurrence of substantial additional indebtedness and otherexpenses.
The Markets We Serve are Highly Competitive and this Competition Could Reduce our Sales and OperatingMargins.
Most of our products are sold in competitive markets. Maintaining and improving our competitive positionwill require continued investment by us in manufacturing, engineering, quality standards, marketing, customerservice and support, and our distribution networks. We may not be successful in maintaining our competitiveposition. Our competitors may develop products that are superior to our products, or may develop methods ofmore efficiently and effectively providing products and services or may adapt more quickly than us to newtechnologies or evolving customer requirements. Pricing pressures may require us to adjust the prices of ourproducts to stay competitive. We may not be able to compete successfully with our existing competitors or withnew competitors. Failure to continue competing successfully could reduce our revenues, operating margins andoverall financial performance.
We are Dependent on the Availability of Raw Materials, Parts and Components Used in Our Products.
While we manufacture certain parts and components used in our products, we require substantial amounts ofraw materials and purchase some parts and components from suppliers. The availability and prices for rawmaterials, parts and components may be subject to curtailment or change due to, among other things, suppliers’allocations to other purchasers, interruptions in production by suppliers, changes in exchange rates and prevailingprice levels. Any change in the supply of, or price for, these raw materials or parts and components couldmaterially affect our business, financial condition, results of operations and cash flow.
Significant Movements in Foreign Currency Exchange Rates May Harm Our Financial Results.
We are exposed to fluctuations in foreign currency exchange rates, particularly with respect to the Euro,Canadian Dollar, British Pound and Chinese Renminbi. Any significant change in the value of the currencies ofthe countries in which we do business against the U.S. Dollar could affect our ability to sell productscompetitively and control our cost structure, which could have a material adverse effect on our results ofoperations. For additional detail related to this risk, see Part II, Item 7A, “Quantitative and Qualitative DisclosureAbout Market Risk.”
An Unfavorable Outcome of Any of Our Pending Contingencies or Litigation Could Adversely Affect Us.
We currently are involved in legal and regulatory proceedings. Where it is reasonably possible to do so, weaccrue estimates of the probable costs for the resolution of these matters. These estimates are developed inconsultation with outside counsel and are based upon an analysis of potential results, assuming a combination oflitigation and settlement strategies. It is possible, however, that future operating results for any particular quarteror annual period could be materially affected by changes in our assumptions or the effectiveness of our strategiesrelated to these proceedings. For additional detail related to this risk, see Item 3. “Legal Proceedings.”
Our Intangible Assets, Including Goodwill, are a Significant Portion of Our Total Assets and a Write-off ofOur Intangible Assets Would Adversely Impact Our Operating Results and Significantly Reduce Our NetWorth.
Our total assets reflect substantial intangible assets, primarily goodwill and identifiable intangible assets. AtDecember 31, 2012, goodwill and intangible assets totaled $1,321.7 million and $341.4 million, respectively.These assets result from our acquisitions, representing the excess of cost over the fair value of the tangible net
9

assets we have acquired. Annually, or when certain events occur that require a more current valuation, we assesswhether there has been an impairment in the value of our goodwill and identifiable intangible assets. If futureoperating performance at one or more of our reporting units were to fall significantly below forecast levels, wecould be required to reflect, under current applicable accounting rules, a non-cash charge to operating income foran impairment. Any determination requiring the write-off of a significant portion of our goodwill or identifiableintangible assets would adversely impact our results of operations and net worth. In accordance with AccountingStandards Codification (“ASC”) No. 350, the Company concluded that a significant non-cash impairment chargeof $198.5 million was required in the fourth quarter of 2012 to reduce the carrying value of goodwill andintangible assets within the IOP platform and goodwill and long-lived assets within the WST platform. SeeNote 4 in Part II, Item 8, Financial Statements and Supplementary Data for further discussion on goodwill andintangible assets.
Item 1B. Unresolved Staff Comments.
None.
Item 2. Properties.
The Company’s principal plants and offices have an aggregate floor space area of approximately 4.3 millionsquare feet, of which 2.8 million square feet (65%) is located in the U.S. and approximately 1.5 million squarefeet (35%) is located outside the U.S., primarily in Germany (8%), the U.K. (7%), China (4%) and TheNetherlands (2%). Management considers these facilities suitable and adequate for their operations. Managementbelieves the Company can meet the expected demand increase over the near term with its existing facilities,especially given its operational improvement initiatives that usually increase capacity. The Company’s executiveoffice occupies 36,588 square feet of leased space in Lake Forest, Illinois.
Approximately 2.8 million square feet (65%) of the principal plant and office floor area is owned by theCompany, and the balance is held under lease. Approximately 1.8 million square feet (42%) of the principal plantand office floor area is held by business units in the Fluid & Metering Technologies Segment; 1.3 million squarefeet (31%) is held by business units in the Health & Science Technologies Segment; and 1.0 million square feet(23%) is held by business units in the Fire & Safety/Diversified Products Segment.
Item 3. Legal Proceedings.
The Company and six of its subsidiaries are presently named as defendants in a number of lawsuits claimingvarious asbestos-related personal injuries and seeking money damages, allegedly as a result of exposure toproducts manufactured with components that contained asbestos. These components were acquired from thirdparty suppliers, and were not manufactured by any of the subsidiaries. To date, the majority of the Company’ssettlements and legal costs, except for costs of coordination, administration, insurance investigation and a portionof defense costs, have been covered in full by insurance subject to applicable deductibles. However, theCompany cannot predict whether and to what extent insurance will be available to continue to cover suchsettlements and legal costs, or how insurers may respond to claims that are tendered to them. Claims have beenfiled in jurisdictions throughout the United States. Most of the claims resolved to date have been dismissedwithout payment. The balance have been settled for various insignificant amounts. Only one case has been tried,resulting in a verdict for the affected business unit. No provision has been made in the financial statements of theCompany for these asbestos-related claims, other than for insurance deductibles in the ordinary course, and theCompany does not currently believe these claims will have a material adverse effect on it.
The Company is also party to various other legal proceedings arising in the ordinary course of business,none of which is expected to have a material adverse effect on it.
Item 4. Mine Safety Disclosures
Not applicable.
10
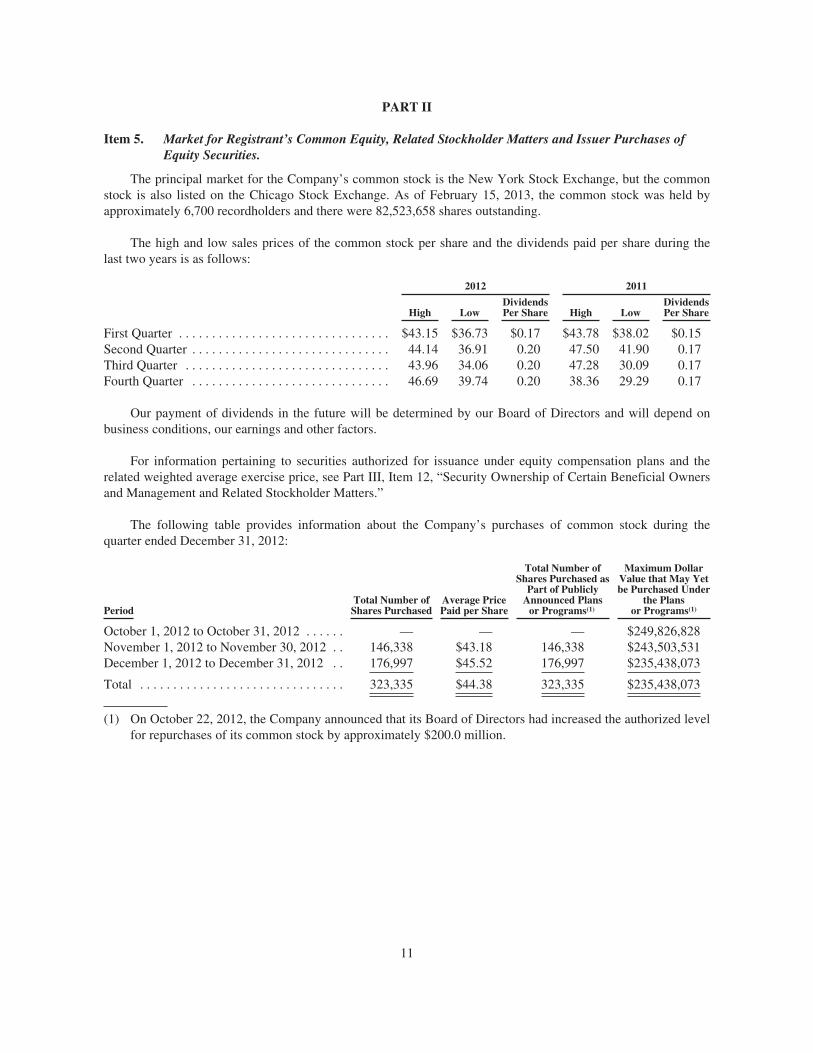
PART II
Item 5. Market for Registrant’s Common Equity, Related Stockholder Matters and Issuer Purchases ofEquity Securities.
The principal market for the Company’s common stock is the New York Stock Exchange, but the commonstock is also listed on the Chicago Stock Exchange. As of February 15, 2013, the common stock was held byapproximately 6,700 recordholders and there were 82,523,658 shares outstanding.
The high and low sales prices of the common stock per share and the dividends paid per share during thelast two years is as follows:
2012 2011
High LowDividendsPer Share High Low
DividendsPer Share
First Quarter . . . . . . . . . . . . . . . . . . . . . . . . . . . . . . . . $43.15 $36.73 $0.17 $43.78 $38.02 $0.15Second Quarter . . . . . . . . . . . . . . . . . . . . . . . . . . . . . . 44.14 36.91 0.20 47.50 41.90 0.17Third Quarter . . . . . . . . . . . . . . . . . . . . . . . . . . . . . . . 43.96 34.06 0.20 47.28 30.09 0.17Fourth Quarter . . . . . . . . . . . . . . . . . . . . . . . . . . . . . . 46.69 39.74 0.20 38.36 29.29 0.17
Our payment of dividends in the future will be determined by our Board of Directors and will depend onbusiness conditions, our earnings and other factors.
For information pertaining to securities authorized for issuance under equity compensation plans and therelated weighted average exercise price, see Part III, Item 12, “Security Ownership of Certain Beneficial Ownersand Management and Related Stockholder Matters.”
The following table provides information about the Company’s purchases of common stock during thequarter ended December 31, 2012:
PeriodTotal Number ofShares Purchased
Average PricePaid per Share
Total Number ofShares Purchased as
Part of PubliclyAnnounced Plansor Programs(1)
Maximum DollarValue that May Yetbe Purchased Under
the Plansor Programs(1)
October 1, 2012 to October 31, 2012 . . . . . . — — — $249,826,828November 1, 2012 to November 30, 2012 . . 146,338 $43.18 146,338 $243,503,531December 1, 2012 to December 31, 2012 . . 176,997 $45.52 176,997 $235,438,073
Total . . . . . . . . . . . . . . . . . . . . . . . . . . . . . . . 323,335 $44.38 323,335 $235,438,073
(1) On October 22, 2012, the Company announced that its Board of Directors had increased the authorized levelfor repurchases of its common stock by approximately $200.0 million.
11
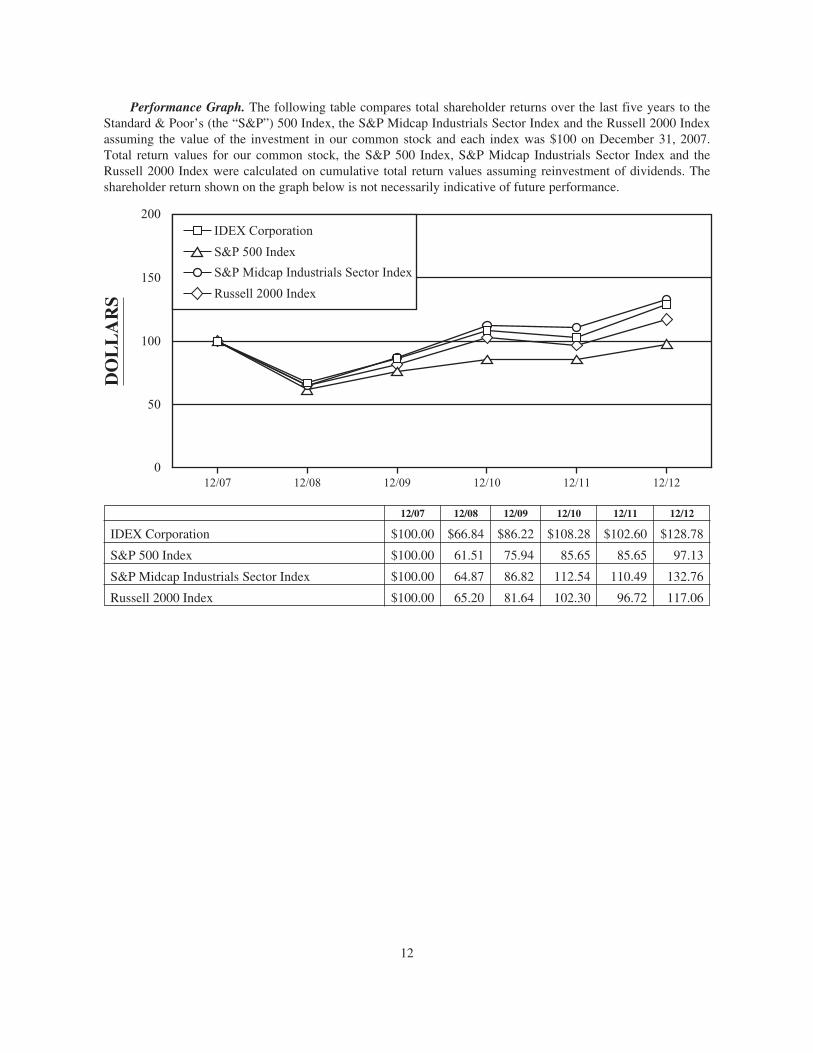
Performance Graph. The following table compares total shareholder returns over the last five years to theStandard & Poor’s (the “S&P”) 500 Index, the S&P Midcap Industrials Sector Index and the Russell 2000 Indexassuming the value of the investment in our common stock and each index was $100 on December 31, 2007.Total return values for our common stock, the S&P 500 Index, S&P Midcap Industrials Sector Index and theRussell 2000 Index were calculated on cumulative total return values assuming reinvestment of dividends. Theshareholder return shown on the graph below is not necessarily indicative of future performance.
12/07 12/08 12/09 12/10 12/11 12/120
50
100
150
200IDEX Corporation
S&P 500 Index
S&P Midcap Industrials Sector Index
Russell 2000 Index
DOLLARS
12/07 12/08 12/09 12/10 12/11 12/12
IDEX Corporation $100.00 $66.84 $86.22 $108.28 $102.60 $128.78
S&P 500 Index $100.00 61.51 75.94 85.65 85.65 97.13
S&P Midcap Industrials Sector Index $100.00 64.87 86.82 112.54 110.49 132.76
Russell 2000 Index $100.00 65.20 81.64 102.30 96.72 117.06
12
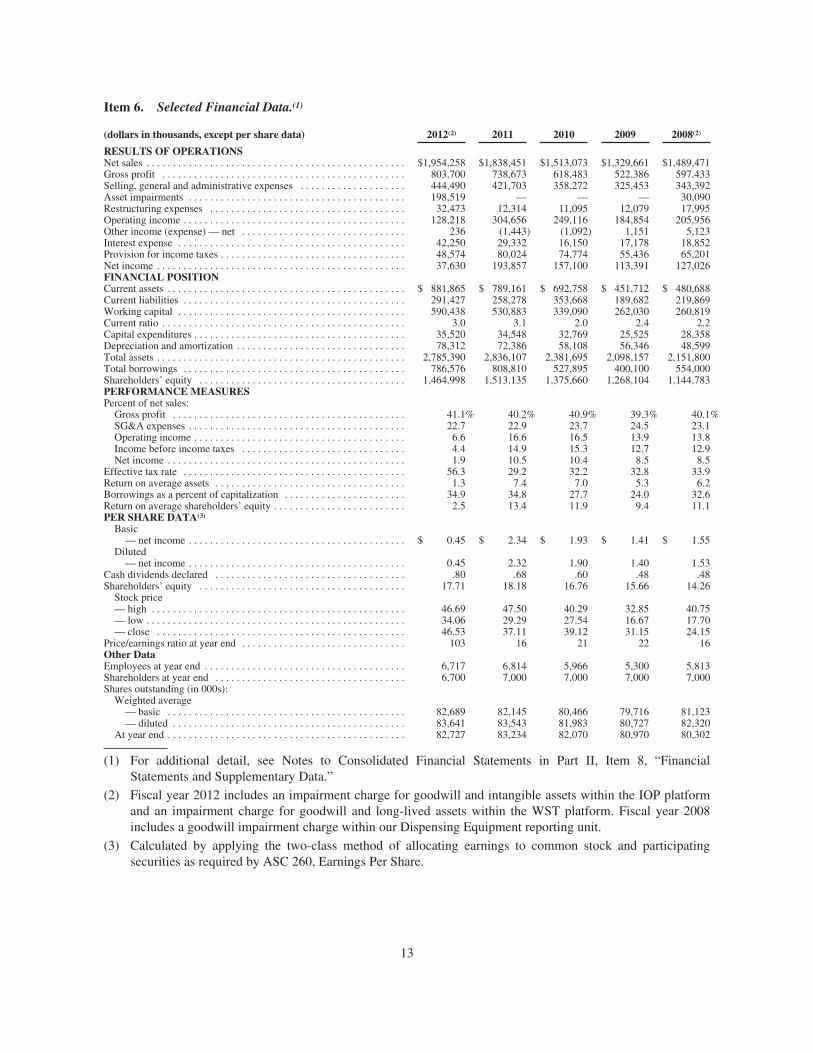
Item 6. Selected Financial Data.(1)
(dollars in thousands, except per share data) 2012(2) 2011 2010 2009 2008(2)
RESULTS OF OPERATIONSNet sales . . . . . . . . . . . . . . . . . . . . . . . . . . . . . . . . . . . . . . . . . . . . . . . . . $1,954,258 $1,838,451 $1,513,073 $1,329,661 $1,489,471Gross profit . . . . . . . . . . . . . . . . . . . . . . . . . . . . . . . . . . . . . . . . . . . . . . 803,700 738,673 618,483 522,386 597,433Selling, general and administrative expenses . . . . . . . . . . . . . . . . . . . . 444,490 421,703 358,272 325,453 343,392Asset impairments . . . . . . . . . . . . . . . . . . . . . . . . . . . . . . . . . . . . . . . . . 198,519 — — — 30,090Restructuring expenses . . . . . . . . . . . . . . . . . . . . . . . . . . . . . . . . . . . . . 32,473 12,314 11,095 12,079 17,995Operating income . . . . . . . . . . . . . . . . . . . . . . . . . . . . . . . . . . . . . . . . . . 128,218 304,656 249,116 184,854 205,956Other income (expense) — net . . . . . . . . . . . . . . . . . . . . . . . . . . . . . . . 236 (1,443) (1,092) 1,151 5,123Interest expense . . . . . . . . . . . . . . . . . . . . . . . . . . . . . . . . . . . . . . . . . . . 42,250 29,332 16,150 17,178 18,852Provision for income taxes . . . . . . . . . . . . . . . . . . . . . . . . . . . . . . . . . . . 48,574 80,024 74,774 55,436 65,201Net income . . . . . . . . . . . . . . . . . . . . . . . . . . . . . . . . . . . . . . . . . . . . . . . 37,630 193,857 157,100 113,391 127,026FINANCIAL POSITIONCurrent assets . . . . . . . . . . . . . . . . . . . . . . . . . . . . . . . . . . . . . . . . . . . . . $ 881,865 $ 789,161 $ 692,758 $ 451,712 $ 480,688Current liabilities . . . . . . . . . . . . . . . . . . . . . . . . . . . . . . . . . . . . . . . . . . 291,427 258,278 353,668 189,682 219,869Working capital . . . . . . . . . . . . . . . . . . . . . . . . . . . . . . . . . . . . . . . . . . . 590,438 530,883 339,090 262,030 260,819Current ratio . . . . . . . . . . . . . . . . . . . . . . . . . . . . . . . . . . . . . . . . . . . . . . 3.0 3.1 2.0 2.4 2.2Capital expenditures . . . . . . . . . . . . . . . . . . . . . . . . . . . . . . . . . . . . . . . . 35,520 34,548 32,769 25,525 28,358Depreciation and amortization . . . . . . . . . . . . . . . . . . . . . . . . . . . . . . . . 78,312 72,386 58,108 56,346 48,599Total assets . . . . . . . . . . . . . . . . . . . . . . . . . . . . . . . . . . . . . . . . . . . . . . . 2,785,390 2,836,107 2,381,695 2,098,157 2,151,800Total borrowings . . . . . . . . . . . . . . . . . . . . . . . . . . . . . . . . . . . . . . . . . . 786,576 808,810 527,895 400,100 554,000Shareholders’ equity . . . . . . . . . . . . . . . . . . . . . . . . . . . . . . . . . . . . . . . 1,464,998 1,513,135 1,375,660 1,268,104 1,144,783PERFORMANCE MEASURESPercent of net sales:Gross profit . . . . . . . . . . . . . . . . . . . . . . . . . . . . . . . . . . . . . . . . . . . . 41.1% 40.2% 40.9% 39.3% 40.1%SG&A expenses . . . . . . . . . . . . . . . . . . . . . . . . . . . . . . . . . . . . . . . . . 22.7 22.9 23.7 24.5 23.1Operating income . . . . . . . . . . . . . . . . . . . . . . . . . . . . . . . . . . . . . . . . 6.6 16.6 16.5 13.9 13.8Income before income taxes . . . . . . . . . . . . . . . . . . . . . . . . . . . . . . . 4.4 14.9 15.3 12.7 12.9Net income . . . . . . . . . . . . . . . . . . . . . . . . . . . . . . . . . . . . . . . . . . . . . 1.9 10.5 10.4 8.5 8.5
Effective tax rate . . . . . . . . . . . . . . . . . . . . . . . . . . . . . . . . . . . . . . . . . . 56.3 29.2 32.2 32.8 33.9Return on average assets . . . . . . . . . . . . . . . . . . . . . . . . . . . . . . . . . . . . 1.3 7.4 7.0 5.3 6.2Borrowings as a percent of capitalization . . . . . . . . . . . . . . . . . . . . . . . 34.9 34.8 27.7 24.0 32.6Return on average shareholders’ equity . . . . . . . . . . . . . . . . . . . . . . . . . 2.5 13.4 11.9 9.4 11.1PER SHARE DATA(3)
Basic— net income . . . . . . . . . . . . . . . . . . . . . . . . . . . . . . . . . . . . . . . . . $ 0.45 $ 2.34 $ 1.93 $ 1.41 $ 1.55
Diluted— net income . . . . . . . . . . . . . . . . . . . . . . . . . . . . . . . . . . . . . . . . . 0.45 2.32 1.90 1.40 1.53
Cash dividends declared . . . . . . . . . . . . . . . . . . . . . . . . . . . . . . . . . . . . .80 .68 .60 .48 .48Shareholders’ equity . . . . . . . . . . . . . . . . . . . . . . . . . . . . . . . . . . . . . . . 17.71 18.18 16.76 15.66 14.26Stock price— high . . . . . . . . . . . . . . . . . . . . . . . . . . . . . . . . . . . . . . . . . . . . . . . . 46.69 47.50 40.29 32.85 40.75— low . . . . . . . . . . . . . . . . . . . . . . . . . . . . . . . . . . . . . . . . . . . . . . . . . 34.06 29.29 27.54 16.67 17.70— close . . . . . . . . . . . . . . . . . . . . . . . . . . . . . . . . . . . . . . . . . . . . . . . 46.53 37.11 39.12 31.15 24.15
Price/earnings ratio at year end . . . . . . . . . . . . . . . . . . . . . . . . . . . . . . . 103 16 21 22 16Other DataEmployees at year end . . . . . . . . . . . . . . . . . . . . . . . . . . . . . . . . . . . . . . 6,717 6,814 5,966 5,300 5,813Shareholders at year end . . . . . . . . . . . . . . . . . . . . . . . . . . . . . . . . . . . . 6,700 7,000 7,000 7,000 7,000Shares outstanding (in 000s):Weighted average— basic . . . . . . . . . . . . . . . . . . . . . . . . . . . . . . . . . . . . . . . . . . . . . 82,689 82,145 80,466 79,716 81,123— diluted . . . . . . . . . . . . . . . . . . . . . . . . . . . . . . . . . . . . . . . . . . . . 83,641 83,543 81,983 80,727 82,320
At year end . . . . . . . . . . . . . . . . . . . . . . . . . . . . . . . . . . . . . . . . . . . . . 82,727 83,234 82,070 80,970 80,302
(1) For additional detail, see Notes to Consolidated Financial Statements in Part II, Item 8, “FinancialStatements and Supplementary Data.”
(2) Fiscal year 2012 includes an impairment charge for goodwill and intangible assets within the IOP platformand an impairment charge for goodwill and long-lived assets within the WST platform. Fiscal year 2008includes a goodwill impairment charge within our Dispensing Equipment reporting unit.
(3) Calculated by applying the two-class method of allocating earnings to common stock and participatingsecurities as required by ASC 260, Earnings Per Share.
13

Item 7. Management’s Discussion and Analysis of Financial Condition and Results of Operations.
Cautionary Statement Under the Private Securities Litigation Reform Act
This management’s discussion and analysis, including, but not limited to, the section entitled “2012Overview and Outlook”, and other portions of this report, contains forward-looking statements within themeaning of Section 27A of the Securities Act of 1933, as amended, and Section 21E of the Exchange Act of1934, as amended. These statements may relate to, among other things, capital expenditures, cost reductions,cash flow, and operating improvements and are indicated by words or phrases such as “anticipate,” “estimate,”“plans,” “expects,” “projects,” “should,” “will,” “management believes,” “the Company believes,” “we believe,”“the Company intends” and similar words or phrases. These statements are subject to inherent uncertainties andrisks that could cause actual results to differ materially from the results described in those statements. These risksand uncertainties include, but are not limited to, economic and political consequences resulting from terroristattacks and wars; levels of industrial activity and economic conditions in the U.S. and other countries around theworld; pricing pressures and other competitive factors, and levels of capital spending in certain industries — allof which could have a material impact on our order rates and results, particularly in light of the low levels oforder backlogs we typically maintain; our ability to make acquisitions and to integrate and operate acquiredbusinesses on a profitable basis; the relationship of the U.S. dollar to other currencies and its impact on pricingand cost competitiveness; political and economic conditions in foreign countries in which we operate; interestrates; capacity utilization and its effect on costs; labor markets; market conditions and material costs; anddevelopments with respect to contingencies, such as litigation and environmental matters. The forward-lookingstatements included in this report are only made as of the date of this report, and we undertake no obligation toupdate them to reflect subsequent events or circumstances. Investors are cautioned not to rely unduly on forward-looking statements when evaluating the information presented here.
2012 Overview and Outlook
IDEX is an applied solutions company specializing in fluid and metering technologies, health and sciencetechnologies, and fire, safety and other diversified products built to customer specifications. IDEX’s products aresold in niche markets to a wide range of industries throughout the world. Accordingly, our businesses areaffected by levels of industrial activity and economic conditions in the U.S. and in other countries where we dobusiness and by the relationship of the U.S. dollar to other currencies. Levels of capacity utilization and capitalspending in the industries that use our products and overall industrial activity are important factors that influencethe demand for our products.
The Company has three reportable business segments: Fluid & Metering Technologies, Health & ScienceTechnologies and Fire & Safety/Diversified Products. Within these three reportable segments, the Companymaintains six strategic platforms, where we will primarily invest organically and through acquisitions, and eightgroups, where we will primarily focus on organic growth to drive these businesses. The Fluid & MeteringTechnologies segment is comprised of the Energy, DDPT, and CFP platforms as well as the WST andAgricultural groups. The Health & Science Technologies segment is comprised of the IOP, Scientific Fluidicsand MPT platforms as well as the Containment and Industrial groups. The Fire & Safety/Diversified Productssegment is comprised of the Dispensing, Rescue, Band-It, and Fire Suppression groups.
The Fluid & Metering Technologies segment designs, produces and distributes positive displacementpumps, flow meters, injectors, and other fluid-handling pump modules and systems and provides flowmonitoring and other services for the food, chemical, general industrial, water and wastewater, agricultural andenergy industries. The Health & Science Technologies segment designs, produces and distributes a wide range ofprecision fluidics, rotary lobe pumps, centrifugal and positive displacement pumps, roll compaction and dryingsystems used in beverage, food processing, pharmaceutical and cosmetics, pneumatic components and sealingsolutions, including very high precision, low-flow rate pumping solutions required in analytical instrumentation,clinical diagnostics and drug discovery, high performance molded and extruded, biocompatible medical devicesand implantables, air compressors used in medical, dental and industrial applications, optical components and
14
coatings for applications in the fields of scientific research, defense, biotechnology, aerospace,telecommunications and electronics manufacturing, laboratory and commercial equipment used in the productionof micro and nano scale materials, precision photonic solutions used in life sciences, research and defensemarkets, and precision gear and peristaltic pump technologies that meet exacting original equipmentmanufacturer specifications. The Fire & Safety/Diversified Products segment produces firefighting pumps andcontrols, rescue tools, lifting bags and other components and systems for the fire and rescue industry, andengineered stainless steel banding and clamping devices used in a variety of industrial and commercialapplications, precision equipment for dispensing, metering and mixing colorants and paints used in a variety ofretail and commercial businesses around the world.
Some of our 2012 financial results are as follows:
• Sales of $1.95 billion rose 6%; organic sales — excluding acquisitions and foreign currencytranslation — were up 3%.
• Asset impairment charge recorded for $198.5 million.
• Operating income of $128.2 million decreased 58%.
• Net income decreased 81% to $37.6 million.
• Diluted EPS of $0.45 decreased $1.87 or 81% compared to 2011.
On a regional basis North America has remained strong, the Asian markets are improving and we seestabilization in Europe. For 2013, based on the Company’s current outlook, we are forecasting fully diluted EPSof $2.85 to $2.95.
Results of Operations
The following is a discussion and analysis of our results of operations for each of the three years in theperiod ended December 31, 2012. For purposes of this Item, reference is made to the Consolidated Statements ofOperations in Part II, Item 8, “Financial Statements and Supplementary Data.” Segment operating incomeexcludes unallocated corporate operating expenses. Certain prior year amounts have been revised to include theDispensing Equipment segment as part of the Fire & Safety/Diversified Products segment and to reflect themovement of our Trebor business unit from the Health & Science Technologies segment to the Fluid & MeteringTechnologies segment.
In this report, references to organic sales, a non-GAAP measure, refers to sales from continuing operationscalculated according to generally accepted accounting principles in the United States but excludes (1) sales fromacquired businesses during the first twelve months of ownership and (2) the impact of foreign currencytranslation. The portion of sales attributable to foreign currency translation is calculated as the differencebetween (a) the period-to-period change in organic sales and (b) the period-to-period change in organic salesafter applying prior period foreign exchange rates to the current year period. Management believes that reportingorganic sales provides useful information to investors by helping identify underlying growth trends in ourbusiness and facilitating easier comparisons of our revenue performance with prior and future periods and to ourpeers. The Company excludes the effect of foreign currency translation from organic sales because foreigncurrency translation is not under management’s control, is subject to volatility and can obscure underlyingbusiness trends. The Company excludes the effect of acquisitions because the nature, size, and number ofacquisitions can vary dramatically from period to period and between the Company and its peers and can alsoobscure underlying business trends and make comparisons of long-term performance difficult.
Management’s primary measurements of segment performance are sales, operating income, and operatingmargin. In addition, due to the highly acquisitive nature of the Company, the determination of operating incomeincludes amortization of acquired intangible assets and, as a result, management reviews depreciation and
15
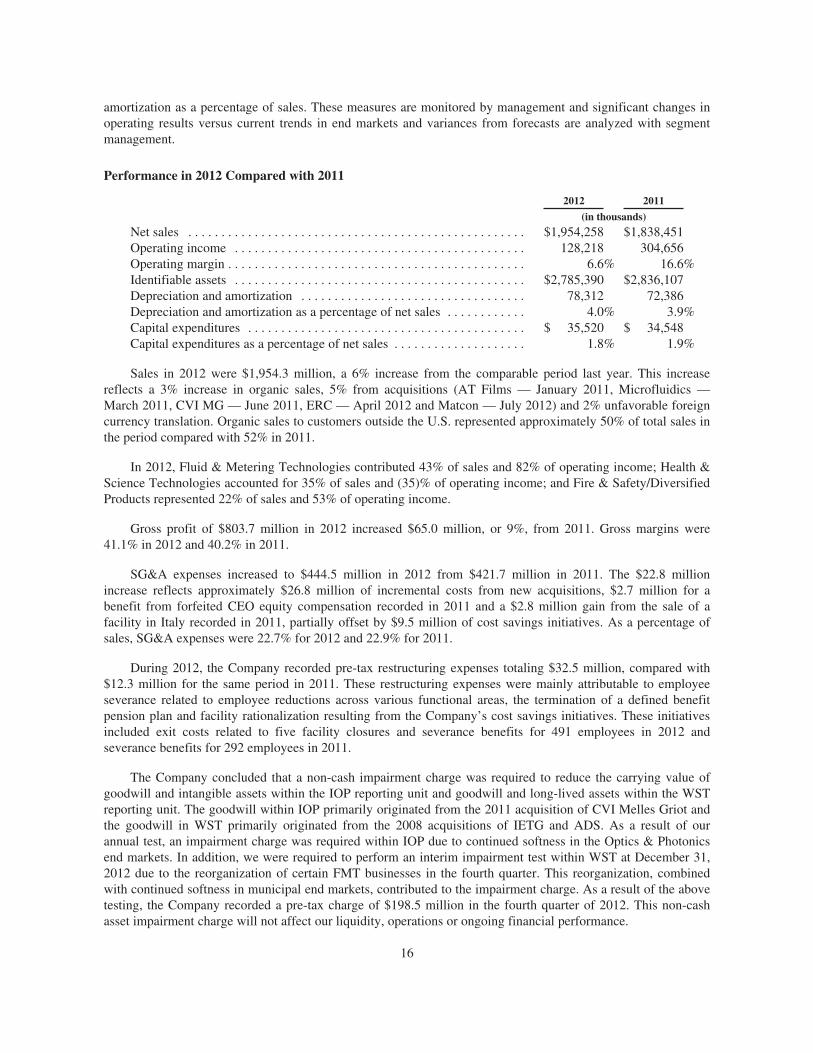
amortization as a percentage of sales. These measures are monitored by management and significant changes inoperating results versus current trends in end markets and variances from forecasts are analyzed with segmentmanagement.
Performance in 2012 Compared with 2011
2012 2011(in thousands)
Net sales . . . . . . . . . . . . . . . . . . . . . . . . . . . . . . . . . . . . . . . . . . . . . . . . . . . $1,954,258 $1,838,451Operating income . . . . . . . . . . . . . . . . . . . . . . . . . . . . . . . . . . . . . . . . . . . . 128,218 304,656Operating margin . . . . . . . . . . . . . . . . . . . . . . . . . . . . . . . . . . . . . . . . . . . . . 6.6% 16.6%Identifiable assets . . . . . . . . . . . . . . . . . . . . . . . . . . . . . . . . . . . . . . . . . . . . $2,785,390 $2,836,107Depreciation and amortization . . . . . . . . . . . . . . . . . . . . . . . . . . . . . . . . . . 78,312 72,386Depreciation and amortization as a percentage of net sales . . . . . . . . . . . . 4.0% 3.9%Capital expenditures . . . . . . . . . . . . . . . . . . . . . . . . . . . . . . . . . . . . . . . . . . $ 35,520 $ 34,548Capital expenditures as a percentage of net sales . . . . . . . . . . . . . . . . . . . . 1.8% 1.9%
Sales in 2012 were $1,954.3 million, a 6% increase from the comparable period last year. This increasereflects a 3% increase in organic sales, 5% from acquisitions (AT Films — January 2011, Microfluidics —March 2011, CVI MG — June 2011, ERC — April 2012 and Matcon — July 2012) and 2% unfavorable foreigncurrency translation. Organic sales to customers outside the U.S. represented approximately 50% of total sales inthe period compared with 52% in 2011.
In 2012, Fluid & Metering Technologies contributed 43% of sales and 82% of operating income; Health &Science Technologies accounted for 35% of sales and (35)% of operating income; and Fire & Safety/DiversifiedProducts represented 22% of sales and 53% of operating income.
Gross profit of $803.7 million in 2012 increased $65.0 million, or 9%, from 2011. Gross margins were41.1% in 2012 and 40.2% in 2011.
SG&A expenses increased to $444.5 million in 2012 from $421.7 million in 2011. The $22.8 millionincrease reflects approximately $26.8 million of incremental costs from new acquisitions, $2.7 million for abenefit from forfeited CEO equity compensation recorded in 2011 and a $2.8 million gain from the sale of afacility in Italy recorded in 2011, partially offset by $9.5 million of cost savings initiatives. As a percentage ofsales, SG&A expenses were 22.7% for 2012 and 22.9% for 2011.
During 2012, the Company recorded pre-tax restructuring expenses totaling $32.5 million, compared with$12.3 million for the same period in 2011. These restructuring expenses were mainly attributable to employeeseverance related to employee reductions across various functional areas, the termination of a defined benefitpension plan and facility rationalization resulting from the Company’s cost savings initiatives. These initiativesincluded exit costs related to five facility closures and severance benefits for 491 employees in 2012 andseverance benefits for 292 employees in 2011.
The Company concluded that a non-cash impairment charge was required to reduce the carrying value ofgoodwill and intangible assets within the IOP reporting unit and goodwill and long-lived assets within the WSTreporting unit. The goodwill within IOP primarily originated from the 2011 acquisition of CVI Melles Griot andthe goodwill in WST primarily originated from the 2008 acquisitions of IETG and ADS. As a result of ourannual test, an impairment charge was required within IOP due to continued softness in the Optics & Photonicsend markets. In addition, we were required to perform an interim impairment test within WST at December 31,2012 due to the reorganization of certain FMT businesses in the fourth quarter. This reorganization, combinedwith continued softness in municipal end markets, contributed to the impairment charge. As a result of the abovetesting, the Company recorded a pre-tax charge of $198.5 million in the fourth quarter of 2012. This non-cashasset impairment charge will not affect our liquidity, operations or ongoing financial performance.
16

No additional impairments were identified at any of the other reporting units.
Operating income of $128.2 million in 2012 was down from the $304.7 million recorded in 2011, primarilyreflecting $198.5 million of asset impairment charges and an increase of $20.2 million in restructuring-relatedcharges, partially offset by an increase in volume and improved productivity. Operating margin of 6.6% in 2012was down from 16.6% in 2011 primarily due to the impact of asset impairment charges and restructuring-relatedcharges, as well as the dilutive impact from acquisitions, partially offset by volume leverage and productivity.
Interest expense increased to $42.3 million in 2012 from $29.3 million in 2011. The increase was principallydue to higher debt levels resulting from the CVI MG acquisition and higher interest rates associated withconverting our Revolving Facility debt in 2011 to fixed rate 4.2% Senior Notes.
The provision for income taxes is based upon estimated annual tax rates for the year applied to federal, stateand foreign income. The provision for income taxes decreased to $48.6 million in 2012 compared to $80.0 in2011. The effective tax rate increased to 56.3% in 2012 compared to 29.2% in 2011, mainly due to thenonrecurring asset impairment charge recorded in the fourth quarter of 2012. The impairment charge increasedour effective tax rate by 26.9%. Our effective tax rate was also impacted by the mix of global pre-tax incomeamong jurisdictions, a reversal of disallowed executive compensation expense in the prior year and the impact ofrecent acquisitions.
In January 2013, legislation was enacted to extend the federal research and development credit and otherfavorable tax benefits through December 31, 2013. As a result, we expect that our income tax provision for thefirst quarter of 2013 will include a discrete tax benefit for the research and development credit which wasextended retroactively to January 1, 2012.
Net income for the year of $37.6 million decreased from the $193.9 million earned in 2011. Dilutedearnings per share in 2012 of $0.45 decreased $1.87, or 81%, from $2.32 in 2011.
Fluid & Metering Technologies Segment
2012 2011(in thousands)
Net sales . . . . . . . . . . . . . . . . . . . . . . . . . . . . . . . . . . . . . . . . . . . . . . . . . . . $ 833,288 $ 831,287Operating income . . . . . . . . . . . . . . . . . . . . . . . . . . . . . . . . . . . . . . . . . . . . 146,650 164,818Operating margin . . . . . . . . . . . . . . . . . . . . . . . . . . . . . . . . . . . . . . . . . . . . . 17.6% 19.8%Identifiable assets . . . . . . . . . . . . . . . . . . . . . . . . . . . . . . . . . . . . . . . . . . . . $1,023,143 $1,072,023Depreciation and amortization . . . . . . . . . . . . . . . . . . . . . . . . . . . . . . . . . . 29,637 32,368Depreciation and amortization as a percentage of net sales . . . . . . . . . . . . 3.6% 3.9%Capital expenditures . . . . . . . . . . . . . . . . . . . . . . . . . . . . . . . . . . . . . . . . . . $ 13,535 $ 12,543Capital expenditures as a percentage of net sales . . . . . . . . . . . . . . . . . . . . 1.6% 1.5%
Sales of $833.3 million increased $2.0 million in 2012 compared with 2011. This increase reflected 2%organic growth offset by 2% unfavorable foreign currency translation. The increase in organic sales was largelyattributed to growth across our Energy platform and our Agricultural group. In 2012, organic sales increasedapproximately 7% domestically and decreased 3% internationally. Organic sales to customers outside theU.S. were approximately 47% of total segment sales in 2012, compared with 48% in 2011.
Sales within our Energy platform increased compared to 2011, due to strong demand for systems used inmidstream and downstream oil and gas applications both domestically and internationally. Additionally, largeEnergy project sales to emerging markets drove international sales growth, partially offset by weakness in theEuropean downstream markets due to general economic conditions. Domestic sales growth within Energy wasdriven by the transportation end markets and strength in our distribution channel. Sales within our CFP platform
17
increased compared to 2011 on strong general industrial and chemical demand in both our OEM and distributorchannels in North America and Asia. In addition, CFP sales growth accelerated in emerging markets. Saleswithin our Agriculture group increased due to robust demand in North America. DDPT sales increased comparedto 2011, due to a modest increase in project activity for the chemical and industrial businesses. Offsetting thesales increases above was a decrease in our WST group, which continues to face funding headwinds in themunicipal water end market.
Operating income and operating margin of $146.7 million and 17.6%, respectively, were lower than the$164.8 million and 19.8% recorded in 2012, primarily due to $27.7 million of impairment charges and anincrease of $3.4 million of restructuring charges, partially offset by productivity and cost reduction initiatives.
Health & Science Technologies Segment
2012 2011(in thousands)
Net sales . . . . . . . . . . . . . . . . . . . . . . . . . . . . . . . . . . . . . . . . . . . . . . . . . . . $ 695,235 $ 607,900Operating (loss) income . . . . . . . . . . . . . . . . . . . . . . . . . . . . . . . . . . . . . . . (62,835) 106,037Operating margin . . . . . . . . . . . . . . . . . . . . . . . . . . . . . . . . . . . . . . . . . . . . . (9.0)% 17.4%Identifiable assets . . . . . . . . . . . . . . . . . . . . . . . . . . . . . . . . . . . . . . . . . . . . $1,102,868 $1,178,653Depreciation and amortization . . . . . . . . . . . . . . . . . . . . . . . . . . . . . . . . . . 39,981 30,055Depreciation and amortization as a percentage of net sales . . . . . . . . . . . . 5.8% 4.9%Capital expenditures . . . . . . . . . . . . . . . . . . . . . . . . . . . . . . . . . . . . . . . . . . $ 13,140 $ 12,938Capital expenditures as a percentage of net sales . . . . . . . . . . . . . . . . . . . . 1.9% 2.1%
Sales of $695.2 million increased $87.3 million, or 14%, in 2012 compared with 2011. This increasereflected 16% growth from acquisitions (AT Films, Microfluidics, CVI MG, ERC and Matcon), offset by a 1%unfavorable foreign currency translation and a 1% decrease in organic sales. In 2012, organic sales increased 2%domestically and decreased 4% internationally. Organic sales to customers outside the U.S. were approximately51% of total segment sales in both 2012 and 2011.
Sales within our MPT platform increased compared to 2011 due a full twelve months of sales fromMicrofluidics, acquired in March 2011, strength in Asian food and pharmaceutical markets, and large projectorders received in the second half of 2011 which shipped during the first half of 2012. Sales within our ScientificFluidics platform decreased compared to 2011 due to slowed instrumentation end markets driven by NationalInstitutes of Health funding concerns, inventory reduction programs by our customers and inconsistent OEMdemand in North America, partially offset by modest growth in the life sciences end market, particularly in Asia.Sales within our Containment group increased slightly compared to 2011 due to an increase in distributor salesand an upturn in the diesel and gas engine markets. Sales within our Optics and Photonics platform increasedcompared to 2011 primarily as a result of our CVI MG acquisition. However, 2012 sales within our Optics andPhotonics platform were lower than anticipated due to weak demand in the defense, biotech and electronics endmarkets. Sales at our Industrial group decreased compared to 2011 due to lower sales to distributors and slowersales into automotive end markets.
An operating loss of $62.8 million in 2012 was down from the $106.0 million of income recorded in 2011,primarily due to $170.8 million of impairment charges and $14.7 million of current period restructuring charges,partially offset by the $15.8 million acquisition fair value inventory charge for CVI MG recorded in 2011 andproductivity from prior period restructuring actions. A negative operating margin of 9.0% in 2012 was downfrom 17.4% in 2011, due to the dilutive impact from acquisitions, current period restructuring charges andimpairment charges.
18
Fire & Safety/Diversified Products Segment
2012 2011(in thousands)
Net sales . . . . . . . . . . . . . . . . . . . . . . . . . . . . . . . . . . . . . . . . . . . . . . . . . . . . . . $437,053 $402,425Operating income . . . . . . . . . . . . . . . . . . . . . . . . . . . . . . . . . . . . . . . . . . . . . . . 96,120 85,901Operating margin . . . . . . . . . . . . . . . . . . . . . . . . . . . . . . . . . . . . . . . . . . . . . . . . 22.0% 21.3%Identifiable assets . . . . . . . . . . . . . . . . . . . . . . . . . . . . . . . . . . . . . . . . . . . . . . . $488,886 $442,400Depreciation and amortization . . . . . . . . . . . . . . . . . . . . . . . . . . . . . . . . . . . . . 7,107 8,516Depreciation and amortization as a percentage of net sales . . . . . . . . . . . . . . . 1.6% 2.1%Capital expenditures . . . . . . . . . . . . . . . . . . . . . . . . . . . . . . . . . . . . . . . . . . . . . $ 6,654 $ 5,644Capital expenditures as a percentage of net sales . . . . . . . . . . . . . . . . . . . . . . . 1.5% 1.4%
Sales of $437.1 million increased $34.6 million, or 9%, in 2012 compared with 2011. This increase reflected11% organic growth offset by 2% unfavorable foreign currency translation. In 2012, organic sales increased 29%domestically and 1% internationally. Organic sales to customers outside the U.S. were approximately 57% oftotal segment sales in 2012, compared with 63% in 2011.
Sales within our Dispensing group increased on strength in our core North American markets driven by alarge replenishment project, which began shipping in the second quarter of 2012. The sales increase within ourBand-It group was driven by general North American industrial market improvement and strength in the oil andgas applications market. Sales within our Fire Suppression group increased as a result of geographic expansionsinto Asian markets and through the penetration into product adjacencies. Sales within our Rescue groupincreased as a result of robust demand for our rescue tools within North American markets and traction in Southand Central America initiatives.
Operating income of $96.1 million was higher than the $85.9 million recorded in 2011, primarily due tovolume leverage and productivity, partially offset by an increase of $3.1 million in restructuring charges and a$2.8 million gain on the sale of a facility in 2011. Operating margin of 22.0% in 2012 was up from 21.3% in2011, primarily due to improved productivity and cost reduction initiatives, partially offset by current periodrestructuring charges and the gain on the sale of a facility in 2011.
Performance in 2011 Compared with 2010
2011 2010(in thousands)
Net sales . . . . . . . . . . . . . . . . . . . . . . . . . . . . . . . . . . . . . . . . . . . . . . . . . . . $1,838,451 $1,513,073Operating income . . . . . . . . . . . . . . . . . . . . . . . . . . . . . . . . . . . . . . . . . . . . 304,656 249,116Operating margin . . . . . . . . . . . . . . . . . . . . . . . . . . . . . . . . . . . . . . . . . . . . . 16.6% 16.5%Identifiable assets . . . . . . . . . . . . . . . . . . . . . . . . . . . . . . . . . . . . . . . . . . . . $2,836,107 $2,381,695Depreciation and amortization . . . . . . . . . . . . . . . . . . . . . . . . . . . . . . . . . . 72,386 58,108Depreciation and amortization as a percentage of net sales . . . . . . . . . . . . 3.9% 3.8%Capital expenditures . . . . . . . . . . . . . . . . . . . . . . . . . . . . . . . . . . . . . . . . . . $ 34,548 $ 32,769Capital expenditures as a percentage of net sales . . . . . . . . . . . . . . . . . . . . 1.9% 2.2%
Sales in 2011 of $1,838.5 million were 22% higher than the $1,513.1 million recorded in 2010. Thisincrease reflected a 9% increase in organic sales, 11% from seven acquisitions (PPE — April 2010, OBL — July2010, Periflo — September 2010, Fitzpatrick — November 2010, AT Films — January 2011, Microfluidics —March 2011 and CVI MG — June 2011) and 2% favorable foreign currency translation. Organic sales increasedin Fluid & Metering Technologies, Health & Science Technologies and Fire & Safety/Diversified Productssegments. Domestic organic sales were up 4% versus the prior year, while international organic sales increased15%. Organic sales to customers outside the U.S. represented 52% of total sales in 2011 and 49% in 2010.
19

In 2011, Fluid & Metering Technologies contributed 45% of sales and 46% of operating income; Health &Science Technologies accounted for 33% of sales and 30% of operating income; and Fire & Safety/DiversifiedProducts represented 22% of sales and 24% of operating income.
Gross profit of $738.7 million in 2011 was $120.2 million, or 19%, higher than 2010. As a percentage ofsales, gross profit was 40.2% in 2011, a 70 basis-point decrease from 40.9% in 2010. The decrease in grossmargin primarily reflected acquisition fair value inventory charges of $15.8 million related to our CVI MGacquisition, partially offset by higher volume and product mix.
SG&A expenses increased to $421.7 million in 2011 from $358.3 million in 2010. The $63.4 millionincrease reflected approximately $16.7 million in volume-related expenses, $46.4 million for incremental costsassociated with acquisitions and $5.8 million of acquisition-related costs, partially offset by a $2.8 million gainfrom the sale of a facility in Italy and $2.7 million from the reversal of previously recorded share basedcompensation costs related to the CEO transition. As a percentage of sales, SG&A expenses were 22.9% for2011 and 23.7% for 2010.
During 2011, the Company recorded pre-tax restructuring expenses totaling $12.3 million, while $11.1million was recorded for the same period in 2010. These restructuring expenses were mainly attributable toemployee severance related to employee reductions across various functional areas and facility rationalizationresulting from the Company’s cost savings initiatives. These initiatives included severance benefits for292 employees in 2011 and 215 in 2010.
Operating income increased $55.5 million, or 22%, to $304.7 million in 2011 from $249.1 million in 2010.This increase primarily reflected an increase in volume, improved productivity and a gain from the sale of afacility in Italy, partially offset by acquisition fair value inventory charges and acquisition-related costs.Operating margins in 2011 were 16.6% of sales compared with 16.5% recorded in 2010.
Other expense of $1.4 million in 2011 was higher than the $1.1 million expense in 2010, primarily due tohigher losses on foreign currency transactions and a loss on an interest rate contract settlement, partially offset byan increase in interest income.
Interest expense increased to $29.3 million in 2011 from $16.2 million in 2010. The increase was principallydue to higher debt levels resulting from the funding of the CVI MG acquisition and a higher interest rateassociated with the 4.5% senior notes issued in December 2010 with a 5.8% effective interest rate.
The provision for income taxes is based upon estimated annual tax rates for the year applied to federal, stateand foreign income. The provision for income taxes increased to $80.0 million for 2011 compared to $74.8million in 2010. The effective tax rate decreased to 29.2% for 2011 compared to 32.2% in 2010 primarily due tothe mix of global pre-tax income among jurisdictions and as a result of recent acquisitions.
Net income in 2011 of $193.9 million increased from the $157.1 million earned in 2010. Diluted earningsper share of $2.32 in 2011 increased $0.42, or 22%, compared with diluted earnings per share of $1.90 in 2010.
Fluid & Metering Technologies Segment
2011 2010(in thousands)
Net sales . . . . . . . . . . . . . . . . . . . . . . . . . . . . . . . . . . . . . . . . . . . . . . . . . . . $ 831,287 $ 718,291Operating income . . . . . . . . . . . . . . . . . . . . . . . . . . . . . . . . . . . . . . . . . . . . 164,818 131,018Operating margin . . . . . . . . . . . . . . . . . . . . . . . . . . . . . . . . . . . . . . . . . . . . . 19.8% 18.2%Identifiable assets . . . . . . . . . . . . . . . . . . . . . . . . . . . . . . . . . . . . . . . . . . . . $1,072,023 $1,065,953Depreciation and amortization . . . . . . . . . . . . . . . . . . . . . . . . . . . . . . . . . . 32,368 31,893Depreciation and amortization as a percentage of net sales . . . . . . . . . . . . 3.9% 4.4%Capital expenditures . . . . . . . . . . . . . . . . . . . . . . . . . . . . . . . . . . . . . . . . . . $ 12,543 $ 17,314Capital expenditures as a percentage of net sales . . . . . . . . . . . . . . . . . . . . 1.5% 2.4%
20
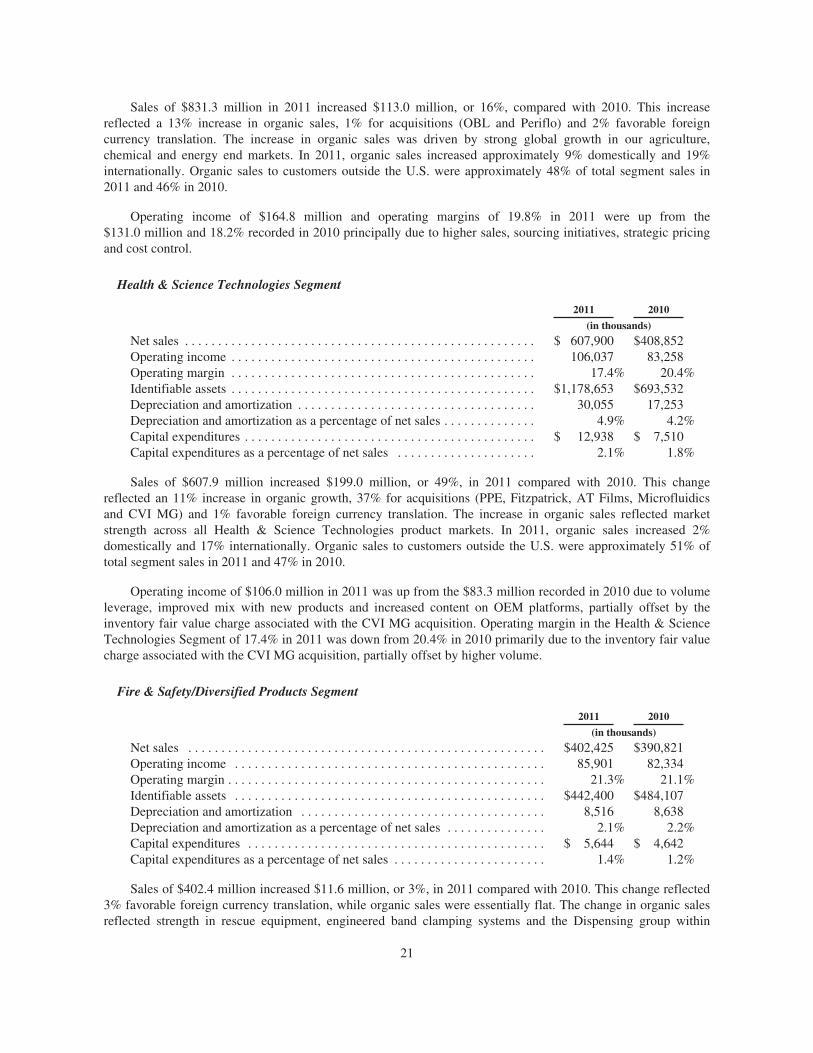
Sales of $831.3 million in 2011 increased $113.0 million, or 16%, compared with 2010. This increasereflected a 13% increase in organic sales, 1% for acquisitions (OBL and Periflo) and 2% favorable foreigncurrency translation. The increase in organic sales was driven by strong global growth in our agriculture,chemical and energy end markets. In 2011, organic sales increased approximately 9% domestically and 19%internationally. Organic sales to customers outside the U.S. were approximately 48% of total segment sales in2011 and 46% in 2010.
Operating income of $164.8 million and operating margins of 19.8% in 2011 were up from the$131.0 million and 18.2% recorded in 2010 principally due to higher sales, sourcing initiatives, strategic pricingand cost control.
Health & Science Technologies Segment
2011 2010(in thousands)
Net sales . . . . . . . . . . . . . . . . . . . . . . . . . . . . . . . . . . . . . . . . . . . . . . . . . . . . . $ 607,900 $408,852Operating income . . . . . . . . . . . . . . . . . . . . . . . . . . . . . . . . . . . . . . . . . . . . . . 106,037 83,258Operating margin . . . . . . . . . . . . . . . . . . . . . . . . . . . . . . . . . . . . . . . . . . . . . . 17.4% 20.4%Identifiable assets . . . . . . . . . . . . . . . . . . . . . . . . . . . . . . . . . . . . . . . . . . . . . . $1,178,653 $693,532Depreciation and amortization . . . . . . . . . . . . . . . . . . . . . . . . . . . . . . . . . . . . 30,055 17,253Depreciation and amortization as a percentage of net sales . . . . . . . . . . . . . . 4.9% 4.2%Capital expenditures . . . . . . . . . . . . . . . . . . . . . . . . . . . . . . . . . . . . . . . . . . . . $ 12,938 $ 7,510Capital expenditures as a percentage of net sales . . . . . . . . . . . . . . . . . . . . . 2.1% 1.8%
Sales of $607.9 million increased $199.0 million, or 49%, in 2011 compared with 2010. This changereflected an 11% increase in organic growth, 37% for acquisitions (PPE, Fitzpatrick, AT Films, Microfluidicsand CVI MG) and 1% favorable foreign currency translation. The increase in organic sales reflected marketstrength across all Health & Science Technologies product markets. In 2011, organic sales increased 2%domestically and 17% internationally. Organic sales to customers outside the U.S. were approximately 51% oftotal segment sales in 2011 and 47% in 2010.
Operating income of $106.0 million in 2011 was up from the $83.3 million recorded in 2010 due to volumeleverage, improved mix with new products and increased content on OEM platforms, partially offset by theinventory fair value charge associated with the CVI MG acquisition. Operating margin in the Health & ScienceTechnologies Segment of 17.4% in 2011 was down from 20.4% in 2010 primarily due to the inventory fair valuecharge associated with the CVI MG acquisition, partially offset by higher volume.
Fire & Safety/Diversified Products Segment
2011 2010(in thousands)
Net sales . . . . . . . . . . . . . . . . . . . . . . . . . . . . . . . . . . . . . . . . . . . . . . . . . . . . . . $402,425 $390,821Operating income . . . . . . . . . . . . . . . . . . . . . . . . . . . . . . . . . . . . . . . . . . . . . . . 85,901 82,334Operating margin . . . . . . . . . . . . . . . . . . . . . . . . . . . . . . . . . . . . . . . . . . . . . . . . 21.3% 21.1%Identifiable assets . . . . . . . . . . . . . . . . . . . . . . . . . . . . . . . . . . . . . . . . . . . . . . . $442,400 $484,107Depreciation and amortization . . . . . . . . . . . . . . . . . . . . . . . . . . . . . . . . . . . . . 8,516 8,638Depreciation and amortization as a percentage of net sales . . . . . . . . . . . . . . . 2.1% 2.2%Capital expenditures . . . . . . . . . . . . . . . . . . . . . . . . . . . . . . . . . . . . . . . . . . . . . $ 5,644 $ 4,642Capital expenditures as a percentage of net sales . . . . . . . . . . . . . . . . . . . . . . . 1.4% 1.2%
Sales of $402.4 million increased $11.6 million, or 3%, in 2011 compared with 2010. This change reflected3% favorable foreign currency translation, while organic sales were essentially flat. The change in organic salesreflected strength in rescue equipment, engineered band clamping systems and the Dispensing group within
21
Eastern Europe and Asia, partially offset by weakness in fire suppression and market softness in North Americawithin our Dispensing business. In 2011, organic sales decreased 7% domestically and increased 5%internationally. Organic sales to customers outside the U.S. were 63% of total segment sales in 2011 and 59% in2010.
Operating income and operating margins in the Fire & Safety/Diversified Products Segment of$85.9 million and 21.3%, respectively, were higher than the $82.3 million and 21.1% recorded in 2010, primarilydue to volume leverage, favorable product mix and a gain from the sale of a facility in Italy, partially offset byrestructuring related costs.
Liquidity and Capital Resources
At December 31, 2012, working capital was $590.4 million and the Company’s current ratio was 3.0 to 1.Cash flows from operating activities increased $108.9 million, or 50%, to $326.2 million in 2012, primarily dueto higher operating income, excluding the non-cash asset impairment charge; improved working capital; and thesettlement of an interest rate contract for $38.7 million in 2011. At December 31, 2012, the Company’s cash andcash equivalents totaled $318.9 million, of which $201.9 million was held outside of the United States. TheCompany has not provided an estimate for any U.S. or additional foreign taxes on undistributed earnings offoreign subsidiaries that might be payable if these earnings were repatriated since the Company considers theseamounts to be permanently invested.
Cash flows from operations were more than adequate to fund capital expenditures of $35.5 million and$34.5 million in 2012 and 2011, respectively. Capital expenditures were generally for machinery and equipmentthat improved productivity and tooling to support global sourcing initiatives, although a portion was for businesssystem technology and replacement of equipment and facilities. Management believes that the Company hasample capacity in its plants and equipment to meet expected needs for future growth in the intermediate term.
The Company acquired Precision Photonics Corporation (“PPC”) in April 2012 for cash consideration of$20.6 million, ERC in April 2012 for cash consideration of $13.3 million and the assumption of approximately$4.7 million of debt, and Matcon in July 2012 for cash consideration of $35.0 million, $2.4 million of workingcapital adjustments to be paid in the first quarter of 2013, and contingent consideration valued at $8.4 million asof the opening balance sheet date. The cash payments for ERC and Matcon were financed with borrowings underthe Company’s credit facility, while the acquisition of PPC was funded with available cash on hand.
The Company completed the acquisitions of AT Films on January 31, 2011 for cash consideration of$31.8 million and contingent consideration valued at approximately $2.7 million, Microfluidics on March 11,2011 for cash consideration of $18.5 million and CVI MG on June 10, 2011 for cash consideration of$393.3 million and the assumption of approximately $1.4 million of debt. Approximately $365.0 million of thecash payment for CVI MG was financed with borrowings under the Company’s revolving credit facility whilethe remaining cash payments were funded from cash on hand.
The Company maintains a revolving credit facility (the “Revolving Facility”), which is a $700.0 millionunsecured, multi-currency bank credit facility expiring on June 27, 2016. At December 31, 2012, $21.0 millionwas outstanding under the Revolving Facility, with $6.5 million of outstanding letters of credit. The net availableborrowing capacity under the Revolving Facility at December 31, 2012, was approximately $672.5 million.Borrowings under the Revolving Facility bear interest, at either an alternate base rate or an adjusted LIBOR rateplus, in each case, an applicable margin. This applicable margin is based on the Company’s senior, unsecured,long-term debt rating and can range from .875% to 1.70%. Based on the Company’s credit rating atDecember 31, 2012, the applicable margin was 1.05%. Interest is payable (a) in the case of base rate loans,quarterly, and (b) in the case of LIBOR rate loans, on the maturity date of the borrowing, or quarterly from theeffective date for borrowings exceeding three months. An annual Revolving Facility fee, also based on theCompany’s credit rating, is currently 20 basis points and is payable quarterly.
22

On June 9, 2010, the Company completed a private placement of €81.0 million ($96.8 million) aggregateprincipal amount of 2.58% Series 2010 Senior Euro Notes due June 9, 2015 (“2.58% Senior Euro Notes”)pursuant to a Master Note Purchase Agreement, dated June 9, 2010 (the “Purchase Agreement”). The PurchaseAgreement provides for the issuance of additional series of notes in the future, provided that the aggregateprincipal amount outstanding under the agreement at any time does not exceed $750.0 million. The 2.58% SeniorEuro Notes bear interest at a rate of 2.58% per annum, which is payable semi-annually in arrears on eachJune 9th and December 9th and will mature on June 9, 2015. The 2.58% Senior Euro Notes are unsecuredobligations of the Company and rank pari passu in right of payment with all of the Company’s other senior debt.The Company may at any time prepay all or any portion of the 2.58% Senior Euro Notes; provided that any suchportion is greater than 5% of the aggregate principal amount of notes then outstanding under the PurchaseAgreement. In the event of a prepayment, the Company would be required to pay an amount equal to par plusaccrued interest plus a make-whole premium. The Purchase Agreement contains certain covenants that restrictthe Company’s ability to, among other things, transfer or sell assets, create liens and engage in certain mergers orconsolidations. In addition, the Company must comply with a leverage ratio and interest coverage ratio as setforth in the Purchase Agreement. The Purchase Agreement provides for customary events of default. In the caseof an event of default arising from specified events of bankruptcy or insolvency, all outstanding 2.58% SeniorEuro Notes will become due and payable immediately without further action or notice. In the case of paymentevents of defaults, any holder of the 2.58% Senior Euro Notes affected thereby may declare all the 2.58% SeniorEuro Notes held by it due and payable immediately. In the case of any other event of default, a majority of theholders of the 2.58% Senior Euro Notes may declare all the 2.58% Senior Euro Notes to be due and payableimmediately.
On December 6, 2010, the Company completed a public offering of $300.0 million 4.5% senior notes dueDecember 15, 2020 (“4.5% Senior Notes”). The net proceeds from the offering of approximately $295.7 million,after deducting a $1.6 million issuance discount, a $1.9 million underwriting commission and $0.8 millionoffering expenses, were used to repay $250.0 million of outstanding bank indebtedness, with the balance used forgeneral corporate purposes. The 4.5% Senior Notes bear interest at a rate of 4.5% per annum, which is payablesemi-annually in arrears on each June 15 and December 15. The Company may redeem all or a portion of the4.5% Senior Notes at any time prior to maturity at the redemption prices set forth in the Note Indenturegoverning the 4.5% Senior Notes. The Company may issue additional debt from time to time pursuant to theIndenture. The Indenture and 4.5% Senior Notes contain covenants that limit the Company’s ability to, amongother things, incur certain liens securing indebtedness, engage in certain sale-leaseback transactions, and enterinto certain consolidations, mergers, conveyances, transfers or leases of all or substantially all the Company’sassets. The terms of the 4.5% Senior Notes also require the Company to make an offer to repurchase the4.5% Senior Notes upon a change of control triggering event (as defined in the Indenture) at a price equal to101% of their principal amount plus accrued and unpaid interest, if any.
On December 9, 2011, the Company completed a public offering of $350.0 million 4.2% senior notes dueDecember 15, 2021 (“4.2% Senior Notes”). The net proceeds from the offering of approximately $346.2 million,after deducting a $0.9 million issuance discount, a $2.3 million underwriting commission and $0.6 millionoffering expenses, were used to repay $306.0 million of outstanding bank indebtedness, with the balance used forgeneral corporate purposes. The 4.2% Senior Notes bear interest at a rate of 4.2% per annum, which is payablesemi-annually in arrears on each June 15 and December 15. The Company may redeem all or part of the4.2% Senior Notes at any time prior to maturity at the redemption prices set forth in the Note Indenturegoverning the 4.2% Senior Notes. The Company may issue additional debt from time to time pursuant to theIndenture. The Indenture and 4.2% Senior Notes contain covenants that limit the Company’s ability to, amongother things, incur certain liens securing indebtedness, engage in certain sale-leaseback transactions, and enterinto certain consolidations, mergers, conveyances, transfers or leases of all or substantially all the Company’sassets. The terms of the 4.2% Senior Notes also require the Company to make an offer to repurchase the4.2% Senior Notes upon a change of control triggering event (as defined in the Indenture) at a price equal to101% of their principal amount plus accrued and unpaid interest, if any.
23
On April 15, 2010, the Company entered into a forward starting interest rate contract with a notional amountof $300.0 million and a settlement date in December 2010. This contract was entered into in anticipation of theissuance of the 4.5% Senior Notes and was designed to lock in the market interest rate as of April 15, 2010. InDecember 2010, the Company settled and paid this interest rate contract for $31.0 million. The $31.0 million isbeing amortized into interest expense over the 10 year term of the 4.5% Senior Notes, which results in aneffective interest rate of 5.8%.
On July 12, 2011, the Company entered into a forward starting interest rate contract with a notional amountof $350.0 million and a settlement date of September 30, 2011. This contract was entered into in anticipation ofthe issuance of the 4.2% Senior Notes and was designed to lock in the market interest rate as of July 12, 2011. OnSeptember 29, 2011, the Company settled this interest rate contract for $34.7 million with a payment made onOctober 3, 2011. Simultaneously, the Company entered into a separate interest rate contract with a notionalamount of $350.0 million and a settlement date of February 28, 2012. The contract was entered into inanticipation of the expected issuance of the 4.2% Senior Notes and was designed to maintain the market rate asof July 12, 2011. In December 2011, the Company settled and paid the September interest rate contract for $4.0million, resulting in a total settlement of $38.7 million. Of the $38.7 million, $0.8 was recognized as otherexpense in 2011 and the balance of $37.9 million is being amortized into interest expense over the 10 year termof the 4.2% Senior Notes, which results in an effective interest rate of 5.3%.
There are two key financial covenants that the Company is required to maintain in connection with theRevolving Facility and the 2.58% Senior Euro Notes. The key financial covenants require a minimum interestcoverage ratio of 3.0 to 1 and a maximum leverage ratio of 3.25 to 1. At December 31, 2012, the Company wasin compliance with both of these financial covenants, as the Company’s interest coverage ratio was 10.05 to 1and the leverage ratio was 1.92 to 1. There are no financial covenants relating to the 4.5% Senior Notes or 4.2%Senior Notes.
On October 22, 2012, the Company’s Board of Directors approved an increase in the authorized level forrepurchases of common stock by $200.0 million. Repurchases under the program will be funded with future cashflow generation. During 2012, 2.2 million shares were purchased at a cost of $89.6 million.
The Company believes current cash and cash that will be generated from operations will be sufficient tomeet its operating cash requirements, planned capital expenditures, interest on all borrowings, pension andpostretirement funding requirements, authorized share repurchases and annual dividend payments to holders ofthe Company’s stock for the next twelve months. Additionally, in the event that suitable businesses are availablefor acquisition upon acceptable terms, the Company may obtain all or a portion of the financing for theseacquisitions through the incurrence of additional borrowings. As of December 31, 2012, $21.0 million wasoutstanding under the Revolving Facility.
Contractual Obligations
Our contractual obligations include pension and postretirement medical benefit plans, rental payments underoperating leases, payments under capital leases, and other long-term obligations arising in the ordinary course ofbusiness. There are no identifiable events or uncertainties, including the lowering of our credit rating that wouldaccelerate payment or maturity of any of these commitments or obligations.
24
The following table summarizes our significant contractual obligations and commercial commitments atDecember 31, 2012, and the future periods in which such obligations are expected to be settled in cash. Inaddition, the table reflects the timing of principal and interest payments on outstanding borrowings. Additionaldetail regarding these obligations is provided in the Notes to Consolidated Financial Statements in Part II, Item 8,“Financial Statements and Supplementary Data.”
Payments Due by Period Total
LessThan1 Year
1-3Years
3-5Years
MoreThan5 Years
(In thousands)Borrowings(1) . . . . . . . . . . . . . . . . . . $1,037,259 $ 39,563 $171,348 $ 78,223 $748,125Operating lease obligations . . . . . . . 41,351 14,078 14,591 5,568 7,114Capital lease obligations(2) . . . . . . . 3,516 578 1,123 1,715 100Purchase obligations(3) . . . . . . . . . . . 75,435 70,959 4,284 192 —Pension and post-retirementobligations . . . . . . . . . . . . . . . . . . 109,823 12,787 20,042 20,250 56,744
Income tax obligations(4) . . . . . . . . . 6,506 2,218 3,290 669 329
Total contractual obligations(5) . . . . $1,273,890 $140,183 $214,678 $106,617 $812,412
(1) Includes interest payments based on contractual terms and current interest rates for variable debt.(2) Consists primarily of tangible personal property leases.(3) Consists primarily of inventory commitments.(4) Excludes interest and penalties.(5) Comprises liabilities recorded on the balance sheet of $884.3, and obligations not recorded on the balance
sheet of $389.6.
Critical Accounting Policies
We believe that the application of the following accounting policies, which are important to our financialposition and results of operations, requires significant judgments and estimates on the part of management. For asummary of all of our accounting policies, including the accounting policies discussed below, see Note 1 of theNotes to Consolidated Financial Statements in Part II, Item 8, “Financial Statements and Supplementary Data.”
Revenue recognition — The Company recognizes revenue when persuasive evidence of an arrangementexists, delivery has occurred, the sales price is fixed or determinable, and collectibility of the sales price isreasonably assured. For product sales, delivery does not occur until the products have been shipped and risk ofloss has been transferred to the customer. Revenue from services is recognized when the services are provided orratably over the contract term. Some arrangements with customers may include multiple deliverables, includingthe combination of products and services. In such cases, the Company has identified these as separate elements inaccordance with ASC 605-25 “Revenue Recognition-Multiple-Element Arrangements-Recognition” andrecognizes revenue consistent with the policy for each separate element based on the relative selling pricemethod. Revenues from some long-term contracts are recognized on the percentage-of-completion method.Percentage-of-completion is measured principally by the percentage of costs incurred to date for each contract tothe estimated total costs for such contract at completion. Provisions for estimated losses on uncompleted long-term contracts are made in the period in which such losses are determined. Due to uncertainties inherent in theestimation process, it is reasonably possible that completion costs, including those arising from contract penaltyprovisions and final contract settlements, will be revised in the near-term. Such revisions to costs and income arerecognized in the period in which the revisions are determined.
The Company records allowances for discounts, product returns and customer incentives at the time of saleas a reduction of revenue as such allowances can be reliably estimated based on historical experience and known
25
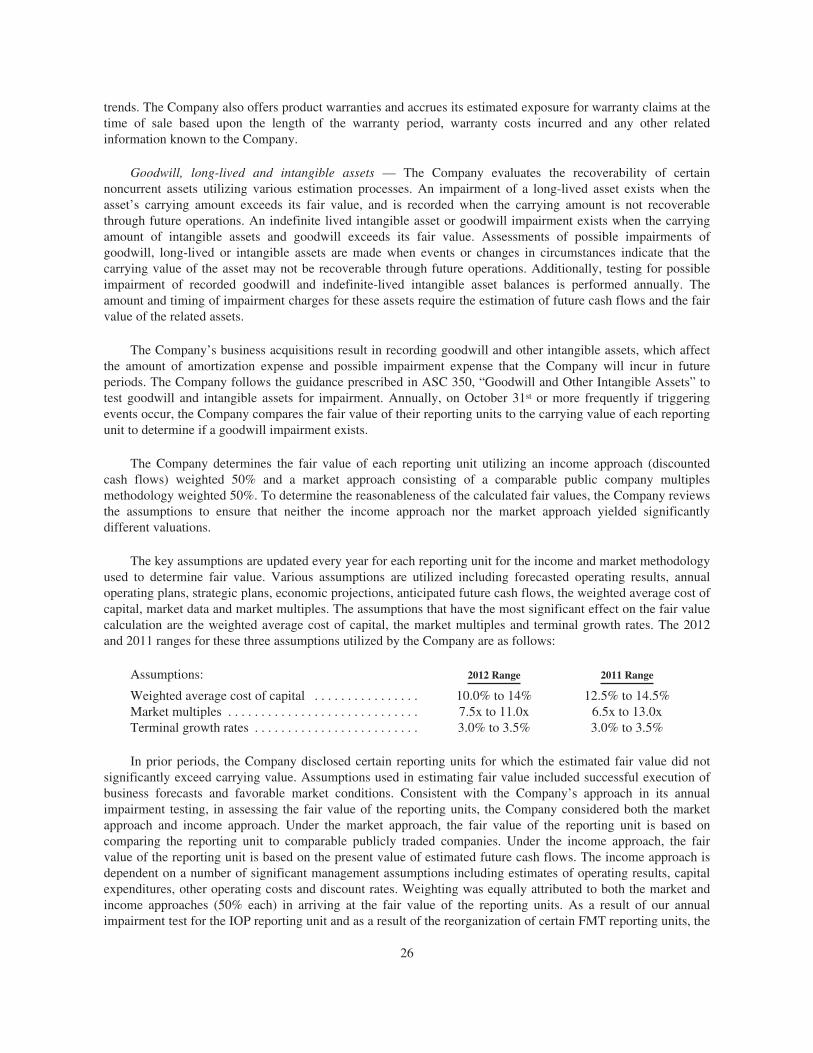
trends. The Company also offers product warranties and accrues its estimated exposure for warranty claims at thetime of sale based upon the length of the warranty period, warranty costs incurred and any other relatedinformation known to the Company.
Goodwill, long-lived and intangible assets — The Company evaluates the recoverability of certainnoncurrent assets utilizing various estimation processes. An impairment of a long-lived asset exists when theasset’s carrying amount exceeds its fair value, and is recorded when the carrying amount is not recoverablethrough future operations. An indefinite lived intangible asset or goodwill impairment exists when the carryingamount of intangible assets and goodwill exceeds its fair value. Assessments of possible impairments ofgoodwill, long-lived or intangible assets are made when events or changes in circumstances indicate that thecarrying value of the asset may not be recoverable through future operations. Additionally, testing for possibleimpairment of recorded goodwill and indefinite-lived intangible asset balances is performed annually. Theamount and timing of impairment charges for these assets require the estimation of future cash flows and the fairvalue of the related assets.
The Company’s business acquisitions result in recording goodwill and other intangible assets, which affectthe amount of amortization expense and possible impairment expense that the Company will incur in futureperiods. The Company follows the guidance prescribed in ASC 350, “Goodwill and Other Intangible Assets” totest goodwill and intangible assets for impairment. Annually, on October 31st or more frequently if triggeringevents occur, the Company compares the fair value of their reporting units to the carrying value of each reportingunit to determine if a goodwill impairment exists.
The Company determines the fair value of each reporting unit utilizing an income approach (discountedcash flows) weighted 50% and a market approach consisting of a comparable public company multiplesmethodology weighted 50%. To determine the reasonableness of the calculated fair values, the Company reviewsthe assumptions to ensure that neither the income approach nor the market approach yielded significantlydifferent valuations.
The key assumptions are updated every year for each reporting unit for the income and market methodologyused to determine fair value. Various assumptions are utilized including forecasted operating results, annualoperating plans, strategic plans, economic projections, anticipated future cash flows, the weighted average cost ofcapital, market data and market multiples. The assumptions that have the most significant effect on the fair valuecalculation are the weighted average cost of capital, the market multiples and terminal growth rates. The 2012and 2011 ranges for these three assumptions utilized by the Company are as follows:
Assumptions: 2012 Range 2011 Range
Weighted average cost of capital . . . . . . . . . . . . . . . . 10.0% to 14% 12.5% to 14.5%Market multiples . . . . . . . . . . . . . . . . . . . . . . . . . . . . . 7.5x to 11.0x 6.5x to 13.0xTerminal growth rates . . . . . . . . . . . . . . . . . . . . . . . . . 3.0% to 3.5% 3.0% to 3.5%
In prior periods, the Company disclosed certain reporting units for which the estimated fair value did notsignificantly exceed carrying value. Assumptions used in estimating fair value included successful execution ofbusiness forecasts and favorable market conditions. Consistent with the Company’s approach in its annualimpairment testing, in assessing the fair value of the reporting units, the Company considered both the marketapproach and income approach. Under the market approach, the fair value of the reporting unit is based oncomparing the reporting unit to comparable publicly traded companies. Under the income approach, the fairvalue of the reporting unit is based on the present value of estimated future cash flows. The income approach isdependent on a number of significant management assumptions including estimates of operating results, capitalexpenditures, other operating costs and discount rates. Weighting was equally attributed to both the market andincome approaches (50% each) in arriving at the fair value of the reporting units. As a result of our annualimpairment test for the IOP reporting unit and as a result of the reorganization of certain FMT reporting units, the
26

Company determined that the fair value of the IOP and WST reporting units was less than the carrying value ofthe net assets of the reporting units, and thus the Company performed step two of the goodwill impairment test.
In step two of the goodwill impairment test, the Company determined the implied fair value of the goodwilland compared it to the carrying value, which resulted in a $149.8 million goodwill impairment charge at the IOPreporting unit and a $20.7 million impairment charge at the WST reporting unit.
The unamortized Banjo trade name and the CVI Melles Griot trade names were determined to be indefinitelived intangible assets which are tested for impairment on an annual basis in accordance with ASC 350 or morefrequently if events or changes in circumstances indicate that the asset might be impaired. As a result of ourannual impairment test, the Company concluded that the fair value of the CVI Melles Griot trade names withinthe IOP reporting unit was less than the carrying value, resulting in a $21.0 million impairment charge. TheCompany also determined that the CVI Melles Griot trade names no longer had an indefinite life and reclassifiedthe remaining $26.0 million to definite lived assets that will be amortized over a remaining useful life of 15years.
A long-lived asset impairment exists when the carrying amount of the asset exceeds its fair value.Assessments of possible impairments of long-lived assets are made when events or changes in circumstancesindicate that the carrying value of the asset may not be recoverable through future operations. The amount andtiming of impairment charges for these assets require the estimation of future cash flows and the fair value of therelated assets. As a result of the reorganization of certain FMT reporting units, the Company concluded thatcertain long lived assets within the WST reporting unit had a fair value that was less than the carrying value ofthe assets, resulting in a $7.0 million impairment charge. No additional impairments were identified at any of theother reporting units.
Defined benefit retirement plans — The plan obligations and related assets of the defined benefit retirementplans are presented in Note 14 of the Notes to Consolidated Financial Statements in Part II, Item 8, “FinancialStatements and Supplementary Data.” Level 1 assets are valued using unadjusted quoted prices for identicalassets in active markets. Level 2 assets are valued using quoted prices or other observable inputs for similarassets. Level 3 assets are valued using unobservable inputs, but reflect the assumptions market participants woulduse in pricing the assets. Plan obligations and the annual pension expense are determined by consulting withactuaries using a number of assumptions provided by the Company. Key assumptions in the determination of theannual pension expense include the discount rate, the rate of salary increases, and the estimated future return onplan assets. To the extent actual amounts differ from these assumptions and estimated amounts, results could beadversely affected.
Changes in the discount rate assumptions will impact the (gain) loss amortization and interest costcomponents of the projected benefit obligation (PBO), which in turn, may impact the Company’s fundingdecisions if the PBO exceeds plan assets. Each 100 basis point increase or decrease in the discount rate will causea corresponding decrease or increase, respectively, in the PBO of an estimated $25.0 million based upon theDecember 31, 2012 data.
Recently Adopted Accounting Pronouncements
In May 2011, the Financial Accounting Standards Board (“FASB”) issued Accounting Standards Update(“ASU”) 2011-04, “Fair Value Measurement: Amendments to Achieve Common Fair Value Measurement andDisclosure Requirements in U.S. Generally Accepted Accounting Principles (“GAAP”) and InternationalFinancial Reporting Standards (“IFRS”)” (“ASU 2011-04”), which was issued to provide a consistent definitionof fair value and ensure that the fair value measurement and disclosure requirements are similar between GAAPand IFRS. ASU 2011-04 changes certain fair value measurement principles and enhances the disclosurerequirements particularly for Level 3 fair value measurements. The Company adopted this guidance onJanuary 1, 2012, and its adoption did not impact the consolidated financial position, results of operations or cashflows of the Company.
27
In June 2011, FASB issued ASU 2011-05 “Presentation of Comprehensive Income.” ASU 2011-05 allowsan entity to present components of net income and other comprehensive income in one continuous statement,referred to as the statement of comprehensive income, or in two separate, but consecutive statements. Theguidance eliminated the option to report other comprehensive income and its components in the statement ofchanges in equity. While ASU 2011-05 changes the presentation of comprehensive income, there are no changesto the components that are recognized in net income or other comprehensive income under current accountingguidance. In December 2011, FASB issued ASU 2011-12 “Comprehensive Income (Topic 220); Deferral of theEffective Date for Amendments to the Presentation of Reclassifications of Items Out of Accumulated OtherComprehensive Income in Accounting Standards Update No. 2011-05.” ASU 2011-12 deferred certain aspects ofASU 2011-05. The new guidance is effective for fiscal years, and interim periods within those years, beginningafter December 15, 2011. The Company adopted ASU 2011-05 and the deferrals in ASU 2011-12 on January 1,2012 and the adoption did not impact the consolidated financial position, results of operations or cash flows ofthe Company.
New Accounting Pronouncements
In July 2012, the FASB issued ASU 2012-02, “Intangibles—Goodwill and Other (Topic 350): TestingIndefinite-Lived Intangible Assets for Impairment” (ASU 2012-02), which allows an entity to first assessqualitative factors to determine whether it is necessary to perform a quantitative impairment test of an indefinite-lived intangible asset. Under ASU 2012-02, an entity would not be required to calculate the fair value of anindefinite-lived intangible asset if the entity determines, based on qualitative assessment, that it is not more likelythan not impaired. The revised standard is effective for annual and interim impairment tests performed for fiscalyears beginning after September 15, 2012; however, early adoption is permitted. As of December 31, 2012, theCompany did not elect to early adopt ASU 2012-02, however it is not expected to have a material impact on theconsolidated financial position, results of operations or cash flows of the Company.
Item 7A. Quantitative and Qualitative Disclosures About Market Risk.
The Company is subject to market risk associated with changes in foreign currency exchange rates andinterest rates. The Company may, from time to time, enter into foreign currency forward contracts and interestrate swaps on its debt when it believes there is a financial advantage in doing so. A treasury risk managementpolicy, adopted by the Board of Directors, describes the procedures and controls over derivative financial andcommodity instruments, including foreign currency forward contracts and interest rate swaps. Under the policy,the Company does not use financial or commodity derivative instruments for trading purposes, and the use ofthese instruments is subject to strict approvals by senior officers. Typically, the use of derivative instruments islimited to foreign currency forward contracts and interest rate swaps on the Company’s outstanding long-termdebt.
The Company’s foreign currency exchange rate risk is limited principally to the Euro, British Pound,Canadian Dollar and Chinese Renminbi. The Company manages its foreign exchange risk principally throughinvoicing customers in the same currency as the source of products. The effect of transaction gains and losses isreported within Other income (expense)-net on the Consolidated Statements of Operations.
The Company’s interest rate exposure is primarily related to its $786.6 million of total debt outstanding atDecember 31, 2012. Approximately 4% of the debt is priced at interest rates that float with the market. A 50basis point movement in the interest rate on the floating rate debt would result in an approximate $0.2 millionannualized increase or decrease in interest expense and cash flows. The remaining debt is fixed rate debt.
28

Item 8. Financial Statements and Supplementary Data.
IDEX CORPORATION
CONSOLIDATED BALANCE SHEETS
As of December 31,2012 2011
(In thousands except share andper share amounts)
ASSETSCurrent assetsCash and cash equivalents . . . . . . . . . . . . . . . . . . . . . . . . . . . . . . . . . . . . . . . . . . . . $ 318,864 $ 230,259Receivables — net . . . . . . . . . . . . . . . . . . . . . . . . . . . . . . . . . . . . . . . . . . . . . . . . . . 256,095 252,845Inventories . . . . . . . . . . . . . . . . . . . . . . . . . . . . . . . . . . . . . . . . . . . . . . . . . . . . . . . . 234,950 254,258Other current assets . . . . . . . . . . . . . . . . . . . . . . . . . . . . . . . . . . . . . . . . . . . . . . . . . 71,956 51,799
Total current assets . . . . . . . . . . . . . . . . . . . . . . . . . . . . . . . . . . . . . . . . . . . . . . . 881,865 789,161Property, plant and equipment — net . . . . . . . . . . . . . . . . . . . . . . . . . . . . . . . . . . . . . 219,161 213,717Goodwill . . . . . . . . . . . . . . . . . . . . . . . . . . . . . . . . . . . . . . . . . . . . . . . . . . . . . . . . . . . 1,321,727 1,431,366Intangible assets — net . . . . . . . . . . . . . . . . . . . . . . . . . . . . . . . . . . . . . . . . . . . . . . . . 341,372 382,222Other noncurrent assets . . . . . . . . . . . . . . . . . . . . . . . . . . . . . . . . . . . . . . . . . . . . . . . . 21,265 19,641
Total assets . . . . . . . . . . . . . . . . . . . . . . . . . . . . . . . . . . . . . . . . . . . . . . . . . . . . . $2,785,390 $2,836,107
LIABILITIES AND SHAREHOLDERS’ EQUITYCurrent liabilitiesTrade accounts payable . . . . . . . . . . . . . . . . . . . . . . . . . . . . . . . . . . . . . . . . . . . . . . $ 117,341 $ 110,977Accrued expenses . . . . . . . . . . . . . . . . . . . . . . . . . . . . . . . . . . . . . . . . . . . . . . . . . . 150,176 130,696Short-term borrowings . . . . . . . . . . . . . . . . . . . . . . . . . . . . . . . . . . . . . . . . . . . . . . 7,335 2,444Dividends payable . . . . . . . . . . . . . . . . . . . . . . . . . . . . . . . . . . . . . . . . . . . . . . . . . . 16,575 14,161
Total current liabilities . . . . . . . . . . . . . . . . . . . . . . . . . . . . . . . . . . . . . . . . . . . . 291,427 258,278Long-term borrowings . . . . . . . . . . . . . . . . . . . . . . . . . . . . . . . . . . . . . . . . . . . . . . . . . 779,241 806,366Deferred income taxes . . . . . . . . . . . . . . . . . . . . . . . . . . . . . . . . . . . . . . . . . . . . . . . . . 121,349 142,482Other noncurrent liabilities . . . . . . . . . . . . . . . . . . . . . . . . . . . . . . . . . . . . . . . . . . . . . 128,375 115,846
Total liabilities . . . . . . . . . . . . . . . . . . . . . . . . . . . . . . . . . . . . . . . . . . . . . . . . . . 1,320,392 1,322,972
Commitments and contingencies (Note 8)Shareholders’ equityPreferred stock:Authorized: 5,000,000 shares, $.01 per share par value; Issued: none . . . . . . . . — —
Common stock:Authorized: 150,000,000 shares, $.01 per share par value; Issued:87,732,405 shares at December 31, 2012 and 85,968,630 shares atDecember 31, 2011 . . . . . . . . . . . . . . . . . . . . . . . . . . . . . . . . . . . . . . . . . . . . . 877 860
Additional paid-in capital . . . . . . . . . . . . . . . . . . . . . . . . . . . . . . . . . . . . . . . . . . . . 550,682 490,128Retained earnings . . . . . . . . . . . . . . . . . . . . . . . . . . . . . . . . . . . . . . . . . . . . . . . . . . 1,113,541 1,142,412Treasury stock at cost: 5,005,518 shares at December 31, 2012 and2,734,747 shares at December 31, 2011 . . . . . . . . . . . . . . . . . . . . . . . . . . . . . . . (156,699) (64,796)
Accumulated other comprehensive loss . . . . . . . . . . . . . . . . . . . . . . . . . . . . . . . . . (43,403) (55,469)
Total shareholders’ equity . . . . . . . . . . . . . . . . . . . . . . . . . . . . . . . . . . . . . . . . . . 1,464,998 1,513,135
Total liabilities and shareholders’ equity . . . . . . . . . . . . . . . . . . . . . . . . . . . . . . $2,785,390 $2,836,107
See Notes to Consolidated Financial Statements.
29
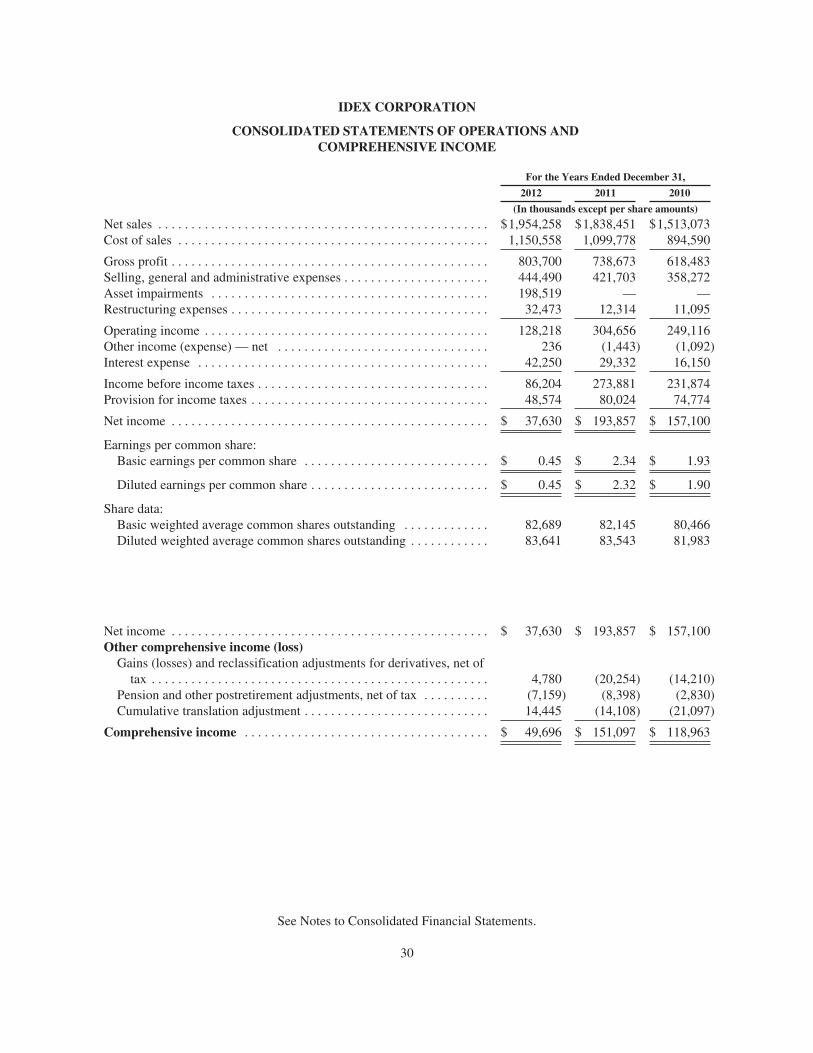
IDEX CORPORATION
CONSOLIDATED STATEMENTS OF OPERATIONS ANDCOMPREHENSIVE INCOME
For the Years Ended December 31,2012 2011 2010
(In thousands except per share amounts)Net sales . . . . . . . . . . . . . . . . . . . . . . . . . . . . . . . . . . . . . . . . . . . . . . . . . . $1,954,258 $1,838,451 $1,513,073Cost of sales . . . . . . . . . . . . . . . . . . . . . . . . . . . . . . . . . . . . . . . . . . . . . . . 1,150,558 1,099,778 894,590
Gross profit . . . . . . . . . . . . . . . . . . . . . . . . . . . . . . . . . . . . . . . . . . . . . . . . 803,700 738,673 618,483Selling, general and administrative expenses . . . . . . . . . . . . . . . . . . . . . . 444,490 421,703 358,272Asset impairments . . . . . . . . . . . . . . . . . . . . . . . . . . . . . . . . . . . . . . . . . . 198,519 — —Restructuring expenses . . . . . . . . . . . . . . . . . . . . . . . . . . . . . . . . . . . . . . . 32,473 12,314 11,095
Operating income . . . . . . . . . . . . . . . . . . . . . . . . . . . . . . . . . . . . . . . . . . . 128,218 304,656 249,116Other income (expense) — net . . . . . . . . . . . . . . . . . . . . . . . . . . . . . . . . 236 (1,443) (1,092)Interest expense . . . . . . . . . . . . . . . . . . . . . . . . . . . . . . . . . . . . . . . . . . . . 42,250 29,332 16,150
Income before income taxes . . . . . . . . . . . . . . . . . . . . . . . . . . . . . . . . . . . 86,204 273,881 231,874Provision for income taxes . . . . . . . . . . . . . . . . . . . . . . . . . . . . . . . . . . . . 48,574 80,024 74,774
Net income . . . . . . . . . . . . . . . . . . . . . . . . . . . . . . . . . . . . . . . . . . . . . . . . $ 37,630 $ 193,857 $ 157,100
Earnings per common share:Basic earnings per common share . . . . . . . . . . . . . . . . . . . . . . . . . . . . $ 0.45 $ 2.34 $ 1.93
Diluted earnings per common share . . . . . . . . . . . . . . . . . . . . . . . . . . . $ 0.45 $ 2.32 $ 1.90
Share data:Basic weighted average common shares outstanding . . . . . . . . . . . . . 82,689 82,145 80,466Diluted weighted average common shares outstanding . . . . . . . . . . . . 83,641 83,543 81,983
Net income . . . . . . . . . . . . . . . . . . . . . . . . . . . . . . . . . . . . . . . . . . . . . . . . $ 37,630 $ 193,857 $ 157,100Other comprehensive income (loss)Gains (losses) and reclassification adjustments for derivatives, net oftax . . . . . . . . . . . . . . . . . . . . . . . . . . . . . . . . . . . . . . . . . . . . . . . . . . . 4,780 (20,254) (14,210)
Pension and other postretirement adjustments, net of tax . . . . . . . . . . (7,159) (8,398) (2,830)Cumulative translation adjustment . . . . . . . . . . . . . . . . . . . . . . . . . . . . 14,445 (14,108) (21,097)
Comprehensive income . . . . . . . . . . . . . . . . . . . . . . . . . . . . . . . . . . . . . $ 49,696 $ 151,097 $ 118,963
See Notes to Consolidated Financial Statements.
30
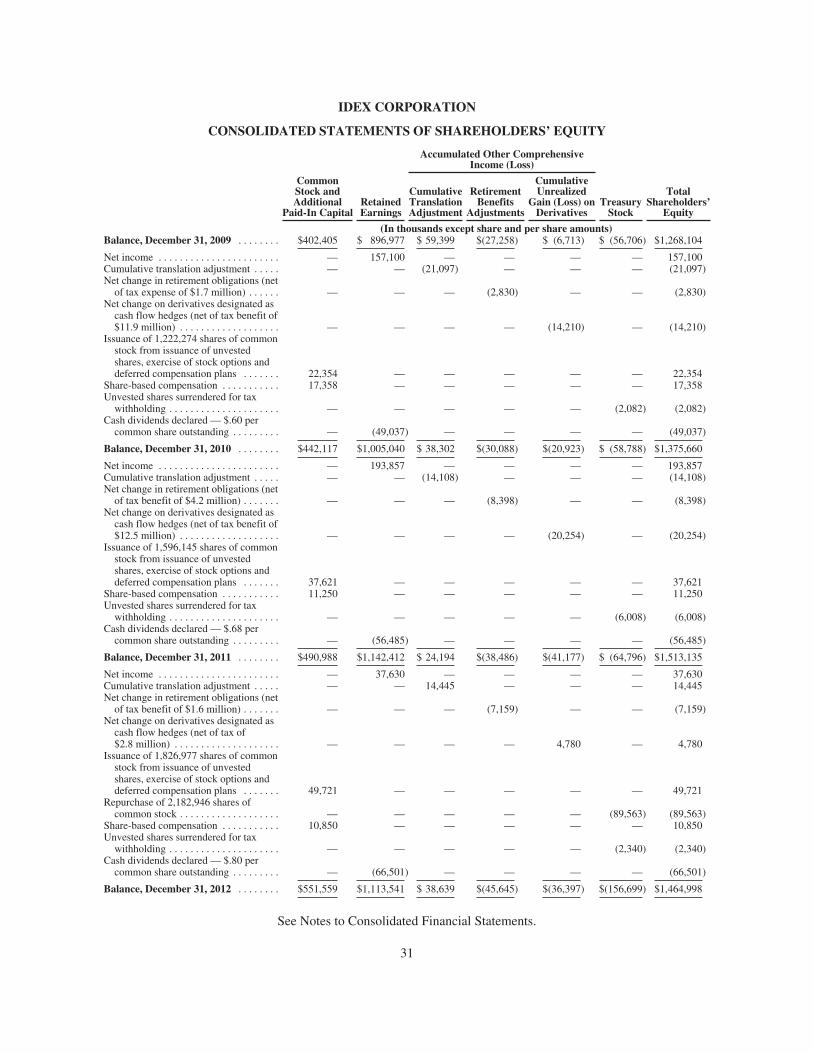
IDEX CORPORATION
CONSOLIDATED STATEMENTS OF SHAREHOLDERS’ EQUITY
CommonStock andAdditional
Paid-In CapitalRetainedEarnings
Accumulated Other ComprehensiveIncome (Loss)
TreasuryStock
TotalShareholders’
Equity
CumulativeTranslationAdjustment
RetirementBenefits
Adjustments
CumulativeUnrealized
Gain (Loss) onDerivatives
(In thousands except share and per share amounts)Balance, December 31, 2009 . . . . . . . . $402,405 $ 896,977 $ 59,399 $(27,258) $ (6,713) $ (56,706) $1,268,104
Net income . . . . . . . . . . . . . . . . . . . . . . . — 157,100 — — — — 157,100Cumulative translation adjustment . . . . . — — (21,097) — — — (21,097)Net change in retirement obligations (netof tax expense of $1.7 million) . . . . . . — — — (2,830) — — (2,830)
Net change on derivatives designated ascash flow hedges (net of tax benefit of$11.9 million) . . . . . . . . . . . . . . . . . . . — — — — (14,210) — (14,210)
Issuance of 1,222,274 shares of commonstock from issuance of unvestedshares, exercise of stock options anddeferred compensation plans . . . . . . . 22,354 — — — — — 22,354
Share-based compensation . . . . . . . . . . . 17,358 — — — — — 17,358Unvested shares surrendered for taxwithholding . . . . . . . . . . . . . . . . . . . . . — — — — — (2,082) (2,082)
Cash dividends declared — $.60 percommon share outstanding . . . . . . . . . — (49,037) — — — — (49,037)
Balance, December 31, 2010 . . . . . . . . $442,117 $1,005,040 $ 38,302 $(30,088) $(20,923) $ (58,788) $1,375,660
Net income . . . . . . . . . . . . . . . . . . . . . . . — 193,857 — — — — 193,857Cumulative translation adjustment . . . . . — — (14,108) — — — (14,108)Net change in retirement obligations (netof tax benefit of $4.2 million) . . . . . . . — — — (8,398) — — (8,398)
Net change on derivatives designated ascash flow hedges (net of tax benefit of$12.5 million) . . . . . . . . . . . . . . . . . . . — — — — (20,254) — (20,254)
Issuance of 1,596,145 shares of commonstock from issuance of unvestedshares, exercise of stock options anddeferred compensation plans . . . . . . . 37,621 — — — — — 37,621
Share-based compensation . . . . . . . . . . . 11,250 — — — — — 11,250Unvested shares surrendered for taxwithholding . . . . . . . . . . . . . . . . . . . . . — — — — — (6,008) (6,008)
Cash dividends declared — $.68 percommon share outstanding . . . . . . . . . — (56,485) — — — — (56,485)
Balance, December 31, 2011 . . . . . . . . $490,988 $1,142,412 $ 24,194 $(38,486) $(41,177) $ (64,796) $1,513,135
Net income . . . . . . . . . . . . . . . . . . . . . . . — 37,630 — — — — 37,630Cumulative translation adjustment . . . . . — — 14,445 — — — 14,445Net change in retirement obligations (netof tax benefit of $1.6 million) . . . . . . . — — — (7,159) — — (7,159)
Net change on derivatives designated ascash flow hedges (net of tax of$2.8 million) . . . . . . . . . . . . . . . . . . . . — — — — 4,780 — 4,780
Issuance of 1,826,977 shares of commonstock from issuance of unvestedshares, exercise of stock options anddeferred compensation plans . . . . . . . 49,721 — — — — — 49,721
Repurchase of 2,182,946 shares ofcommon stock . . . . . . . . . . . . . . . . . . . — — — — — (89,563) (89,563)
Share-based compensation . . . . . . . . . . . 10,850 — — — — — 10,850Unvested shares surrendered for taxwithholding . . . . . . . . . . . . . . . . . . . . . — — — — — (2,340) (2,340)
Cash dividends declared — $.80 percommon share outstanding . . . . . . . . . — (66,501) — — — — (66,501)
Balance, December 31, 2012 . . . . . . . . $551,559 $1,113,541 $ 38,639 $(45,645) $(36,397) $(156,699) $1,464,998
See Notes to Consolidated Financial Statements.
31

IDEX CORPORATION
CONSOLIDATED STATEMENTS OF CASH FLOWS
For The Years Ended December 31,2012 2011 2010
(In thousands)Cash flows from operating activitiesNet income . . . . . . . . . . . . . . . . . . . . . . . . . . . . . . . . . . . . . . . . . . . . . . . . . . . . . . . . . . . . $ 37,630 $ 193,857 $ 157,100Adjustments to reconcile net income to net cash provided by operating activities:Loss (gain) on sale of fixed assets . . . . . . . . . . . . . . . . . . . . . . . . . . . . . . . . . . . . . . . . . — (2,831) 12Asset impairments . . . . . . . . . . . . . . . . . . . . . . . . . . . . . . . . . . . . . . . . . . . . . . . . . . . . . 198,519 — —Depreciation and amortization . . . . . . . . . . . . . . . . . . . . . . . . . . . . . . . . . . . . . . . . . . . 36,827 36,882 32,367Amortization of intangible assets . . . . . . . . . . . . . . . . . . . . . . . . . . . . . . . . . . . . . . . . . 41,485 35,504 25,741Amortization of debt issuance expenses . . . . . . . . . . . . . . . . . . . . . . . . . . . . . . . . . . . . 1,685 1,263 547Share-based compensation expense . . . . . . . . . . . . . . . . . . . . . . . . . . . . . . . . . . . . . . . 13,102 12,076 17,358Deferred income taxes . . . . . . . . . . . . . . . . . . . . . . . . . . . . . . . . . . . . . . . . . . . . . . . . . . (37,229) (3,576) (7,336)Excess tax benefit from share-based compensation . . . . . . . . . . . . . . . . . . . . . . . . . . . (4,474) (5,298) (3,457)Non-cash interest expense associated with forward starting swaps . . . . . . . . . . . . . . . 7,637 3,570 —Forward starting interest rate contract settlement . . . . . . . . . . . . . . . . . . . . . . . . . . . . . — (38,707) (30,970)Changes in (net of the effect from acquisitions):Receivables . . . . . . . . . . . . . . . . . . . . . . . . . . . . . . . . . . . . . . . . . . . . . . . . . . . . . . . . 12,747 (16,488) (22,162)Inventories . . . . . . . . . . . . . . . . . . . . . . . . . . . . . . . . . . . . . . . . . . . . . . . . . . . . . . . . . 23,799 (607) (26,651)Other current assets . . . . . . . . . . . . . . . . . . . . . . . . . . . . . . . . . . . . . . . . . . . . . . . . . . (12,127) 877 (2,985)Trade accounts payable . . . . . . . . . . . . . . . . . . . . . . . . . . . . . . . . . . . . . . . . . . . . . . . (1,376) (8,645) 21,432Accrued expenses . . . . . . . . . . . . . . . . . . . . . . . . . . . . . . . . . . . . . . . . . . . . . . . . . . . 9,944 7,411 17,941
Other — net . . . . . . . . . . . . . . . . . . . . . . . . . . . . . . . . . . . . . . . . . . . . . . . . . . . . . . . . . . (1,989) 1,953 5,540Net cash flows provided by operating activities . . . . . . . . . . . . . . . . . . . . . . . . . . . . 326,180 217,241 184,477
Cash flows from investing activitiesPurchases of property, plant and equipment . . . . . . . . . . . . . . . . . . . . . . . . . . . . . . . . . (35,807) (35,175) (31,740)Acquisition of businesses, net of cash acquired . . . . . . . . . . . . . . . . . . . . . . . . . . . . . . (68,930) (443,634) (91,286)Proceeds from fixed asset disposals . . . . . . . . . . . . . . . . . . . . . . . . . . . . . . . . . . . . . . . — 12,651 720Other — net . . . . . . . . . . . . . . . . . . . . . . . . . . . . . . . . . . . . . . . . . . . . . . . . . . . . . . . . . . (529) (3,379) —
Net cash flows used in investing activities . . . . . . . . . . . . . . . . . . . . . . . . . . . . . . . . (105,266) (469,537) (122,306)Cash flows from financing activitiesBorrowings under revolving facilities and credit facilities for acquisitions . . . . . . . . . 35,000 365,000 53,866Borrowings under revolving facilities . . . . . . . . . . . . . . . . . . . . . . . . . . . . . . . . . . . . . . 94,479 471,222 —Borrowings under credit facilities . . . . . . . . . . . . . . . . . . . . . . . . . . . . . . . . . . . . . . . . . — 1,890 7,685Proceeds from issuance of 4.2% Senior Notes . . . . . . . . . . . . . . . . . . . . . . . . . . . . . . . — 349,125 —Proceeds from issuance of 2.58% Senior Euro Notes . . . . . . . . . . . . . . . . . . . . . . . . . . — — 96,762Proceeds from issuance of 4.5% Senior Notes . . . . . . . . . . . . . . . . . . . . . . . . . . . . . . . — — 298,427Payments under revolving facilities, credit facilities and term loan . . . . . . . . . . . . . . . (158,825) (906,115) (331,632)Debt issuance costs . . . . . . . . . . . . . . . . . . . . . . . . . . . . . . . . . . . . . . . . . . . . . . . . . . . . — (5,451) (2,685)Dividends paid . . . . . . . . . . . . . . . . . . . . . . . . . . . . . . . . . . . . . . . . . . . . . . . . . . . . . . . . (64,087) (54,613) (46,334)Proceeds from stock option exercises . . . . . . . . . . . . . . . . . . . . . . . . . . . . . . . . . . . . . . 45,771 33,064 18,057Excess tax benefit from share-based compensation . . . . . . . . . . . . . . . . . . . . . . . . . . . 4,474 5,298 3,457Purchase of common stock . . . . . . . . . . . . . . . . . . . . . . . . . . . . . . . . . . . . . . . . . . . . . . (89,563) — —Unvested shares surrendered for tax withholding . . . . . . . . . . . . . . . . . . . . . . . . . . . . . (2,340) (6,008) (2,082)Other . . . . . . . . . . . . . . . . . . . . . . . . . . . . . . . . . . . . . . . . . . . . . . . . . . . . . . . . . . . . . . . (1,394) — —
Net cash flows (used in) provided by financing activities . . . . . . . . . . . . . . . . . . . . (136,485) 253,412 95,521Effect of exchange rate changes on cash and cash equivalents . . . . . . . . . . . . . . . . . . . . . 4,176 (5,993) 3,918Net increase (decrease) in cash . . . . . . . . . . . . . . . . . . . . . . . . . . . . . . . . . . . . . . . . . . . . . 88,605 (4,877) 161,610Cash and cash equivalents at beginning of year . . . . . . . . . . . . . . . . . . . . . . . . . . . . . . . . 230,259 235,136 73,526Cash and cash equivalents at end of period . . . . . . . . . . . . . . . . . . . . . . . . . . . . . . . . . . . . $ 318,864 $ 230,259 $ 235,136
Supplemental cash flow informationCash paid for:Interest . . . . . . . . . . . . . . . . . . . . . . . . . . . . . . . . . . . . . . . . . . . . . . . . . . . . . . . . . . . . . . $ 32,639 $ 27,749 $ 16,776Income taxes . . . . . . . . . . . . . . . . . . . . . . . . . . . . . . . . . . . . . . . . . . . . . . . . . . . . . . . . . 87,603 66,087 73,867
Significant non-cash activities:Contingent consideration for acquisition . . . . . . . . . . . . . . . . . . . . . . . . . . . . . . . . . . . 8,370 3,000 —Debt acquired with acquisition of business . . . . . . . . . . . . . . . . . . . . . . . . . . . . . . . . . . 4,680 1,400 758
See Notes to Consolidated Financial Statements.
32

IDEX CORPORATION AND SUBSIDIARIES
NOTES TO CONSOLIDATED FINANCIAL STATEMENTS
1. Significant Accounting Policies
Business
IDEX is an applied solutions company specializing in fluid and metering technologies, health and sciencetechnologies, and fire, safety and other diversified products built to its customers’ specifications. Its products aresold in niche markets to a wide range of industries throughout the world. The Company’s products includeindustrial pumps, compressors, flow meters, injectors and valves, and related controls for use in a wide variety ofprocess applications; precision fluidics solutions, including pumps, valves, degassing equipment, correctivetubing, fittings, and complex manifolds, precision photonic solutions, optical filters and specialty medicalequipment and devices used in life science applications; precision-engineered equipment for dispensing,metering and mixing paints; refinishing equipment; and engineered products for industrial and commercialmarkets, including fire and rescue, transportation equipment, oil and gas, electronics, and communications. Theseactivities are grouped into three reportable segments: Fluid & Metering Technologies, Health & ScienceTechnologies and Fire & Safety/Diversified Products.
Principles of Consolidation
The consolidated financial statements include the Company and its subsidiaries. All intercompanytransactions and accounts have been eliminated.
Use of Estimates
The preparation of financial statements in conformity with accounting principles generally accepted in theUnited States of America requires management to make estimates and judgments that affect the reported amountsof assets and liabilities, disclosure of contingent assets and liabilities, and reported amounts of revenue andexpenses during the reporting period. Actual results could differ from those estimates. The principal areas ofestimation reflected in the financial statements are revenue recognition, sales returns and allowances, allowancefor doubtful accounts, inventory valuation, recoverability of long-lived assets, income taxes, product warranties,derivatives, contingencies and litigation, insurance-related items, impairment charges, share-based compensation,defined benefit retirement plans and purchase accounting related to acquisitions.
Revenue Recognition
The Company recognizes revenue when persuasive evidence of an arrangement exists, delivery hasoccurred, the sales price is fixed or determinable, and collectability of the sales price is reasonably assured. Forproduct sales, delivery does not occur until the products have been shipped and risk of loss has been transferredto the customer. Revenue from services is recognized when the services are provided or ratably over the contractterm. Some arrangements with customers may include multiple deliverables, including the combination ofproducts and services. In such cases the Company has identified these as separate elements in accordance withASC 605-25 and recognizes revenue consistent with the policy for each separate element based on the relativeselling price method. Revenues from certain long-term contracts are recognized on the percentage-of-completionmethod. Percentage-of-completion is measured principally by the percentage of costs incurred to date for eachcontract to the estimated total costs for such contract at completion. Provisions for estimated losses onuncompleted long-term contracts are made in the period in which such losses are determined. Due touncertainties inherent in the estimation process, it is reasonably possible that completion costs, including thosearising from contract penalty provisions and final contract settlements, will be revised in the near-term. Suchrevisions to costs and income are recognized in the period in which the revisions are determined.
33
IDEX CORPORATION AND SUBSIDIARIES
NOTES TO CONSOLIDATED FINANCIAL STATEMENTS— (Continued)
The Company records allowances for discounts, product returns and customer incentives at the time of saleas a reduction of revenue as such allowances can be reliably estimated based on historical experience and knowntrends. The Company also offers product warranties and accrues its estimated exposure for warranty claims at thetime of sale based upon the length of the warranty period, warranty costs incurred and any other relatedinformation known to the Company.
Shipping and Handling Costs
Shipping and handling costs are included in cost of sales and are recognized as a period expense during theperiod in which they are incurred.
Advertising Costs
Advertising costs of $15.3 million, $13.4 million and $11.0 million for 2012, 2011 and 2010, respectively,are expensed as incurred.
Cash and Cash Equivalents
The Company considers all highly liquid instruments purchased with an original maturity of 90 days or lessto be cash and cash equivalents.
Allowance for Doubtful Accounts
The Company maintains allowances for doubtful accounts for estimated losses as a result of customer’sinability to make required payments. Management evaluates the aging of the accounts receivable balances, thefinancial condition of its customers, historical trends and the time outstanding of specific balances to estimate theamount of accounts receivables that may not be collected in the future and records the appropriate provision.
Inventories
The Company states inventories at the lower of cost or market. Cost, which includes material, labor, andfactory overhead, is determined on a FIFO basis. We make adjustments to reduce the cost of inventory to its netrealizable value, if required, at the business unit level for estimated excess, obsolescence or impaired balances.Factors influencing these adjustments include changes in market demand, product life cycle and engineeringchanges.
Impairment of Long-Lived Assets
Long-lived assets are reviewed for impairment upon the occurrence of events or changes in circumstancesthat indicate that the carrying value of the assets may not be recoverable, as measured by comparing their netbook value to the projected undiscounted future cash flows generated by their use. Impaired assets are recordedat their estimated fair value using a discounted cash flow analysis.
Goodwill and Indefinite-Lived Intangible Assets
In accordance with ASC 350, the Company reviews the carrying value of goodwill and indefinite-livedintangible assets annually on October 31, or upon the occurrence of events or changes in circumstances thatindicate that the carrying value of the goodwill or intangible assets may not be recoverable. The Companyevaluates the recoverability of these assets based on the estimated fair value of each of the fifteen reporting unitsand the indefinite-lived intangible asset. See Note 4 for a further discussion on goodwill and intangible assets.
34

IDEX CORPORATION AND SUBSIDIARIES
NOTES TO CONSOLIDATED FINANCIAL STATEMENTS— (Continued)
Borrowing Expenses
Expenses, inclusive of commissions and professional fees, incurred in securing and issuing debt arecapitalized and included in Other noncurrent assets. These assets are amortized over the life of the relatedborrowing and the related amortization is included in Interest expense in the Consolidated Statements ofOperations.
Earnings per Common Share
Earnings per common share (“EPS”) is computed by dividing net income by the weighted average numberof shares of common stock (basic) plus common stock equivalents and unvested shares (diluted) outstandingduring the year. Common stock equivalents consist of stock options and deferred compensation units (“DCUs”)and have been included in the calculation of weighted average shares outstanding using the treasury stockmethod.
ASC 260 concludes that all outstanding unvested share-based payment awards that contain rights tononforfeitable dividends participate in undistributed earnings with common shareholders. If awards areconsidered participating securities, the Company is required to apply the two-class method of computing basicand diluted earnings per share. The Company has determined that its outstanding unvested shares areparticipating securities. Accordingly, earnings per common share were computed using the two-class methodprescribed by ASC 260. Net income attributable to common shareholders was reduced by $0.1 million,$1.2 million and $1.4 million in 2012, 2011 and 2010, respectively.
Basic weighted average shares outstanding reconciles to diluted weighted average shares outstanding asfollows:
2012 2011 2010(In thousands)
Basic weighted average common shares outstanding . . . . . . . . . . . . . . . 82,689 82,145 80,466Dilutive effect of stock options, DCUs and unvested shares . . . . . . . . . . 952 1,398 1,517
Diluted weighted average common shares outstanding . . . . . . . . . . . . . . 83,641 83,543 81,983
Options to purchase approximately 1.2 million, 0.7 million and 0.2 million shares of common stock in 2012,2011 and 2010, respectively, were not included in the computation of diluted EPS because the effect of theirinclusion would have been antidilutive.
Share-Based Compensation
The Company accounts for share-based payments in accordance with ASC 718. Accordingly, the Companyexpenses the fair value of awards made under its share-based compensation plans. That cost is recognized in theconsolidated financial statements over the requisite service period of the grants. See Note 13 for furtherdiscussion on share-based compensation.
35
IDEX CORPORATION AND SUBSIDIARIES
NOTES TO CONSOLIDATED FINANCIAL STATEMENTS— (Continued)
Depreciation and Amortization
Property and equipment are stated at cost, with depreciation and amortization provided using the straight-line method over the following estimated useful lives:
Land improvements . . . . . . . . . . . . . . . . . . . . . . . . . . . . . . . . . . . . . . . . . . . . . . . . . . . . . 8 to 12 yearsBuildings and improvements . . . . . . . . . . . . . . . . . . . . . . . . . . . . . . . . . . . . . . . . . . . . . . 8 to 30 yearsMachinery, equipment and other . . . . . . . . . . . . . . . . . . . . . . . . . . . . . . . . . . . . . . . . . . . 3 to 12 yearsOffice and transportation equipment . . . . . . . . . . . . . . . . . . . . . . . . . . . . . . . . . . . . . . . . 3 to 10 years
Certain identifiable intangible assets are amortized over their estimated useful lives using the straight-line method.The estimated useful lives used in the computation of amortization of identifiable intangible assets are as follows:
Patents . . . . . . . . . . . . . . . . . . . . . . . . . . . . . . . . . . . . . . . . . . . . . . . . . . . . . . . . . . . . . . . 5 to 17 yearsTrade names . . . . . . . . . . . . . . . . . . . . . . . . . . . . . . . . . . . . . . . . . . . . . . . . . . . . . . . . . . 10 to 20 yearsCustomer relationships . . . . . . . . . . . . . . . . . . . . . . . . . . . . . . . . . . . . . . . . . . . . . . . . . . 3 to 20 yearsNon-compete agreements . . . . . . . . . . . . . . . . . . . . . . . . . . . . . . . . . . . . . . . . . . . . . . . . 2 to 5 yearsUnpatented technology and other . . . . . . . . . . . . . . . . . . . . . . . . . . . . . . . . . . . . . . . . . . 4 to 20 years
Research and Development Expenditures
Costs associated with research and development are expensed in the period incurred and are included inCost of sales within the Consolidated Statements of Operations. Research and development expenses, whichinclude costs associated with developing new products and major improvements to existing products, were$36.4 million, $36.0 million and $31.8 million in 2012, 2011 and 2010, respectively.
Foreign Currency Translation
The functional currency of substantially all operations outside the United States is the respective localcurrency. Accordingly, those foreign currency balance sheet accounts have been translated using the exchangerates in effect as of the balance sheet date. Income statement amounts have been translated using the averageexchange rate for the year. The gains and losses resulting from changes in exchange rates from year to year havebeen reported in Accumulated other comprehensive loss in the Consolidated Balance Sheets. The effect oftransaction gains and losses is reported within Other income (expense)-net in the Consolidated Statements ofOperations.
Income Taxes
Income tax expense includes United States, state, local and international income taxes. Deferred tax assetsand liabilities are recognized for the tax consequences of temporary differences between the financial reportingand the tax basis of existing assets and liabilities and for loss carryforwards. The tax rate used to determine thedeferred tax assets and liabilities is the enacted tax rate for the year and manner in which the differences areexpected to reverse. Valuation allowances are recorded to reduce deferred tax assets to the amount that will morelikely than not be realized.
Concentration of Credit Risk
The Company is not dependent on a single customer, the largest of which accounted for less than 2% of netsales for all years presented.
36
IDEX CORPORATION AND SUBSIDIARIES
NOTES TO CONSOLIDATED FINANCIAL STATEMENTS— (Continued)
Recently Adopted Accounting Pronouncements
In May 2011, the Financial Accounting Standards Board (“FASB”) issued Accounting Standards Update(“ASU”) 2011-04, “Fair Value Measurement: Amendments to Achieve Common Fair Value Measurement andDisclosure Requirements in U.S. GAAP and IFRS” (“ASU 2011-04”), which was issued to provide a consistentdefinition of fair value and ensure that the fair value measurement and disclosure requirements are similarbetween GAAP and IFRS. ASU 2011-04 changes certain fair value measurement principles and enhances thedisclosure requirements particularly for Level 3 fair value measurements. The Company adopted this guidanceon January 1, 2012, and its adoption did not impact the consolidated financial position, results of operations orcash flows of the Company.
In June 2011, FASB issued ASU 2011-05 “Presentation of Comprehensive Income.” ASU 2011-05 allowsan entity to present components of net income and other comprehensive income in one continuous statement,referred to as the statement of comprehensive income, or in two separate, but consecutive statements. The newguidance eliminates the current option to report other comprehensive income and its components in the statementof changes in equity. While ASU 2011-05 changes the presentation of comprehensive income, there are nochanges to the components that are recognized in net income or other comprehensive income under currentaccounting guidance. In December 2011, FASB issued ASU 2011-12 “Comprehensive Income (Topic 220);Deferral of the Effective Date for Amendments to the Presentation of Reclassifications of Items Out ofAccumulated Other Comprehensive Income in Accounting Standards Update No. 2011-05.” ASU 2011-12deferred certain aspects of ASU 2011-05. The new guidance is effective for fiscal years, and interim periodswithin those years, beginning after December 15, 2011. The Company adopted ASU 2011-05 and the deferrals inASU 2011-12 on January 1, 2012 and the adoption did not impact the consolidated financial position, results ofoperations or cash flows of the Company.
New Accounting Pronouncements
In July 2012, the FASB issued ASU 2012-02, “Intangibles—Goodwill and Other (Topic 350): TestingIndefinite-Lived Intangible Assets for Impairment” (ASU 2012-02), which allows an entity to first assessqualitative factors to determine whether it is necessary to perform a quantitative impairment test of an indefinite-lived intangible asset. Under ASU 2012-02, an entity would not be required to calculate the fair value of anindefinite-lived intangible asset if the entity determines, based on qualitative assessment, that it is not more likelythan not impaired. The revised standard is effective for annual and interim impairment tests performed for fiscalyears beginning after September 15, 2012; however, early adoption is permitted. As of December 31, 2012, theCompany did not elect to early adopt ASU 2012-02, however it is not expected to have a material impact on theconsolidated financial position, results of operations or cash flows of the Company.
2. Restructuring
During 2012, 2011 and 2010, the Company recorded restructuring costs as a part of the 2011 and 2009restructuring initiatives that support the implementation of key strategic efforts designed to facilitate long-termsustainable growth through cost reduction actions, primarily consisting of employee reductions and facilityrationalization. The costs incurred related to these initiatives are included in Restructuring expenses in theConsolidated Statements of Operations while the related accruals are included in Accrued expenses in theConsolidated Balance Sheets. Severance costs primarily consist of severance benefits through payrollcontinuation, COBRA subsidies, outplacement services, conditional separation costs and employer tax liabilities,while exit costs primarily consist of asset disposals or impairments, the termination of a defined benefit plan,legal costs and relocation charges.
37

IDEX CORPORATION AND SUBSIDIARIES
NOTES TO CONSOLIDATED FINANCIAL STATEMENTS— (Continued)
2011 Initiatives
During 2012 and 2011, the Company recorded pre-tax restructuring expenses totaling $32.5 million and$12.3 million, respectively, related to our 2011 restructuring initiative for exit costs and employee severancerelated to employee reductions across various functional areas as well as facility rationalization. The 2011restructuring initiatives included severance benefits for 491 employees in 2012 and 292 employees in 2011. The2011 initiative was completed by the end of 2012 and no further restructuring is currently planned. Severancepayments are expected to be fully paid in the next 12 months using cash from operations.
2009 Initiatives
During 2010, the Company recorded $11.1 million of pre-tax restructuring expenses related to our 2009restructuring initiative for employee severance related to employee reductions across various functional areas aswell as facility closures resulting from the Company’s cost savings initiatives. The 2009 restructuring initiativeincluded severance benefits for over 700 employees. The 2009 initiatives were substantially complete by the endof 2010, with restructuring charges totaling $23.2 million for the program.
Pre-tax restructuring expenses by segment, for 2012, were as follows:
SeveranceCosts Exit Costs Total
(In thousands)Fluid & Metering Technologies . . . . . . . . . . . . . . . . . . . . . . . . . . . . $ 6,226 $ 36 $ 6,262Health & Science Technologies . . . . . . . . . . . . . . . . . . . . . . . . . . . . 11,223 3,521 14,744Fire & Safety/Diversified Products . . . . . . . . . . . . . . . . . . . . . . . . . 3,226 5,114 8,340Corporate/Other . . . . . . . . . . . . . . . . . . . . . . . . . . . . . . . . . . . . . . . . 2,844 283 3,127
Total restructuring costs . . . . . . . . . . . . . . . . . . . . . . . . . . . . . . . . . . $23,519 $8,954 $32,473
Pre-tax restructuring expenses by segment, for 2011, were as follows:
SeveranceCosts Exit Costs Total
(In thousands)Fluid & Metering Technologies . . . . . . . . . . . . . . . . . . . . . . . . . . . . $ 2,800 $ 61 $ 2,861Health & Science Technologies . . . . . . . . . . . . . . . . . . . . . . . . . . . . 2,007 123 2,130Fire & Safety/Diversified Products . . . . . . . . . . . . . . . . . . . . . . . . . 4,430 797 5,227Corporate/Other . . . . . . . . . . . . . . . . . . . . . . . . . . . . . . . . . . . . . . . . 2,096 — 2,096
Total restructuring costs . . . . . . . . . . . . . . . . . . . . . . . . . . . . . . . . . . $11,333 $981 $12,314
Pre-tax restructuring expenses by segment, for 2010, were as follows:
SeveranceCosts Exit Costs Total
(In thousands)Fluid & Metering Technologies . . . . . . . . . . . . . . . . . . . . . . . . . . . . $2,630 $ 320 $ 2,950Health & Science Technologies . . . . . . . . . . . . . . . . . . . . . . . . . . . . 3,511 1,650 5,161Fire & Safety/Diversified Products . . . . . . . . . . . . . . . . . . . . . . . . . 1,230 — 1,230Corporate/Other . . . . . . . . . . . . . . . . . . . . . . . . . . . . . . . . . . . . . . . . 1,754 — 1,754
Total restructuring costs . . . . . . . . . . . . . . . . . . . . . . . . . . . . . . . . . . $9,125 $1,970 $11,095
38
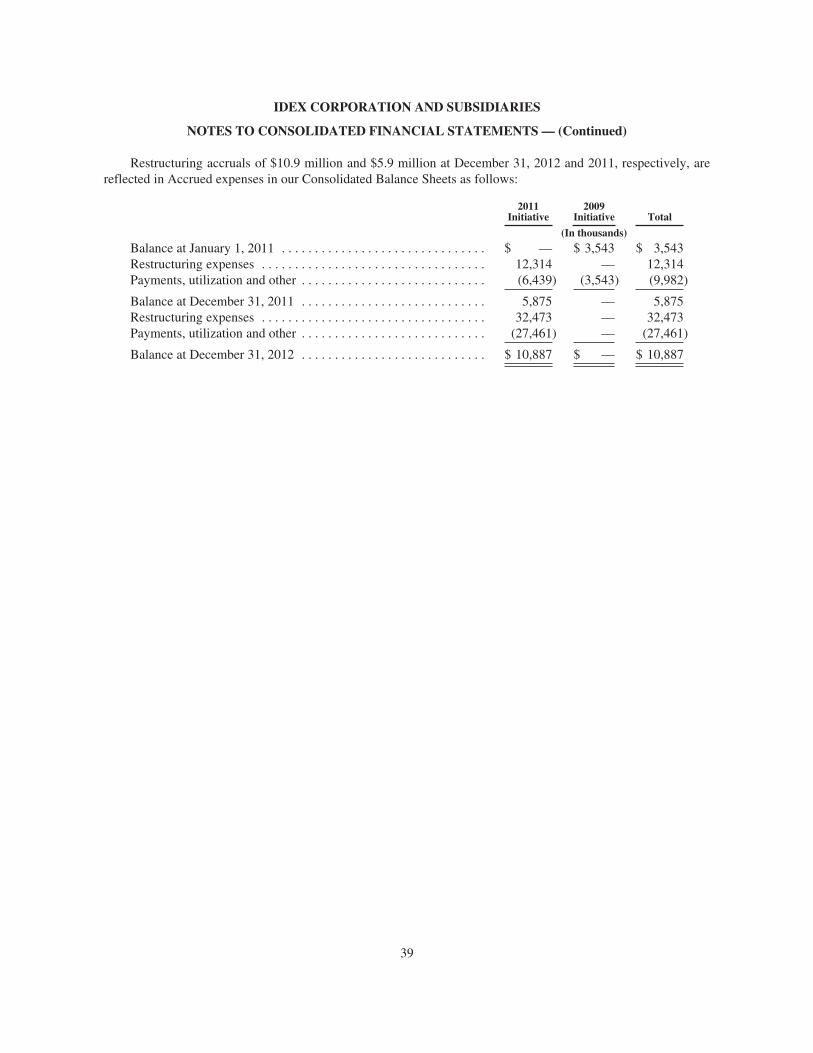
IDEX CORPORATION AND SUBSIDIARIES
NOTES TO CONSOLIDATED FINANCIAL STATEMENTS— (Continued)
Restructuring accruals of $10.9 million and $5.9 million at December 31, 2012 and 2011, respectively, arereflected in Accrued expenses in our Consolidated Balance Sheets as follows:
2011Initiative
2009Initiative Total
(In thousands)Balance at January 1, 2011 . . . . . . . . . . . . . . . . . . . . . . . . . . . . . . . $ — $ 3,543 $ 3,543Restructuring expenses . . . . . . . . . . . . . . . . . . . . . . . . . . . . . . . . . . 12,314 — 12,314Payments, utilization and other . . . . . . . . . . . . . . . . . . . . . . . . . . . . (6,439) (3,543) (9,982)
Balance at December 31, 2011 . . . . . . . . . . . . . . . . . . . . . . . . . . . . 5,875 — 5,875Restructuring expenses . . . . . . . . . . . . . . . . . . . . . . . . . . . . . . . . . . 32,473 — 32,473Payments, utilization and other . . . . . . . . . . . . . . . . . . . . . . . . . . . . (27,461) — (27,461)
Balance at December 31, 2012 . . . . . . . . . . . . . . . . . . . . . . . . . . . . $ 10,887 $ — $ 10,887
39
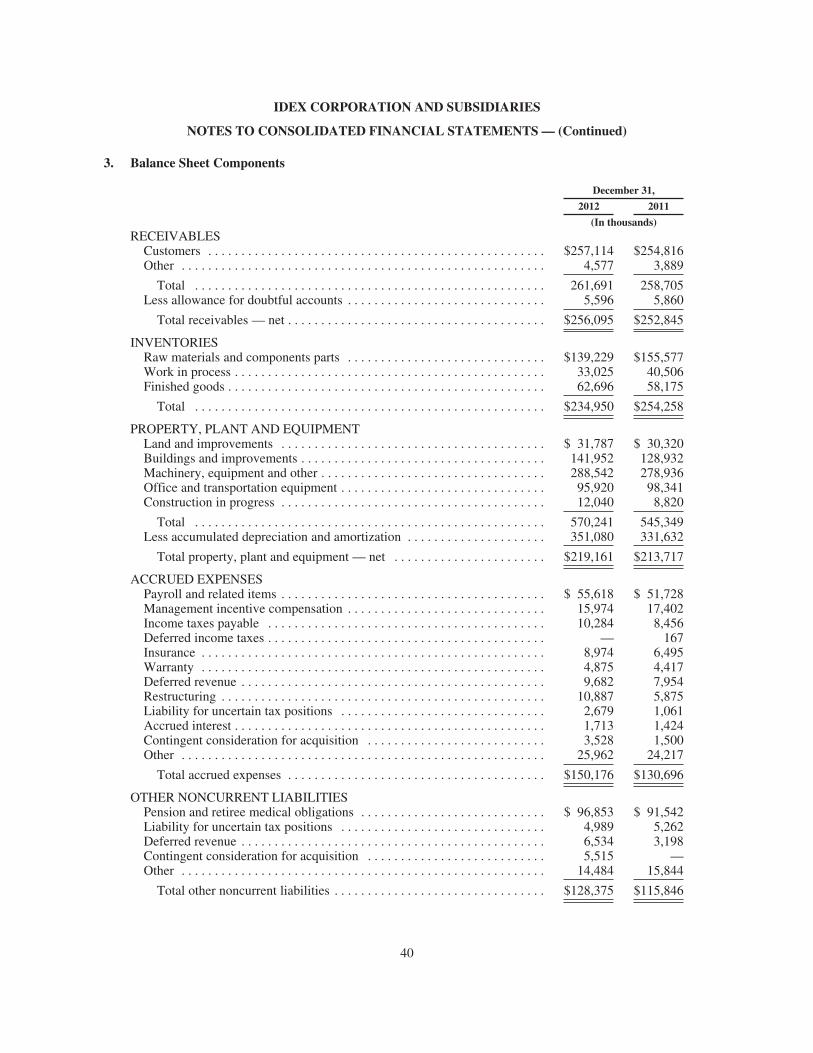
IDEX CORPORATION AND SUBSIDIARIES
NOTES TO CONSOLIDATED FINANCIAL STATEMENTS— (Continued)
3. Balance Sheet Components
December 31,2012 2011
(In thousands)RECEIVABLESCustomers . . . . . . . . . . . . . . . . . . . . . . . . . . . . . . . . . . . . . . . . . . . . . . . . . . . $257,114 $254,816Other . . . . . . . . . . . . . . . . . . . . . . . . . . . . . . . . . . . . . . . . . . . . . . . . . . . . . . . 4,577 3,889
Total . . . . . . . . . . . . . . . . . . . . . . . . . . . . . . . . . . . . . . . . . . . . . . . . . . . . . 261,691 258,705Less allowance for doubtful accounts . . . . . . . . . . . . . . . . . . . . . . . . . . . . . . 5,596 5,860
Total receivables — net . . . . . . . . . . . . . . . . . . . . . . . . . . . . . . . . . . . . . . . $256,095 $252,845
INVENTORIESRaw materials and components parts . . . . . . . . . . . . . . . . . . . . . . . . . . . . . . $139,229 $155,577Work in process . . . . . . . . . . . . . . . . . . . . . . . . . . . . . . . . . . . . . . . . . . . . . . . 33,025 40,506Finished goods . . . . . . . . . . . . . . . . . . . . . . . . . . . . . . . . . . . . . . . . . . . . . . . . 62,696 58,175
Total . . . . . . . . . . . . . . . . . . . . . . . . . . . . . . . . . . . . . . . . . . . . . . . . . . . . . $234,950 $254,258
PROPERTY, PLANT AND EQUIPMENTLand and improvements . . . . . . . . . . . . . . . . . . . . . . . . . . . . . . . . . . . . . . . . $ 31,787 $ 30,320Buildings and improvements . . . . . . . . . . . . . . . . . . . . . . . . . . . . . . . . . . . . . 141,952 128,932Machinery, equipment and other . . . . . . . . . . . . . . . . . . . . . . . . . . . . . . . . . . 288,542 278,936Office and transportation equipment . . . . . . . . . . . . . . . . . . . . . . . . . . . . . . . 95,920 98,341Construction in progress . . . . . . . . . . . . . . . . . . . . . . . . . . . . . . . . . . . . . . . . 12,040 8,820
Total . . . . . . . . . . . . . . . . . . . . . . . . . . . . . . . . . . . . . . . . . . . . . . . . . . . . . 570,241 545,349Less accumulated depreciation and amortization . . . . . . . . . . . . . . . . . . . . . 351,080 331,632
Total property, plant and equipment — net . . . . . . . . . . . . . . . . . . . . . . . $219,161 $213,717
ACCRUED EXPENSESPayroll and related items . . . . . . . . . . . . . . . . . . . . . . . . . . . . . . . . . . . . . . . . $ 55,618 $ 51,728Management incentive compensation . . . . . . . . . . . . . . . . . . . . . . . . . . . . . . 15,974 17,402Income taxes payable . . . . . . . . . . . . . . . . . . . . . . . . . . . . . . . . . . . . . . . . . . 10,284 8,456Deferred income taxes . . . . . . . . . . . . . . . . . . . . . . . . . . . . . . . . . . . . . . . . . . — 167Insurance . . . . . . . . . . . . . . . . . . . . . . . . . . . . . . . . . . . . . . . . . . . . . . . . . . . . 8,974 6,495Warranty . . . . . . . . . . . . . . . . . . . . . . . . . . . . . . . . . . . . . . . . . . . . . . . . . . . . 4,875 4,417Deferred revenue . . . . . . . . . . . . . . . . . . . . . . . . . . . . . . . . . . . . . . . . . . . . . . 9,682 7,954Restructuring . . . . . . . . . . . . . . . . . . . . . . . . . . . . . . . . . . . . . . . . . . . . . . . . . 10,887 5,875Liability for uncertain tax positions . . . . . . . . . . . . . . . . . . . . . . . . . . . . . . . 2,679 1,061Accrued interest . . . . . . . . . . . . . . . . . . . . . . . . . . . . . . . . . . . . . . . . . . . . . . . 1,713 1,424Contingent consideration for acquisition . . . . . . . . . . . . . . . . . . . . . . . . . . . 3,528 1,500Other . . . . . . . . . . . . . . . . . . . . . . . . . . . . . . . . . . . . . . . . . . . . . . . . . . . . . . . 25,962 24,217
Total accrued expenses . . . . . . . . . . . . . . . . . . . . . . . . . . . . . . . . . . . . . . . $150,176 $130,696
OTHER NONCURRENT LIABILITIESPension and retiree medical obligations . . . . . . . . . . . . . . . . . . . . . . . . . . . . $ 96,853 $ 91,542Liability for uncertain tax positions . . . . . . . . . . . . . . . . . . . . . . . . . . . . . . . 4,989 5,262Deferred revenue . . . . . . . . . . . . . . . . . . . . . . . . . . . . . . . . . . . . . . . . . . . . . . 6,534 3,198Contingent consideration for acquisition . . . . . . . . . . . . . . . . . . . . . . . . . . . 5,515 —Other . . . . . . . . . . . . . . . . . . . . . . . . . . . . . . . . . . . . . . . . . . . . . . . . . . . . . . . 14,484 15,844
Total other noncurrent liabilities . . . . . . . . . . . . . . . . . . . . . . . . . . . . . . . . $128,375 $115,846
40
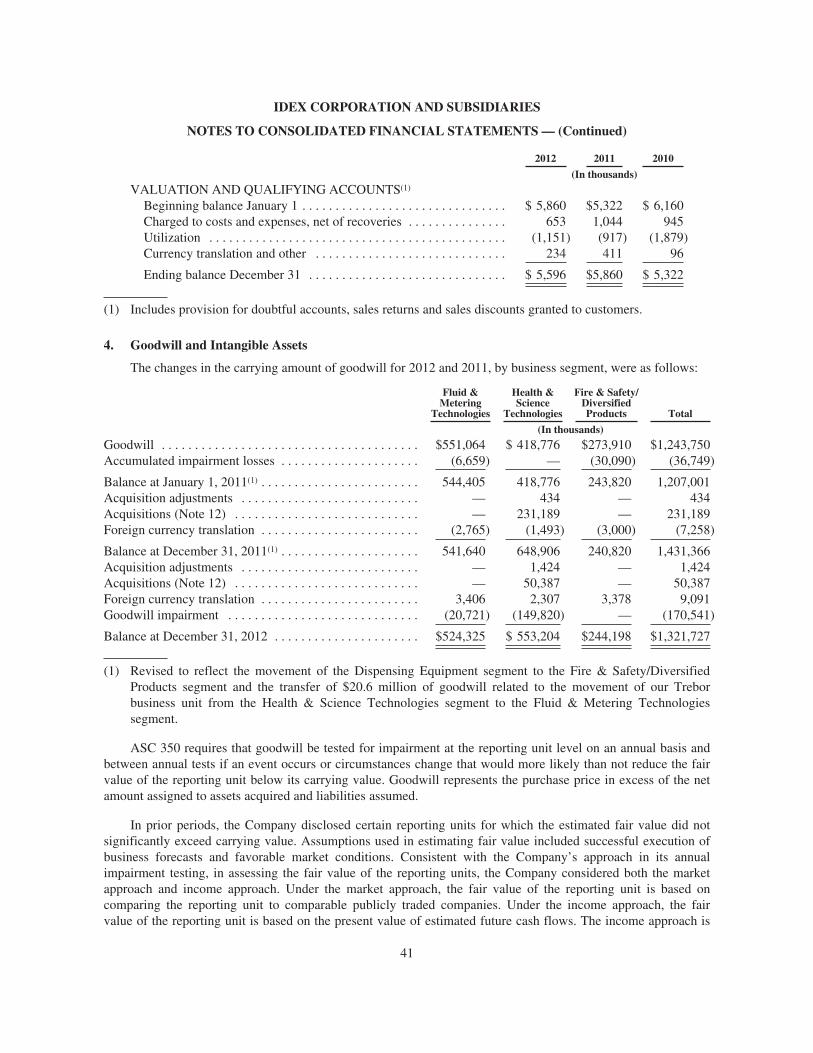
IDEX CORPORATION AND SUBSIDIARIES
NOTES TO CONSOLIDATED FINANCIAL STATEMENTS— (Continued)
2012 2011 2010(In thousands)
VALUATION AND QUALIFYING ACCOUNTS(1)
Beginning balance January 1 . . . . . . . . . . . . . . . . . . . . . . . . . . . . . . . $ 5,860 $5,322 $ 6,160Charged to costs and expenses, net of recoveries . . . . . . . . . . . . . . . 653 1,044 945Utilization . . . . . . . . . . . . . . . . . . . . . . . . . . . . . . . . . . . . . . . . . . . . . (1,151) (917) (1,879)Currency translation and other . . . . . . . . . . . . . . . . . . . . . . . . . . . . . 234 411 96
Ending balance December 31 . . . . . . . . . . . . . . . . . . . . . . . . . . . . . . $ 5,596 $5,860 $ 5,322
(1) Includes provision for doubtful accounts, sales returns and sales discounts granted to customers.
4. Goodwill and Intangible Assets
The changes in the carrying amount of goodwill for 2012 and 2011, by business segment, were as follows:
Fluid &Metering
Technologies
Health &Science
Technologies
Fire & Safety/DiversifiedProducts Total
(In thousands)Goodwill . . . . . . . . . . . . . . . . . . . . . . . . . . . . . . . . . . . . . . . $551,064 $ 418,776 $273,910 $1,243,750Accumulated impairment losses . . . . . . . . . . . . . . . . . . . . . (6,659) — (30,090) (36,749)
Balance at January 1, 2011(1) . . . . . . . . . . . . . . . . . . . . . . . . 544,405 418,776 243,820 1,207,001Acquisition adjustments . . . . . . . . . . . . . . . . . . . . . . . . . . . — 434 — 434Acquisitions (Note 12) . . . . . . . . . . . . . . . . . . . . . . . . . . . . — 231,189 — 231,189Foreign currency translation . . . . . . . . . . . . . . . . . . . . . . . . (2,765) (1,493) (3,000) (7,258)
Balance at December 31, 2011(1) . . . . . . . . . . . . . . . . . . . . . 541,640 648,906 240,820 1,431,366Acquisition adjustments . . . . . . . . . . . . . . . . . . . . . . . . . . . — 1,424 — 1,424Acquisitions (Note 12) . . . . . . . . . . . . . . . . . . . . . . . . . . . . — 50,387 — 50,387Foreign currency translation . . . . . . . . . . . . . . . . . . . . . . . . 3,406 2,307 3,378 9,091Goodwill impairment . . . . . . . . . . . . . . . . . . . . . . . . . . . . . (20,721) (149,820) — (170,541)
Balance at December 31, 2012 . . . . . . . . . . . . . . . . . . . . . . $524,325 $ 553,204 $244,198 $1,321,727
(1) Revised to reflect the movement of the Dispensing Equipment segment to the Fire & Safety/DiversifiedProducts segment and the transfer of $20.6 million of goodwill related to the movement of our Treborbusiness unit from the Health & Science Technologies segment to the Fluid & Metering Technologiessegment.
ASC 350 requires that goodwill be tested for impairment at the reporting unit level on an annual basis andbetween annual tests if an event occurs or circumstances change that would more likely than not reduce the fairvalue of the reporting unit below its carrying value. Goodwill represents the purchase price in excess of the netamount assigned to assets acquired and liabilities assumed.
In prior periods, the Company disclosed certain reporting units for which the estimated fair value did notsignificantly exceed carrying value. Assumptions used in estimating fair value included successful execution ofbusiness forecasts and favorable market conditions. Consistent with the Company’s approach in its annualimpairment testing, in assessing the fair value of the reporting units, the Company considered both the marketapproach and income approach. Under the market approach, the fair value of the reporting unit is based oncomparing the reporting unit to comparable publicly traded companies. Under the income approach, the fairvalue of the reporting unit is based on the present value of estimated future cash flows. The income approach is
41
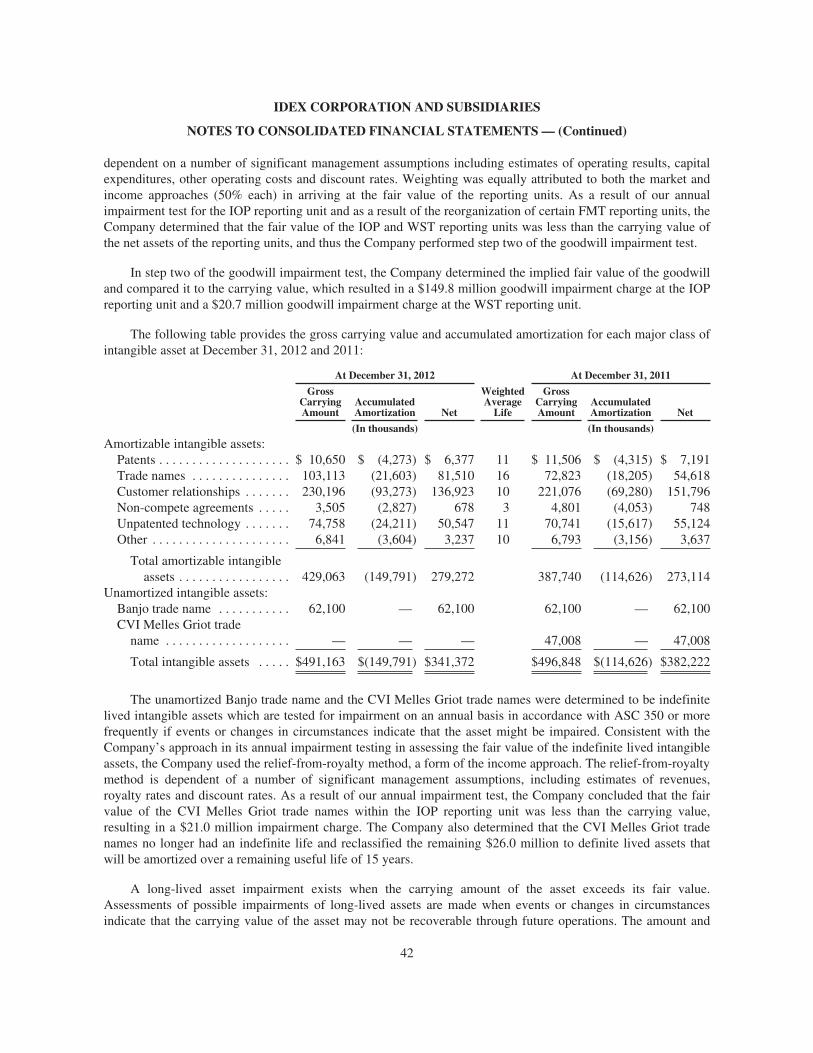
IDEX CORPORATION AND SUBSIDIARIES
NOTES TO CONSOLIDATED FINANCIAL STATEMENTS— (Continued)
dependent on a number of significant management assumptions including estimates of operating results, capitalexpenditures, other operating costs and discount rates. Weighting was equally attributed to both the market andincome approaches (50% each) in arriving at the fair value of the reporting units. As a result of our annualimpairment test for the IOP reporting unit and as a result of the reorganization of certain FMT reporting units, theCompany determined that the fair value of the IOP and WST reporting units was less than the carrying value ofthe net assets of the reporting units, and thus the Company performed step two of the goodwill impairment test.
In step two of the goodwill impairment test, the Company determined the implied fair value of the goodwilland compared it to the carrying value, which resulted in a $149.8 million goodwill impairment charge at the IOPreporting unit and a $20.7 million goodwill impairment charge at the WST reporting unit.
The following table provides the gross carrying value and accumulated amortization for each major class ofintangible asset at December 31, 2012 and 2011:
At December 31, 2012 At December 31, 2011Gross
CarryingAmount
AccumulatedAmortization Net
WeightedAverageLife
GrossCarryingAmount
AccumulatedAmortization Net
(In thousands) (In thousands)Amortizable intangible assets:Patents . . . . . . . . . . . . . . . . . . . . $ 10,650 $ (4,273) $ 6,377 11 $ 11,506 $ (4,315) $ 7,191Trade names . . . . . . . . . . . . . . . 103,113 (21,603) 81,510 16 72,823 (18,205) 54,618Customer relationships . . . . . . . 230,196 (93,273) 136,923 10 221,076 (69,280) 151,796Non-compete agreements . . . . . 3,505 (2,827) 678 3 4,801 (4,053) 748Unpatented technology . . . . . . . 74,758 (24,211) 50,547 11 70,741 (15,617) 55,124Other . . . . . . . . . . . . . . . . . . . . . 6,841 (3,604) 3,237 10 6,793 (3,156) 3,637
Total amortizable intangibleassets . . . . . . . . . . . . . . . . . 429,063 (149,791) 279,272 387,740 (114,626) 273,114
Unamortized intangible assets:Banjo trade name . . . . . . . . . . . 62,100 — 62,100 62,100 — 62,100CVI Melles Griot tradename . . . . . . . . . . . . . . . . . . . — — — 47,008 — 47,008
Total intangible assets . . . . . $491,163 $(149,791) $341,372 $496,848 $(114,626) $382,222
The unamortized Banjo trade name and the CVI Melles Griot trade names were determined to be indefinitelived intangible assets which are tested for impairment on an annual basis in accordance with ASC 350 or morefrequently if events or changes in circumstances indicate that the asset might be impaired. Consistent with theCompany’s approach in its annual impairment testing in assessing the fair value of the indefinite lived intangibleassets, the Company used the relief-from-royalty method, a form of the income approach. The relief-from-royaltymethod is dependent of a number of significant management assumptions, including estimates of revenues,royalty rates and discount rates. As a result of our annual impairment test, the Company concluded that the fairvalue of the CVI Melles Griot trade names within the IOP reporting unit was less than the carrying value,resulting in a $21.0 million impairment charge. The Company also determined that the CVI Melles Griot tradenames no longer had an indefinite life and reclassified the remaining $26.0 million to definite lived assets thatwill be amortized over a remaining useful life of 15 years.
A long-lived asset impairment exists when the carrying amount of the asset exceeds its fair value.Assessments of possible impairments of long-lived assets are made when events or changes in circumstancesindicate that the carrying value of the asset may not be recoverable through future operations. The amount and
42
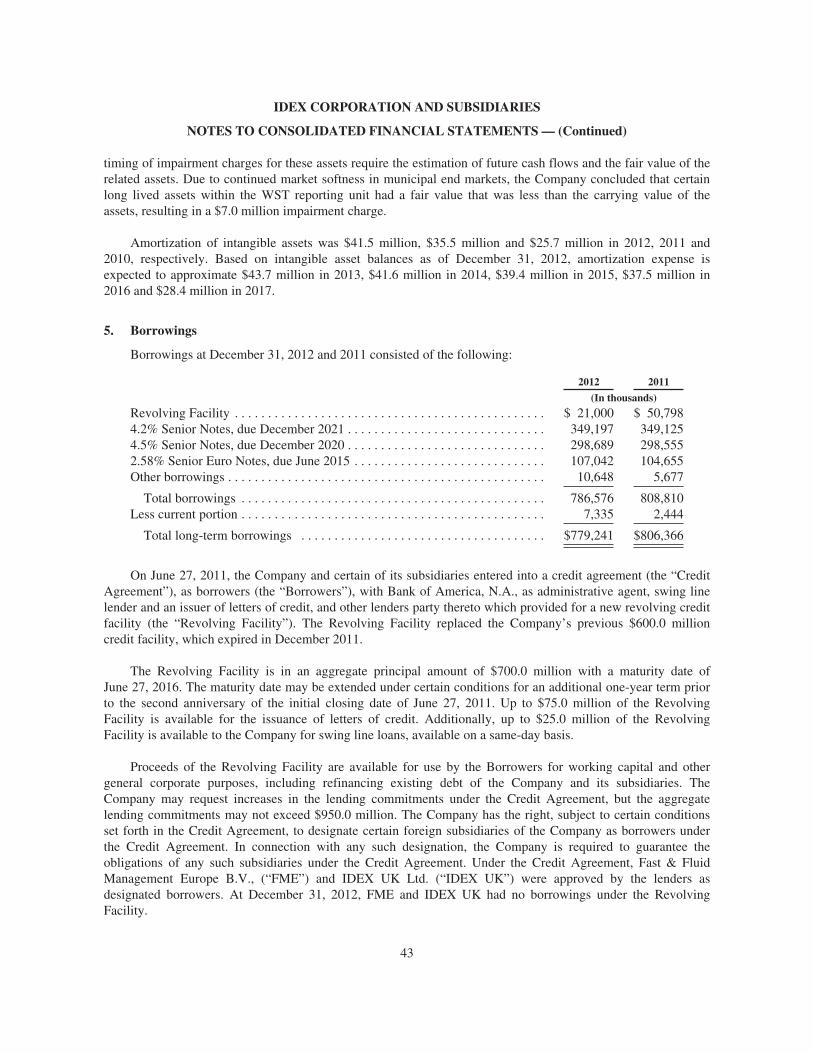
IDEX CORPORATION AND SUBSIDIARIES
NOTES TO CONSOLIDATED FINANCIAL STATEMENTS— (Continued)
timing of impairment charges for these assets require the estimation of future cash flows and the fair value of therelated assets. Due to continued market softness in municipal end markets, the Company concluded that certainlong lived assets within the WST reporting unit had a fair value that was less than the carrying value of theassets, resulting in a $7.0 million impairment charge.
Amortization of intangible assets was $41.5 million, $35.5 million and $25.7 million in 2012, 2011 and2010, respectively. Based on intangible asset balances as of December 31, 2012, amortization expense isexpected to approximate $43.7 million in 2013, $41.6 million in 2014, $39.4 million in 2015, $37.5 million in2016 and $28.4 million in 2017.
5. Borrowings
Borrowings at December 31, 2012 and 2011 consisted of the following:
2012 2011(In thousands)
Revolving Facility . . . . . . . . . . . . . . . . . . . . . . . . . . . . . . . . . . . . . . . . . . . . . . . $ 21,000 $ 50,7984.2% Senior Notes, due December 2021 . . . . . . . . . . . . . . . . . . . . . . . . . . . . . . 349,197 349,1254.5% Senior Notes, due December 2020 . . . . . . . . . . . . . . . . . . . . . . . . . . . . . . 298,689 298,5552.58% Senior Euro Notes, due June 2015 . . . . . . . . . . . . . . . . . . . . . . . . . . . . . 107,042 104,655Other borrowings . . . . . . . . . . . . . . . . . . . . . . . . . . . . . . . . . . . . . . . . . . . . . . . . 10,648 5,677
Total borrowings . . . . . . . . . . . . . . . . . . . . . . . . . . . . . . . . . . . . . . . . . . . . . . 786,576 808,810Less current portion . . . . . . . . . . . . . . . . . . . . . . . . . . . . . . . . . . . . . . . . . . . . . . 7,335 2,444
Total long-term borrowings . . . . . . . . . . . . . . . . . . . . . . . . . . . . . . . . . . . . . $779,241 $806,366
On June 27, 2011, the Company and certain of its subsidiaries entered into a credit agreement (the “CreditAgreement”), as borrowers (the “Borrowers”), with Bank of America, N.A., as administrative agent, swing linelender and an issuer of letters of credit, and other lenders party thereto which provided for a new revolving creditfacility (the “Revolving Facility”). The Revolving Facility replaced the Company’s previous $600.0 millioncredit facility, which expired in December 2011.
The Revolving Facility is in an aggregate principal amount of $700.0 million with a maturity date ofJune 27, 2016. The maturity date may be extended under certain conditions for an additional one-year term priorto the second anniversary of the initial closing date of June 27, 2011. Up to $75.0 million of the RevolvingFacility is available for the issuance of letters of credit. Additionally, up to $25.0 million of the RevolvingFacility is available to the Company for swing line loans, available on a same-day basis.
Proceeds of the Revolving Facility are available for use by the Borrowers for working capital and othergeneral corporate purposes, including refinancing existing debt of the Company and its subsidiaries. TheCompany may request increases in the lending commitments under the Credit Agreement, but the aggregatelending commitments may not exceed $950.0 million. The Company has the right, subject to certain conditionsset forth in the Credit Agreement, to designate certain foreign subsidiaries of the Company as borrowers underthe Credit Agreement. In connection with any such designation, the Company is required to guarantee theobligations of any such subsidiaries under the Credit Agreement. Under the Credit Agreement, Fast & FluidManagement Europe B.V., (“FME”) and IDEX UK Ltd. (“IDEX UK”) were approved by the lenders asdesignated borrowers. At December 31, 2012, FME and IDEX UK had no borrowings under the RevolvingFacility.
43
IDEX CORPORATION AND SUBSIDIARIES
NOTES TO CONSOLIDATED FINANCIAL STATEMENTS— (Continued)
Borrowings under the Revolving Facility bear interest, at either an alternate base rate or an adjusted LIBORrate plus, an applicable margin. Such applicable margin is based on the Company’s senior, unsecured, long-termdebt rating and can range from .875% to 1.70%. Based on the Company’s credit rating at December 31, 2012, theapplicable margin was 1.05%. Interest is payable (a) in the case of base rate loans, quarterly, and (b) in the caseof LIBOR rate loans, on the maturity date of the borrowing, or quarterly from the effective date for borrowingsexceeding three months. An annual Revolving Facility fee, also based on the Company’s credit rating, iscurrently 20 basis points and is payable quarterly.
The Credit Agreement contains affirmative and negative covenants that the Company believes are usual andcustomary for senior unsecured credit agreements, including a financial covenant requiring the maintenance of a3.25 to 1.0 or lower leverage ratio, which is the ratio of the Company’s consolidated total debt to its consolidatedEBITDA, each as defined in the Credit Agreement.
The Credit Agreement also contains customary events of default (subject to grace periods, as appropriate)including among others: nonpayment of principal, interest or fees; breach of the representations or warranties inany material respect; breach of the financial, affirmative or negative covenants; payment default on, oracceleration of, other material indebtedness; bankruptcy or insolvency; material judgments entered against theCompany or any of its subsidiaries; certain specified events under the Employee Retirement Income Security Actof 1974, as amended; certain changes in control of the Company; and the invalidity or unenforceability of theCredit Agreement or other documents associated with the Credit Agreement.
At December 31, 2012, $21.0 million was outstanding under the Revolving Facility, with $6.5 million ofoutstanding letters of credit, resulting in net available borrowing capacity under the Revolving Facility atDecember 31, 2012 of approximately $672.5 million.
On June 9, 2010, the Company completed a private placement of €81.0 million ($96.8 million) aggregateprincipal amount of 2.58% Series 2010 Senior Euro Notes due June 9, 2015 (“2.58% Senior Euro Notes”)pursuant to a Master Note Purchase Agreement, dated June 9, 2010 (the “Purchase Agreement”). The PurchaseAgreement provides for the issuance of additional series of notes in the future, provided that the aggregateprincipal amount outstanding under the agreement at any time does not exceed $750.0 million. The 2.58% SeniorEuro Notes bear interest at a rate of 2.58% per annum, which is payable semi-annually in arrears on eachJune 9th and December 9th and will mature on June 9, 2015. The 2.58% Senior Euro Notes are unsecuredobligations of the Company and rank pari passu in right of payment with all of the Company’s other senior debt.The Company may at any time prepay all or any portion of the 2.58% Senior Euro Notes; provided that any suchportion is greater than 5% of the aggregate principal amount of Notes then outstanding under the PurchaseAgreement. In the event of a prepayment, the Company would be required to pay an amount equal to par plusaccrued interest plus a make-whole premium. The Purchase Agreement contains certain covenants that restrictthe Company’s ability to, among other things, transfer or sell assets, create liens and engage in certain mergers orconsolidations. In addition, the Company must comply with a leverage ratio and interest coverage ratio as setforth in the Purchase Agreement. The Purchase Agreement provides for customary events of default. In the caseof an event of default arising from specified events of bankruptcy or insolvency, all outstanding 2.58% SeniorEuro Notes will become due and payable immediately without further action or notice. In the case of paymentevents of defaults, any holder of the 2.58% Senior Euro Notes affected thereby may declare all the 2.58% SeniorEuro Notes held by it due and payable immediately. In the case of any other event of default, a majority of theholders of the 2.58% Senior Euro Notes may declare all the 2.58% Senior Euro Notes to be due and payableimmediately.
On December 6, 2010, the Company completed a public offering of $300.0 million 4.5% senior notes dueDecember 15, 2020 (“4.5% Senior Notes”). The net proceeds from the offering of $295.7 million, after deducting
44
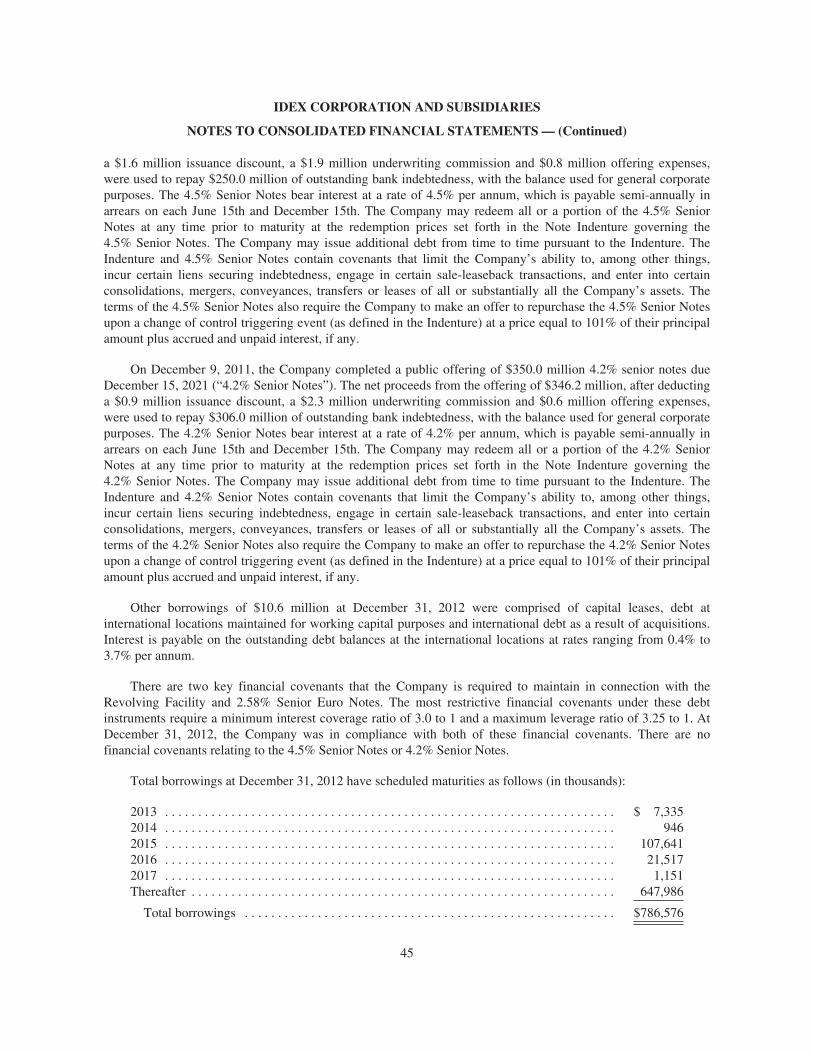
IDEX CORPORATION AND SUBSIDIARIES
NOTES TO CONSOLIDATED FINANCIAL STATEMENTS— (Continued)
a $1.6 million issuance discount, a $1.9 million underwriting commission and $0.8 million offering expenses,were used to repay $250.0 million of outstanding bank indebtedness, with the balance used for general corporatepurposes. The 4.5% Senior Notes bear interest at a rate of 4.5% per annum, which is payable semi-annually inarrears on each June 15th and December 15th. The Company may redeem all or a portion of the 4.5% SeniorNotes at any time prior to maturity at the redemption prices set forth in the Note Indenture governing the4.5% Senior Notes. The Company may issue additional debt from time to time pursuant to the Indenture. TheIndenture and 4.5% Senior Notes contain covenants that limit the Company’s ability to, among other things,incur certain liens securing indebtedness, engage in certain sale-leaseback transactions, and enter into certainconsolidations, mergers, conveyances, transfers or leases of all or substantially all the Company’s assets. Theterms of the 4.5% Senior Notes also require the Company to make an offer to repurchase the 4.5% Senior Notesupon a change of control triggering event (as defined in the Indenture) at a price equal to 101% of their principalamount plus accrued and unpaid interest, if any.
On December 9, 2011, the Company completed a public offering of $350.0 million 4.2% senior notes dueDecember 15, 2021 (“4.2% Senior Notes”). The net proceeds from the offering of $346.2 million, after deductinga $0.9 million issuance discount, a $2.3 million underwriting commission and $0.6 million offering expenses,were used to repay $306.0 million of outstanding bank indebtedness, with the balance used for general corporatepurposes. The 4.2% Senior Notes bear interest at a rate of 4.2% per annum, which is payable semi-annually inarrears on each June 15th and December 15th. The Company may redeem all or a portion of the 4.2% SeniorNotes at any time prior to maturity at the redemption prices set forth in the Note Indenture governing the4.2% Senior Notes. The Company may issue additional debt from time to time pursuant to the Indenture. TheIndenture and 4.2% Senior Notes contain covenants that limit the Company’s ability to, among other things,incur certain liens securing indebtedness, engage in certain sale-leaseback transactions, and enter into certainconsolidations, mergers, conveyances, transfers or leases of all or substantially all the Company’s assets. Theterms of the 4.2% Senior Notes also require the Company to make an offer to repurchase the 4.2% Senior Notesupon a change of control triggering event (as defined in the Indenture) at a price equal to 101% of their principalamount plus accrued and unpaid interest, if any.
Other borrowings of $10.6 million at December 31, 2012 were comprised of capital leases, debt atinternational locations maintained for working capital purposes and international debt as a result of acquisitions.Interest is payable on the outstanding debt balances at the international locations at rates ranging from 0.4% to3.7% per annum.
There are two key financial covenants that the Company is required to maintain in connection with theRevolving Facility and 2.58% Senior Euro Notes. The most restrictive financial covenants under these debtinstruments require a minimum interest coverage ratio of 3.0 to 1 and a maximum leverage ratio of 3.25 to 1. AtDecember 31, 2012, the Company was in compliance with both of these financial covenants. There are nofinancial covenants relating to the 4.5% Senior Notes or 4.2% Senior Notes.
Total borrowings at December 31, 2012 have scheduled maturities as follows (in thousands):
2013 . . . . . . . . . . . . . . . . . . . . . . . . . . . . . . . . . . . . . . . . . . . . . . . . . . . . . . . . . . . . . . . . . . . . $ 7,3352014 . . . . . . . . . . . . . . . . . . . . . . . . . . . . . . . . . . . . . . . . . . . . . . . . . . . . . . . . . . . . . . . . . . . . 9462015 . . . . . . . . . . . . . . . . . . . . . . . . . . . . . . . . . . . . . . . . . . . . . . . . . . . . . . . . . . . . . . . . . . . . 107,6412016 . . . . . . . . . . . . . . . . . . . . . . . . . . . . . . . . . . . . . . . . . . . . . . . . . . . . . . . . . . . . . . . . . . . . 21,5172017 . . . . . . . . . . . . . . . . . . . . . . . . . . . . . . . . . . . . . . . . . . . . . . . . . . . . . . . . . . . . . . . . . . . . 1,151Thereafter . . . . . . . . . . . . . . . . . . . . . . . . . . . . . . . . . . . . . . . . . . . . . . . . . . . . . . . . . . . . . . . . 647,986
Total borrowings . . . . . . . . . . . . . . . . . . . . . . . . . . . . . . . . . . . . . . . . . . . . . . . . . . . . . . . . $786,576
45
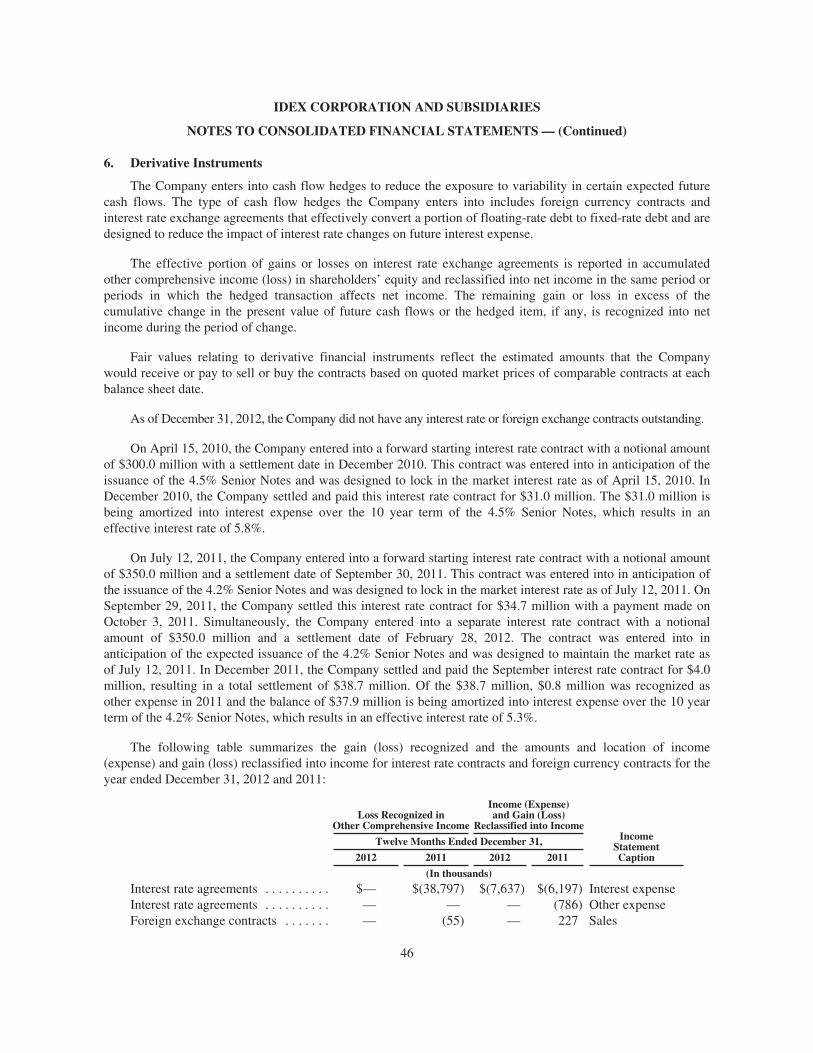
IDEX CORPORATION AND SUBSIDIARIES
NOTES TO CONSOLIDATED FINANCIAL STATEMENTS— (Continued)
6. Derivative Instruments
The Company enters into cash flow hedges to reduce the exposure to variability in certain expected futurecash flows. The type of cash flow hedges the Company enters into includes foreign currency contracts andinterest rate exchange agreements that effectively convert a portion of floating-rate debt to fixed-rate debt and aredesigned to reduce the impact of interest rate changes on future interest expense.
The effective portion of gains or losses on interest rate exchange agreements is reported in accumulatedother comprehensive income (loss) in shareholders’ equity and reclassified into net income in the same period orperiods in which the hedged transaction affects net income. The remaining gain or loss in excess of thecumulative change in the present value of future cash flows or the hedged item, if any, is recognized into netincome during the period of change.
Fair values relating to derivative financial instruments reflect the estimated amounts that the Companywould receive or pay to sell or buy the contracts based on quoted market prices of comparable contracts at eachbalance sheet date.
As of December 31, 2012, the Company did not have any interest rate or foreign exchange contracts outstanding.
On April 15, 2010, the Company entered into a forward starting interest rate contract with a notional amountof $300.0 million with a settlement date in December 2010. This contract was entered into in anticipation of theissuance of the 4.5% Senior Notes and was designed to lock in the market interest rate as of April 15, 2010. InDecember 2010, the Company settled and paid this interest rate contract for $31.0 million. The $31.0 million isbeing amortized into interest expense over the 10 year term of the 4.5% Senior Notes, which results in aneffective interest rate of 5.8%.
On July 12, 2011, the Company entered into a forward starting interest rate contract with a notional amountof $350.0 million and a settlement date of September 30, 2011. This contract was entered into in anticipation ofthe issuance of the 4.2% Senior Notes and was designed to lock in the market interest rate as of July 12, 2011. OnSeptember 29, 2011, the Company settled this interest rate contract for $34.7 million with a payment made onOctober 3, 2011. Simultaneously, the Company entered into a separate interest rate contract with a notionalamount of $350.0 million and a settlement date of February 28, 2012. The contract was entered into inanticipation of the expected issuance of the 4.2% Senior Notes and was designed to maintain the market rate asof July 12, 2011. In December 2011, the Company settled and paid the September interest rate contract for $4.0million, resulting in a total settlement of $38.7 million. Of the $38.7 million, $0.8 million was recognized asother expense in 2011 and the balance of $37.9 million is being amortized into interest expense over the 10 yearterm of the 4.2% Senior Notes, which results in an effective interest rate of 5.3%.
The following table summarizes the gain (loss) recognized and the amounts and location of income(expense) and gain (loss) reclassified into income for interest rate contracts and foreign currency contracts for theyear ended December 31, 2012 and 2011:
Loss Recognized inOther Comprehensive Income
Income (Expense)and Gain (Loss)
Reclassified into IncomeIncome
StatementCaption
Twelve Months Ended December 31,2012 2011 2012 2011
(In thousands)Interest rate agreements . . . . . . . . . . $— $(38,797) $(7,637) $(6,197) Interest expenseInterest rate agreements . . . . . . . . . . — — — (786) Other expenseForeign exchange contracts . . . . . . . — (55) — 227 Sales
46

IDEX CORPORATION AND SUBSIDIARIES
NOTES TO CONSOLIDATED FINANCIAL STATEMENTS— (Continued)
Approximately $7.4 million of the pre-tax amount included in accumulated other comprehensive loss inshareholders’ equity at December 31, 2012 will be recognized to net income over the next 12 months as theunderlying hedged transactions are realized.
7. Fair Value Measurements
ASC 820 “Fair Value Measurements and Disclosures” defines fair value, provides guidance for measuringfair value and requires certain disclosures. This standard discusses valuation techniques, such as the marketapproach (comparable market prices), the income approach (present value of future income or cash flow), and thecost approach (cost to replace the service capacity of an asset or replacement cost). The standard utilizes a fairvalue hierarchy that prioritizes the inputs to valuation techniques used to measure fair value into three broadlevels. The following is a brief description of those three levels:
• Level 1: Observable inputs such as quoted prices (unadjusted) in active markets for identical assets orliabilities.
• Level 2: Inputs, other than quoted prices that are observable for the asset or liability, either directly orindirectly. These include quoted prices for similar assets or liabilities in active markets and quoted pricesfor identical or similar assets or liabilities in markets that are not active.
• Level 3: Unobservable inputs that reflect the reporting entity’s own assumptions.
The following table summarizes the basis used to measure the Company’s financial assets (liabilities) at fairvalue on a recurring basis in the balance sheet at December 31, 2012 and 2011:
Basis of Fair Value MeasurementsBalance at
December 31,2012 Level 1 Level 2 Level 3
(In thousands)Money market investments . . . . . . . . . . . . . . . . . . . . . . $11,165 $11,165 — —Available for sale securities . . . . . . . . . . . . . . . . . . . . . 2,862 2,862 — —Contingent consideration . . . . . . . . . . . . . . . . . . . . . . . . (9,043) — — (9,043)
Balance atDecember 31,
2011 Level 1 Level 2 Level 3(In thousands)
Money market investments . . . . . . . . . . . . . . . . . . . . . . $11,899 $11,899 — —Available for sale securities . . . . . . . . . . . . . . . . . . . . . 2,785 2,785 — —Contingent consideration . . . . . . . . . . . . . . . . . . . . . . . . (3,000) — — $(3,000)
There were no transfers of assets or liabilities between Level 1 and Level 2 in 2012 or 2011.
In determining the fair value of the contingent consideration potentially due on the acquisition of Matcon,the Company used probability weighted estimates adjusted for the time value of money. The Matcon contingentconsideration liability is valued at $9.0 million, of which $8.4 million was recorded as part of the purchase priceas of the opening balance sheet date and the remaining $0.6 was recognized to SG&A in the fourth quarter of2012. At December 31, 2012, $3.5 million of the contingent consideration is included in Accrued expenses and$5.5 million of contingent consideration is recorded in Noncurrent liabilities in the Consolidated Balance Sheet.In February 2012, the Company paid $1.5 million as contingent consideration for the AT Films acquisition. Theremaining liability on the AT Films contingent consideration of $1.5 million was recognized as a benefit toSG&A in 2012, as the Company determined that the contingent consideration will not be earned.
47
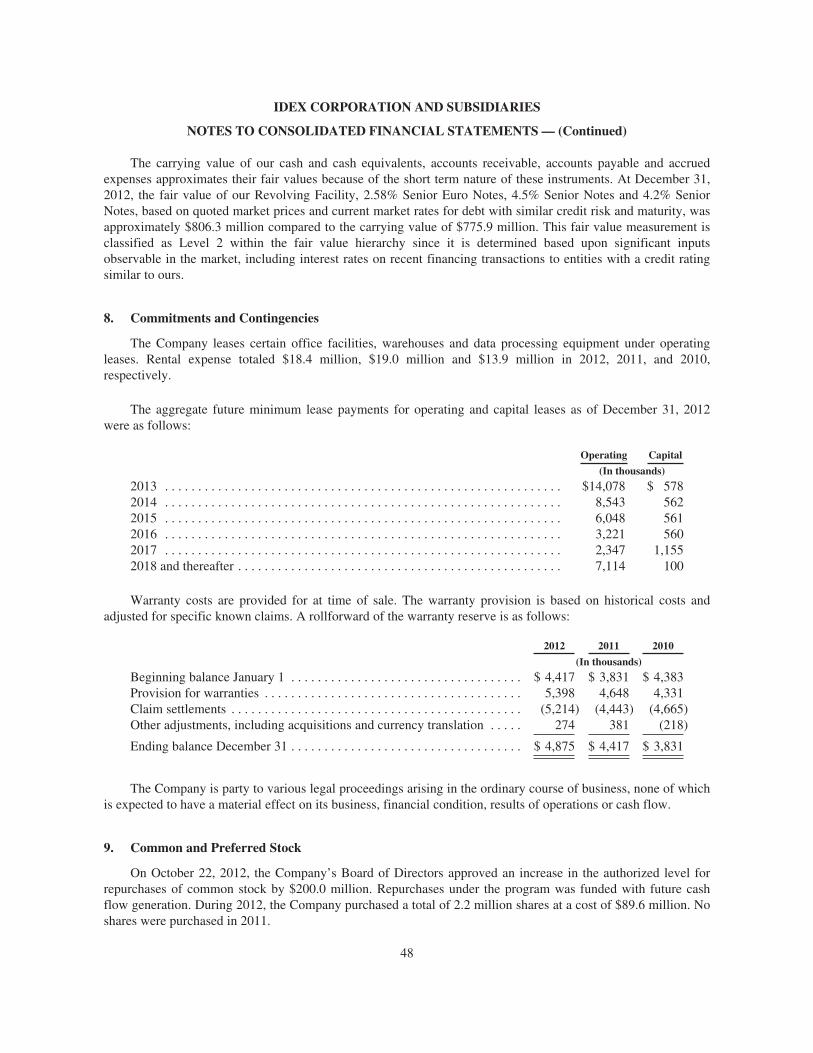
IDEX CORPORATION AND SUBSIDIARIES
NOTES TO CONSOLIDATED FINANCIAL STATEMENTS— (Continued)
The carrying value of our cash and cash equivalents, accounts receivable, accounts payable and accruedexpenses approximates their fair values because of the short term nature of these instruments. At December 31,2012, the fair value of our Revolving Facility, 2.58% Senior Euro Notes, 4.5% Senior Notes and 4.2% SeniorNotes, based on quoted market prices and current market rates for debt with similar credit risk and maturity, wasapproximately $806.3 million compared to the carrying value of $775.9 million. This fair value measurement isclassified as Level 2 within the fair value hierarchy since it is determined based upon significant inputsobservable in the market, including interest rates on recent financing transactions to entities with a credit ratingsimilar to ours.
8. Commitments and Contingencies
The Company leases certain office facilities, warehouses and data processing equipment under operatingleases. Rental expense totaled $18.4 million, $19.0 million and $13.9 million in 2012, 2011, and 2010,respectively.
The aggregate future minimum lease payments for operating and capital leases as of December 31, 2012were as follows:
Operating Capital(In thousands)
2013 . . . . . . . . . . . . . . . . . . . . . . . . . . . . . . . . . . . . . . . . . . . . . . . . . . . . . . . . . . . . $14,078 $ 5782014 . . . . . . . . . . . . . . . . . . . . . . . . . . . . . . . . . . . . . . . . . . . . . . . . . . . . . . . . . . . . 8,543 5622015 . . . . . . . . . . . . . . . . . . . . . . . . . . . . . . . . . . . . . . . . . . . . . . . . . . . . . . . . . . . . 6,048 5612016 . . . . . . . . . . . . . . . . . . . . . . . . . . . . . . . . . . . . . . . . . . . . . . . . . . . . . . . . . . . . 3,221 5602017 . . . . . . . . . . . . . . . . . . . . . . . . . . . . . . . . . . . . . . . . . . . . . . . . . . . . . . . . . . . . 2,347 1,1552018 and thereafter . . . . . . . . . . . . . . . . . . . . . . . . . . . . . . . . . . . . . . . . . . . . . . . . . 7,114 100
Warranty costs are provided for at time of sale. The warranty provision is based on historical costs andadjusted for specific known claims. A rollforward of the warranty reserve is as follows:
2012 2011 2010(In thousands)
Beginning balance January 1 . . . . . . . . . . . . . . . . . . . . . . . . . . . . . . . . . . . $ 4,417 $ 3,831 $ 4,383Provision for warranties . . . . . . . . . . . . . . . . . . . . . . . . . . . . . . . . . . . . . . . 5,398 4,648 4,331Claim settlements . . . . . . . . . . . . . . . . . . . . . . . . . . . . . . . . . . . . . . . . . . . . (5,214) (4,443) (4,665)Other adjustments, including acquisitions and currency translation . . . . . 274 381 (218)
Ending balance December 31 . . . . . . . . . . . . . . . . . . . . . . . . . . . . . . . . . . . $ 4,875 $ 4,417 $ 3,831
The Company is party to various legal proceedings arising in the ordinary course of business, none of whichis expected to have a material effect on its business, financial condition, results of operations or cash flow.
9. Common and Preferred Stock
On October 22, 2012, the Company’s Board of Directors approved an increase in the authorized level forrepurchases of common stock by $200.0 million. Repurchases under the program was funded with future cashflow generation. During 2012, the Company purchased a total of 2.2 million shares at a cost of $89.6 million. Noshares were purchased in 2011.
48
IDEX CORPORATION AND SUBSIDIARIES
NOTES TO CONSOLIDATED FINANCIAL STATEMENTS— (Continued)
At December 31, 2012 and 2011, the Company had 150 million shares of authorized common stock, with apar value of $.01 per share and 5 million shares of authorized preferred stock with a par value of $.01 per share.No preferred stock was issued as of December 31, 2012 and 2011.
10. Income Taxes
Pretax income for 2012, 2011 and 2010 was taxed in the following jurisdictions:
2012 2011 2010(In thousands)
Domestic . . . . . . . . . . . . . . . . . . . . . . . . . . . . . . . . . . . . . . . . . . . . . $65,738 $192,857 $161,573Foreign . . . . . . . . . . . . . . . . . . . . . . . . . . . . . . . . . . . . . . . . . . . . . . 20,466 81,024 70,301
Total . . . . . . . . . . . . . . . . . . . . . . . . . . . . . . . . . . . . . . . . . . . . . . $86,204 $273,881 $231,874
The provision (benefit) for income taxes for 2012, 2011, and 2010, was as follows:
2012 2011 2010(In thousands)
CurrentU.S. . . . . . . . . . . . . . . . . . . . . . . . . . . . . . . . . . . . . . . . . . . . . . . . . $ 59,811 $48,823 $59,384State and local . . . . . . . . . . . . . . . . . . . . . . . . . . . . . . . . . . . . . . . . 5,764 3,434 4,548Foreign . . . . . . . . . . . . . . . . . . . . . . . . . . . . . . . . . . . . . . . . . . . . . 20,228 31,343 18,178
Total current . . . . . . . . . . . . . . . . . . . . . . . . . . . . . . . . . . . . . . . 85,803 83,600 82,110DeferredU.S. . . . . . . . . . . . . . . . . . . . . . . . . . . . . . . . . . . . . . . . . . . . . . . . . (31,246) 4,792 (6,550)State and local . . . . . . . . . . . . . . . . . . . . . . . . . . . . . . . . . . . . . . . . (2,377) (1,103) (293)Foreign . . . . . . . . . . . . . . . . . . . . . . . . . . . . . . . . . . . . . . . . . . . . . (3,606) (7,265) (493)
Total deferred . . . . . . . . . . . . . . . . . . . . . . . . . . . . . . . . . . . . . . (37,229) (3,576) (7,336)
Total provision for income taxes . . . . . . . . . . . . . . . . . . . . . $ 48,574 $80,024 $74,774
Deferred tax assets (liabilities) at December 31, 2012 and 2011 were:
2012 2011(In thousands)
Employee and retiree benefit plans . . . . . . . . . . . . . . . . . . . . . . . . . . . . . . . . $ 38,401 $ 38,626Depreciation and amortization . . . . . . . . . . . . . . . . . . . . . . . . . . . . . . . . . . . . (170,630) (213,002)Inventories . . . . . . . . . . . . . . . . . . . . . . . . . . . . . . . . . . . . . . . . . . . . . . . . . . . 10,851 10,274Allowances and accruals . . . . . . . . . . . . . . . . . . . . . . . . . . . . . . . . . . . . . . . . 7,629 14,103Interest rate exchange agreement . . . . . . . . . . . . . . . . . . . . . . . . . . . . . . . . . . 20,856 23,714Other . . . . . . . . . . . . . . . . . . . . . . . . . . . . . . . . . . . . . . . . . . . . . . . . . . . . . . . . 7,059 10,033
Total . . . . . . . . . . . . . . . . . . . . . . . . . . . . . . . . . . . . . . . . . . . . . . . . . . . . . . $ (85,834) $(116,252)
49
IDEX CORPORATION AND SUBSIDIARIES
NOTES TO CONSOLIDATED FINANCIAL STATEMENTS— (Continued)
The deferred tax assets and liabilities recognized in the Company’s Consolidated Balance Sheets as ofDecember 31, 2012 and 2011 were:
2012 2011(In thousands)
Deferred tax asset — other current assets . . . . . . . . . . . . . . . . . . . . . . . . . . . $ 32,293 $ 26,037Deferred tax asset — other noncurrent assets . . . . . . . . . . . . . . . . . . . . . . . . 3,222 360
Total deferred tax assets . . . . . . . . . . . . . . . . . . . . . . . . . . . . . . . . . . . . . . . . . 35,515 26,397Deferred tax liability — accrued expenses . . . . . . . . . . . . . . . . . . . . . . . . . . . — (167)Noncurrent deferred tax liability — deferred income taxes . . . . . . . . . . . . . . (121,349) (142,482)
Total deferred tax liabilities . . . . . . . . . . . . . . . . . . . . . . . . . . . . . . . . . . . . . . (121,349) (142,649)
Net deferred tax liabilities . . . . . . . . . . . . . . . . . . . . . . . . . . . . . . . . . . . . . $ (85,834) $(116,252)
The provision for income taxes differs from the amount computed by applying the statutory federal incometax rate to pretax income. The computed amount and the differences for 2012, 2011, and 2010 are shown in thefollowing table:
2012 2011 2010(In thousands)
Pretax income . . . . . . . . . . . . . . . . . . . . . . . . . . . . . . . . . . . . . . . . . $86,204 $273,881 $231,874
Provision for income taxes:Computed amount at statutory rate of 35% . . . . . . . . . . . . . . . . . . $30,171 $ 95,858 $ 81,156State and local income tax (net of federal tax benefit) . . . . . . . . . . 2,406 1,515 2,766Taxes on non-U.S. earnings-net of foreign tax credits . . . . . . . . . . 1,189 (4,522) (8,545)Effect of flow-through entities . . . . . . . . . . . . . . . . . . . . . . . . . . . . (7,846) (6,922) (516)Asset impairments . . . . . . . . . . . . . . . . . . . . . . . . . . . . . . . . . . . . . 28,524 — —U.S. business tax credits . . . . . . . . . . . . . . . . . . . . . . . . . . . . . . . . . — (917) (935)Domestic activities production deduction . . . . . . . . . . . . . . . . . . . (5,267) (4,589) (4,720)Other . . . . . . . . . . . . . . . . . . . . . . . . . . . . . . . . . . . . . . . . . . . . . . . . (603) (399) 5,568
Total provision for income taxes . . . . . . . . . . . . . . . . . . . . . . . . $48,574 $ 80,024 $ 74,774
The Company has not provided an estimate for any U.S. or additional foreign taxes on undistributedearnings of foreign subsidiaries that might be payable if these earnings were repatriated since the Companyconsiders these amounts to be permanently invested.
A reconciliation of the beginning and ending amount of unrecognized tax benefits for 2012, 2011 and 2010are shown in the following table:
2012 2011 2010(In thousands)
Beginning balance January 1 . . . . . . . . . . . . . . . . . . . . . . . . . . . . . . . . . $ 5,548 $ 6,440 $5,285Gross increases for tax positions of prior years . . . . . . . . . . . . . . . . . . . 3,017 1,828 3,049Gross decreases for tax positions of prior years . . . . . . . . . . . . . . . . . . (98) (1,595) (675)Settlements . . . . . . . . . . . . . . . . . . . . . . . . . . . . . . . . . . . . . . . . . . . . . . . — (338) (517)Lapse of statute of limitations . . . . . . . . . . . . . . . . . . . . . . . . . . . . . . . . (1,961) (787) (702)
Ending balance December 31 . . . . . . . . . . . . . . . . . . . . . . . . . . . . . . . . $ 6,506 $ 5,548 $6,440
50
IDEX CORPORATION AND SUBSIDIARIES
NOTES TO CONSOLIDATED FINANCIAL STATEMENTS— (Continued)
We recognize interest and penalties related to uncertain tax positions in income tax expense. As ofDecember 31, 2012, 2011 and 2010, we had approximately $0.7 million, $0.5 million and $0.8 million,respectively, of accrued interest related to uncertain tax positions. As of December 31, 2012, 2011 and 2010, wehad approximately $0.5 million, $0.2 million and $0.4 million, respectively, of accrued penalties related touncertain tax positions.
The total amount of unrecognized tax benefits that would affect our effective tax rate if recognized is$5.8 million, $5.0 million and $5.8 million as of December 31, 2012, 2011 and 2010, respectively. The tax years2007-2011 remain open to examination by major taxing jurisdictions. Due to the potential for resolution offederal, state and foreign examinations, and the expiration of various statutes of limitation, it is reasonablypossible that the Company’s gross unrecognized tax benefits balance may change within the next 12 months by arange of zero to $2.7 million.
The Company had net operating loss and credit carry forwards for U.S. federal purposes at December 31,2012 and 2011 of $13.9 and $14.0 million, respectively. For non-U.S. purposes, the Company had net operatingloss carry forwards at December 31, 2012 and 2011 of $7.8 and $12.4 million, respectively. The federal netoperating loss carry forwards are available for use against the Company’s consolidated federal taxable incomeand expire between 2018 and 2031. The entire balance of the non-U.S. net operating losses are available to becarried forward, with $3.7 million of these losses beginning to expire during the years 2018 through 2021. Theremaining $4.1 million of such losses can be carried forward indefinitely.
At December 31, 2012 and 2011, the Company had a foreign capital loss carry forward of approximately$1.0 million and $1.1 million, respectively. The foreign capital loss can be carried forward indefinitely. At bothDecember 31, 2012 and 2011, the Company has a valuation allowance against the deferred tax asset attributableto the foreign capital loss of $0.2 million. At December 31, 2012 and 2011, the Company had state net operatingloss and credit carry forwards of approximately $38.8 million and $18.0 million, respectively. If unutilized, thestate net operating loss will expire between 2019 and 2032. At December 31, 2012 and 2011, the Companyrecorded a valuation allowance against the deferred tax asset attributable to the state net operating loss of$1.5 million and $0.3 million, respectively.
11. Business Segments and Geographic Information
IDEX has three reportable business segments: Fluid & Metering Technologies, Health & ScienceTechnologies and Fire & Safety/Diversified Products. Reporting units in the Fluid & Metering Technologiessegment consist of: Banjo; Energy; CFP; DDPT and WST. Reporting units in the Health & Science Technologiessegment consist of: IH&S; IOP; Containment; Gast; Micropump and MPT. Reporting units in the Fire & Safety/Diversified Products segment consist of: Fire Suppression; Rescue; Band-It; and Dispensing Equipment.
The Fluid & Metering Technologies segment designs, produces and distributes positive displacementpumps, flow meters, injectors, and other fluid-handling pump modules and systems and provides flowmonitoring and other services for the water and wastewater industries. The Health & Science Technologiessegment designs, produces and distributes a wide range of precision fluidics, rotary lobe pumps, centrifugal andpositive displacement pumps, roll compaction and drying systems used in beverage, food processing,pharmaceutical and cosmetics, pneumatic components and sealing solutions, including very high precision, low-flow rate pumping solutions required in analytical instrumentation, clinical diagnostics and drug discovery, highperformance molded and extruded, biocompatible medical devices and implantables, air compressors used inmedical, dental and industrial applications, optical components and coatings for applications in the fields ofscientific research, defense, biotechnology, aerospace, telecommunications and electronics manufacturing,laboratory and commercial equipment used in the production of micro and nano scale materials, precision
51
IDEX CORPORATION AND SUBSIDIARIES
NOTES TO CONSOLIDATED FINANCIAL STATEMENTS— (Continued)
photonic solutions used in life sciences, research and defense markets, and precision gear and peristaltic pumptechnologies that meet exacting original equipment manufacturer specifications. The Fire & Safety/DiversifiedProducts segment produces firefighting pumps and controls, rescue tools, lifting bags and other components andsystems for the fire and rescue industry, engineered stainless steel banding and clamping devices used in avariety of industrial and commercial applications, and precision equipment for dispensing, metering and mixingcolorants and paints used in a variety of retail and commercial businesses around the world.
Information on the Company’s business segments is presented below, based on the nature of products andservices offered. The Company evaluates performance based on several factors, of which operating income is theprimary financial measure. Intersegment sales are accounted for at fair value as if the sales were to third parties.Certain prior year amounts have been revised to include the Dispensing Equipment segment as part of the Fire &Safety/Diversified Products segment and to reflect the movement of our Trebor business unit from the Health &Science Technologies segment to the Fluid & Metering Technologies segment.
2012 2011 2010(In thousands)
NET SALESFluid & Metering Technologies:External customers . . . . . . . . . . . . . . . . . . . . . . . . . . . . . $ 829,320 $ 830,821 $ 717,579Intersegment sales . . . . . . . . . . . . . . . . . . . . . . . . . . . . . . 3,968 466 712
Total segment sales . . . . . . . . . . . . . . . . . . . . . . . . . . . 833,288 831,287 718,291Health & Science Technologies:External customers . . . . . . . . . . . . . . . . . . . . . . . . . . . . . 689,574 606,247 405,135Intersegment sales . . . . . . . . . . . . . . . . . . . . . . . . . . . . . . 5,661 1,653 3,717
Total segment sales . . . . . . . . . . . . . . . . . . . . . . . . . . . 695,235 607,900 408,852Fire & Safety/Diversified Products:External customers . . . . . . . . . . . . . . . . . . . . . . . . . . . . . 435,364 401,383 390,359Intersegment sales . . . . . . . . . . . . . . . . . . . . . . . . . . . . . . 1,689 1,042 462
Total segment sales . . . . . . . . . . . . . . . . . . . . . . . . . . . 437,053 402,425 390,821Intersegment eliminations . . . . . . . . . . . . . . . . . . . . . . . . . . (11,318) (3,161) (4,891)
Total net sales . . . . . . . . . . . . . . . . . . . . . . . . . . . . . . . $1,954,258 $1,838,451 $1,513,073
OPERATING INCOME(1)
Fluid & Metering Technologies(2) . . . . . . . . . . . . . . . . . . . . $ 146,650 $ 164,818 $ 131,018Health & Science Technologies(2) . . . . . . . . . . . . . . . . . . . . (62,835) 106,037 83,258Fire & Safety/Diversified Products . . . . . . . . . . . . . . . . . . . 96,120 85,901 82,334Corporate office and other(3) . . . . . . . . . . . . . . . . . . . . . . . . (51,717) (52,100) (47,494)
Total operating income . . . . . . . . . . . . . . . . . . . . . . . . 128,218 304,656 249,116Interest expense . . . . . . . . . . . . . . . . . . . . . . . . . . . . . . . . . . 42,250 29,332 16,150Other income (expense)-net . . . . . . . . . . . . . . . . . . . . . . . . 236 (1,443) (1,092)
Income before taxes . . . . . . . . . . . . . . . . . . . . . . . . . . $ 86,204 $ 273,881 $ 231,874
52
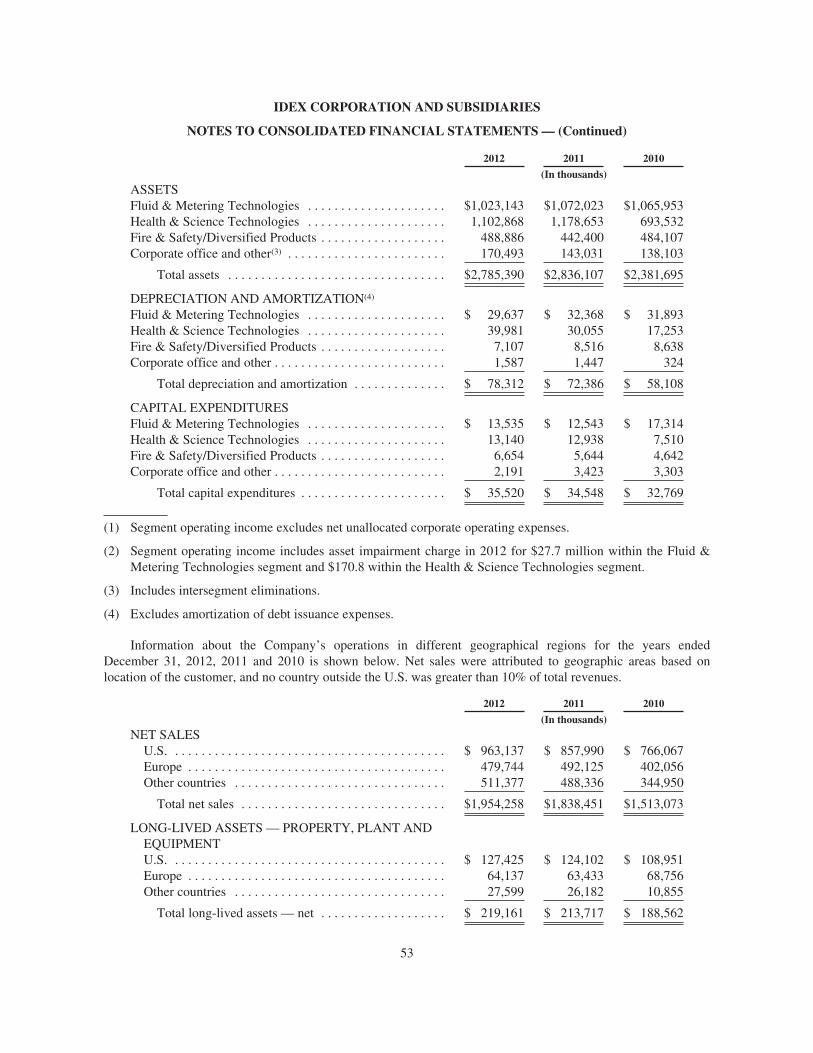
IDEX CORPORATION AND SUBSIDIARIES
NOTES TO CONSOLIDATED FINANCIAL STATEMENTS— (Continued)
2012 2011 2010(In thousands)
ASSETSFluid & Metering Technologies . . . . . . . . . . . . . . . . . . . . . $1,023,143 $1,072,023 $1,065,953Health & Science Technologies . . . . . . . . . . . . . . . . . . . . . 1,102,868 1,178,653 693,532Fire & Safety/Diversified Products . . . . . . . . . . . . . . . . . . . 488,886 442,400 484,107Corporate office and other(3) . . . . . . . . . . . . . . . . . . . . . . . . 170,493 143,031 138,103
Total assets . . . . . . . . . . . . . . . . . . . . . . . . . . . . . . . . . $2,785,390 $2,836,107 $2,381,695
DEPRECIATION AND AMORTIZATION(4)
Fluid & Metering Technologies . . . . . . . . . . . . . . . . . . . . . $ 29,637 $ 32,368 $ 31,893Health & Science Technologies . . . . . . . . . . . . . . . . . . . . . 39,981 30,055 17,253Fire & Safety/Diversified Products . . . . . . . . . . . . . . . . . . . 7,107 8,516 8,638Corporate office and other . . . . . . . . . . . . . . . . . . . . . . . . . . 1,587 1,447 324
Total depreciation and amortization . . . . . . . . . . . . . . $ 78,312 $ 72,386 $ 58,108
CAPITAL EXPENDITURESFluid & Metering Technologies . . . . . . . . . . . . . . . . . . . . . $ 13,535 $ 12,543 $ 17,314Health & Science Technologies . . . . . . . . . . . . . . . . . . . . . 13,140 12,938 7,510Fire & Safety/Diversified Products . . . . . . . . . . . . . . . . . . . 6,654 5,644 4,642Corporate office and other . . . . . . . . . . . . . . . . . . . . . . . . . . 2,191 3,423 3,303
Total capital expenditures . . . . . . . . . . . . . . . . . . . . . . $ 35,520 $ 34,548 $ 32,769
(1) Segment operating income excludes net unallocated corporate operating expenses.
(2) Segment operating income includes asset impairment charge in 2012 for $27.7 million within the Fluid &Metering Technologies segment and $170.8 within the Health & Science Technologies segment.
(3) Includes intersegment eliminations.
(4) Excludes amortization of debt issuance expenses.
Information about the Company’s operations in different geographical regions for the years endedDecember 31, 2012, 2011 and 2010 is shown below. Net sales were attributed to geographic areas based onlocation of the customer, and no country outside the U.S. was greater than 10% of total revenues.
2012 2011 2010(In thousands)
NET SALESU.S. . . . . . . . . . . . . . . . . . . . . . . . . . . . . . . . . . . . . . . . . . $ 963,137 $ 857,990 $ 766,067Europe . . . . . . . . . . . . . . . . . . . . . . . . . . . . . . . . . . . . . . . 479,744 492,125 402,056Other countries . . . . . . . . . . . . . . . . . . . . . . . . . . . . . . . . 511,377 488,336 344,950
Total net sales . . . . . . . . . . . . . . . . . . . . . . . . . . . . . . . $1,954,258 $1,838,451 $1,513,073
LONG-LIVED ASSETS — PROPERTY, PLANT ANDEQUIPMENTU.S. . . . . . . . . . . . . . . . . . . . . . . . . . . . . . . . . . . . . . . . . . $ 127,425 $ 124,102 $ 108,951Europe . . . . . . . . . . . . . . . . . . . . . . . . . . . . . . . . . . . . . . . 64,137 63,433 68,756Other countries . . . . . . . . . . . . . . . . . . . . . . . . . . . . . . . . 27,599 26,182 10,855
Total long-lived assets — net . . . . . . . . . . . . . . . . . . . $ 219,161 $ 213,717 $ 188,562
53
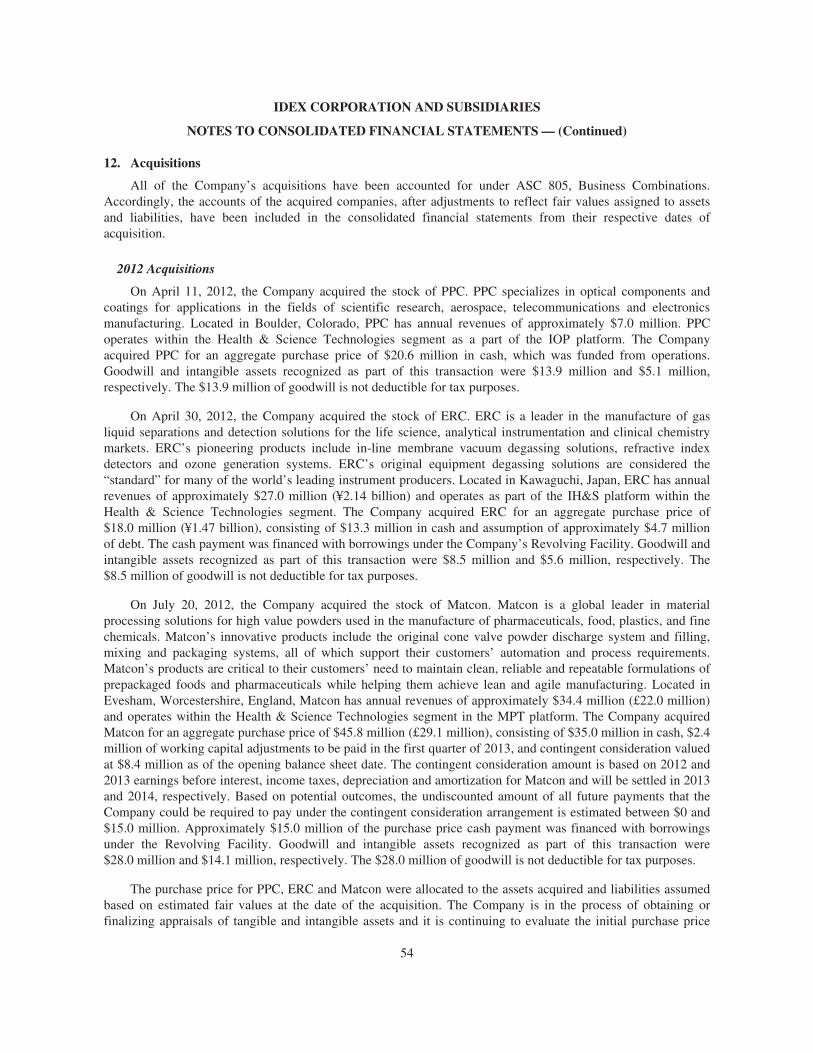
IDEX CORPORATION AND SUBSIDIARIES
NOTES TO CONSOLIDATED FINANCIAL STATEMENTS— (Continued)
12. Acquisitions
All of the Company’s acquisitions have been accounted for under ASC 805, Business Combinations.Accordingly, the accounts of the acquired companies, after adjustments to reflect fair values assigned to assetsand liabilities, have been included in the consolidated financial statements from their respective dates ofacquisition.
2012 Acquisitions
On April 11, 2012, the Company acquired the stock of PPC. PPC specializes in optical components andcoatings for applications in the fields of scientific research, aerospace, telecommunications and electronicsmanufacturing. Located in Boulder, Colorado, PPC has annual revenues of approximately $7.0 million. PPCoperates within the Health & Science Technologies segment as a part of the IOP platform. The Companyacquired PPC for an aggregate purchase price of $20.6 million in cash, which was funded from operations.Goodwill and intangible assets recognized as part of this transaction were $13.9 million and $5.1 million,respectively. The $13.9 million of goodwill is not deductible for tax purposes.
On April 30, 2012, the Company acquired the stock of ERC. ERC is a leader in the manufacture of gasliquid separations and detection solutions for the life science, analytical instrumentation and clinical chemistrymarkets. ERC’s pioneering products include in-line membrane vacuum degassing solutions, refractive indexdetectors and ozone generation systems. ERC’s original equipment degassing solutions are considered the“standard” for many of the world’s leading instrument producers. Located in Kawaguchi, Japan, ERC has annualrevenues of approximately $27.0 million (¥2.14 billion) and operates as part of the IH&S platform within theHealth & Science Technologies segment. The Company acquired ERC for an aggregate purchase price of$18.0 million (¥1.47 billion), consisting of $13.3 million in cash and assumption of approximately $4.7 millionof debt. The cash payment was financed with borrowings under the Company’s Revolving Facility. Goodwill andintangible assets recognized as part of this transaction were $8.5 million and $5.6 million, respectively. The$8.5 million of goodwill is not deductible for tax purposes.
On July 20, 2012, the Company acquired the stock of Matcon. Matcon is a global leader in materialprocessing solutions for high value powders used in the manufacture of pharmaceuticals, food, plastics, and finechemicals. Matcon’s innovative products include the original cone valve powder discharge system and filling,mixing and packaging systems, all of which support their customers’ automation and process requirements.Matcon’s products are critical to their customers’ need to maintain clean, reliable and repeatable formulations ofprepackaged foods and pharmaceuticals while helping them achieve lean and agile manufacturing. Located inEvesham, Worcestershire, England, Matcon has annual revenues of approximately $34.4 million (£22.0 million)and operates within the Health & Science Technologies segment in the MPT platform. The Company acquiredMatcon for an aggregate purchase price of $45.8 million (£29.1 million), consisting of $35.0 million in cash, $2.4million of working capital adjustments to be paid in the first quarter of 2013, and contingent consideration valuedat $8.4 million as of the opening balance sheet date. The contingent consideration amount is based on 2012 and2013 earnings before interest, income taxes, depreciation and amortization for Matcon and will be settled in 2013and 2014, respectively. Based on potential outcomes, the undiscounted amount of all future payments that theCompany could be required to pay under the contingent consideration arrangement is estimated between $0 and$15.0 million. Approximately $15.0 million of the purchase price cash payment was financed with borrowingsunder the Revolving Facility. Goodwill and intangible assets recognized as part of this transaction were$28.0 million and $14.1 million, respectively. The $28.0 million of goodwill is not deductible for tax purposes.
The purchase price for PPC, ERC and Matcon were allocated to the assets acquired and liabilities assumedbased on estimated fair values at the date of the acquisition. The Company is in the process of obtaining orfinalizing appraisals of tangible and intangible assets and it is continuing to evaluate the initial purchase price
54

IDEX CORPORATION AND SUBSIDIARIES
NOTES TO CONSOLIDATED FINANCIAL STATEMENTS— (Continued)
allocations, as of the acquisition date, which will be adjusted as additional information relative to the fair valuesof the assets and liabilities of the businesses become known. Accordingly, management has used its best estimatein the initial purchase price allocation as of the date of these financial statements.
The allocation of the acquisition costs to the assets acquired and liabilities assumed, based on theirestimated fair values, is as follows:
ERC PPC Matcon Total(In thousands)
Accounts receivable . . . . . . . . . . . . . . . . . . . . . . . . . . $ 5,766 $ 877 $ 7,768 $ 14,411Inventory . . . . . . . . . . . . . . . . . . . . . . . . . . . . . . . . . . . 4,224 932 604 5,760Other current assets, net of cash acquired . . . . . . . . . 981 252 1,880 3,113Property, plant and equipment . . . . . . . . . . . . . . . . . . 2,738 1,936 5,695 10,369Goodwill . . . . . . . . . . . . . . . . . . . . . . . . . . . . . . . . . . . 8,499 13,941 27,947 50,387Intangible assets . . . . . . . . . . . . . . . . . . . . . . . . . . . . . 5,642 5,104 14,081 24,827Other assets . . . . . . . . . . . . . . . . . . . . . . . . . . . . . . . . . 1,509 13 53 1,575
Total assets acquired . . . . . . . . . . . . . . . . . . . . . . . . 29,359 23,055 58,028 110,442Total liabilities assumed . . . . . . . . . . . . . . . . . . . . . (16,074) (2,465) (12,215) (30,754)
Net assets acquired . . . . . . . . . . . . . . . . . . . . . . . . . . . $ 13,285 $20,590 $ 45,813 $ 79,688
Acquired intangible assets consist of trade names, non-compete agreements, customer relationships andunpatented technology. The goodwill recorded for the acquisitions reflects the strategic fit and revenue andearnings growth potential of these businesses.
The acquired intangible assets and weighted average amortization periods are as follows:
Total
WeightedAverageLife
(In thousands)Trade names . . . . . . . . . . . . . . . . . . . . . . . . . . . . . . . . . . . . . . . . . . . . . . . . . . $ 8,973 15Non-compete agreements . . . . . . . . . . . . . . . . . . . . . . . . . . . . . . . . . . . . . . . . 470 3Customer relationships . . . . . . . . . . . . . . . . . . . . . . . . . . . . . . . . . . . . . . . . . . 11,343 6Unpatented technology . . . . . . . . . . . . . . . . . . . . . . . . . . . . . . . . . . . . . . . . . . 4,041 8
2012 acquired intangible assets . . . . . . . . . . . . . . . . . . . . . . . . . . . . . . . . . . . $24,827
The Company incurred $2.7 million of acquisition-related transaction costs in 2012. These costs wererecorded in selling, general and administrative expense and were related to completed transactions, pendingtransactions and potential transactions, including certain transactions that ultimately were not completed. During2012, the Company recorded $0.9 million of fair value inventory charges associated with these acquisitions,which were recorded in cost of sales.
2011 Acquisitions
On January 31, 2011, the Company acquired the membership interests of AT Films. AT Films specializes inoptical components and coatings for applications in the fields of scientific research, defense, aerospace,telecommunications and electronics manufacturing. AT Films’ core competence is the design and manufacture offilters, splitters, reflectors and mirrors with the precise physical properties required to support their customers’most challenging and cutting-edge optical applications. Headquartered in Boulder, Colorado, AT Films operates
55

IDEX CORPORATION AND SUBSIDIARIES
NOTES TO CONSOLIDATED FINANCIAL STATEMENTS— (Continued)
within the Health & Science Technologies segment as a part of the IOP platform. The Company acquired ATFilms for an aggregate purchase price of $34.5 million, consisting of $31.8 million in cash and contingentconsideration valued at approximately $2.7 million as of the opening balance sheet date. Goodwill and intangibleassets recognized as part of this transaction were $18.2 million and $11.4 million, respectively. The $18.2 millionof goodwill is deductible for tax purposes.
On March 11, 2011, the Company completed the acquisition of Microfluidics. Microfluidics is a globalleader in the design and manufacture of laboratory and commercial equipment used in the production of microand nano scale materials for the pharmaceutical and chemical markets. Microfluidics is the exclusive producer ofthe Microfluidizer® family of high shear fluid processors for uniform particle size reduction, robust celldisruption and nanoparticle creation. Microfluidics operates within the Health & Science Technologies segmentas a part of the MPT platform. The Company acquired Microfluidics for an aggregate purchase price of$18.5 million in cash. Goodwill and intangible assets recognized as part of this transaction were $5.9 million and$9.7 million, respectively. The $5.9 million of goodwill is not deductible for tax purposes.
On June 10, 2011, the Company completed the acquisition of CVI Melles Griot (“CVI MG”). CVI MG is aglobal leader in the design and manufacture of precision photonic solutions used in the life sciences, research,semiconductor, security and defense markets. CVI MG’s innovative products are focused on the generation,control and productive use of light for a variety of key science and industrial applications. Products includespecialty lasers and light sources, electro-optical components, specialty shutters and components. In addition,CVI MG produces critical components for life science research, electronics manufacturing, military and otherindustrial applications including lenses, mirrors, filters and polarizers. These components are utilized in a numberof important applications such as spectroscopy, cytometry (cell counting), guidance systems for targetdesignation, remote sensing, menology and optical lithography. CVI MG operates within the Health and ScienceTechnologies segment as part of the IOP platform. The Company acquired CVI MG for an aggregate purchaseprice of $394.7 million, consisting of $393.3 million in cash and the assumption of approximately $1.4 million ofdebt. Approximately $365.0 million of the cash payment was financed with borrowings under the RevolvingFacility. CVI MG is headquartered in Albuquerque, New Mexico, with manufacturing sites located on threecontinents. Goodwill and intangible assets recognized as part of this transaction were $208.5 million and$115.8 million, respectively. Approximately $117.7 million of goodwill is deductible for tax purposes.
The purchase price for CVI MG, AT Films and Microfluidics was allocated to the assets acquired andliabilities assumed based on estimated fair values at the date of the acquisition.
The allocation of the acquisition costs to the assets acquired and liabilities assumed, based on theirestimated fair values, is as follows:
AT Films Microfluidics CVI MG Total(In thousands)
Accounts receivable . . . . . . . . . . . . . . . . . . . . . . . . $ 947 $ 1,760 $ 23,978 $ 26,685Inventory . . . . . . . . . . . . . . . . . . . . . . . . . . . . . . . . 852 2,226 52,868 55,946Other current assets, net of cash acquired . . . . . . . 73 816 7,562 8,451Property, plant and equipment . . . . . . . . . . . . . . . . 5,019 567 31,049 36,635Goodwill . . . . . . . . . . . . . . . . . . . . . . . . . . . . . . . . . 18,220 5,853 208,540 232,613Intangible assets . . . . . . . . . . . . . . . . . . . . . . . . . . . 11,435 9,717 115,777 136,929Other assets . . . . . . . . . . . . . . . . . . . . . . . . . . . . . . 2,731 548 2,112 5,391
Total assets acquired . . . . . . . . . . . . . . . . . . . . . 39,277 21,487 441,886 502,650Total liabilities assumed . . . . . . . . . . . . . . . . . . (4,766) (2,951) (48,572) (56,289)
Net assets acquired . . . . . . . . . . . . . . . . . . . . . . . . . $34,511 $18,536 $393,314 $446,361
56
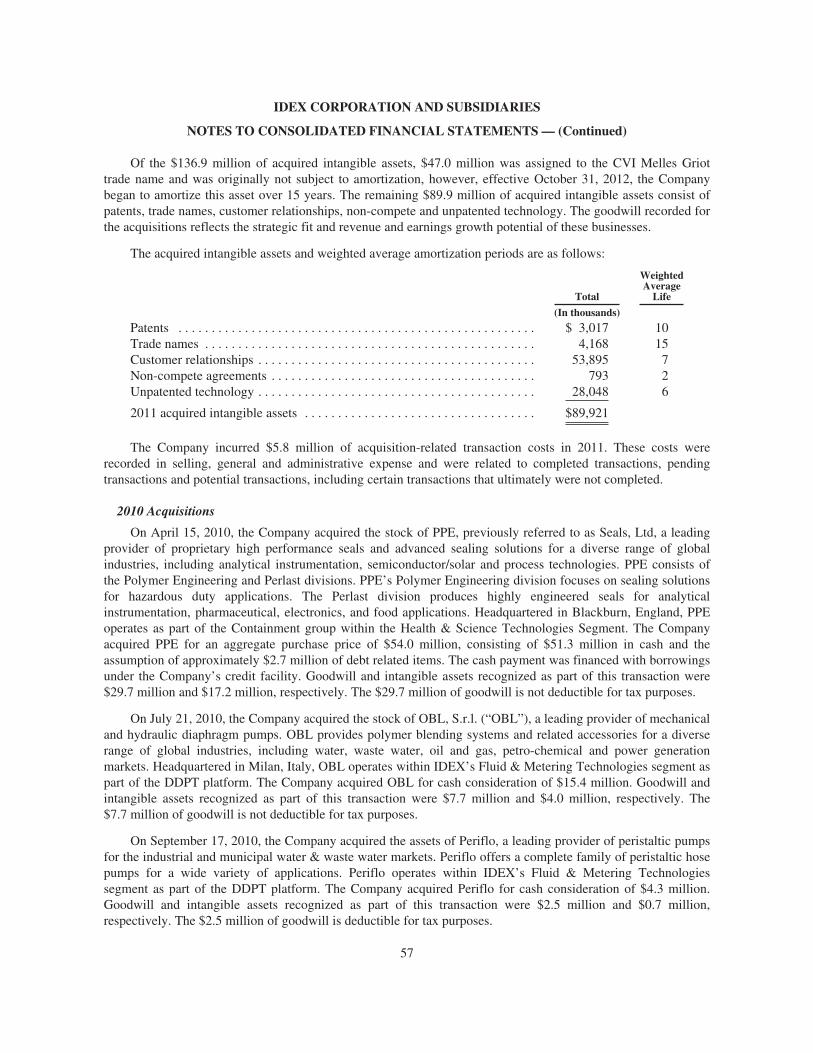
IDEX CORPORATION AND SUBSIDIARIES
NOTES TO CONSOLIDATED FINANCIAL STATEMENTS— (Continued)
Of the $136.9 million of acquired intangible assets, $47.0 million was assigned to the CVI Melles Griottrade name and was originally not subject to amortization, however, effective October 31, 2012, the Companybegan to amortize this asset over 15 years. The remaining $89.9 million of acquired intangible assets consist ofpatents, trade names, customer relationships, non-compete and unpatented technology. The goodwill recorded forthe acquisitions reflects the strategic fit and revenue and earnings growth potential of these businesses.
The acquired intangible assets and weighted average amortization periods are as follows:
Total
WeightedAverageLife
(In thousands)Patents . . . . . . . . . . . . . . . . . . . . . . . . . . . . . . . . . . . . . . . . . . . . . . . . . . . . . . $ 3,017 10Trade names . . . . . . . . . . . . . . . . . . . . . . . . . . . . . . . . . . . . . . . . . . . . . . . . . . 4,168 15Customer relationships . . . . . . . . . . . . . . . . . . . . . . . . . . . . . . . . . . . . . . . . . . 53,895 7Non-compete agreements . . . . . . . . . . . . . . . . . . . . . . . . . . . . . . . . . . . . . . . . 793 2Unpatented technology . . . . . . . . . . . . . . . . . . . . . . . . . . . . . . . . . . . . . . . . . . 28,048 6
2011 acquired intangible assets . . . . . . . . . . . . . . . . . . . . . . . . . . . . . . . . . . . $89,921
The Company incurred $5.8 million of acquisition-related transaction costs in 2011. These costs wererecorded in selling, general and administrative expense and were related to completed transactions, pendingtransactions and potential transactions, including certain transactions that ultimately were not completed.
2010 Acquisitions
On April 15, 2010, the Company acquired the stock of PPE, previously referred to as Seals, Ltd, a leadingprovider of proprietary high performance seals and advanced sealing solutions for a diverse range of globalindustries, including analytical instrumentation, semiconductor/solar and process technologies. PPE consists ofthe Polymer Engineering and Perlast divisions. PPE’s Polymer Engineering division focuses on sealing solutionsfor hazardous duty applications. The Perlast division produces highly engineered seals for analyticalinstrumentation, pharmaceutical, electronics, and food applications. Headquartered in Blackburn, England, PPEoperates as part of the Containment group within the Health & Science Technologies Segment. The Companyacquired PPE for an aggregate purchase price of $54.0 million, consisting of $51.3 million in cash and theassumption of approximately $2.7 million of debt related items. The cash payment was financed with borrowingsunder the Company’s credit facility. Goodwill and intangible assets recognized as part of this transaction were$29.7 million and $17.2 million, respectively. The $29.7 million of goodwill is not deductible for tax purposes.
On July 21, 2010, the Company acquired the stock of OBL, S.r.l. (“OBL”), a leading provider of mechanicaland hydraulic diaphragm pumps. OBL provides polymer blending systems and related accessories for a diverserange of global industries, including water, waste water, oil and gas, petro-chemical and power generationmarkets. Headquartered in Milan, Italy, OBL operates within IDEX’s Fluid & Metering Technologies segment aspart of the DDPT platform. The Company acquired OBL for cash consideration of $15.4 million. Goodwill andintangible assets recognized as part of this transaction were $7.7 million and $4.0 million, respectively. The$7.7 million of goodwill is not deductible for tax purposes.
On September 17, 2010, the Company acquired the assets of Periflo, a leading provider of peristaltic pumpsfor the industrial and municipal water & waste water markets. Periflo offers a complete family of peristaltic hosepumps for a wide variety of applications. Periflo operates within IDEX’s Fluid & Metering Technologiessegment as part of the DDPT platform. The Company acquired Periflo for cash consideration of $4.3 million.Goodwill and intangible assets recognized as part of this transaction were $2.5 million and $0.7 million,respectively. The $2.5 million of goodwill is deductible for tax purposes.
57
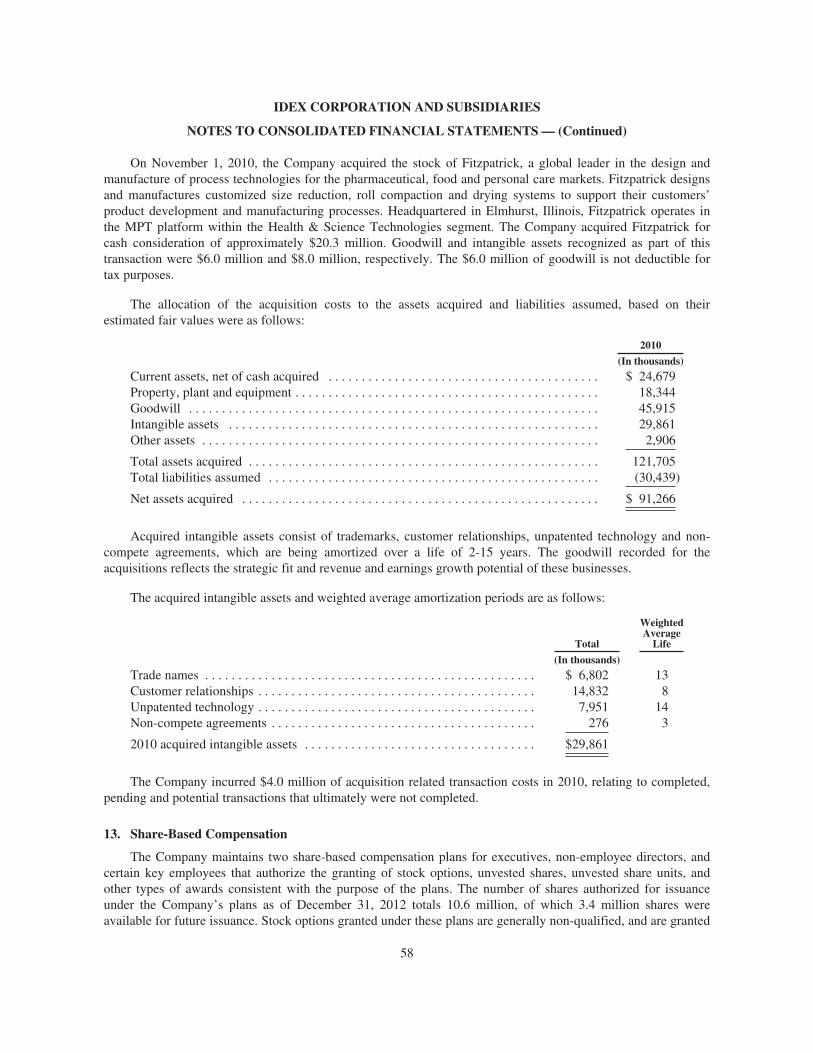
IDEX CORPORATION AND SUBSIDIARIES
NOTES TO CONSOLIDATED FINANCIAL STATEMENTS— (Continued)
On November 1, 2010, the Company acquired the stock of Fitzpatrick, a global leader in the design andmanufacture of process technologies for the pharmaceutical, food and personal care markets. Fitzpatrick designsand manufactures customized size reduction, roll compaction and drying systems to support their customers’product development and manufacturing processes. Headquartered in Elmhurst, Illinois, Fitzpatrick operates inthe MPT platform within the Health & Science Technologies segment. The Company acquired Fitzpatrick forcash consideration of approximately $20.3 million. Goodwill and intangible assets recognized as part of thistransaction were $6.0 million and $8.0 million, respectively. The $6.0 million of goodwill is not deductible fortax purposes.
The allocation of the acquisition costs to the assets acquired and liabilities assumed, based on theirestimated fair values were as follows:
2010(In thousands)
Current assets, net of cash acquired . . . . . . . . . . . . . . . . . . . . . . . . . . . . . . . . . . . . . . . . . $ 24,679Property, plant and equipment . . . . . . . . . . . . . . . . . . . . . . . . . . . . . . . . . . . . . . . . . . . . . . 18,344Goodwill . . . . . . . . . . . . . . . . . . . . . . . . . . . . . . . . . . . . . . . . . . . . . . . . . . . . . . . . . . . . . . 45,915Intangible assets . . . . . . . . . . . . . . . . . . . . . . . . . . . . . . . . . . . . . . . . . . . . . . . . . . . . . . . . 29,861Other assets . . . . . . . . . . . . . . . . . . . . . . . . . . . . . . . . . . . . . . . . . . . . . . . . . . . . . . . . . . . . 2,906
Total assets acquired . . . . . . . . . . . . . . . . . . . . . . . . . . . . . . . . . . . . . . . . . . . . . . . . . . . . . 121,705Total liabilities assumed . . . . . . . . . . . . . . . . . . . . . . . . . . . . . . . . . . . . . . . . . . . . . . . . . . (30,439)
Net assets acquired . . . . . . . . . . . . . . . . . . . . . . . . . . . . . . . . . . . . . . . . . . . . . . . . . . . . . . $ 91,266
Acquired intangible assets consist of trademarks, customer relationships, unpatented technology and non-compete agreements, which are being amortized over a life of 2-15 years. The goodwill recorded for theacquisitions reflects the strategic fit and revenue and earnings growth potential of these businesses.
The acquired intangible assets and weighted average amortization periods are as follows:
Total
WeightedAverageLife
(In thousands)Trade names . . . . . . . . . . . . . . . . . . . . . . . . . . . . . . . . . . . . . . . . . . . . . . . . . . $ 6,802 13Customer relationships . . . . . . . . . . . . . . . . . . . . . . . . . . . . . . . . . . . . . . . . . . 14,832 8Unpatented technology . . . . . . . . . . . . . . . . . . . . . . . . . . . . . . . . . . . . . . . . . . 7,951 14Non-compete agreements . . . . . . . . . . . . . . . . . . . . . . . . . . . . . . . . . . . . . . . . 276 3
2010 acquired intangible assets . . . . . . . . . . . . . . . . . . . . . . . . . . . . . . . . . . . $29,861
The Company incurred $4.0 million of acquisition related transaction costs in 2010, relating to completed,pending and potential transactions that ultimately were not completed.
13. Share-Based Compensation
The Company maintains two share-based compensation plans for executives, non-employee directors, andcertain key employees that authorize the granting of stock options, unvested shares, unvested share units, andother types of awards consistent with the purpose of the plans. The number of shares authorized for issuanceunder the Company’s plans as of December 31, 2012 totals 10.6 million, of which 3.4 million shares wereavailable for future issuance. Stock options granted under these plans are generally non-qualified, and are granted
58
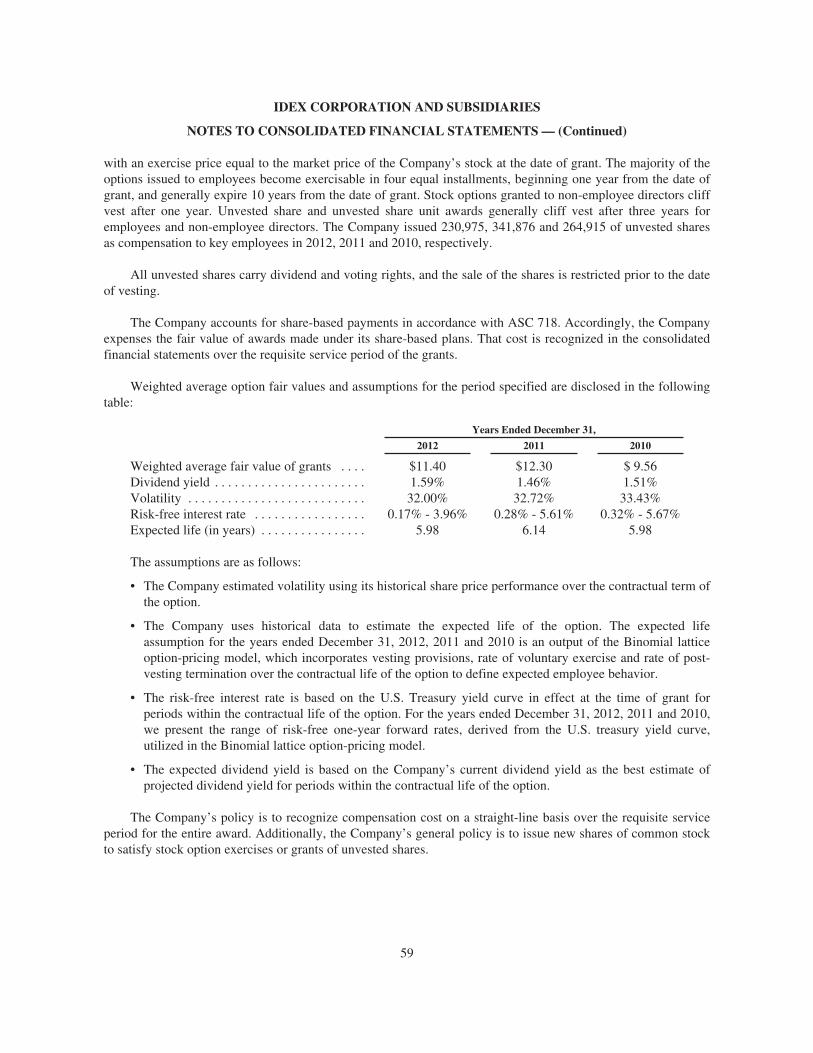
IDEX CORPORATION AND SUBSIDIARIES
NOTES TO CONSOLIDATED FINANCIAL STATEMENTS— (Continued)
with an exercise price equal to the market price of the Company’s stock at the date of grant. The majority of theoptions issued to employees become exercisable in four equal installments, beginning one year from the date ofgrant, and generally expire 10 years from the date of grant. Stock options granted to non-employee directors cliffvest after one year. Unvested share and unvested share unit awards generally cliff vest after three years foremployees and non-employee directors. The Company issued 230,975, 341,876 and 264,915 of unvested sharesas compensation to key employees in 2012, 2011 and 2010, respectively.
All unvested shares carry dividend and voting rights, and the sale of the shares is restricted prior to the dateof vesting.
The Company accounts for share-based payments in accordance with ASC 718. Accordingly, the Companyexpenses the fair value of awards made under its share-based plans. That cost is recognized in the consolidatedfinancial statements over the requisite service period of the grants.
Weighted average option fair values and assumptions for the period specified are disclosed in the followingtable:
Years Ended December 31,2012 2011 2010
Weighted average fair value of grants . . . . $11.40 $12.30 $ 9.56Dividend yield . . . . . . . . . . . . . . . . . . . . . . . 1.59% 1.46% 1.51%Volatility . . . . . . . . . . . . . . . . . . . . . . . . . . . 32.00% 32.72% 33.43%Risk-free interest rate . . . . . . . . . . . . . . . . . 0.17% - 3.96% 0.28% - 5.61% 0.32% - 5.67%Expected life (in years) . . . . . . . . . . . . . . . . 5.98 6.14 5.98
The assumptions are as follows:
• The Company estimated volatility using its historical share price performance over the contractual term ofthe option.
• The Company uses historical data to estimate the expected life of the option. The expected lifeassumption for the years ended December 31, 2012, 2011 and 2010 is an output of the Binomial latticeoption-pricing model, which incorporates vesting provisions, rate of voluntary exercise and rate of post-vesting termination over the contractual life of the option to define expected employee behavior.
• The risk-free interest rate is based on the U.S. Treasury yield curve in effect at the time of grant forperiods within the contractual life of the option. For the years ended December 31, 2012, 2011 and 2010,we present the range of risk-free one-year forward rates, derived from the U.S. treasury yield curve,utilized in the Binomial lattice option-pricing model.
• The expected dividend yield is based on the Company’s current dividend yield as the best estimate ofprojected dividend yield for periods within the contractual life of the option.
The Company’s policy is to recognize compensation cost on a straight-line basis over the requisite serviceperiod for the entire award. Additionally, the Company’s general policy is to issue new shares of common stockto satisfy stock option exercises or grants of unvested shares.
59

IDEX CORPORATION AND SUBSIDIARIES
NOTES TO CONSOLIDATED FINANCIAL STATEMENTS— (Continued)
Total compensation cost for stock options is as follows:
Years Ended December 31,2012 2011 2010
(In thousands)Cost of goods sold . . . . . . . . . . . . . . . . . . . . . . . . . . . . . . . . . . . . . . . . $ 650 $ 805 $ 804Selling, general and administrative expenses . . . . . . . . . . . . . . . . . . . . 5,642 6,153 6,923
Total expense before income taxes . . . . . . . . . . . . . . . . . . . . . . . . . . . 6,292 6,958 7,727Income tax benefit . . . . . . . . . . . . . . . . . . . . . . . . . . . . . . . . . . . . . . . . (1,988) (2,208) (2,450)
Total expense after income taxes . . . . . . . . . . . . . . . . . . . . . . . . . . . . . $ 4,304 $ 4,750 $ 5,277
Total compensation cost for unvested shares is as follows:
Years Ended December 31,2012 2011(1) 2010
(In thousands)Cost of goods sold . . . . . . . . . . . . . . . . . . . . . . . . . . . . . . . . . . . . . . . . $ 991 $ 684 $ 311Selling, general and administrative expenses . . . . . . . . . . . . . . . . . . . . 5,819 4,434 8,382Restructuring expenses . . . . . . . . . . . . . . . . . . . . . . . . . . . . . . . . . . . . . — — 938
Total expense before income taxes . . . . . . . . . . . . . . . . . . . . . . . . . . . 6,810 5,118 9,631Income tax benefit . . . . . . . . . . . . . . . . . . . . . . . . . . . . . . . . . . . . . . . . (1,682) (1,827) (2,097)
Total expense after income taxes . . . . . . . . . . . . . . . . . . . . . . . . . . . . . $ 5,128 $ 3,291 $ 7,534
(1) Reflects the forfeiture of unvested shares related to the Company’s transition to a new CEO in August 2011.
Recognition of compensation cost was consistent with recognition of cash compensation for the sameemployees. Compensation cost capitalized as part of inventory was immaterial.
As of December 31, 2012, there was $8.3 million and $9.4 million of total unrecognized compensation costrelated to stock options and unvested shares, respectively, that is expected to be recognized over a weighted-average period of 1.4 years and 1.0 years, respectively.
A summary of the Company’s stock option activity as of December 31, 2012, and changes during the yearended December 31, 2012 is presented in the following table:
Stock Options Shares
WeightedAveragePrice
Weighted-AverageRemaining
Contractual Term
AggregateIntrinsicValue
Outstanding at January 1, 2012 . . . . . . . 4,314,044 $29.61 7.01 $34,899,200Granted . . . . . . . . . . . . . . . . . . . . . . . . . 764,700 42.66Exercised . . . . . . . . . . . . . . . . . . . . . . . . (1,631,923) 27.77Forfeited/Expired . . . . . . . . . . . . . . . . . (223,079) 36.60
Outstanding at December 31, 2012 . . . . 3,223,742 $33.16 6.37 $43,106,153
Vested and expected to vest atDecember 31, 2012 . . . . . . . . . . . . . . 3,100,929 $32.86 6.28 $42,398,877
Exercisable at December 31, 2012 . . . . 1,780,761 $29.00 4.82 $31,219,847
60
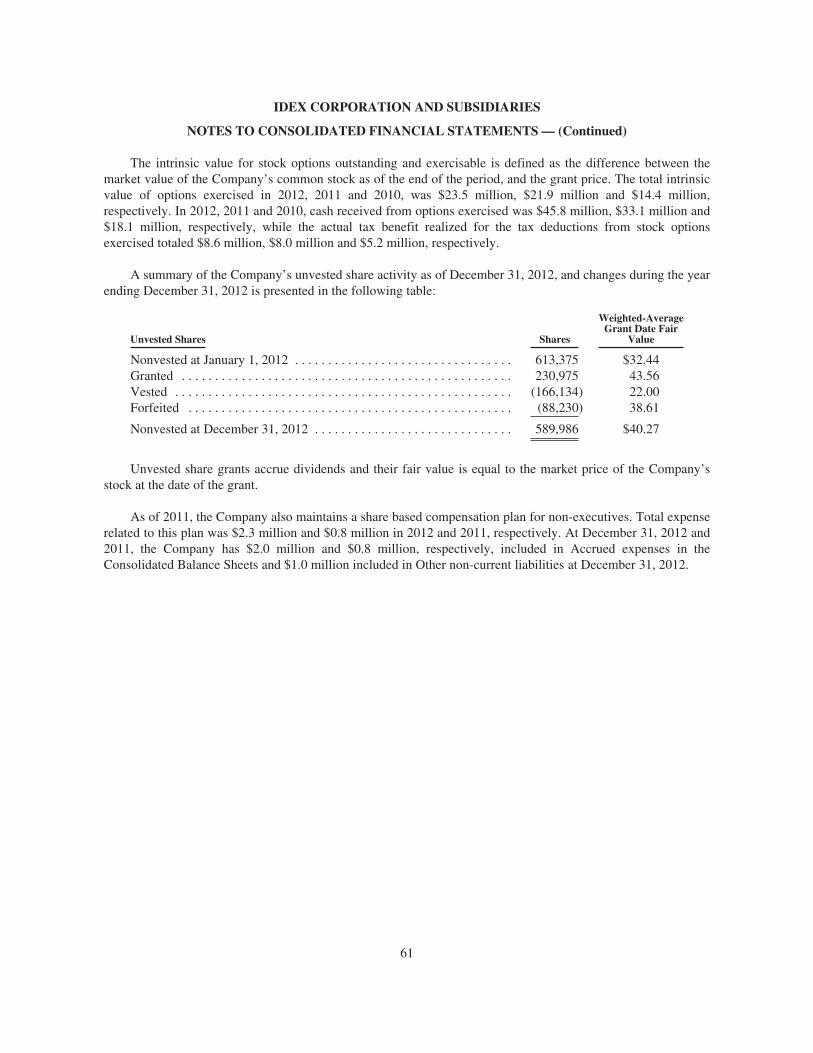
IDEX CORPORATION AND SUBSIDIARIES
NOTES TO CONSOLIDATED FINANCIAL STATEMENTS— (Continued)
The intrinsic value for stock options outstanding and exercisable is defined as the difference between themarket value of the Company’s common stock as of the end of the period, and the grant price. The total intrinsicvalue of options exercised in 2012, 2011 and 2010, was $23.5 million, $21.9 million and $14.4 million,respectively. In 2012, 2011 and 2010, cash received from options exercised was $45.8 million, $33.1 million and$18.1 million, respectively, while the actual tax benefit realized for the tax deductions from stock optionsexercised totaled $8.6 million, $8.0 million and $5.2 million, respectively.
A summary of the Company’s unvested share activity as of December 31, 2012, and changes during the yearending December 31, 2012 is presented in the following table:
Unvested Shares Shares
Weighted-AverageGrant Date Fair
Value
Nonvested at January 1, 2012 . . . . . . . . . . . . . . . . . . . . . . . . . . . . . . . . . 613,375 $32.44Granted . . . . . . . . . . . . . . . . . . . . . . . . . . . . . . . . . . . . . . . . . . . . . . . . . . 230,975 43.56Vested . . . . . . . . . . . . . . . . . . . . . . . . . . . . . . . . . . . . . . . . . . . . . . . . . . . (166,134) 22.00Forfeited . . . . . . . . . . . . . . . . . . . . . . . . . . . . . . . . . . . . . . . . . . . . . . . . . (88,230) 38.61
Nonvested at December 31, 2012 . . . . . . . . . . . . . . . . . . . . . . . . . . . . . . 589,986 $40.27
Unvested share grants accrue dividends and their fair value is equal to the market price of the Company’sstock at the date of the grant.
As of 2011, the Company also maintains a share based compensation plan for non-executives. Total expenserelated to this plan was $2.3 million and $0.8 million in 2012 and 2011, respectively. At December 31, 2012 and2011, the Company has $2.0 million and $0.8 million, respectively, included in Accrued expenses in theConsolidated Balance Sheets and $1.0 million included in Other non-current liabilities at December 31, 2012.
61
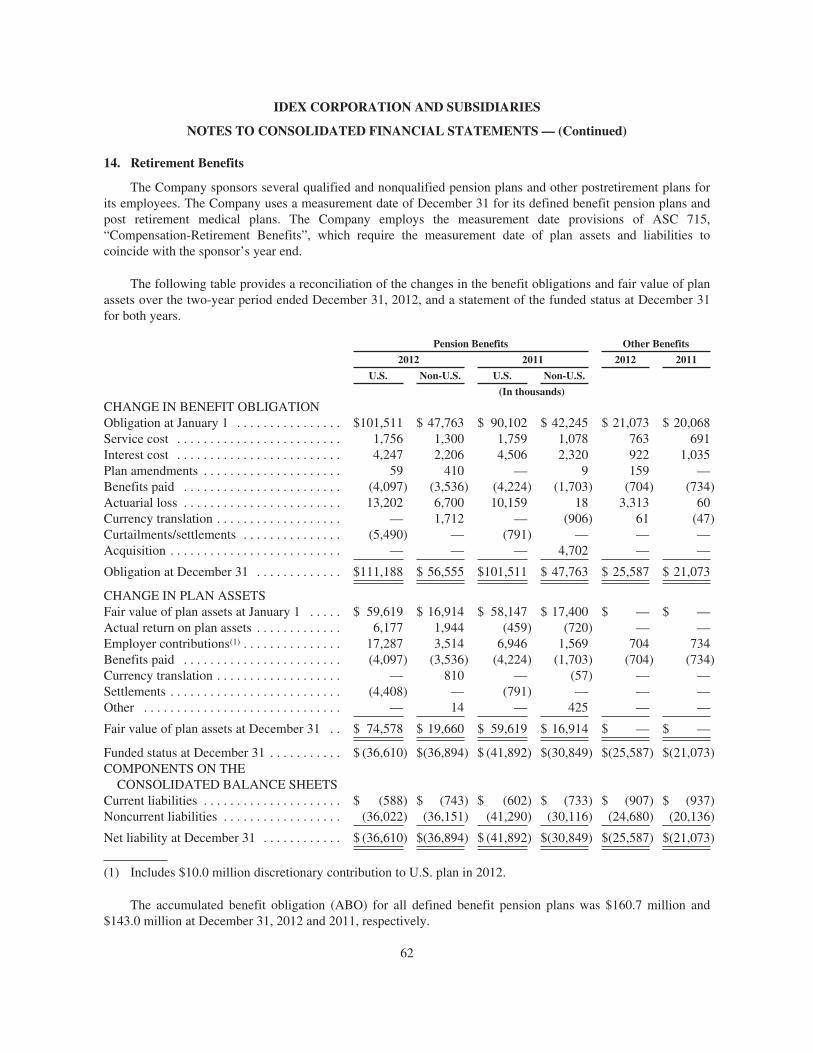
IDEX CORPORATION AND SUBSIDIARIES
NOTES TO CONSOLIDATED FINANCIAL STATEMENTS— (Continued)
14. Retirement Benefits
The Company sponsors several qualified and nonqualified pension plans and other postretirement plans forits employees. The Company uses a measurement date of December 31 for its defined benefit pension plans andpost retirement medical plans. The Company employs the measurement date provisions of ASC 715,“Compensation-Retirement Benefits”, which require the measurement date of plan assets and liabilities tocoincide with the sponsor’s year end.
The following table provides a reconciliation of the changes in the benefit obligations and fair value of planassets over the two-year period ended December 31, 2012, and a statement of the funded status at December 31for both years.
Pension Benefits Other Benefits2012 2011 2012 2011
U.S. Non-U.S. U.S. Non-U.S.(In thousands)
CHANGE IN BENEFIT OBLIGATIONObligation at January 1 . . . . . . . . . . . . . . . . $101,511 $ 47,763 $ 90,102 $ 42,245 $ 21,073 $ 20,068Service cost . . . . . . . . . . . . . . . . . . . . . . . . . 1,756 1,300 1,759 1,078 763 691Interest cost . . . . . . . . . . . . . . . . . . . . . . . . . 4,247 2,206 4,506 2,320 922 1,035Plan amendments . . . . . . . . . . . . . . . . . . . . . 59 410 — 9 159 —Benefits paid . . . . . . . . . . . . . . . . . . . . . . . . (4,097) (3,536) (4,224) (1,703) (704) (734)Actuarial loss . . . . . . . . . . . . . . . . . . . . . . . . 13,202 6,700 10,159 18 3,313 60Currency translation . . . . . . . . . . . . . . . . . . . — 1,712 — (906) 61 (47)Curtailments/settlements . . . . . . . . . . . . . . . (5,490) — (791) — — —Acquisition . . . . . . . . . . . . . . . . . . . . . . . . . . — — — 4,702 — —
Obligation at December 31 . . . . . . . . . . . . . $111,188 $ 56,555 $101,511 $ 47,763 $ 25,587 $ 21,073
CHANGE IN PLAN ASSETSFair value of plan assets at January 1 . . . . . $ 59,619 $ 16,914 $ 58,147 $ 17,400 $ — $ —Actual return on plan assets . . . . . . . . . . . . . 6,177 1,944 (459) (720) — —Employer contributions(1) . . . . . . . . . . . . . . . 17,287 3,514 6,946 1,569 704 734Benefits paid . . . . . . . . . . . . . . . . . . . . . . . . (4,097) (3,536) (4,224) (1,703) (704) (734)Currency translation . . . . . . . . . . . . . . . . . . . — 810 — (57) — —Settlements . . . . . . . . . . . . . . . . . . . . . . . . . . (4,408) — (791) — — —Other . . . . . . . . . . . . . . . . . . . . . . . . . . . . . . — 14 — 425 — —
Fair value of plan assets at December 31 . . $ 74,578 $ 19,660 $ 59,619 $ 16,914 $ — $ —
Funded status at December 31 . . . . . . . . . . . $ (36,610) $(36,894) $ (41,892) $(30,849) $(25,587) $(21,073)COMPONENTS ON THECONSOLIDATED BALANCE SHEETS
Current liabilities . . . . . . . . . . . . . . . . . . . . . $ (588) $ (743) $ (602) $ (733) $ (907) $ (937)Noncurrent liabilities . . . . . . . . . . . . . . . . . . (36,022) (36,151) (41,290) (30,116) (24,680) (20,136)
Net liability at December 31 . . . . . . . . . . . . $ (36,610) $(36,894) $ (41,892) $(30,849) $(25,587) $(21,073)
(1) Includes $10.0 million discretionary contribution to U.S. plan in 2012.
The accumulated benefit obligation (ABO) for all defined benefit pension plans was $160.7 million and$143.0 million at December 31, 2012 and 2011, respectively.
62
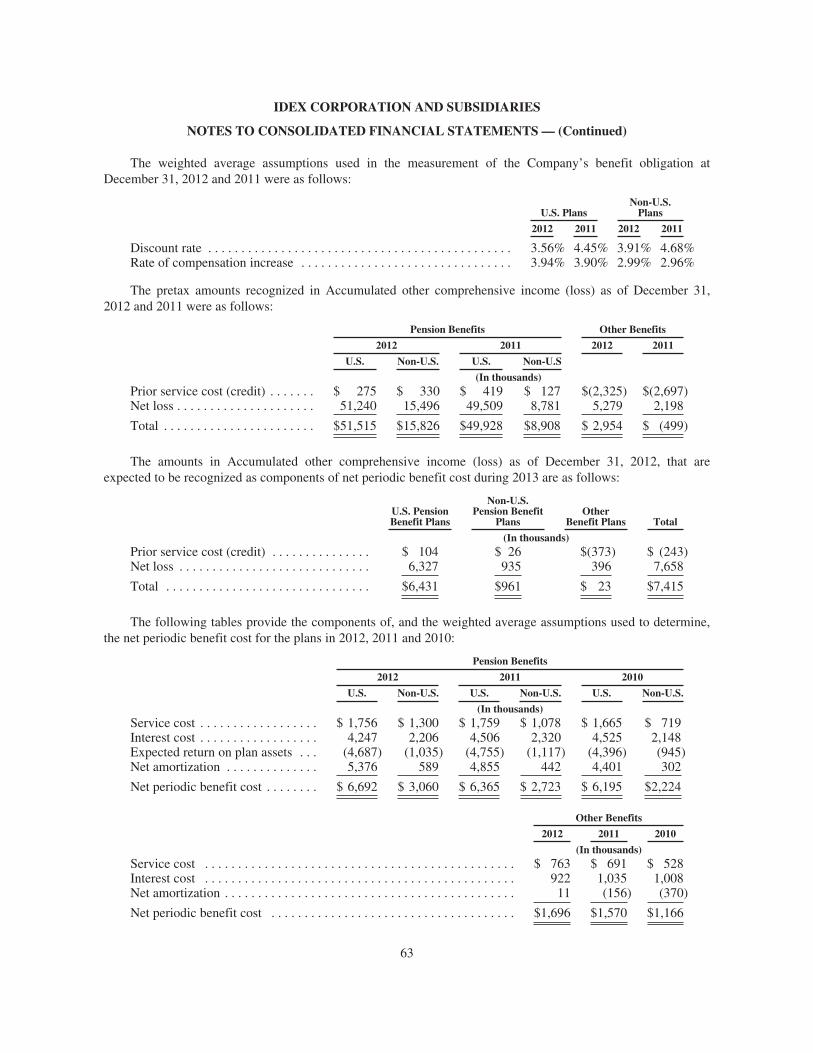
IDEX CORPORATION AND SUBSIDIARIES
NOTES TO CONSOLIDATED FINANCIAL STATEMENTS— (Continued)
The weighted average assumptions used in the measurement of the Company’s benefit obligation atDecember 31, 2012 and 2011 were as follows:
U.S. PlansNon-U.S.Plans
2012 2011 2012 2011
Discount rate . . . . . . . . . . . . . . . . . . . . . . . . . . . . . . . . . . . . . . . . . . . . . . 3.56% 4.45% 3.91% 4.68%Rate of compensation increase . . . . . . . . . . . . . . . . . . . . . . . . . . . . . . . . 3.94% 3.90% 2.99% 2.96%
The pretax amounts recognized in Accumulated other comprehensive income (loss) as of December 31,2012 and 2011 were as follows:
Pension Benefits Other Benefits2012 2011 2012 2011
U.S. Non-U.S. U.S. Non-U.S(In thousands)
Prior service cost (credit) . . . . . . . $ 275 $ 330 $ 419 $ 127 $(2,325) $(2,697)Net loss . . . . . . . . . . . . . . . . . . . . . 51,240 15,496 49,509 8,781 5,279 2,198
Total . . . . . . . . . . . . . . . . . . . . . . . $51,515 $15,826 $49,928 $8,908 $ 2,954 $ (499)
The amounts in Accumulated other comprehensive income (loss) as of December 31, 2012, that areexpected to be recognized as components of net periodic benefit cost during 2013 are as follows:
U.S. PensionBenefit Plans
Non-U.S.Pension Benefit
PlansOther
Benefit Plans Total(In thousands)
Prior service cost (credit) . . . . . . . . . . . . . . . $ 104 $ 26 $(373) $ (243)Net loss . . . . . . . . . . . . . . . . . . . . . . . . . . . . . 6,327 935 396 7,658
Total . . . . . . . . . . . . . . . . . . . . . . . . . . . . . . . $6,431 $961 $ 23 $7,415
The following tables provide the components of, and the weighted average assumptions used to determine,the net periodic benefit cost for the plans in 2012, 2011 and 2010:
Pension Benefits2012 2011 2010
U.S. Non-U.S. U.S. Non-U.S. U.S. Non-U.S.(In thousands)
Service cost . . . . . . . . . . . . . . . . . . $ 1,756 $ 1,300 $ 1,759 $ 1,078 $ 1,665 $ 719Interest cost . . . . . . . . . . . . . . . . . . 4,247 2,206 4,506 2,320 4,525 2,148Expected return on plan assets . . . (4,687) (1,035) (4,755) (1,117) (4,396) (945)Net amortization . . . . . . . . . . . . . . 5,376 589 4,855 442 4,401 302
Net periodic benefit cost . . . . . . . . $ 6,692 $ 3,060 $ 6,365 $ 2,723 $ 6,195 $2,224
Other Benefits2012 2011 2010
(In thousands)Service cost . . . . . . . . . . . . . . . . . . . . . . . . . . . . . . . . . . . . . . . . . . . . . . . $ 763 $ 691 $ 528Interest cost . . . . . . . . . . . . . . . . . . . . . . . . . . . . . . . . . . . . . . . . . . . . . . . 922 1,035 1,008Net amortization . . . . . . . . . . . . . . . . . . . . . . . . . . . . . . . . . . . . . . . . . . . . 11 (156) (370)
Net periodic benefit cost . . . . . . . . . . . . . . . . . . . . . . . . . . . . . . . . . . . . . $1,696 $1,570 $1,166
63
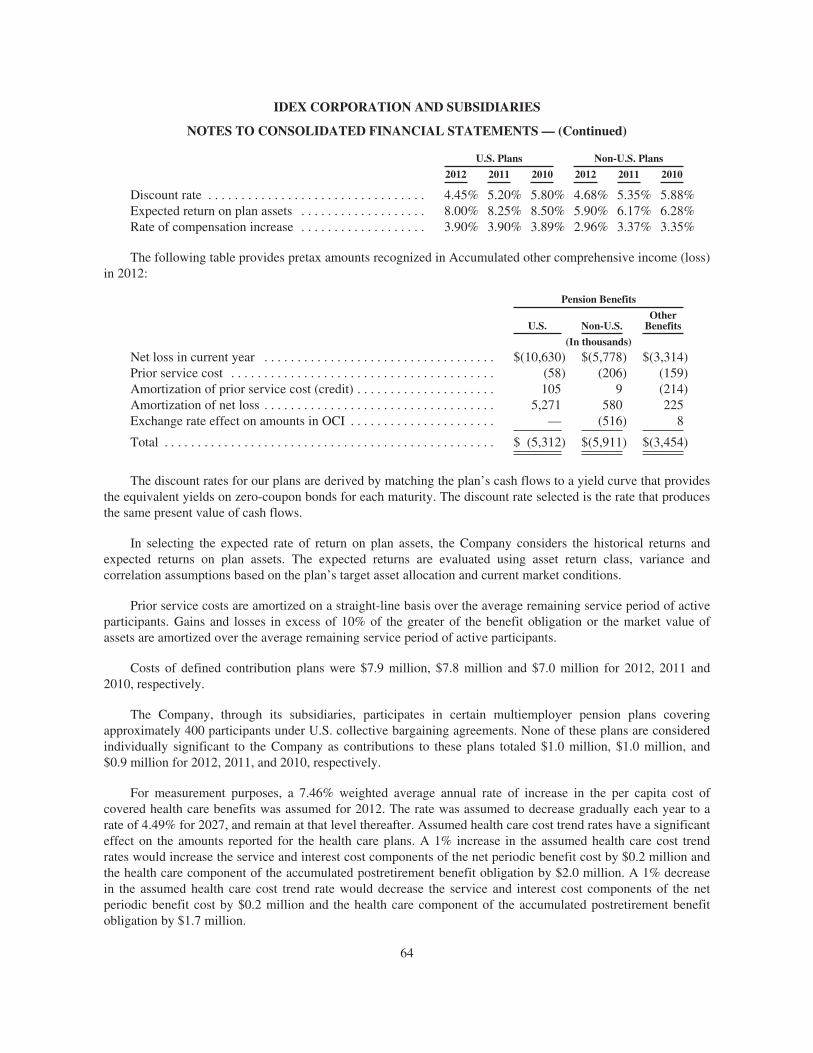
IDEX CORPORATION AND SUBSIDIARIES
NOTES TO CONSOLIDATED FINANCIAL STATEMENTS— (Continued)
U.S. Plans Non-U.S. Plans2012 2011 2010 2012 2011 2010
Discount rate . . . . . . . . . . . . . . . . . . . . . . . . . . . . . . . . . 4.45% 5.20% 5.80% 4.68% 5.35% 5.88%Expected return on plan assets . . . . . . . . . . . . . . . . . . . 8.00% 8.25% 8.50% 5.90% 6.17% 6.28%Rate of compensation increase . . . . . . . . . . . . . . . . . . . 3.90% 3.90% 3.89% 2.96% 3.37% 3.35%
The following table provides pretax amounts recognized in Accumulated other comprehensive income (loss)in 2012:
Pension Benefits
U.S. Non-U.S.OtherBenefits
(In thousands)Net loss in current year . . . . . . . . . . . . . . . . . . . . . . . . . . . . . . . . . . . $(10,630) $(5,778) $(3,314)Prior service cost . . . . . . . . . . . . . . . . . . . . . . . . . . . . . . . . . . . . . . . . (58) (206) (159)Amortization of prior service cost (credit) . . . . . . . . . . . . . . . . . . . . . 105 9 (214)Amortization of net loss . . . . . . . . . . . . . . . . . . . . . . . . . . . . . . . . . . . 5,271 580 225Exchange rate effect on amounts in OCI . . . . . . . . . . . . . . . . . . . . . . — (516) 8
Total . . . . . . . . . . . . . . . . . . . . . . . . . . . . . . . . . . . . . . . . . . . . . . . . . . $ (5,312) $(5,911) $(3,454)
The discount rates for our plans are derived by matching the plan’s cash flows to a yield curve that providesthe equivalent yields on zero-coupon bonds for each maturity. The discount rate selected is the rate that producesthe same present value of cash flows.
In selecting the expected rate of return on plan assets, the Company considers the historical returns andexpected returns on plan assets. The expected returns are evaluated using asset return class, variance andcorrelation assumptions based on the plan’s target asset allocation and current market conditions.
Prior service costs are amortized on a straight-line basis over the average remaining service period of activeparticipants. Gains and losses in excess of 10% of the greater of the benefit obligation or the market value ofassets are amortized over the average remaining service period of active participants.
Costs of defined contribution plans were $7.9 million, $7.8 million and $7.0 million for 2012, 2011 and2010, respectively.
The Company, through its subsidiaries, participates in certain multiemployer pension plans coveringapproximately 400 participants under U.S. collective bargaining agreements. None of these plans are consideredindividually significant to the Company as contributions to these plans totaled $1.0 million, $1.0 million, and$0.9 million for 2012, 2011, and 2010, respectively.
For measurement purposes, a 7.46% weighted average annual rate of increase in the per capita cost ofcovered health care benefits was assumed for 2012. The rate was assumed to decrease gradually each year to arate of 4.49% for 2027, and remain at that level thereafter. Assumed health care cost trend rates have a significanteffect on the amounts reported for the health care plans. A 1% increase in the assumed health care cost trendrates would increase the service and interest cost components of the net periodic benefit cost by $0.2 million andthe health care component of the accumulated postretirement benefit obligation by $2.0 million. A 1% decreasein the assumed health care cost trend rate would decrease the service and interest cost components of the netperiodic benefit cost by $0.2 million and the health care component of the accumulated postretirement benefitobligation by $1.7 million.
64
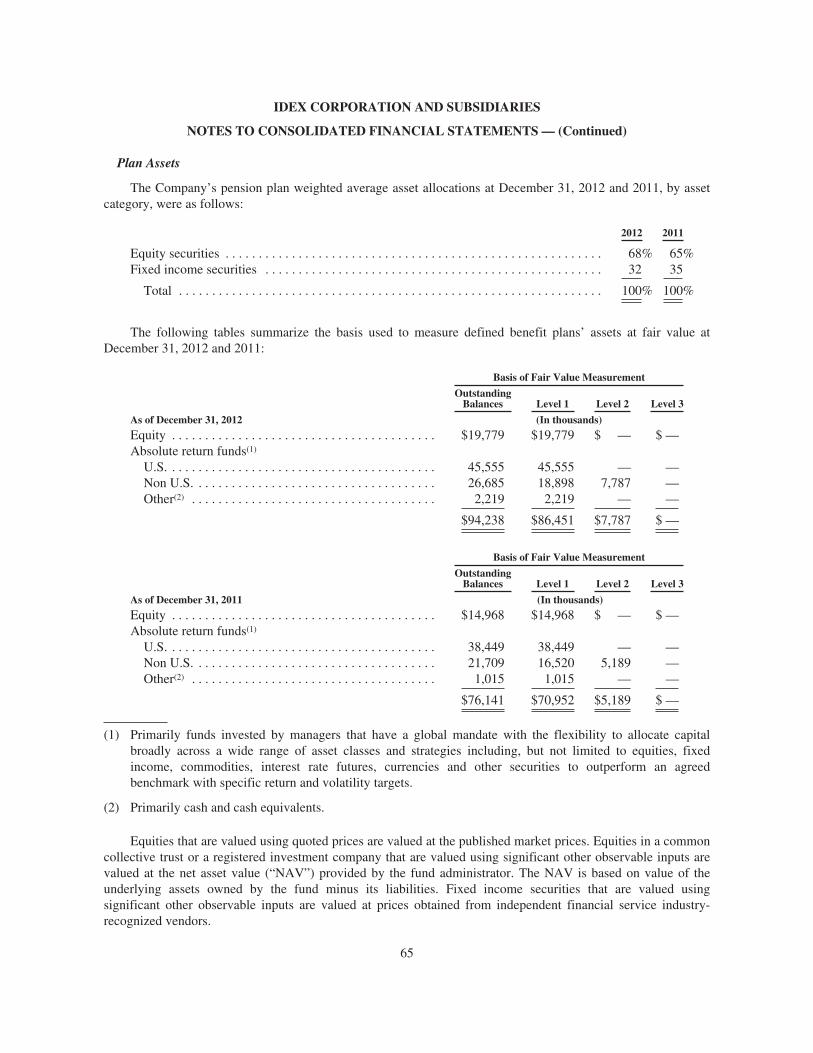
IDEX CORPORATION AND SUBSIDIARIES
NOTES TO CONSOLIDATED FINANCIAL STATEMENTS— (Continued)
Plan Assets
The Company’s pension plan weighted average asset allocations at December 31, 2012 and 2011, by assetcategory, were as follows:
2012 2011
Equity securities . . . . . . . . . . . . . . . . . . . . . . . . . . . . . . . . . . . . . . . . . . . . . . . . . . . . . . . . . 68% 65%Fixed income securities . . . . . . . . . . . . . . . . . . . . . . . . . . . . . . . . . . . . . . . . . . . . . . . . . . . 32 35
Total . . . . . . . . . . . . . . . . . . . . . . . . . . . . . . . . . . . . . . . . . . . . . . . . . . . . . . . . . . . . . . . . 100% 100%
The following tables summarize the basis used to measure defined benefit plans’ assets at fair value atDecember 31, 2012 and 2011:
Basis of Fair Value MeasurementOutstandingBalances Level 1 Level 2 Level 3
As of December 31, 2012 (In thousands)Equity . . . . . . . . . . . . . . . . . . . . . . . . . . . . . . . . . . . . . . . . $19,779 $19,779 $ — $ —Absolute return funds(1)U.S. . . . . . . . . . . . . . . . . . . . . . . . . . . . . . . . . . . . . . . . . 45,555 45,555 — —Non U.S. . . . . . . . . . . . . . . . . . . . . . . . . . . . . . . . . . . . . 26,685 18,898 7,787 —Other(2) . . . . . . . . . . . . . . . . . . . . . . . . . . . . . . . . . . . . . 2,219 2,219 — —
$94,238 $86,451 $7,787 $ —
Basis of Fair Value MeasurementOutstandingBalances Level 1 Level 2 Level 3
As of December 31, 2011 (In thousands)Equity . . . . . . . . . . . . . . . . . . . . . . . . . . . . . . . . . . . . . . . . $14,968 $14,968 $ — $ —Absolute return funds(1)U.S. . . . . . . . . . . . . . . . . . . . . . . . . . . . . . . . . . . . . . . . . 38,449 38,449 — —Non U.S. . . . . . . . . . . . . . . . . . . . . . . . . . . . . . . . . . . . . 21,709 16,520 5,189 —Other(2) . . . . . . . . . . . . . . . . . . . . . . . . . . . . . . . . . . . . . 1,015 1,015 — —
$76,141 $70,952 $5,189 $ —
(1) Primarily funds invested by managers that have a global mandate with the flexibility to allocate capitalbroadly across a wide range of asset classes and strategies including, but not limited to equities, fixedincome, commodities, interest rate futures, currencies and other securities to outperform an agreedbenchmark with specific return and volatility targets.
(2) Primarily cash and cash equivalents.
Equities that are valued using quoted prices are valued at the published market prices. Equities in a commoncollective trust or a registered investment company that are valued using significant other observable inputs arevalued at the net asset value (“NAV”) provided by the fund administrator. The NAV is based on value of theunderlying assets owned by the fund minus its liabilities. Fixed income securities that are valued usingsignificant other observable inputs are valued at prices obtained from independent financial service industry-recognized vendors.
65
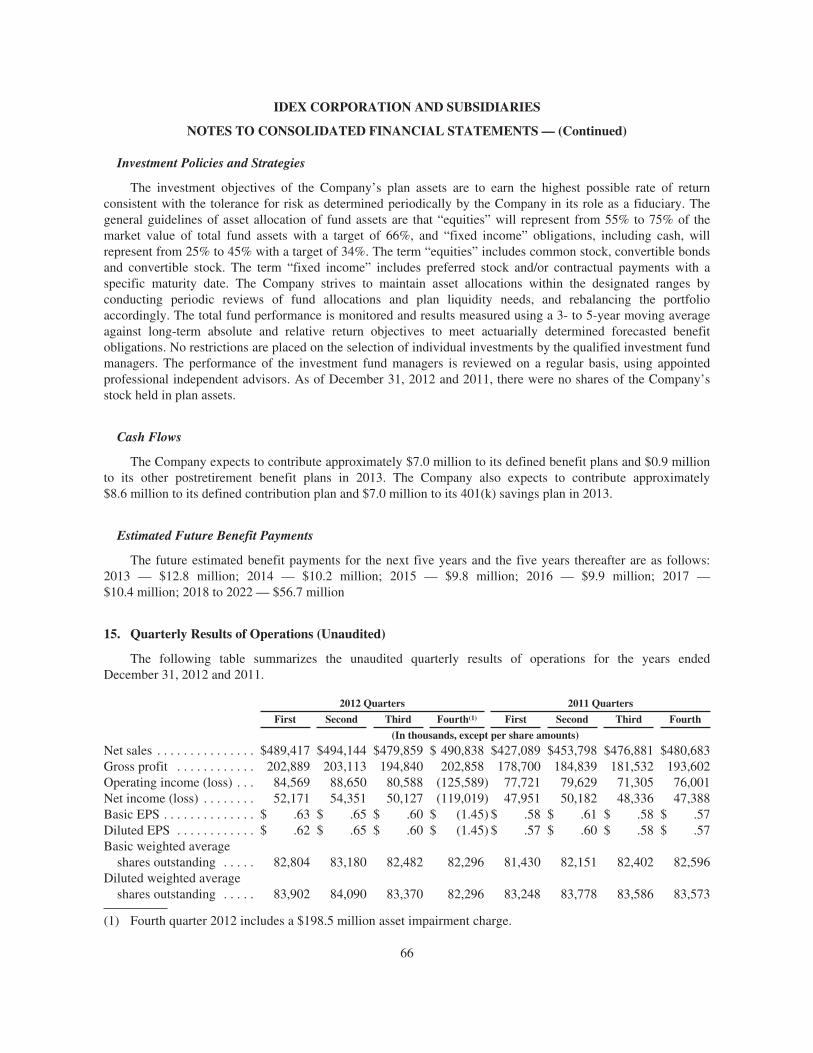
IDEX CORPORATION AND SUBSIDIARIES
NOTES TO CONSOLIDATED FINANCIAL STATEMENTS— (Continued)
Investment Policies and Strategies
The investment objectives of the Company’s plan assets are to earn the highest possible rate of returnconsistent with the tolerance for risk as determined periodically by the Company in its role as a fiduciary. Thegeneral guidelines of asset allocation of fund assets are that “equities” will represent from 55% to 75% of themarket value of total fund assets with a target of 66%, and “fixed income” obligations, including cash, willrepresent from 25% to 45% with a target of 34%. The term “equities” includes common stock, convertible bondsand convertible stock. The term “fixed income” includes preferred stock and/or contractual payments with aspecific maturity date. The Company strives to maintain asset allocations within the designated ranges byconducting periodic reviews of fund allocations and plan liquidity needs, and rebalancing the portfolioaccordingly. The total fund performance is monitored and results measured using a 3- to 5-year moving averageagainst long-term absolute and relative return objectives to meet actuarially determined forecasted benefitobligations. No restrictions are placed on the selection of individual investments by the qualified investment fundmanagers. The performance of the investment fund managers is reviewed on a regular basis, using appointedprofessional independent advisors. As of December 31, 2012 and 2011, there were no shares of the Company’sstock held in plan assets.
Cash Flows
The Company expects to contribute approximately $7.0 million to its defined benefit plans and $0.9 millionto its other postretirement benefit plans in 2013. The Company also expects to contribute approximately$8.6 million to its defined contribution plan and $7.0 million to its 401(k) savings plan in 2013.
Estimated Future Benefit Payments
The future estimated benefit payments for the next five years and the five years thereafter are as follows:2013 — $12.8 million; 2014 — $10.2 million; 2015 — $9.8 million; 2016 — $9.9 million; 2017 —$10.4 million; 2018 to 2022 — $56.7 million
15. Quarterly Results of Operations (Unaudited)
The following table summarizes the unaudited quarterly results of operations for the years endedDecember 31, 2012 and 2011.
2012 Quarters 2011 QuartersFirst Second Third Fourth(1) First Second Third Fourth
(In thousands, except per share amounts)Net sales . . . . . . . . . . . . . . . $489,417 $494,144 $479,859 $ 490,838 $427,089 $453,798 $476,881 $480,683Gross profit . . . . . . . . . . . . 202,889 203,113 194,840 202,858 178,700 184,839 181,532 193,602Operating income (loss) . . . 84,569 88,650 80,588 (125,589) 77,721 79,629 71,305 76,001Net income (loss) . . . . . . . . 52,171 54,351 50,127 (119,019) 47,951 50,182 48,336 47,388Basic EPS . . . . . . . . . . . . . . $ .63 $ .65 $ .60 $ (1.45) $ .58 $ .61 $ .58 $ .57Diluted EPS . . . . . . . . . . . . $ .62 $ .65 $ .60 $ (1.45) $ .57 $ .60 $ .58 $ .57Basic weighted averageshares outstanding . . . . . 82,804 83,180 82,482 82,296 81,430 82,151 82,402 82,596
Diluted weighted averageshares outstanding . . . . . 83,902 84,090 83,370 82,296 83,248 83,778 83,586 83,573
(1) Fourth quarter 2012 includes a $198.5 million asset impairment charge.
66
REPORT OF INDEPENDENT REGISTERED PUBLIC ACCOUNTING FIRM
To the Board of Directors and Shareholders of IDEX Corporation
We have audited the accompanying consolidated balance sheets of IDEX Corporation and subsidiaries (the“Company”) as of December 31, 2012 and 2011, and the related consolidated statements of operations,comprehensive income, shareholders’ equity, and cash flows for each of the three years in the period endedDecember 31, 2012. These consolidated financial statements are the responsibility of the Company’smanagement. Our responsibility is to express an opinion on the consolidated financial statements based on ouraudits.
We conducted our audits in accordance with the standards of the Public Company Accounting OversightBoard (United States). Those standards require that we plan and perform the audit to obtain reasonable assuranceabout whether the consolidated financial statements are free of material misstatement. An audit includesexamining, on a test basis, evidence supporting the amounts and disclosures in the consolidated financialstatements. An audit also includes assessing the accounting principles used and significant estimates made bymanagement, as well as evaluating the overall financial statement presentation. We believe that our auditsprovide a reasonable basis for our opinion.
In our opinion, such consolidated financial statements present fairly, in all material respects, theconsolidated financial position of IDEX Corporation and subsidiaries as of December 31, 2012 and 2011, and theresults of its operations and its cash flows for each of the three years in the period ended December 31, 2012, inconformity with accounting principles generally accepted in the United States of America.
We have also audited, in accordance with the standards of the Public Company Accounting Oversight Board(United States), the Company’s internal control over financial reporting as of December 31, 2012, based on thecriteria established in Internal Control — Integrated Framework issued by the Committee of SponsoringOrganizations of the Treadway Commission, and our report dated February 21, 2013, expressed an unqualifiedopinion on the Company’s internal control over financial reporting.
Deloitte & Touche LLP
Chicago, IllinoisFebruary 21, 2013
67
REPORT OF INDEPENDENT REGISTERED PUBLIC ACCOUNTING FIRM
To the Board of Directors and Shareholders of IDEX Corporation
We have audited the internal control over financial reporting of IDEX Corporation and subsidiaries (the “Company”) as ofDecember 31, 2012, based on criteria established in Internal Control — Integrated Framework issued by the Committee ofSponsoring Organizations of the Treadway Commission. As described in Management’s Report on Internal Control Over FinancialReporting, management excluded from its assessment the internal control over financial reporting at Precision PhotonicsCorporation (“PPC”), which was acquired on April 11, 2012, ERC, which was acquired on April 30, 2012, and Matcon Group Ltd(“Matcon”), which was acquired on July 20, 2012. These exclusions constitute 6.0% and 3.8% of net and total assets, respectively,and 1.7% of net sales, of the consolidated financial statement amounts as of and for the year ended December 31, 2012.Accordingly, our audit did not include the internal control over financial reporting at PPC, ERC and Matcon. The Company’smanagement is responsible for maintaining effective internal control over financial reporting and for its assessment of theeffectiveness of internal control over financial reporting, included in the accompanying Management’s Report on Internal ControlOver Financial Reporting. Our responsibility is to express an opinion on the Company’s internal control over financial reportingbased on our audit.
We conducted our audit in accordance with the standards of the Public Company Accounting Oversight Board (United States).Those standards require that we plan and perform the audit to obtain reasonable assurance about whether effective internal controlover financial reporting was maintained in all material respects. Our audit included obtaining an understanding of internal controlover financial reporting, assessing the risk that a material weakness exists, testing and evaluating the design and operatingeffectiveness of internal control based on the assessed risk, and performing such other procedures as we considered necessary inthe circumstances. We believe that our audit provides a reasonable basis for our opinion.
A company’s internal control over financial reporting is a process designed by, or under the supervision of, the company’sprincipal executive and principal financial officers, or persons performing similar functions, and effected by the company’s boardof directors, management, and other personnel to provide reasonable assurance regarding the reliability of financial reporting andthe preparation of financial statements for external purposes in accordance with accounting principles generally accepted in theUnited States of America (“generally accepted accounting principles”). A company’s internal control over financial reportingincludes those policies and procedures that (1) pertain to the maintenance of records that, in reasonable detail, accurately and fairlyreflect the transactions and dispositions of the assets of the company; (2) provide reasonable assurance that transactions arerecorded as necessary to permit preparation of financial statements in accordance with generally accepted accounting principles,and that receipts and expenditures of the company are being made only in accordance with authorizations of management anddirectors of the company; and (3) provide reasonable assurance regarding prevention or timely detection of unauthorizedacquisition, use, or disposition of the company’s assets that could have a material effect on the financial statements.
Because of the inherent limitations of internal control over financial reporting, including the possibility of collusion orimproper management override of controls, material misstatements due to error or fraud may not be prevented or detected on atimely basis. Also, projections of any evaluation of the effectiveness of the internal control over financial reporting to futureperiods are subject to the risk that the controls may become inadequate because of changes in conditions, or that the degree ofcompliance with the policies or procedures may deteriorate.
In our opinion, the Company maintained, in all material respects, effective internal control over financial reporting as ofDecember 31, 2012, based on the criteria established in Internal Control — Integrated Framework issued by the Committee ofSponsoring Organizations of the Treadway Commission.
We have also audited, in accordance with the standards of the Public Company Accounting Oversight Board (United States),the consolidated financial statements as of and for the year ended December 31, 2012, of the Company and our report datedFebruary 21, 2013, expressed an unqualified opinion on those consolidated financial statements.
Deloitte & Touche LLP
Chicago, IllinoisFebruary 21, 2013
68

MANAGEMENT’S REPORT ON INTERNAL CONTROL OVER FINANCIAL REPORTING
Internal control over financial reporting refers to the process designed by, or under the supervision of, ourChief Executive Officer and Chief Financial Officer, and effected by our board of directors, management andother personnel, to provide reasonable assurance regarding the reliability of financial reporting and thepreparation of financial statements for external purposes in accordance with accounting principles generallyaccepted in the United States of America, and includes those policies and procedures that:
• Pertain to the maintenance of records that, in reasonable detail, accurately and fairly reflect thetransactions and dispositions of the assets of the Company;
• Provide reasonable assurance that transactions are recorded as necessary to permit preparation offinancial statements in accordance with accounting principles generally accepted in the United States ofAmerica, and that receipts and expenditures of the Company are being made only in accordance withauthorizations of management and directors of the Company; and
• Provide reasonable assurance regarding prevention or timely detection of unauthorized acquisition, use ordisposition of the Company’s assets that could have a material effect on the financial statements.
Internal control over financial reporting cannot provide absolute assurance of achieving financial reportingobjectives because of its inherent limitations. Internal control over financial reporting is a process that involveshuman diligence and compliance and is subject to lapses in judgment and breakdowns resulting from humanfailures. Internal control over financial reporting also can be circumvented by collusion or improper managementoverride. Because of such limitations, there is a risk that material misstatements may not be prevented or detectedon a timely basis by internal control over financial reporting. However, these inherent limitations are knownfeatures of the financial reporting process. Therefore, it is possible to design into the process safeguards toreduce, though not eliminate, this risk. Management is responsible for establishing and maintaining effectiveinternal control over financial reporting for the Company. Management has used the framework set forth in thereport entitled “Internal Control — Integrated Framework” issued by the Committee of SponsoringOrganizations of the Treadway Commission to assess the effectiveness of the Company’s internal control overfinancial reporting. Management has concluded that the Company’s internal control over financial reporting waseffective as of December 31, 2012.
The Company completed the acquisitions of PPC in April 2012, ERC in April 2012 and Matcon in July2012. Due to the timing of the acquisitions, management has excluded these acquisitions from our evaluation ofeffectiveness of internal controls over financial reporting. This exclusion represented 1.7% of total sales, 6.0% ofnet assets and 3.8% of total assets for the year ended December 31, 2012.
The effectiveness of the Company’s internal control over financial reporting as of December 31, 2012, hasbeen audited by Deloitte & Touche LLP, an independent registered public accounting firm, as stated in theirreport which appears herein.
Andrew K. SilvernailChairman of the Board, President and ChiefExecutive Officer
Heath A. MittsVice President and Chief Financial Officer
Lake Forest, IllinoisFebruary 21, 2013
69
Item 9. Changes in and Disagreements with Accountants on Accounting and Financial Disclosure.
None.
Item 9A. Controls and Procedures.
The Company maintains disclosure controls and procedures that are designed to ensure that informationrequired to be disclosed in the Company’s Exchange Act reports is recorded, processed, summarized andreported within the time periods specified in the SEC’s rules and forms, and that such information is accumulatedand communicated to the Company’s management, including its Chief Executive Officer and Chief FinancialOfficer, as appropriate, to allow timely decisions regarding required disclosure.
As required by SEC Rule 13a-15(b), the Company carried out an evaluation, under the supervision and withthe participation of the Company’s management, including the Company’s Chief Executive Officer and ChiefFinancial Officer, of the effectiveness of the design and operation of the Company’s disclosure controls andprocedures as of the end of the period covered by this report. Based on the foregoing, the Company’s ChiefExecutive Officer and Chief Financial Officer concluded that the Company’s disclosure controls and procedureswere effective as of December 31, 2012.
Management’s Report on Internal Control Over Financial Reporting appearing on page 69 of this report isincorporated into this Item 9A by reference.
There has been no change in the Company’s internal control over financial reporting during the Company’smost recent fiscal quarter that has materially affected, or is reasonably likely to materially affect, the Company’sinternal control over financial reporting.
Item 9B. Other Information.
None.
PART III
Item 10. Directors, Executive Officers and Corporate Governance.
Information under the headings “Election of Directors” and “Section 16(a) Beneficial Ownership ReportingCompliance,” and the information under the subheading “Information Regarding the Board of Directors andCommittees,” in the 2013 Proxy Statement is incorporated into this Item 10 by reference. Information regardingexecutive officers of the Company is located in Part I, Item 1, of this report under the caption “ExecutiveOfficers of the Registrant.”
The Company has adopted a Code of Business Conduct and Ethics applicable to the Company’s directors,officers (including the Company’s principal executive officer, principal financial officer and principal accountingofficer) and employees. The Code of Business Conduct and Ethics, along with the Audit Committee Charter,Nominating and Corporate Governance Committee Charter, Compensation Committee Charter and CorporateGovernance Guidelines are available on the Company’s website at www.idexcorp.com. In the event we amend orwaive any of the provisions of the Code of Business Conduct and Ethics applicable to our principal executiveofficer, principal financial officer or principal accounting officer, we intend to disclose the same on theCompany’s website.
Item 11. Executive Compensation.
Information under the heading “Executive Compensation” in the 2013 Proxy Statement is incorporated intothis Item 11 by reference.
70
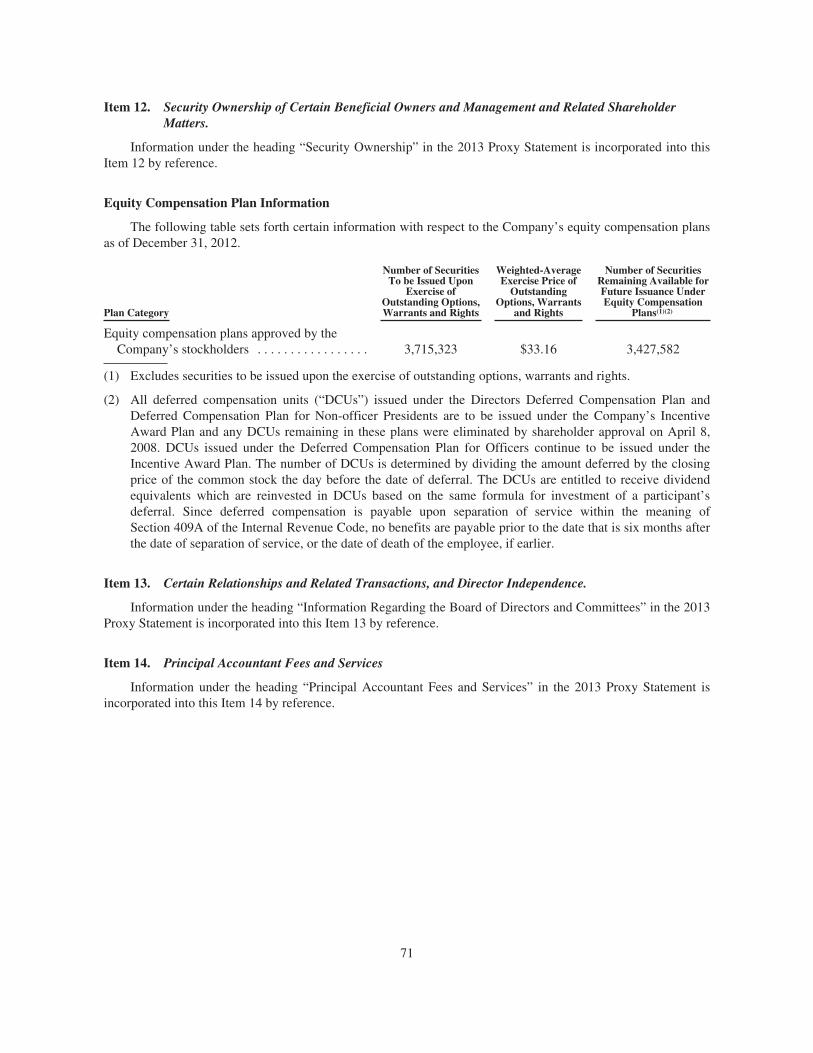
Item 12. Security Ownership of Certain Beneficial Owners and Management and Related ShareholderMatters.
Information under the heading “Security Ownership” in the 2013 Proxy Statement is incorporated into thisItem 12 by reference.
Equity Compensation Plan Information
The following table sets forth certain information with respect to the Company’s equity compensation plansas of December 31, 2012.
Plan Category
Number of SecuritiesTo be Issued Upon
Exercise ofOutstanding Options,Warrants and Rights
Weighted-AverageExercise Price ofOutstanding
Options, Warrantsand Rights
Number of SecuritiesRemaining Available forFuture Issuance UnderEquity Compensation
Plans(1)(2)
Equity compensation plans approved by theCompany’s stockholders . . . . . . . . . . . . . . . . . 3,715,323 $33.16 3,427,582
(1) Excludes securities to be issued upon the exercise of outstanding options, warrants and rights.
(2) All deferred compensation units (“DCUs”) issued under the Directors Deferred Compensation Plan andDeferred Compensation Plan for Non-officer Presidents are to be issued under the Company’s IncentiveAward Plan and any DCUs remaining in these plans were eliminated by shareholder approval on April 8,2008. DCUs issued under the Deferred Compensation Plan for Officers continue to be issued under theIncentive Award Plan. The number of DCUs is determined by dividing the amount deferred by the closingprice of the common stock the day before the date of deferral. The DCUs are entitled to receive dividendequivalents which are reinvested in DCUs based on the same formula for investment of a participant’sdeferral. Since deferred compensation is payable upon separation of service within the meaning ofSection 409A of the Internal Revenue Code, no benefits are payable prior to the date that is six months afterthe date of separation of service, or the date of death of the employee, if earlier.
Item 13. Certain Relationships and Related Transactions, and Director Independence.
Information under the heading “Information Regarding the Board of Directors and Committees” in the 2013Proxy Statement is incorporated into this Item 13 by reference.
Item 14. Principal Accountant Fees and Services
Information under the heading “Principal Accountant Fees and Services” in the 2013 Proxy Statement isincorporated into this Item 14 by reference.
71
PART IV
Item 15. Exhibits and Financial Statement Schedules.
(A) 1. Financial Statements
Consolidated financial statements filed as part of this report are listed under Part II. Item 8. “FinancialStatements and Supplementary Data.”
2. Financial Statement Schedules
Financial statement schedules are omitted because they are not applicable, not required, or because therequired information is included in the Consolidated Financial Statements of the Company or the Notes thereto.
3. Exhibits
The exhibits filed with this report are listed on the “Exhibit Index.”
(B) Exhibit Index
Reference is made to the Exhibit Index beginning on page 74 hereof.
72

SIGNATURES
Pursuant to the requirements of Section 13 or 15(d) of the Securities Exchange Act of 1934, the Registranthas duly caused this report to be signed on its behalf by the undersigned, thereunto duly authorized.
IDEX CORPORATION
By: /s/ HEATH A. MITTS
Heath A. MittsVice President and Chief Financial Officer
Date: February 21, 2013
Pursuant to the requirements of the Securities Exchange Act of 1934, this report has been signed below bythe following persons on behalf of the Registrant and in the capacities and on the dates indicated.
Signature Title Date
/s/ ANDREW K. SILVERNAIL
Andrew K. Silvernail
Chairman of the Board, President andChief Executive Officer
(Principal Executive Officer)
February 21, 2013
/s/ HEATH A. MITTS
Heath A. Mitts
Vice President and Chief FinancialOfficer (Principal Financial Officer)
February 21, 2013
/s/ MICHAEL J. YATES
Michael J. Yates
Vice President andChief Accounting Officer
(Principal Accounting Officer)
February 21, 2013
/s/ BRADLEY J. BELL
Bradley J. Bell
Director February 21, 2013
/s/ RUBY R. CHANDY
Ruby R. Chandy
Director February 21, 2013
/s/ WILLIAM M. COOK
William M. Cook
Director February 21, 2013
/s/ GREGORY F. MILZCIK
Gregory F. Milzcik
Director February 21, 2013
/s/ ERNEST J. MROZEK
Ernest J. Mrozek
Director February 21, 2013
/s/ MICHAEL T. TOKARZ
Michael T. Tokarz
Director February 21, 2013
/s/ LIVINGSTON L. SATTERTHWAITE
Livingston L. Satterthwaite
Director February 21, 2013
/s/ DAVID C. PARRY
David C. Parry
Director February 21, 2013
73
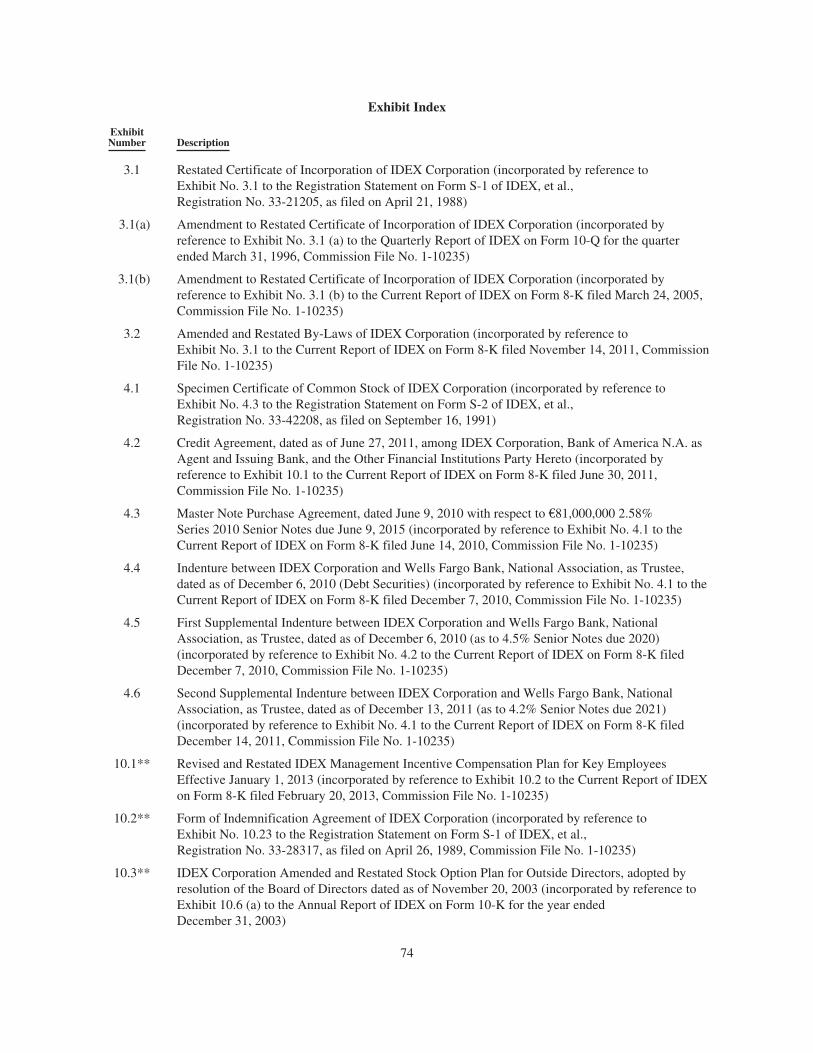
Exhibit Index
ExhibitNumber Description
3.1 Restated Certificate of Incorporation of IDEX Corporation (incorporated by reference toExhibit No. 3.1 to the Registration Statement on Form S-1 of IDEX, et al.,Registration No. 33-21205, as filed on April 21, 1988)
3.1(a) Amendment to Restated Certificate of Incorporation of IDEX Corporation (incorporated byreference to Exhibit No. 3.1 (a) to the Quarterly Report of IDEX on Form 10-Q for the quarterended March 31, 1996, Commission File No. 1-10235)
3.1(b) Amendment to Restated Certificate of Incorporation of IDEX Corporation (incorporated byreference to Exhibit No. 3.1 (b) to the Current Report of IDEX on Form 8-K filed March 24, 2005,Commission File No. 1-10235)
3.2 Amended and Restated By-Laws of IDEX Corporation (incorporated by reference toExhibit No. 3.1 to the Current Report of IDEX on Form 8-K filed November 14, 2011, CommissionFile No. 1-10235)
4.1 Specimen Certificate of Common Stock of IDEX Corporation (incorporated by reference toExhibit No. 4.3 to the Registration Statement on Form S-2 of IDEX, et al.,Registration No. 33-42208, as filed on September 16, 1991)
4.2 Credit Agreement, dated as of June 27, 2011, among IDEX Corporation, Bank of America N.A. asAgent and Issuing Bank, and the Other Financial Institutions Party Hereto (incorporated byreference to Exhibit 10.1 to the Current Report of IDEX on Form 8-K filed June 30, 2011,Commission File No. 1-10235)
4.3 Master Note Purchase Agreement, dated June 9, 2010 with respect to €81,000,000 2.58%Series 2010 Senior Notes due June 9, 2015 (incorporated by reference to Exhibit No. 4.1 to theCurrent Report of IDEX on Form 8-K filed June 14, 2010, Commission File No. 1-10235)
4.4 Indenture between IDEX Corporation and Wells Fargo Bank, National Association, as Trustee,dated as of December 6, 2010 (Debt Securities) (incorporated by reference to Exhibit No. 4.1 to theCurrent Report of IDEX on Form 8-K filed December 7, 2010, Commission File No. 1-10235)
4.5 First Supplemental Indenture between IDEX Corporation and Wells Fargo Bank, NationalAssociation, as Trustee, dated as of December 6, 2010 (as to 4.5% Senior Notes due 2020)(incorporated by reference to Exhibit No. 4.2 to the Current Report of IDEX on Form 8-K filedDecember 7, 2010, Commission File No. 1-10235)
4.6 Second Supplemental Indenture between IDEX Corporation and Wells Fargo Bank, NationalAssociation, as Trustee, dated as of December 13, 2011 (as to 4.2% Senior Notes due 2021)(incorporated by reference to Exhibit No. 4.1 to the Current Report of IDEX on Form 8-K filedDecember 14, 2011, Commission File No. 1-10235)
10.1** Revised and Restated IDEX Management Incentive Compensation Plan for Key EmployeesEffective January 1, 2013 (incorporated by reference to Exhibit 10.2 to the Current Report of IDEXon Form 8-K filed February 20, 2013, Commission File No. 1-10235)
10.2** Form of Indemnification Agreement of IDEX Corporation (incorporated by reference toExhibit No. 10.23 to the Registration Statement on Form S-1 of IDEX, et al.,Registration No. 33-28317, as filed on April 26, 1989, Commission File No. 1-10235)
10.3** IDEX Corporation Amended and Restated Stock Option Plan for Outside Directors, adopted byresolution of the Board of Directors dated as of November 20, 2003 (incorporated by reference toExhibit 10.6 (a) to the Annual Report of IDEX on Form 10-K for the year endedDecember 31, 2003)
74
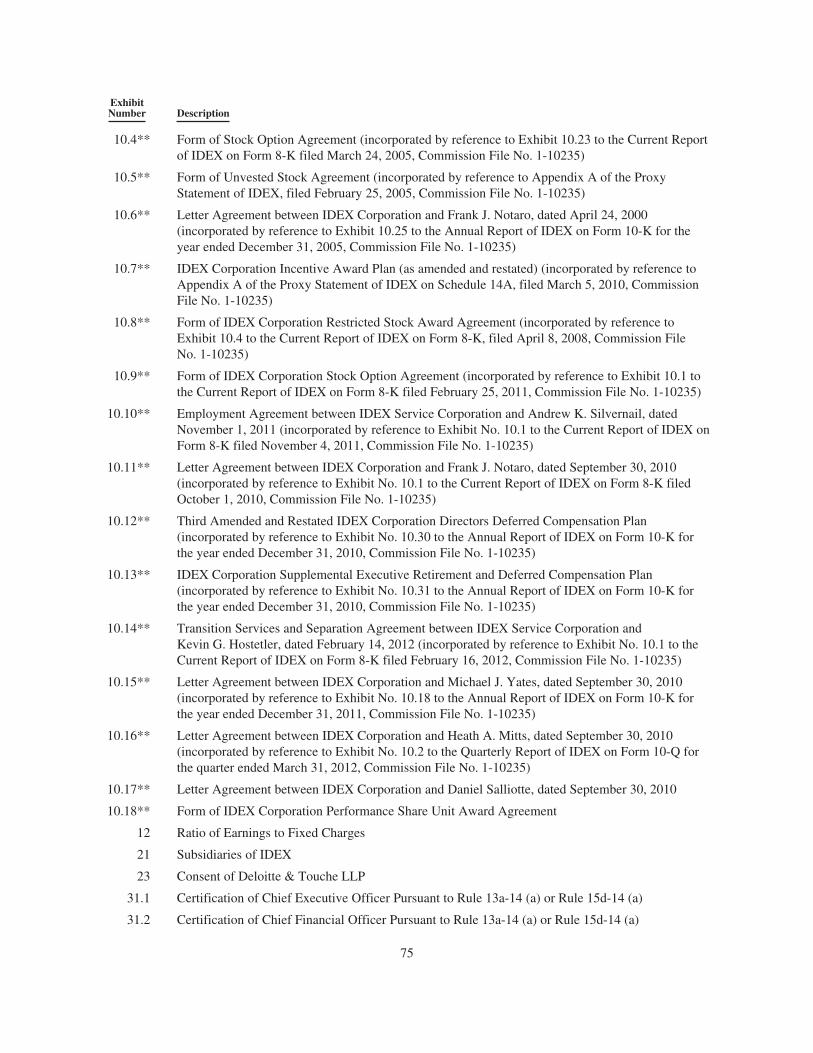
ExhibitNumber Description
10.4** Form of Stock Option Agreement (incorporated by reference to Exhibit 10.23 to the Current Reportof IDEX on Form 8-K filed March 24, 2005, Commission File No. 1-10235)
10.5** Form of Unvested Stock Agreement (incorporated by reference to Appendix A of the ProxyStatement of IDEX, filed February 25, 2005, Commission File No. 1-10235)
10.6** Letter Agreement between IDEX Corporation and Frank J. Notaro, dated April 24, 2000(incorporated by reference to Exhibit 10.25 to the Annual Report of IDEX on Form 10-K for theyear ended December 31, 2005, Commission File No. 1-10235)
10.7** IDEX Corporation Incentive Award Plan (as amended and restated) (incorporated by reference toAppendix A of the Proxy Statement of IDEX on Schedule 14A, filed March 5, 2010, CommissionFile No. 1-10235)
10.8** Form of IDEX Corporation Restricted Stock Award Agreement (incorporated by reference toExhibit 10.4 to the Current Report of IDEX on Form 8-K, filed April 8, 2008, Commission FileNo. 1-10235)
10.9** Form of IDEX Corporation Stock Option Agreement (incorporated by reference to Exhibit 10.1 tothe Current Report of IDEX on Form 8-K filed February 25, 2011, Commission File No. 1-10235)
10.10** Employment Agreement between IDEX Service Corporation and Andrew K. Silvernail, datedNovember 1, 2011 (incorporated by reference to Exhibit No. 10.1 to the Current Report of IDEX onForm 8-K filed November 4, 2011, Commission File No. 1-10235)
10.11** Letter Agreement between IDEX Corporation and Frank J. Notaro, dated September 30, 2010(incorporated by reference to Exhibit No. 10.1 to the Current Report of IDEX on Form 8-K filedOctober 1, 2010, Commission File No. 1-10235)
10.12** Third Amended and Restated IDEX Corporation Directors Deferred Compensation Plan(incorporated by reference to Exhibit No. 10.30 to the Annual Report of IDEX on Form 10-K forthe year ended December 31, 2010, Commission File No. 1-10235)
10.13** IDEX Corporation Supplemental Executive Retirement and Deferred Compensation Plan(incorporated by reference to Exhibit No. 10.31 to the Annual Report of IDEX on Form 10-K forthe year ended December 31, 2010, Commission File No. 1-10235)
10.14** Transition Services and Separation Agreement between IDEX Service Corporation andKevin G. Hostetler, dated February 14, 2012 (incorporated by reference to Exhibit No. 10.1 to theCurrent Report of IDEX on Form 8-K filed February 16, 2012, Commission File No. 1-10235)
10.15** Letter Agreement between IDEX Corporation and Michael J. Yates, dated September 30, 2010(incorporated by reference to Exhibit No. 10.18 to the Annual Report of IDEX on Form 10-K forthe year ended December 31, 2011, Commission File No. 1-10235)
10.16** Letter Agreement between IDEX Corporation and Heath A. Mitts, dated September 30, 2010(incorporated by reference to Exhibit No. 10.2 to the Quarterly Report of IDEX on Form 10-Q forthe quarter ended March 31, 2012, Commission File No. 1-10235)
10.17** Letter Agreement between IDEX Corporation and Daniel Salliotte, dated September 30, 2010
10.18** Form of IDEX Corporation Performance Share Unit Award Agreement
12 Ratio of Earnings to Fixed Charges
21 Subsidiaries of IDEX
23 Consent of Deloitte & Touche LLP
31.1 Certification of Chief Executive Officer Pursuant to Rule 13a-14 (a) or Rule 15d-14 (a)
31.2 Certification of Chief Financial Officer Pursuant to Rule 13a-14 (a) or Rule 15d-14 (a)
75
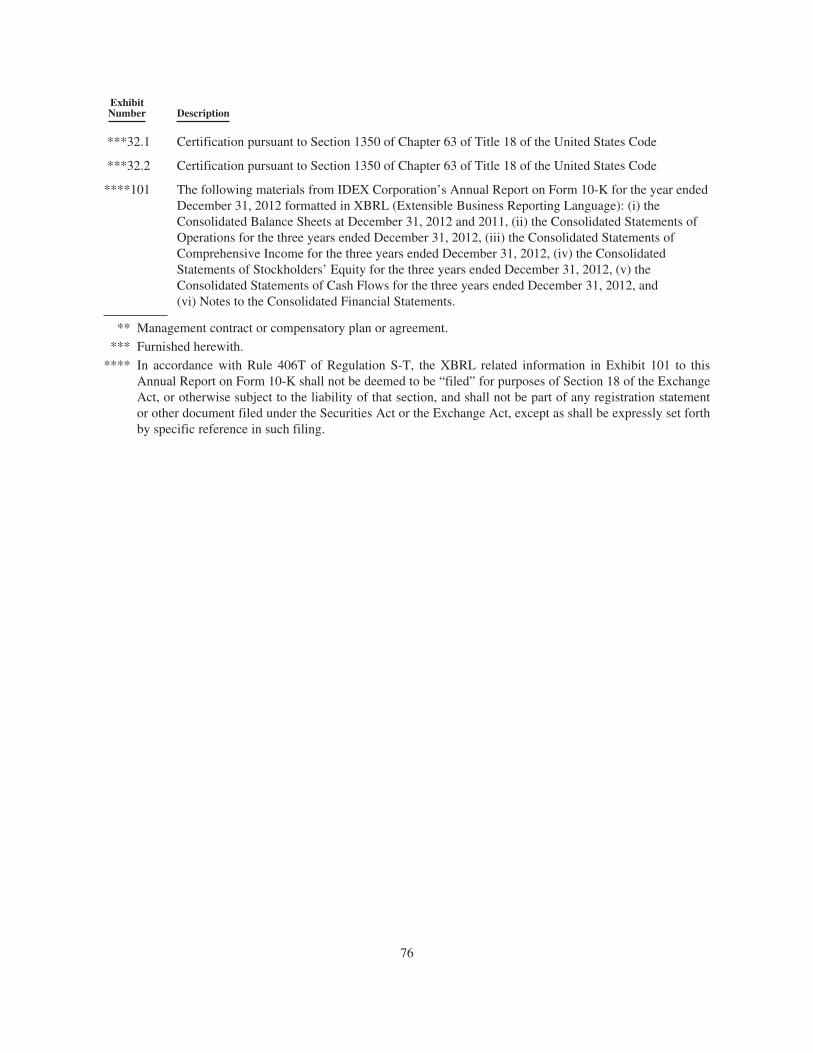
ExhibitNumber Description
***32.1 Certification pursuant to Section 1350 of Chapter 63 of Title 18 of the United States Code
***32.2 Certification pursuant to Section 1350 of Chapter 63 of Title 18 of the United States Code
****101 The following materials from IDEX Corporation’s Annual Report on Form 10-K for the year endedDecember 31, 2012 formatted in XBRL (Extensible Business Reporting Language): (i) theConsolidated Balance Sheets at December 31, 2012 and 2011, (ii) the Consolidated Statements ofOperations for the three years ended December 31, 2012, (iii) the Consolidated Statements ofComprehensive Income for the three years ended December 31, 2012, (iv) the ConsolidatedStatements of Stockholders’ Equity for the three years ended December 31, 2012, (v) theConsolidated Statements of Cash Flows for the three years ended December 31, 2012, and(vi) Notes to the Consolidated Financial Statements.
** Management contract or compensatory plan or agreement.*** Furnished herewith.**** In accordance with Rule 406T of Regulation S-T, the XBRL related information in Exhibit 101 to this
Annual Report on Form 10-K shall not be deemed to be “filed” for purposes of Section 18 of the ExchangeAct, or otherwise subject to the liability of that section, and shall not be part of any registration statementor other document filed under the Securities Act or the Exchange Act, except as shall be expressly set forthby specific reference in such filing.
76

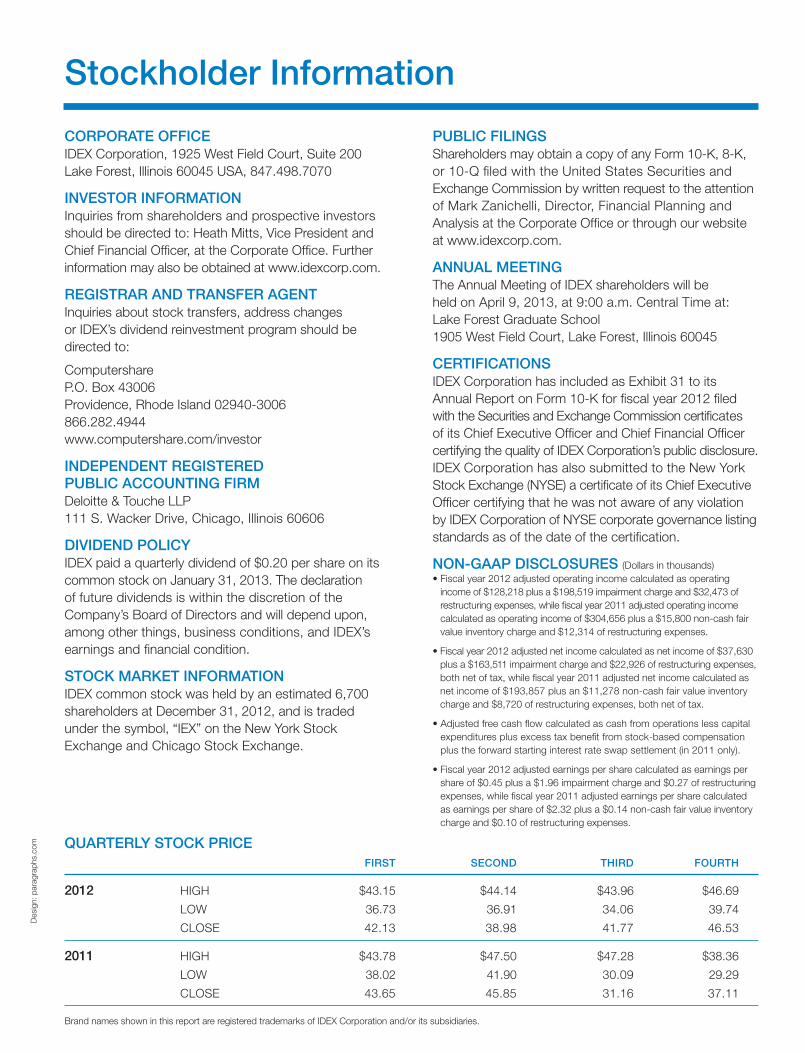
Paragraphs #91556
6 Page Cover Inside 2.19.2013
BLK PMS285
END MARKETS BRANDS PRODUCTS
Energy & fuels Corken / Faure Herman / Liquid Controls / SAMPI / Sponsler / Toptech Systems
Leading supplier of flow meters, electronic registration and control products, rotary vane and turbine pumps, reciprocating piston compressors and terminal automation systems
Water services Accusonic / ADS / Hydra-Stop / IETG / iPEK Detection and improvement of inefficiencies in the water, wastewater and power generation industries through flow monitoring & measurement, asset surveys, leak detection, line stopping, valve insertion and CCTV inspection systems
Aerospace, biopharma chemical, food & beverage, laundry, mining, oil & gas, petrochem, power generation, pulp & paper, semiconductor, solar, wastewater and water treatment
Knight / OBL / PeriFlo / Pulsafeeder / Trebor / Warren Rupp (which includes the SANDPIPER, Versa-Matic, Blagdon and Pumper Parts brands)
Pumps, heaters, controllers, systems, accessories and process equipment used for diaphragm and dosing pump applications. Technologies include: air-operated double-diaphragm pumps, ultra-pure chemical pumps, quartz de-ionized water heaters, peristaltic, precision hydraulic and mechanical diaphragm metering pumps, sliding vane, centrifugal, cooling tower, boiler controllers and timers. Products manufactured under Diaphragm & Dosing assist with movement, measurement, metering, mixing, dispensing and heating of various chemicals, water and other fluids through pumps, flow monitors and controls
Chemical, food processing and personal care Richter / Viking / Wright Flow Technologies Pumps, valves and accessories used in industrial and hygienic process applications; pump technologies include: rotary gear, centrifugal, lobe, vane and circumferential piston pumps; in addition they offer industrial valves, accessories and services.
Life sciences, analytical instrumentation, biotechnology and diagnostics
IDEX Health & Science / Eastern Plastics / Ismatec / Isolation Technologies / Rheodyne / Systec / Sapphire Engineering / Upchurch Scientific / ERC
Fluid processing components and fluidic sub-systems include; pumps, valves, tubing, fittings, degassers, manifolds, and machined materials; our integrated solutions approach enables optimization of the fluid path through multi-component subsystem design, development and production
Life sciences and medical instrumentation, scientific instrumentation, industrial materials processing and measurement, semiconductor manufacturing and wafer processing, environmental monitoring and defense and security
AT Films / Precision Photonics / CVI Laser / Melles Griot / Semrock
Advanced coating technologies for high performance applications, including Ion Beam Sputtering (IBS), Electron beam (EB), and Plasma Ion-assisted Deposition (PIAD), a wide range of innovative photonic and optical components and subsystems including solid-state and gas lasers and laser light engines, filters, lenses, mirrors, beam-splitters, waveplates, polarizers, shutters and opto-mechanical assemblies, and custom Optical and Electro-optic Assemblies (EOAs)
Industrial machinery, pharmaceuticals, food, laboratory, medical and dental
Fitzpatrick / Gast / JUN-AIR / Microfluidics / Quadro Engineering / Matcon
Clean, quiet compressors, air motors, regenerative blowers, vacuum pumps and generators; highly engineered material handling systems, size reduction mills, roll compacters, mixers, emulsifiers, powder dispensing and dispersion equipment
Printing & specialty seals Micropump / Precision Polymer Engineering High-efficiency miniature magnetically and electromagnetically driven gear pumps delivering pulse-free flow and exceptional life; high performance sealing solutions for demanding applications
Public and private fire and rescue agencies, nuclear power and petrochemical facilities, mining, transit bus and specialty vehicle applications
Class 1 / Godiva / HaleTruck-mounted and portable fire pumps, pump modules and pump kits, skidded and trailer mounted engine-driven pumping systems, marine pumps, foam and compressed-air foam systems, electronic controls and information systems, conventional and networked electrical systems and mechanical components
Fire services, civil defense, military, machine manufacturing, infrastructure providers such as railways, airports and public transportation systems
Dinglee / HURST Jaws of Life / LUKAS / Vetter Hydraulic and battery powered rescue tools, re-railing equipment, lifting & positioning devices for various industrial applications; pneumatic lifting bags and emergency shoring equipment
Agriculture, civil infrastructure, electrical transmission and distribution, manufacturing, mining, municipal, oil & gas, auto, petrochemical and chemical
Banjo / BAND-ITInjection-molded high quality, chemical and corrosion resistance valves and other liquid handling products designed for specific agricultural applications; engineered fastening systems consisting of band clamping products, manufactured from a variety of stainless steel and other corrosion-resistant materials and related installation tools
DIY retail stores and professional paint stores Fast & Fluid Management / Fluid Management Manual and automatic precision dispensing and mixing systems, software and service solutions for custom formulations at the point-of-sale
IDEX Overview Stockholder Information
CORPORATE OFFICEIDEX Corporation, 1925 West Field Court, Suite 200 Lake Forest, Illinois 60045 USA, 847.498.7070
INVESTOR INFORMATION Inquiries from shareholders and prospective investors should be directed to: Heath Mitts, Vice President and Chief Financial Officer, at the Corporate Office. Further information may also be obtained at www.idexcorp.com.
REGISTRAR AND TRANSFER AGENT Inquiries about stock transfers, address changes or IDEX’s dividend reinvestment program should be directed to:
Computershare P.O. Box 43006 Providence, Rhode Island 02940-3006 866.282.4944 www.computershare.com/investor
INDEPENDENT REGISTERED PUBLIC ACCOUNTING FIRMDeloitte & Touche LLP 111 S. Wacker Drive, Chicago, Illinois 60606
DIVIDEND POLICY IDEX paid a quarterly dividend of $0.20 per share on its common stock on January 31, 2013. The declaration of future dividends is within the discretion of the Company’s Board of Directors and will depend upon, among other things, business conditions, and IDEX’s earnings and financial condition.
STOCK MARKET INFORMATION IDEX common stock was held by an estimated 6,700 shareholders at December 31, 2012, and is traded under the symbol, “IEX” on the New York Stock Exchange and Chicago Stock Exchange.
PUBLIC FILINGS Shareholders may obtain a copy of any Form 10-K, 8-K, or 10-Q filed with the United States Securities and Exchange Commission by written request to the attention of Mark Zanichelli, Director, Financial Planning and Analysis at the Corporate Office or through our website at www.idexcorp.com.
ANNUAL MEETING The Annual Meeting of IDEX shareholders will be held on April 9, 2013, at 9:00 a.m. Central Time at: Lake Forest Graduate School 1905 West Field Court, Lake Forest, Illinois 60045
CERTIFICATIONS IDEX Corporation has included as Exhibit 31 to its Annual Report on Form 10-K for fiscal year 2012 filed with the Securities and Exchange Commission certificates of its Chief Executive Officer and Chief Financial Officer certifying the quality of IDEX Corporation’s public disclosure. IDEX Corporation has also submitted to the New York Stock Exchange (NYSE) a certificate of its Chief Executive Officer certifying that he was not aware of any violation by IDEX Corporation of NYSE corporate governance listing standards as of the date of the certification.
NON-GAAP DISCLOSURES (Dollars in thousands)
income of $128,218 plus a $198,519 impairment charge and $32,473 of restructuring expenses, while fiscal year 2011 adjusted operating income calculated as operating income of $304,656 plus a $15,800 non-cash fair value inventory charge and $12,314 of restructuring expenses.
plus a $163,511 impairment charge and $22,926 of restructuring expenses, both net of tax, while fiscal year 2011 adjusted net income calculated as net income of $193,857 plus an $11,278 non-cash fair value inventory charge and $8,720 of restructuring expenses, both net of tax.
expenditures plus excess tax benefit from stock-based compensation plus the forward starting interest rate swap settlement (in 2011 only).
share of $0.45 plus a $1.96 impairment charge and $0.27 of restructuring expenses, while fiscal year 2011 adjusted earnings per share calculated as earnings per share of $2.32 plus a $0.14 non-cash fair value inventory charge and $0.10 of restructuring expenses.
QUARTERLY STOCK PRICE FIRST SECOND THIRD FOURTH
2012 HIGH $43.15 $44.14 $43.96 $46.69 LOW 36.73 36.91 34.06 39.74 CLOSE 42.13 38.98 41.77 46.53
2011 HIGH $43.78 $47.50 $47.28 $38.36 LOW 38.02 41.90 30.09 29.29 CLOSE 43.65 45.85 31.16 37.11
Brand names shown in this report are registered trademarks of IDEX Corporation and/or its subsidiaries.
Des
ign:
par
agra
phs.
com

IDEX CORPORATION1925 WEST FIELD COURT, SUITE 200LAKE FOREST, ILLINOIS 60045 USA
WWW.IDEXCORP.COM
Paragraphs #91556
6 Page Cover Outside 2.19.2013
BLK PMS285 SILVER FOIL BLACK FOIL
ABOUT IDEX Headquartered in Lake Forest, IL, USA, IDEX was founded in 1987 and stands for Innovation, Diversity and Excellence. Our company trades under the symbol “IEX” on the New York Stock Exchange and Chicago Stock Exchange. We have operating facilities across five continents with 6,717 dedicated employees worldwide.
MARKETSIDEX is an applied solutions provider serving niche markets worldwide. Our served markets include process industry and infrastructure-related applications, life sciences, research, semi-conductor, security, defense and medical technologies, industrial and municipal fire and rescue, and equipment associated with the retail dispensing of architectural paints and coatings. From leak detection within water infrastructure to enabling the push towards personalized medicine, IDEX is a leader in creating enabling technology, and improving business prospects for a diverse customer set across the globe.
STRATEGY Our expertise is in products that facilitate customer specific solutions in attractive niche markets. We are focused on growth by reinvesting in new products and markets to drive organic growth, acquiring complementary technologies to our existing offerings, and building a culture of excellence to deliver exceptional performance. Our commitment is to provide lasting value to our customers, challenging and rewarding work environments for our employees, and profitable long term growth for our shareholders. A strong foothold in developed countries has allowed us to make great strides to expand our footprint in emerging markets, where we see tremendous potential for growth across all our segments.
FINANCIAL HIGHLIGHTS(DOLLARS IN THOUSANDS, EXCEPT PER SHARE AMOUNTS)
RESULTS OF OPERATIONS 2012 2011
Net sales $1,954,258 $1,838,451
Adjusted operating income* 359,210 332,770
Adjusted net income* 224,067 213,855
Adjusted free cash flow* 294,847 226,071
FINANCIAL POSITION 2012 2011
Total assets $2,785,390 $2,836,107
Total borrowings 786,576 808,810
Shareholders’ equity 1,464,998 1,513,135
PERFORMANCE MEASURES 2012 2011
Percent of net sales:
Adjusted operating income* 18.4% 18.1%
Adjusted net income* 11.5% 11.6 %
Return on average assets* 8.0% 8.2%
Net debt as a percent of capitalization 24.2% 27.7%
Return on average shareholders’ equity* 15.0% 14.8%
PER SHARE DATA 2012 2011
Adjusted net income (diluted)* $2.68 $2.56
Cash dividends declared 0.80 0.68
Shareholders’ equity 17.71 18.18
OTHER DATA 2012 2011
Employees at year end 6,717 6,814
Shareholders at year end 6,700 7,000
Diluted weighted average shares outstanding (in 000s) 83,641 83,543
YEARS ENDED DECEMBER 31
* Refer to Non-GAAP Disclosures within Stockholder Information
At a Glance
IDEX CORPORATION 2012 ANNUAL REPORT