Embed Size (px)
Citation preview

Infigen Energy
ASX Spotlight ConferenceSingapore & Hong Kong
21 & 23 October 2014

• Overview
• Australian Operations
• US Operations
• Corporate Structure & Global Facility
• Cash flow, FX & Balance Sheet
• Strategic Issues, Outlook and Priorities
• Questions
Presenter:Richard Farrell
For further information please contact:Richard Farrell, Group Manager, Investor Relations and Strategy+61 2 8031 [email protected]
3
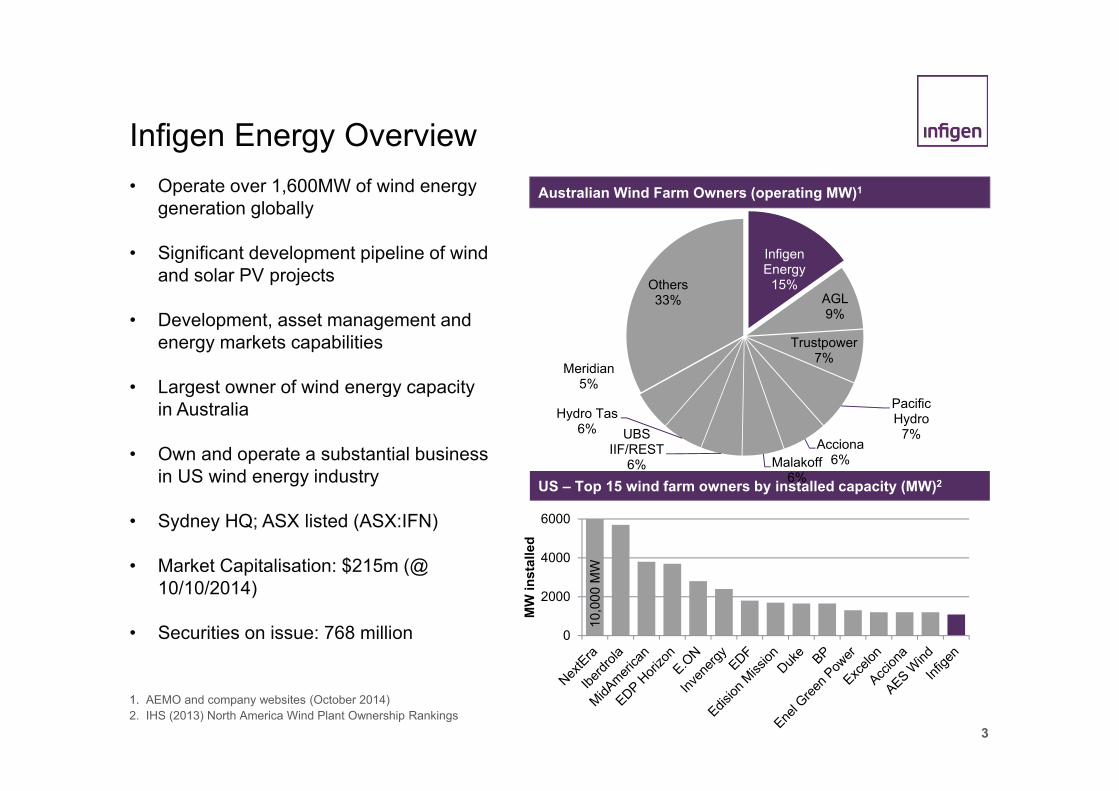
Infigen Energy Overview
US – Top 15 wind farm owners by installed capacity (MW)2
• Operate over 1,600MW of wind energy generation globally
• Significant development pipeline of wind and solar PV projects
• Development, asset management and energy markets capabilities
• Largest owner of wind energy capacity in Australia
• Own and operate a substantial business in US wind energy industry
• Sydney HQ; ASX listed (ASX:IFN)
• Market Capitalisation: $215m (@ 10/10/2014)
• Securities on issue: 768 million
Australian Wind Farm Owners (operating MW)1
1. AEMO and company websites (October 2014)2. IHS (2013) North America Wind Plant Ownership Rankings
10,0
00 M
W
0
2000
4000
6000M
W in
stal
led
Infigen Energy
15%AGL9%
Trustpower7%
Pacific Hydro
7%Acciona
6%Malakoff6%
UBS IIF/REST
6%
Hydro Tas6%
Meridian5%
Others33%
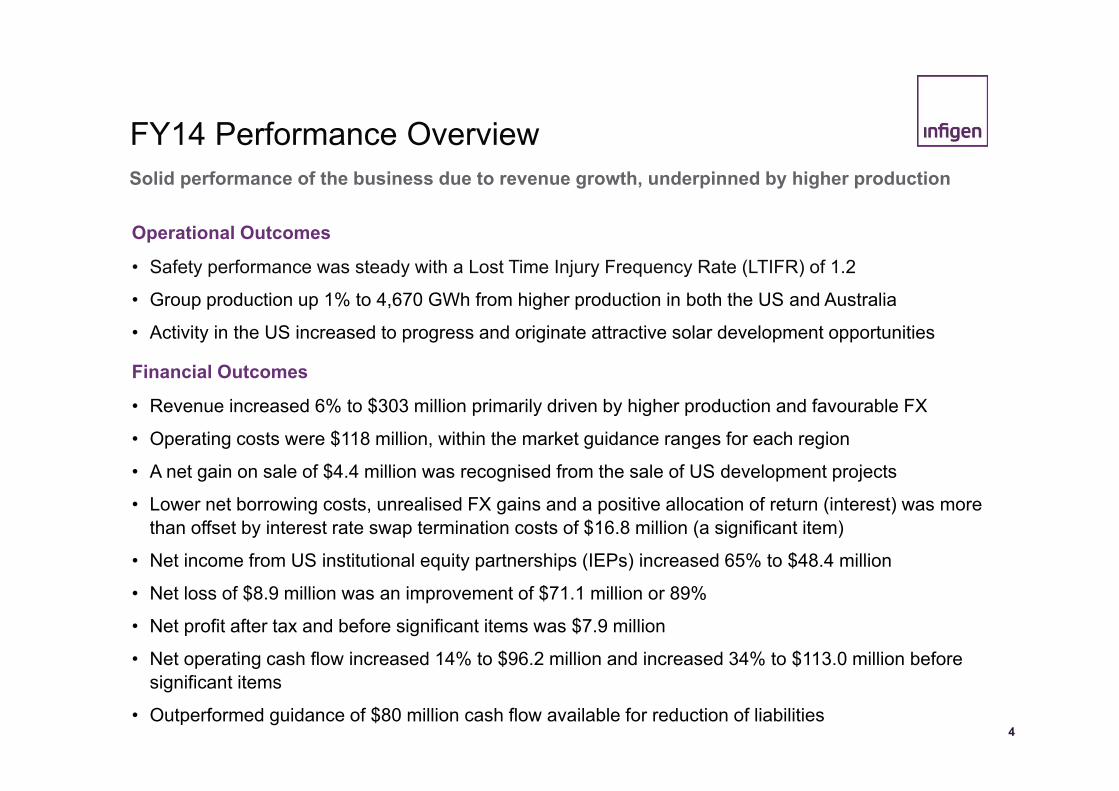
FY14 Performance Overview Solid performance of the business due to revenue growth, underpinned by higher production
4
Operational Outcomes
• Safety performance was steady with a Lost Time Injury Frequency Rate (LTIFR) of 1.2
• Group production up 1% to 4,670 GWh from higher production in both the US and Australia
• Activity in the US increased to progress and originate attractive solar development opportunities
Financial Outcomes
• Revenue increased 6% to $303 million primarily driven by higher production and favourable FX
• Operating costs were $118 million, within the market guidance ranges for each region
• A net gain on sale of $4.4 million was recognised from the sale of US development projects
• Lower net borrowing costs, unrealised FX gains and a positive allocation of return (interest) was more than offset by interest rate swap termination costs of $16.8 million (a significant item)
• Net income from US institutional equity partnerships (IEPs) increased 65% to $48.4 million
• Net loss of $8.9 million was an improvement of $71.1 million or 89%
• Net profit after tax and before significant items was $7.9 million
• Net operating cash flow increased 14% to $96.2 million and increased 34% to $113.0 million before significant items
• Outperformed guidance of $80 million cash flow available for reduction of liabilities

• Overview
• Australian Operations
• US Operations
• Corporate Structure & Global Facility
• Cash flow, FX & Balance Sheet
• Strategic Issues, Outlook and Priorities
• Questions

6
Location: New South Wales Status: Operational November 2009Installed Capacity: 140.7MW Turbine: 67 Suzlon 2.1MW S88
Location: Western AustraliaStatus: Operational January 2006Installed Capacity: 89.1MW Turbine: 54 NEG Micon NM82
Location: South AustraliaStatus: Operational March 2005Installed Capacity: 80.5MW Turbine: 46 Vestas V66
Location: South AustraliaStatus: Operational September 2008Installed Capacity: 159.0MW Turbine: 53 Vestas V90
Location: South AustraliaStatus: Operational June 2010Installed Capacity: 39.0MW Turbine: 13 Vestas V90
Location: New South WalesStatus: Operational October 2011Installed Capacity: 48.3MW Turbine: Suzlon 2.1MW S88
Australia's leading wind energy developer and operator Operating Australian Wind Assets
ALINTA
LAKE BONNEY 2
LAKE BONNEY 1
LAKE BONNEY 3
WOODLAWN
CAPITAL

Australian Development Pipeline
7
Wind Farm Location Capacity (MW) Planning Status Connection Status
Bodangora NSW 90-100 Approved AdvancedCapital 2 NSW 90-100 Approved AdvancedCherry Tree VIC 35-40 Approved Intermediate
Flyers Creek NSW 100-115 Approved Intermediate
Forsayth QLD 60-75 Approved IntermediateWalkaway 2&3* WA ~400 Approved IntermediateWoakwine SA ~450 Approved Intermediate
Total 1,230 –1,280
* Infigen has a 32% equity interest
Wind farm pipeline progressed and solar expertise enhanced through Capital East solar demo
Solar FarmLocation Capacity (MW) Planning Status Connection Status
Capital NSW 50 Approved AdvancedCloncurry QLD 6 Early EarlyManildra NSW 50 Approved Advanced
Total 207
Comments
• Stage 1 of the Capital East solar farm (137 kW DC) was registered and began exporting electricity in September 2013

Australian LRET Supply/DemandPolitical and industry rhetoric potentially foreshadows serious adverse changes to RET
8
Comments
• The recent review of the renewable energy target (RET) failed to make a case for reducing the RET • The review panel found that a reduced RET would freeze investment, increase electricity prices, increase Australian
taxpayer-funded cost of emissions reductions under the Coalition’s Direct Action policy, and boost existing coal fired generation profits
• The Panel’s recommendation to effectively terminate the scheme was inconsistent with the findings• The Government is now working with the ALP to find a ‘middle ground’ after the cabinet reportedly rejected the
Panel’s recommendations. The ALP has indicated that it supports the current legislated targets.• Under the existing target the LGC surplus will remain to 2017; with no new build the LGC market would be short by
2018 causing prices to trend towards the shortfall price • A bipartisan solution supported by the review findings will continue to deliver lower electricity prices to consumers
(4) (4)(5)
5
15
25
35
4520
01
2002
2003
2004
2005
2006
2007
2008
2009
2010
2011
2012
2013
2014
2015
2016
2017
2018
2019
2020
2021
2022
2023
2024
2025
2026
2027
2028
2029
2030
TWh
Baseline generators LRET generators Committed generatorsLegislated Target to (41 TWh) Reduced target (to 25.5TWh) Surplus/deficitReduced target surplus/deficit
Target excludes voluntary surrender LGCs
Source: Green Energy Markets (01/07/2014)
Surplus resulting from generous State residential solar incentives
There will be a supply deficit if regulatory certainty is not restored

SA Forward Electricity and LGC prices
Australian Electricity and LGC Market Prices
9
Improved LGC prices needed to preserve value of existing investments and stimulate new build
Source: D-Cypha, Mercari 15 October 2014
Comments • SA electricity futures reflect the expectation of higher gas prices from 2016 as east coast LNG
exports ramp up • The National Electricity Market is oversupplied with old coal generation and electricity demand
forecasts remain highly uncertain • At current electricity prices, gas fired generators will struggle to recover fuel costs and be under
pressure to exit• LGC forward prices remain at depressed levels as a result of acute regulatory uncertainty• Australian market PPA tenors, when available, are shorter than expected asset life. Investments
rely on LGC revenues from existing legislated targets to sustain value
Shortfall to new build economics caused by regulatory uncertainty
Modelled LGC future prices (2014$/LGC)
Source : ACIL Allen for 2014 RET review
36.8 37.7 39.2
43.9 46.2 46.8
- 20.0 40.0 60.0 80.0
100.0
2015 2016 2017
$/M
Wh
bund
led
LGC SA Base New build shortfall

Operational Performance: Australia
Year ended 30 June 2014 2013 F/(A)%
Operating capacity (MW) 557 557 -
Production (GWh) 1,572 1,516 4
Revenue (A$M) 145.4 146.3 (1)
Operating costs (A$M) 36.1 36.3 1
Operating EBITDA (A$M) 109.3 110.0 (1)
Operating EBITDA margin 75.2% 75.2% -
Average price (A$/MWh) 92.5 96.6 (4)
Operating costs (A$/MWh) 23.0 23.9 4
10
Stable operating EBITDA driven by higher production from improved wind conditions
110.0
10.5 (8.4) (3.0) 0.8 (0.6)
109.3
FY13OperatingEBITDA
Production Price Compensated& OtherRevenue
OperatingCosts
VariableProduction
Costs
FY14OperatingEBITDA
Operating EBITDA (A$M)
Comments • Production increase reflected better wind conditions at
all wind farms except Alinta (WA) and higher turbine availability
• Revenue decrease reflected lower LGC prices, lower electricity prices and higher compensated revenue in prior year, mostly offset by higher production
• Operating costs decreased due to an organisational restructure and cost saving initiatives undertaken in February 2013 offset by incentive payments to O&M service providers for exceeding availability and production targets
• Marginally lower operating EBITDA due to lower revenue, which was mostly attributable to a subdued LGC market
O&M incentive payments
Turbine warranty and maintenance profile
0%
20%
40%
60%
80%
100%
FY14 FY15 FY16 FY17 FY18
Opportunity tocontractservices
3rd partyservices -Vendor partsexposureUnder originalwarranty

• Overview
• Australian Operations
• US Operations
• Corporate Structure & Global Facility
• Cash flow, FX & Balance Sheet
• Strategic Issues, Outlook and Priorities
• Questions
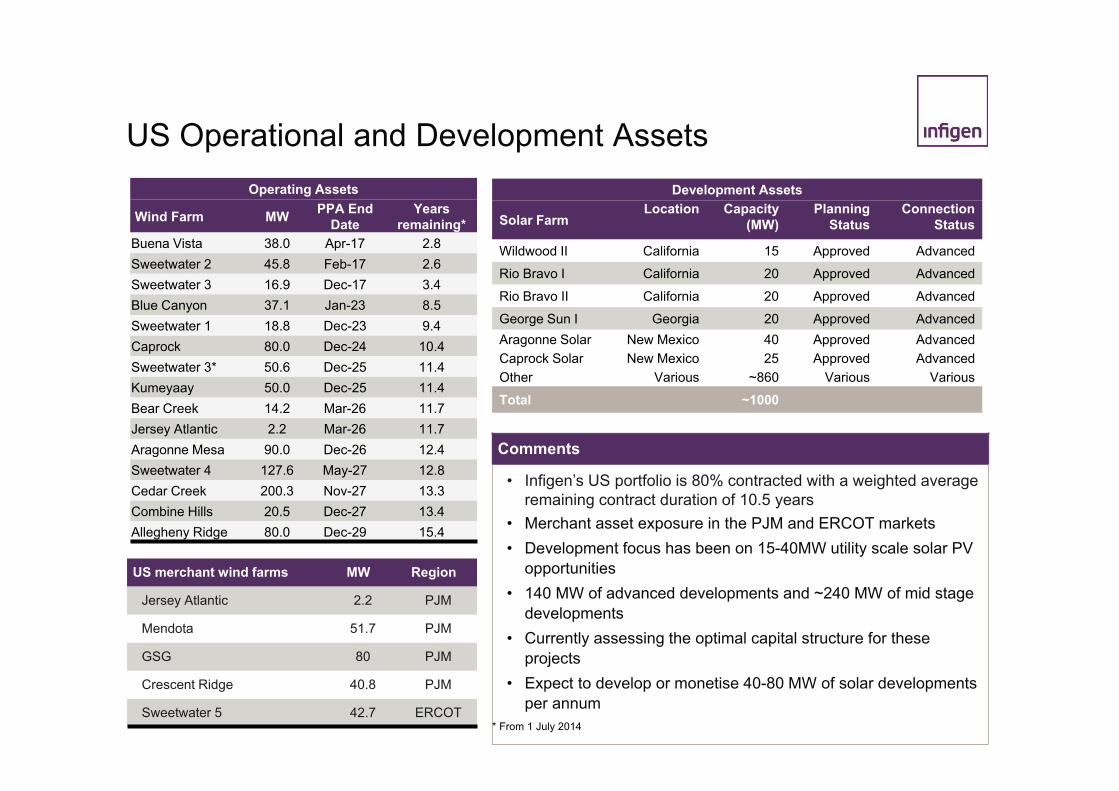
US Operational and Development Assets
12
US merchant wind farms MW Region
Jersey Atlantic 2.2 PJM
Mendota 51.7 PJM
GSG 80 PJM
Crescent Ridge 40.8 PJM
Sweetwater 5 42.7 ERCOT
Operating Assets
Wind Farm MW PPA End Date
Years remaining*
Buena Vista 38.0 Apr-17 2.8Sweetwater 2 45.8 Feb-17 2.6Sweetwater 3 16.9 Dec-17 3.4Blue Canyon 37.1 Jan-23 8.5Sweetwater 1 18.8 Dec-23 9.4Caprock 80.0 Dec-24 10.4Sweetwater 3* 50.6 Dec-25 11.4Kumeyaay 50.0 Dec-25 11.4Bear Creek 14.2 Mar-26 11.7Jersey Atlantic 2.2 Mar-26 11.7Aragonne Mesa 90.0 Dec-26 12.4Sweetwater 4 127.6 May-27 12.8Cedar Creek 200.3 Nov-27 13.3Combine Hills 20.5 Dec-27 13.4Allegheny Ridge 80.0 Dec-29 15.4
Development Assets
Solar FarmLocation Capacity
(MW)Planning
StatusConnection
Status
Wildwood II California 15 Approved AdvancedRio Bravo I California 20 Approved AdvancedRio Bravo II California 20 Approved AdvancedGeorge Sun I Georgia 20 Approved AdvancedAragonne Solar New Mexico 40 Approved AdvancedCaprock Solar New Mexico 25 Approved AdvancedOther Various ~860 Various VariousTotal ~1000
Comments
• Infigen’s US portfolio is 80% contracted with a weighted average remaining contract duration of 10.5 years
• Merchant asset exposure in the PJM and ERCOT markets• Development focus has been on 15-40MW utility scale solar PV
opportunities• 140 MW of advanced developments and ~240 MW of mid stage
developments• Currently assessing the optimal capital structure for these
projects• Expect to develop or monetise 40-80 MW of solar developments
per annum* From 1 July 2014
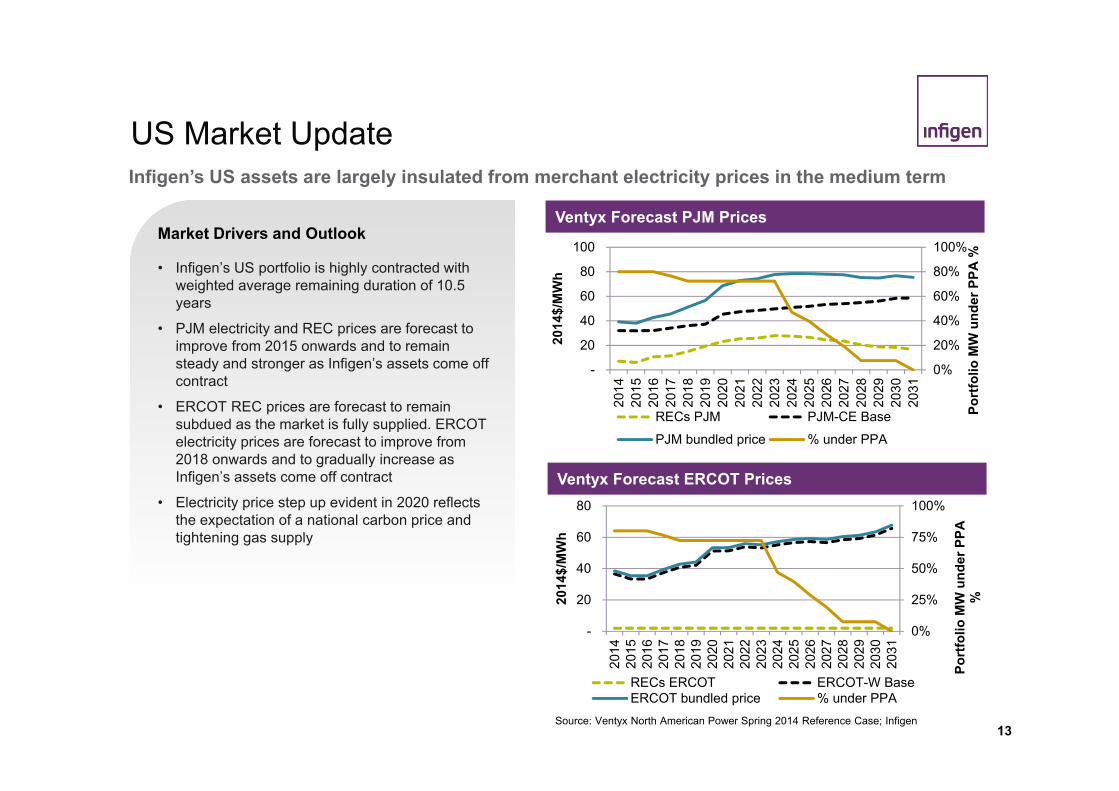
US Market UpdateInfigen’s US assets are largely insulated from merchant electricity prices in the medium term
13
Ventyx Forecast PJM Prices
Source: Ventyx North American Power Spring 2014 Reference Case; Infigen
Ventyx Forecast ERCOT Prices
0%
20%
40%
60%
80%
100%
-
20
40
60
80
100
2014
2015
2016
2017
2018
2019
2020
2021
2022
2023
2024
2025
2026
2027
2028
2029
2030
2031
Port
folio
MW
und
er P
PA %
2014
$/M
Wh
RECs PJM PJM-CE BasePJM bundled price % under PPA
0%
25%
50%
75%
100%
-
20
40
60
80
2014
2015
2016
2017
2018
2019
2020
2021
2022
2023
2024
2025
2026
2027
2028
2029
2030
2031
Port
folio
MW
und
er P
PA
%2014
$/M
Wh
RECs ERCOT ERCOT-W BaseERCOT bundled price % under PPA
Market Drivers and Outlook
• Infigen’s US portfolio is highly contracted with weighted average remaining duration of 10.5 years
• PJM electricity and REC prices are forecast to improve from 2015 onwards and to remain steady and stronger as Infigen’s assets come off contract
• ERCOT REC prices are forecast to remain subdued as the market is fully supplied. ERCOT electricity prices are forecast to improve from 2018 onwards and to gradually increase as Infigen’s assets come off contract
• Electricity price step up evident in 2020 reflects the expectation of a national carbon price and tightening gas supply

14
US Market UpdateFederal action on climate change is gaining traction with strong continuing state level support
States with Renewable Portfolio Standards
States with Tax Credits for Renewables
Regulatory update
• Investment Tax Credit for solar development in place until December 2016
• Strong support for renewable incentives at the State level
• In February 2014 the EPA released a rule proposal that seeks to reduce US carbon emissions by 30% of 2005 levels by 2030
• States have until 30 June 2016 to come up with their own plan on how to implement the rule to reduce average emissions intensity of their generation
• The primary mechanism will be tough emission limits on coal fired generation thereby making lower carbon emitting technologies more competitive
• Secretary of State Kerry pursuing a campaign for global action on emissions reductions
• US and China committed to collaborate through enhanced policy dialogue, including the sharing of information regarding their respective post-2020 plans to limit greenhouse gas emissions
• US policies to address carbon emissions aligned with most countries

Continues for life of WF
USA Tax Equity Structure
• Class A (US tax payer) and Class B (typically owner-operator) members share economic benefits over the life of the wind farm. Class A capital investment has a contracted target return.
• Class B gets all cash in stage 1 to repay initial investment while Class A gets tax losses and production tax credits (PTCs) as cash equivalents to repay initial investment
• Class A continues to receive cash equivalent tax benefits and operating cash through stage 2 until capital investment has been repaid and target return achieved
• Class A and Class B share operating cash during stage 3 with Class B members typically having an option to acquire the Class A minority interest at an agreed market value
15
Class A PTCs
Due to the available tax incentives most US wind farms have a tax equity structure

16
Operational Performance: US
Year ended 30 June 2014 2013 F/(A)%
Operating capacity (MW) 1,089 1,089 -
Production (GWh) 3,098 3,089 -
Revenue (US$M) 144.9 142.9 1
Operating costs (US$M) 74.9 74.8 -
Operating EBITDA (US$M) 70.0 68.1 3
Operating EBITDA Margin 48.3% 47.7% 0.6 ppts
Average price (US$/MWh) 45.5 45.0 1
Operating costs (US$/MWh) 24.2 24.2 -
16ppts = percentage point change
Higher production from better wind conditions partially offset by higher operating costs
Comments
• Production increase reflected better wind conditions and steady site availability, partially offset by lower turbine availability at GSG and Mendota (maintenance transitioned to Gamesa)
• Revenue increase reflects higher production and REC revenue and higher merchant electricity prices offset by lower average electricity prices and lower compensated revenue
• US development activity has increased with attractive opportunities identified and progressed
• Investment in Class A interests has improved the cash flow profile of the business
• Profitable sale of Wildwood and Pumpjack solar development assets
68.1
1.90.7 (0.6) 1.3 (0.4) (1.0)
70.0
FY13OperatingEBITDA
Production Price Compensatedrevenue &
other
Operatingcosts
O&M incentivecosts
Class Atransaction
costs
FY14OperatingEBITDA
Operating EBITDA (US$M)
O&M incentive payments
Turbine warranty and maintenance profile
0%
20%
40%
60%
80%
100%
FY15 FY16 FY17 FY18 FY19
Opportunity to contractservices
3rd party services -Infigen parts exposure
IAM services - Infigenparts exposure
3rd party services -Vendor parts exposure

• Overview
• Australian Operations
• US Operations
• Corporate Structure & Global Facility
• Cash flow, FX & Balance Sheet
• Strategic Issues, Outlook and Priorities
• Questions

Corporate Structure & Global Facility
18
Infigen Energy Holdings Pty
Limited
Operating Wind Farms Woodlawn Wind Farm
Infigen Energy Limited
Infigen Energy Trust
Infigen Energy (Bermuda) Limited
Infigen Energy RE
Limited
Development Assets
Infigen Energy Securityholders
sharesunits shares
Responsible
Stapled Securities
Entities and assets within the Global Facility borrower group. The wholly-owned subsidiaries of Infigen that are entitled to returns, including cash distributions, from the US institutional equity partnerships (IEPs) are included within the Global Facility borrower group, but the IEPs, which are not wholly owned, are not members of that group.
Entity
Global Facility
Repayment Terms Fully amortising facility; multi-currency; maturity 2022From FY11, cash sweep of cash flow of Global Facility borrower groupFinancial Covenant – leverage ratio covenantFrom FY11 Net debt / EBITDA¹ (measured at 30 June and 31 Dec. EBITDA is for the 12 month prior to the measurement date):Through 30 June 2016:< 8.5 times 31 December 2016 to 30 June 2019: < 6.0 times 31 December 2019 to 30 June 2022: < 3.0 times Review EventsWould occur if IEL shares were removed from ASX or were unstapled from IET units/IEBL shares
1 The Global Facility leverage ratio covenant includes US cash distributions to Infigen instead of US EBITDA
Financial Assets*
* Through its subsidiaries, Infigen Energy Holdings Pty Limited (IEH) has provided funding to certain wholly-owned subsidiaries of IEL which in turn acquired Class A interests in relation to nine of IELs US operating wind farms. Like IEH, those subsidiaries of IEL are owned by a member of the Global Facility borrower group but are ‘Excluded Companies’ for the purpose of the Global Facility

• Overview
• Australian Operations
• US Operations
• Corporate Structure & Global Facility
• Cash flow, FX & Balance Sheet
• Strategic Issues, Outlook and Priorities
• Questions

Cash Flow – Cash Movement Lower cash balance largely attributable to investment in US Class A interests
20
Comments • 30 June 2014 closing cash balance included $61m of ‘Excluded Company’ cash• Excluded Company cash movements included equity investment in Class A interests, operating and capital expenditure related
to development in the US and Australia, income from the investment in Class A interests, the proceeds from the sale of US solar PV development projects and the net income from Woodlawn after refinancing costs
• Capex included Gamesa fleet transitional make good related items, balance of plant equipment and development expenditure
124.0
96.2
62.2
8.3 51.7(93.0)
(41.4)
(100.0)(15.7) (9.4)
82.9
30 June 2013 Net operatingcash flow
Union BankFacility
drawdown
Proceedsfrom sale ofUS assets
NewWoodlawn
Facilitydrawdown
Debtrepayment
Distributionsto Class Amembers
Acquisitionof Class Ainterests
Capex FX andothers
30 June 2014
(A$M)Sources Uses
Operating Cash Flow (OCF) 96.2mSignificant items 16.8mOCF before significant items 113.0m
Old Woodlawn Facility 54mGlobal Facility 35mUnion Bank Facility 4m

Impact of FX
21
Profit and Loss (A$M)
Balance Sheet (A$M)
FX movements resulted in decreased assets in Australian dollar terms
(8.4)(9.0)
(3.0)
16.0 3.7(0.8)
FX onoperatingexpenses
FX ondepreciation
FX oninterest
FX onrevenue
FX on IEP& other
financingcosts
Net FX lossbefore tax
(22.2)
(0.3) (1.1) 2.114.8
(6.7)
FX on PPE,goodwill
andintangibles
FX on cash FX others FX onborrowings
FX on IEP NetunrealisedFX costs
FX on cash
Comments
• Profit and Loss: FX had an adverse effect on expenses partially offset by a positive effect on revenue, net IEP income and other financing costs
• Balance Sheet: Total liabilities in AUD terms have benefitted from a stronger AUD at 30 June 2014 compared to 30 June 2013
Average yearly rate to: AUD:USD 30 June 2014 = 0.9179, 30 June 2013 = 1.0242 AUD:EUR 30 June 2014 = 0.6764, 30 June 2013 = 0.7941
Closing rate: AUD:USD 30 June 2014 = 0.9420, 30 June 2013 = 0.9275 AUD:EUR 30 June 2014 = 0.6906, 30 June 2013 = 0.7095

Balance Sheet
Debt Ratios calculated on an IFN economic interest basis
Debt service and leverage metrics in the above table include the Global Facility, the Woodlawn project finance facility and the Union Bank facility and differ from the Global Facilities covenant metrics
26.7%
Debt Ratios 30 June 2014 30 June 2013
Net Debt / EBITDA 5.8x 5.9x
EBITDA / Interest 2.4x 2.3x
Net Debt / (Net Debt + Net Assets) 66.9% 65.9%
22
A$M as at 30 June 2014 30 June 2013 Cash 82.9 124.0Receivables, inventory & prepayments 64.5 62.5PPE, goodwill & intangibles 2,421.3 2,571.7Investments in financial assets 86.4 -Deferred tax 50.4 50.5Total Assets 2,705.5 2,808.7
Payables & provisions 60.4 62.2Borrowings 1,076.5 1,060.0Tax equity (US) 515.9 588.7Deferred revenue (US) 428.3 459.1Interest rate derivatives 132.3 154.7Total Liabilities 2,213.4 2,324.7
Net Assets 492.1 484.0
Interest rate derivative liability lower due to swap terminations and higher forward interest rates
Comments
• Borrowings increased $16.5 million largely due to the new Union Bank Facility offset by Global Facility and Woodlawn Facilityamortisation, and FX translation
• Interest rate swap terminations and movement in forward interest rates resulted in a $22.4 million reduction to the interest rate derivative liability
• Global Facility leverage ratio covenant satisfied for the period ended 30 June 2014

• Overview
• Australian Operations
• US Operations
• Corporate Structure & Global Facility
• Cash flow, FX & Balance Sheet
• Strategic Issues, Outlook and Priorities
• Questions

US: Acquisition of Class A interests
24
Comments
• Infigen acquired Class A interests in nine of its US wind farms for ~US$95m including upfront financing costs• Class A interests in seven of the wind farms were acquired by a new investment vehicle that is jointly owned by
Infigen and the seller of the Class A tax equity interests. The investment vehicle apportions the vast majority of the cash flows attributable to those interests to Infigen
• Infigen also purchased 100% of the seller’s Class A interests in the Sweetwater 1 and Blue Canyon wind farms. Completion of this aspect of the transaction occurred in early January 2014
Features and benefits of the transaction included:• Infigen will receive cash flows from these wind farms during a period when those cash flows would otherwise have
been allocated to the Class A tax equity investor• Infigen’s available cash has been applied to a higher return investment in a low interest rate environment and the
investment has a relatively short payback period• Infigen is familiar with and already manages the associated underlying risks in these wind farms• The underlying assets are highly contracted from a revenue and operating cost perspective through long term power
purchase agreements (PPAs) and post-warranty maintenance agreements
Class A cash flows acquired by Infigen via transactionTax equity structure illustration
Acquisition offers attractive returns, has a short payback period and is strategically advantageous

Outlook
25
Production
• US: improved availability is expected across the Gamesa fleet • Australia: steady
Prices
• US: average prices expected to be only slightly higher than FY14 • Australia: average portfolio bundled prices expected to be approximately
10% lower than FY14 following repeal of the carbon price. Merchant LGC prices remain highly uncertain
Operating Costs
• US: expected to be US$76-$78 million. FY14 - US$74.9 million• Australia: expected to be A$36.5-$38 million. FY14 - A$36.1million• Lightning strike insurance excess costs and performance bonus
payments to O&M service providers are excluded from guidance
Cash Flow
• Cash generated to repay Global Facility borrowings and reduce US Class A liabilities is expected to be approximately A$90 million, subject to currently forecast merchant electricity and LGC prices being achieved
Australian outlook highly uncertain until RET future is resolved

Questions

Appendix

28
Infigen Energy Portfolio Summary

Balance Sheet by Country
29
A$M 30-Jun-14
IFN Statutory Interest
Add: US Equity
Accounted Investments
Less US Minority Interest
30-Jun-14 IFN
Economic Interest
Australia United States
Cash 80.7 2.8 (0.6) 82.9 69.5 13.5Receivables 30.0 5.5 (1.4) 34.1 24.8 9.3Inventory 16.2 1.3 (0.3) 17.2 12.9 4.3Prepayments 12.2 1.2 (0.1) 13.2 6.5 6.8PPE 1,895.4 435.6 (149.8) 2,181.2 875.5 1,305.6Goodwill & Intangibles 257.1 (3.5) (13.5) 240.1 124.4 115.7Investments in financial assets & other assets 88.1 (1.0) (0.7) 86.4 2.6 83.8
Investment in associates & JVs 96.3 (96.3) - - - -Deferred Tax Assets 50.5 - (0.1) 50.4 50.4 -Total Assets 2,526.4 345.5 (166.5) 2,705.5 1,166.5 1,539.0
Payables 32.4 2.8 (2.4) 32.8 7.4 25.3Provisions 22.0 7.5 (1.9) 27.6 10.9 16.7Borrowings 1,075.0 1.4 - 1,076.5 693.6 382.9Tax Equity (US) 439.4 190.0 (113.5) 515.9 - 515.9Deferred benefits (US) 333.3 143.7 (48.7) 428.3 - 428.3Derivative Liabilities 132.3 - - 132.3 103.7 28.6Total Liabilities 2,034.4 345.5 (166.5) 2,213.4 815.6 1,397.8
Net Assets 492.1 - - 492.1 350.9 141.2
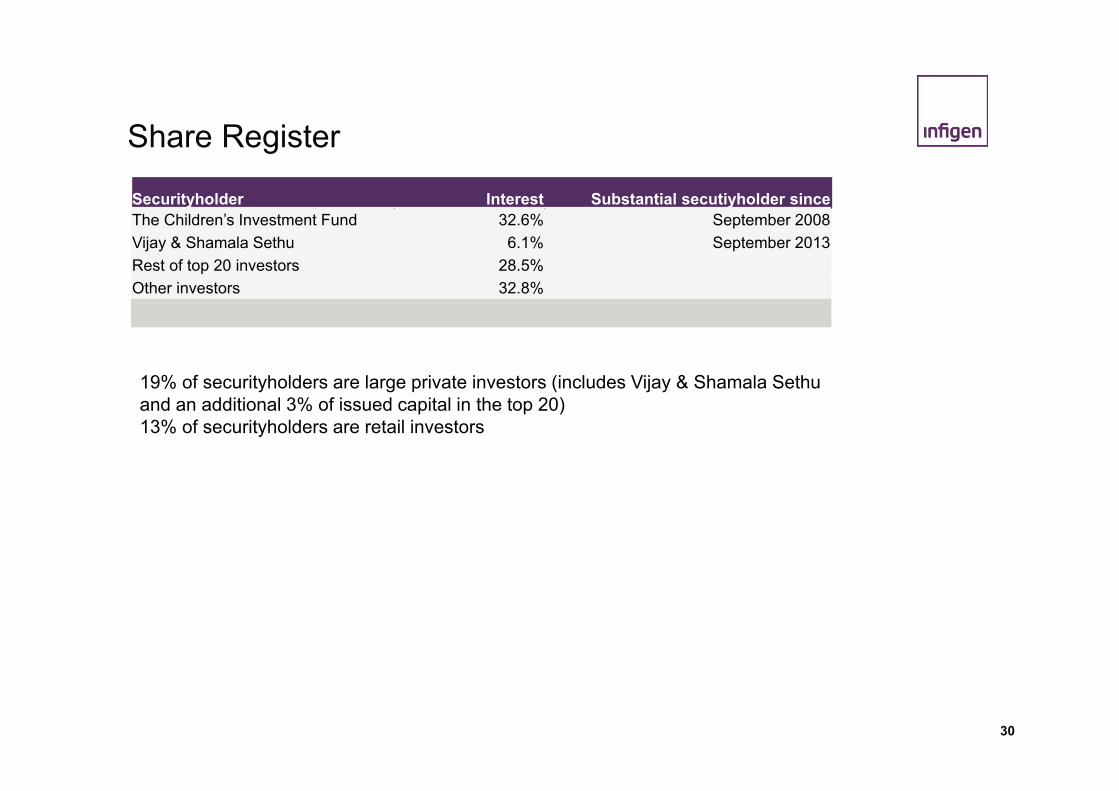
Share Register
30
Securityholder Interest Substantial secutiyholder sinceThe Children’s Investment Fund 32.6% September 2008Vijay & Shamala Sethu 6.1% September 2013Rest of top 20 investors 28.5%Other investors 32.8%
19% of securityholders are large private investors (includes Vijay & Shamala Sethuand an additional 3% of issued capital in the top 20)13% of securityholders are retail investors

Disclaimer
This publication is issued by Infigen Energy Limited (“IEL”), Infigen Energy (Bermuda) Limited (“IEBL”) and Infigen Energy Trust (“IET”), with Infigen Energy RE Limited (“IERL”) as responsible entity of IET (collectively “Infigen”). Infigen and its related entities, directors, officers and employees (collectively “Infigen Entities”) do not accept, and expressly disclaim, any liability whatsoever (including for negligence) for any loss howsoever arising from any use of this publication or its contents. This publication is not intended to constitute legal, tax or accounting advice or opinion. No representation or warranty, expressed or implied, is made as to the accuracy, completeness or thoroughness of the content of the information. The recipient should consult with its own legal, tax or accounting advisers as to the accuracy and application of the information contained herein and should conduct its own due diligence and other enquiries in relation to such information. The information in this presentation has not been independently verified by the Infigen Entities. The Infigen Entities disclaim any responsibility for any errors or omissions in such information, including the financial calculations, projections and forecasts. No representation or warranty is made by or on behalf of the Infigen Entities that any projection, forecast, calculation, forward-looking statement, assumption or estimate contained in this presentation should or will be achieved. None of the Infigen Entities guarantee the performance of Infigen, the repayment of capital or a particular rate of return on Infigen Stapled Securities. IEL and IEBL are not licensed to provide financial product advice. This publication is for general information only and does not constitute financial product advice, including personal financial product advice, or an offer, invitation or recommendation in respect of securities, by IEL, IEBL or any other Infigen Entities. Please note that, in providing this presentation, the Infigen Entities have not considered the objectives, financial position or needs of the recipient. The recipient should obtain and rely on its own professional advice from its tax, legal, accounting and other professional advisers in respect of the recipient’s objectives, financial position or needs. This presentation does not carry any right of publication. Neither this presentation nor any of its contents may be reproduced or used for any other purpose without the prior written consent of the Infigen Entities.
IMPORTANT NOTICENothing in this presentation should be construed as either an offer to sell or a solicitation of an offer to buy Infigen securities in the United States or any other jurisdiction.Securities may not be offered or sold in the United States or to, or for the account or benefit of, US persons (as such term is defined in Regulation S under the US Securities Act of 1933) unless they are registered under the Securities Act or exempt from registration.
31