Embed Size (px)
Citation preview

Manalto Limited ABN 88 098 640 352
Suite 1, Level 6, 50 Queen Street, Melbourne VIC 3000 Australia
Postal Address: PO Box 16109, Collins Street West VIC 8007 Australia
Telephone: +61 (0)3 8692 9048 Facsimile: +61 (0)3 8692 9040
ASX ANNOUNCEMENT | MANALTO LIMITED ANNUAL REPORT FOR THE PERIOD ENDING 30 JUNE 2016 MELBOURNE – 29 September 2016 - Manalto Limited (ASX: MTL) (Manalto or the Company) is pleased to provide shareholders with its Annual Report for the period ending 30 June 2016.
ENDS About Manalto Limited Manalto Limited (MTL.ASX) is a U.S. based global provider of cloud social media management solutions. Manalto’s proprietary software delivers capability for the streamlined management of social media at scale – including controls to support organisational brand management, reputational risk management and efficiency in managing users, community engagement and analytics. An enterprise can centrally publish content and update brand assets across hundreds of its organisation’s social media pages spanning multiple platforms – in just one click. Manalto offers a direct-to-market Enterprise Solution and a Business Application for Channel Partners to offer to SME’s – ‘Sóshlr’. Manalto is headquartered in Washington, D.C. with offices in the Netherlands, Australia and South Africa, and supports channel partners and customers globally. For further information, please manalto.com For more information on Sóshlr soshlr.com
For
per
sona
l use
onl
y
1
MTL.ASX
Manalto Limited ABN 88 098 640 352 Suite 1, Level 6, 50 Queen Street, Melbourne VIC 3000 Australia Postal Address: PO Box 16109, Collins Street West VIC 8007 Australia Telephone: +61 (0) 3 8692 9048 Facsimile: +61 (0) 3 8692 9040
Manalto Limited Annual Report 2016
For
per
sona
l use
onl
y

2
CONTENTS
ABOUT MANALTO ................................................................................................................................... 3
CHAIRMAN AND CEO’S REPORT .......................................................................................................... 4
OPERATIONS REVIEW ........................................................................................................................... 8
FINANCIAL OVERVIEW ......................................................................................................................... 11
DIRECTOR AND REMUNERATION REPORT....................................................................................... 12
CORPORATE GOVERANCE STATEMENT .......................................................................................... 21
CONSOLIDATED STATEMENT OF PROFIT OR LOSS AND OTHER COMPREHENSIVE INCOME . 26
CONSOLIDATED STATEMENT OF FINANCIAL POSITION ................................................................ 27
CONSOLIDATED STATEMENT OF CHANGES IN EQUITY ................................................................. 28
CONSOLIDATED STATEMENT OF CASH FLOWS.............................................................................. 29
NOTES TO THE FINANCIAL STATEMENTS ........................................................................................ 30
DIRECTOR DECLARATION .................................................................................................................. 53
AUDITOR'S INDEPENDENCE DECLARATION .................................................................................... 54
INDEPENDENT AUDITOR'S REPORT .................................................................................................. 55
ASX OTHER REQUIRED INFORMATION ............................................................................................. 58
CORPORATE DIRECTORY ................................................................................................................... 61
For
per
sona
l use
onl
y

3
About Manalto Limited Manalto Limited (MTL.ASX) is a U.S. based global provider of cloud social media management solutions. Manalto’s proprietary software delivers capability for the streamlined management of social media at scale – including controls to support organisational brand management, reputational risk management and efficiency in managing users, community engagement and analytics. An enterprise can centrally publish content and update brand assets across hundreds of its organisation’s social media pages spanning multiple platforms – in just one click. Manalto has two products, which stem from its base technology platform: o Enterprise Solution for large disparate businesses and government o Sóshlr - a small-to-medium sized enterprise (SME) packaged and provisioned for resale by cloud based
resellers.
Today the Company is focused on two key distribution channels: third party distribution via cloud application platforms; and direct sales. Manalto is headquartered in Washington, D.C. with offices in the Netherlands, Australia and South Africa, and supports channel partners and customers globally. For further information, please visit www.manalto.com, www.soshlr.com
For
per
sona
l use
onl
y
4
Chairman and CEO Report
HIGHLIGHTS
- Commenced the first key integration of Sóshlr into Microsoft Office 365.
o Microsoft Office 365 is the largest selling cloud business application with 60 million monthly active Office 365 commercial customers, 50,000 SME’s added to Office 365 each month and more than 400 million active users on Outlook.com
- Integrated and launched Sóshlr via leading cloud platform providers AppDirect, Plesk, Ingram Micro and WHMCS
o AppDirect powers the largest network of cloud service marketplaces, reaching approximately 30 million small businesses worldwide via partners such as Telstra, Globe Telecom, Comcast, Deutsche Telekom.
o Plesk is a recognised global leader in web hosting Cloud Market Place with a global network of 2500+ resellers - hosting companies, and an estimated addressable market of 8 million SME’s.
o Ingram Micro, Inc. (NYSE: IM), U.S. global provider of cloud, mobility, supply chain services and technology solutions with a network of more than 200,000 reseller customers.
o WHMCS is a global cloud marketplace with more than 10,000 partners.
- Commenced commercialisation with the following resellers via their online cloud app marketplaces
o Telstra
o Globe Telecom
o Blacknight
o ReadySpace
o Dnet
o LuxCloud’s Suenos marketplace
- Completed acquisition of Hearis, an Australian-based Enterprise Social Media Management platform, making Manalto a major player in the Australian marketplace.
- Relocated technology engineering division and established customer support centre in Cape Town, South Africa to tap into a wealth of available resources, to increase capacity and to drive cost efficiencies.
- Expanded customer presence and operations to Europe, Asia and South Africa.
For
per
sona
l use
onl
y

5
Chairman and CEO Report
LETTER TO SHAREHOLDERS Dear Manalto Limited Shareholders, On behalf of the Board of Manalto Limited (MTL.ASX) (Manalto or The Company), I would like to thank you for your support of Manalto throughout the year. The Company has made significant strides during FY2016 to further establish its market position with the distribution and commercialisation of both of its products - Sóshlr and the Enterprise Solution. The increasing adoption of cloud-based applications by businesses, in particular – small and medium sized enterprises (SME’s), together with the increasing business uptake of social media, remain as the two most significant global drivers that continue to expand Manalto’s addressable market and provide enormous growth opportunity for the Company. To surmise our position today, the scalability of the core Manalto technology remains a key differentiator in the market. Both products solve an increasing problem for businesses in how they manage their expanding social media presence across multiple social media platforms - by providing a highly scalable cloud-based technology solution. Manalto is in a far stronger position, having strategically pursued and secured a number of major global distribution agreements since the listing on the ASX and the Q3 FY2015 release of its Sóshlr product. It has established a solid distribution base from which to build upon, positioning the Company towards its goal of being a leading cloud business application provider – this foundation is critical to growth in revenue over the forthcoming years. During FY 2016, the Company positioned its products at the forefront of the rapid shift by businesses to purchase software and other services via the cloud. We firstly secured product certification for Sóshlr, required by the major cloud marketplace providers and then moved to sign distribution agreements with a number of large and key hosting companies, Telcos and other third party resellers across the globe for both products. The Company also commenced the development of an API for its Enterprise Solution. Through steadfast focus during the year, the Company has achieved early success to secure both certification and a number of agreements with major cloud marketplace providers. The Company is well positioned to leverage its first mover advantage, as part of its vision to become a globally recognised, and the leading social media platform, being sold via the Cloud Marketplaces of hosting companies, Telcos and other third party reseller to small, medium and large enterprises. Today, the Company’s Sóshlr product is the only social media management solution that is currently:
- Both certified and available via leading global cloud marketplaces, Odin (integrated FY2015) and AppDirect, Plesk and WHMCS, all integrated during the year.
o AppDirect powers the largest network of cloud service marketplaces, reaching approximately 30 million small businesses worldwide via partners such as Globe Telecom, Comcast, Deutsche Telekom and Telstra. Partnering with AppDirect provides Manalto with a tremendous scale of distribution for the Sóshlr product.
o Plesk is a recognised global leader in web hosting with an established partner base and network of customers and is selling Sóshlr via its Cloud Market Place to an estimated addressable market of 8 million SME’s.
o WHMCS is a global cloud marketplace with more than 10,000 partners and now offers Sóshlr.
- Offered by major Telcos, Telstra and Globe Telecom, a large Philippine based telecommunications service provider.
For
per
sona
l use
onl
y
6
- Available via a growing number of smaller-scale hosting companies such as Blacknight, Dnet, Suenos and ReadySpace.
- Being integrated into Microsoft Office 365 with plans for the integrated product to be available via the MS Cloud Office Store. Microsoft Office 365 is the largest selling cloud business application with 60 million monthly active Office 365 commercial customers, 50,000 SME’s added to Office 365 each month and more than 400 million active users on Outlook.com. Sóshlr will be the first social media solution available for sale with Microsoft Office 365 applications. Manalto also plans to integrate its Enterprise Solution into Microsoft Office 365.
- Being integrated into Ingram Micro, Inc. (Ingram) which has a network of more than 200,000 reseller customers and is a global leader in the technology industry’s shift to cloud solutions. Ingram represents a significant strategic win for Manalto’s channel growth strategy and will see both Manalto’s Enterprise Solution and Sóshlr made available via the Ingram Micro Cloud Marketplace.
The opportunity to yield revenue growth from these initial major partnerships is what we have been positioning ourselves for. Collectively, they represent a significant estimated addressable market through which the Company can achieve product reach and sustainable growth. There will be a period of time between the integration and the flow of revenue, during which, Go-to-Market initiatives and the development of brand recognition among a partner’s customer base, needs to occur. While the level of activity and timeframe is at partner discretion, it is anticipated that this period of time will be between three to six months per partner. I am confident that the agreements will directly contribute to the level of scalable distribution required to deliver return. It is important to understand why the Company has held a steadfast focus on securing agreements and cloud integrations with key partners during the year.
- The cloud industry is transforming. Both traditional leading software and hardware providers, Telcos, hosting companies and other software resellers are rapidly shifting their business models to offer cloud based applications via cloud marketplaces, or cloud stores, to businesses, to capitalise on the global shift taking place and to drive greater share of wallet and increasing margins.
- Securing agreements and integrations with global cloud platform providers is a strategically
important and necessary step to give the Company access to a ready-network of resellers and managed service providers (MSP’s) with which to pursue and negotiate distribution or resale agreements. It is a commercial preference, and, in many instances, a requirement, by the leading resellers that Manalto is targeting, to offer a certified product that is both packaged and provisioned, and is available directly from a reputable global cloud platform provider. The Company is concurrently actively pursuing agreements with resellers – including hosting companies, Telcos and other reseller type entities, to integrate, launch and resell Sóshlr and the Enterprise Solution. The Company is also targeting MSP’s which, in addition to reselling business applications, provide value add IT services and consulting to support customers.
- We fully expect competitive social media management solutions to be offered via these cloud
channels, which is why it is imperative for Manalto to quickly secure a leading position and build a solid foundation, globally. The company needs to fully exploit and build upon the unique position it has established during the past year - as the only social media management solution, presently, available via these global channels. This position will be further strengthened through delivering integrations with market leaders such as Microsoft to advance our position in this channel. A cloud marketplace provider, or reseller such as a Telco or Hosting Company, is less likely to integrate and offer multiple social media solutions to their customers, if we execute well, deliver a high level of partner support, ensure product stability and continue to deliver product innovation. It is imperative therefore, that Manalto not only integrate our products with the leading cloud application providers and build a solid network of resellers, but that we do it first.
- Increasing demand for cloud distribution of the Enterprise Solution. The Company has experienced
an exciting and higher than anticipated level of interest in its Sóshlr product, and achieved strong momentum by securing agreements with major players in the cloud application industry. Equally, the Company has seen a growing level of interest for the distribution of the Enterprise Solution, resulting in distribution agreements and the development of an Enterprise Solution API. While the Company continues to see direct sales adoption and market validation of its Enterprise Solution, the direct sales channel has experienced a less than anticipated conversion to date. Manalto will continue to target large, strategic sales directly, but will increase its pursuit of cloud integration opportunities for the planned third
For
per
sona
l use
onl
y

7
party distribution of both its Sóshlr product and also its Enterprise Solution, to achieve scalable distribution.
It is an exciting period of growth for the business as Manalto continues to elevate its market position as a key social media management solution provider and a first-to-market social media management entrant into the cloud industry. Through the strategic global partnerships cultivated throughout the year with some of world’s largest and leading cloud platform providers across Europe, Asia and North America, and the integrations completed, we have successfully injected the Company into the cloud industry, positioning Manalto today, as a cloud application provider with an innovative product offering. By doing so, the Company has extended its estimated addressable market, and secured first mover advantages and is now well positioned to take full advantage of the rapid growth in the use of cloud market places, to achieve revenue growth and shareholder return. The Board is confident that through steadfast commitment to the strategy in place and by building upon the progress achieved, the Company will capitalise on the significant transformation taking place today in the cloud industry to achieve the desired growth and return for our investors. On behalf of the Board of Manalto Limited, thank you for your continued support.
Joseph Miller Interim Chairman
Anthony Owen Founder & Chief Executive Officer
For
per
sona
l use
onl
y

8
Operations Report
REVIEW OF OPERATIONS During the year, Manalto made changes to its operations and to its corporate structure in an effort to align capital allocation with expected operational growth to achieve strategic goals.
- The Company brought the core finance functions in-house and streamlined the technology vendors as part of an operational review.
- To position the Company to successfully support planned growth of its distribution channel in Europe and
Asia Pacific, and to meet the commercial requirements of our partners and the regulatory environments of each region, Manalto established its primary commercial operations for Sóshlr within Europe, based in Ireland - Soshlr Ltd (Ireland), with wholly owned subsidiaries established in Netherlands, Australia and South Africa. The Company based its Asia Pacific Partner Onboarding and Account Management functions in Australia to support Asia Pacific growth for Sóshlr.
- The Company successfully relocated its technology development division and built out a customer support
function in Cape Town, South Africa, a decision made to leverage the cost effective availability of specialised, high-calibre technology resources and the opportunity for the Company to efficiently extend development capacity across multiple time zones to support product development and to enable 24/7 global technology and customer support.
- The Company appointed Australian Corporate Advisory Group, Henslow to provide advisory services to
advance the Company beyond its early growth stage including supporting core investor relations’ activities and providing U.S based management with on-ground resources and expertise to broaden the Company’s investor reach within Australia.
Product, Distribution and Marketing During FY 2016, the Company expanded its distribution channel securing agreements with a number of major cloud providers, advanced its core platform development with new features and enhancements to both products and continued to build traction in awareness as a provider with a solid product offering that directly addresses the recognised challenges in managing social media – at scale. Product Development The Company continued development of the core product offering during the year to support channel partner and global user growth and to maintain its unique value proposition. The Company delivered a number of significant enhancements including the integration of Dropbox to allow for better client side storage options, planned product interface and user experience enhancements, as well as the platform translation rollout of five (5) languages. The Company built and released a reseller API that allows for easier integration with the Sóshlr product by third party vendors as well as resellers – a key build to support the growth of Sóshlr distribution channel through streamlined partner integration and on boarding. Distribution Hearis Acquisition The Company completed the acquisition (1 August 2016) of Australian-based Enterprise Social Media Management platform, Hearis, representing a key strategic move for Manalto to strengthen its presence in Australia and to achieve wider penetration of the Manalto Enterprise Solution into the Australian corporate market. The acquisition provided Manalto with an active customer base of retail and multi-site businesses and an existing revenue base. Significant upside potential exists to scale up the utilisation of existing customers for further growth in revenue.
For
per
sona
l use
onl
y

9
Global Cloud Platform Providers In addition to its existing integration with Odin during FY2015, Manalto has, or is currently integrating its technology with the following global cloud platform providers:
- AppDirect (integrated) powers the largest network of cloud service marketplaces, reaching approximately 30 million small businesses worldwide via partners such as Globe Telecom, Comcast, Deutsche Telekom and Telstra. Partnering with AppDirect provides Manalto with a tremendous scale of distribution for the Sóshlr product. Notably, Sóshlr’s agreement with AppDirect also includes multi-tier distribution, which allows AppDirect to offer Sóshlr to channel partners directly, without requiring Sóshlr to enter into individual agreements with each channel partner. AppDirect will directly negotiate, integrate and support its channel partners to quickly start selling Sóshlr to their customers, bypassing the previous commercial model in which Manalto was wholly responsible for actively engaging AppDirect channel partners and resellers to promote Sóshlr. In addition to distribution via the AppDirect syndicated marketplace, Sóshlr was accepted as part of AppDirect’s Developer Certification Program which provides criteria that developers can meet that makes it easy for AppDirect’s service providers, independent software vendor (ISV), and value-added reseller (VAR) partners to quickly add and begin offering certified applications to their business customers.
- Plesk (integrated) is selling Sóshlr via its Cloud Market Place to an estimated addressable market of 8
million SME’s. Plesk is a recognised global leader in web hosting with an established partner base and network of customers. Plesk has a global network of 2500+ hosting companies who sell web and hosting services. 10 million domains are registered through Plesk. Plesk partners include companies such as 1&1, GoDaddy and Strato. In addition to Sóshlr being made available via its cloud extension store, Plesk will distribute Sóshlr directly via its reseller network.
- WHMCS (integrated) is a global cloud marketplace with more than 10,000 partners and now offers Sóshlr
- Ingram Micro, Inc. (integrating) (NYSE: IM), U.S. global provider of cloud, mobility, supply chain services
and technology solutions with a network of more than 200,000 reseller customers will make available both Manalto’s Enterprise Solution and Sóshlr to be resold via the Ingram Micro Cloud Marketplace. Ingram Micro is a global leader in the technology industry’s shift to cloud solutions and the agreement with Ingram Micro represents a significant strategic win for Manalto to further build upon the Company’s channel growth strategy to achieve maximum delivery of its technology and provide opportunity for growth in shareholder return. The agreement is the Company’s first cloud marketplace distribution channel agreement for its Enterprise Solution and bolsters the Company’s propensity to build upon Enterprise sales.
Third Party Integrations In addition to pursuing cloud platform providers and resellers, Manalto is targeting additional third party integration opportunities to extend the reach of both its Sóshlr and Enterprise Solution - to increase market penetration and boost visibility and market recognition and credibility. Examples of these types of integrations include, but are not limited to, functionality integrations and plugins. Throughout the year, Manalto targeted opportunities to offer both Sóshlr and its Enterprise Solution as extensions/ plugins that end customers could purchase:
- Manalto has also commenced the first key integration of its Sóshlr product into Microsoft Office 365. Microsoft Office 365 is the largest selling cloud business application with 60 million monthly active Office 365 commercial customers, 50,000 SME’s added to Office 365 each month and more than 400M active users on Outlook.com. This integration is part of a broader integration strategy to make Sóshlr available for sale via Microsoft’s Cloud Office Store to an estimated addressable market of 60 million Office 365 commercial customers. Sóshlr will be the first social media solution available for sale with Microsoft Office 365 applications. The Company plans to also integrate its Enterprise Solution into Microsoft Office 365.
Signed Resellers - Hosting Companies and Telcos
- Our first major partners, Telstra and Globe Telecom both commenced the commercialisation of Sóshlr in September 2016 making it available for sale via the Telstra Apps Marketplace to businesses within Australia, and via Globe’s online Apps Marketplace, reaching businesses across the Philippines.
- Several smaller-scale hosting companies are commercialising Sóshlr, including Blacknight, Dnet,
ReadySpace and LuxCloud’s Suenos marketplace, which offers hosted business applications focused on
For
per
sona
l use
onl
y

10
digital agencies, SEO and SEM companies across the globe. Collectively, these companies open up several strategic markets for us, help develop our foundation and brand reputation.
Sales Outreach Manalto increased its cloud sales outreach to help deliver the threshold of volume required to achieve planned growth and revenue goals for its Sóshlr and Enterprise Solution distribution channel. The Company appointed two specialist cloud sales companies to provide additional sales capability across the UK and Europe, and Asia, and to drive further cloud partner engagement. Leveraging the expertise of both companies, that already have an established network of SME reseller providers, is expected to streamline and ultimately accelerate the sales cycle for Sóshlr and our Enterprise Solution. Marketing The Company launched Channel Marketing Program to support partner Go-to-Market initiatives for Sóshlr distribution. It also ramped up its digital marketing program during the year and actively participated in key cloud and hosting events including Microsoft’s Partner Conference, Ingram Micro’s Cloud Summit, AppDirect’s Engage Conference and World Hosting Day events within the regions we operate, to strengthen brand visibility, provide solid engagement and commercial opportunities, and to showcase the Company’s capability and offering. Active engagement is a general industry expectation, imperative to achieve brand exposure and to build credibility and to demonstrates corporate commitment to the industry.
For
per
sona
l use
onl
y
11
Financial Overview During the year ended 30 June 2016 the Group recognised revenue of $117,952 relating to the Enterprise product, a 21% increase on the year ended 30 June 2015 (2015: $97,698). The Group recorded a loss after tax of $3,157,850 for the year ended 30 June 2016 (2015: $3,602,186). Net cash used in operations was $3,139,196 (2015: $2,659,412). The primary costs of the business continued to be salaries and research & development expenditure, which is in line with operational expectations and expected for a technology company developing a product of Manalto’s capabilities. Additionally, the Group continues to invest in travel and marketing expenditure as an active participant in the web hosting industry and franchise industry conference circuit to promote and engage commercial opportunities. During the year ended 30 June 2016, the Group issued capital totaling US$3.447 million (AU$4.741 million) executed over multiple placements from December 2015 to May 2016. The capital raised enabled the Group to finance its product and distribution activities. The issuance of capital remains a key requirement of the Group’s immediate plans to drive desired revenue goals and shareholder returns. The Group has continued to develop internally-generated intangible assets totaling $1.470m (2015: $594k). During the year ended 30 June 2016, $876,406 (2015: $479,510) was spent on the acquisition, development, maintenance and enhancement of technical knowledge for the design and implementation of the social media management software. The majority of the capitalised expense relates to staff and contractor wages specifically associated with the development, maintenance and deployment of the software. Understanding the AASB ruling guidelines for capitalising intangible assets, the Group fully expects to continue to develop and build on new and existing features of the Enterprise and Sóshlr platforms beyond the commercialisation stage and thus expects to continue to grow the internally-generated intangible asset balance in future reporting periods.
For
per
sona
l use
onl
y

12
Directors and Remuneration Report CURRENT DIRECTORS AT THE DATE OF THIS REPORT Joseph Miller Interim Chairman
Joseph Miller has been a Managing Director at Europlay Capital Advisors, LLC and its subsidiaries (“ECA”) since 2003. ECA is a Los Angeles-based boutique merchant bank and financial advisory firm that invests in, and provides services to companies in the technology, media, telecom, life sciences and consumer sectors. ECA’s investments have included such notable companies as Skype, Rdio, FlashFunders, FanDuel, and Red Bull Global Rallycross. Mr. Miller currently serves on the boards of several companies including Covata (ASX: CVT), FlashFunders and Red Bull Global Rallycross. In the past, he has also served on the boards of Talon International, Multigig, and Unicorn Media as well as on the Compensation and Audit Committees of Skype Global, prior to its sale to Microsoft.
Anthony Owen Founder & CEO
Mr Owen is the founder of Manalto with 20 years’ experience in digital and social media. His experience includes media agency environments, direct-to-market and senior sales management and strategic commercial partnership roles. His track record in establishing & building successful sales management capability across many organisations including, OzEmail, BMC Media, Softbank, Sensis, and Groupon.
Chris Adams Director
Mr Adams is an internationally recognised digital strategist, advisor and technology executive. Mr Adams created and produced the reality TV series ‘Facebook Diaries” for Facebook, and served as Chief Vision Officer and SVP of Business Development for Participant Media. Mr Adams served in executive roles with Facebook and Amazon.
Michael Quinert Director
Mr Quinert graduated with degrees in economics and law from Monash University and has over 30 years’ experience as a commercial lawyer, including three years with the ASX and over 20 years as a partner in a Melbourne law firm. He has extensive experience in assisting and advising public companies on capital raising and market compliance issues and has regularly advised publicly listed mining companies. Mr Quinert is a partner at Quinert Rodda, a law firm in Melbourne and serves on the boards of several companies including Covata Limited (ASX:CVT) and West Wits Mining Limited (ASX:WWI).
A review of the Company’s ‘Corporate Governance Framework’ is performed on a periodic basis to ensure that it is relevant and effective in light of changing legal and regulatory requirements. The Board of Directors continues to adopt a set of Corporate Governance Practices and a Code of Conduct appropriate for the size, complexity and operations of the Company and its subsidiaries. Unless otherwise stated all Policies and Charters meet the ASX Corporate Governance Council's Best Practice Recommendations.
1. Directors The following persons were Directors of Manalto Limited at any time during, or since the end of, the year: o Joseph Miller o Anthony Owen o Michael Quinert o Chris Adams (appointed 24 July 2015) o Kristian Blaszczynski (resigned 7 April 2016) o David Fletcher (resigned 11 April 2016) o Trent Telford (resigned 24 July 2015 All Directors have been in office since the start of the financial year to the date of this report, unless otherwise stated.
For
per
sona
l use
onl
y
13
2. Company Secretary The following person held the position of Company secretary at the end of the financial year: Mr. Justyn Stedwell On 14 September 2016, the Group advised of the appointment of Mrs. Lucy Rowe as Company Secretary and the resignation of Mr. Justyn Stedwell, effective 15 September 2016.
3. Principal Activities The principal activities of the Group during the financial year were: Licencing social media management software relating to the Enterprise and Sóshlr products.
4. Operating Results The consolidated loss of the Group after providing for income tax amounted to $3,184,553 (2015: loss of $3,602,186).
5. Review of Operations and Significant Changes in State of Affairs During the year, the Group established operations in South Africa, Ireland and the Netherlands and incorporated the following four entities: Soshlr Ltd, in Ireland – a wholly owned subsidiary of Manalto Limited (Australia). Soshlr Pty Ltd, in Australia – a wholly owned subsidiary of Soshlr Ltd (Ireland). Soshlr South Africa (Pty) Ltd – a wholly owned subsidiary of Soshlr Ltd (Ireland). Soshlr B.V., in the Netherlands – a wholly owned subsidiary of Soshlr Ltd (Ireland). The operations of the Company are still considered to be centered in the United States including the majority of management, the majority of operating cash flows and the location of the primary business address. Accordingly, the Directors have elected to present financial information in US dollars. All financial figures in this document are denominated in US dollars except where explicitly denoted.
6. Dividends No dividends were paid or declared since the start of the financial year (2015: no dividends).
7. Events Subsequent to Reporting Date On 1 August 2016, the Group completed the US$86,100 (A$114,000) strategic asset acquisition of Hearis Social Media Management Platform from Australian-based digital company, Generation Co. Pty Ltd. The settlement consisted of US$34,100 (A$45,000) in equity in the form of Manalto Limited ordinary shares and US$52,000 (A$69,000) in cash. There has not arisen in the interval between the year ended 30 June 2016 and the date of this report any other item, transaction or event of a material and unusual nature likely, in the opinion of the Directors’ of the Company, to materially affect the operations of the Group, the results of those operations, or the state of affairs of the Group, in future reporting periods.
8. Future Developments The Company is focused on the direct sales growth of its Enterprise Solution, and growth of a third party distribution channel for both its Sóshlr and Enterprise Solution through the identification of commercialisation opportunities for both of its products.
9. Environmental Issues The Group's operations are not regulated by any significant environmental regulation under a law of the Commonwealth or of a state or territory.
For
per
sona
l use
onl
y

14
10. Non-Audit Services The Company may decide to employ the auditor on assignments additional to their statutory audit duties where the auditor's expertise and experience with the Company and/or the Group are important. Details of the amounts paid or payable to the auditor (Grant Thornton) for audit services provided during the year are set out below. There were no non-audit services provided during the year. The following fees were paid/payable to the external auditors during the year ended 30 June 2016:
2016 $
2015 $
Amounts paid/payable to Grant Thornton Audit Pty Ltd Audit and other assurance services
53,414
30,620
Total paid or payable 53,414 30,620
11. Auditors Independence Declaration The lead auditor’s independence declaration for the year ended 30 June 2016 as required by Section 307C of the Corporations Act 2001 has been received and can be found on Page 54 of the financial report.
12. Director Information Information on Directors at 30 June 2016
Joseph Miller (Interim Chairman) Date appointed 11 March 2015 Interest in shares (Direct and indirect) 13,961,731* Interest in options (Direct and indirect) - Directorships in other listed entities held in the last 3 years Covata Limited
Anthony Owen (Chief Executive Officer) Date appointed 11 March 2015 Interest in shares (Direct and indirect) 6,769,540
Interest in options (Direct and indirect) 16,320,613
Directorships in other listed entities held in the last 3 years -
Michael Quinert Date appointed 6 September 2013 Interest in shares (Direct and indirect) 140,000 Interest in options (Direct and indirect) 500,000 Directorships in other listed entities held in the last 3 years West Wits Mining Limited, Covata Limited
Chris Adams
Date appointed 24 July 2015
Interest in shares (Direct and indirect) -
Interest in options (Direct and indirect) 500,000
Directorships in other listed entities held in the last 3 years Thred Limited
David Fletcher Date appointed 11 March 2015 Date resigned 11 April 2016 Interest in shares (Direct and indirect) 723,187
Interest in options (Direct and indirect) 1,000,000 Directorships in other listed entities held in the last 3 years -
Kristian Blaszczynski Date appointed 11 March 2015 Date resigned 7 April 2016 Interest in shares (Direct and indirect) 685,499 Interest in options (Direct and indirect) -
Directorships in other listed entities held in the last 3 years -
Trent Telford Date appointed 21 March 2013 Date resigned 24 July 2015 Interest in shares (Direct and indirect) 2,144,051 Interest in options (Direct and indirect) - Directorships in other listed entities held in the last 3 years Covata Limited
*Joseph Miller holds an indirect interest in shares held by ECA Ventures LLC, as a result of a share interest, but does not control ECA Ventures LLC.
For
per
sona
l use
onl
y

15
13. Meetings of Directors During the financial year, attendances by each Director at Directors’ Meetings were as follows: Directors'
Meetings Eligible to
attend Number attended
Joseph Miller 6 6 Anthony Owen 6 6 Michael Quinert 6 6 Chris Adams 6 6 David Fletcher (resigned 11 April 2016) 4 4 Kristian Blaszczynski (resigned 7 April 2016) 4 3 Trent Telford (resigned 24 July 2015) - - The Audit and Risk Management Committee Due to the number of directors on the Board, and the size of the Company, the consolidated entity did not consider it necessary to appoint an audit and risk committee for the year ended 30 June 2016. Remuneration Report (Audited) The remuneration report is set out under the following main headings: (a) Principles used to determine the nature and amount of remuneration (b) Details of remuneration (c) Service agreements (d) Share-based compensation (e) Additional information. The following persons were Directors and key management personnel (KMP) in office at any time during the financial year: Director Position Joseph Miller Director, Interim Chairman (appointed Interim Chairman 11 April 2016) Anthony Owen Chief Executive Officer, Executive Director Michael Quinert Director Chris Adams Director (Independent; appointed 24 July 2015) David Fletcher Chairman (Independent) (resigned 11 April 2016) Kristian Blaszczynski Director (Independent) (resigned 7 April 2016) Trent Telford Director (Independent) (resigned 24 July 2015)
Megan Owen Key Management Personnel (Chief Marketing Officer)
Justin Vianello Key Management Personnel (Chief Financial Officer, resigned 8 April 2016) Patrick Fong Key Management Personnel (Chief Technology Officer, resigned 6 May 2016)
14. Principles Used to Determine the Nature and Amount of Remuneration The objective of the Group’s executive reward framework is to ensure reward for performance is competitive and appropriate for the results delivered. The framework aligns executive reward with achievement of strategic objectives and the creation of value for shareholders, and conforms to market best practice for delivery of reward. The Board ensures that executive reward satisfies the following key criteria for good reward governance practices: o Competitiveness and reasonableness; o Acceptability to shareholders; o Performance linkage / alignment of executive compensation; o Transparency; and o Capital management. In consultation with industry surveys on executive remuneration the Group has structured an executive remuneration framework that is market competitive and complimentary to the reward strategy of the organisation. Alignment to shareholders’ interests: o Has economic future profits as a core component of plan design; o Focuses on sustained growth in shareholder wealth, consisting of the possibility of future dividends and growth in share
price, and delivering a future return on assets as well as focusing the executive on key non-financial drivers of value; and o Attracts and retains high calibre executives.
For
per
sona
l use
onl
y
16
Alignment to program participants’ interests: o Rewards capability and experience; o Reflects competitive reward for contribution to growth in shareholder wealth; o Provides a clear structure for earning rewards; and o Provides recognition for contribution. The framework provides a mix of fixed and variable pay, and a blend of short and long-term incentives. Non-Executive Directors Fees and payments to non-executive Directors reflect the demands which are made on, and the responsibilities of the Directors. Non-executive Directors’ fees and payments are reviewed regularly by the Board. The Chairman’s fees are determined independently to the fees of non-executive Directors based on comparative roles in the external market. The Chairman is not present at any discussions relating to determination of his own remuneration. Non-executive Directors do on occasions receive share options. Non-executive Directors may opt each year to receive a percentage of their remuneration in Manalto Limited shares, which would be acquired on-market. Directors’ Fees The current base remuneration was last reviewed with effect from 1 February 2016. The Chairman's remuneration is inclusive of committee fees, and non-executive Directors who chair a committee also do not receive additional yearly fees for such roles. Additional fees are payable to Directors for their membership on subsidiary boards (currently there are no subsidiary Boards). Non-executive Directors’ fees are determined within an aggregate Directors’ fee pool limit, which is periodically recommended for approval by shareholders. Executive Pay The executive pay and reward framework has four components: o Base pay and benefits o Short-term performance incentives o Long-term incentives through participation in the Manalto Limited's Employee Share Option Plan (ESOP), and o Other remuneration such as superannuation. The combination of these comprises the executive’s total remuneration. Base Pay Base pay is structured as a ‘total employment cost’ package which may be delivered as a combination of cash and prescribed non-financial benefits at the executive’s discretion, subject to Group guidelines. Executives are offered a competitive base pay that comprises the fixed component of pay and rewards. Industry remuneration surveys provide analysis to ensure base pay is set to reflect the market for a comparable role. Base pay for senior executives is reviewed – generally annually – to ensure the executive’s pay is competitive with the market. An executive’s pay is also reviewed on promotion. There are no guaranteed base pay increases included in any senior executives’ contracts. Short-term Incentives In respect of the senior Executives, each year key performance indicators (KPIs) are set. The Board of Directors sets the KPIs for the senior management and the senior management sets the KPIs for the other staff. The KPIs generally include measures relating to the Group and the individual, and include financial, sales, strategy, and risk measures. The measures are chosen as they directly align the individual’s reward to the KPIs of the Group and to its strategy and performance. At the end of the financial year, the Board of Directors assesses the actual performance of the Group and the individual against the KPIs set at the beginning of the financial year. Minimum sales targets are compared with actual product sales, and the terms achieved in respect of additional strategic agreements are compared with the Board’s desired terms. A percentage of the pre-determined maximum is awarded depending on results. No bonus is awarded where performance falls below the minimum. Long-Term Incentive Manalto Limited’s Employee Share Option Plan (ESOP). Information on the Manalto Limited ESOP is set out on Pages 18-19.
15. Details of Remuneration Details of the remuneration of the Directors and the key management personnel (as defined in AASB 124 Related Party Disclosures) of Manalto Limited and the Manalto Group are set out in the following tables. The key management personnel of Manalto Limited and the Group include the Directors as listed earlier in this Report, the Chief Marketing and Chief Technology Officer.
For
per
sona
l use
onl
y
17
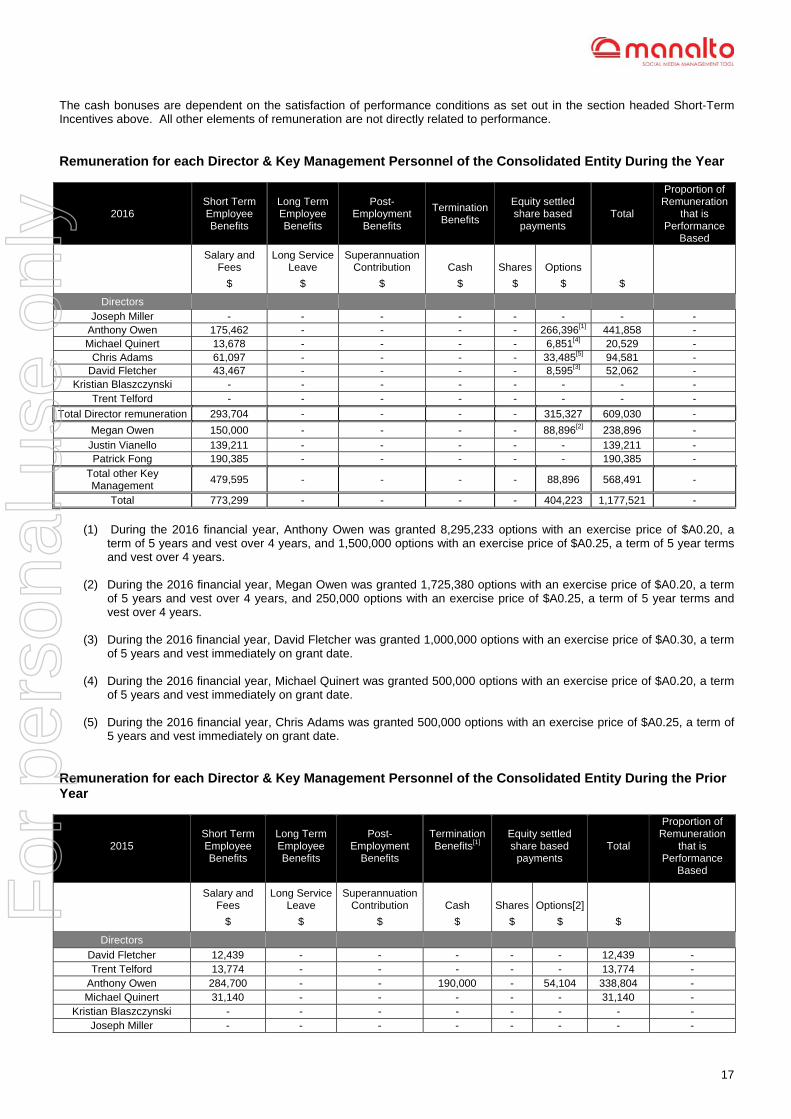
The cash bonuses are dependent on the satisfaction of performance conditions as set out in the section headed Short-Term Incentives above. All other elements of remuneration are not directly related to performance. Remuneration for each Director & Key Management Personnel of the Consolidated Entity During the Year
2016
Short Term Employee Benefits
Long Term Employee Benefits
Post-
Employment Benefits
Termination Benefits
Equity settled share based
payments
Total
Proportion of Remuneration
that is Performance
Based Salary and
Fees
$
Long Service Leave
$
Superannuation Contribution
$
Cash
$
Shares
$
Options
$ $
Directors Joseph Miller - - - - - - - -
Anthony Owen 175,462 - - - - 266,396[1] 441,858 - Michael Quinert 13,678 - - - - 6,851[4] 20,529 -
Chris Adams 61,097 - - - - 33,485[5] 94,581 - David Fletcher 43,467 - - - - 8,595[3] 52,062 -
Kristian Blaszczynski - - - - - - - - Trent Telford - - - - - - - -
Total Director remuneration 293,704 - - - - 315,327 609,030 -
Megan Owen 150,000 - - - - 88,896[2] 238,896 -
Justin Vianello 139,211 - - - - - 139,211 - Patrick Fong 190,385 - - - - - 190,385 -
Total other Key Management
479,595 - - - - 88,896 568,491 -
Total 773,299 - - - - 404,223 1,177,521 -
(1) During the 2016 financial year, Anthony Owen was granted 8,295,233 options with an exercise price of $A0.20, a
term of 5 years and vest over 4 years, and 1,500,000 options with an exercise price of $A0.25, a term of 5 year terms and vest over 4 years.
(2) During the 2016 financial year, Megan Owen was granted 1,725,380 options with an exercise price of $A0.20, a term of 5 years and vest over 4 years, and 250,000 options with an exercise price of $A0.25, a term of 5 year terms and vest over 4 years.
(3) During the 2016 financial year, David Fletcher was granted 1,000,000 options with an exercise price of $A0.30, a term
of 5 years and vest immediately on grant date.
(4) During the 2016 financial year, Michael Quinert was granted 500,000 options with an exercise price of $A0.20, a term of 5 years and vest immediately on grant date.
(5) During the 2016 financial year, Chris Adams was granted 500,000 options with an exercise price of $A0.25, a term of
5 years and vest immediately on grant date. Remuneration for each Director & Key Management Personnel of the Consolidated Entity During the Prior Year
2015
Short Term Employee Benefits
Long Term Employee Benefits
Post-
Employment Benefits
Termination Benefits[1]
Equity settled share based
payments
Total
Proportion of Remuneration
that is Performance
Based
Salary and Fees
$
Long Service Leave
$
Superannuation Contribution
$
Cash
$
Shares
$
Options[2]
$
$
Directors
David Fletcher 12,439 - - - - - 12,439 - Trent Telford 13,774 - - - - - 13,774 -
Anthony Owen 284,700 - - 190,000 - 54,104 338,804 - Michael Quinert 31,140 - - - - - 31,140 -
Kristian Blaszczynski - - - - - - - - Joseph Miller - - - - - - - -
For
per
sona
l use
onl
y
18
2015
Short Term Employee Benefits
Long Term Employee Benefits
Post-
Employment Benefits
Termination Benefits[1]
Equity settled share based
payments
Total
Proportion of Remuneration
that is Performance
Based
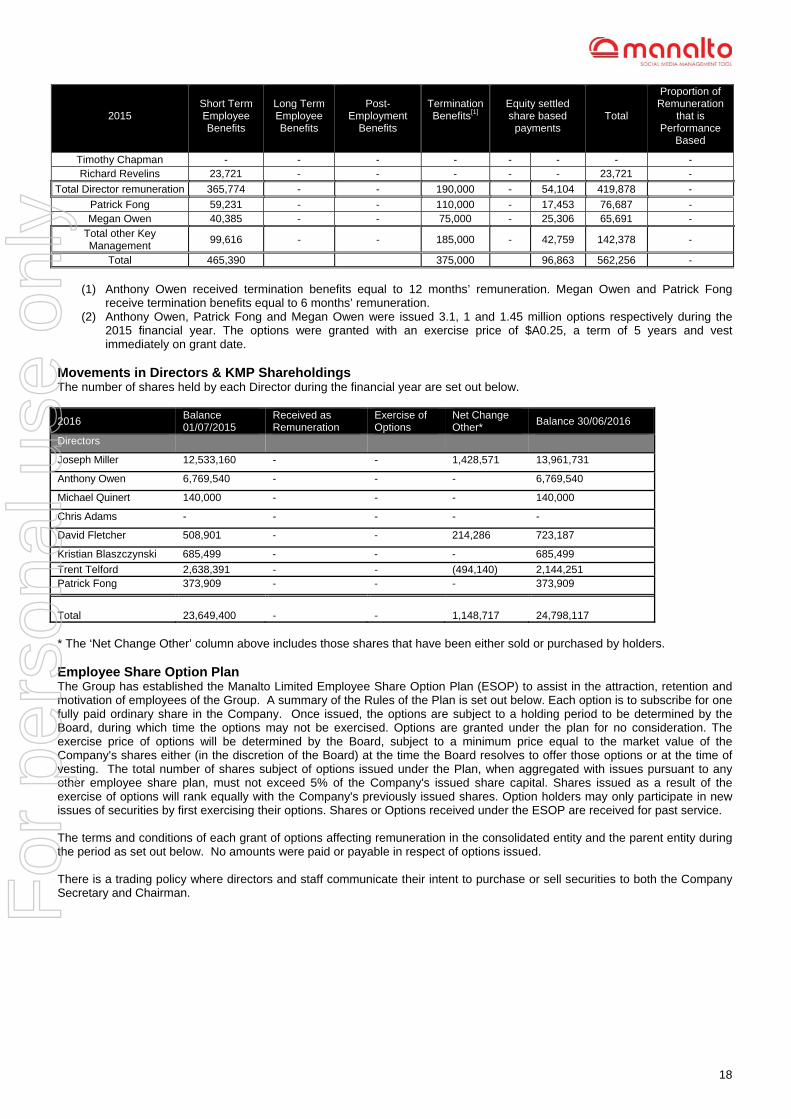
Timothy Chapman - - - - - - - - Richard Revelins 23,721 - - - - - 23,721 -
Total Director remuneration 365,774 - - 190,000 - 54,104 419,878 -
Patrick Fong 59,231 - - 110,000 - 17,453 76,687 - Megan Owen 40,385 - - 75,000 - 25,306 65,691 -
Total other Key Management
99,616 - - 185,000 - 42,759 142,378 -
Total 465,390 375,000 96,863 562,256 -
(1) Anthony Owen received termination benefits equal to 12 months’ remuneration. Megan Owen and Patrick Fong
receive termination benefits equal to 6 months’ remuneration. (2) Anthony Owen, Patrick Fong and Megan Owen were issued 3.1, 1 and 1.45 million options respectively during the
2015 financial year. The options were granted with an exercise price of $A0.25, a term of 5 years and vest immediately on grant date.
Movements in Directors & KMP Shareholdings The number of shares held by each Director during the financial year are set out below.
2016 Balance 01/07/2015
Received as Remuneration
Exercise of Options
Net Change Other*
Balance 30/06/2016
Directors
Joseph Miller 12,533,160 - - 1,428,571 13,961,731
Anthony Owen 6,769,540 - - - 6,769,540
Michael Quinert 140,000 - - - 140,000
Chris Adams - - - - -
David Fletcher 508,901 - - 214,286 723,187
Kristian Blaszczynski 685,499 - - - 685,499
Trent Telford 2,638,391 - - (494,140) 2,144,251 Patrick Fong 373,909 - - - 373,909
Total
23,649,400
-
-
1,148,717
24,798,117
* The ‘Net Change Other’ column above includes those shares that have been either sold or purchased by holders. Employee Share Option Plan The Group has established the Manalto Limited Employee Share Option Plan (ESOP) to assist in the attraction, retention and motivation of employees of the Group. A summary of the Rules of the Plan is set out below. Each option is to subscribe for one fully paid ordinary share in the Company. Once issued, the options are subject to a holding period to be determined by the Board, during which time the options may not be exercised. Options are granted under the plan for no consideration. The exercise price of options will be determined by the Board, subject to a minimum price equal to the market value of the Company's shares either (in the discretion of the Board) at the time the Board resolves to offer those options or at the time of vesting. The total number of shares subject of options issued under the Plan, when aggregated with issues pursuant to any other employee share plan, must not exceed 5% of the Company's issued share capital. Shares issued as a result of the exercise of options will rank equally with the Company's previously issued shares. Option holders may only participate in new issues of securities by first exercising their options. Shares or Options received under the ESOP are received for past service. The terms and conditions of each grant of options affecting remuneration in the consolidated entity and the parent entity during the period as set out below. No amounts were paid or payable in respect of options issued. There is a trading policy where directors and staff communicate their intent to purchase or sell securities to both the Company Secretary and Chairman. F
or p
erso
nal u
se o
nly

19
Movements in Directors & KMP options holdings No options were exercised during 2016. The number of options held by each Director and key management personnel during the financial year ended 30 June 2016 are set out below.
2016 Balance 01/07/2015
Received as Remuneration
Exercise of Options
Lapsed Balance 30/06/2016
Directors and Key Management Personnel
Joseph Miller - - - - -
Anthony Owen 3,100,000 9,795,233 - - 12,895,233
Michael Quinert - 500,000 - - 500,000
Chris Adams - 500,000 - - 500,000
David Fletcher - 1,000,000 - - 1,000,000
Kristian Blaszczynski - - - - -
Trent Telford - - - - -
Megan Owen 1,450,000 1,975,380 - - 3,425,380
Patrick Fong 1,000,000 - - (1,000,000) -
Total 5,550,000 13,770,613 - (1,000,000) 18,320,613
Details of share options issued to Directors and other key management personnel as part of compensation during the year ended 30 June 2016 are set out below:
Name Options Grant Date Date of Expiry Exercise Price
$USD Fair value
$USD Anthony Owen 8,295,233 29 February 2016 29 February 2020 $0.14[1] $113,657
Anthony Owen 1,500,000 29 February 2016 29 February 2020 $0.18[2] $20,552 Michael Quinert 500,000 29 February 2016 29 February 2020 $0.14[1] $9,207 Chris Adams 500,000 11 March 2015 11 March 2018 $0.19[2] $33,485 David Fletcher 1,000,000 15 December 2015 15 December 2020 $0.22[3] $8,595 Megan Owen 1,725,380 29 February 2016 29 February 2020 $0.14[1] $23,640 Megan Owen 250,000 29 February 2016 29 February 2020 $0.18[2] $3,425
Details of share options issued to Directors and other key management personnel as part of compensation during the year ended 30 June 2015 are set out below:
Name Options Grant Date Date of Expiry Exercise
Price $USD
Fair value $USD
Anthony Owen 3,100,000 11 March 2015 11 March 2020 $0.19[2] $186,291
Megan Owen 1,450,000 11 March 2015 11 March 2020 $0.19[2] $87,136 Patrick Fong 1,000,000 11 March 2015 11 March 2020 $0.19[2] $0[4]
(1) The options were issued at a price of AUD$0.20. (2) The options were issued at a price of AUD$0.25. (3) The options were issued at a price of AUD$0.30. (4) Options lapsed during the year ended 30 June 2016.
16. Other Payments Made to the Directors A Director, Michael Quinert, is the partner of a legal firm Quinert Rodda & Associates. During the year Quinert Rodda & Associates provided legal advisory service to the Group. The services were provided on normal commercial terms and conditions. Payments are included in the Statement of Profit or Loss and Other Comprehensive Income as operating expense of the Group. Amounts recognised as expense:
Consolidated 2016
$ 2015
$ Quinert Rodda & Associates Consulting & Professional Fees
15,000 209,000
Total 15,000 209,000
This marks the end of the audited Remuneration Report.
For
per
sona
l use
onl
y

20
17. Indemnification of Officers During the financial year, Manalto Limited Instituted Directors and Officers insurance. The liabilities insured are legal costs that may be incurred in defending civil or criminal proceedings that may be brought against the officers in their capacity as officers of entities in the Group, and any other payments arising from liabilities incurred by the officers in connection with such proceedings. This does not include such liabilities that arise from conduct involving a wilful breach of duty by the officers or the improper use by the officers of their position or of information to gain advantage for themselves or someone else or to cause detriment to the Company. It is not possible to apportion the premium between amounts relating to the insurance against legal costs and those relating to other liabilities.
18. Proceedings on Behalf of Company The Company is involved in an employee litigation matter that was brought against the Group subsequent to the 30 June 2016 year end. The Directors’ consider this claim to be unjustified and immaterial to the operations of the Group. Further information on these contingencies is omitted so as not to prejudice the Group’s position in the related disputes. The Company was not a party to other any such proceedings during the year ended 30 June 2016.
19. Options At the date of this report, the unissued ordinary shares of Manalto Limited under unlisted options are as follows: Grant Date Date of Expiry *Exercise Price Number Under Option 11 March 2015 11 March 2020 $0.19[1] 4,550,000 11 March 2015 11 March 2018 $0.19[1] 2,250,000 15 December 2015 15 December 2020 $0.22[2] 1,900,000 29 February 2016 29 February 2020 $0.14[3] 17,719,562 26 February 2016 29 February 2020 $0.18[1] 4,287,500
Total 30,707,062
(1) The options were issued at a price of AUD$0.25. (2) The options were issued at a price of AUD$0.30. (3) The options were issued at a price of AUD$0.20.
No option holder has any right under the options to participate in any other share issue of the Company or any other entity. Signed in accordance with a resolution of the Board of Directors:
Joseph Miller Interim Chairman
Anthony Owen Founder & Chief Executive Officer
Dated 29 September 2016
For
per
sona
l use
onl
y

21
Corporate Governance Statement
PRINCIPLE 1: LAY SOLID FOUNDATIONS FOR MANAGEMENT AND OVERSIGHT ROLE OF THE BOARD AND MANAGEMENT The Board’s role is to govern the Company rather than to manage it. In governing the Company, the Directors must act in the best interests of the Company as a whole. It is the role of senior management to manage the Company in accordance with the direction and delegations of the Board and the responsibility of the Board to oversee the activities of management in carrying out these delegated duties. The Board’s responsibilities are detailed in its Board Charter and cover the following broad categories: o Leadership of the organisation o Strategy formulation o Shareholder liaison o Monitoring, compliance and risk management o Company finances o Human resources o Health, safety and well-being of Directors, Officers and Contractors o Delegation of authority o Remuneration policy o Nomination policy BOARD APPOINTMENTS The Company undertakes comprehensive reference checks prior to appointing a director, or putting that person forward as a candidate to ensure that person is competent, experienced, and would not be impaired in any way from undertaking the duties of director. The Company provides relevant information to shareholders for their consideration about the attributes of candidates together with whether the Board supports the appointment or re-election. The terms of the appointment of a non-executive director, executive directors and senior executives are agreed upon and set out in writing. COMPANY SECRETARY The Company Secretary is accountable directly to the Board, through the Chairman, on all matters to do with the proper functioning of the Board, including agendas, Board papers and minutes, advising the Board on governance matters, monitoring that Board policies and procedures are followed, communication with regulatory bodies and the ASX and statutory and other filings. DIVERSITY The Company's objective is to have a workforce that is representative of the countries and communities in which it operates. Our workforce is employed based on the right person for the right job regardless of their gender, age, nationality, race, religious beliefs, cultural background, sexuality or physical ability. The Company is committed to increasing diversity amongst its employees, consultants and advisors. Management and board positions are filled by the best candidates available without discrimination. The Company is committed to increasing gender diversity within these positions when appropriate appointments become available. It is also committed to identifying suitable persons within the organisation and where appropriate opportunities exist, advance diversity and to support promotion of talented employees into management positions. The Company has not set any gender specific diversity objectives as it believes that all categories of diversity are equally as important within its organisation. BOARD AND KMP PERFORMANCE REVIEW The Board considers the ongoing development and improvement of its own performance, the performance of individual directors and Board Committees as critical to effective governance. The Board has adopted an informal self-evaluation process to measure its own performance. The performance of the Board and individual directors is reviewed by the Board as a whole. This process includes a review in relation to the composition and skills mix of the Directors of the Company. Performance reviews involve analysis based on key performance indicators aligned with the financial and non‐financial objectives of the Company. An informal review was performed in April 2016 resulting in Mr Joseph Miller being appointed to the seat of Interim Chairman, and Mr Kristian Blaszczynski and Mr David Fletcher stepping down from their roles on the Board. The Board intends to conduct a Board performance review during the 2017 financial year. The Board conducts performance reviews of the Chief Executive Officer and any other key management personnel (KMP). The
For
per
sona
l use
onl
y

22
Board assesses the performance of KMP against qualitative and quantitative key performance indicators relevant to each KMP. A performance review of KMP occurred in April 2016 and resulted in the departure of the Chief Technology Officer, Mr Patrick Fong. Additionally, Mr Justin Vianello departed from the position of Chief Financial Officer. Upon further assessment in in July 2016, the Board appointed Mr Anthony Corliss to the position of Chief Operating Officer. The Board intends to conduct a formal performance review of KMP during the 2017 financial year and is actively conducting searches to appoint additional KMP posts. INDEPENDENT ADVICE Directors collectively or individually have the right to seek independent professional advice at the Company's expense, up to specified limits, to assist them to carry out their responsibilities. All advice obtained is made available to the Full Board.
PRINCIPLE 2: STRUCTURE THE BOARD TO ADD VALUE STRUCTURE AND COMPOSITION OF THE BOARD The Board has been formed so that it has an effective mix of personnel who are committed to adequately discharging their responsibilities and duties and being of value to the Company. The names of the Directors, their independence, qualifications and experience are stated on pages 12 to 15 along with the term of office held by each. The Board believes that the interests of all Shareholders are best served by: o Directors having the appropriate skills, experience and contacts within the Company's industry. o The Company striving to have a number of Directors being independent as defined in the ASX Corporate Governance
Guidelines. o Where any Director has a material personal interest in a matter before the board, the Director will not be permitted to be
present during discussion or to vote on the matter. The enforcement of this requirement is in accordance with the Corporations Act and aims to ensure that the interests of Shareholders, as a whole, are pursued and that their interest or the Director's independence is not jeopardised.
The Board assesses whether a director is independent in accordance with the ASX Corporate Governance Council’s independence guidelines. The Board currently consists of four directors of which one is considered to be independent. Chris Adams (and former directors Trent Telford, David Fletcher (Chairman) and Kristian Blaszczynski) are all considered to be independent directors. The Board is currently undergoing a structure review and intends to appoint additional independent directors in the 2017 financial year. The Board considers that the presence of at least two independent directors (including the Chairman) provides the Board with sufficient independent judgement. NOMINATION OF DIRECTORS The Board is responsible for the nomination and selection of directors. Given the size of the Board and the company, the Board does not believe it to be appropriate to establish a Nomination Committee at this time. Directors are appointed based on the specific skills required to effectively govern the company. The Board periodically assesses the competencies and experience of each Board member and the experiences and skills required at Board level to meet its operational objectives. The Board has not developed a formal Board skill matrix. The Board is satisfied with the skills and experience of each director and the current Board, the Board will consider developing a formal Board sills matrix during the 2017 financial year. INDUCTION OF DIRECTORS AND PROFESSIONAL DEVELOPMENT A new director induction program is in place and Directors are encouraged to engage in professional development activities to develop and maintain the skills and knowledge needed to perform their role as Directors effectively.
PRINCIPLE 3: ACT ETHICALLY AND RESPONSIBILY ETHICAL AND RESPONSIBLE DECISION MAKING As part of its commitment to recognising the legitimate interests of stakeholders, the Company has established a Code of Conduct to guide compliance with legal and other obligations to legitimate stakeholders. LEGITIMATE INTERESTS OF STAKEHOLDERS The Board acknowledges the legitimate interests of various stakeholders such as Employees, Clients, Customers, Government Authorities, Creditors and the Community as a whole. As a good Corporate Citizen, it encourages compliance and commitment to appropriate corporate practices that are fair and ethical.
For
per
sona
l use
onl
y
23
SHARE TRADING POLICY The Company has a share trading policy that regulates the dealings by Directors, Officers and Consultants, in shares, options and other securities issued by the Company. The policy has been formulated to ensure that Directors, Officers, Employees and Consultants who work on a regular basis for the Company are aware of the legal restrictions on trading in Company securities while in possession of unpublished price-sensitive information.
PRINCIPLE 4: SAFEGAURD INTEGRITY IN CORPORATE REPORTING AUDIT COMMITTEE The Board has assumed the responsibilities normally delegated to the Audit and Risk Committee as set out in the Company’s Audit and Risk Committee Charter. Due to the size of the Company, the Board does not believe it is necessary to establish a separate Audit and Risk Committee structure. In fulfilling the responsibilities of the Audit and Risks Committee, the Board: o Receives regular reports from management; o Meets with the external auditors at least twice a year and reviews any significant disagreements between the auditors and
management irrespective of whether they have been resolved; o Review of the audit plan with the external auditors and evaluates the effectiveness of the external audit; and o Fulfils all obligations of the Audit and Risk Committee as set out in the Company’s Audit and Risk Committee Charter. CEO DECLARATIONS The CEO has provided the Board with a declaration that, in his opinion, the financial records of the entity have been properly maintained and that the financial statements comply with the appropriate accounting standards and give a true and fair view of the financial position and performance of the entity and that the opinion has been formed on the basis of a sound system of risk management and internal control which is operating effectively. EXTERNAL AUDITOR The Company's external auditor attends each annual general meeting and is available to answer any questions with regard to the conduct of the audit and their report. Prior approval of the Board must be gained for non-audit work to be performed by the external auditor. There are qualitative limits on this non-audit work to ensure that the independence of the auditor is maintained. There is also a requirement that the audit partner responsible for the audit not perform in that role for more than five years
PRINCIPLE 5: MAKING TIMELY AND BALANCED DISCLOSURE The Company is committed to ensuring all investors have equal and timely access to material information concerning the Company. The Board has designated the Company Secretary as the person responsible for overseeing and co-ordinating disclosure of information to the ASX as well as communicating with the ASX. In accordance with ASX Listing Rules, the Company immediately notifies the ASX of information concerning the Company: o That a reasonable person would or may expect to have a material effect on the price or value of the Company's securities;
and, o That would, or would be likely to, influence persons who commonly invest in securities in deciding whether to acquire or
dispose of the Company's securities. o The information disclosed will be factual and presented in a clear and balanced way that allows investors to assess the
impact of the information when making investment decisions.
PRINCIPLE 6: RESPECT THE RIGHTS OF SHAREHOLDERS The Company respects the rights of its shareholders and to facilitate the effective exercise of those rights the Company is committed to: o Communicating effectively with shareholders through releases to the market via ASX, the Company website, information
mailed to shareholders, annual and half-year financial statements and the general meetings of the company; o Giving shareholders ready access to balanced and understandable information about the Company and corporate
proposals; and o Making it easy for shareholders to participate in general meetings of the company. The Company also makes available a telephone number and email address for shareholders to make enquiries of the company. These contact details are available on Company ASX announcements.
For
per
sona
l use
onl
y

24
The Company views the annual general meeting as an opportunity for shareholders to meet with and ask questions of the Board. Accordingly, all shareholders are given the opportunity to ask questions. The Company’s external auditors are in attendance at the annual general meetings. All shareholders are given the opportunity to ask the Company’s external auditors questions about the conduct of the audit and the preparation and content of the auditor’s report. Shareholders may elect to, and are encouraged to, receive communications from the Company and its securities registry electronically. The Company maintains information in relation to its corporate governance documents, Directors and senior executives, Board and committee charters, annual reports and ASX announcements on the Company’s website.
PRINCIPLE 7: RECOGNISE AND MANAGE RISK The Board has an established a policy for risk oversight and management within the Company. This is periodically reviewed and updated. Management reports risks identified to the Committee and the Board on a periodical basis. Risk management is considered a key governance and management process. The Board ultimately determines the company’s risk profile and is responsible for approving and overseeing the company’s risk management policy and internal compliance and control systems. The Board reviews the Company’s risk management framework at least annually to satisfy itself that it continues to be sound. A review of the Company’s risk management framework occurred during the year. Management reports to the Board on the effectiveness of the Company’s management of its material business risks. In addition, the Board undertakes a review of all major activities to assess risk and the effectiveness of strategies implemented to manage risk. During the reporting period, management has reported to the Board as to the effectiveness of the Company’s management of its material business risks. The Company does not have an internal audit function. The Company faces risks inherent to its business, including economic risks, which may materially impact the Company’s ability to create or preserve value for security holders over the short, medium or long term. The Company has in place policies and procedures, including a risk management framework (as described in the Company’s Risk Management Policy), which is developed and updated to help manage these risks. The Board does not consider that the Company currently has any material exposure to environmental or social sustainability risks
PRINCIPLE 8: REMUNERATE FAIRLY AND RESPONSIBLY Due to the size of the Board and the Company, the Board has not established a separate Remuneration Committee. The Board of Directors is responsible for, but not limited to, the following: o Setting the remuneration and conditions of service of all Executive and Non-Executive Directors, Officers and Employees
of the Company; o Approving the design of Executive and Employee incentive plans (including equity-based plans) and proposed payments
or awards under such plans; o Reviewing performance hurdles associated with incentive plans; o Making recommendations to the Board on the remuneration of Non-Executive Directors within the aggregate approved by
shareholders at General Meetings from time to time; o Consulting appropriately qualified consultants for advice on remuneration and other conditions of service; o Succession planning for the Senior Executive Officers; o Performance assessment of the Managing Director and Senior Executives Officers; recommending policy on the selection
of Board Members; and, o Recommending prospective Board Members to the Full Board of the Company. The Company remunerates directors and key executives fairly and appropriately with reference to the skills and experience of the director/executive and employment market conditions. Any bonus or incentive payments made to directors and executives are based on the achievement of set financial and/or operational performance targets. Payment of equity-based remuneration is made in accordance with thresholds set in plans approved by shareholders. Participants in an equity based remuneration scheme are prohibited from entering into any transaction that would have the effect of hedging or otherwise transferring the risk of any fluctuation in the value of any unvested entitlement in the Company’s securities to any other person. The Company is committed to remunerating its Senior Executives in a manner that is market-competitive and consistent with 'Best Practice' as well as supporting the interests of Shareholders. Senior Management may receive a remuneration package-based on fixed and variable components, determined by their position and experience. Shares and/or Options may also be granted based on an individual's performance, with those granted to Directors subject to Shareholder approval. Non-Executive Directors are paid their fees out of the maximum aggregate amount approved by Shareholders for the remuneration of Non-Executive Directors. Non-Executive Directors do not receive performance based bonuses and do not participate in Equity Schemes of the Company without prior Shareholder approval.
For
per
sona
l use
onl
y

25
Details of the amount of remuneration, and all monetary and non-monetary components, for Directors and key management personnel are included in the Directors’ Report. This Corporate Governance statement complies with the 3rd edition (March 2014) of the ASX Corporate Governance Principles/Recommendations, is current as at 30 June 2016 and has been approved by the Board. All of these practices, unless otherwise stated, were in place for the entire year.
For
per
sona
l use
onl
y

26
CONSOLIDATED STATEMENT OF PROFIT OR LOSS AND OTHER COMPREHENSIVE INCOME For the Year Ended 30 June 2016
The accompanying notes form part of the financial statements.
Consolidated
Note 2016
$ 2015
$
Revenue 3 117,952 97,698
Other income 3 70 80,503
Total revenue and other income 3 118,022 178,201
Payroll and employees expense (1,567,438) (929,480)
Share-based payment expense (310,335) (139,672)
Travel and accommodation (509,464) (324,408)
Consulting and professional fees 4 (447,950) (957,578)
General administration and compliance costs (350,998) (170,127)
IT and web costs (150,656) (61,889)
Listing fee 16(d) - (1,219,401)
Advertising and marketing (119,892) (121,083)
Depreciation (24,039) (5,548)
Finance expense 5 (9,365) (25,923)
Loss before income tax (3,372,115) (3,776,908)
Income tax benefit 6 187,562 174,722
Net loss for the period (3,184,553) (3,602,186)
Items that may be reclassified subsequently to profit or loss:
Foreign Currency Translation Reserve Movement 15 44,196 (156,678)
Total comprehensive income/(loss) for the period (3,140,357) (3,758,864)
Basic and diluted loss per share (cents per share) from continuing operations:
Basic earnings per share 19 (0.027) (0.050)
Diluted earnings per share 19 (0.027) (0.050)
For
per
sona
l use
onl
y

27
CONSOLIDATED STATEMENT OF FINANCIAL POSITION As at 30 June 2016
The accompanying notes form part of the financial statements.
Consolidated
Note 2016
$ 2015
$ ASSETS
Current assets Cash and cash equivalents 7 1,308,515 2,091,598
Trade and other receivables 8 132,583 82,073
Prepaid expenses 8 2,705 48,764
Total current assets 1,443,803 2,222,435
Non-current assets
Deferred tax asset 6 362,284 174,722
Property, plant and equipment 10 80,167 45,438
Intangible assets 9 1,469,993 593,587
Total non-current assets 1,912,444 813,747
TOTAL ASSETS 3,356,247 3,036,182
LIABILITIES
Current liabilities
Trade and other payables 11 127,586 96,030
Short-term provisions 12 33,854 162,507
Total current liabilities 161,440 258,537
TOTAL LIABILITIES 161,440 258,537
NET ASSETS 3,194,807 2,777,645
EQUITY
Equity attributable to owners of the parent:
Contributed equity 13 10,651,290 7,404,106
Share option reserve 20 605,021 294,686
Foreign currency translation reserve 15 (103,411) (147,607)
Accumulated losses 14 (7,958,093) (4,773,540)
TOTAL EQUITY 3,194,807 2,777,645
For
per
sona
l use
onl
y

28
CONSOLIDATED STATEMENT OF CHANGES IN EQUITY For the Year Ended 30 June 2016
Consolidated
30 June 2016
Note Contributed
Equity $
Foreign currency
reserve $
Accumulated Losses
$
Share option reserve
$
Total
$
Balance at 1 July 2015 7,404,106 (147,607) (4,773,540) 294,686 2,777,645
Losses for the year 14 - - (3,184,553) - (3,184,553)
Other comprehensive income/(loss) 15 - 44,196 - - 44,196
Transactions with owners in their capacity as owners
Share-based payment – share options 20 - - - 310,335 310,335
Contributions of equity 13 3,247,184 - - - 3,247,184
Balance at 30 June 2016 10,651,290 (103,411) (7,958,093) 605,021 3,194,807
Consolidated
30 June 2015
Note
Contributed Equity
$
Foreign currency
reserve $
Accumulated Losses
$
Share option reserve
$
Total
$
Balance at 1 July 2014 1,043,751 9,071 (1,171,354) - (118,532)
Losses for the year 14 - - (3,602,186) - (3,602,186)
Other comprehensive income/(loss) 15 - (156,678) - - (156,678)
Transactions with owners in their capacity as owners
Share-based payment – share options 20 - - 294,686 294,686
Contributions of equity 13 6,360,355 - - - 6,360,355
Balance at 30 June 2015 7,404,106 (147,607) (4,773,540) 294,686 2,777,645
The accompanying notes form part of the financial statements.
For
per
sona
l use
onl
y
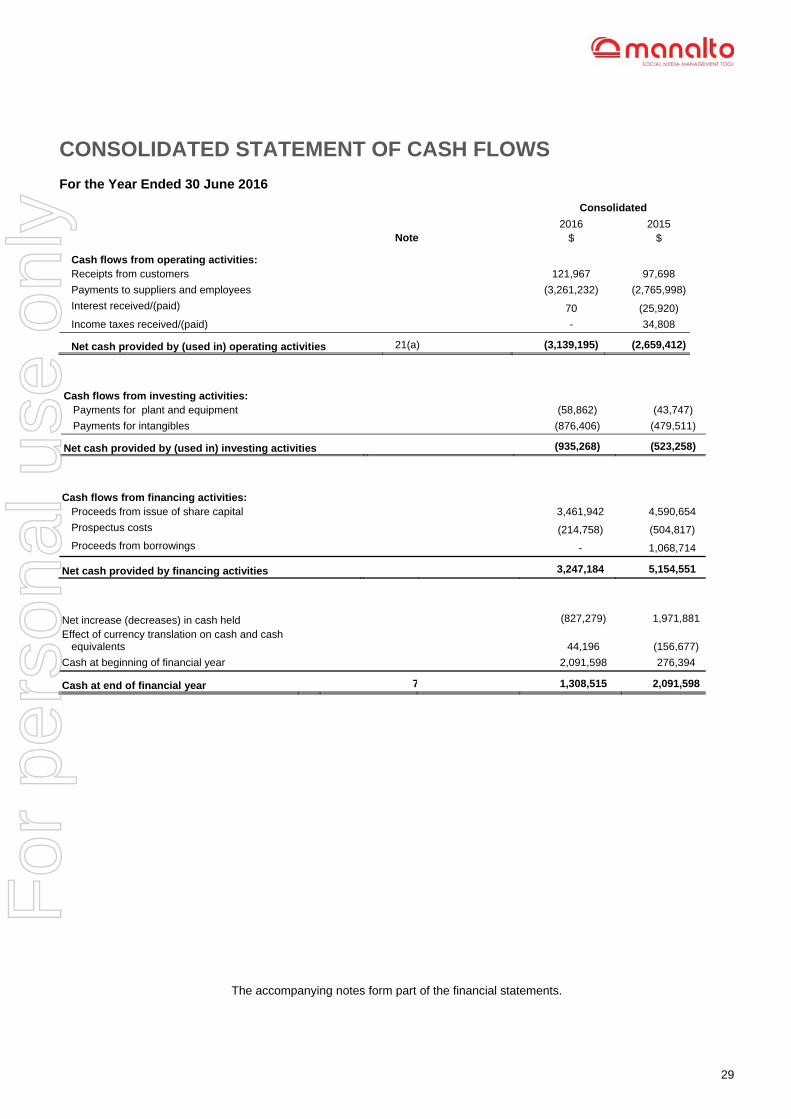
29
CONSOLIDATED STATEMENT OF CASH FLOWS For the Year Ended 30 June 2016
Consolidated
Note 2016
$ 2015
$
Cash flows from operating activities: Receipts from customers 121,967 97,698
Payments to suppliers and employees (3,261,232) (2,765,998)
Interest received/(paid) 70 (25,920)
Income taxes received/(paid) - 34,808
Net cash provided by (used in) operating activities 21(a) (3,139,195) (2,659,412)
Cash flows from investing activities: Payments for plant and equipment (58,862) (43,747)
Payments for intangibles (876,406) (479,511)
Net cash provided by (used in) investing activities (935,268) (523,258)
Cash flows from financing activities: Proceeds from issue of share capital 3,461,942 4,590,654
Prospectus costs (214,758) (504,817)
Proceeds from borrowings - 1,068,714
Net cash provided by financing activities 3,247,184 5,154,551
Net increase (decreases) in cash held (827,279) 1,971,881
Effect of currency translation on cash and cash equivalents 44,196 (156,677)
Cash at beginning of financial year 2,091,598 276,394
Cash at end of financial year 7 1,308,515 2,091,598
The accompanying notes form part of the financial statements.
For
per
sona
l use
onl
y
30
NOTES TO THE FINANCIAL STATEMENTS
1. Statement of Significant Accounting Policies The principal accounting policies adopted in the preparation of the financial statements are set out below. These policies have been consistently applied to all the years presented, unless otherwise stated. Pursuant to changes to the Corporations Act 2001, the financial statements presented are only for the consolidated entity consisting of Manalto Limited and its subsidiaries. Disclosures required in relation to the parent entity are presented in Note 16. (a) Basis of preparation These financial statements are general purpose financial statements that have been prepared in accordance with Australian Accounting Standards (including Australian interpretations), other authoritative pronouncements adopted by the Australian Accounting Standards Board (AASB), and the Corporations Act 2001. The Company is a for-profit entity for the purpose of preparing financial statements. On 31 March 2015 Manalto Limited (formerly Healthlinx Limited) completed the legal acquisition of Manalto Inc. Under the Australian Accounting Standards Manalto Inc. was deemed to be the accounting acquirer in this transaction. The acquisition has been accounted for as a share based payment by which Manalto Inc. acquires the net assets and listing status of Manalto Limited Accordingly, the consolidated financial statements of the Manalto Limited Group have been prepared as a continuation of the business and operations of Manalto Inc. As the deemed acquirer, Manalto Inc. has accounted for the acquisition of Manalto Limited from 31 March 2015. The comparative information for the 12 months ended 30 June 2015 presented in the consolidated financial statements represents the combination of Manalto, Inc. and Manalto Limited. Refer to note 16 for further details of the transaction The implications of the acquisition by Manalto Inc. on the financial statements are as follows: Statement of Profit or Loss and Other Comprehensive Income The 2015 Statement of Profit or Loss and Other Comprehensive Income comprises the total comprehensive income for the financial year, being the 12 months from Manalto Inc. for the year ended 30 June 2015 and the period from 31 March 2015 until 30 June 2015 for Manalto Limited Statement of Financial Position The 2015 Statement of Financial Position as at 30 June 2015 represents the combination of Manalto Inc. and Manalto Limited Statement of Changes in Equity The 2015 Statement of Changes in Equity comprises: o The equity balance of Manalto Inc. as at the beginning of the financial year (1 July 2014) o The total comprehensive income for the financial year and transactions with equity holders, being the 12 months from
Manalto Inc. for the year ended 30 June 2015 and the period from 31 March 2015 until 30 June 2015 for Manalto Limited o The equity balance of the combined Manalto Inc. and Manalto Limited at the end of the financial year (30 June 2015) Statement of Cash Flows The 2015 Statement of Cash Flows comprises: o The cash balance of Manalto Inc. at the beginning of the financial year (1 July 2014) o The transactions for the financial year for the 12 months of Manalto Inc. ended 30 June 2015 and from 31 March 2015 until
30 June 2015 for Manalto Limited o The cash balance of the combined Manalto Inc. and Manalto Limited at the end of the period (30 June 2015) Compliance with IFRS The consolidated financial statements and notes of Manalto Limited comply with International Financial Reporting Standards (IFRS) and interpretations adopted by the International Accounting Standards Board (IASB). Historical Cost Convention These financial statements have been prepared under the historical cost convention.
For
per
sona
l use
onl
y
31
Critical Accounting Estimates The preparation of financial statements in conformity with Australian Accounting Standards requires the use of certain critical accounting estimates. It also requires management to exercise its judgement in the process of applying the Group’s accounting policies. The areas involving a higher degree of judgement or complexity, or areas where assumptions and estimates are significant to the financial statements are disclosed in Note 2. (b) Going Concern The financial statements have been prepared on the going concern basis, which contemplates continuity of normal business activities and the realisation of assets and discharge of liabilities in the normal course of business. The Group has experienced operating losses of $3,184,553 and net cash outflows from operating activities of $3,139,195, and has net assets of $3,194,807. The Company will need to raise additional funds in the year ahead in order to meet all of its expenditure commitments. While the raising of the necessary funds is not assured, the directors are confident that in the short term they will be able to raise the additional capital required to continue the marketing and any required development of the product for release to the market. The Directors believe that it is reasonably foreseeable that the Company and consolidated entity will continue as a going concern and that it is appropriate to adopt the going concern basis in preparation of the financial report. (c) Principles of Consolidation The consolidated financial statements comprise the financial statements of Manalto Limited and its subsidiaries (the Group) as at 30 June 2016. During the year ended 30 June 2016, the Group established operations in South Africa, Ireland and the Netherlands and incorporated the following four entities: o Soshlr Ltd, in Ireland – a wholly owned subsidiary of Manalto Limited (Australia). o Soshlr Pty Ltd, in Australia – a wholly owned subsidiary of Soshlr Ltd (Ireland). o Soshlr South Africa (Pty) Ltd, in South Africa – a wholly owned subsidiary of Soshlr Ltd (Ireland). o Soshlr B.V., in the Netherlands – wholly owned subsidiary of Soshlr Ltd (Ireland). Refer to Note 26 for detailed information on controlled entities throughout the reporting period ended 30 June 2016. The comparative information for the 12 months ended 30 June 2015 presented in the consolidated financial statements represents the combination of Manalto, Inc. and Manalto Limited, using consistent accounting policies. In preparing the consolidated financial statements, all intercompany balances and transactions, income and expenses and profit and losses resulting from intra-group transactions, have been eliminated in full. Subsidiaries are fully consolidated from the date on which control is transferred to the Group and cease to be consolidated from the date on which control is transferred out of the group. (d) Segment Reporting The Group determines and presents operating segments based on the information that is internally provided to the Managing Director, who is the Group’s chief operating decision maker. An operating segment is a component of the Group that engages in business activities from which it may earn revenues and incur expenses, including revenues and expenses that relate to transactions with any of the Group’s other components. An operating segment’s operating results are regularly reviewed by the Group’s Board to make decisions about resources to be allocated to the segment and assess its performance, and for which discrete financial information is available. Segment results that are reported to the Board include revenue and expense items directly attributable to a segment as well as those that can be allocated on a reasonable basis. Assets and liabilities are not allocated to operating segments. Other unallocated items comprise mainly head office and Group-wide expenses, and income tax amounts. Under AASB 8 Operating Segments, segment information is presented using a 'management approach'; that is, segment information is provided on the same basis as information used for internal reporting purposes by the chief operating decision maker (executive management committee that makes strategic decisions). In the year ended 30 June 2016, the Group has commenced operations in South Africa, Ireland and the Netherlands, in addition to existing operations in Australia and the USA. As such, the Directors have opted to report its operations by geographical segments. Refer to Note 25 for further information. (e) Foreign Currency Translation The functional currency of the Manalto Limited is AU$, while the subsidiary in the United Stated has a functional currency of US$. Due to the operational head office of the group being based in the USA, and the vast majority of the transaction being in US$, the group has elected its presentation currency in US$. Foreign currency transactions are translated into the functional currency using the exchange rates ruling at the date of the
For
per
sona
l use
onl
y
32
transaction. Monetary assets and liabilities denominated in foreign currencies are retranslated at the rate of exchange ruling at the reporting date. Foreign exchange gains and losses resulting from settling foreign currency transactions, as well as from restating foreign currency denominated monetary assets and liabilities, are recognised in profit or loss, except for differences arising on the re-translation of available-for-sale equity instruments, a financial liability designated as a hedge of the net investment in a foreign operation, or qualifying cash flow hedges, which are recognised in other comprehensive income. Non-monetary items measured at fair value in a foreign currency are translated using the exchange rates at the date when fair value was determined. Foreign currency gains and losses are reported on a net basis.
(f) Financial Instruments i. Non-Derivative Financial Assets The Group initially recognises loans and receivables and deposits on the date that they are originated. All other financial assets (including assets designated at fair value through profit or loss) are recognised initially on the trade date at which the Group becomes a party to the contractual provisions of the instrument. The Group derecognises a financial asset when the contractual rights to the cash flows from the asset expire, or it transfers the rights to receive the contractual cash flows on the financial asset in a transaction in which substantially all the risks and rewards of ownership of the financial asset are transferred. Any interest in transferred financial assets that is created or retained by the Group is recognised as a separate asset or liability. Financial assets and liabilities are offset and the net amount presented in the Statement of Financial Position when, and only when, the Group has a legal right to offset the amounts and intends either to settle on a net basis or to realise the asset and settle the liability simultaneously. ii. Financial Assets at Fair Value through Profit or Loss At 30 June 2016, the Group does not hold any financial assets at fair value through profit or loss. iii. Held-to-Maturity Investments If the Group has positive intent and ability to hold debt securities to maturity, then they are classified as held-to-maturity. Held-to-maturity financial assets are recognised initially at fair value plus any directly attributable transaction costs. Held-to-maturity investments are subsequently measured at amortised cost using the effective interest method, less any impairment losses. iv. Loans and receivables Loans and receivables are financial assets with fixed or determinable payments that are not quoted in an active market. Such assets are recognised initially at fair value plus any directly attributable transaction costs. Subsequent to initial recognition, loans and receivables are measured at amortised cost using the effective interest method, less any impairment losses. Loans and receivables comprise trade and other receivables (refer to Note 1(o)). Cash and cash equivalents comprise cash balances and at-call deposits with original maturities of three months or less (refer to Note 1(p)). v. Available-For-Sale Financial Assets As at 30 June 2016, the Group does not hold any available-for-sale financial assets. Any such assets subsequently acquired would, subsequent to initial recognition, be measured at fair value and changes therein, other than impairment losses (see Note 1(f)(x) and foreign exchange gains and losses on available-for-sale monetary items (see Note 1(e)) would be recognised in other comprehensive income. When an investment is derecognised, the cumulative gain or loss in equity would be transferred to profit or loss.
vi. Non-Derivative Financial Liabilities The Group initially recognises debt securities issued and subordinated liabilities on the date that they are originated. All other financial liabilities (including liabilities designated at fair value through profit or loss) are recognised initially on the trade date at which the Group becomes a party to the contractual provisions of the instrument. The Group derecognises a financial liability when its contractual obligations are discharged or cancelled or expire. Financial assets and liabilities are offset and the net amount presented in the Statement of Financial Position when, and only when, the Group has a legal right to offset the amounts. The Group has (or has had during the reporting period) the following non-derivative financial liabilities: trade and other payables. These financial liabilities are recognised at fair value plus any directly attributable transaction costs. All borrowings are classified as current liabilities unless the Group has an unconditional right to defer settlement of the liability for at least 12 months after the balance sheet date. vii. Share Capital Ordinary shares are classified as equity. If the entity reacquires its own equity instruments, e.g. as the result of a share buy back, those instruments are deducted from equity and the associated shares are cancelled. No gain or loss is recognised in the profit or loss and the consideration paid including any directly attributable incremental costs (net of income taxes) is
For
per
sona
l use
onl
y
33
recognised directly in equity. viii. Derivative Financial Instruments As at 30 June 2016, the Group did not hold any derivative financial instruments. ix. Compound Financial Instruments Compound financial instruments consist of convertible notes that can be converted to share capital at the option of the holder. Upon conversion of the convertible notes, the number of shares to be issued does vary with changes in their fair value. The fair value of a liability portion of a convertible note is determined using a market rate of interest for an equivalent non-convertible note and stated on an amortised cost basis until conversion or maturity of the notes. The remainder of the proceeds is allocated to the conversion option and is shown as equity. Issue costs are apportioned between the liability and equity components based on the allocation of proceeds to the liability and equity components when the instruments are first recognised. Subsequent to initial recognition, the liability component of this compound financial instrument is measured at amortised cost using the effective interest method. Any equity component of this compound financial instrument is not remeasured subsequent to initial recognition. Interest, dividends, losses and gains relating to the financial liability are recognised in profit or loss. Distributions to the equity holders will be recognised against equity, net of any tax benefit. x. Impairment of Financial Assets A financial asset not carried at fair value through profit or loss is assessed at each reporting date to determine whether there is any objective evidence that it is impaired. A financial asset is considered to be impaired if objective evidence indicates that one or more events has occurred after the initial recognition of the asset, and that the loss event had a negative effect on the estimated future cash flows of that asset that can be estimated reliably. Objective evidence that financial assets (including equity securities) are impaired can include default or delinquency by a debtor, restructuring of an amount due to the Group on terms that the Group would not otherwise consider, indications that a debtor or issuer will enter bankruptcy, and the disappearance of an active market for a security. The Group considers evidence of impairment for receivables and held-to-maturity investment securities at both a specific asset and collective level. All individually significant receivables and held-to-maturity investment securities found not to be specifically impaired are then collectively assessed for any impairment that has been incurred but not yet identified. Receivables and held-to-maturity investment securities that are not individually significant are collectively assessed for impairment by grouping together receivables and held-to-maturity investment securities with similar risk characteristics. In assessing collective impairment, the Group uses historical trends of the probability of default, timing of recoveries, and the amount of loss incurred, adjusted for management’s judgement as to whether current economic and credit conditions are such that the actual losses are likely to be greater or less than suggested by historical trends. An impairment loss in respect of a financial asset measured at amortised cost is calculated as the difference between its carrying amount and the present value of the estimated future cash flows discounted at the original effective interest rate. Losses are recognised in profit or loss and reflected in an allowance account against receivables. If applicable, interest on an impaired asset continues to be recognised through the unwinding of the discount. When a subsequent event causes the amount of impairment loss to decrease, the decrease in impairment loss is reversed through profit or loss. (g) Property, plant and equipment Items of property, plant and equipment are initially recognised at acquisition cost or manufacturing cost, including any costs directly attributable to bringing the assets to the location and condition necessary for it to be capable of operating in the manner intended by the Group’s management. Items of property, plant and equipment are subsequently measured using the cost model, cost less subsequent depreciation and impairment losses. Depreciation is recognised on a straight-line basis to write down the cost less estimated residual value of equipment and other equipment. The following useful lives are applied: o IT equipment: 2-5 years o Other equipment: 3-12 years
In the case of leasehold property, expected useful lives are determined by reference to comparable owned assets or over the term of the lease, if shorter. Material residual value estimates and estimates of useful life are updated as required, but at least annually. Gains or losses arising on the disposal of property, plant and equipment are determined as the difference between the disposal proceeds and the carrying amount of the assets and are recognised in profit or loss within other income or other expenses.
For
per
sona
l use
onl
y
34
(h) Intangible Assets Goodwill Goodwill represents the excess of the cost of an acquisition over the fair value of the Group’s share of the net identifiable assets of the acquired subsidiary at the date of acquisition. Goodwill on acquisitions of subsidiaries is included in intangible assets. Goodwill is not amortised. Instead, goodwill is tested for impairment annually or more frequently if events or changes in circumstances indicate that it might be impaired, and is carried at cost less accumulated impairment losses. Gains and losses on the disposal of an entity include the carrying amount of goodwill relating to the entity sold. Impairment losses on goodwill cannot be reversed. Research & Development Expenditure on research activities, undertaken with the prospect of gaining new scientific or technical knowledge and understanding, is recognised in profit or loss when incurred. Development activities involve a plan or design for the production of new or substantially improved products and processes. Development expenditure is capitalised only if development costs can be measured reliably, the product or process is technically and commercially feasible, future economic benefits are probable, and the Group intends to and has sufficient resources to complete development and to use or sell the asset. The expenditure capitalised includes the cost of materials, direct labour and overhead costs that are directly attributable to preparing the asset for its intended use. Other development expenditure is recognised in profit or loss as incurred. (i) Impairment of Non-Financial Assets Goodwill and intangible assets that have an indefinite useful life are not subject to amortisation and are tested annually for impairment or more frequently if events or changes in circumstances indicate that they might be impaired. At each reporting date the Group assesses whether there is any indication that individual assets are impaired. Where impairment indicators exist, recoverable amount is determined and impairment losses are recognised in profit or loss where the asset's carrying value exceeds its recoverable amount. Recoverable amount is the higher of an asset's fair value less costs to sell and value in use. For the purpose of assessing value in use, the estimated future cash flows are discounted to their present value using a pre-tax discount rate that reflects current market assessments of the time value of money and the risks specific to the asset. An impairment loss is recognised for the amount by which the asset’s carrying amount exceeds its recoverable amount. The recoverable amount is the higher of an asset’s fair value less costs to sell and value in use. For the purposes of assessing impairment, assets are grouped together into the smallest group of assets that generates cash inflows from continuing use that are largely independent of the cash inflows from other assets or groups of assets (cash generating units). (j) Borrowings Borrowings are initially recognised at fair value, net of transaction costs incurred. Borrowings are subsequently measured at amortised cost. Fees paid in the establishment of loan facilities, which are not incremental costs relating to the draw-down of the facility, are recognised as prepayments and amortised on a straight-line basis over the term of the facility. All borrowings are classified as current liabilities unless the Group has an unconditional right to defer settlement of the liability for at least 12 months after the balance sheet date. Finance expenses comprise interest expense on borrowings including convertible notes, unwinding of the discount on provisions, changes in the fair value of financial assets at fair value through profit or loss, and impairment losses recognised on financial assets. In respect of borrowing costs relating to qualifying assets, the Group capitalises borrowing costs directly attributable to the acquisition, construction or production of a qualifying asset as part of the cost of that asset. (k) Provisions Provisions for legal claims, service warranties and make good obligations are recognised when the Group has a present legal or constructive obligation as a result of past events, it is probable that an outflow of resources will be required to settle the obligation and the amount has been reliably estimated. Provisions are not recognised for future operating losses. Where there are a number of similar obligations, the likelihood that an outflow will be required in settlement is determined by considering the class of obligations as a whole. A provision is recognised even if the likelihood of an outflow with respect to any one item included in the same class of obligations may be small. Provisions are measured at the present value of management’s best estimate of the expenditure required to settle the present obligation at the balance sheet date. The discount rate used to determine the present value reflects current market assessments of the time value of money and the risks specific to the liability. The increase in the provision due to the passage of time is recognised as a finance expense.
For
per
sona
l use
onl
y

35
(l) Employee Benefits Wages & Salaries, Annual Leave & Sick Leave Liabilities for wages and salaries, including non-monetary benefits, are recognised in other payables, and for annual leave and accumulating sick leave expected to be settled within 12 months in provisions, in respect of employees' services up to the reporting date and are measured at the amounts expected to be paid when the liabilities are settled, on an undiscounted basis. Long Service Leave The liability for long service leave is not recognised in the provision for employee benefits. All of the Group’s current employees are based in the United States of America (USA), South Africa and the Netherlands and no long service leave entitlements exist in these locations. Share-Based Payments Share-based compensation benefits are provided to employees via the employee share option scheme. Information relating to this scheme is set out in Note 20. The fair value of options granted under the employee share option scheme is recognised as an employee benefit expense with a corresponding increase in equity. The fair value is measured at grant date and recognised over the period during which the employees become unconditionally entitled to the options. The amount recognised as an expense is adjusted to reflect the number of option grants for which the related service and non-market vesting conditions are expected to be met, such that the amount ultimately recognised as an expense is based on the number of grants that do not meet the related service and non-market performance conditions at the vesting date. For grants with non-vesting conditions, the grant date fair value of the share-based payment is measured to reflect such conditions and there is no true-up for differences between expected and actual outcomes. The fair value of options at grant date is independently determined using the Black Scholes option pricing model or Binomial option pricing model that take into account the exercise price, the term of the option, the impact of dilution, the share price at grant date and expected price volatility of the underlying share, the expected dividend yield and the risk free interest rate for the term of the option. Profit Sharing & Bonus Plans The Group recognises a liability and an expense for bonuses and profit sharing based on a formula that takes into consideration the profit attributable to the Company’s shareholders after certain adjustments. The Group recognises a provision where contractually obliged or where there is a past practice that has created a constructive obligation. Defined Contribution Plans A defined contribution plan is a post-employment benefit plan under which an entity pays fixed contributions into a separate entity and will have no legal or constructive obligation to pay further amounts. Obligations for contributions to defined contribution pension plans are recognised as an employee benefit expense in profit or loss in the periods during which services are rendered by employees. The Company does not make contributions to a defined contribution plan on behalf of an employee. (m) Share-Based Payments The Group measures the goods and services received by equity-settled share-based payment transactions as an increase in equity, directly, at the fair value of the goods or services rendered, unless that fair value cannot be estimated reliably. If the Group cannot estimate reliably the fair value of the goods or services rendered, the Group shall measure their value, and the corresponding increase in equity, indirectly, by reference to the fair value of the equity instruments granted. If the equity instruments granted vest immediately, are unconditional and are not required to complete a specified period of service, the Group shall presume that services rendered by the counterparty as consideration for the equity instruments have been received. On grant date the Group recognises the services rendered in full, with a corresponding increase in equity. If the equity instruments granted do not vest until the counterparty completes a specified period of service, the Group shall presume that the services to be rendered by the counterparty as consideration for those equity instruments will be received in the future, during the vesting period. The Group accounts for these services as they are rendered by the counterparty during the vesting period, with a corresponding increase in equity. Share-based payment arrangements in which the Group receives goods or services as consideration for its own equity instruments are accounted for as equity-settled share-based payment transactions, regardless of how the equity instruments are obtained by the Group. For the Group's policy on share based payments to employees, please refer to Note 1(l). (n) Revenue Recognition Revenue is measured at the fair value of the consideration received or receivable. Amounts disclosed as revenue are net of returns, trade allowances, volume rebates, and duties and taxes paid. Revenue is recognised for the major business activities as follows: Revenue from license services provided are recognised over the subscription period and recognised in the period in which it is earned.
For
per
sona
l use
onl
y

36
Government grants are recognised at fair value where there is reasonable assurance that the grant will be received and all grant conditions will be met. Grants relating to expense items are recognised as income over the periods necessary to match the grant to the costs they are compensating. Grants relating to assets are reflected as a reduction in the cost of acquiring or developing the asset. Interest revenue is recognised as interest accrues using the effective interest method. The effective interest method uses the effective interest rate which is the rate that exactly discounts the estimated future cash receipts over the expected life of the financial asset. (o) Trade Receivables Trade receivables are recognised at fair value less provision for impairment. Trade receivables are generally due for settlement within 30 days. Collectability of trade receivables is reviewed on an ongoing basis. Debts which are known to be uncollectible are written off. A provision for impairment of trade receivables is established when there is objective evidence that the Group will not be able to collect all amounts due according to the original terms of the receivables. Significant financial difficulties of the debtor, probability that the debtor will enter bankruptcy or financial reorganisation, and default or delinquency in payments (more than 30 days overdue) are considered indicators that the trade receivable is impaired. The amount of the provision is the difference between the asset’s carrying amount and the present value of estimated future cash flows, discounted at the original effective interest rate. (p) Cash and Cash Equivalents Cash flows relating to short term receivables are not discounted if the effect of discounting is immaterial. The amount of the provision is recognised in profit or loss in other expenses. For statement of cash flows presentation purposes, cash and cash equivalents includes cash on hand, deposits held at call with financial institutions, other short term, highly liquid investments with original maturities of three months or less that are readily convertible to known amounts of cash and which are subject to an insignificant risk of changes in value, and bank overdrafts. Bank overdrafts are shown within borrowings in current liabilities on the balance sheet. (q) Trade and Other Payables These amounts represent liabilities for goods and services provided to the Group prior to the end of financial year which are unpaid. The amounts are unsecured and are usually paid within 30 days of recognition. (r) Goods & Services Tax (GST) Revenues, expenses and assets are recognised net of the amount of associated GST, unless the GST incurred is not recoverable from the taxation authority. In this case it is recognised as part of the cost of acquisition of the asset or as part of the expense. Receivables and payables are stated inclusive of the amount of GST receivable or payable. The net amount of GST recoverable from, or payable to, the taxation authority is included with other receivables or payables in the balance sheet. Cash flows are presented on a gross basis. The GST components of cash flows arising from investing or financing activities which are recoverable from, or payable to the taxation authority, are presented as operating cash flow. (s) Earnings per Share Basic Earnings Per Share Basic earnings per share is calculated by dividing the profit or loss attributable to ordinary shareholders of the Company by the weighted average number of ordinary shares outstanding during the financial year, adjusted for bonus elements in ordinary shares issued during the year. Diluted Earnings Per Share Diluted earnings per share adjusts the figures used in the determination of basic earnings per share to take into account the after income tax effect of interest and other financing costs associated with dilutive potential ordinary shares and the weighted average number of shares assumed to have been issued for no consideration in relation to dilutive potential ordinary shares. (t) Income Tax The income tax expense or revenue for the period is the tax payable on the current period’s taxable income based on the national income tax rate for each jurisdiction adjusted by changes in deferred tax assets and liabilities attributable to temporary differences and to unused tax losses. Deferred income tax is provided in full, using the liability method, on temporary differences arising between the tax bases of assets and liabilities and their carrying amounts in the consolidated financial statements. However, the deferred income tax is not accounted for if it arises from initial recognition of an asset or liability in a transaction other than a business combination that at the time of the transaction affects neither accounting nor taxable profit or loss. Deferred income tax is determined using tax rates (and laws) that have been enacted or substantially enacted by the balance sheet date and are expected to apply when the related deferred income tax asset is realised or the deferred income tax liability is settled.
For
per
sona
l use
onl
y

37
Deferred tax assets are recognised for deductible temporary differences and unused tax losses only if it is probable that future taxable amounts will be available to utilise those temporary differences and losses. Deferred tax liabilities and assets are not recognised for temporary differences between the carrying amount and tax bases of investments in controlled entities where the parent entity is able to control the timing of the reversal of the temporary differences and it is probable that the differences will not reverse in the foreseeable future. Deferred tax assets and liabilities are offset when there is a legally enforceable right to offset current tax assets and liabilities and when the deferred tax balances relate to the same taxation authority. Current tax assets and tax liabilities are offset where the entity has a legally enforceable right to offset and intends either to settle on a net basis, or to realise the asset and settle the liability simultaneously. Current and deferred tax balances attributable to amounts recognised directly in equity are also recognised directly in equity. From time to time, the Group receives Research and Development grant from the government. This amount is reported as a credit in the income tax expense account. (u) Leases At the inception of an arrangement, the Group determines whether such an arrangement is or contains a lease. A specific asset is the subject of a lease if fulfilment of the arrangement is dependent on the use of that specified asset. An arrangement conveys the right to use the asset if the arrangement conveys to the Group the right to control the use of the underlying asset. At inception or upon reassessment of the arrangement, the Group separates payments and other consideration required by such an arrangement into those for the lease and those for other elements on the basis of their relative fair values. If the Group concludes for a finance lease that it is impracticable to separate the payments reliably, an asset and a liability are recognised at an amount equal to the fair value of the underlying asset. Subsequently the liability is reduced as payments are made and an imputed finance charge on the liability is recognised using the Group’s incremental borrowing rate. Leases of fixed assets where substantially all the risks and benefits incidental to the ownership of the asset, but not the legal ownership that are transferred to entities in the Group are classified as finance leases. Lease payments are allocated between the reduction of the lease liability and the lease interest expense for the period. Leased assets are depreciated on a diminishing value basis over the shorter of their estimated useful lives or the lease term. Lease payments for operating leases, where substantially all of the risks and benefits remain with the lessor, are charged as expenses in the periods in which they are incurred. (v) New accounting standards issued but not yet effective The following new standards, amendments to Standards and Interpretations which have been recently issued or amended but are not yet effective have not been applied to the financial statements for the current period. None of these are expected to have a significant effect on the entity’s financial position or performance. AASB 9 – Financial Instruments AASB 9 replaces the existing guidance in AASB 139 – Financial Instruments: Recognition and Measurement. AASB 9 includes revised guidance on the classification and measurement of financial instruments, including a new expected credit loss model for calculating impairment on financial assets, and the new general hedge accounting treatment. It also carries forward the guidance on recognition and derecognition of financial instruments from AASB 139. AASB 9 is effective for annual reporting periods beginning on or after 1January 2018, with early adoption permitted. The Group does not plan to adopt this standard early and is assessing the potential impact on its consolidated financial statements resulting from the application of AASB 9. AASB 15 – Revenue from Contracts with Customers AASB 15 establishes a comprehensive framework for determining whether, how much, and when revenue is recognised. It replaces existing revenue recognition guidance, including AASB 118 – Revenue and AASB 111 – Construction Contracts. AASB 15 is effective for annual reporting periods beginning on or after 1 January 2018, with early adoption permitted. The Group is assessing the potential impact on its consolidated financial statements resulting from the application of AASB 15. AASB 16 – Leases AASB 16 Leases was issued and introduced changes to lessee accounting. It requires recognition of lease liabilities and assets other than short-term leases of low-value assets on the statement of financial position. This will replace the operating/financial lease distinction and accounting requirements prescribed in AASB 117 Leases. AASB 16 will become mandatory for the Group’s 30 June 2020 financial statements. The Group Is assessing the potential impact on its consolidated financial statements resulting from the application of AASB 16.
For
per
sona
l use
onl
y

38
(w) Critical Accounting Estimates & Judgements Estimates and judgements are continually evaluated and are based on historical experience and other factors, including expectations of future events that may have a financial impact on the entity and that are believed to be reasonable under the circumstances. The Group makes estimates and assumptions concerning the future. The resulting accounting estimates will, by definition, seldom equal the related actual results. The estimates and assumptions that have a significant risk of causing a material adjustment to the carrying amounts of assets and liabilities within the next financial year are discussed below. Refer also to Note 1(b) in relation to the adoption of the ‘going concern’ basis of accounting in the financial statements. (x) Income Taxes The Group is subject to income taxes in Australia, United States of America, South Africa, Ireland and the Netherlands. The Group has not recognised deferred tax assets relating to carried forward tax losses to the extent there are sufficient taxable temporary differences (deferred tax liabilities) relating to the same taxation authority and the same subsidiary against which the unused tax losses can be utilised. However, utilisation of the tax losses also depends on the ability of the entity to satisfy certain tests at the time the losses are recouped. Refer to Note 6 for further detail.
2. Financial Risk Management Overview The Company and the Group have exposure to the following risks from their use of financial instruments: o credit risk; o liquidity risk; and, o market risk. This note presents information about the Company’s and Group’s exposure to each of the above risks, their objectives, policies and processes for measuring and managing risk, and the management of capital. Further quantitative disclosures are included throughout this financial report. The Board of Directors has overall responsibility for the establishment and oversight of the risk management framework. Risk management policies are established to identify and analyse the risks affecting the Company and Group, to set appropriate risk limits and controls, and to monitor risks and adherence to limits. Risk management policies and systems are reviewed regularly to reflect changes in market conditions and the Company’s and Group’s activities. The Company and Group, through training and management standards and procedures appropriate for a small organisation, aim to develop a disciplined and constructive control environment in which all employees understand their roles and obligations. The Group’s Board oversees how management monitors compliance with the Company’s and Group’s risk management policies and procedures and reviews the adequacy of the risk management framework in relation to the risks faced by the Company and Group. Being a relatively small organisation, there is no formal Internal Audit function. Credit Risk Credit risk is the risk of financial loss to the Group if a customer or counterparty to a financial instrument fails to meet its contractual obligations, and arises principally from the Group’s receivables from customers. Exposure to Credit Risk The carrying amount of the Group’s financial assets represents the maximum credit exposure. The Group’s maximum exposure to credit risk at the reporting date was: Carrying Amount Note 2016
$ 2015
$ Trade & Other Receivables 8 132,583 82,073 Total 132,583 82,073
The Group’s maximum exposure to credit risk for Trade Receivables at the reporting date was $132,583 (2015: $82,073). Trade and Other Receivables The Group has a credit policy under which potential new customers are analysed individually for creditworthiness before payment terms are offered. As the Group’s revenue has been derived principally from arrangements under pre-agreed contractual terms, credit limits are not considered relevant. If payment is not received within agreed credit terms, services or availability of licensed technology may be suspended pending clearance of the outstanding balance. More than 75% of the Group’s operating revenue is from customers that have been transacting with the Group for 12 months, and losses have rarely if ever been experienced. In monitoring credit risk, each customer is assessed individually rather than grouping customers according to credit characteristics, because the Group deals with only a small number of customers. The
For
per
sona
l use
onl
y
39
Board of Directors reviews and approves the terms of new service contracts entered into with customers, including credit terms granted. Guarantees Neither the Company nor the Group has provided financial guarantees to any third party. Liquidity Risk Liquidity risk is the risk that the Group will encounter difficulty in meeting the obligations associated with its financial liabilities that are settled by delivering cash or another financial asset. The Group’s approach to managing liquidity is to ensure, as far as possible, that it will always have sufficient liquidity to meet its liabilities when due, under both normal and stressed conditions, without incurring unacceptable losses or risking damage to the Group’s reputation. The following are the contractual maturities of financial liabilities, including estimated interest payments, for the Group: 30 June 2016 Carrying
Amount $
Contract C/Flows
$
6 months or less
$
6 -12 months
$
1 – 2 years
$
2 – 5 years
$
More than 5 years
$ Non-Derivative Financial Liabilities
Trade and other payables 127,586 127,586 127,586 - - - - Loan - - - - - - - Total 127,586 127,586 127,586 - - - -
30 June 2015 Carrying
Amount $
Contract C/Flows
$
6 months or less
$
6 -12 months
$
1 – 2 years
$
2 – 5 years
$
More than 5 years
$ Non-Derivative Financial Liabilities
Trade and other payables 96,030 96,030 96,030 - - - - Loan - - - - - - - Total 96,030 96,030 96,030 - - - -
Market Risk Market risk is the risk that changes in market prices, such as foreign exchange rates, interest rates, and equity prices will affect the Group’s income or the value of its holdings of financial instruments. The objective of market risk management is to manage and control market risk exposures within acceptable parameters, while optimising the return. The Group is exposed to material levels of market risk. The Group has exposure to currency risk in relation to purchases that are denominated in a currency other than United States dollars. However, such purchases represent a relatively small proportion of total Group expenses and entry into hedging activity in relation to such purchases is not considered warranted on a cost-benefit analysis. The Group is exposed to currency risk associated with raising capital in Australia and utilising this capital to fund operational expenditure in the USA, South Africa and Europe. The cost of hedging this position is extremely high as the exact timing and amounts associated with the capital raising activities is not certain. As such the Directors do not consider this a cost effective measure to manage currency risk, and rather seek alternative measure to minimise the currency exchange losses. The Group also has only a minor exposure to interest rate risk. Interest on credit card facilities is at a variable interest rate. Interest expense on these facilities is minor. Exposure to Currency Risk The Group’s exposure (shown as Asset/(Liability) and Revenue/(Expense)) to foreign currency risk at reporting date was as follows, based on notional amounts (all amounts are shown as USD equivalents, with column headings denoting the invoice-denominated currency): 30 June 2016 EUR ZAR GBP AUD Cash and cash equivalents - - - 719,853 Trade and other payables (21,023) (5,526) - (63,432) Trade and other receivables 2,452 32,122 - 23,523 Gross Balance Sheet exposure (18,571) 26,596 - 679,944 Profit or (loss) (94,949) (174,062) - (723,676)
For
per
sona
l use
onl
y
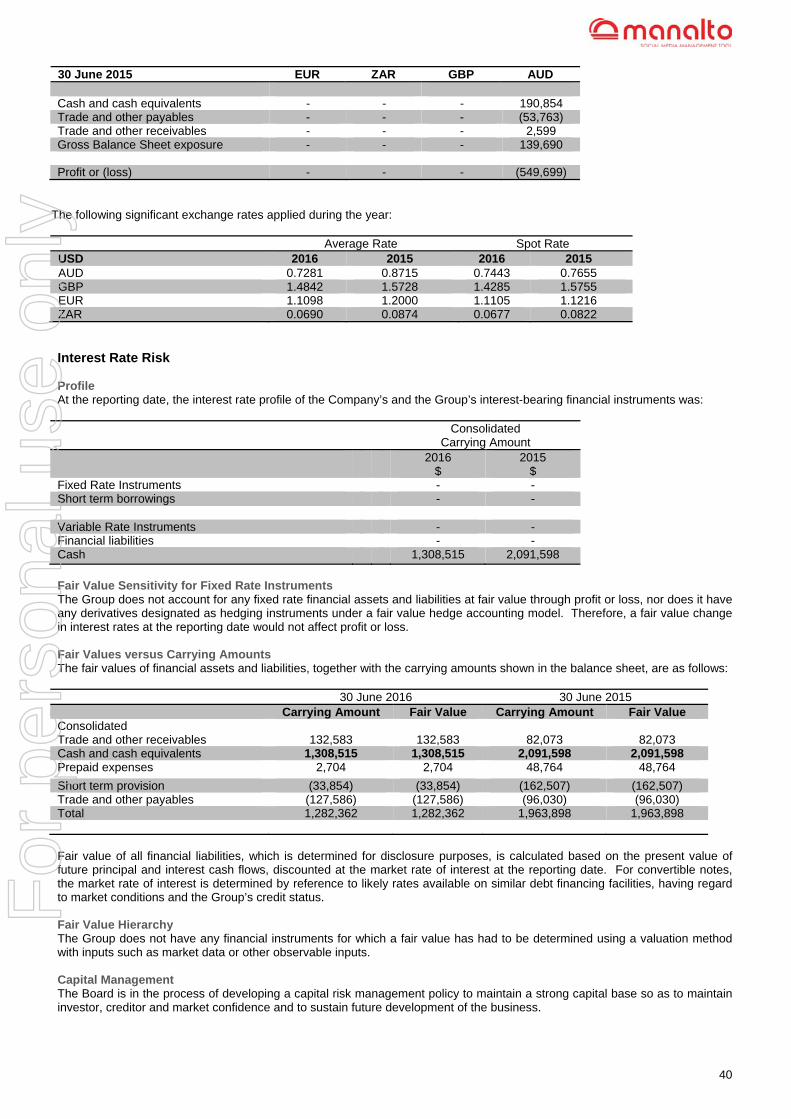
40
30 June 2015 EUR ZAR GBP AUD Cash and cash equivalents - - - 190,854 Trade and other payables - - - (53,763) Trade and other receivables - - - 2,599 Gross Balance Sheet exposure - - - 139,690 Profit or (loss) - - - (549,699)
The following significant exchange rates applied during the year: Average Rate Spot Rate USD 2016 2015 2016 2015 AUD 0.7281 0.8715 0.7443 0.7655 GBP 1.4842 1.5728 1.4285 1.5755 EUR 1.1098 1.2000 1.1105 1.1216 ZAR 0.0690 0.0874 0.0677 0.0822 Interest Rate Risk Profile At the reporting date, the interest rate profile of the Company’s and the Group’s interest-bearing financial instruments was: Consolidated
Carrying Amount 2016
$ 2015
$ Fixed Rate Instruments - - Short term borrowings - - Variable Rate Instruments - - Financial liabilities - - Cash 1,308,515 2,091,598
Fair Value Sensitivity for Fixed Rate Instruments The Group does not account for any fixed rate financial assets and liabilities at fair value through profit or loss, nor does it have any derivatives designated as hedging instruments under a fair value hedge accounting model. Therefore, a fair value change in interest rates at the reporting date would not affect profit or loss. Fair Values versus Carrying Amounts The fair values of financial assets and liabilities, together with the carrying amounts shown in the balance sheet, are as follows: 30 June 2016 30 June 2015 Carrying Amount Fair Value Carrying Amount Fair Value Consolidated Trade and other receivables
132,583
132,583
82,073
82,073
Cash and cash equivalents 1,308,515 1,308,515 2,091,598 2,091,598 Prepaid expenses 2,704 2,704 48,764 48,764
Short term provision (33,854) (33,854) (162,507) (162,507) Trade and other payables (127,586) (127,586) (96,030) (96,030) Total 1,282,362 1,282,362 1,963,898 1,963,898 Fair value of all financial liabilities, which is determined for disclosure purposes, is calculated based on the present value of future principal and interest cash flows, discounted at the market rate of interest at the reporting date. For convertible notes, the market rate of interest is determined by reference to likely rates available on similar debt financing facilities, having regard to market conditions and the Group’s credit status. Fair Value Hierarchy The Group does not have any financial instruments for which a fair value has had to be determined using a valuation method with inputs such as market data or other observable inputs. Capital Management The Board is in the process of developing a capital risk management policy to maintain a strong capital base so as to maintain investor, creditor and market confidence and to sustain future development of the business.
For
per
sona
l use
onl
y
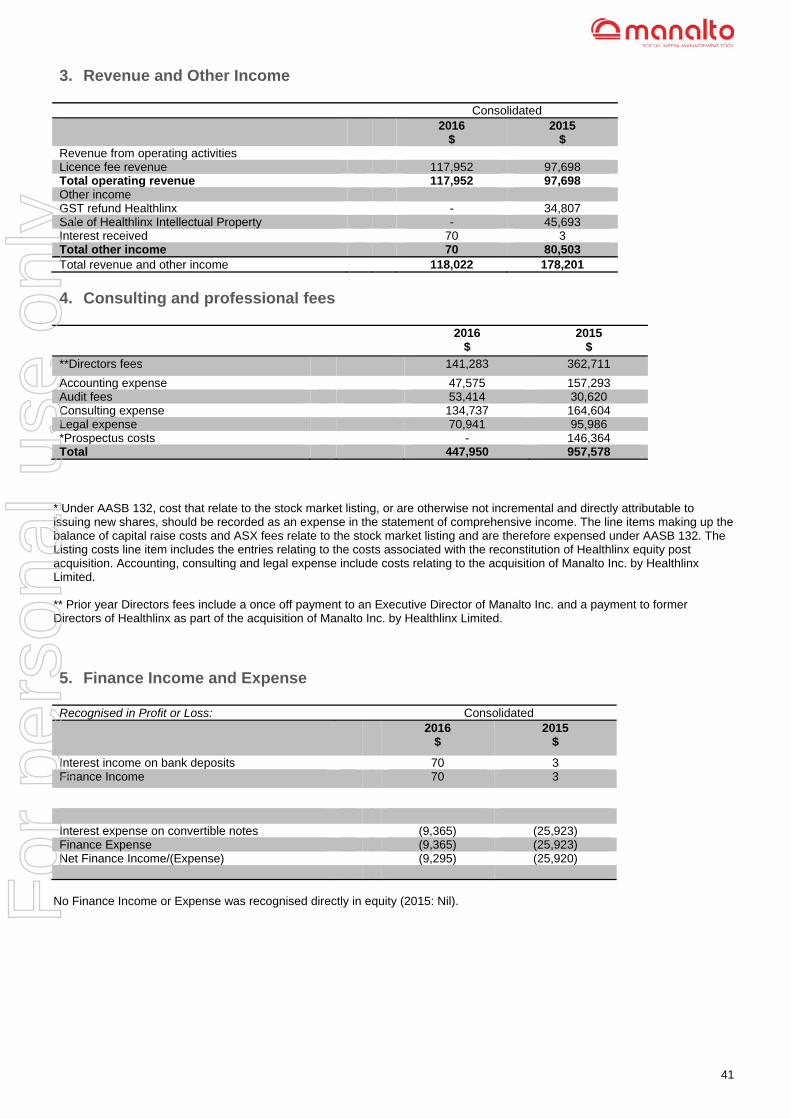
41
3. Revenue and Other Income Consolidated 2016
$ 2015
$ Revenue from operating activities Licence fee revenue 117,952 97,698 Total operating revenue 117,952 97,698 Other income GST refund Healthlinx - 34,807 Sale of Healthlinx Intellectual Property - 45,693 Interest received 70 3 Total other income 70 80,503 Total revenue and other income 118,022 178,201
4. Consulting and professional fees 2016
$ 2015
$
**Directors fees 141,283 362,711
Accounting expense 47,575 157,293 Audit fees 53,414 30,620 Consulting expense 134,737 164,604 Legal expense 70,941 95,986 *Prospectus costs - 146,364 Total 447,950 957,578
* Under AASB 132, cost that relate to the stock market listing, or are otherwise not incremental and directly attributable to issuing new shares, should be recorded as an expense in the statement of comprehensive income. The line items making up the balance of capital raise costs and ASX fees relate to the stock market listing and are therefore expensed under AASB 132. The Listing costs line item includes the entries relating to the costs associated with the reconstitution of Healthlinx equity post acquisition. Accounting, consulting and legal expense include costs relating to the acquisition of Manalto Inc. by Healthlinx Limited. ** Prior year Directors fees include a once off payment to an Executive Director of Manalto Inc. and a payment to former Directors of Healthlinx as part of the acquisition of Manalto Inc. by Healthlinx Limited.
5. Finance Income and Expense Recognised in Profit or Loss: Consolidated 2016
$ 2015
$
Interest income on bank deposits 70 3 Finance Income 70 3
Interest expense on convertible notes (9,365) (25,923) Finance Expense (9,365) (25,923) Net Finance Income/(Expense) (9,295) (25,920)
No Finance Income or Expense was recognised directly in equity (2015: Nil). F
or p
erso
nal u
se o
nly

42
6. Taxation The prima facie tax on loss from ordinary activities before income tax is reconciled to the income tax as follows: 2015
$ 2015
$ Prima facie tax benefit on loss from ordinary activities before income tax
- Australia (Income tax rate: 28.5%[1]) 181,720 601,420 - United States (35%) 862,922 539,225 - South Africa (28%) 48,737 - - Ireland (13%) 6,598 - - Netherlands (25%) 10,541 - Consolidated entity 1,110,518 1,140,645 Adjusting for the tax effect of: Amortisation of intangible assets 20,248 8,310 Permanent differences (14,406) - Deferred tax asset of tax loss and temporary differences not brought to account
(928,798) (974,233)
Income tax benefit attributable to entity 187,562 174,722 (1) In the 2016/17 Budget, the Australian Government announced a reduction in corporate tax rate for entities with
aggregate turnover less than $A2 million. As it is likely that the aggregate turnover will initially be $A2 million or less for Australian operations when absorbing the losses recognised, income tax rate of 28.5% has been applied when assessing deferred tax benefits.
The Directors have recognised a deferred tax asset representing the tax benefit of the assessed loss associated with the operations in Australia, namely a tax benefit of $187,562. The Directors anticipate that assessed losses will be utilised against future taxable profits in Australia, however, the tax losses incurred during the year for the other jurisdictions have not been recognised until a later date when the Directors believe it is probable they will be utilised.
Deferred tax assets Deferred tax assets brought to account are set out below. Consolidated 2016
$ 2015
$ Opening Balance 1 July 174,722 - Deferred tax assets recognised 187,562 174,722 Total 362,284 174,722 This benefit for tax losses will only be obtained if: The Company derives future assessable income of a nature and an amount sufficient to enable the benefit from the deductions for the losses to be realised; the Company complies with the conditions for deductibility imposed by the tax legislation; and no changes in tax legislation adversely affect the Company in realising the benefit from deductions for the losses. In addition, the availability of tax losses is subject to the Group successfully establishing deductibility, and in particular, satisfying either the continuity of ownership test or the same business test at the future time at which losses are sought to be recouped.
7. Cash & Cash Equivalents
Consolidated 2016
$ 2015
$ Cash on hand - - Cash at bank 1,308,515 2,091,598 Short-term bank deposits - - Total 1,308,515 2,091,598
Cash at bank in 2016 is non-interest bearing (2015: non-interest bearing).
For
per
sona
l use
onl
y

43
8. Trade & Other Receivables
Consolidated 2016
$ 2015
$ CURRENT Trade receivables 58,957 62,972 Allowance for doubtful debts - - 58,957 62,972 Goods and services tax (receivable) 22,884 1,727 Deposits 32,394 16,169 Other receivables 18,348 1,205
Total 132,583 82,073 Prepayments 2,705 48,764
Total 2,705 48,764
Impaired receivables At 30 June 2016 there were no bad or doubtful debts. Effective interest rates and credit risk There is no effective interest rate on receivables.
9. Intangible Assets Consolidated 2016
$ 2015
$
Development Expenditure Capitalised development costs Cost 1,469,993 593,587 Accumulated amortisation and impairment - - Net carrying value 1,469,993 593,587 Total Intangibles 1,469,993 593,587 (a) Reconciliation Detailed Table
2016
$ 2015
$
Capitalised Development Costs
Opening balance 1 July 593,587 114,077
Additions 876,406 479,510
Impairment charges - -
Amortisation - -
Net carrying value 1,469,993 593,587
Total Intangibles 1,469,993 593,587
During the year ended 30 June 2016, $876,406 (2015: $479,510) was spent on the acquisition, development, maintenance and enhancement of technical knowledge for the design and implementation of new or substantially improved materials, devices, and products. The Directors believe the criteria for recognition and measurement of the intangible asset have been are met and are outlined below: o Identifiable – the proposed asset is separable together with an identifiable asset, namely a Manalto social media
management software, i.e. a Manalto System encompasses the technical knowledge that can be sold, transferred, licensed, rented or exchanged;
o Manalto has engaged exclusively in development expenditure throughout the financial year. o Technical programming staff have been focused on the development and enhancement of the Manalto social media
management tool, and their costs are identifiable and separable, both for the current and prior financial year.
For
per
sona
l use
onl
y

44
o Control – Manalto Limited controls the proposed asset as it has the power to obtain the future economic benefits through the application of the technical knowledge, which is protected by a legal duty on employees to maintain confidentiality.
o Future Economic Benefits – use of the proposed asset will provide future economic benefits through revenue in sales of licenses attached to the Manalto system. Revenue associated with the product is being generated during the live beta testing stage of the software development process.
o Cost – the proposed asset cost can be measured reliably as the cost is comprised of technical development staff costs directly attributable to the preparation of the asset for its intended use. These costs are in the form of employees on the payroll in the current year, and employees and contractors in the prior year.
Understanding the AASB ruling guidelines for capitalising intangible assets, the Group fully expects to continue to develop and build on new and existing features of the Enterprise and Sóshlr platforms beyond the commercialisation stage and thus expects to continue to grow the internally-generated intangible asset balance in future reporting periods. Intangible assets not yet in use are systematically tested annually for impairment. During the year ended 30 June 2016, impairment analysis was performed and it was deemed that intangible assets are not considered impaired.
10. Property, plant and equipment Consolidated
Leasehold Improvements
$
Office equipment $
Total $
Year ended 30 June 2016 Gross carrying amount
Opening balance 1 July 2015 - 51,839 51,839 Additions 13,185 45,583 58,768 Balance at 30 June 2016 13,185 97,422 110,607 Accumulated depreciation and amortisation
Opening balance 1 July 2015 - (6,401) (6,401) Depreciation and amortisation expense (2,627) (21,412) (24,039) Balance at 30 June 2016 (2,627) (27,813) (30,440) Carrying amount at 30 June 2016 10,558 69,609 80,167
Year ended 30 June 2015 Gross carrying amount
Opening balance 1 July 2014 - 8,092 8,092 Additions - 43,747 43,747 Balance at 30 June 2015 - 51,839 51,839 Accumulated depreciation and amortisation
Opening balance 1 July 2014 - (853) (853) Depreciation and amortisation expense - (5,548) (5,548) Balance at 30 June 2015 - (6,401) (6,401) Carrying amount at 30 June 2015 - 45,438 45,438
11. Trade & Other Payables Consolidated 2016
$ 2015
$ CURRENT Unsecured Liabilities Provision for audit fee 30,886 30,620 Trade payables and accrued expenses 96,700 65,410 Total 127,586 96,030 Payables are non-interest bearing and are payable within one year.
For
per
sona
l use
onl
y

45
12. Short-Term Provisions
13. Contributed Equity
*Share-based payment relates to the cost of advisor options associated with the 11 March 2015 reverse acquisition recognised as an offset of the shares issued for cash. Year ended 30 June 2016: o In December 2015, 24,500,000 shares were issued under the first tranche of a placement of 44,214,286 shares at an issue
price of $A0.07 ($US0.051). The weighted average share price at the date of exercise was $A0.079 ($US0.058). o On 17 February 2016, 3,314,288 shares were issued under the share purchase plan at an issue price of $A0.07
($US0.050). The weighted average share price at the date of exercise was $A0.06 ($US0.043) o On 8 March 2016, 11,317,144 shares were issued under Part A of the second tranche of the placement of 44,214,286
shares at an issue price of $A0.07 ($US0.052). The weighted average share price at the date of exercise was $A0.06 ($US0.045).
o On 28 April 2016, 8,397,143 shares were issued under Part B of the second tranche of the placement of 44,214,286
shares at an issue price of $A0.07 ($US0.053). The weighted average share price at the date of exercise was $A0.065 ($US0.050).
o On 27 May 2016, 20,199,996 shares were issued under the placement at an issue price of $A0.07 ($US0.050). The
weighted average share price at the date of exercise was $A0.07 ($US0.050). Year ended 30 June 2015: On 11 March 2015 Healthlinx acquired 100% of Manalto, and the combined entity was renamed Manalto Limited. This is treated as a reverse acquisition because the substance of the transaction is such that the pre-existing shareholders of Manalto obtained substantial control of Healthlinx. The acquisition of Manalto, Inc. by Healthlinx Limited is accounted for under AASB 2 Share Based Payments whereby the non-cash consideration in a reverse acquisition represents a deemed issue of shares by the legal acquiree (Manalto), equivalent to the current shareholder interest in Healthlinx post the acquisition. The excess of the assessed value of the share based payment over the net assets has been expensed to the income statement as a listing fee. Under AASB 132, incremental costs that are directly attributable to issuing new shares should be deducted from equity. The
Consolidated 2016
$ 2015
$ Employee entitlements 33,854 162,507 Total 33,854 162,507
Consolidated 2016
No. of shares 2015
No. of shares Opening contributed equity 98,054,590 27,771,476 Consolidated of Healthlinx shares pre-acquisition - (22,216,884) Shares issued during the year for cash 67,728,571 30,000,000 Shares issued to Manalto, Inc. shareholders on reverse acquisition
- 62,499,998
Total 165,783,161 98,054,590
Reconciliation: Consolidated 2016
$ 2015
$ Balance at 1 July 7,404,106 1,043,751 Shares issued during the year for cash 3,447,423 4,590,653 Share issue expenses (214,758) (504,816) Realised foreign currency gain/(loss) 14,519 - Net cash flow from share issue 3,247,184 4,085,837 Conversion of short term borrowing to equity - 1,547,429 Deemed consideration on acquisition of Manalto Limited - 882,103 *Share based payment - (155,014) Contributions of equity 3,247,184 6,360,355 Total 10,651,290 7,404,106
For
per
sona
l use
onl
y

46
share issue expense relates to costs directly attributable to the issuing of new shares, costs associated with the listing are detailed in note 2 and have been expensed. Ordinary Shares Ordinary shares entitle the holder to participate in dividends and the proceeds on winding up of the Company in proportion to the number of and amounts paid on the shares held. At shareholder meetings, each ordinary share is entitled to one vote when a poll is called; otherwise each shareholder has one vote on a show of hands. All ordinary shares issued are fully paid. Unlisted Options Unlisted Options at 30 June 2016 10,252,000
Total options issued during the period 23,907,062 Total options lapsed / forfeited during the period (3,452,000) Less options exercised during the period - Total listed options at 30 June 2016 30,707,062
Information relating to unlisted options, including those issued pursuant to the Manalto Limited Employee Share Option Plan, showing details of options issued, exercised and lapsed during the financial year and options outstanding at the end of the financial year, is set out on the following table. Unlisted Options at 30 June 2016
Grant Date Date of Expiry Exercise Price
Number Under Option
11 March 2015 11 March 2018 $0.19[1] 2,250,000[5]
11 March 2015 11 March 2020 $0.19[1] 4,550,000[5]
15 December 2015 15 December 2020 $0.23[2] 1,900,000[5]
29 February 2016 29 February 2020 $0.14[3] 17,719,562[6]
29 February 2016 29 February 2020 $0.18[4] 4,287,500[6]
Total 30,707,062
(1) The options were issued at a price of AU$0.25 (US$ 0.19) on Grant Date. (2) The options were issued at a price of AU$0.30 (US$ 0.23) on Grant Date. (3) The options were issued at a price of AU$0.20 (US$ 0.14) on Grant Date. (4) The options were issued at a price of AU$0.25 (US$ 0.18) on Grant Date. (5) The Black-Scholes valuation model has been used to value the options as of the 30 June 2016. Refer to Note 20 (a)
for details associated with the valuation. (6) The Binomial valuation model has been used to value the options as of the 30 June 2016. Refer to Note 20 (a) for
details associated with the valuation. No option holder has any right under the options to participate in any other share issue of the Company or any other entity.
14. Accumulated Losses 2016
$ 2015
$ Accumulated losses at the beginning of the financial year
4,773,540 1,171,354
Net loss for the period 3,184,553 3,602,186 Accumulated losses at the end of the financial year 7,958,093 4,773,540 Note: Included in the net loss for the 2015 reporting period is a one-off non cash listing expense of $1,219,401 on acquisition of Manalto Limited by Manalto Inc. This represents the deemed consideration $882,103 and the net liability $337,298 of Manalto Limited on acquisition date.
15. Foreign Currency Translation Reserve 2016
$ 2015
$ Balance at 1 July (147,607) 9,071 Currency gain/(loss) 44,196 (156,678) Balance at 30 June (103,411) (147,607)
For
per
sona
l use
onl
y

47
16. Share Based Payment Acquisition During the year ended 30 June 2015, Manalto Limited (formerly Healthlinx Limited) completed the legal acquisition of Manalto Inc. Under the Australian Accounting Standards Manalto Inc. was deemed to be the accounting acquirer in this transaction. The acquisition has been accounted for as a share-based payment by which Manalto Inc. acquires the net assets and listing status of Manalto Limited. The purchase consideration was the issue of 62,500,000 shares in Manalto Limited (legal parent) to the shareholders of Manalto Inc. and is deemed to have a value of $882,103 determined as follows:
(a) Deemed Consideration
$ Notional share price issued under prospectus 0.153 Deemed consideration based on 5,554,250 shares 882,103
(b) Deemed Manalto Limited Share Capital
$
Historical issued capital balance as at 30 June 2014 26,322,579 Issue of shares from capital raise 4,593,000 less capital raising costs (504,817) Elimination of Manalto Limited issued capital (30,410,762) Deemed consideration as per note 16 (a) 882,103 Total Manalto Limited share capital on completion of transaction 882,103
(c) Manalto Limited Reserves
$
Historical balance as at 30 June 2014 483,935
Elimination of Manalto Limited reserves on completion (483,935)
Total Manalto Limited reserves on completion of transaction -
(d) Manalto Limited retained losses pre-completion
$
Historical balance as at 30 June 2014 27,073,337
Losses from 1 July 2014 to 11 March 2014 2,298
Elimination of Manalto limited pre completion retained losses (27,075,635)
Deemed consideration 882,103
Plus Net liability of Manalto Limited pre-acquisition 337,298
Total Manalto Limited losses on completion of transaction (listing expense) 1,219,401
(e) Assets and liabilities acquired
$
Cash & Cash Equivalents 31,124
Investments in subsidiaries 3
Intangible Assets 77
Total Assets 31,204
Trade & Other Payables (133,137)
Short-Term Provisions (75,970)
Long-Term Borrowings (159,395)
Total Liabilities (368,502)
Total Manalto Limited losses on completion of transaction (listing expense) (337,298)
For
per
sona
l use
onl
y
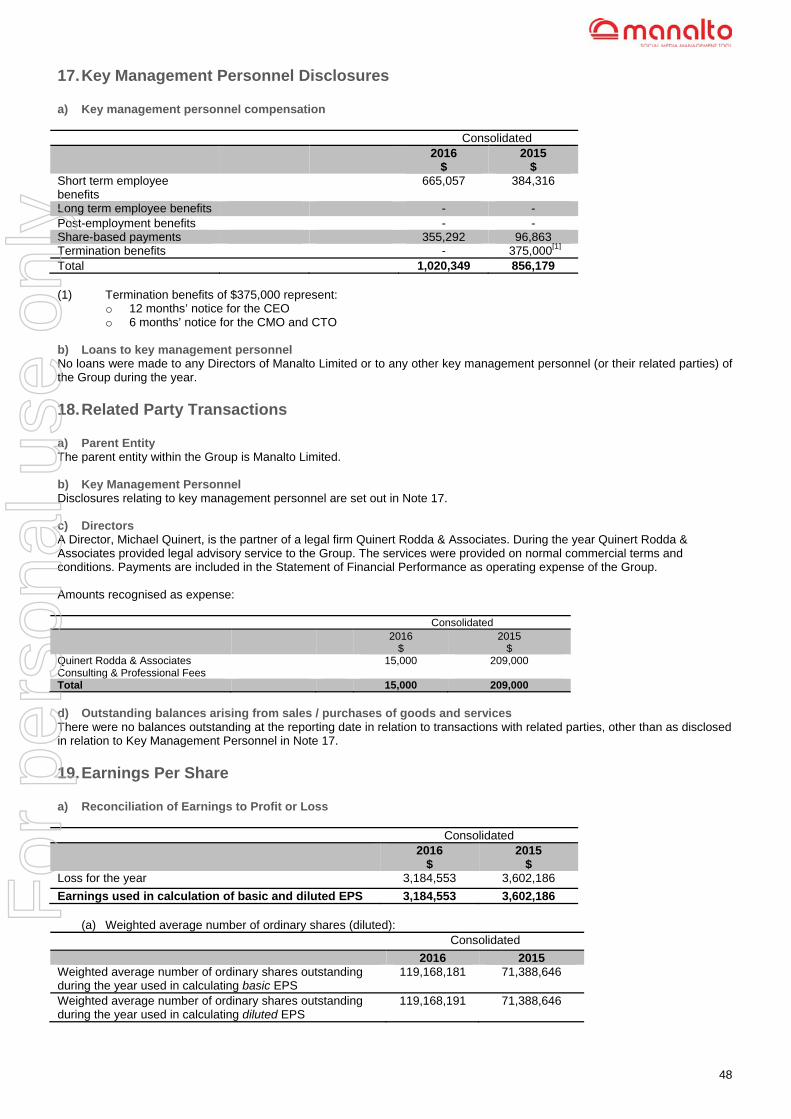
48
17. Key Management Personnel Disclosures a) Key management personnel compensation
Consolidated 2016
$ 2015
$ Short term employee benefits
665,057 384,316
Long term employee benefits - - Post-employment benefits - - Share-based payments 355,292 96,863 Termination benefits - 375,000[1]
Total 1,020,349 856,179 (1) Termination benefits of $375,000 represent:
o 12 months’ notice for the CEO o 6 months’ notice for the CMO and CTO
b) Loans to key management personnel No loans were made to any Directors of Manalto Limited or to any other key management personnel (or their related parties) of the Group during the year.
18. Related Party Transactions a) Parent Entity The parent entity within the Group is Manalto Limited. b) Key Management Personnel Disclosures relating to key management personnel are set out in Note 17. c) Directors A Director, Michael Quinert, is the partner of a legal firm Quinert Rodda & Associates. During the year Quinert Rodda & Associates provided legal advisory service to the Group. The services were provided on normal commercial terms and conditions. Payments are included in the Statement of Financial Performance as operating expense of the Group. Amounts recognised as expense: Consolidated 2016
$ 2015
$ Quinert Rodda & Associates Consulting & Professional Fees
15,000 209,000
Total 15,000 209,000
d) Outstanding balances arising from sales / purchases of goods and services There were no balances outstanding at the reporting date in relation to transactions with related parties, other than as disclosed in relation to Key Management Personnel in Note 17.
19. Earnings Per Share a) Reconciliation of Earnings to Profit or Loss
Consolidated 2016
$ 2015
$ Loss for the year 3,184,553 3,602,186
Earnings used in calculation of basic and diluted EPS 3,184,553 3,602,186
(a) Weighted average number of ordinary shares (diluted): Consolidated
2016 2015 Weighted average number of ordinary shares outstanding during the year used in calculating basic EPS
119,168,181 71,388,646
Weighted average number of ordinary shares outstanding during the year used in calculating diluted EPS
119,168,191 71,388,646
For
per
sona
l use
onl
y

49
As diluted EPS is calculated as a lower loss per share than basic EPS, diluted EPS is taken to be the same as basic EPS. The number of contingent shares excluded from the diluted EPS calculation is 30,707,062 share options on issue as detailed in Note 20 (a).
20. Share Based Payments (a) Employee Option Plan The Group has established the Manalto Limited Employee Share Option Plan (ESOP) to assist in the attraction, retention and motivation of employees of the Group. A summary of the Rules of the Plan is set out below. o Each option is to subscribe for one fully paid ordinary share in the Company. Once issued, the options are subject to a
holding period of four years, with the options vesting in equal percentages at the end of each year. o Options are granted under the plan for no consideration. The exercise price of options will be determined by the Board,
subject to a minimum price equal to the market value of the Company's shares either (in the discretion of the Board) at the time the Board resolves to offer those options or at the time of vesting.
o The total number of shares subject of options issued under the Plan, when aggregated with issues pursuant to any other employee share plan, must not exceed 5% of the Company's issued share capital.
o Shares issued as a result of the exercise of options will rank equally with the Company's previously issued shares. o Option holders may only participate in new issues of securities by first exercising their options. o Shares or Options received under the ESOP are received for past service.
Fair value of options granted
(1) The options were issued at a price of AU$0.25 (US$ 0.19) (2) The options were issued at a price of AU$0.30 (US$ 0.23). (3) The options were issued at a price of AU$0.20 (US$0.14). (4) The options were issued at a price of AU$0.25 (US$0.18). (5) The options were issued at a price of AU$0.30 (US$0.22).
Set out below are the summaries of options granted under the plan as at 30 June 2016.
(6) Using a Black-Scholes valuation model, the option value as of the 30 June 2016 on the 8 million management options issued on 11 March 2015 valued at 12 cents and 2.25 million advisor options valued at 9 cents. The options value recognised in the share option provision account is the liability associated with these options from the grant date to 30 June 2016.
(7) Using a Binomial valuation model, the 1,900,000 options issued at AU$0.30 (US$0.22) were valued at 4.73 cents. (8) Using a Binomial valuation model, the 17,720,000 options issued at AU$0.20 (US$0.14) were valued at 5.07 cents. (9) Using a Binomial valuation model, the 4,288,000 options issued at AU$0.25 (US$0.18) were valued at 4.89 cents.
Grant Date Expiry Date Exercise Price cents
No. of options
as at 01/07/15
‘000
Balance 01/07/15
$
No. Granted
As Remun
‘000
*Value recognise
d in reserve
$
Exercised
Forfeited
No. of options as
at 30/06/16
‘000
Balance 30/06/16
$
Vested & Exercisable
31 October 2012[6]
30 April 2016 23[2] 2 50 - (50) - (2) - - -
11 March 2015[6]
11 March 2020
19[1] 3,450 60,212 - (60,212) - (3,450) - - -
11 March 2015[6]
11 March 2020
19[1] 4,550 79,410 - 192,030 - - 4,550 271,440[6] 4,550
11 March 2015[6]
11 March 2018
19[1] 2,250 155,014 - - - - 2,250 155,014[6] 2,250
16 December 2015[7]
16 December 2020
22[5] - - 1,900 18,909 - - 1,900 18,909 1,100
29 February 2016[8]
29 February 2016
14[3[ - - 17,720 128,057 - - 17,720 128,057 -
1 December 2015[9]
1 December 2020
18[4] - - 4,287 31,601 - - 4,287 31,601 -
Total 10,252 294,686 23,007 310,335 - (3,452) 30,707 605,021 7,900
Weighted Average Exercise Price - cents 18.2 16.4 - - 16.4 -
For
per
sona
l use
onl
y

50
(b) Expenses arising from share - based payment transactions
Total expenses arising from share - based payment transactions recognised during the period: Consolidated 2016
$ 2015
$ Shares issued for other services rendered 13,162 155,014 Options issued under ESOP 297,173 139,672 Total 310,335 294,686
21. Cash Flow Statement Information (a) Reconciliation of Cash Flow from Operations with loss after Income Tax
(b) Non-cash investing activities There were no non-cash investing activities during the year ended 30 June 2016 (2015: Nil). (c) Non-cash financing activities There were no non-cash financing activities during the year ended 30 June 2016 (2015: Nil).
22. Parent Entity Disclosures The following details information related to the parent entity, Manalto Limited, at 30 June 2016 and 2015. The information presented here has been prepared using consistent accounting policies as presented in Note 1. 2016
$ 2015
$ Current assets 3,822,252 3,227,762
Non-current assets 11,795,000 9,568,753 Total assets 15,617,252 12,796,515 Current liabilities 32,812 47,805 Non-current liabilities - - Total Liabilities 32,812 47,805 Net Assets 15,584,440 12,748,710 Contributed equity 38,456,671 35,049,792 Accumulated losses (23,331,999) (22,694,385) Option reserve 681,295 355,028 Other reserve (221,527) 38,275 Total equity 15,584,440 12,748,710 Loss for the year (637,614) (549,699) Other comprehensive loss for the year Total comprehensive loss for the year (637,614) (549,699)
2016 $
2015 $
Non-cash flows in profit (3,184,553) (3,602,186) Depreciation 24,039 5,548 Consideration for acquisition of Healthlinx - 882,103 Share based payment expense 310,335 139,672 (Increase)/decrease in trade and term receivables (50,415) (49,876) Increase/(decrease) in trade payables and accruals 31,556 36,592 Increase/(decrease) in deferred taxes payable (187,563) (174,722) (Increase)/decrease in other current assets 46,060 (48,764) Increase/(decrease) in provisions (128,654) 152,221 Cash flow from operations (3,139,195) (2,659,412)
For
per
sona
l use
onl
y

51
23. Auditors' Remuneration
Consolidated 2016
$ 2015
$
Amounts paid/payable to Grant Thornton Audit Pty Ltd Audit and other assurance services - Auditing or reviewing the financial report 53,414 30,620 Total 53,414 30,620
24. Capital & Leasing Commitments (a) Operating Lease Commitments Non-cancellable operating leases contracted for but not capitalised in the financial statements: Consolidated 2016
$ 2015
$ Payable - minimum lease payments - not later than 12 months 137,283 178,860 - between 12 months and 5 years 106,994 149,992 Total 244,277 328,852 (b) Capital commitments There were no capital commitments at 30 June 2016 (2015: Nil). (c) Termination commitments The service contracts of key management personnel include benefits payable on termination of the employees’ contracts in certain circumstances.
25. Segment Reporting The following details information related to the geographical segment reporting for the year ended 30 June 2016. The Group only operates in one business segment, being the development and commercialisation of social media management technology. The geographical segments are monitored by the Gorup’s chief operating decision maker. The information presented here has been prepared using consistent accounting policies as presented in Note 1. 30 June 2016 Australia USA Ireland South
Africa Netherlands Total
Total segment external income 1,973 115,979 - - - 117,952 Total segment interest 16 54 - - - 70 Total segment expenses (693,603) (2,581,524) (52,785) (174,062) (42,164) (3,490,138) Total segment loss (637,614) (2,465,491) (52,785) (174,062) (42,164) (3,372,116) Total deferred tax assets 187,562 174,722 - - - 362,284 Total segment assets 930,938 2,197,830 2,452 224,989 38 3,356,247
The following details information related to the geographical segment reporting for the year ended 30 June 2015. 30 June 2015 Australia USA Ireland South
Africa Netherlands Total
Total segment external income 85,153 93,045 - - - 178,198 Total segment interest - 3 - - - 3 Total segment expenses (1,763,286) (2,191,822) - - - (3,955,108) Total segment loss (1,678,133) (2,098,774) - - - (3,776,907) Total deferred tax assets - 174,722 - - - 174,722 Total segment assets 148,690 2,887,492 - - - 3,036,182
For
per
sona
l use
onl
y
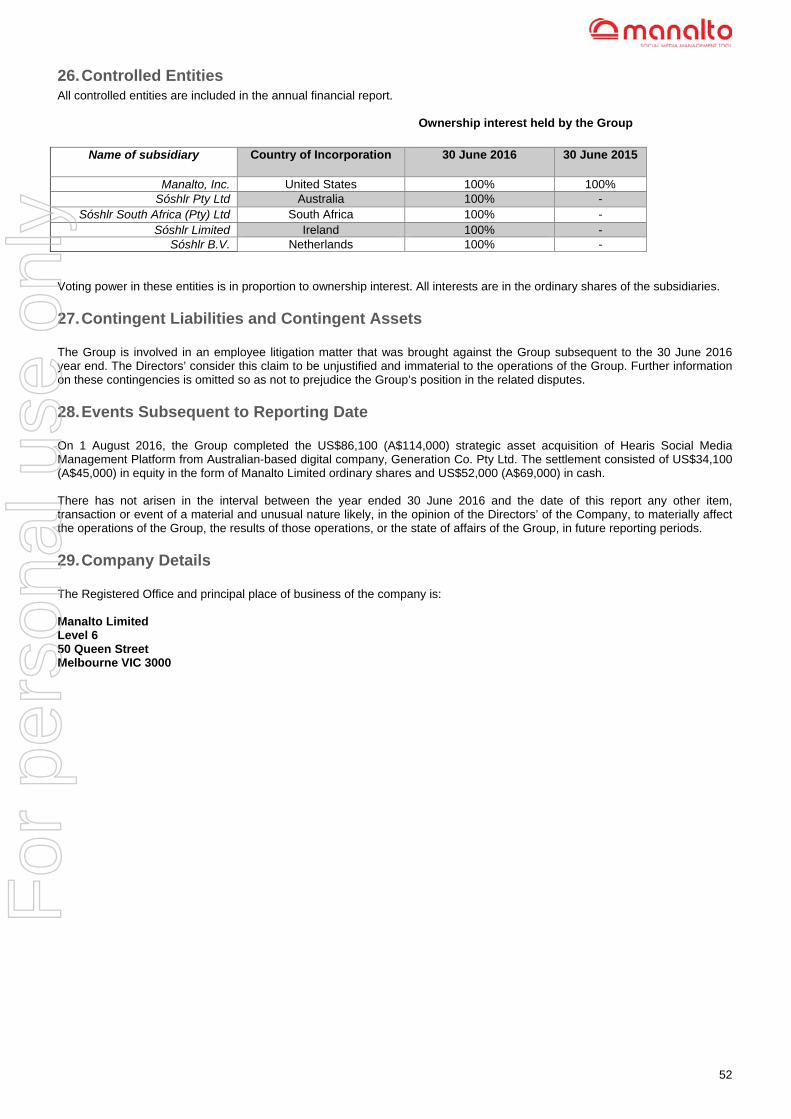
52
26. Controlled Entities All controlled entities are included in the annual financial report.
Ownership interest held by the Group
Name of subsidiary Country of Incorporation 30 June 2016 30 June 2015
Manalto, Inc. United States 100% 100% Sóshlr Pty Ltd Australia 100% -
Sóshlr South Africa (Pty) Ltd South Africa 100% - Sóshlr Limited Ireland 100% -
Sóshlr B.V. Netherlands 100% - Voting power in these entities is in proportion to ownership interest. All interests are in the ordinary shares of the subsidiaries.
27. Contingent Liabilities and Contingent Assets The Group is involved in an employee litigation matter that was brought against the Group subsequent to the 30 June 2016 year end. The Directors’ consider this claim to be unjustified and immaterial to the operations of the Group. Further information on these contingencies is omitted so as not to prejudice the Group’s position in the related disputes.
28. Events Subsequent to Reporting Date On 1 August 2016, the Group completed the US$86,100 (A$114,000) strategic asset acquisition of Hearis Social Media Management Platform from Australian-based digital company, Generation Co. Pty Ltd. The settlement consisted of US$34,100 (A$45,000) in equity in the form of Manalto Limited ordinary shares and US$52,000 (A$69,000) in cash. There has not arisen in the interval between the year ended 30 June 2016 and the date of this report any other item, transaction or event of a material and unusual nature likely, in the opinion of the Directors’ of the Company, to materially affect the operations of the Group, the results of those operations, or the state of affairs of the Group, in future reporting periods.
29. Company Details The Registered Office and principal place of business of the company is: Manalto Limited Level 6 50 Queen Street Melbourne VIC 3000
For
per
sona
l use
onl
y

53
DIRECTOR DECLARATION
In the Directors’ opinion: 1. The financial statements and notes set out on Pages 26 to 52 are in accordance with the Corporations Act 2001, including: (a) Complying with Accounting Standards, the Corporations Regulations 2001 and other mandatory professional reporting requirements; and (b) Giving a true and fair view of the consolidated entity's financial position as at 30 June 2016 and of its performance for the financial year ended on that date; and there are reasonable grounds to believe that the company will be able to pay its debts as and when they become due and payable; The audited remuneration disclosures set out in Sections 4 of the Directors Report (as part of the Remuneration Report), for the year ended 30 June 2016, comply with Section 300A of the Corporations Act 2001 and the Corporations Regulations 2001; and the notes to the financial statements include an explicit and unreserved statement of compliance with International Financial Reporting Standards. The Directors have been given the declarations by the Chairman and Managing Director required by section 295A of the Corporations Act 2001. This declaration is made in accordance with a resolution of the Directors.
Joseph Miller Interim Chairman Melbourne 29 September 2016
Anthony Owen Managing Director Melbourne
For
per
sona
l use
onl
y

54
AUDITOR’S INDEPENDENCE DECLARATION
For
per
sona
l use
onl
y

55
INDEPENDENT AUDITOR’S REPORT
For
per
sona
l use
onl
y

56
For
per
sona
l use
onl
y
57
For
per
sona
l use
onl
y

58
ASX OTHER REQUIRED INFORMATION
1. SHAREHOLDINGS (a) RANGE OF SHARES ISSUED - AS AT 22 SEPTEMBER 2016
(b) TOP 20 SHAREHOLDERS – AS AT 22 SEPTEMBER 2016
Rank Name Units % of Units
1 LSAF HOLDINGS PTY LTD 17,057,727 10.24%
2 ECA VENTURES LLC 13,961,731 8.38%
3 MRS MELANIE THERESE VERHEGGEN 9,350,000 5.61%
4 JACK BURSTON 7,220,876 4.33%
5 ANTHONY AND MEGAN OWEN 6,769,540 4.06%
6 HSBC CUSTODY NOMINEES 6,556,846 3.94%
7 VANKAT PTY LTD 4,130,162 2.48%
8 CHIFLEY PORTFOLIOS PTY LIMITED 4,117,857 2.47%
9 ASGARD CAPITAL MANAGEMENT LTD 3,820,000 2.29%
10 RAVEN VENTURES (AUSTRALIA) PTY 3,485,986 2.09%
11 SPINITE PTY LTD 3,177,529 1.91%
12 EXIT OUT PTY LTD 3,005,253 1.80%
13 MARIVA INVESTMENTS PTY LTD 3,000,000 1.80%
14 MR PETER BARRETT CAPP 3,000,000 1.80%
15 CS FOURTH NOMINEES PTY LIMITED 2,824,382 1.70%
16 BLUEMAX INVESTMENTS PTY 2,377,142 1.43%
17 JINDABYNE CAPITAL PTY LTD 2,200,000 1.32%
18 COPE ST PTY LIMITED 2,116,851 1.27%
19 MS MICHELE ALLISON OWEN 2,000,000 1.20%
20 PANIC SUPER PTY LTD 2,000,000 1.20%
Totals: Top 20 holders of ISSUED CAPITAL 102,171,882 61.34%
Total Remaining Holders Balance 64,400,752 38.66%
Range Total holders Units % of Issued Capital
1 - 1,000 1,275 118,405 0.1%
1,001 - 5,000 89 218,340 0.1%
5,001 - 10,000 34 301,359 0.2%
10,001 - 100,000 162 7,307,149 4.4%
100,001 - 999,999,999 154 158,627,381 95.2%
1,000,000,000 - 9,999,999,999 - - -
Rounding - - -
Total 1,714 166,572,634 100.0%
Unmarketable Parcels 1,405 708,735
Minimum Parcel Size Holders Units
Minimum $ 500.00 parcel at $ 0.0480 per unit
10,417 1,405 708,735
For
per
sona
l use
onl
y

59
2. Voting Rights Shareholders are entitled to one vote for each share held. On a show of hands every shareholder presents in person or by proxy shall have one vote and upon a poll, every shareholder so present shall have one vote for every share held.
3. Unlisted Option Holdings DISTRIBUTION OF OPTION HOLDERS AS AT 22 SEPTEMBER 2016
(a) Options 2 - $A0.25 on or before 11 March 2020
(b) Options 3 - $A0.25 on or before 11 March 2018
(c) Options 4 - $A0.30 on or before 15 December 2020
Range Total holders Options held %
1 - 1,000 - - -
1,001 - 5,000 - - -
5,001 - 10,000 - - -
10,001 - 100,000 - - -
100,001 - 999,999,999 2 4,550,000 100%
Totals 2 4,550,000 100%
Holder of 20% or more:
Anthony Owen 3,100,000
Megan Owen 1,450,000
Range Total holders Options held %
1 - 1,000 - - -
1,001 - 5,000 - - -
5,001 - 10,000 - - -
10,001 - 100,000 - - -
100,001 - 999,999,999 4 2,250,000 100%
Totals 4 2,250,000 100%
Holder of 20% or more:
Chris Adams 500,000
Gleneagle Securities Nom. 750,000
LSAF Holdings Pty Ltd 750,000
Range Total holders Options held %
1 - 1,000 - - -
1,001 - 5,000 - - -
5,001 - 10,000 - - -
10,001 - 100,000 1 100,000 5%
100,001 - 999,999,999 3 1,800,000 95%
Totals 4 1,900,000 100%
Holder of 20% or more:
D & F Fletcher Super Pty Ltd 1,000,000
Craig Ball 500,000
For
per
sona
l use
onl
y
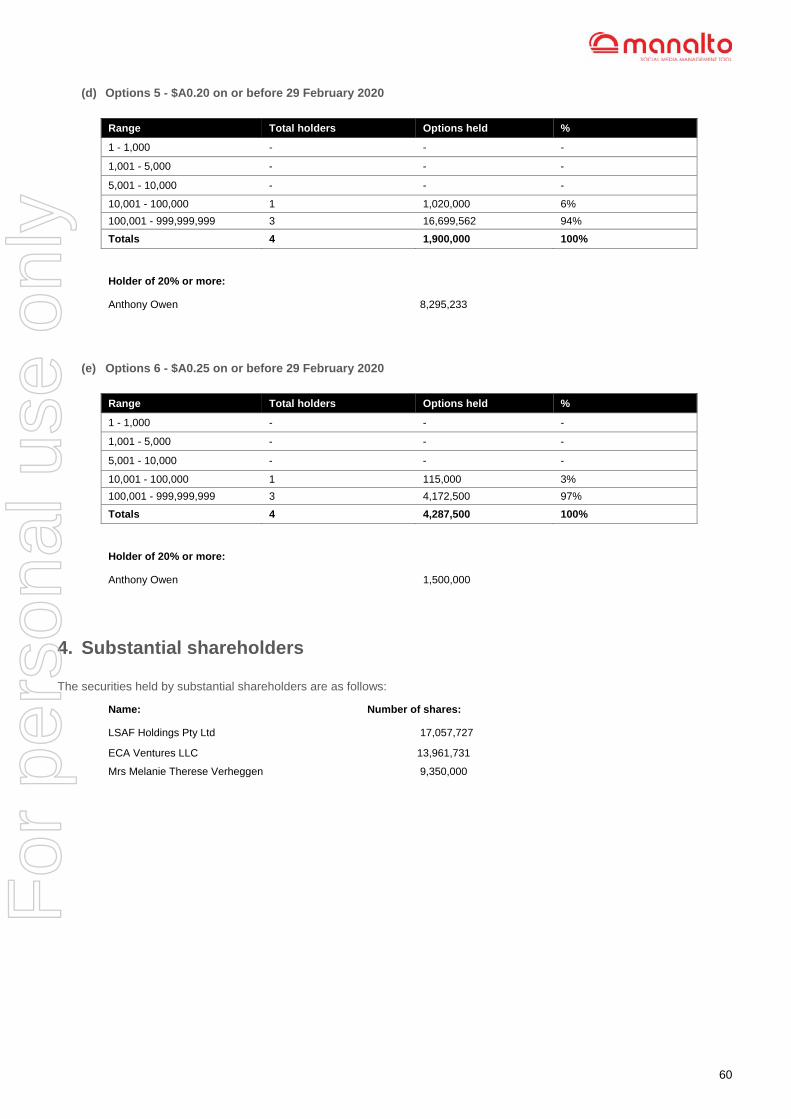
60
(d) Options 5 - $A0.20 on or before 29 February 2020
(e) Options 6 - $A0.25 on or before 29 February 2020
4. Substantial shareholders The securities held by substantial shareholders are as follows:
Range Total holders Options held %
1 - 1,000 - - -
1,001 - 5,000 - - -
5,001 - 10,000 - - -
10,001 - 100,000 1 1,020,000 6%
100,001 - 999,999,999 3 16,699,562 94%
Totals 4 1,900,000 100%
Holder of 20% or more:
Anthony Owen 8,295,233
Range Total holders Options held %
1 - 1,000 - - -
1,001 - 5,000 - - -
5,001 - 10,000 - - -
10,001 - 100,000 1 115,000 3%
100,001 - 999,999,999 3 4,172,500 97%
Totals 4 4,287,500 100%
Holder of 20% or more:
Anthony Owen 1,500,000
Name: Number of shares:
LSAF Holdings Pty Ltd 17,057,727
ECA Ventures LLC 13,961,731
Mrs Melanie Therese Verheggen 9,350,000
For
per
sona
l use
onl
y

61
DIRECTORS Joseph Miller Anthony Owen Michael Quinert Chris Adams COMPANY SECRETARY Lucy Rowe REGISTERED OFFICE Level 6 50 Queen Street MELBOURNE VIC 3000 Telephone (03) 8692 9000 BUSINESS OFFICE Level 6 50 Queen Street MELBOURNE VIC 3000 Telephone (03) 8692 9000 POSTAL ADDRESS PO Box 16109 Collins Street West VIC 8007 Telephone (03) 8692 9000
CORPORATE DIRECTORY
PATENT ATTORNEY TO THE COMPANY Davies Collison Cave 1 Little Collins Street Melbourne VIC 3000 Telephone (03) 9254 2777 Facsimile (03) 9254 2770 SOLICITORS TO THE COMPANY Quinert Rodda Level 6, 50 Queens Street Melbourne VIC 3000 Telephone (03) 8692 9000 SHARE REGISTRY Computershare Investor Services Pty Limited ABN 48 078 279 277 Yarra Falls 452 Johnston St Abbotsford VIC 3067 Telephone 1300 850 505 AUDITORS Grant Thornton Audit Pty Ltd The Rialto Level 30 525 Collins Street Melbourne VIC 3000 Telephone (03) 8320 2222
For
per
sona
l use
onl
y