Embed Size (px)
Citation preview

ASX Announcement
Wednesday, 16 August 2017 ASX: WPL OTC: WOPEY
Woodside Petroleum Ltd.
ACN 004 898 962
Woodside Plaza
240 St Georges Terrace
Perth WA 6000
Australia
www.woodside.com.au
WOODSIDE RECORDS FIRST HALF PROFIT OF US$507 MILLION, UP 49%
Woodside has recorded a half-year reported net profit after tax (NPAT) of US$507 million, 49% higher than H1 2016.
Production was 42.2 MMboe and sales revenue was US$1.76 billion.
The directors have declared an interim dividend of US 49 cents per share.
Woodside CEO Peter Coleman said the company continued to deliver on the long-term plan outlined to investors earlier
in the year and was in a strong position heading into the second half of 2017.
“We are progressing the priorities we outlined in our plan to deliver shareholder value across three distinct time
horizons.
“Our free cash flow is up 170% from H1 2016 to US$445 million and our break-even oil price for the half was US$34 per
barrel.
“We look forward to Wheatstone production commencing and remain focused on supporting the operator achieving
this in a safe and reliable manner.
“Subsequent to the half we made a third gas discovery in Myanmar, our second in the Southern Rakhine Basin and
close to our existing Shwe Yee Htun discovery.
“In Senegal, the RSSD joint venture completed a five well exploration and appraisal campaign and Woodside has been
appointed the development lead of the SNE oil field.
“The Burrup Hub is already beginning to take shape, with notable progress across Pluto, the North West Shelf Project and
the Browse development. We are progressing concept definition on Pluto LNG expansion; the North West Shelf Project
participants have agreed a tolling proposal and started discussions with third party resource owners; and the Browse
Joint Venture participants have agreed Browse to NWS as the reference development concept for technical studies.
“Work on our priorities has been underpinned by Woodside’s ongoing commitment to operational excellence, which
delivered world-class unit production costs of US$4.90/boe, 6% lower than H1 2016. Unit production costs for North
West Shelf gas products were US$3.30/boe, 13% lower than H1 2016, and we achieved a portfolio cash margin of 78%.
“We also executed a long-term sales agreement with Pertamina that will see Woodside become a significant supplier
of LNG to Indonesia,” he said.
To view a short video of CEO Peter Coleman discussing Woodside’s half-year results, please click the link.
Financial headlines for H1 2017
Half-year reported NPAT of US$507 million.
Portfolio average realised price of US$43/boe, 10% higher than H1 2016.
Positive free cash flow of US$445 million, up 170% from H1 2016.
Increased net cash flow from operating activities of US$1.24 billion, up 3% from H1 2016.
Reduced half-year unit production costs of US$4.90/boe, 6% lower than H1 2016 and 2% lower than FY 2016.
Declared an interim dividend of US 49 cents per share.
Liquidity of US$2.59 billion available to develop Woodside’s business in line with strategy.
Maintained a competitive pre-tax portfolio cost of debt of 3.4%.
Maintained credit ratings of Baa1 and BBB+ from Moody’s and Standard & Poor’s respectively.

Page 2 of 2
Key business activities
Operational excellence
Improved safety performance with lowest-ever total recordable injury rate (TRIR) and no Tier 1 or Tier 2 process
safety events.
Pluto LNG achieved record daily and weekly production rates during the period, 3% higher than the previous
record (Q3 2016), after successfully completing high-rate trials. The high-rate trials demonstrated additional
capacity in the LNG train and will inform decision-making on expansion options for Pluto LNG.
Achieved reliability across the FPSO fleet of over 95%.
Managing risk and volatility
Entered into a long-term LNG sale and purchase agreement with PT Pertamina (Persero) commencing in 2019 to
supply up to 1.1 million tonnes per annum.
Executed mid-term LNG sale and purchase agreements for up to 16 cargoes from Woodside’s portfolio for delivery
in the period 2017 – 2019.
Diversified funding sources by executing a US$100 million term loan and guarantee facility with Norway’s export
credit agencies and DNB Bank ASA.
Capturing and building near-term value growth
Delivering Wheatstone, Greater Enfield and NWS subsea tieback projects which underpin targeted production
growth from 2017 to 2020 of approximately 15%.
Final commissioning of the Wheatstone LNG Train 1 is well advanced and nearing completion. Wheatstone LNG
is expected to provide more than 13 MMboe (Woodside share) of annual production once fully operational.
NWS Project participants agreed a tolling proposal and have commenced discussions with third party resource
owners for processing gas through the Karratha Gas Plant.
Persephone ready for start-up achieved on 25 July 2017, with the project delivered 30% under budget and six
months ahead of schedule.
Continued appraisal of the SNE field in Senegal is further improving confidence in the SNE development plan,
targeting first oil in 2021-2023.
Production testing of the Thalin field in Myanmar established high reservoir deliverability and reservoir properties
in line with expectations.
Pluto LNG expansion studies have commenced; contractors have been engaged to develop concept options.
Woodside continues to target the selection of a Browse development concept in H2 2017. The Browse Joint
Venture is aligned on Browse to NWS as the reference development concept subject to reaching acceptable terms
and conditions on the development.
Half-year 2017 results teleconference
A teleconference providing an overview of the half-year 2017 results and a question and answer session will be held at
7.30am AWST (9.30 am AEST) on 16 August 2017. Dial in numbers are listed below. Please quote passcode ID: 5894
0329.
For locations within Australia dial toll-free 1800 123 296, or toll 02 8038 5221. If you are calling from another country,
please use one of the following toll-free dial-in numbers: Canada (1855 5616 766), China (4001 203 085), Hong
Kong (800 908 865), India (1800 3010 6141), Japan (0120 477 087), New Zealand (0800 452 782), Singapore (800
616 2288), United Kingdom (0808 234 0757), United States (1855 293 1544). For all other countries or operator
assistance, please dial + 61 2 8038 5221.
The half-year results briefing pack follows this announcement and will be referred to during the conference call.
Contacts:
MEDIA
Michelle Grady W: +61 8 9348 5995 M: +61 418 938 660 E: [email protected]
INVESTORS Damien Gare W: +61 8 9348 4421 M: +61 417 111 697 E: [email protected]

16 August 2017
HALF-YEAR 2017 RESULTS BRIEFING

This presentation contains forward looking statements that are subject to risk factors associated with oil and gas businesses. It is believed that the expectations reflected in these statements are reasonable as at the date of this presentation but they may be affected by a variety of variables and changes in underlying assumptions which could cause actual results or trends to differmaterially, including but not limited to: price fluctuations, actual demand, currency fluctuations, drilling and production results, reserve estimates, loss of market, industry competition, environmental risks, physical risks, legislative, fiscal and regulatorydevelopments, changes in accounting standards, economic and financial market conditions in various countries and regions, political risks, project delay or advancement, approvals and cost estimates. Readers are cautioned not to place undue reliance on theseforward looking statements. No representation is made or will be made that any forward looking statements will be achieved or will prove to be correct. We do not undertake to update or revise any forward looking statement, whether as a result of new information, future events or otherwise.
All references to dollars, cents or $ in this presentation are to US currency, unless otherwise stated.
References to “Woodside” may be references to Woodside Petroleum Ltd or its applicable subsidiaries.
Peer group refers to Anadarko, Apache, ConocoPhillips, ENI, Hess, Inpex, Marathon Oil, Murphy Oil, Oil Search, Origin Energy, Pioneer, Repsol, Santos, Statoil and Tullow Oil.
16 August 2017Half-Year 2017 Results Briefing |
Disclaimer and important notice
2

16 August 2017
Profit: Change1
Net profit after tax $507 million 49%
Interim dividend 49 US cps 44%
Cashflow:
Operating cash flow $1,235 million 3%
Free cash flow $445 million 170%
Unit production costs $4.9/boe 6%
Free cash flow breakeven2 (Dated Brent) $34/bbl
Balance Sheet:
Liquidity $2,593 million 30%
Gearing 24%
Half-Year 2017 Results Briefing |
OVERVIEW
Financial headlines
1. Comparisons are to the half-year period ended 30 June 2016.
2. Pre-dividend.
3

16 August 2017Half-Year 2017 Results Briefing |
OVERVIEW
Achievements
1. Subsequent to the period.
Man
agin
g ris
k an
d vo
latil
ityN
ear-
term
va
lue
grow
thO
pera
tiona
l ex
celle
nce
+ Total recordable injury rate at record low+ Record Pluto LNG daily production rate+ NWS gas unit production costs down 13%+ FPSO reliability of over 95% + Persephone delivered under budget and ahead of schedule
+ Entered into long-term LNG SPA with Pertamina+ Executed mid-term SPAs for up to 16 cargoes+ Breakeven cash cost of sales $9.6/boe
+ Wheatstone final commissioning nearing completion+ NWS tolling proposal agreed and submitted to third parties+ Browse JV aligned on Browse to NWS as reference development concept+ Progressing Pluto LNG expansion FID+ Appointed Development Lead of SNE oil field, appraisal activities continue + Third exploration success offshore Myanmar1
4

16 August 2017
EBITDA margin
OVERVIEW
Peer leading performance
1. Refer to disclaimer and important notice for peer group. Excludes Inpex. Insufficient peer data for H1 2017.
2. Annualised for comparison purposes.
Half-Year 2017 Results Briefing |
Return on average capital employed
5
Source: IHS Source: IHS
-20%
-10%
0%
10%
20%
2014 2015 2016 H1 2017²
Peer range¹ Woodside
0%
20%
40%
60%
80%
100%
2014 2015 2016 H1 2017
Peer range¹ Woodside
16 August 2017
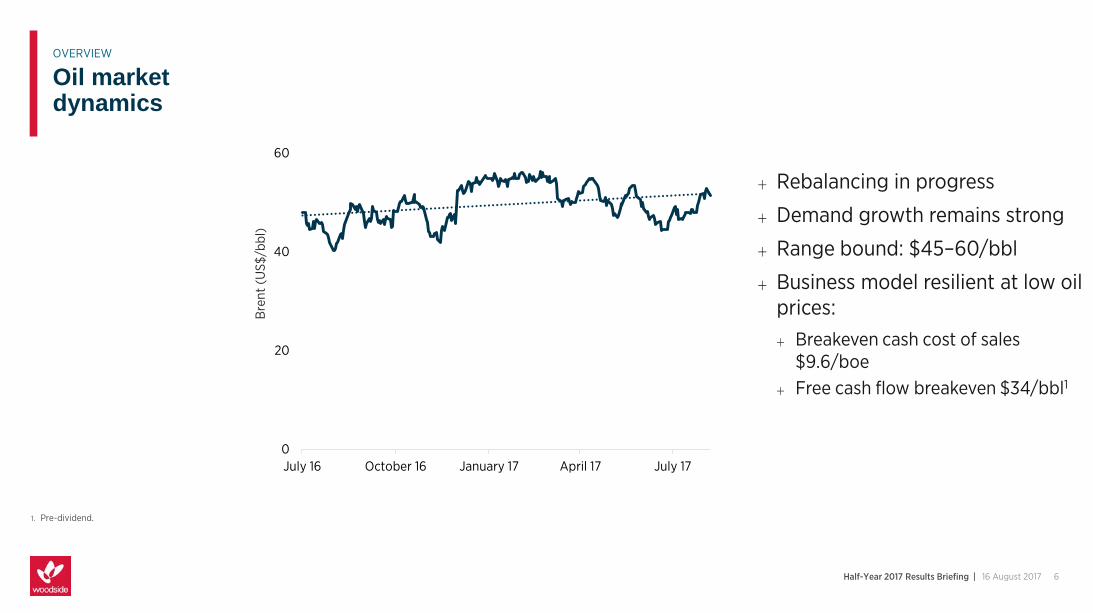
+ Rebalancing in progress
+ Demand growth remains strong
+ Range bound: $45–60/bbl
+ Business model resilient at low oil prices:+ Breakeven cash cost of sales
$9.6/boe+ Free cash flow breakeven $34/bbl1
Half-Year 2017 Results Briefing |
OVERVIEW
Oil market dynamics
6
0
20
40
60
July 16 October 16 January 17 April 17 July 17
Bre
nt (
US$
/bbl
)
1. Pre-dividend.

0
100
200
300
400
500
600
2010 2015 2020 2025 2030
mtp
a
Under construction Operational supply Demand
16 August 2017
Global supply and demand outlook
19%China
+ Market is well supplied
+ New markets emerging
+ Strong Asian and new buyer demand
+ Low-cost projects leading competition
+ Woodside positioning projects to meet supply window
Half-Year 2017 Results Briefing |
OVERVIEW
LNG market dynamics
Source: Wood Mackenzie LNG Service, Q2 20177
TargetingFID ready
TargetingRFSU
Asian demand growthCAGR (2016–2020)
35%Pakistan
6%Asia Pacific

16 August 2017Half-Year 2017 Results Briefing |
OVERVIEW
Strategy delivers value
1. Refer to ASX announcement dated 23 May 2017, Investor Briefing Day, for assumptions and disclaimers.
Out
stan
ding
bas
e bu
sine
ss
Sust
aina
ble
ener
gy
+ Lower capital intensity developments
+ New revenue streams
+ Preparing for Horizon II growth
+ New growth platforms through exploration
+ Expanding the LNG market
+ Developments leveraging existing infrastructure
+ Growth funded by base business and Horizon I growth
+ Monetise exploration success
+ Increase supply to new and traditional markets
+ Capital efficient developments
+ Unlock new major hubs
Horizon I 2017-2021
Horizon II 2022-2026
Horizon III 2027+
CASH GENERATION
VALUE UNLOCKED
SUCCESS REPEATED
8

FINANCIAL UPDATEANTHEA MCKINNELLActing Chief Financial Officer

16 August 2017
Reported profit up 49%
+ Sustained cost reductions
+ Reduced seismic activity and increased appraisal drilling
+ Reduction in depreciation driven by:+ Increased Pluto developed
reserves+ Greater Enfield reserves booking
Half-Year 2017 Results Briefing |
FINANCIAL UPDATE
Increased profit
1. Production for the period was 0.9 MMboehigher than sales due to timing of LNG sales.
2. Other includes foreign exchange losses, lower general, administrative and other costs, net trading margin, PRRT, non-controlling interest, income tax expense.
340 (45) 33
128
78 (27) 507
H1 2
016
Sale
s re
venu
e¹
Prod
uctio
n co
sts
Expl
orat
ion
Dep
reci
atio
n
Oth
er²
H2
2017
$ m
illio
n
10

16 August 2017
PortfolioFINANCIAL UPDATE
Production costs
Half-Year 2017 Results Briefing |
355 351
2392067.6 8.4
5.2 4.9
H1 2014 H1 2015 H1 2016 H1 2017
Total ($ million) Unit ($/boe)
+ Cost reduction trend continues
+ Compared to H1 2014:+ Total production costs down
$149 million+ Unit production costs down 36%
+ NWS gas unit production cost $3.3/boe
NWS gas
105
80 79
615.0
3.9 3.8 3.3
H1 2014 H1 2015 H1 2016 H1 2017
Total ($ million) Unit ($/boe) 11

16 August 2017
FINANCIAL UPDATE
Margin
Half-Year 2017 Results Briefing |
+ High margin maintained
+ Increased gross margin from 43% in H1 2016
12
Gross Margin
21.1 $/boe
Depreciation and amortisation
13.5 $/boe
Production and other costs
9.7 $/boe

16 August 2017
Interim dividend up 44%1
+ US49 cps fully franked interim dividend
+ Dividend payout ratio of 80%
Half-Year 2017 Results Briefing |
FINANCIAL UPDATE
Interim dividend
1. Comparison is to half-year period ended 30 June 2016.
13
111
66
34
49
H1 2014 H1 2015 H1 2016 H1 2017
Interim dividend (US cps)

16 August 2017
Generating FCF while investing in growth
+ Free cash flow of $445 million
+ Dividend funded from operating cash flow
+ Demonstrating capital discipline
Half-Year 2017 Results Briefing |
FINANCIAL UPDATE
Sources and uses of cash
Cash from operating activities
Capital and exploration expenditure
2016 final dividend
Other financingNet cash build
0
200
400
600
800
1,000
1,200
1,400
Sources Uses
$ m
illio
n
14

0
10
20
30
40
50
60
70
80
90
100
$/bb
l(B
rent
)2
Base business Exploration
2017 break-even cash flow
16 August 2017
Woodside and peers1
Half-Year 2017 Results Briefing |
FINANCIAL UPDATE
1. Refer to disclaimer and important notice for peer group. Excludes Origin.
2. Wood Mackenzie estimate of the Brent price required to remain cash flow neutral (accumulate no additional debt) using their full-year 2017 base case activity outlook.
Source: Wood Mackenzie Corporate Benchmarking Tool, Q2 2017
+ Low break-even cash flow while continuing to invest in growth
+ Reflects quality of assets
15

0
5
10
15
20
25
30
35
0
500
1,000
1,500
2,000
2,500
3,000
3,500
4,000
4,500
5,000
H1 2014 H1 2015 H1 2016 H1 2017
Perc
ent
$ m
illio
n
Liquidity (LHS) Gearing (RHS)
16 August 2017
Strong financial position maintained
+ Liquidity of $2.6 billion
+ Gearing at 24%, within target range
+ Strong investment grade credit ratings maintained1
FINANCIAL UPDATE
Liquidity and gearing
1. S&P Global BBB+, Moody’s Baa1.
Half-Year 2017 Results Briefing |
Target gearing range
16

16 August 2017
+ Portfolio cost of debt of 3.4%
+ Managing our maturity profile: 1
+ Executed $100 million term loan and guarantee facility with Norwegian Export Credit Agencies and DNB Bank ASA
+ Executed evergreen options on $800 million of bilateral facilities
FINANCIAL UPDATE
Debt maturity profile
1. Since 1 January 2017.
Half-Year 2017 Results Briefing | 17
Drawn debt maturity profile
0
400
800
1,200
1,600
2,000
2017 2018 2019 2020 2021 2022 2023 2024 2025 2026 2027
$ m
illio
n
Bonds Revolving debt facilities (bilateral and syndicated) Other

0
500
1,000
1,500
2,000
2017E H1 2017
$ m
illio
n
Base business¹ Greater Enfield Plateau extension
Wheatstone² Growth³ Sustaining
Exploration
16 August 2017
+ 70% of capex invested in sanctioned projects4
+ Low base business spend
+ Sustaining capex $32 million
+ 2017 total investment expenditure estimate unchanged5
FINANCIAL UPDATE
Investment expenditure
1. Base business operating assets delivering cash flow during the period, namely Pluto, NWS and Australia Oil.
2. Wheatstone includes Julimar.3. Growth includes Pluto LNG expansion,
Senegal, Browse, Myanmar, Kitimat and other spend.
4. Wheatstone, Greater Enfield and NWS subsea tieback projects.
5. Compared to estimate in Annual Report 2016. Increase in Wheatstone and Growth, offset by reduction in Base business.
Half-Year 2017 Results Briefing | 18

2017 PRIORITIESPETER COLEMANChief Executive Officer and Managing Director

16 August 2017
Achieved:
Platform operational
Trunkline fully pressurised
Train 1 starting-up
Final commissioning nearing completion
Next steps:
o First LNG
o Train 2 and domestic gas 6–8 months after start-up of Train 1
Half-Year 2017 Results Briefing |
2017 PRIORITIES
Wheatstone
Source: Chevron Australia
20
Horizon I 2017–2021

16 August 2017
Achieved:
Two successful appraisal wells
Three exploration wells
SNE Development Lead
Next steps:
o Planning transition to operator
o Targeting FEED in 2018
Half-Year 2017 Results Briefing |
2017 PRIORITIES
Senegal
21
Horizon I 2017–2021

16 August 2017
Achieved:
Third discovery in the Rakhine Basin (Pyi Thit-1)1
Two Thalin appraisal wells; strong flow rates achieved
Acquired three blocks2
Added Pyi Tharyar to 2017 drilling campaign
Next steps:
o Drill Pyi Tharyar and Khayang Swal
o Progress development planning
Half-Year 2017 Results Briefing |
2017 PRIORITIES
Myanmar
1. Subsequent to the period.2. Completion of farm-in to Blocks AD-1,
AD-6 and AD-8 subject to satisfaction of conditions precedent.
22
Horizon II 2022–2026

16 August 2017
Expansion options1
Achieved:
Commenced LNG expansion studies
Engaged experienced LNG technology contractors
EOIs sought for FEED scope
Warm high-rate trial confirmed additional available pre-treatment capacity
Next steps:
o Complete concept definition
o Finalise contract execution plan and FID schedule
Half-Year 2017 Results Briefing |
2017 PRIORITIES
Pluto LNGexpansion
1. Subject to relevant joint venture participant approvals and agreement being obtained.
Transfer pipeline~1 Mpta
Capacity enhancing 0.7 Mpta
Standalone system ~1.5 Mpta
23
Horizon I 2017–2021

2 x gas FPSOsLength: 360 mWeight: 90,000 t
16 August 2017
Achieved:
Browse JV aligned on Browse to NWS as reference development concept1
Tolling proposal agreed by NWS and sent to Browse
Browse JV and NWS Project progressing joint technicalfeasibility study
Next steps:
o Targeting concept select H2 2017 and FEED in 2019
Half-Year 2017 Results Briefing |
2017 PRIORITIES
Browse
1. Subject to reaching acceptable terms and conditions with the NWS Project and the Governments of Australia and Western Australia.
Torosa
BrecknockCalliance
24
Horizon II 2022–2026

16 August 2017Half-Year 2017 Results Briefing |
SummaryGenerating increasing cash flow and returns from
existing business and committed projects
Unlocking value by delivering capital efficient developments to meet growing demand
Maximising the value of existing infrastructure
25

ANNEXURE

16 August 2017Half-Year 2017 Results Briefing |
ANNEXURE
Production reconciliation
1. The Domestic Gas Joint Venture (DGJV) was fulfilled on 8 May 2017. Woodside’s equity share of pipeline gas and associated condensate in the DGJV was 50%. All remaining gas will be sold under the Incremental Pipeline Gas Joint Venture (IPGJV). Woodside’s equity share of the IPGJV is 16.67%.
+ Higher LNG capacity following Pluto cold high-rate trial
+ NWS pipeline gas lower due to:+ Fulfilment of DGJV1
+ Lower customer demand
45.9 (0.1) (0.8) 0.5 (2.8)(0.5) 42.2
H1 2016 Facilityutilisation
Reservoirdecline
LNGcapacity
NWSpipeline gas¹
Discontinuedoperations
H1 2017
MM
boe
27

16 August 2017Half-Year 2017 Results Briefing |
ANNEXURE
Realised prices
1. Japan Customs-cleared Crude is the average price of customs-cleared crude oil imports into Japan as reported in customs statistics and used as reference price for long-term supply LNG contracts.
Products
$/boe
Variance %
Revenue impact
$ millionH1 2017 H1 2016
NWS LNG 35 31 13 42
Pluto LNG 49 49 - (3)
NWS pipeline natural gas 22 20 10 5
Condensate 53 42 26 42
LPG 48 45 7 -
Oil 54 39 38 53
Volume weighted average realised price 43 39 10 139
Average Dated Brent price 52 40 30
Average 3-month lagged JCC1 51 40 28
28

16 August 2017Half-Year 2017 Results Briefing |
ANNEXURE
Production costs Gas
153139
91
62
25 2528
19
H1 2014 H1 2015 H1 2016 H1 2017
Total ($ million) Unit ($/boe)
204 210
147 143
5.0 5.83.4 3.7
H1 2014 H1 2015 H1 2016 H1 2017
Total ($ million) Unit ($/boe)
29
Oil
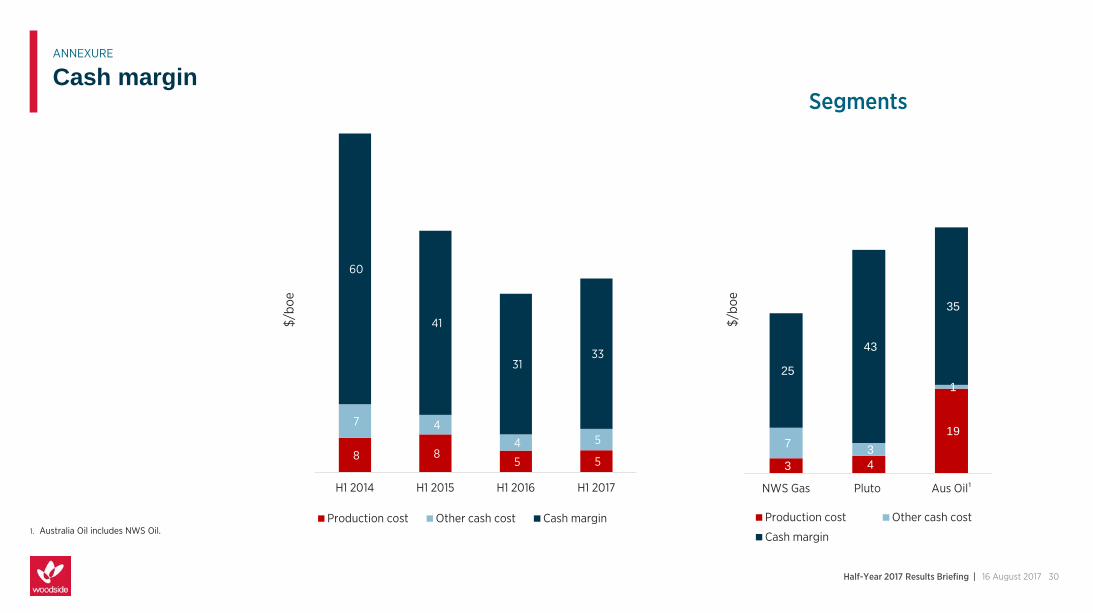
3 4
19 7
3
1
25
43
35
NWS Gas Pluto Aus Oil¹
$/bo
e
Production cost Other cash cost
Cash margin
16 August 2017Half-Year 2017 Results Briefing |
ANNEXURE
Cash margin
1. Australia Oil includes NWS Oil.
Segments
30
8 8 5 5
7 4 4 5
60
41
31 33
H1 2014 H1 2015 H1 2016 H1 2017
$/bo
e
Production cost Other cash cost Cash margin

16 August 2017Half-Year 2017 Results Briefing |
ANNEXURE
Segment performance
1. Australia Oil includes NWS Oil.
NWS Pluto Aus Oil1
Production volume (MMboe) 18.3 19.8 3.4
Operating revenue ($ million) 637 1,027 184
EBITDA ($ million) 459 895 122
EBIT ($ million) 331 498 76
Unit production cost ($/boe) 3.3 3.8 18.6
Gross margin (%) 52 49 35
31

16 August 2017Half-Year 2017 Results Briefing |
ANNEXURE
Exploration pipeline
1. This is a forecast activity plan subject to change due to final approvals, weather conditions and other external circumstances.
2. Target size: unrisked gross mean success volume ( 100% basis). Medium >20 MMboe and <100 MMboe and large >100 MMboe.
3. Completion of farm-in to Blocks AD-1, AD-6 and AD-8 subject to satisfaction of conditions precedent.
4. Woodside's farm-in to Luna Muetse Block is awaiting final Government approval.
32

Unless otherwise stated, all petroleum resource estimates are quoted as at the balance date (i.e. 31 December) of the Reserves Statement in Woodside’s most recent Annual Report released to ASX and available at http://www.woodside.com.au/Investors-Media/Announcements, net Woodside share at standard oilfield conditions of 14.696 psi (101.325 kPa) and 60 degrees Fahrenheit (15.56 deg Celsius). Woodside is not aware of any new information or data that materially affects the information included in the Reserves Statement. All the material assumptions and technical parameters underpinning the estimates in the Reserves Statement continue to apply and have not materially changed.
Woodside reports reserves net of the fuel and flare required for production, processing and transportation up to a reference point. For offshore oil and floating LNG (FLNG) projects, the reference point is defined as the outlet of the floating production storage and offloading (FPSO) vessel, or FLNG facility respectively, while for the onshore gas projects the reference point is defined as the inlet to the downstream (onshore) processing facility.
Woodside uses both deterministic and probabilistic methods for estimation of petroleum resources at the field and project levels. Unless otherwise stated, all petroleum estimates reported at the company or region level are aggregated by arithmetic summation by category. Note that the aggregated Proved level may be a very conservative estimate due to the portfolio effects of arithmetic summation.
‘MMboe’ means millions (106) of barrels of oil equivalent. Dry gas volumes, defined as ‘C4 minus’ hydrocarbon components and non-hydrocarbon volumes that are present in sales product, are converted to oil equivalent volumes via a constant conversion factor, which for Woodside is 5.7 Bcf of dry gas per 1 MMboe. Volumes of oil and condensate, defined as ‘C5 plus’ petroleum components, are converted from MMbbl to MMboe on a 1:1 ratio.
The estimates of petroleum resources are based on and fairly represent information and supporting documentation prepared by qualified petroleum reserves and resources evaluators. The estimates have been approved by Mr Ian F. Sylvester, Woodside’s Vice President Reservoir Management, who is a full-time employee of the company and a member of the Society of Petroleum Engineers. Mr Sylvester’s qualifications include a Master of Engineering (Petroleum Engineering) from Imperial College, University of London, England, and more than 20 years of relevant experience.
16 August 2017Half-Year 2017 Results Briefing |
Notes on petroleum resource estimates
33