Embed Size (px)
Citation preview
A&A 549, A26 (2013)DOI: 10.1051/0004-6361/201219898c© ESO 2012
Astronomy&
Astrophysics
Infrared radiative transfer in atmospheresof Earth-like planets around F, G, K, and M stars
I. Clear-sky thermal emission spectra and weighting functions?
M. Vasquez1, F. Schreier1, S. Gimeno García1,2, D. Kitzmann3, B. Patzer3, H. Rauer3,4, and T. Trautmann1
1 DLR – Deutsches Zentrum für Luft- und Raumfahrt, Institut für Methodik der Fernerkundung, Oberpfaffenhofen, 82234 Weßling,Germanye-mail: [email protected]
2 TUM – Technische Universität München, Lehrstuhl für Methodik der Fernerkundung, Arcisstr. 21, 80333 München, Germany3 TUB – Technische Universität Berlin, Zentrum für Astronomie und Astrophysik, Hardenbergstr. 36, 10623 Berlin, Germany4 DLR – Deutsches Zentrum für Luft- und Raumfahrt, Institut für Planetenforschung, Rutherfordstr. 2, 12489 Berlin, Germany
Received 26 June 2012 / Accepted 18 October 2012
ABSTRACT
Context. The atmosphere of Earth-like extrasolar planets orbiting different types of stars is influenced by the spectral dependence ofthe incoming stellar radiation. The changes in structure and composition affect atmospheric radiation, hence the spectral appearanceof these exoplanets.Aims. We provide a thorough investigation of infrared radiative transfer in cloud-free exoplanets atmospheres by not only analyzingthe planetary spectral appearance but also discussing the radiative processes behind the spectral features in detail and identifying theregions in the atmosphere that contribute most at a given wavelength.Methods. Using cloud-free scenarios provided by a one-dimensional radiative-convective steady-state atmospheric model, we com-puted high-resolution infrared transmission and emission spectra, as well as weighting functions for exoplanets located within thehabitable zone of F, G, K, and M stars by means of a line-by-line molecular absorption model and a Schwarzschild solver for theradiative transfer. The monochromatic spectra were convolved with appropriate spectral response functions to study the effects offinite instrument resolution.Results. Spectra of the exoplanets of F, G, K, and M stars were analyzed in the 4.5 µm N2O band, the 4.3 µm and 15 µm CO2 bands,the 7.7 µm CH4 band, the 6.3 µm H2O band, and the 9.6 µm O3 band. Differences in the state of the atmosphere of the exoplanetsclearly show up in the thermal infrared spectra; absorption signatures known from Earth can be transformed to emission features (andvice versa). Weighting functions show that radiation in the absorption bands of the uniformly mixed gases (CO2 , CH4 , N2O) and(to some extent) ozone comes from the stratosphere and upper troposphere, and also indicate that changes in the atmospheres canshift sources of thermal radiation to lower or higher altitudes. Molecular absorption and/or emission features can be identified in thehigh-resolution spectra of all planets and in most reduced resolution spectra.Conclusions. Insight into radiative transfer processes is essential for analyzing exoplanet spectral observations; for instance, under-standing the impact of the temperature profile (nb. non-existence of an inversion) on the CO2 bands facilitates their interpretationand can help avoid false positive or negative estimates of O3 . The detailed analysis of the radiation source and sink regions couldeven help give an indication about the feasibility of identifying molecular signatures in cloud-covered planets, i.e. radiation mainlycoming from the upper atmosphere is less likely to be hidden by clouds. Infrared radiative transfer and biomarker detectability incloud-covered exoplanets will be presented in a companion paper.
Key words. radiative transfer – techniques: spectroscopic – planets and satellites: atmospheres – infrared: planetary systems
1. Introduction
The search for the potential habitability of extrasolar planets in-cludes the study of their atmospheres. The atmospheric compo-sition (molecules and particles) and physical conditions of extra-solar planets can be revealed and analyzed through spectroscopy,since the only quantity that can be measured from the planetsis the flux. In determining the habitability of extrasolar planets,studies concentrate on Earth-like bodies since our home planet isthe only available guidance in understanding planets where lifemay develop. For this, the modeled spectra of Earth-like planetsmay offer information on the atmosphere due to the influence ofthe different types of stars.
? Appendix is available in electronic form athttp://www.aanda.org
Several groups have studied the potential biosignatures ofexoplanets in the infrared and/or visible-ultraviolet spectralregime. Schindler & Kasting (2000) modeled the longwave ther-mal infrared for Earth, a methane rich early Earth, Mars, andearly Venus. Des Marais et al. (2002) investigated molecularbands of biomarker and greenhouse gases in order to providewavelength regions and spectral features useful for character-izing potentially habitable exoplanets. The problem of “false-positive detection” of biosignatures with NASA’s TerrestrialPlanet Finder or ESA’s Darwin has been discussed by Schindler& Kasting (2000) and Selsis et al. (2002), respectively. Seguraet al. (2003, 2005) analyzed the feasibility to observe the biosig-natures of Earth-like planets orbiting different main sequencestars. Complementary to Des Marais et al. providing spec-tra of present day Earth with different molecular abundances,
Article published by EDP Sciences A26, page 1 of 13
A&A 549, A26 (2013)
Kaltenegger et al. (2007) modeled spectra for different geolog-ical epochs of Earth. Grenfell et al. (2011) assessed biosigna-tures and their robustness under varying conditions for earlyEarth’s Proterozoic epoch. Rauer et al. (2011) studied atmo-spheric chemistry and the resulting transmission and emissionspectra of super-Earth planetary atmospheres orbiting the habit-able zones of a variety of M-dwarf stars.
The presence and characteristics of clouds depends on thestate of the atmosphere, and in turn clouds influence the atmo-sphere. In particular, clouds modify the atmospheric radiationand temperature distribution (e.g. Kitzmann et al. 2010), hencealso the spectral appearance of a planet. Des Marais et al. (2002)considered clouds in the radiative transfer calculations by “in-serting continuum absorbing/emitting layers at appropriate al-titudes”. Clouds have not been considered in the Segura et al.(2003, 2005) studies. Kaltenegger et al. (2007) modeled radia-tive transfer assuming a weighted average of cloud-free, low-,medium-, and high-level clouds; however, the thermal structureof the atmosphere apparently has not been adjusted to the cloudi-ness. The impact of low-level water or high-level ice clouds onthe low-resolution, thermal emission spectra of exoplanets orbit-ing F, G, K, or M stars is described by Kitzmann et al. (2011).
To study the feasibility of detecting biosignatures in cloud-contaminated exoplanet spectra based on a (physically) consis-tent description of atmospheres (as provided by, e.g., a one-dimensional radiative convective climate model coupled witha cloud model, Kitzmann et al. 2010) is clearly desirable.However, an assessment of the impact of clouds on the spec-tral signatures of exoplanets requires a profound understandingof radiative transfer and spectral appearance of cloud-free, puregaseous atmospheres.
Accordingly, we present here a detailed description of ther-mal infrared emission of clear-sky atmospheres of exoplanetsorbiting F, G, K, and M stars, both for “ideal” high-resolutionspectra as provided by line-by-line (lbl) modeling, and for lowspectral resolution (obtained by convolution of the monochro-matic spectra with appropriate response functions) that could beperformed by current (or planned) instruments. In addition toemission and transmission spectra, we also present weightingfunctions and provide a detailed discussion of the physics givingrise to the spectral patterns seen. Weighting functions, originallyintroduced in the context of temperature sounding for meteorol-ogy and planetary science, are a quantitative measure that de-scribe how different altitude regimes contribute to the upwellingradiation. For our study of spectral signatures in cloud coveredplanets (Paper II) this information is important, because spectralregions with radiation originating from upper atmospheric layersare less likely to be affected by clouds.
The basis of this study is a lbl modeling of molecular ab-sorption. Clearly, observed spectra of exoplanets will not deliverthe high spectral resolution provided by lbl models in the fore-seeable future, and the need for these computationally expensivecalculations can be questioned. However, if a spectral signatureof a species of interest (e.g., a biosignature) cannot be detected inthe (observed) low-resolution spectra, it is unclear whether thesought-for feature does not show up because of the physics ofradiative transfer, the lack of the corresponding species in theatmosphere, or other instrumental issues (“false-negative” de-tection). Similar care has to be taken to avoid “false-positive”detections.
Furthermore, low-resolution models typically based on bandor k-distribution approaches have frequently been developed fora restricted parameter range (pressure, temperature, composi-tion), e.g. trimmed to conditions as found in Earth’s atmosphere
(e.g. Mlawer et al. 1997), and the application of these mod-els to exoplanets spanning a wide range of atmospheric condi-tions should be done with care. In particular the spectral appear-ance as indicated by these models should be carefully checkedagainst “benchmark” lbl spectra and low-resolution spectra ob-tained from them by appropriate convolution. Note that for mod-eling thermal emission spectra Selsis et al. (2002) and Kitzmannet al. (2011) used low-resolution band or correlated-k radiativetransfer models, respectively, whereas high-resolution lbl mod-els were used in all other studies mentioned above.
As an extension to previous investigations, we provide thefirst consistent treatment of all main sequence stars and the mainmolecular absorbers in the thermal infrared for various resolu-tions, and discuss the physics of infrared radiative transfer inorder to understand the spectral features. In addition, the spec-tra have been studied with and without the presence of cer-tain molecules at a very low-resolution in order to determinethe contributing molecular species. Des Marais et al. (2002)and Kaltenegger et al. (2007) have presented spectra for Earthwith varying molecular abundances or for Earth at different ge-ological epochs. Segura et al. (2003) have discussed the low-resolution spectra of F-, G-, and K-star planets with an emphasison ozone (CO2 and CH4 spectra have been shown, too). In ad-dition to these three molecules, the M dwarf study of Seguraet al. (2005) have also shown spectra of water. The CO2 band at4.3 µm has not been investigated in these studies, and N2O sig-natures have only been considered by Des Marais et al. (2002),Grenfell et al. (2011), and Rauer et al. (2011). Kitzmann et al.(2011) have simulated thermal emission spectra for main se-quence star planets only at significantly lower resolution.
This paper is organized as follows: Sect. 2 describes the at-mospheric and radiative transfer models and planetary scenarios.The resulting high-resolution planetary spectra and weightingfunctions for cloud-free atmospheres are shown and analyzed inSect. 3. Section 4 examines the modeled spectra at different res-olutions. The results are summarized in Sect. 5. This study thusprovides a starting point and reference for interpreting the in-frared emission spectra of cloud-covered exoplanet atmospherespresented in a forthcoming Paper II, and might also serve as acomplement to the papers cited above.
2. Modeling2.1. Radiative transfer
Assuming a cloud-free atmosphere and local thermodynami-cal equilibrium, radiative transfer in the thermal infrared is de-scribed by Schwarzschild’s equation, i.e. the intensity (radiance)I at wavenumber ν seen by an observer at position s = 0 is givenby the integral (e.g. Goody & Yung 1989; Zdunkowski et al.2007)
I(ν) = Ib(ν) e−τ(ν,s) +
τ(ν,s)∫0
B(ν,T
(τ′
))e−τ
′
dτ′ (1)
= Ib(ν)T (ν, sb) −
sb∫0
B(ν,T
(s′)) ∂T (ν, s′)
∂s′ds′, (2)
where B is the Planck function at temperature T , and Ib is a back-ground contribution, e.g. surface emission. The transmission Tand optical depth τ are given by Beer’s law,
T (ν, s) ≡ e−τ(ν,s) (3)
= exp
−∫ s
0ds′
∑m
nm(s′)
km(ν, p
(s′),T
(s′))
A26, page 2 of 13
M. Vasquez et al.: IR radiative transfer in atmospheres of Earth-like planets. I.
Table 1. Characteristic parameters of the exoplanets and their atmo-spheres, surfaces, and host stars.
F G K M
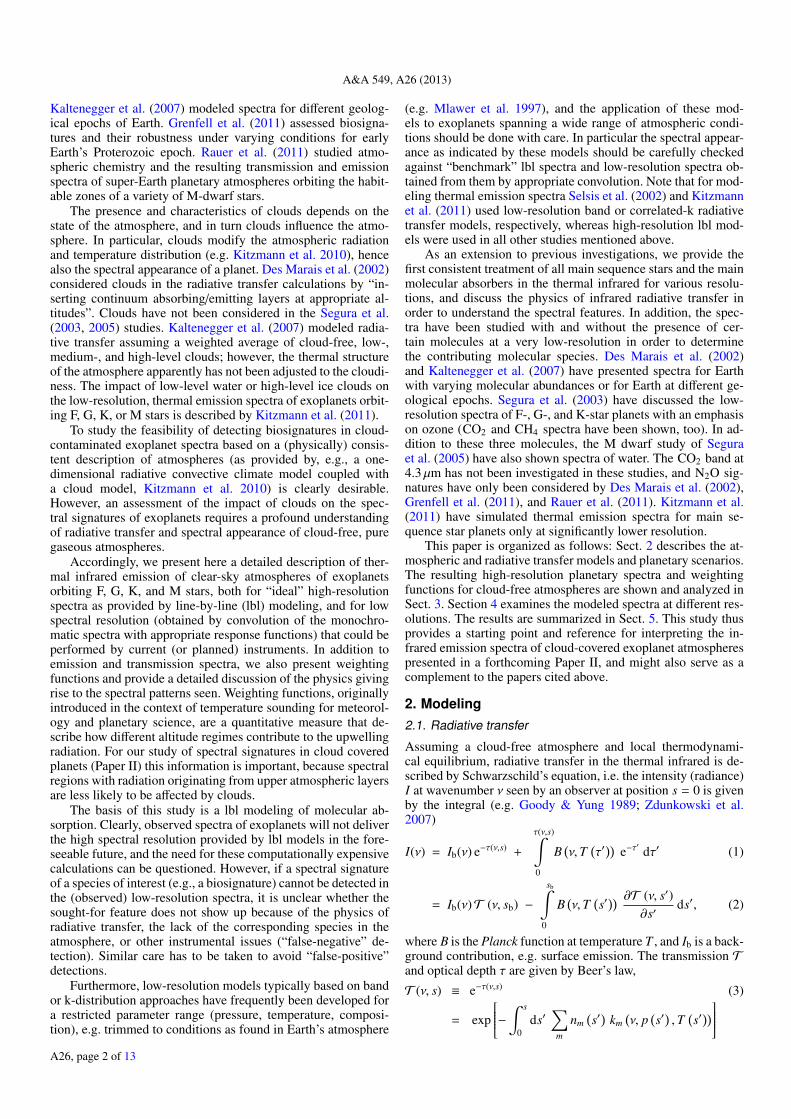
Orbital radius r [AU] 1.89 1.0 0.61 0.15Mass M/ME 1.0 1.0 1.0 1.0Stellar temperature Teff [K] 6722. 5777. 5072. 3400.Planet surface temp. Tsurf [K] 286.2 293.6 298.4 302.7Top-of-atmosphere∗ zToA [km] 72.96 65.19 59.09 59.98Surface H2O VMR [103 ppm] 11.55 18.11 24.09 30.69
Notes. (∗) Corresponds to a pressure of pToA = 0.0755 mb.
where p is the atmospheric pressure and nm the number densityof molecule m. In high-resolution line-by-line models the ab-sorption cross section km is given by the superposition of manylines, km(ν, p,T ) =
∑l S l(T ) g(ν, p,T ), each described by the
product of a temperature-dependent line strength S l and a nor-malized line shape function g describing the broadening mech-anism(s). The combined effect of pressure broadening (corre-sponding to a Lorentzian line shape) and Doppler broadening(Gaussian line shape) is represented by a Voigt line profile (cf.,e.g. Schreier 2011).
Radiative transfer calculations were made with GARLIC(Generic Atmospheric Radiation Line-by-line Infrared Code,a modern Fortran reimplementation of the Fortran 77code MIRART/SQuIRRL, Schreier & Schimpf 2001).MIRART/SQuIRRL has been verified in extensive inter-comparisons, e.g. von Clarmann et al. (2002) and Melsheimeret al. (2005); recently, Hedelt et al. (2011) have used the codesuccessfully to model observations of the Venus transit 2004made by the Tenerife Vacuum Tower Telescope, and Vasquezet al. (2012) modeled near-infrared spectra of Venus observedby the SCIAMACHY instrument aboard ESA’s ENVISAT.Furthermore, it has been used for an assessment of exoplanetbiosignatures by Grenfell et al. (2011); Rauer et al. (2011) andvon Paris et al. (2011).
In this study, absorption cross sections for H2O, CO2 , O3 ,CH4 , and N2O were calculated using the molecular spectral linedatabase HITRAN 2008 (Rothman et al. 2009). Continuum cor-rections were additionally taken into account, e.g. the CKD con-tinuum (Clough et al. 1989) for water vapor. All spectra wereconvolved by applying Gaussian functions representing typicalinstruments of different resolutions.
The emergent flux spectra for planets around F2V, G2V,K2V, and M4.5V stars (see Table 1) were calculated by a super-position of individual radiance spectra (at appropriate angles)to account for the hemispherical integration. This integrationwas computed by considering beam radiances in a plane-parallelatmosphere. To check this approach, the disk-averaged outgo-ing fluxes were also computed for a spherical atmosphere. Onlysmall differences were found between the fluxes. The reason be-hind this agreement is that the beams with zenith angles close to0◦ are not very affected by the sphericity of the planet and arethe main contributors to the total flux. On the other hand, spher-ical beam radiances close to 90◦ (almost parallel to the surface)differ considerably from the plane-parallel ones, but their contri-butions to the total flux is much less, and as a result, their impacton the flux integral turns out to be very low.
160 180 200 220 240 260 280 300 320 340
10−1
100
101
102
103
Temperature T (K)
Pre
ssur
ep
(mb)
FGKM
Fig. 1. Pressure-temperature profiles of planets orbiting F, G, K, andM stars for clear sky conditions (see Kitzmann et al. 2010, for more de-tails). The markers shown for the G star profile indicate the 58 pressurelevels.
2.2. Scenarios
The atmospheric profiles used in the radiative transfer calcula-tions of the different stars’ planets were calculated using a 1Dsteady-state, radiative-convective model. For a consistent de-scription of the effect of clouds on the planetary spectral sig-natures, we decided to use the atmospheric profiles of Kitzmannet al. (2010) in both papers (i.e., only pressure, temperature, andwater profiles are planet-dependent). This model can take the ef-fect clouds produce on the atmosphere of the planet into account;however, here we only use the cloud-free atmospheric profiles,and cloud effects will be discussed in Paper II. Stellar spectra fortypical F, G, K, and M stars were based on observations and/orsynthetic data. The orbital distances of the planets to their cen-tral stars were scaled so that the stellar energy input at the top ofthe atmosphere equals the solar constant, see Table 1 (or Table 3of Kitzmann et al. 2010). A detailed description of the model isgiven in Kitzmann et al. (2010).
The profiles of the major chemical species were obtainedwith a detailed photochemical model representing the modernEarth’s atmosphere (Grenfell et al. 2007) and are used for allmodel calculations. The empirical relative humidity distributionof Manabe & Wetherald (1967) is used for the relative humidityin. The radiative transfer in the atmospheric model, consists of aδ-two-stream quadrature at short wavelengths and a hemisphericmean two-stream method in the infrared (Toon et al. 1989). Inthe Kitzmann et al. (2010) radiative-convective model, gaseousabsorption in the IR was described by the correlated-k method(Mlawer et al. 1997).
The pressure-temperature profiles for the cloud-free atmo-spheres, given up to a top-of-atmosphere (ToA) pressure ofpToA = 0.0755 mb, for the different planets are shown in Fig. 1.Host stars of different stellar types have a strong impact on the at-mospheric conditions of their orbiting planets, as already pointedby, e.g., Segura et al. (2003). The surface temperature can differby several tens of degrees, and the difference at the stratopausecan be greater than 100 K; however, the surface temperatures ofthe cloud-free planets are above the freezing point of water forall planets (see the temperature profiles of the K- and M-starplanets in comparison to the F-star planet).
The F- and G-star planets result in a temperature inver-sion in their stratospheres. The F-star planet has even higherstratospheric temperatures than its surface. The K- and M-starplanet’s stratosphere is significantly different; in particular, the
A26, page 3 of 13
A&A 549, A26 (2013)
500 1000 1500 2000 2500 3000Wavenumber [cm
−1]
0
0.2
0.4
0.6
0.8
1
O3CH4N2OCO2
0
0.2
0.4
0.6
0.8
1
Tra
nsm
issi
on
H2O
0
0.2
0.4
0.6
0.8
1
FGKM
3.33µm456.6681012.51520
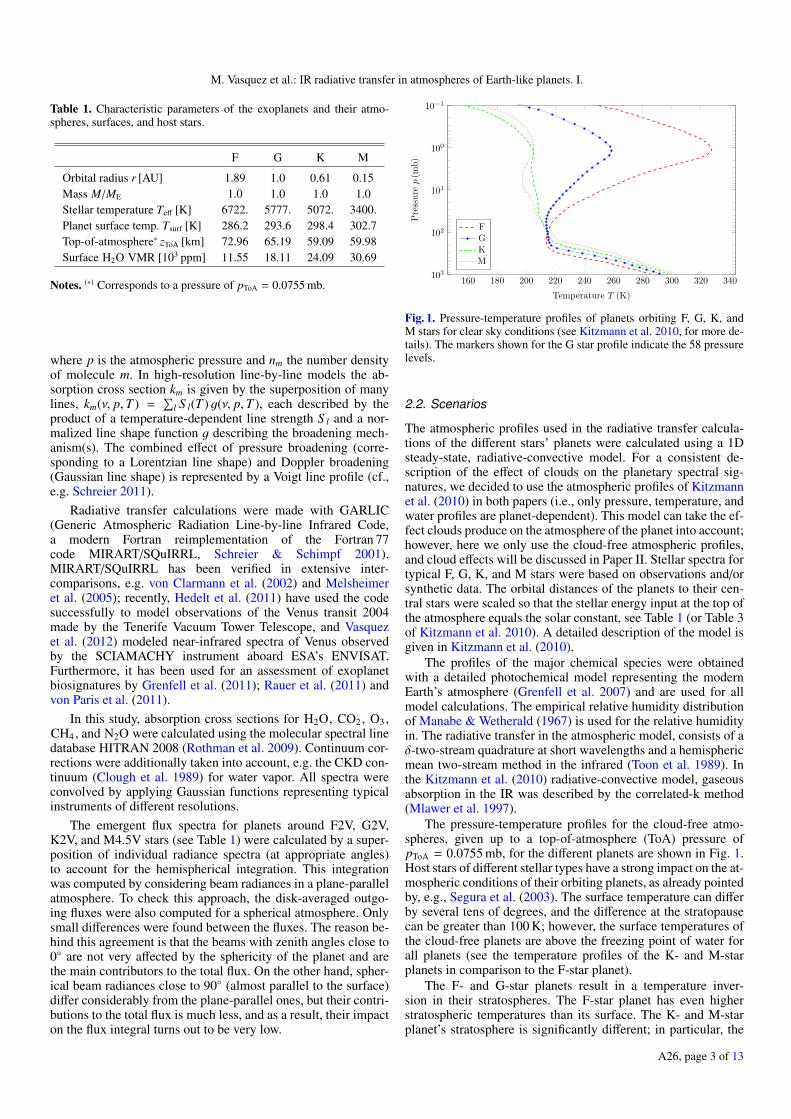
Fig. 2. Total transmission for a verti-cal path through the atmosphere of allplanet types (top panel). Transmissiondue to water vapor (middle panel) andthe other absorbers (lower panel) for anEarth atmosphere. Wavelengths are in-dicated at the top of the figure.
atmospheric temperatures decrease monotonically with increas-ing height throughout the K-star planet’s atmosphere. Since Kand M stars are colder than the F and G stars, the amount ofenergy emitted in the ultraviolet (UV) and visible is consider-ably smaller. This UV radiation is mostly absorbed by the strato-spheric O3 and, as a result, the stratosphere becomes warmer.This mechanism explains the high temperatures in the F- andG-star planets’ stratospheres. Since there is not enough energyin the UV delivered by the K and M stars, temperatures decreasefurther with altitude in their planet atmospheres. Strictly speak-ing, the K- and M-star planets do not have a stratosphere, i.e. anintermediate altitude regime of increasing temperatures; how-ever, we use this term henceforth even for these planets to de-note the mid-atmospheric altitude range, and the tropopause isconsidered as the upper end of the convective region.
3. Spectra at high resolution
Transmission and emission spectra, as well as weighting func-tions of Earth-like planets for a cloud-free atmosphere, are pre-sented in this section. A detailed study of the spectral signaturesof the main molecular absorbers found in the thermal infraredspectrum of all four planets is also presented. The G-star planethas been taken as reference in identifying the molecular bandsfound within the infrared region.
3.1. Transmission spectra and weighting functions
The total transmission for all planet types and the indi-vidual contributions for an Earth atmosphere are shown inFig. 2. The atmospheric window regions 800−1200 cm−1
and 2500−3000 cm−1 are conveniently used to estimate the sur-face temperature; however, these estimates might be more reli-able for F- or G-star planets than for K- or M-star planets due totheir decreased opacity.
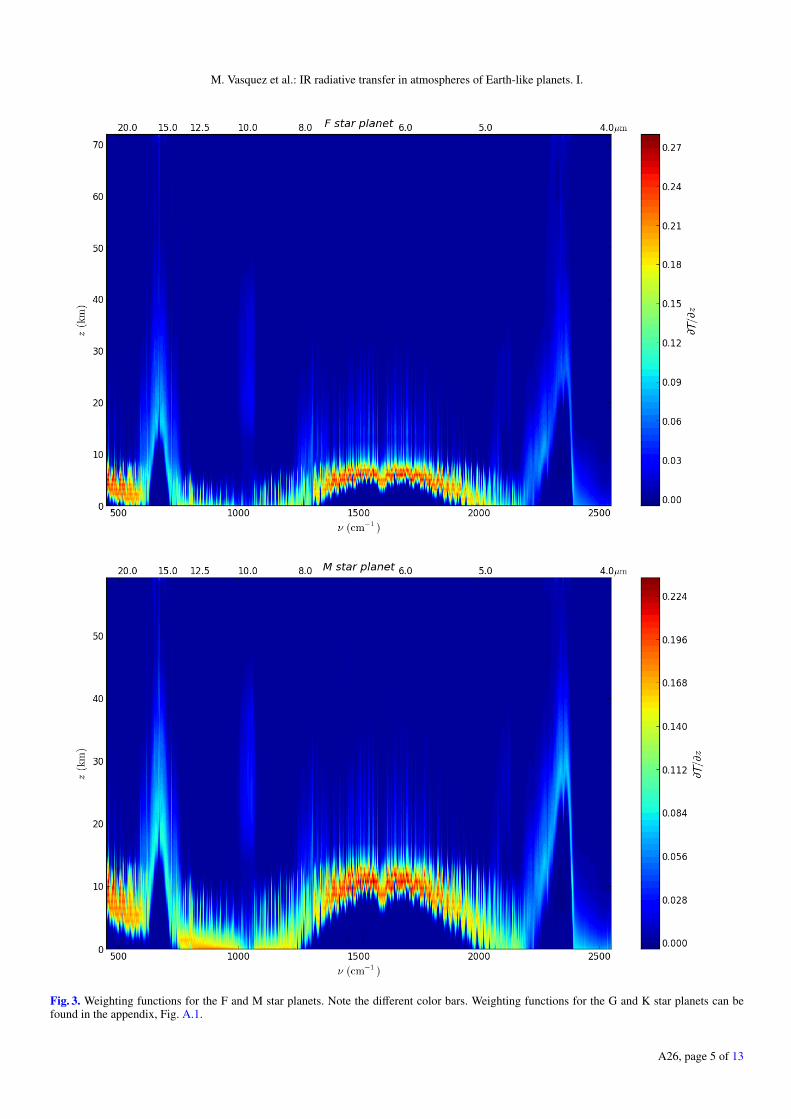
Differences in the state of the atmosphere have an in-fluence on the distribution of sources and sinks of thermalradiation, which can be clearly seen by comparing of the
so-called weighting functions of the F- and M-type star plan-ets, Fig. 3. Weighting functions, defined by the partial deriva-tives ∂T (ν, z)/∂z, are an important concept for nadir soundingof atmospheric temperature and are a measure of the contribu-tion of a particular atmospheric layer to the upwelling radiationseen by a downlooking observer, see Eq. (2). In this equation,we use geometrical distance s (essentially altitude z) as inte-gration variable. Because pressure is closely related to altitude,Schwarzschild’s equation can be easily reformulated in terms ofpressure and weighting functions redefined accordingly.
In the context of inverse problems and temperature sounding(e.g. Craig & Brown 1986; Hanel et al. 2003), the SchwarzschildEq. (2) is regarded as a Fredholm integral equation where theweighting function is termed the kernel of the integral equationand the unknown B (ν,T (z)) is called the source term. Actuallythe unknown is the temperature profile, but Planck’s functionestablishes a one-to-one correspondence between B and T , i.e.,T = B−1. In the case of microwave atmospheric sounding, tem-perature and Planck radiation are identical except for a constant,according to the Rayleigh-Jeans approximation. The propertiesof the kernel or its corresponding matrix representation (e.g.,condition number or distribution of singular values) are crucialfor an assessment of the inversion. Recently, Lee et al. (2012)have discussed a closely related quantity – the contribution func-tion (the product of the weighting function and the Planck func-tion, i.e., the integrand of the Schwarzschild equation) to “assessthe vertical sensitivity of the emission spectrum to temperaturesand molecular composition”.
As mentioned above, weighting functions are a key quan-tity of temperature sounding. For Earth temperature retrievals,an implicit assumption is that the amount of CO2 (for ther-mal infrared sounding) or O2 (for microwave sounding) is wellknown and independent of altitude. Clearly, the first assump-tion is not justified for exoplanets, whereas it is reasonable toassume a constant concentration over a wide altitude range forthese long-lived species. Nevertheless, the one-to-one wavenum-ber (or wavelength) to altitude (or pressure) mapping as demon-strated by the weighting functions (see Figs. 3–5) will also be
A26, page 4 of 13
M. Vasquez et al.: IR radiative transfer in atmospheres of Earth-like planets. I.
Fig. 3. Weighting functions for the F and M star planets. Note the different color bars. Weighting functions for the G and K star planets can befound in the appendix, Fig. A.1.
A26, page 5 of 13
A&A 549, A26 (2013)
500 1000 1500 2000 2500Wavenumber [cm
−1]
0
10
20
30
40
Alti
tude
[km
]
F star planetG star planetK star planetM star planet
5 4.5 4µm7 68102030 15 12.5
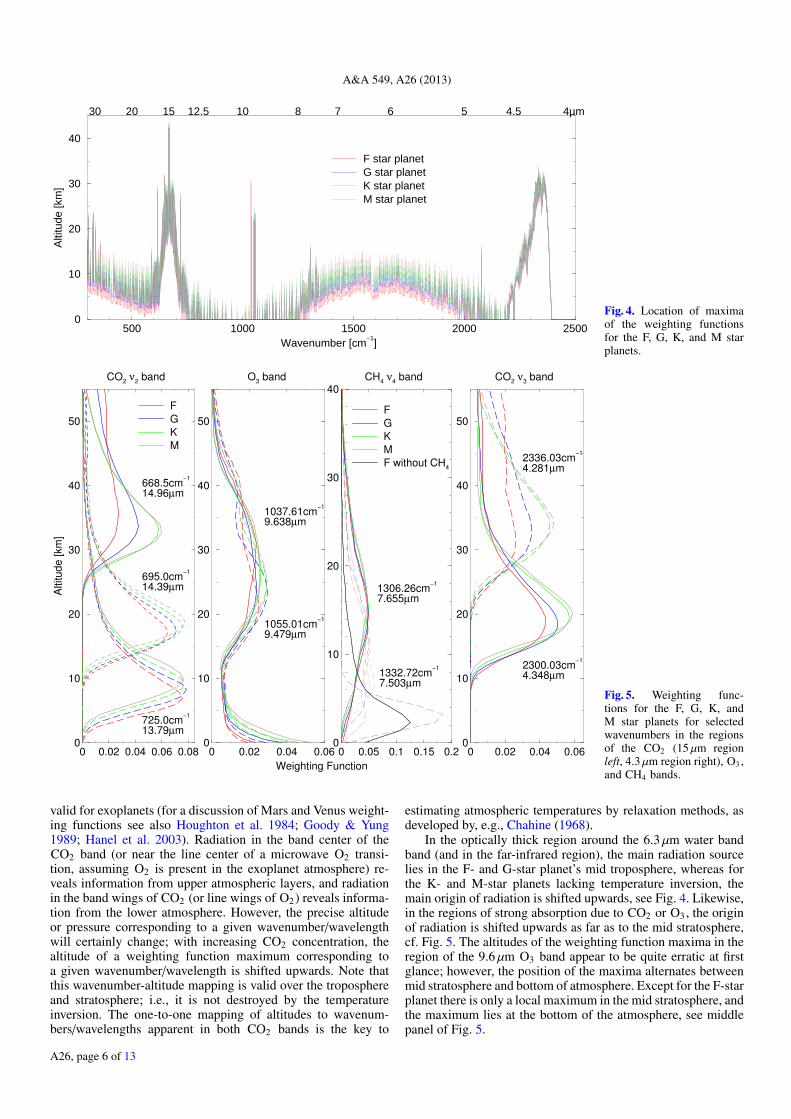
Fig. 4. Location of maximaof the weighting functionsfor the F, G, K, and M starplanets.
0 0.02 0.04 0.06 0.080
10
20
30
40
50
Altitu
de
[km
]
CO2 ν
2 band
Thu S
ep 2
0 1
5:1
1:1
7 2
012
F
G
K
M
668.5cm−1
695.0cm−1
725.0cm−1
14.96µm
14.39µm
13.79µm
0 0.02 0.04 0.06
Weighting Function
0
10
20
30
40
50
O3 band
Thu S
ep 2
0 1
5:1
1:1
7 2
012
1037.61cm−1
9.638µm
1055.01cm−1
9.479µm
0 0.05 0.1 0.15 0.20
10
20
30
40CH
4 ν
4 band
Thu S
ep 2
0 1
5:1
1:1
7 2
012
F
G
K
M
F without CH4
1306.26cm−1
7.655µm
1332.72cm−1
7.503µm
0 0.02 0.04 0.060
10
20
30
40
50
CO2 ν
3 band
Thu S
ep 2
0 1
5:1
1:1
7 2
012
2300.03cm−1
4.348µm
2336.03cm−1
4.281µm
Fig. 5. Weighting func-tions for the F, G, K, andM star planets for selectedwavenumbers in the regionsof the CO2 (15 µm regionleft, 4.3 µm region right), O3 ,and CH4 bands.
valid for exoplanets (for a discussion of Mars and Venus weight-ing functions see also Houghton et al. 1984; Goody & Yung1989; Hanel et al. 2003). Radiation in the band center of theCO2 band (or near the line center of a microwave O2 transi-tion, assuming O2 is present in the exoplanet atmosphere) re-veals information from upper atmospheric layers, and radiationin the band wings of CO2 (or line wings of O2 ) reveals informa-tion from the lower atmosphere. However, the precise altitudeor pressure corresponding to a given wavenumber/wavelengthwill certainly change; with increasing CO2 concentration, thealtitude of a weighting function maximum corresponding toa given wavenumber/wavelength is shifted upwards. Note thatthis wavenumber-altitude mapping is valid over the troposphereand stratosphere; i.e., it is not destroyed by the temperatureinversion. The one-to-one mapping of altitudes to wavenum-bers/wavelengths apparent in both CO2 bands is the key to
estimating atmospheric temperatures by relaxation methods, asdeveloped by, e.g., Chahine (1968).
In the optically thick region around the 6.3 µm water bandband (and in the far-infrared region), the main radiation sourcelies in the F- and G-star planet’s mid troposphere, whereas forthe K- and M-star planets lacking temperature inversion, themain origin of radiation is shifted upwards, see Fig. 4. Likewise,in the regions of strong absorption due to CO2 or O3 , the originof radiation is shifted upwards as far as to the mid stratosphere,cf. Fig. 5. The altitudes of the weighting function maxima in theregion of the 9.6 µm O3 band appear to be quite erratic at firstglance; however, the position of the maxima alternates betweenmid stratosphere and bottom of atmosphere. Except for the F-starplanet there is only a local maximum in the mid stratosphere, andthe maximum lies at the bottom of the atmosphere, see middlepanel of Fig. 5.
A26, page 6 of 13
M. Vasquez et al.: IR radiative transfer in atmospheres of Earth-like planets. I.
5 10 15 20 25 30Wavelength [µm]
0
10
20
30
Flu
x [1
03 erg
/ s
/ (cm
2 µm
)]
FGKM
CO2H2O
CH4
O3
CO2
H2O
2000 1000 500 4001250 800 666 333 cm−1
.
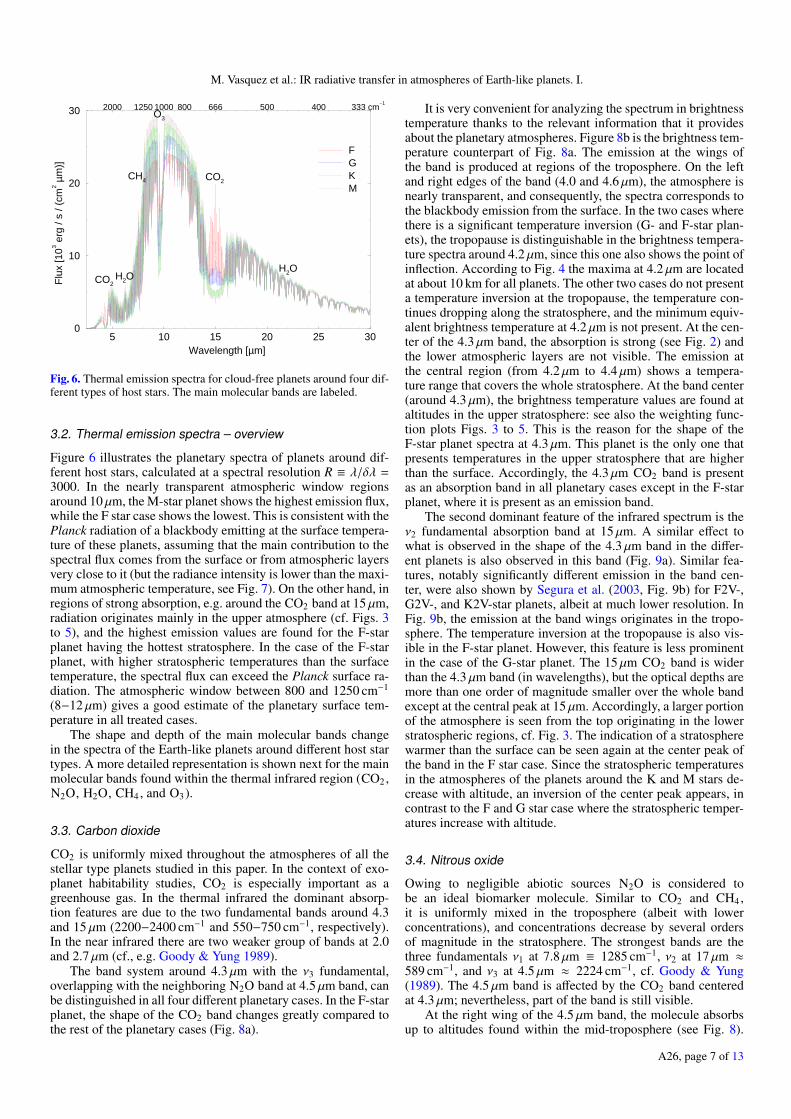
Fig. 6. Thermal emission spectra for cloud-free planets around four dif-ferent types of host stars. The main molecular bands are labeled.
3.2. Thermal emission spectra – overview
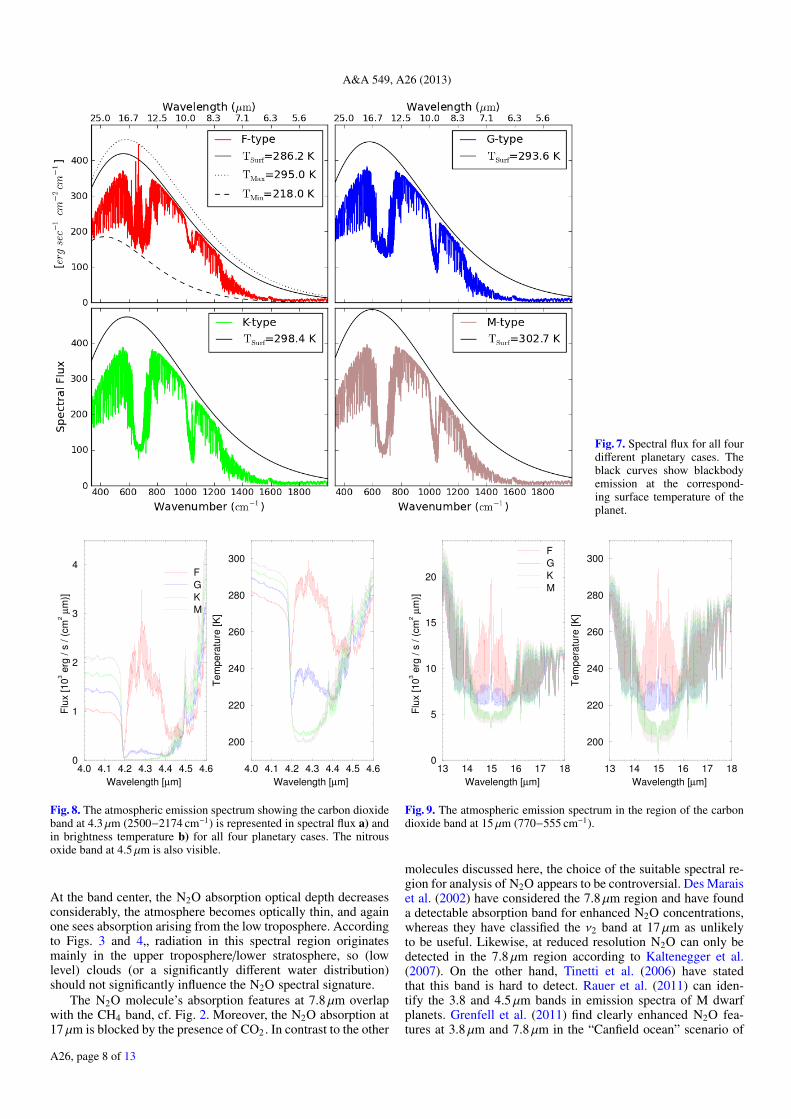
Figure 6 illustrates the planetary spectra of planets around dif-ferent host stars, calculated at a spectral resolution R ≡ λ/δλ =3000. In the nearly transparent atmospheric window regionsaround 10 µm, the M-star planet shows the highest emission flux,while the F star case shows the lowest. This is consistent with thePlanck radiation of a blackbody emitting at the surface tempera-ture of these planets, assuming that the main contribution to thespectral flux comes from the surface or from atmospheric layersvery close to it (but the radiance intensity is lower than the maxi-mum atmospheric temperature, see Fig. 7). On the other hand, inregions of strong absorption, e.g. around the CO2 band at 15 µm,radiation originates mainly in the upper atmosphere (cf. Figs. 3to 5), and the highest emission values are found for the F-starplanet having the hottest stratosphere. In the case of the F-starplanet, with higher stratospheric temperatures than the surfacetemperature, the spectral flux can exceed the Planck surface ra-diation. The atmospheric window between 800 and 1250 cm−1
(8−12 µm) gives a good estimate of the planetary surface tem-perature in all treated cases.
The shape and depth of the main molecular bands changein the spectra of the Earth-like planets around different host startypes. A more detailed representation is shown next for the mainmolecular bands found within the thermal infrared region (CO2 ,N2O, H2O, CH4 , and O3 ).
3.3. Carbon dioxide
CO2 is uniformly mixed throughout the atmospheres of all thestellar type planets studied in this paper. In the context of exo-planet habitability studies, CO2 is especially important as agreenhouse gas. In the thermal infrared the dominant absorp-tion features are due to the two fundamental bands around 4.3and 15 µm (2200−2400 cm−1 and 550−750 cm−1, respectively).In the near infrared there are two weaker group of bands at 2.0and 2.7 µm (cf., e.g. Goody & Yung 1989).
The band system around 4.3 µm with the ν3 fundamental,overlapping with the neighboring N2O band at 4.5 µm band, canbe distinguished in all four different planetary cases. In the F-starplanet, the shape of the CO2 band changes greatly compared tothe rest of the planetary cases (Fig. 8a).
It is very convenient for analyzing the spectrum in brightnesstemperature thanks to the relevant information that it providesabout the planetary atmospheres. Figure 8b is the brightness tem-perature counterpart of Fig. 8a. The emission at the wings ofthe band is produced at regions of the troposphere. On the leftand right edges of the band (4.0 and 4.6 µm), the atmosphere isnearly transparent, and consequently, the spectra corresponds tothe blackbody emission from the surface. In the two cases wherethere is a significant temperature inversion (G- and F-star plan-ets), the tropopause is distinguishable in the brightness tempera-ture spectra around 4.2 µm, since this one also shows the point ofinflection. According to Fig. 4 the maxima at 4.2 µm are locatedat about 10 km for all planets. The other two cases do not presenta temperature inversion at the tropopause, the temperature con-tinues dropping along the stratosphere, and the minimum equiv-alent brightness temperature at 4.2 µm is not present. At the cen-ter of the 4.3 µm band, the absorption is strong (see Fig. 2) andthe lower atmospheric layers are not visible. The emission atthe central region (from 4.2 µm to 4.4 µm) shows a tempera-ture range that covers the whole stratosphere. At the band center(around 4.3 µm), the brightness temperature values are found ataltitudes in the upper stratosphere: see also the weighting func-tion plots Figs. 3 to 5. This is the reason for the shape of theF-star planet spectra at 4.3 µm. This planet is the only one thatpresents temperatures in the upper stratosphere that are higherthan the surface. Accordingly, the 4.3 µm CO2 band is presentas an absorption band in all planetary cases except in the F-starplanet, where it is present as an emission band.
The second dominant feature of the infrared spectrum is theν2 fundamental absorption band at 15 µm. A similar effect towhat is observed in the shape of the 4.3 µm band in the differ-ent planets is also observed in this band (Fig. 9a). Similar fea-tures, notably significantly different emission in the band cen-ter, were also shown by Segura et al. (2003, Fig. 9b) for F2V-,G2V-, and K2V-star planets, albeit at much lower resolution. InFig. 9b, the emission at the band wings originates in the tropo-sphere. The temperature inversion at the tropopause is also vis-ible in the F-star planet. However, this feature is less prominentin the case of the G-star planet. The 15 µm CO2 band is widerthan the 4.3 µm band (in wavelengths), but the optical depths aremore than one order of magnitude smaller over the whole bandexcept at the central peak at 15 µm. Accordingly, a larger portionof the atmosphere is seen from the top originating in the lowerstratospheric regions, cf. Fig. 3. The indication of a stratospherewarmer than the surface can be seen again at the center peak ofthe band in the F star case. Since the stratospheric temperaturesin the atmospheres of the planets around the K and M stars de-crease with altitude, an inversion of the center peak appears, incontrast to the F and G star case where the stratospheric temper-atures increase with altitude.
3.4. Nitrous oxide
Owing to negligible abiotic sources N2O is considered tobe an ideal biomarker molecule. Similar to CO2 and CH4 ,it is uniformly mixed in the troposphere (albeit with lowerconcentrations), and concentrations decrease by several ordersof magnitude in the stratosphere. The strongest bands are thethree fundamentals ν1 at 7.8 µm ≡ 1285 cm−1, ν2 at 17 µm ≈
589 cm−1, and ν3 at 4.5 µm ≈ 2224 cm−1, cf. Goody & Yung(1989). The 4.5 µm band is affected by the CO2 band centeredat 4.3 µm; nevertheless, part of the band is still visible.
At the right wing of the 4.5 µm band, the molecule absorbsup to altitudes found within the mid-troposphere (see Fig. 8).
A26, page 7 of 13
A&A 549, A26 (2013)
Fig. 7. Spectral flux for all fourdifferent planetary cases. Theblack curves show blackbodyemission at the correspond-ing surface temperature of theplanet.
4.0 4.1 4.2 4.3 4.4 4.5 4.6
Wavelength [µm]
0
1
2
3
4
Flu
x [10
3 e
rg / s
/ (
cm
2 µ
m)]
Th
u S
ep
27
17
:18
:46
20
12
F
G
K
M
4.0 4.1 4.2 4.3 4.4 4.5 4.6
Wavelength [µm]
200
220
240
260
280
300
Tem
pera
ture
[K
]
Th
u S
ep
27
17
:18
:46
20
12
.
Fig. 8. The atmospheric emission spectrum showing the carbon dioxideband at 4.3 µm (2500−2174 cm−1) is represented in spectral flux a) andin brightness temperature b) for all four planetary cases. The nitrousoxide band at 4.5 µm is also visible.
At the band center, the N2O absorption optical depth decreasesconsiderably, the atmosphere becomes optically thin, and againone sees absorption arising from the low troposphere. Accordingto Figs. 3 and 4„ radiation in this spectral region originatesmainly in the upper troposphere/lower stratosphere, so (lowlevel) clouds (or a significantly different water distribution)should not significantly influence the N2O spectral signature.
The N2O molecule’s absorption features at 7.8 µm overlapwith the CH4 band, cf. Fig. 2. Moreover, the N2O absorption at17 µm is blocked by the presence of CO2 . In contrast to the other
13 14 15 16 17 18
Wavelength [µm]
0
5
10
15
20
Flu
x [10
3 e
rg / s
/ (
cm
2 µ
m)]
Th
u S
ep
27
17
:32
:20
20
12
F
G
K
M
13 14 15 16 17 18
Wavelength [µm]
200
220
240
260
280
300
Tem
pera
ture
[K
]
Th
u S
ep
27
17
:32
:20
20
12
.
Fig. 9. The atmospheric emission spectrum in the region of the carbondioxide band at 15 µm (770−555 cm−1).
molecules discussed here, the choice of the suitable spectral re-gion for analysis of N2O appears to be controversial. Des Maraiset al. (2002) have considered the 7.8 µm region and have founda detectable absorption band for enhanced N2O concentrations,whereas they have classified the ν2 band at 17 µm as unlikelyto be useful. Likewise, at reduced resolution N2O can only bedetected in the 7.8 µm region according to Kaltenegger et al.(2007). On the other hand, Tinetti et al. (2006) have statedthat this band is hard to detect. Rauer et al. (2011) can iden-tify the 3.8 and 4.5 µm bands in emission spectra of M dwarfplanets. Grenfell et al. (2011) find clearly enhanced N2O fea-tures at 3.8 µm and 7.8 µm in the “Canfield ocean” scenario of
A26, page 8 of 13
M. Vasquez et al.: IR radiative transfer in atmospheres of Earth-like planets. I.
4.2 4.3 4.4 4.5 4.6 4.7 4.8Wavelength [µm]
0
1
2
3
4
Flu
x [1
03 erg
/s/(
cm2 µ
m)]
Thu
Sep
27
16:5
2:32
201
2
H2O+CO2+O3+CH4+N2OH2O+CO2+O3+CH4H2O+O3+CH4+N2O
7.5 7.6 7.7 7.8 7.9Wavelength [µm]
0
5
10
15
20
Thu
Sep
27
16:5
2:32
201
2
H2O+CO2+O3+CH4+N2OCO2+O3+CH4+N2OH2O+CO2+O3+CH4H2O+CO2+O3+N2O
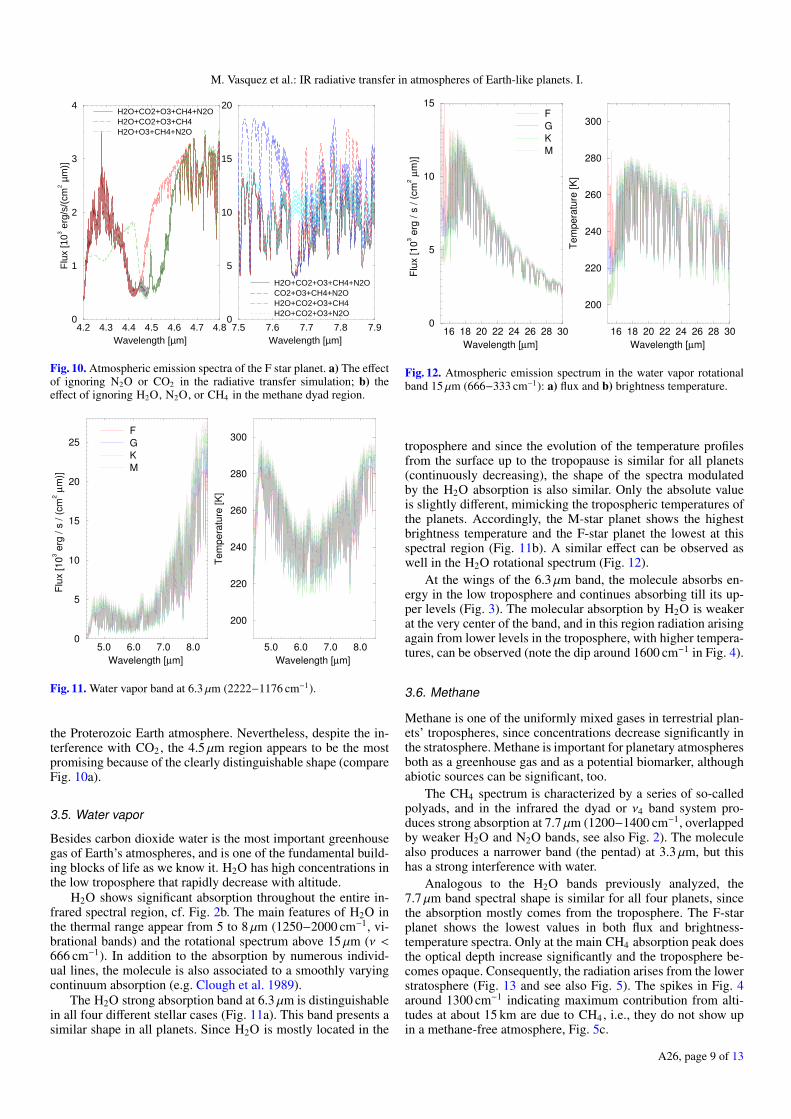
Fig. 10. Atmospheric emission spectra of the F star planet. a) The effectof ignoring N2O or CO2 in the radiative transfer simulation; b) theeffect of ignoring H2O, N2O, or CH4 in the methane dyad region.
5.0 6.0 7.0 8.0
Wavelength [µm]
0
5
10
15
20
25
Flu
x [10
3 e
rg / s
/ (
cm
2 µ
m)]
Th
u S
ep
27
17
:29
:11
20
12
F
G
K
M
5.0 6.0 7.0 8.0
Wavelength [µm]
200
220
240
260
280
300
Tem
pera
ture
[K
]
Th
u S
ep
27
17
:29
:11
20
12
.
Fig. 11. Water vapor band at 6.3 µm (2222−1176 cm−1).
the Proterozoic Earth atmosphere. Nevertheless, despite the in-terference with CO2 , the 4.5 µm region appears to be the mostpromising because of the clearly distinguishable shape (compareFig. 10a).
3.5. Water vapor
Besides carbon dioxide water is the most important greenhousegas of Earth’s atmospheres, and is one of the fundamental build-ing blocks of life as we know it. H2O has high concentrations inthe low troposphere that rapidly decrease with altitude.
H2O shows significant absorption throughout the entire in-frared spectral region, cf. Fig. 2b. The main features of H2O inthe thermal range appear from 5 to 8 µm (1250−2000 cm−1, vi-brational bands) and the rotational spectrum above 15 µm (ν <666 cm−1). In addition to the absorption by numerous individ-ual lines, the molecule is also associated to a smoothly varyingcontinuum absorption (e.g. Clough et al. 1989).
The H2O strong absorption band at 6.3 µm is distinguishablein all four different stellar cases (Fig. 11a). This band presents asimilar shape in all planets. Since H2O is mostly located in the
16 18 20 22 24 26 28 30
Wavelength [µm]
0
5
10
15
Flu
x [10
3 e
rg / s
/ (
cm
2 µ
m)]
Th
u S
ep
27
17
:35
:42
20
12
F
G
K
M
16 18 20 22 24 26 28 30
Wavelength [µm]
200
220
240
260
280
300
Tem
pera
ture
[K
]
Th
u S
ep
27
17
:35
:42
20
12
.
Fig. 12. Atmospheric emission spectrum in the water vapor rotationalband 15 µm (666−333 cm−1): a) flux and b) brightness temperature.
troposphere and since the evolution of the temperature profilesfrom the surface up to the tropopause is similar for all planets(continuously decreasing), the shape of the spectra modulatedby the H2O absorption is also similar. Only the absolute valueis slightly different, mimicking the tropospheric temperatures ofthe planets. Accordingly, the M-star planet shows the highestbrightness temperature and the F-star planet the lowest at thisspectral region (Fig. 11b). A similar effect can be observed aswell in the H2O rotational spectrum (Fig. 12).
At the wings of the 6.3 µm band, the molecule absorbs en-ergy in the low troposphere and continues absorbing till its up-per levels (Fig. 3). The molecular absorption by H2O is weakerat the very center of the band, and in this region radiation arisingagain from lower levels in the troposphere, with higher tempera-tures, can be observed (note the dip around 1600 cm−1 in Fig. 4).
3.6. Methane
Methane is one of the uniformly mixed gases in terrestrial plan-ets’ tropospheres, since concentrations decrease significantly inthe stratosphere. Methane is important for planetary atmospheresboth as a greenhouse gas and as a potential biomarker, althoughabiotic sources can be significant, too.
The CH4 spectrum is characterized by a series of so-calledpolyads, and in the infrared the dyad or ν4 band system pro-duces strong absorption at 7.7 µm (1200−1400 cm−1, overlappedby weaker H2O and N2O bands, see also Fig. 2). The moleculealso produces a narrower band (the pentad) at 3.3 µm, but thishas a strong interference with water.
Analogous to the H2O bands previously analyzed, the7.7 µm band spectral shape is similar for all four planets, sincethe absorption mostly comes from the troposphere. The F-starplanet shows the lowest values in both flux and brightness-temperature spectra. Only at the main CH4 absorption peak doesthe optical depth increase significantly and the troposphere be-comes opaque. Consequently, the radiation arises from the lowerstratosphere (Fig. 13 and see also Fig. 5). The spikes in Fig. 4around 1300 cm−1 indicating maximum contribution from alti-tudes at about 15 km are due to CH4 , i.e., they do not show upin a methane-free atmosphere, Fig. 5c.
A26, page 9 of 13
A&A 549, A26 (2013)
7.5 7.6 7.7 7.8
Wavelength [µm]
0
5
10
15
Flu
x [10
3 e
rg / s
/ (
cm
2 µ
m)]
Th
u S
ep
27
17
:39
:53
20
12
F
G
K
M
7.5 7.6 7.7 7.8
Wavelength [µm]
200
220
240
260
280
300
Tem
pera
ture
[K
]
Th
u S
ep
27
17
:39
:53
20
12
.
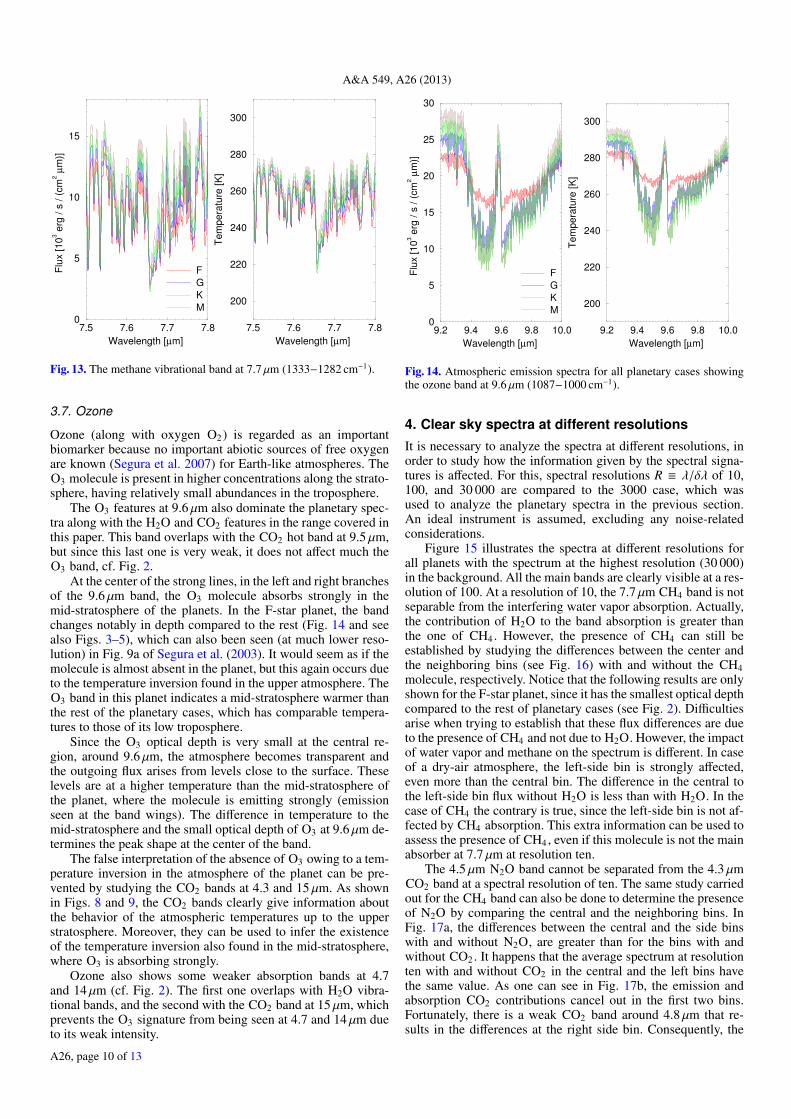
Fig. 13. The methane vibrational band at 7.7 µm (1333−1282 cm−1).
3.7. Ozone
Ozone (along with oxygen O2 ) is regarded as an importantbiomarker because no important abiotic sources of free oxygenare known (Segura et al. 2007) for Earth-like atmospheres. TheO3 molecule is present in higher concentrations along the strato-sphere, having relatively small abundances in the troposphere.
The O3 features at 9.6 µm also dominate the planetary spec-tra along with the H2O and CO2 features in the range covered inthis paper. This band overlaps with the CO2 hot band at 9.5 µm,but since this last one is very weak, it does not affect much theO3 band, cf. Fig. 2.
At the center of the strong lines, in the left and right branchesof the 9.6 µm band, the O3 molecule absorbs strongly in themid-stratosphere of the planets. In the F-star planet, the bandchanges notably in depth compared to the rest (Fig. 14 and seealso Figs. 3–5), which can also been seen (at much lower reso-lution) in Fig. 9a of Segura et al. (2003). It would seem as if themolecule is almost absent in the planet, but this again occurs dueto the temperature inversion found in the upper atmosphere. TheO3 band in this planet indicates a mid-stratosphere warmer thanthe rest of the planetary cases, which has comparable tempera-tures to those of its low troposphere.
Since the O3 optical depth is very small at the central re-gion, around 9.6 µm, the atmosphere becomes transparent andthe outgoing flux arises from levels close to the surface. Theselevels are at a higher temperature than the mid-stratosphere ofthe planet, where the molecule is emitting strongly (emissionseen at the band wings). The difference in temperature to themid-stratosphere and the small optical depth of O3 at 9.6 µm de-termines the peak shape at the center of the band.
The false interpretation of the absence of O3 owing to a tem-perature inversion in the atmosphere of the planet can be pre-vented by studying the CO2 bands at 4.3 and 15 µm. As shownin Figs. 8 and 9, the CO2 bands clearly give information aboutthe behavior of the atmospheric temperatures up to the upperstratosphere. Moreover, they can be used to infer the existenceof the temperature inversion also found in the mid-stratosphere,where O3 is absorbing strongly.
Ozone also shows some weaker absorption bands at 4.7and 14 µm (cf. Fig. 2). The first one overlaps with H2O vibra-tional bands, and the second with the CO2 band at 15 µm, whichprevents the O3 signature from being seen at 4.7 and 14 µm dueto its weak intensity.
9.2 9.4 9.6 9.8 10.0
Wavelength [µm]
0
5
10
15
20
25
30
Flu
x [
10
3 e
rg /
s /
(cm
2 µ
m)]
Th
u S
ep
27
17
:42
:12
20
12
F
G
K
M
9.2 9.4 9.6 9.8 10.0
Wavelength [µm]
200
220
240
260
280
300
Te
mp
era
ture
[K
]
Th
u S
ep
27
17
:42
:12
20
12
.
Fig. 14. Atmospheric emission spectra for all planetary cases showingthe ozone band at 9.6 µm (1087−1000 cm−1).
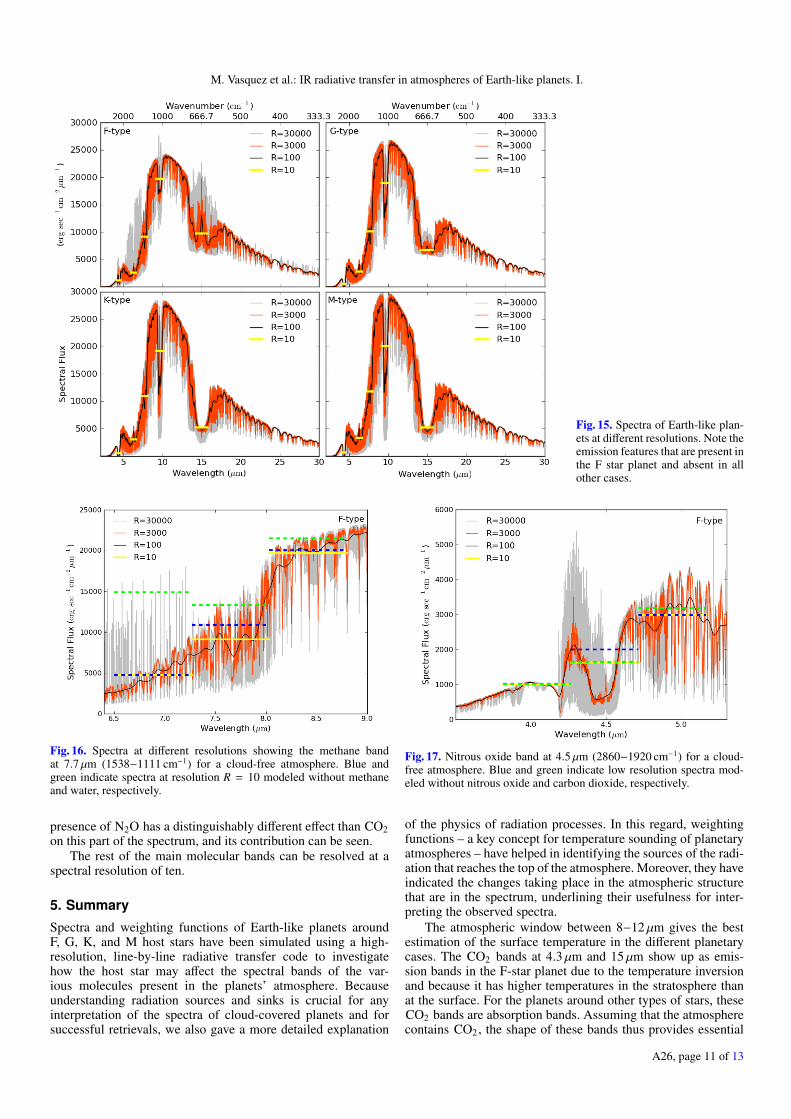
4. Clear sky spectra at different resolutionsIt is necessary to analyze the spectra at different resolutions, inorder to study how the information given by the spectral signa-tures is affected. For this, spectral resolutions R ≡ λ/δλ of 10,100, and 30 000 are compared to the 3000 case, which wasused to analyze the planetary spectra in the previous section.An ideal instrument is assumed, excluding any noise-relatedconsiderations.
Figure 15 illustrates the spectra at different resolutions forall planets with the spectrum at the highest resolution (30 000)in the background. All the main bands are clearly visible at a res-olution of 100. At a resolution of 10, the 7.7 µm CH4 band is notseparable from the interfering water vapor absorption. Actually,the contribution of H2O to the band absorption is greater thanthe one of CH4 . However, the presence of CH4 can still beestablished by studying the differences between the center andthe neighboring bins (see Fig. 16) with and without the CH4molecule, respectively. Notice that the following results are onlyshown for the F-star planet, since it has the smallest optical depthcompared to the rest of planetary cases (see Fig. 2). Difficultiesarise when trying to establish that these flux differences are dueto the presence of CH4 and not due to H2O. However, the impactof water vapor and methane on the spectrum is different. In caseof a dry-air atmosphere, the left-side bin is strongly affected,even more than the central bin. The difference in the central tothe left-side bin flux without H2O is less than with H2O. In thecase of CH4 the contrary is true, since the left-side bin is not af-fected by CH4 absorption. This extra information can be used toassess the presence of CH4 , even if this molecule is not the mainabsorber at 7.7 µm at resolution ten.
The 4.5 µm N2O band cannot be separated from the 4.3 µmCO2 band at a spectral resolution of ten. The same study carriedout for the CH4 band can also be done to determine the presenceof N2O by comparing the central and the neighboring bins. InFig. 17a, the differences between the central and the side binswith and without N2O, are greater than for the bins with andwithout CO2 . It happens that the average spectrum at resolutionten with and without CO2 in the central and the left bins havethe same value. As one can see in Fig. 17b, the emission andabsorption CO2 contributions cancel out in the first two bins.Fortunately, there is a weak CO2 band around 4.8 µm that re-sults in the differences at the right side bin. Consequently, the
A26, page 10 of 13
M. Vasquez et al.: IR radiative transfer in atmospheres of Earth-like planets. I.
Fig. 15. Spectra of Earth-like plan-ets at different resolutions. Note theemission features that are present inthe F star planet and absent in allother cases.
Fig. 16. Spectra at different resolutions showing the methane bandat 7.7 µm (1538−1111 cm−1) for a cloud-free atmosphere. Blue andgreen indicate spectra at resolution R = 10 modeled without methaneand water, respectively.
presence of N2O has a distinguishably different effect than CO2on this part of the spectrum, and its contribution can be seen.
The rest of the main molecular bands can be resolved at aspectral resolution of ten.
5. Summary
Spectra and weighting functions of Earth-like planets aroundF, G, K, and M host stars have been simulated using a high-resolution, line-by-line radiative transfer code to investigatehow the host star may affect the spectral bands of the var-ious molecules present in the planets’ atmosphere. Becauseunderstanding radiation sources and sinks is crucial for anyinterpretation of the spectra of cloud-covered planets and forsuccessful retrievals, we also gave a more detailed explanation
Fig. 17. Nitrous oxide band at 4.5 µm (2860−1920 cm−1) for a cloud-free atmosphere. Blue and green indicate low resolution spectra mod-eled without nitrous oxide and carbon dioxide, respectively.
of the physics of radiation processes. In this regard, weightingfunctions – a key concept for temperature sounding of planetaryatmospheres – have helped in identifying the sources of the radi-ation that reaches the top of the atmosphere. Moreover, they haveindicated the changes taking place in the atmospheric structurethat are in the spectrum, underlining their usefulness for inter-preting the observed spectra.
The atmospheric window between 8−12 µm gives the bestestimation of the surface temperature in the different planetarycases. The CO2 bands at 4.3 µm and 15 µm show up as emis-sion bands in the F-star planet due to the temperature inversionand because it has higher temperatures in the stratosphere thanat the surface. For the planets around other types of stars, theseCO2 bands are absorption bands. Assuming that the atmospherecontains CO2 , the shape of these bands thus provides essential
A26, page 11 of 13
A&A 549, A26 (2013)
information about the upper stratospheric temperatures of theplanet. In particular, for all planet types the brightness tempera-tures observed in the band center correspond to the upper strato-spheric temperatures, in accordance with the weighting func-tions. Results show that the 9.6 µm O3 band for the F-star planetpresents a much smaller depth than the rest, which could leadto misinterpreting the amount of O3 found in the planets’ atmo-sphere. However, this is because the temperatures at the O3 layerare similar to the surface temperature. Since the CO2 bands con-tain information from a larger part of the atmosphere, the mis-interpretation of the O3 band due to the temperature inversioncan be prevented by analyzing both bands. A combined analy-sis of several bands is also important for methane and nitrousoxide: the CH4 amount could be established from the 7.7 µmband and its neighbor regions by also determining the amountof H2O. The same is valid for N2O at 4.5 µm considering theeffect of CO2 from the neighboring 4.3 µm bands. The rest ofthe main molecular bands could be distinguished at the lowerspectral resolutions of 10 and 100.
As already indicated in the introduction, this paper had atwofold purpose. The first was to investigate the thermal radi-ation of cloud-free Earth-like exoplanets orbiting F, G, K, orM stars in order to facilitate the interpretation of future observa-tions with respect to identifying biosignatures, thus continuingand complementing the discussions of several previous studies.In particular we tried to locate the sources of radiation, becausebiosignatures originating in upper atmospheric layers are lesslikely to be influenced by clouds. This study also constitutes animportant preparatory step in our investigations of the infraredspectra of clouded Earth-like exoplanets. A detailed expositionof our radiative transfer modeling studies, including a descrip-tion of our lbl multiple scattering approach, is the subject of thefollow-up Paper (II).
Acknowledgements. Financial support by the Helmholtz Research Alliance –Planetary Evolution and Life and within the ESA–ESTEC study ESAS-Light(Contract No. AO/1-5433/07/NL/HE) is greatly appreciated. Furthermore, wewould like to thank Pascal Hedelt for helpful discussions and a critical readingof the manuscript.
ReferencesChahine, M. 1968, J. Opt. Soc. Am., 58, 1634Clough, S., Kneizys, F., & Davies, R. 1989, Atmos. Res., 23, 229Craig, I., & Brown, J. 1986, Inverse Problems in Astronomy (Bristol: A. Hilger)Des Marais, D. J., Harwit, M. O., Jucks, K. W., et al. 2002, Astrobiology, 2, 153Goody, R., & Yung, Y. 1989, Atmospheric Radiation – Theoretical Basis, 2nd
edn. (Oxford University Press)Grenfell, J. L., Stracke, B., von Paris, P., et al. 2007, Planet. Space Sci., 55, 661Grenfell, J., Gebauer, S., von Paris, P., et al. 2011, Icarus, 211, 81Hanel, R., Conrath, B., Jennigs, D., & Samuelson, R. 2003, Exploration of the
Solar System by Infrared Remote Sensing, 2nd edn. (Cambridge UniversityPress)
Hedelt, P., Alonso, R., Brown, T., et al. 2011, A&A, 533, A136Houghton, J., Taylor, F., & Rodgers, C. 1984, Remote Sounding of Atmospheres
(Cambridge University Press)Kaltenegger, L., Traub, W. A., & Jucks, K. W. 2007, ApJ, 658, 598Kitzmann, D., Patzer, A., von Paris, P., et al. 2010, A&A, 511, A66Kitzmann, D., Patzer, A., von Paris, P., Godolt, M., & Rauer, H. 2011, A&A,
531, A62Lee, J.-M., Fletcher, L. N., & Irwin, P. G. J. 2012, MNRAS, 420, 170Manabe, S., & Wetherald, R. T. 1967, J. Atmos. Sci., 24, 241Melsheimer, C., Verdes, C., Bühler, S., et al. 2005, Radio Sci., 40, RS1007Mlawer, E., Taubman, S., Brown, P., Iacono, M., & Clough, S. 1997, J. Geophys.
Res., 102, 16663Rauer, H., Gebauer, S., v. Paris, P., et al. 2011, A&A, 529, A8Rothman, L., Gordon, I. E., Barbe, A., et al. 2009, J. Quant. Spectrosc. Radiat.
Transfer, 110, 533Schindler, T. L., & Kasting, J. F. 2000, Icarus, 145, 262Schreier, F. 2011, J. Quant. Spectrosc. Radiat. Transfer, 112, 1010Schreier, F., & Schimpf, B. 2001, in IRS 2000: Current Problems in Atmospheric
Radiation, eds. W. Smith, & Y. Timofeyev (A. Deepak Publishing), 381Segura, A., Krelove, K., Kasting, J., et al. 2003, Astrobiology, 3, 689Segura, A., Kasting, J. F., Meadows, V., et al. 2005, Astrobiology, 5, 706Segura, A., Meadows, V., Kasting, J., Crisp, D., & Cohen, M. 2007, A&A, 472,
665Selsis, F., Despois, D., & Parisot, J.-P. 2002, A&A, 388, 985Tinetti, G., Meadows, V. S., Crisp, D., et al. 2006, Astrobiology, 6, 34Toon, O. B., McKay, C. P., Ackerman, T. P., & Santhanam, K. 1989, J. Geophys.
Res., 94, 16287Vasquez, M., Gottwald, M., Gimeno García, S., et al. 2012, Adv. Space Res.,
DOI: 10.1017/S1743921311020205, in pressvon Clarmann, T., Höpfner, M., Funke, B., et al. 2002, J. Quant. Spectrosc.
Radiat. Transfer, 78, 381von Paris, P., Cabrera, J., Godolt, M., et al. 2011, A&A, 534, A26Zdunkowski, W., Trautmann, T., & Bott, A. 2007, Radiation in the Atmosphere
– A Course in Theoretical Meteorology (Cambridge University Press)
Page 13 is available in the electronic edition of the journal at http://www.aanda.org
A26, page 12 of 13
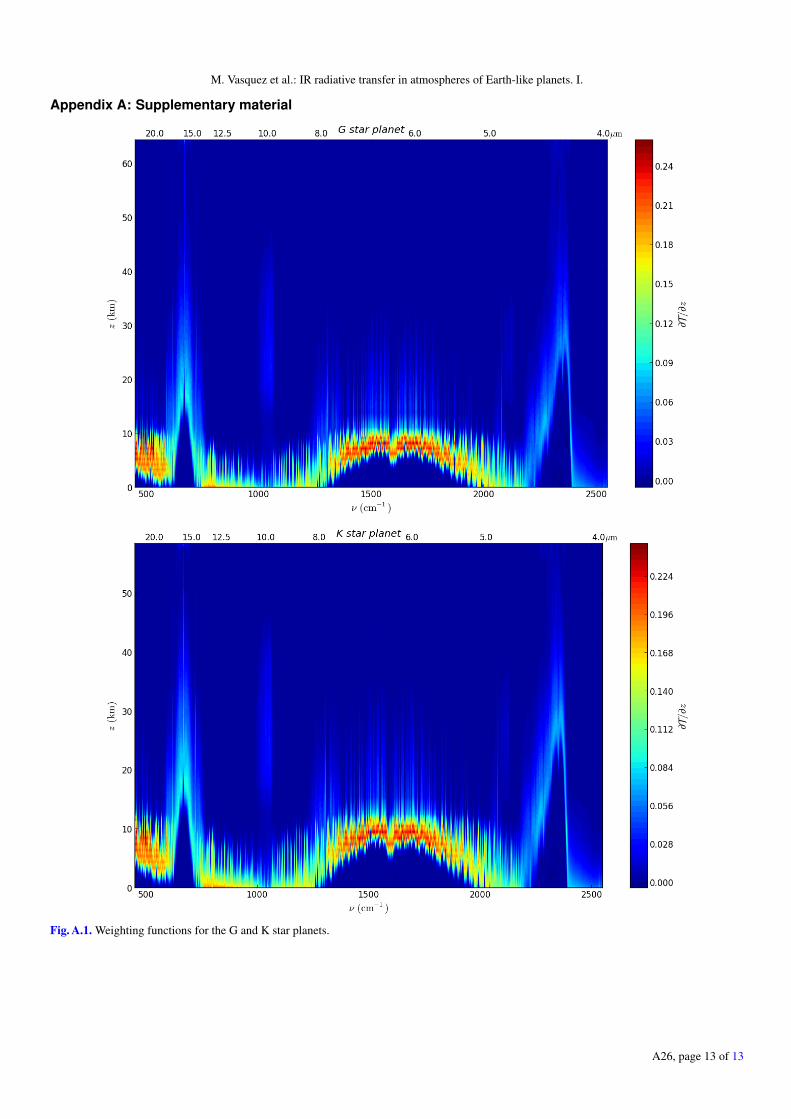
M. Vasquez et al.: IR radiative transfer in atmospheres of Earth-like planets. I.
Appendix A: Supplementary material
Fig. A.1. Weighting functions for the G and K star planets.
A26, page 13 of 13


![Abstract - DLR Portalelib.dlr.de/74042/1/StefanieSchiffer.pdf · the developing flow structures. Hemida and Krajnovic used the same set-up as Kra-´ jnovic et al. [6] except for](https://img.pdfslide.us/doc/110x75/5aeb8dde7f8b9ac3618f5f1c/abstract-dlr-developing-ow-structures-hemida-and-krajnovic-used-the-same-set-up.jpg)