Embed Size (px)
DESCRIPTION
Astonfield Renewable Resources, Ltd. Developer’s perspective on an enabling framework for renewable energy November 2009. Ravi Raina. INDIA’S POWER SECTOR : POINTS TO PONDER . Current power mix is fossil fuel dependent and has following negatives Price volatility/ subsidy dependent - PowerPoint PPT Presentation
Citation preview
Astonfield RenewableResources Ltd.
An AstonfieldGroup Company
Note: The information contained here-in is proprietary and confidential. Any unauthorized reproduction or distribution is forbidden.
Astonfield Renewable Resources, Ltd.
Developer’s perspective on an enabling framework for renewable energy
November 2009
Ravi Raina
2
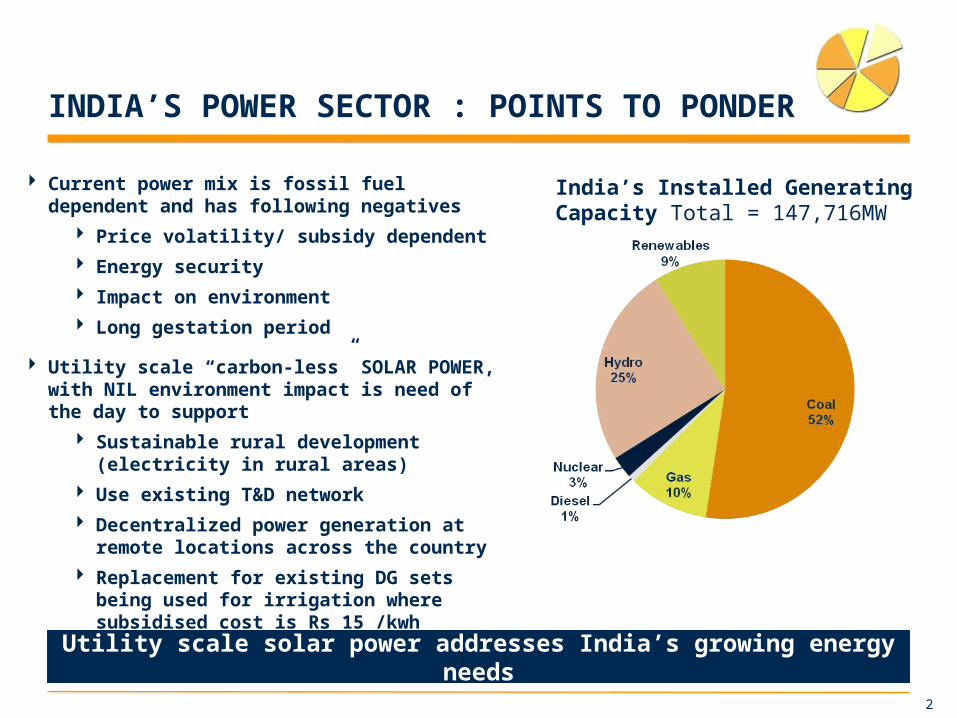
INDIA’S POWER SECTOR : POINTS TO PONDER
Current power mix is fossil fuel dependent and has following negatives
Price volatility/ subsidy dependent Energy security Impact on environment Long gestation period
Utility scale “carbon-less” SOLAR POWER, with NIL environment impact is need of the day to support
Sustainable rural development (electricity in rural areas)
Use existing T&D network Decentralized power generation at remote
locations across the country Replacement for existing DG sets being used
for irrigation where subsidised cost is Rs 15 /kwh
Utility scale solar power addresses India’s growing energy needs
India’s Installed Generating Capacity Total = 147,716MW
3
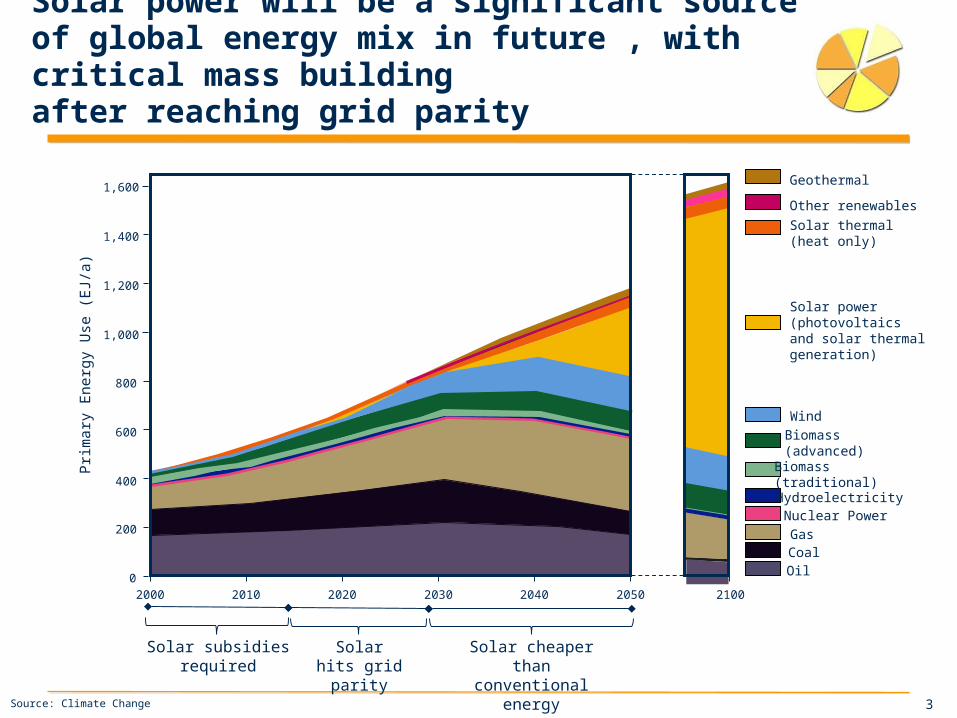
Solar power will be a significant source of global energy mix in future , with critical mass building after reaching grid parity
OilCoalGasNuclear PowerHydroelectricity
Biomass(traditional)
Biomass(advanced)
Wind
Solar power(photovoltaics and solar thermal generation)
Solar thermal(heat only)
Other renewables
Geothermal
200
400
600
800
1,000
1,200
1,400
1,600
02000 2010 2020 2030 2040 2050 2100
Prim
ary
Ene
rgy
Use
(EJ/
a)
Source: Climate Change
Solar subsidies required
Solar hits grid parity
Solar cheaper than conventional energy
4
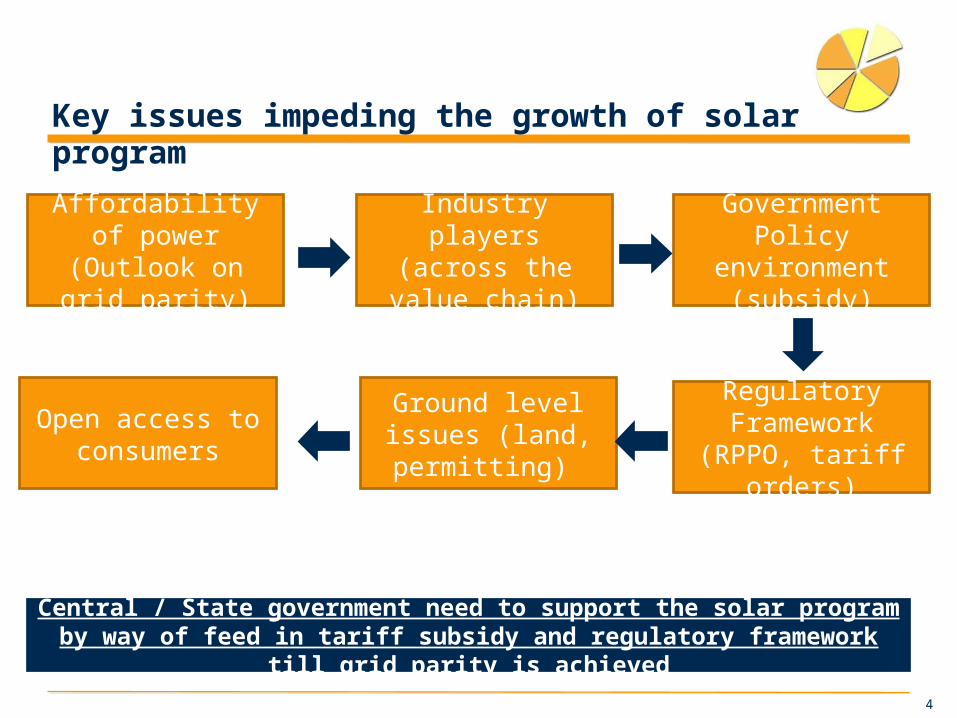
Key issues impeding the growth of solar program
Affordability of power (Outlook on
grid parity)
Industry players (across the value
chain)
Government Policy environment
(subsidy)
Regulatory Framework (RPPO,
tariff orders)
Ground level issues (land, permitting)
Open access to consumers
Central / State government need to support the solar program by way of feed in tariff subsidy and regulatory framework till grid parity is achieved
5
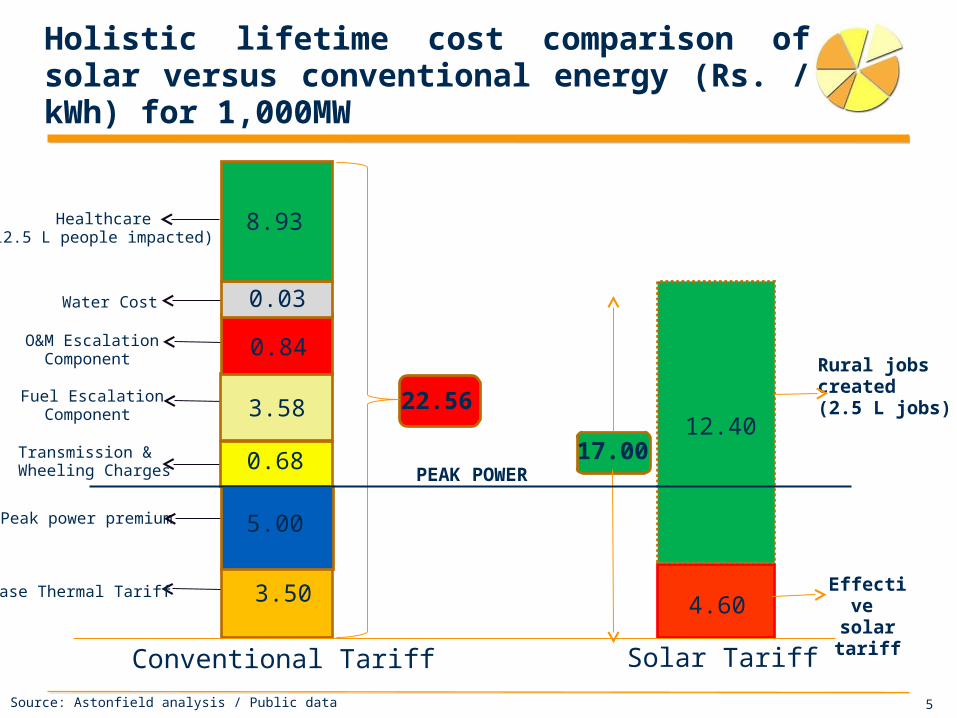
Holistic lifetime cost comparison of solar versus conventional energy (Rs. / kWh) for 1,000MW
Base Thermal Tariff
Healthcare(12.5 L people impacted)
Fuel EscalationComponent
Transmission & Wheeling Charges
Peak power premium
O&M EscalationComponent
Water Cost
3.50
22.56
Conventional Tariff Solar Tariff
17.0012.40
4.60
Rural jobscreated(2.5 L jobs)
Effective solar tariff
5.00
0.68
3.58
0.84
0.03
8.93
PEAK POWER
Source: Astonfield analysis / Public data
6
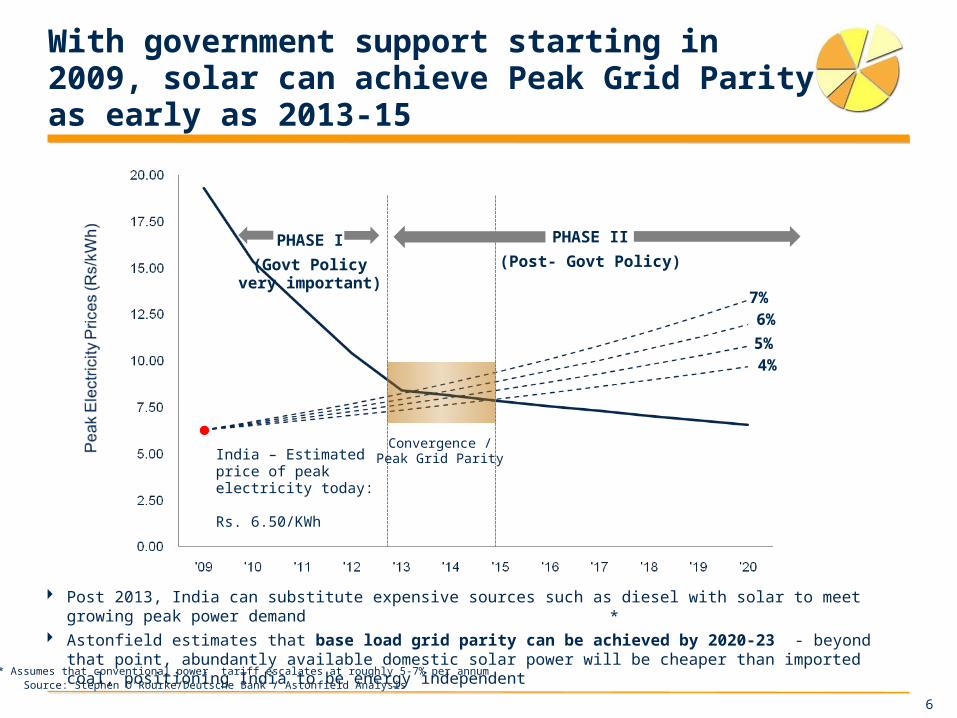
With government support starting in 2009, solar can achieve Peak Grid Parity as early as 2013-15
Source: Stephen O’Rourke/Deutsche Bank / Astonfield Analysis
7%6%
PHASE I(Govt Policy
very important)
PHASE II(Post- Govt Policy)
5%4%
India – Estimated price of peak electricity today:
Rs. 6.50/KWh
Convergence /Peak Grid Parity
Post 2013, India can substitute expensive sources such as diesel with solar to meet growing peak power demand Astonfield estimates that base load grid parity can be achieved by 2020-23 - beyond that point, abundantly
available domestic solar power will be cheaper than imported coal, positioning India to be energy independent*
* Assumes that conventional power tariff escalates at roughly 5-7% per annum

7
While Solar tariffs are more incentivized in Europe, large scale program can bring economies of scale to support low tariffs in India
15 -17 Rupees
22-24 Rupees
22-24 Rupees
28-35 Rupees
2.5MW grid connected solar capacity in all of India
50MW experimental solar program announced by Government of India; more than 1500MW of applications
Two States have now established independently funded programs of 500MW and 50MW respectivelyIn addition, Government of India expected to announce landmark 20,000MW solar program in 2009
Comparison of Feed-in Tariffs Globally (INR per kWh) Scale of India’s Solar Program (MW)
8
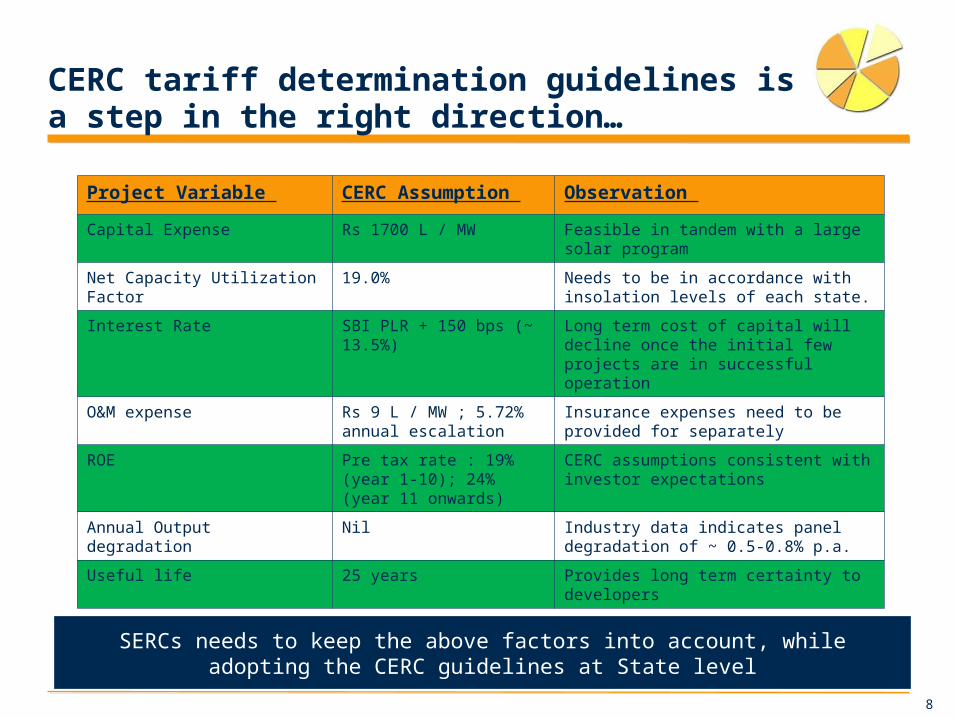
CERC tariff determination guidelines is a step in the right direction…
SERCs needs to keep the above factors into account, while adopting the CERC guidelines at State level
Project Variable CERC Assumption Observation
Capital Expense Rs 1700 L / MW Feasible in tandem with a large solar program
Net Capacity Utilization Factor 19.0% Needs to be in accordance with insolation levels of each state.
Interest Rate SBI PLR + 150 bps (~ 13.5%)
Long term cost of capital will decline once the initial few projects are in successful operation
O&M expense Rs 9 L / MW ; 5.72% annual escalation
Insurance expenses need to be provided for separately
ROE Pre tax rate : 19% (year 1-10); 24% (year 11 onwards)
CERC assumptions consistent with investor expectations
Annual Output degradation Nil Industry data indicates panel degradation of ~ 0.5-0.8% p.a.
Useful life 25 years Provides long term certainty to developers
9
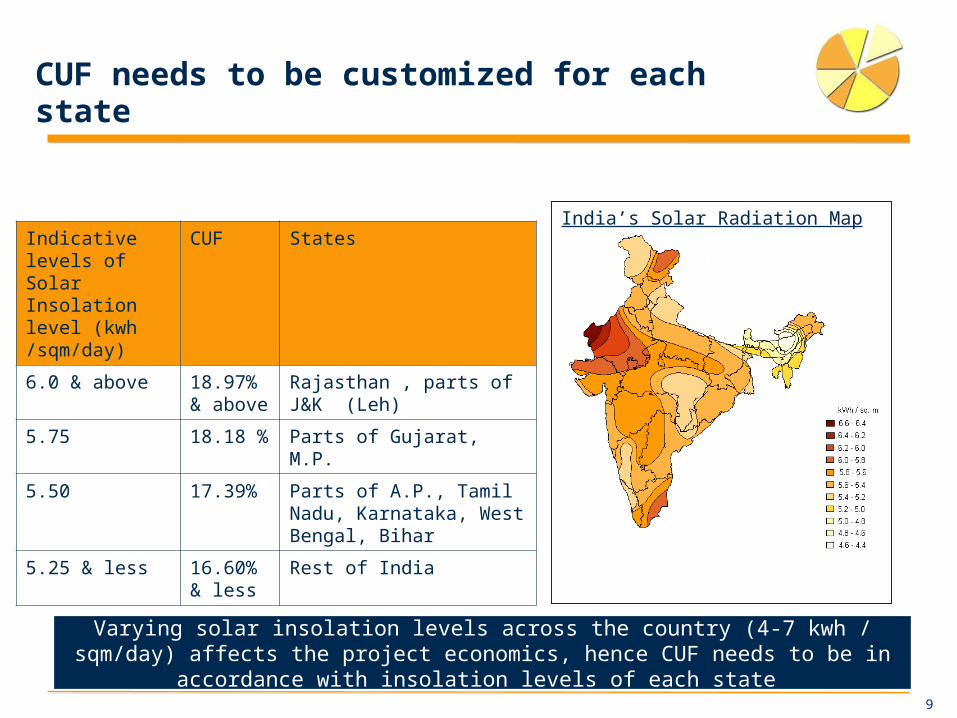
CUF needs to be customized for each state
Varying solar insolation levels across the country (4-7 kwh / sqm/day) affects the project economics, hence CUF needs to be in accordance with insolation levels of each state
India’s Solar Radiation MapIndicative levels of Solar Insolation level (kwh /sqm/day)
CUF States
6.0 & above 18.97% & above
Rajasthan , parts of J&K (Leh)
5.75 18.18 % Parts of Gujarat, M.P.
5.50 17.39% Parts of A.P., Tamil Nadu, Karnataka, West Bengal, Bihar
5.25 & less 16.60% & less
Rest of India
10
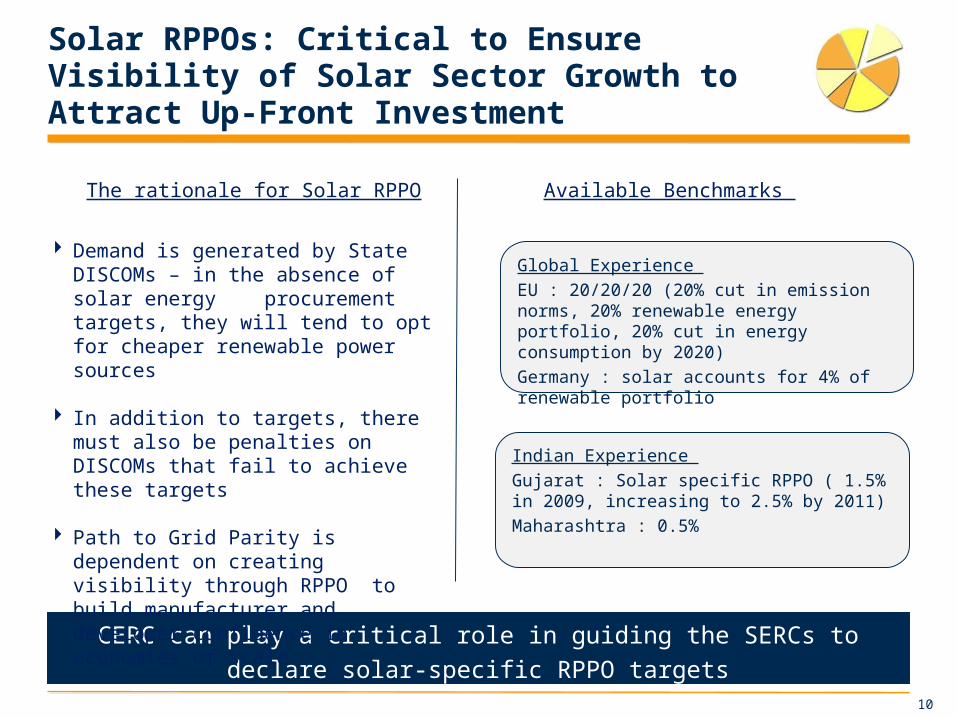
Solar RPPOs: Critical to Ensure Visibility of Solar Sector Growth to Attract Up-Front Investment
CERC can play a critical role in guiding the SERCs to declare solar-specific RPPO targets
The rationale for Solar RPPO
Demand is generated by State DISCOMs – in the absence of solar energy
procurement targets, they will tend to opt for cheaper renewable power sources
In addition to targets, there must also be penalties on DISCOMs that fail to achieve these targets
Path to Grid Parity is dependent on creating visibility through RPPO to build manufacturer and developer confidence in economies of scale
Indian Experience Gujarat : Solar specific RPPO ( 1.5% in 2009, increasing to 2.5% by 2011)Maharashtra : 0.5%
Available Benchmarks
Global Experience EU : 20/20/20 (20% cut in emission norms, 20% renewable energy portfolio, 20% cut in energy consumption by 2020)Germany : solar accounts for 4% of renewable portfolio
11
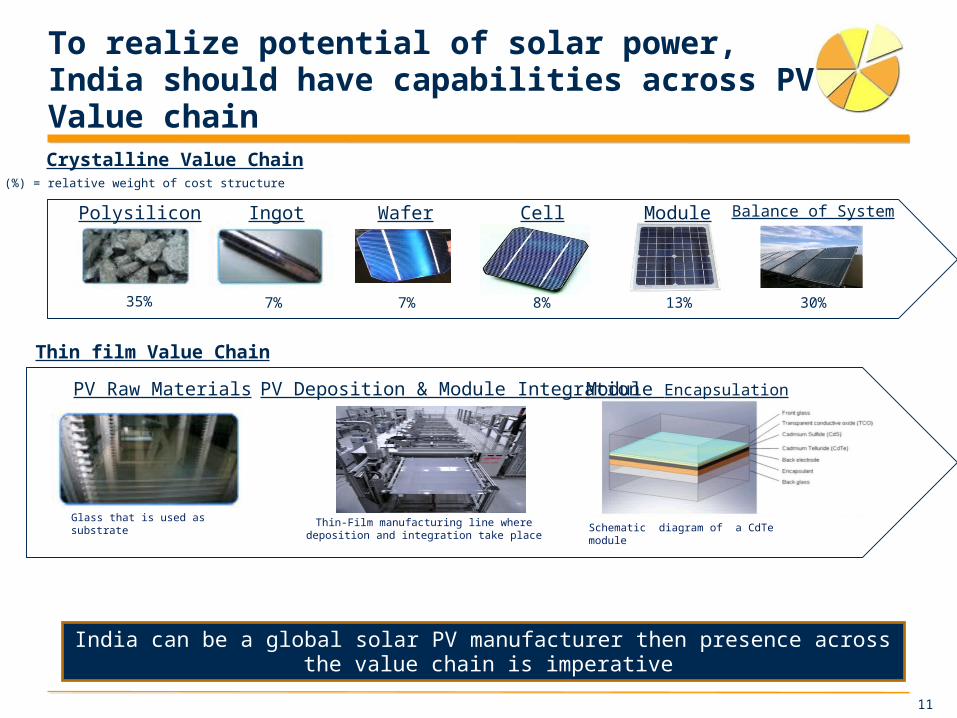
To realize potential of solar power, India should have capabilities across PV Value chain Crystalline Value Chain
7% 7% 8% 13% 30%
(%) = relative weight of cost structure
35%
Polysilicon Ingot Wafer Cell Module Balance of System
PV Raw Materials PV Deposition & Module Integration Module Encapsulation
Schematic diagram of a CdTe moduleThin-Film manufacturing line where deposition and integration take place
Glass that is used as substrate
Thin film Value Chain
India can be a global solar PV manufacturer then presence across the value chain is imperative
12
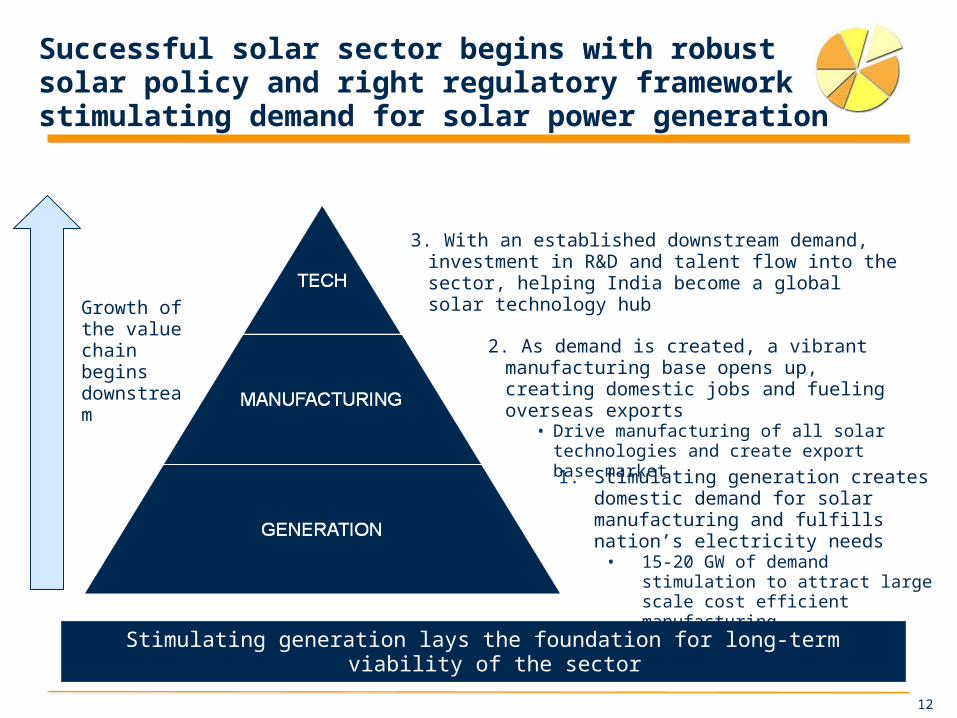
Successful solar sector begins with robust solar policy and right regulatory framework stimulating demand for solar power generation
1. Stimulating generation creates domestic demand for solar manufacturing and fulfills nation’s electricity needs
• 15-20 GW of demand stimulation to attract large scale cost efficient manufacturing
2. As demand is created, a vibrant manufacturing base opens up, creating domestic jobs and fueling overseas exports
• Drive manufacturing of all solar technologies and create export base market
3. With an established downstream demand, investment in R&D and talent flow into the sector, helping India become a global solar technology hub
Growth of the value chain begins downstream
Stimulating generation lays the foundation for long-term viability of the sector
13
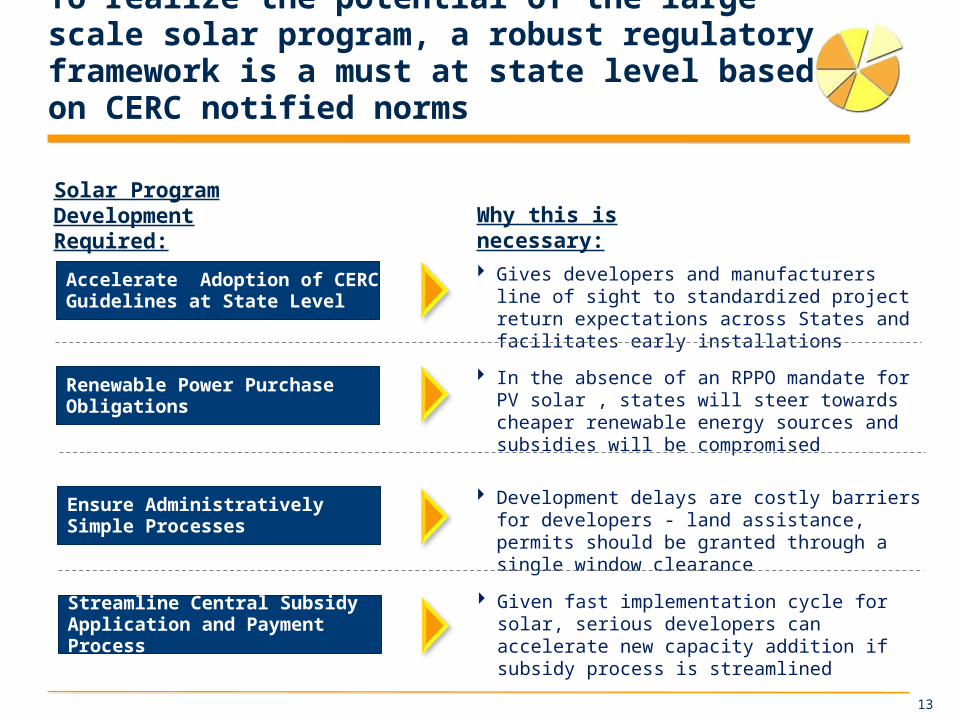
To realize the potential of the large scale solar program, a robust regulatory framework is a must at state level based on CERC notified norms
Solar Program Development Required: Why this is necessary:
In the absence of an RPPO mandate for PV solar , states will steer towards cheaper renewable energy sources and subsidies will be compromised
Gives developers and manufacturers line of sight to standardized project return expectations across States and facilitates early installations
Accelerate Adoption of CERC Guidelines at State Level
Renewable Power Purchase Obligations
Development delays are costly barriers for developers - land assistance, permits should be granted through a single window clearance
Ensure Administratively Simple Processes
Given fast implementation cycle for solar, serious developers can accelerate new capacity addition if subsidy process is streamlined
Streamline Central Subsidy Application and Payment Process
14
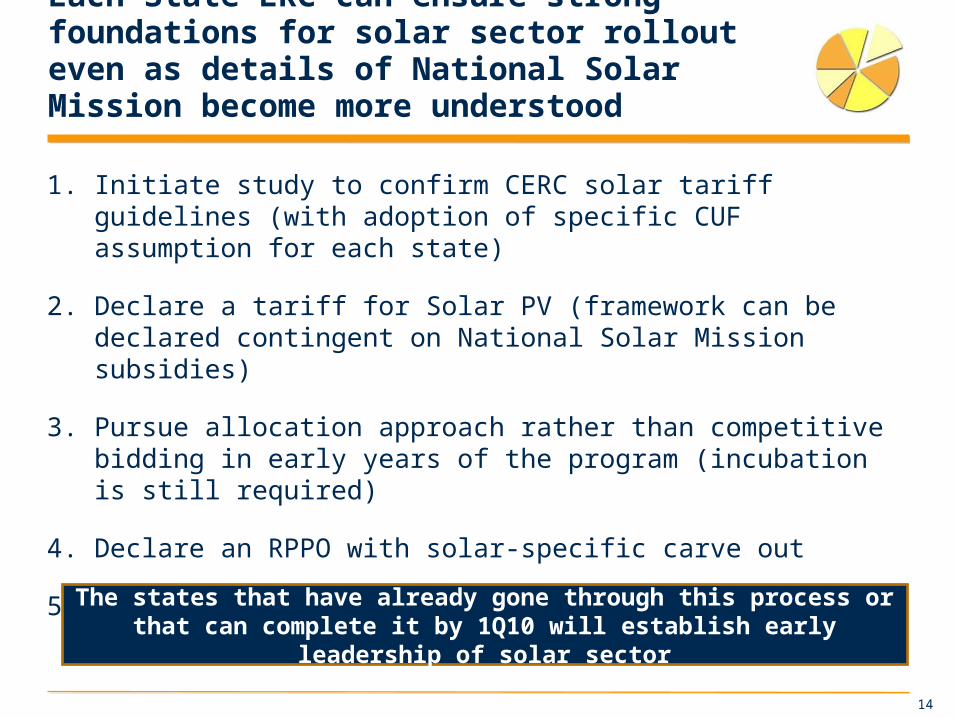
Each State ERC can ensure strong foundations for solar sector rollout even as details of National Solar Mission become more understood
1. Initiate study to confirm CERC solar tariff guidelines (with adoption of specific CUF assumption for each state)
2. Declare a tariff for Solar PV (framework can be declared contingent on National Solar Mission subsidies)
3. Pursue allocation approach rather than competitive bidding in early years of the program (incubation is still required)
4. Declare an RPPO with solar-specific carve out
5. Work with Discoms to standardize bankable PPAs for solar projects <25MW
The states that have already gone through this process or that can complete it by 1Q10 will establish early leadership of solar sector
15
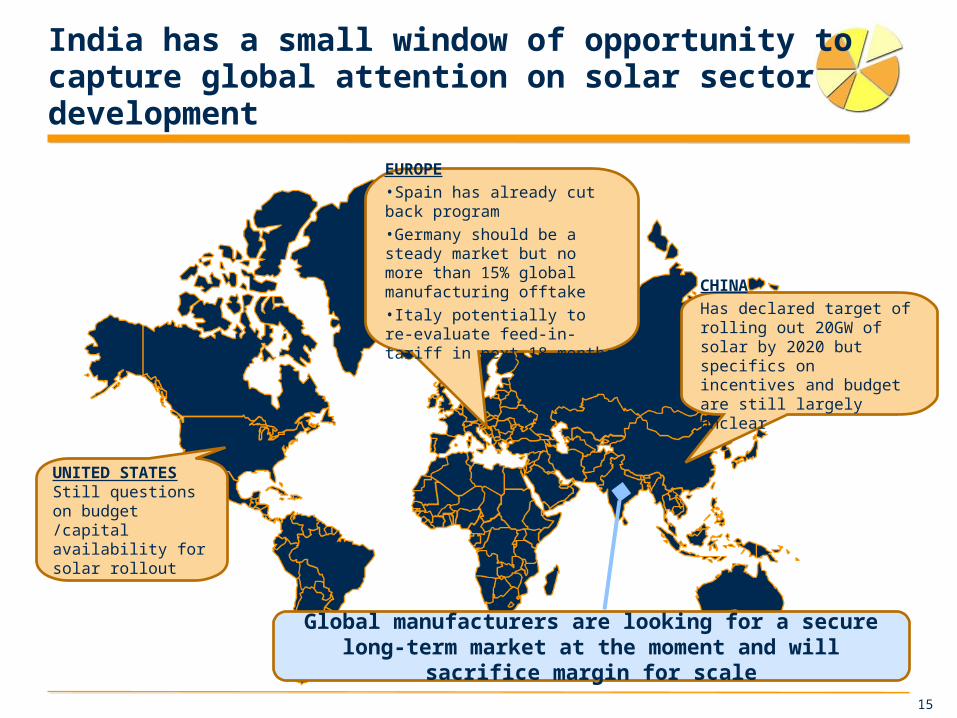
India has a small window of opportunity to capture global attention on solar sector development
UNITED STATESStill questions on budget /capital availability for solar rollout
EUROPE•Spain has already cut back program•Germany should be a steady market but no more than 15% global manufacturing offtake•Italy potentially to re-evaluate feed-in-tariff in next 18 months
CHINAHas declared target of rolling out 20GW of solar by 2020 but specifics on incentives and budget are still largely unclear
Global manufacturers are looking for a secure long-term market at the moment and will sacrifice margin for scale

16
West Bengal2x 5MW Solar10MW Biomass
Rajasthan5MW Solar
Gujarat200MW Solar
Haryana3MW Solar
Bihar100MW Biomass
Karnataka10MW Solar
KarnatakaPhase 2 Solar
Uttar PradeshPhase I Solar / Biomass
West BengalPhase 2 WTE / Biomass
► Total of 338MW solar project currently in the MOU/Allocation stage
► Close to 1000 MW of pre-MOU opportunities currently in the public sector pipeline
► Of that pipeline, at least 500MW expected to convert into formal concession by 1Q10 with remainder by 1Q11
► In addition Astonfield is in process of finalizing 400MW in pipeline from four leading industrialists in India under co-development structure
RajasthanPhase 2 Solar
Astonfield has become the largest diversified renewable energy company in India
MOU/ AllocationPipelineInitial Dialogue
Madhya PradeshPhase I Solar
Orissa
Tamil Nadu
Andhra Pradesh
Jammu & KashmirPhase I Solar
Bihar Phase I solar
17
THANKS FOR YOUR ATTENTION


![Resources [renewable and non renewable]](https://img.pdfslide.us/doc/110x75/55643cd7d8b42ad3308b522b/resources-renewable-and-non-renewable.jpg)