Embed Size (px)
Citation preview
Assuring Data Integrity for Healthcare Public Reporting and Using Results to Evaluate Patient Care Quality ABSTRACT This presentation describes (1) steps insuring data integrity for public reporting; (2) mechanisms for using those data to evaluate patient care quality. Examples (1): incorporation of public reporting data elements in Electronic Patient Record (EPR) implementation and paper medical record documents, data abstractor/analyst training, internal validation of abstraction, review of vendor data quality reports and internally-developed validation reports, comparisons of results generated internally and by vendors/regulatory agencies, pursuit of missing documentation, reviewing clerical staff understanding of electronic data fields. Examples (2), including three reporting levels: A) Scorecards: summary data reviewed at executive level. Clinical chairs are held accountable
by hospital leadership for meeting targets. B) Dashboards: quality indicators relevant to a clinical service. Reviewed monthly by service
leadership held accountable for quality of care. C) Detailed reports:
a. Documenting specifics of noncompliance b. Identifying problem units c. Demonstrating associations between care and outcomes d. Breakdowns of care into intermediate steps.
BIOGRAPHY Elisa L. Horbatuk, MA Data Manager, Decision Support Services Stony Brook University Medical Center Elisa Horbatuk is a data manager in Stony Brook University Medical Center’s Decision Support Services, responsible for data processing, submission, and analysis for a variety of public reporting databases, including the Joint Commission core measures, New York State cardiac registries, American College of Cardiology registries, and American Heart Association’s Get With The Guidelines Heart Failure registry. Additionally, she prepares a wide array of internal reports including scorecards (executive summary data), quality dashboards, and detailed analytic reports. Ms. Horbatuk has worked in healthcare research for three years and quality for seven years, including four years at New York State’s Quality Improvement Organization and External Quality Review Organization.
MIT Information Quality Industry Symposium, July 15-17, 2009
371
Assuring Data Integrity for Healthcare Public Reporting and Using Results to Evaluate Patient Care Quality
Elisa L. Horbatuk, MA
Data Manager, Decision Support Services
Stony Brook University Medical Center
OVERVIEW
MIT Information Quality Industry Symposium, July 15-17, 2009
372
Overview
• About Stony Brook University Medical Center
• Steps insuring data integrity for public reporting
• Mechanisms for using those data to evaluate patient care quality
ABOUT US
MIT Information Quality Industry Symposium, July 15-17, 2009
373
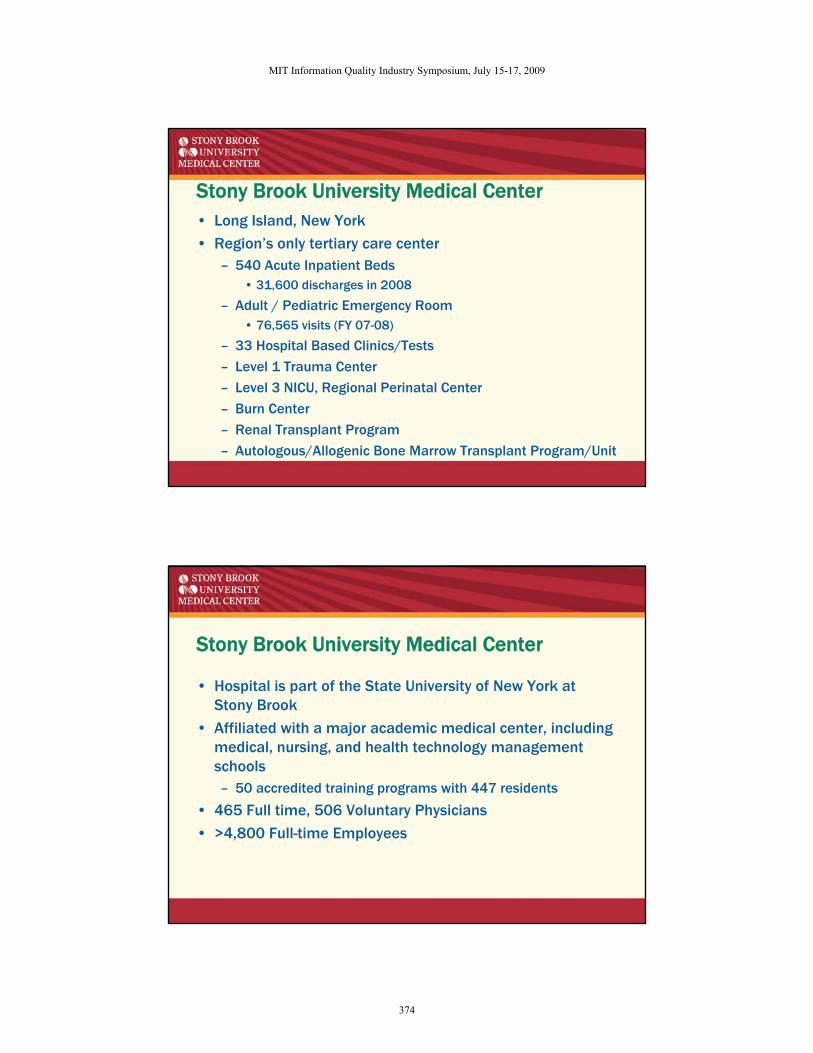
Stony Brook University Medical Center• Long Island, New York
• Region’s only tertiary care center– 540 Acute Inpatient Beds
• 31,600 discharges in 2008
– Adult / Pediatric Emergency Room• 76,565 visits (FY 07-08)
– 33 Hospital Based Clinics/Tests
– Level 1 Trauma Center
– Level 3 NICU, Regional Perinatal Center
– Burn Center
– Renal Transplant Program
– Autologous/Allogenic Bone Marrow Transplant Program/Unit
Stony Brook University Medical Center
• Hospital is part of the State University of New York at Stony Brook
• Affiliated with a major academic medical center, including medical, nursing, and health technology management schools– 50 accredited training programs with 447 residents
• 465 Full time, 506 Voluntary Physicians
• >4,800 Full-time Employees
MIT Information Quality Industry Symposium, July 15-17, 2009
374
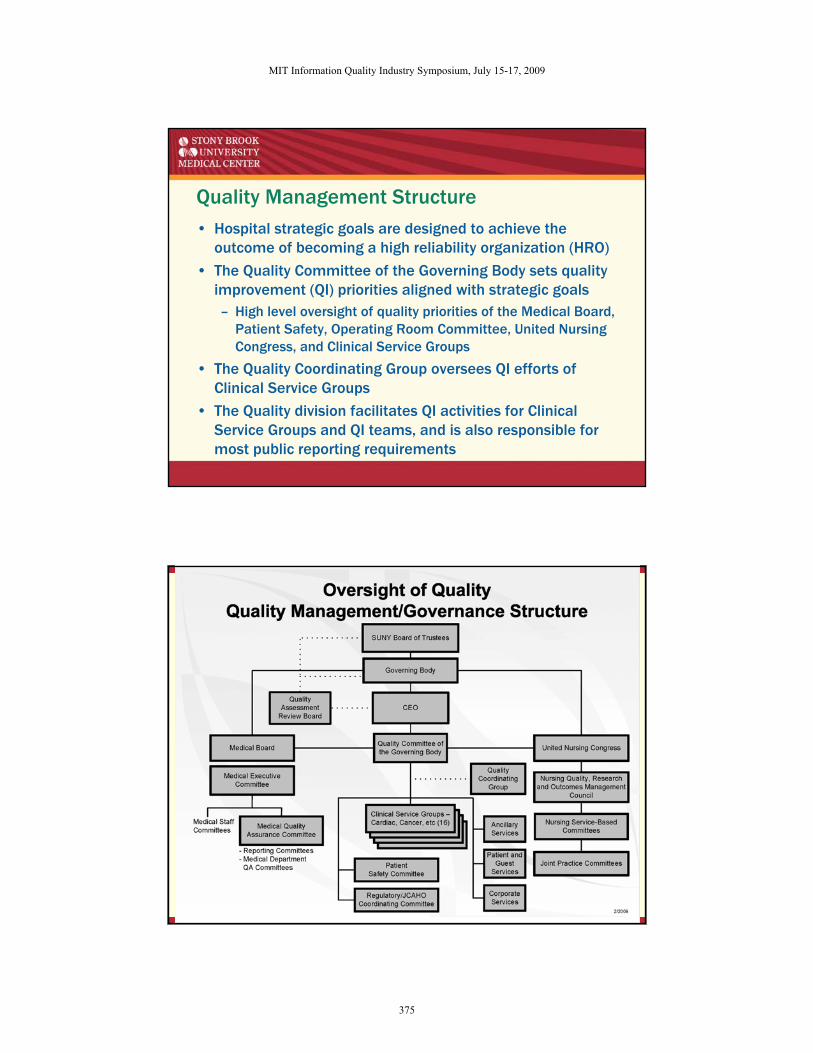
Quality Management Structure• Hospital strategic goals are designed to achieve the
outcome of becoming a high reliability organization (HRO)
• The Quality Committee of the Governing Body sets quality improvement (QI) priorities aligned with strategic goals– High level oversight of quality priorities of the Medical Board,
Patient Safety, Operating Room Committee, United Nursing Congress, and Clinical Service Groups
• The Quality Coordinating Group oversees QI efforts of Clinical Service Groups
• The Quality division facilitates QI activities for Clinical Service Groups and QI teams, and is also responsible for most public reporting requirements
MIT Information Quality Industry Symposium, July 15-17, 2009
375
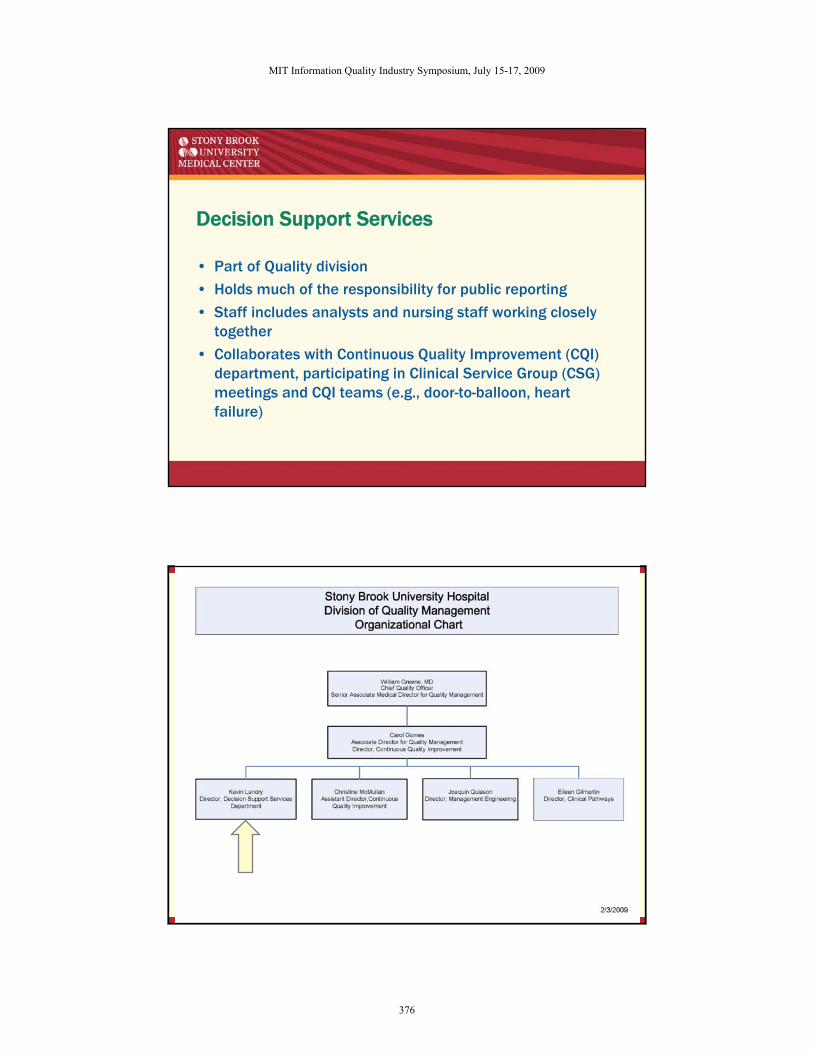
Decision Support Services
• Part of Quality division
• Holds much of the responsibility for public reporting
• Staff includes analysts and nursing staff working closely together
• Collaborates with Continuous Quality Improvement (CQI) department, participating in Clinical Service Group (CSG) meetings and CQI teams (e.g., door-to-balloon, heart failure)
MIT Information Quality Industry Symposium, July 15-17, 2009
376
Public Reporting (examples)
• The Joint Commission/Centers for Medicare and Medicaid Services (TJC/CMS) Core Measure Requirements– Acute Myocardial Infarction (AMI) – Inpatient and Outpatient
– Heart Failure (HF) – Inpatient
– Pneumonia (PN) – Inpatient
– Surgical Care Improvement Program (SCIP) – Inpatient and Outpatient
– Chest Pain – Outpatient
– Children’s Asthma Care - Inpatient
Public Reporting (examples)
• New York State Department of Health (NYSDOH) Requirements– Percutaneous Coronary Interventions (PCI)
– Adult Cardiac Surgeries
• American College of Cardiology National Cardiovascular Data Registries (ACC-NCDR)– Implantable Cardioverter Defibrillator (ICD) Registry
– Carotid Artery Revascularization and Endarterectomy (CARE) Registry
• Limited to Carotid Artery Stent (CAS) procedures at this time
– Diagnostic Cardiac Catheterizations and Percutaneous Coronary Interventions (CathPCI) Registry
MIT Information Quality Industry Symposium, July 15-17, 2009
377

OVERVIEW
Overview
• About Stony Brook University Medical Center
• Steps insuring data integrity for public reporting
• Mechanisms for using those data to evaluate patient care quality
MIT Information Quality Industry Symposium, July 15-17, 2009
378
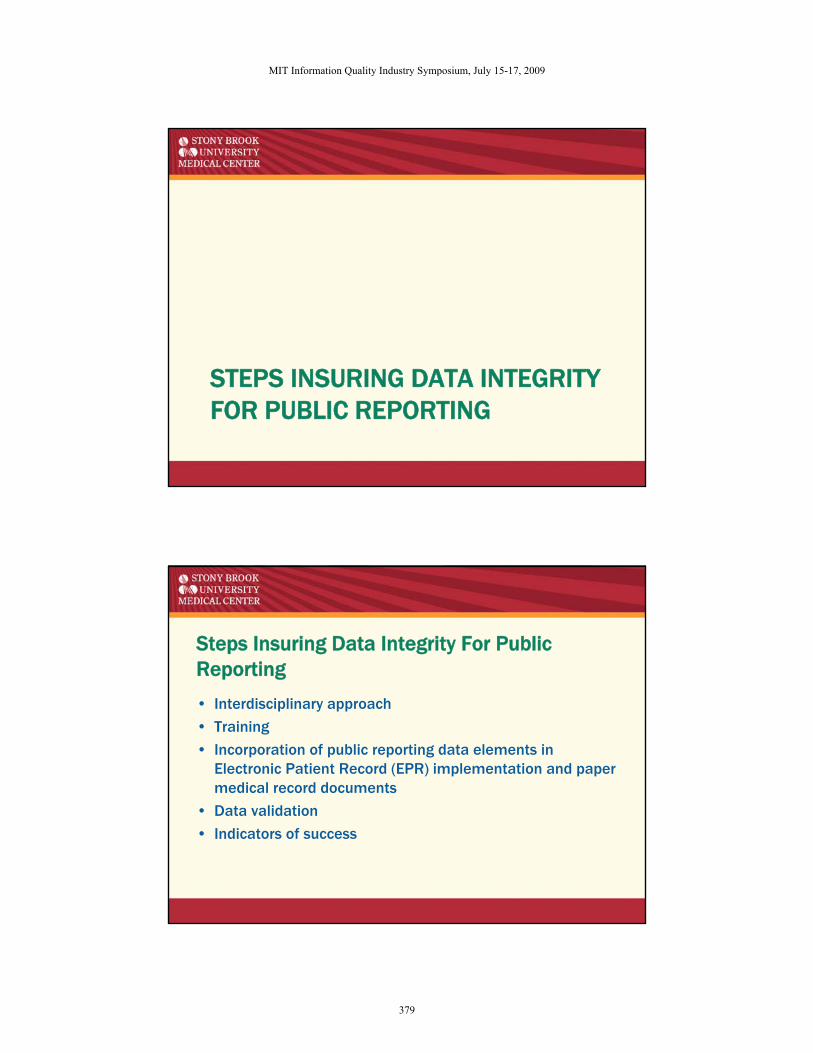
STEPS INSURING DATA INTEGRITY FOR PUBLIC REPORTING
Steps Insuring Data Integrity For Public Reporting
• Interdisciplinary approach
• Training
• Incorporation of public reporting data elements in Electronic Patient Record (EPR) implementation and paper medical record documents
• Data validation
• Indicators of success
MIT Information Quality Industry Symposium, July 15-17, 2009
379
Interdisciplinary Approach
• Data Integrity Task Force
• EPR implementation
• Medical record abstraction validation
Training
• Data Abstractors/Analysts
– Centralized
– Ongoing
– Review of revised data element specifications
– Monthly meetings at which specifications/validation results are clarified
– Continuous updates to internal reference documents summarizing clarifications from public reporting agencies
MIT Information Quality Industry Symposium, July 15-17, 2009
380
MIT Information Quality Industry Symposium, July 15-17, 2009
381
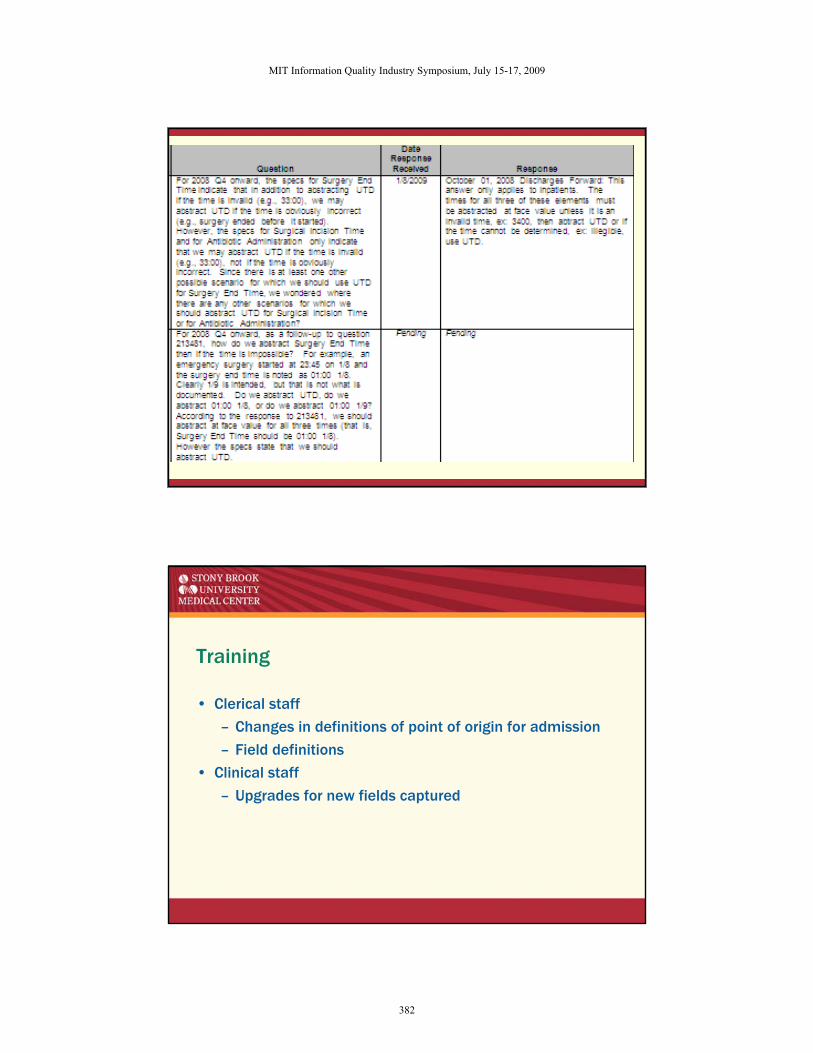
Training
• Clerical staff
– Changes in definitions of point of origin for admission
– Field definitions
• Clinical staff
– Upgrades for new fields captured
MIT Information Quality Industry Symposium, July 15-17, 2009
382
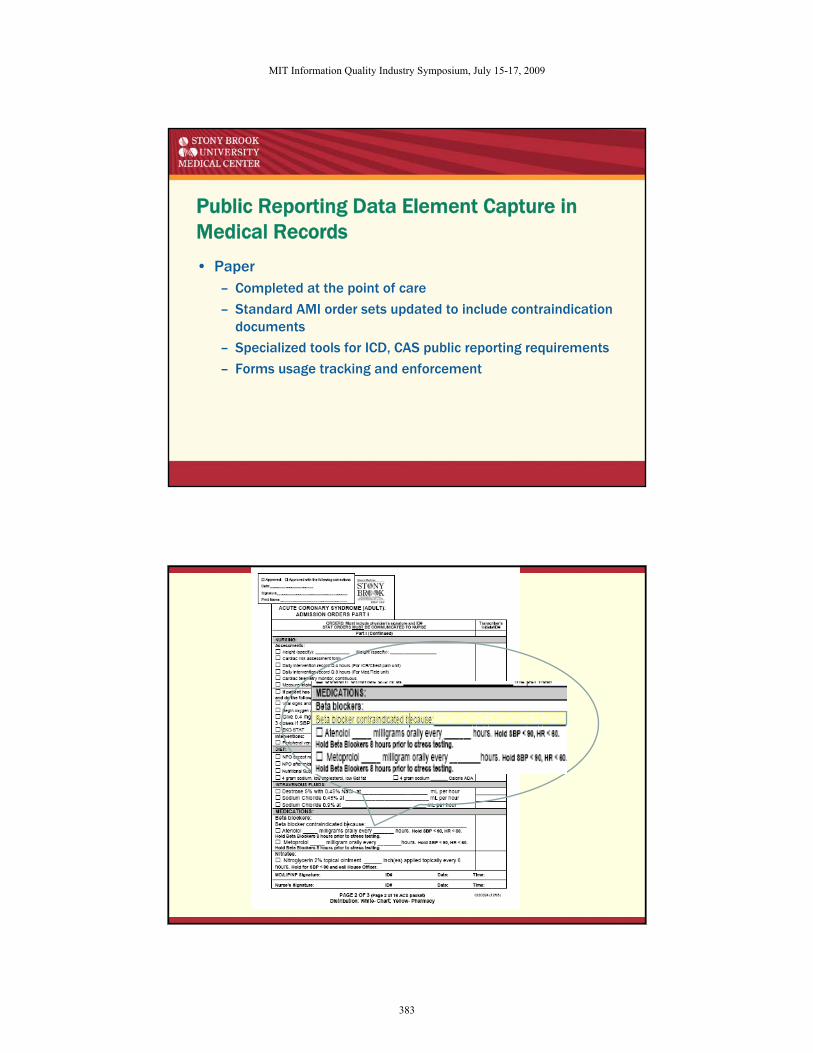
Public Reporting Data Element Capture in Medical Records
• Paper – Completed at the point of care
– Standard AMI order sets updated to include contraindication documents
– Specialized tools for ICD, CAS public reporting requirements
– Forms usage tracking and enforcement
MIT Information Quality Industry Symposium, July 15-17, 2009
383
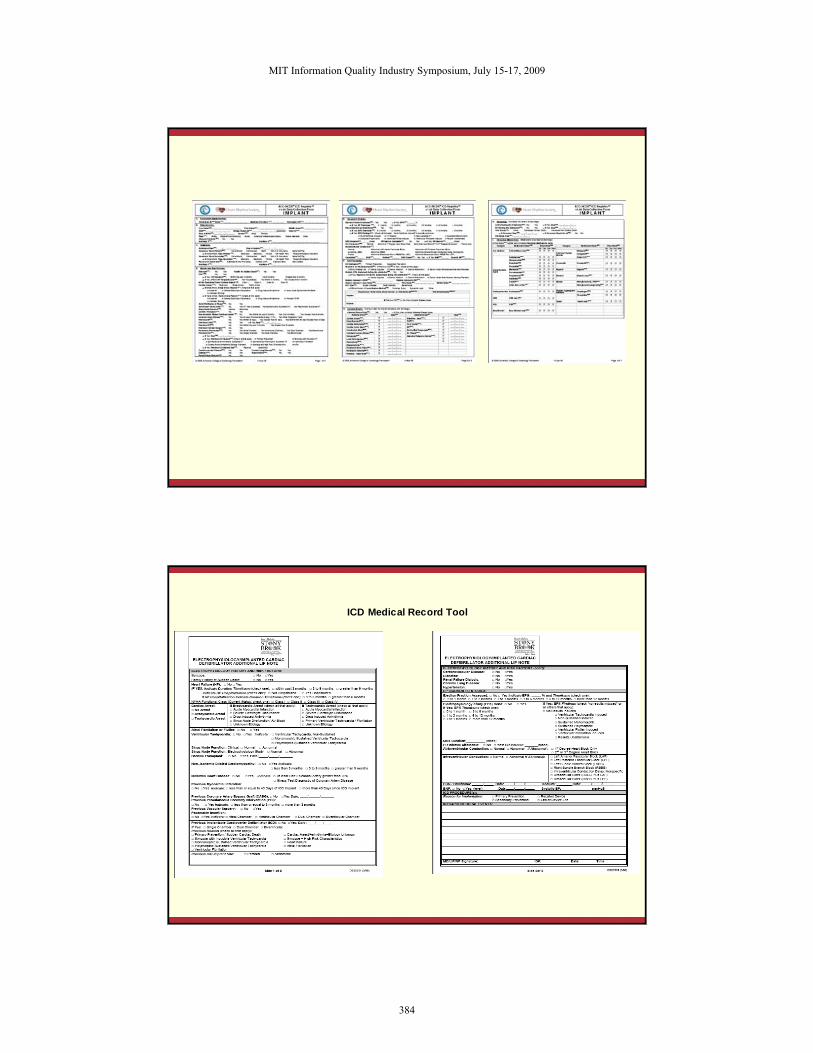
ICD Medical Record Tool
MIT Information Quality Industry Symposium, July 15-17, 2009
384
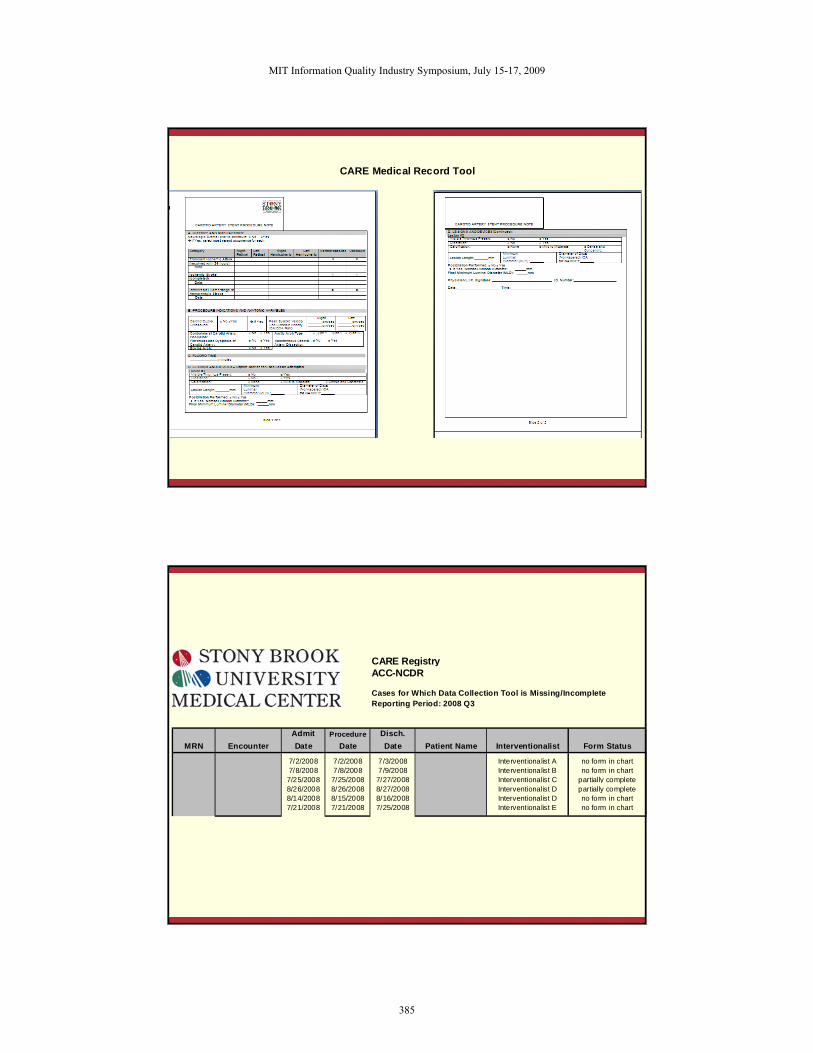
CARE Medical Record Tool
CARE RegistryACC-NCDR
Cases for Which Data Collection Tool is Missing/IncompleteReporting Period: 2008 Q3
Admit Procedure Disch.MRN Encounter Date Date Date Patient Name Interventionalist Form Status
7/2/2008 7/2/2008 7/3/2008 Interventionalist A no form in chart7/8/2008 7/8/2008 7/9/2008 Interventionalist B no form in chart7/25/2008 7/25/2008 7/27/2008 Interventionalist C partially complete8/26/2008 8/26/2008 8/27/2008 Interventionalist D partially complete8/14/2008 8/15/2008 8/16/2008 Interventionalist D no form in chart7/21/2008 7/21/2008 7/25/2008 Interventionalist E no form in chart
MIT Information Quality Industry Symposium, July 15-17, 2009
385
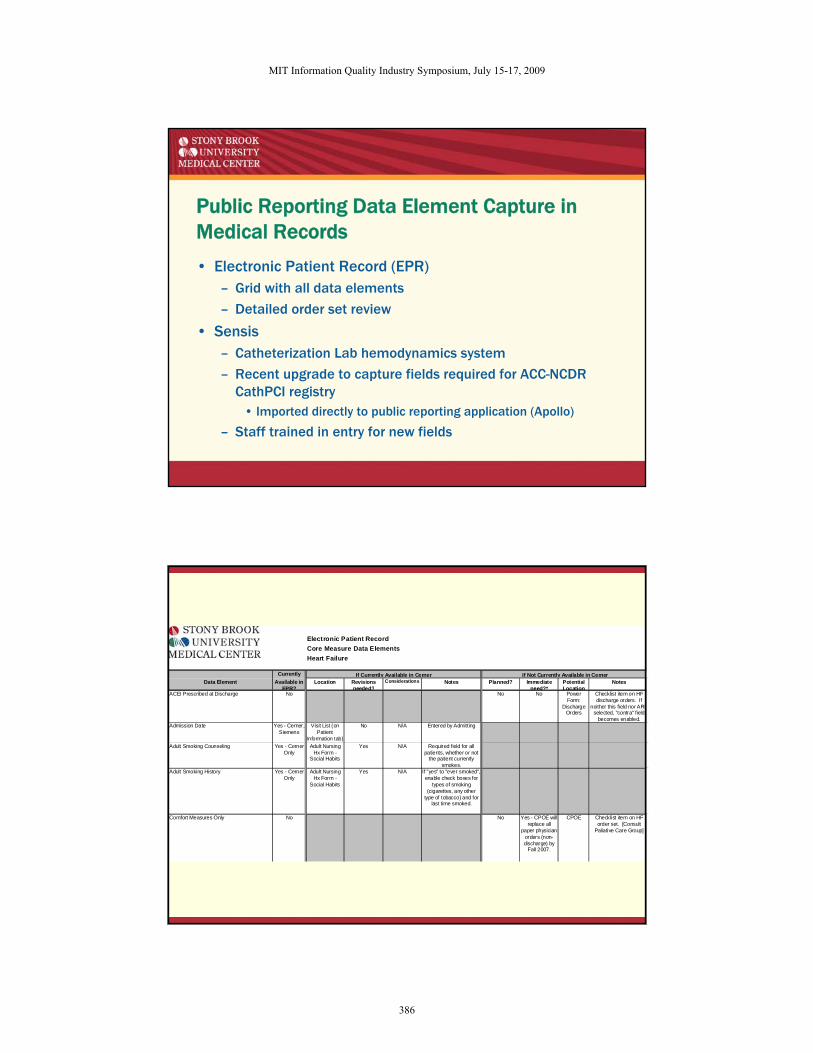
Public Reporting Data Element Capture in Medical Records
• Electronic Patient Record (EPR)– Grid with all data elements
– Detailed order set review
• Sensis– Catheterization Lab hemodynamics system
– Recent upgrade to capture fields required for ACC-NCDR CathPCI registry
• Imported directly to public reporting application (Apollo)
– Staff trained in entry for new fields
Electronic Patient RecordCore Measure Data ElementsHeart Failure
Currently If Currently Available in Cerner If Not Currently Available in CernerData Element Available in
EPR?Location Revisions
needed?Considerations Notes Planned? Immediate
need?*Potential Location
Notes
ACEI Prescribed at Discharge No No No Power Form:
Discharge Orders
Checklist item on HF discharge orders. If
neither this field nor ARBselected, "contra" field
becomes enabled.Admission Date Yes - Cerner,
SiemensVisit List (on
Patient Information tab)
No N/A Entered by Admitting
Adult Smoking Counseling Yes - Cerner Only
Adult Nursing Hx Form -
Social Habits
Yes N/A Required field for all patients, whether or not
the patient currently smokes.
Adult Smoking History Yes - Cerner Only
Adult Nursing Hx Form -
Social Habits
Yes N/A If "yes" to "ever smoked", enable check boxes for
types of smoking (cigarettes, any other
type of tobacco) and for last time smoked.
Comfort Measures Only No No Yes - CPOE will replace all
paper physician orders (non-discharge) by
Fall 2007.
CPOE Checklist item on HF order set. [Consult
Paliative Care Group]
MIT Information Quality Industry Symposium, July 15-17, 2009
386
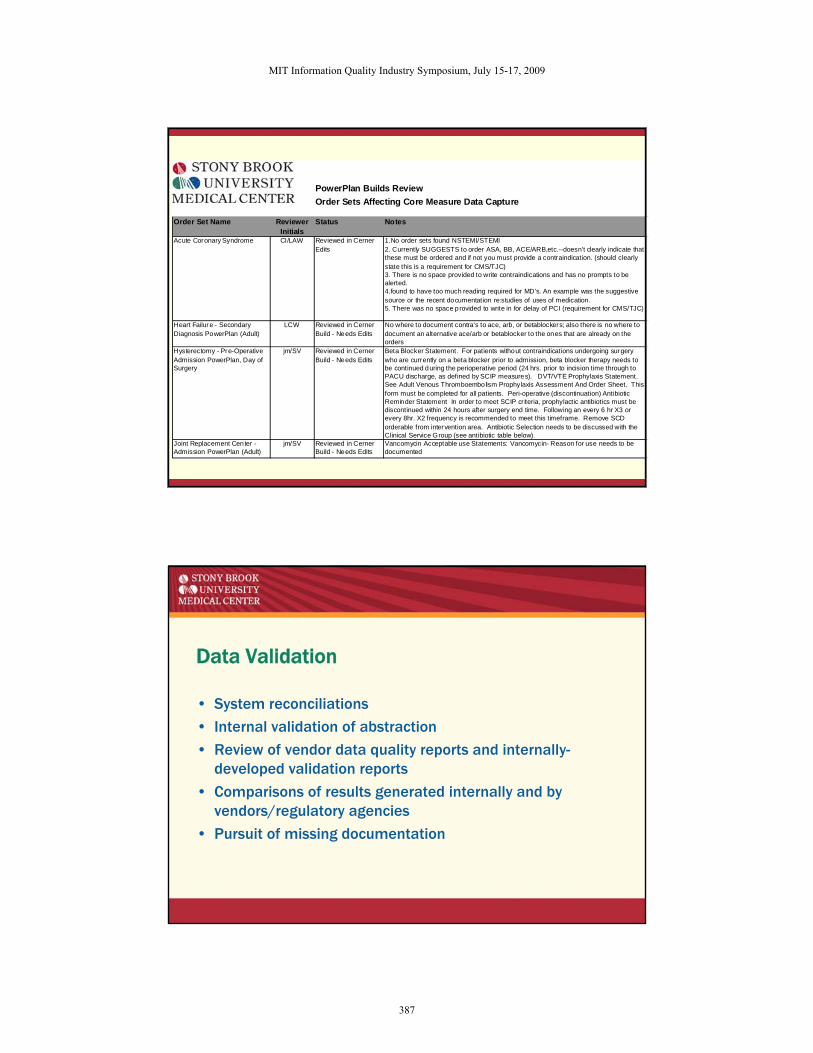
PowerPlan Builds ReviewOrder Sets Affecting Core Measure Data Capture
Order Set Name Reviewer Initials
Status Notes
Acute Coronary Syndrome CI/LAW Reviewed in Cerner 1.No order sets found NSTEMI/STEMIEdits 2. Currently SUGGESTS to order ASA, BB, ACE/ARB,etc.--doesn't clearly indicate that
these must be ordered and if not you must provide a contraindication. (should clearly state this is a requirement for CMS/TJC)3. There is no space provided to write contraindications and has no prompts to be alerted. 4.found to have too much reading required for MD's. An example was the suggestive source or the recent documentation re:studies of uses of medication.5. There was no space provided to write in for delay of PCI (requirement for CMS/TJC)
Heart Failure - Secondary Diagnosis PowerPlan (Adult)
LCW Reviewed in Cerner Build - Needs Edits
No where to document contra's to ace, arb, or betablockers; also there is no where to document an alternative ace/arb or betablocker to the ones that are already on the orders
Hysterectomy - Pre-Operative Admission PowerPlan, Day of Surgery
jm/SV Reviewed in Cerner Build - Needs Edits
Beta Blocker Statement. For patients without contraindications undergoing surgery who are currently on a beta blocker prior to admission, beta blocker therapy needs to be continued during the perioperative period (24 hrs. prior to incision time through to PACU discharge, as defined by SCIP measures). DVT/VTE Prophylaxis Statement. See Adult Venous Thromboembolism Prophylaxis Assessment And Order Sheet. This form must be completed for all patients. Peri-operative (discontinuation) Antibiotic Reminder Statement In order to meet SCIP cr iteria, prophylactic antibiotics must be discontinued within 24 hours after surgery end time. Following an every 6 hr X3 or every 8hr. X2 frequency is recommended to meet this timeframe. Remove SCD orderable from intervention area. Antibiotic Selection needs to be discussed with the Clinical Service Group (see antibiotic table below).
Joint Replacement Center - Admission PowerPlan (Adult)
jm/SV Reviewed in Cerner Build - Needs Edits
Vancomycin Acceptable use Statements: Vancomycin- Reason for use needs to be documented
Data Validation
• System reconciliations
• Internal validation of abstraction
• Review of vendor data quality reports and internally-developed validation reports
• Comparisons of results generated internally and by vendors/regulatory agencies
• Pursuit of missing documentation
MIT Information Quality Industry Symposium, July 15-17, 2009
387
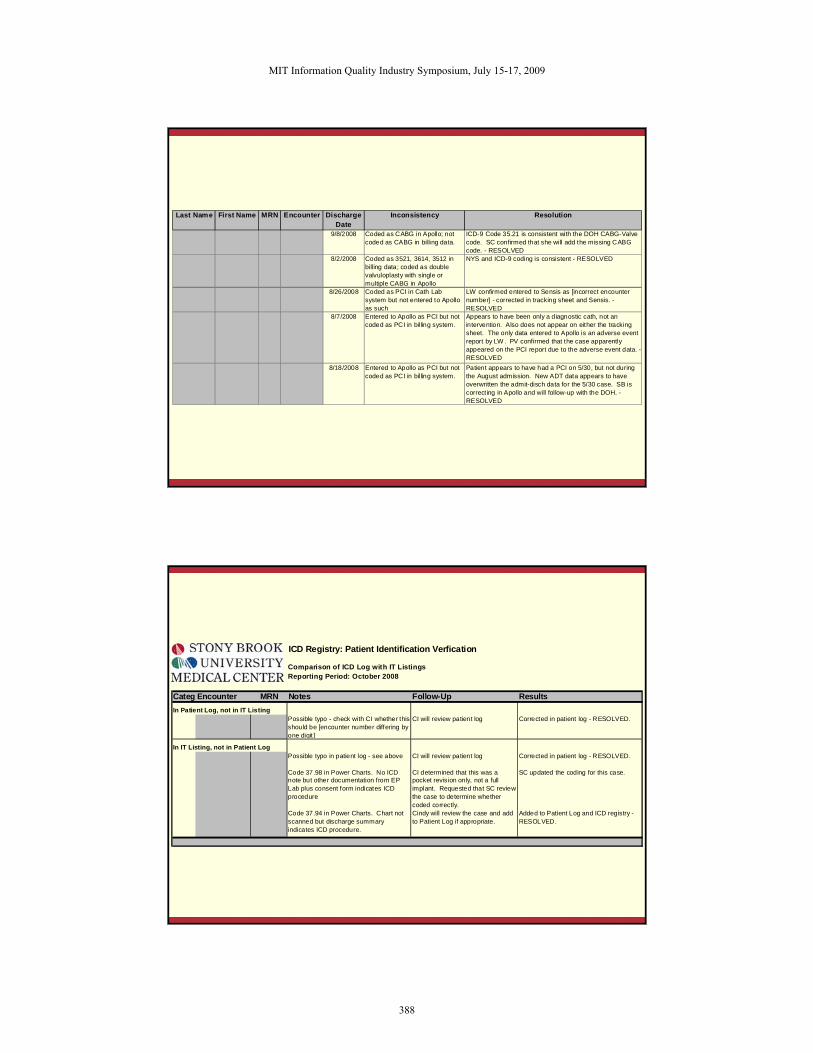
Last Name First Name MRN Encounter Discharge Date
Inconsistency Resolution
9/8/2008 Coded as CABG in Apollo; not coded as CABG in billing data.
ICD-9 Code 35.21 is consistent with the DOH CABG-Valve code. SC confirmed that she will add the missing CABG code. - RESOLVED
8/2/2008 Coded as 3521, 3614, 3512 in billing data; coded as double valvuloplasty with single or multiple CABG in Apollo
NYS and ICD-9 coding is consistent - RESOLVED
8/26/2008 Coded as PCI in Cath Lab system but not entered to Apollo as such
LW confirmed entered to Sensis as [incorrect encounter number] - corrected in tracking sheet and Sensis. - RESOLVED
8/7/2008 Entered to Apollo as PCI but not coded as PCI in billing system.
Appears to have been only a diagnostic cath, not an intervention. Also does not appear on either the tracking sheet. The only data entered to Apollo is an adverse event report by LW . PV confirmed that the case apparently appeared on the PCI report due to the adverse event data. - RESOLVED
8/18/2008 Entered to Apollo as PCI but not coded as PCI in billing system.
Patient appears to have had a PCI on 5/30, but not during the August admission. New ADT data appears to have overwritten the admit-disch data for the 5/30 case. SB is correcting in Apollo and will follow-up with the DOH. - RESOLVED
ICD Registry: Patient Identification Verfication
Comparison of ICD Log with IT ListingsReporting Period: October 2008
Categ Encounter MRN Notes Follow-Up ResultsIn Patient Log, not in IT Listing
Possible typo - check with CI whether this should be [encounter number differing by one digit ]
CI will review patient log Corrected in patient log - RESOLVED.
In IT Listing, not in Patient LogPossible typo in patient log - see above CI will review patient log Corrected in patient log - RESOLVED.
Code 37.98 in Power Charts. No ICD note but other documentation from EP Lab plus consent form indicates ICD procedure
CI determined that this was a pocket revision only, not a full implant. Requested that SC review the case to determine whether coded correctly.
SC updated the coding for this case.
Code 37.94 in Power Charts. Chart not scanned but discharge summary indicates ICD procedure.
Cindy will review the case and add to Patient Log if appropriate.
Added to Patient Log and ICD registry - RESOLVED.
MIT Information Quality Industry Symposium, July 15-17, 2009
388
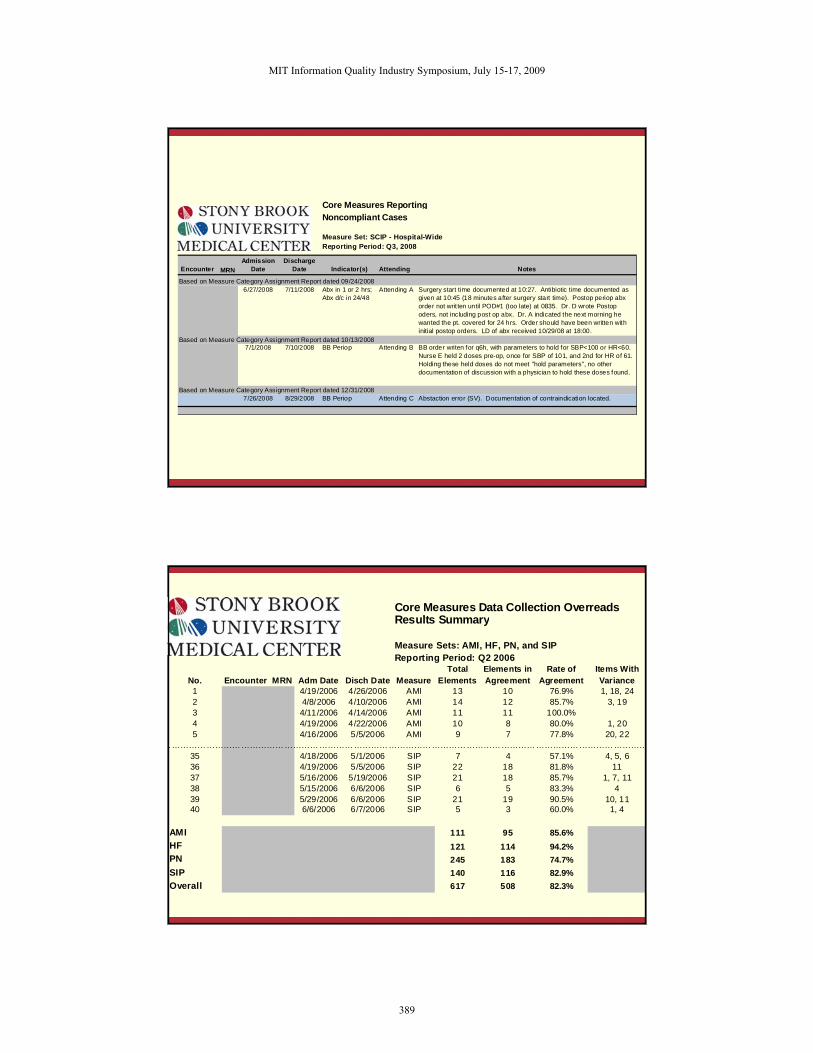
Core Measures ReportingNoncompliant Cases
Measure Set: SCIP - Hospital-WideReporting Period: Q3, 2008
Encounter MRNAdmission
DateDischarge
Date Indicator(s) Attending Notes
Based on Measure Category Assignment Report dated 09/24/20086/27/2008 7/11/2008 Abx in 1 or 2 hrs;
Abx d/c in 24/48Attending A Surgery start time documented at 10:27. Antibiotic time documented as
given at 10:45 (18 minutes after surgery start time). Postop periop abx order not writ ten until POD#1 (too late) at 0835. Dr. D wrote Postop oders, not including post op abx. Dr. A indicated the next morning he wanted the pt. covered for 24 hrs. Order should have been written with initial postop orders. LD of abx received 10/29/08 at 18:00.
Based on Measure Category Assignment Report dated 10/13/20087/1/2008 7/10/2008 BB Periop Attending B BB order writen for q6h, with parameters to hold for SBP<100 or HR<60.
Nurse E held 2 doses pre-op, once for SBP of 101, and 2nd for HR of 61. Holding these held doses do not meet "hold parameters", no other documentation of discussion with a physician to hold these doses found.
Based on Measure Category Assignment Report dated 12/31/20087/26/2008 8/29/2008 BB Periop Attending C Abstaction error (SV). Documentation of contraindication located.
Core Measures Data Collection OverreadsResults Summary
Measure Sets: AMI, HF, PN, and SIPReporting Period: Q2 2006
No. Encounter MRN Adm Date Disch Date MeasureTotal
ElementsElements in Agreement
Rate of Agreement
Items With Variance
1 4/19/2006 4/26/2006 AMI 13 10 76.9% 1, 18, 242 4/8/2006 4/10/2006 AMI 14 12 85.7% 3, 193 4/11/2006 4/14/2006 AMI 11 11 100.0%4 4/19/2006 4/22/2006 AMI 10 8 80.0% 1, 205 4/16/2006 5/5/2006 AMI 9 7 77.8% 20, 22
……………………………………………………………………………………………………………………………………………………35 4/18/2006 5/1/2006 SIP 7 4 57.1% 4, 5, 636 4/19/2006 5/5/2006 SIP 22 18 81.8% 1137 5/16/2006 5/19/2006 SIP 21 18 85.7% 1, 7, 1138 5/15/2006 6/6/2006 SIP 6 5 83.3% 439 5/29/2006 6/6/2006 SIP 21 19 90.5% 10, 1140 6/6/2006 6/7/2006 SIP 5 3 60.0% 1, 4
AMI 111 95 85.6%HF 121 114 94.2%PN 245 183 74.7%SIP 140 116 82.9%Overall 617 508 82.3%
MIT Information Quality Industry Symposium, July 15-17, 2009
389
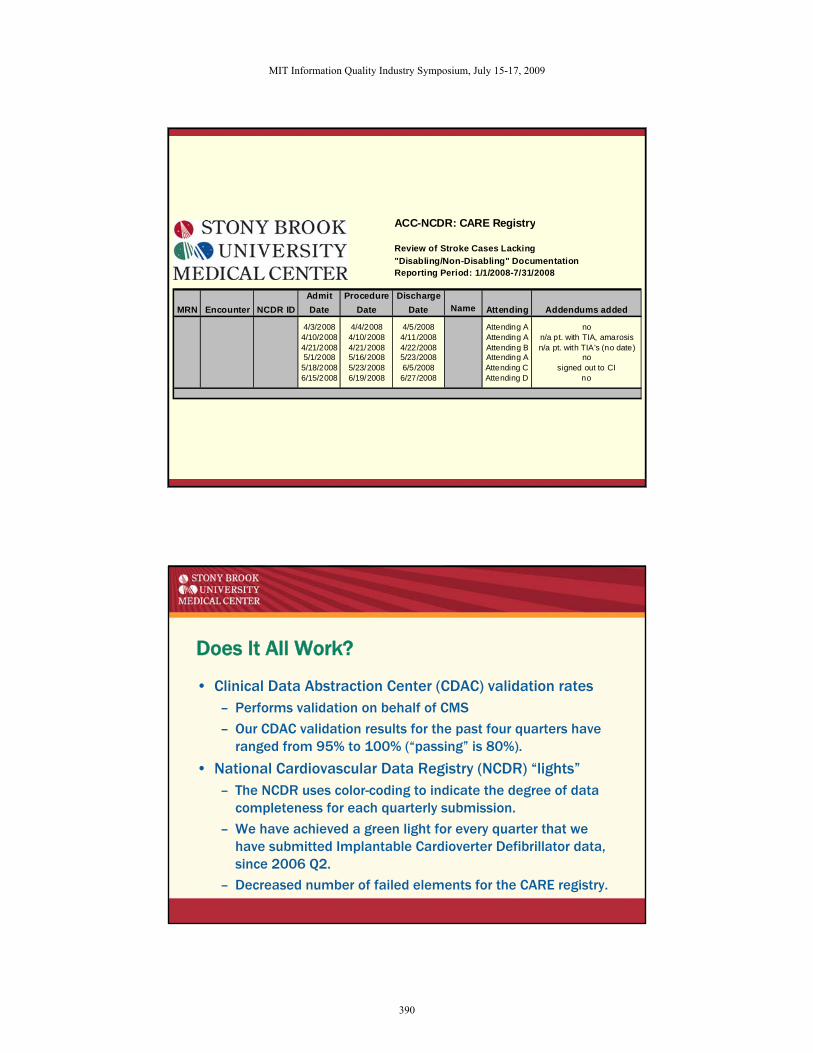
ACC-NCDR: CARE Registry
Review of Stroke Cases Lacking"Disabling/Non-Disabling" DocumentationReporting Period: 1/1/2008-7/31/2008
Admit Procedure DischargeMRN Encounter NCDR ID Date Date Date Name Attending Addendums added
4/3/2008 4/4/2008 4/5/2008 Attending A no4/10/2008 4/10/2008 4/11/2008 Attending A n/a pt. with TIA, amarosis4/21/2008 4/21/2008 4/22/2008 Attending B n/a pt. with TIA's (no date)5/1/2008 5/16/2008 5/23/2008 Attending A no5/18/2008 5/23/2008 6/5/2008 Attending C signed out to CI6/15/2008 6/19/2008 6/27/2008 Attending D no
Does It All Work?
• Clinical Data Abstraction Center (CDAC) validation rates– Performs validation on behalf of CMS
– Our CDAC validation results for the past four quarters have ranged from 95% to 100% (“passing” is 80%).
• National Cardiovascular Data Registry (NCDR) “lights”– The NCDR uses color-coding to indicate the degree of data
completeness for each quarterly submission.
– We have achieved a green light for every quarter that we have submitted Implantable Cardioverter Defibrillator data, since 2006 Q2.
– Decreased number of failed elements for the CARE registry.
MIT Information Quality Industry Symposium, July 15-17, 2009
390
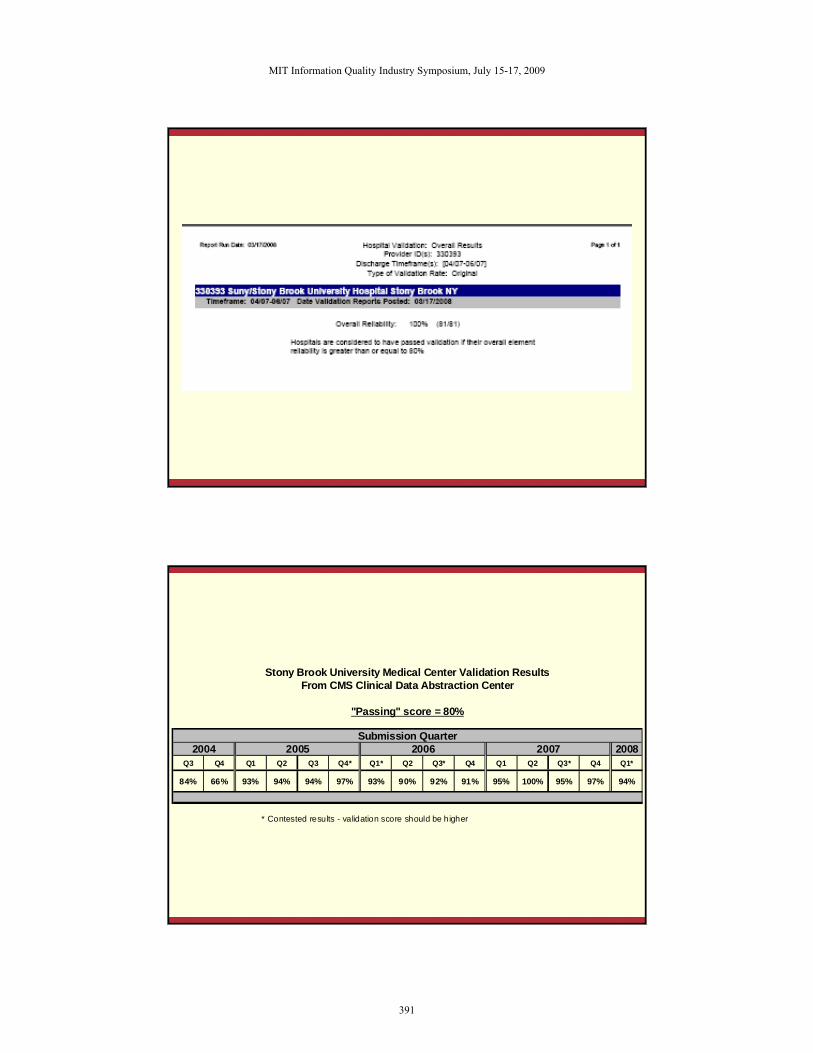
Stony Brook University Medical Center Validation ResultsFrom CMS Clinical Data Abstraction Center
"Passing" score = 80%
Submission Quarter2004 2005 2006 2007 2008
Q3 Q4 Q1 Q2 Q3 Q4* Q1* Q2 Q3* Q4 Q1 Q2 Q3* Q4 Q1*
84% 66% 93% 94% 94% 97% 93% 90% 92% 91% 95% 100% 95% 97% 94%
* Contested results - validation score should be higher
MIT Information Quality Industry Symposium, July 15-17, 2009
391
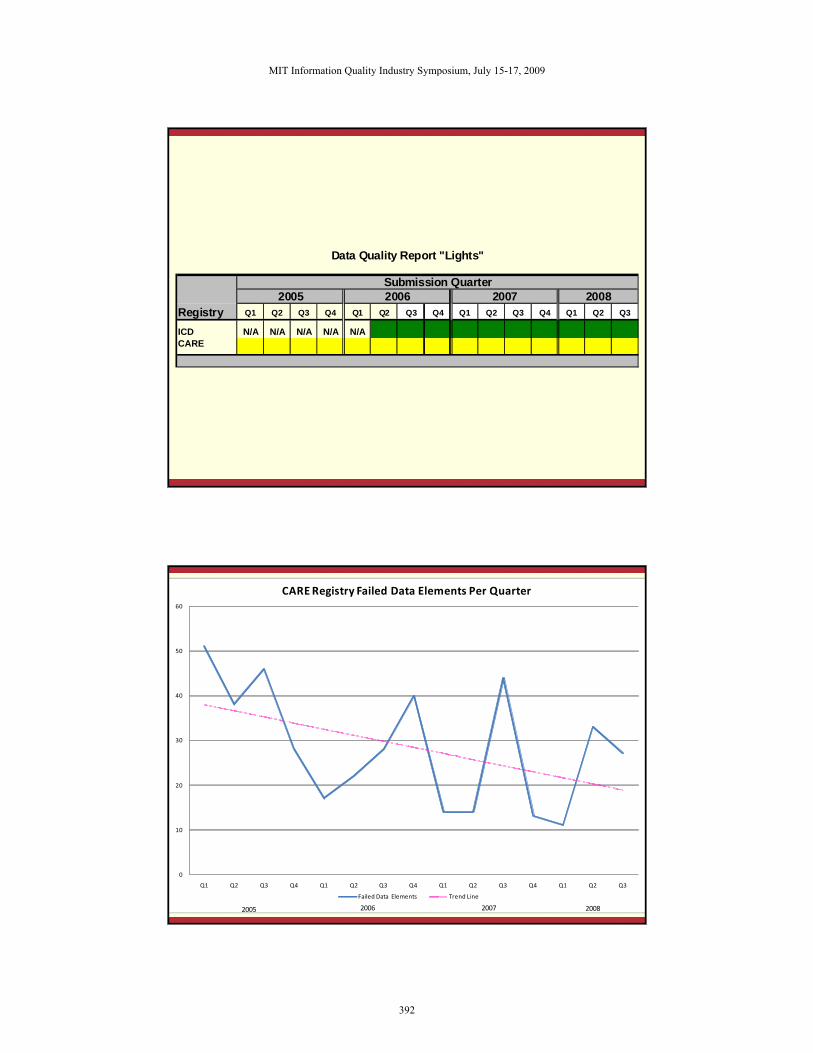
Data Quality Report "Lights"
Submission Quarter2005 2006 2007 2008
Registry Q1 Q2 Q3 Q4 Q1 Q2 Q3 Q4 Q1 Q2 Q3 Q4 Q1 Q2 Q3
ICD N/A N/A N/A N/A N/ACARE
0
10
20
30
40
50
60
Q1 Q2 Q3 Q4 Q1 Q2 Q3 Q4 Q1 Q2 Q3 Q4 Q1 Q2 Q3
CARE Registry Failed Data Elements Per Quarter
Failed Data Elements Trend Line
2006 2007 20082005
MIT Information Quality Industry Symposium, July 15-17, 2009
392
OVERVIEW
Overview
• About Stony Brook University Medical Center
• Steps insuring data integrity for public reporting
• Mechanisms for using those data to evaluate patient care quality
MIT Information Quality Industry Symposium, July 15-17, 2009
393
MECHANISMS FOR USING DATA TO EVALUATE PATIENT CARE QUALITY
Quality Improvement and Reporting Levels
• To be successful, (CQI) efforts must incorporate accountability at all levels of the facility, from leadership toindividual staff.– CQI results are accountable to all levels of the Quality
Management structure, including the Associate Director for Quality Management, Chief Quality Officer, Quality Coordinating Group, Quality Committee of the Governing Body, Chief Executive Officer, Quality Assessment Review Board, Governing Body, and State University of New York Board of Trustees
• This is best accomplished through a wide range of reporting efforts, tailored to each accountable group.
MIT Information Quality Industry Symposium, July 15-17, 2009
394
Quality Improvement and Reporting Levels
• Most of the reports in this presentation are based on the following databases, which offer a rich source from which to create such reports:– University HealthSystem Consortium (UHC) core measure
database
– NCDR ICD and CARE databases
• CQI activities may then be developed and monitored based on the results of these reports.
Three Reporting Levels
• Scorecards
• Dashboards
• Detailed reports
MIT Information Quality Industry Symposium, July 15-17, 2009
395
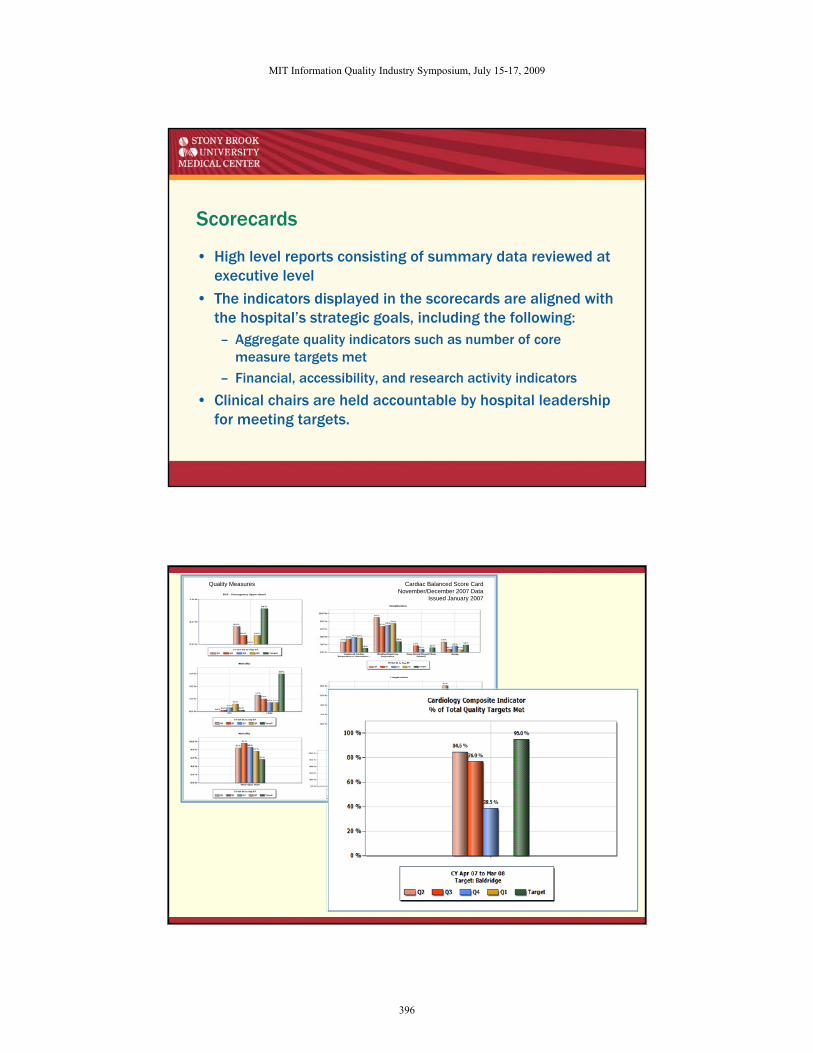
Scorecards
• High level reports consisting of summary data reviewed at executive level
• The indicators displayed in the scorecards are aligned with the hospital’s strategic goals, including the following:– Aggregate quality indicators such as number of core
measure targets met
– Financial, accessibility, and research activity indicators
• Clinical chairs are held accountable by hospital leadership for meeting targets.
Quality Measures Cardiac Balanced Score CardNovember/December 2007 Data
Issued January 2007
MIT Information Quality Industry Symposium, July 15-17, 2009
396
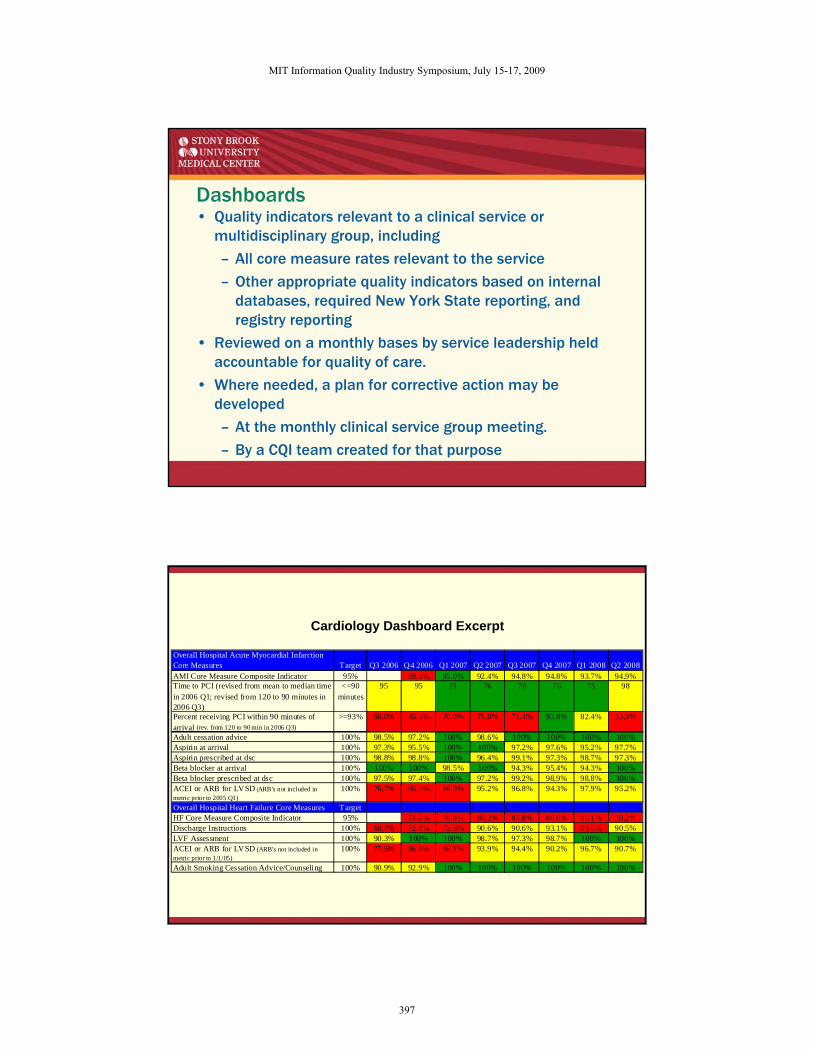
Dashboards• Quality indicators relevant to a clinical service or
multidisciplinary group, including
– All core measure rates relevant to the service
– Other appropriate quality indicators based on internal databases, required New York State reporting, and registry reporting
• Reviewed on a monthly bases by service leadership held accountable for quality of care.
• Where needed, a plan for corrective action may be developed
– At the monthly clinical service group meeting.
– By a CQI team created for that purpose
Cardiology Dashboard Excerpt
Overall Hospital Acute Myocardial Infarction Core Measures Target Q3 2006 Q4 2006 Q1 2007 Q2 2007 Q3 2007 Q4 2007 Q1 2008 Q2 2008AMI Core Measure Composite Indicator 95% 89.3% 95.0% 92.4% 94.8% 94.8% 93.7% 94.9%Time to PCI (revised from mean to median time in 2006 Q1; revised from 120 to 90 minutes in 2006 Q3)
<=90 minutes
95 95 71 76 78 76 75 98
Percent receiving PCI within 90 minutes of arrival (rev. from 120 to 90 min in 2006 Q3)
>=93% 50.0% 45.5% 70.0% 75.0% 71.4% 93.8% 82.4% 33.3%
Adult cessation advice 100% 98.5% 97.2% 100% 98.6% 100% 100% 100% 100%Aspirin at arrival 100% 97.3% 95.5% 100% 100% 97.2% 97.6% 95.2% 97.7%Aspirin prescribed at dsc 100% 98.8% 98.8% 100% 96.4% 99.1% 97.3% 98.7% 97.3%Beta blocker at arrival 100% 100% 100% 98.5% 100% 94.3% 95.4% 94.3% 100%Beta blocker prescribed at dsc 100% 97.5% 97.4% 100% 97.2% 99.2% 98.9% 98.8% 100%ACEI or ARB for LVSD (ARB's not included in metric prior to 2005 Q1)
100% 76.7% 86.0% 86.0% 95.2% 96.8% 94.3% 97.9% 95.2%
Overall Hospital Heart Failure Core Measures TargetHF Core Measure Composite Indicator 95% 71.8% 70.8% 88.2% 87.8% 88.0% 86.1% 89.2%Discharge Instructions 100% 60.7% 72.4% 72.6% 90.6% 90.6% 93.1% 83.6% 90.5%LVF Assessment 100% 90.3% 100% 100% 98.7% 97.3% 98.7% 100% 100%ACEI or ARB for LVSD (ARB's not included in metric prior to 1/1/05)
100% 77.5% 86.8% 86.1% 93.9% 94.4% 90.2% 96.7% 90.7%
Adult Smoking Cessation Advice/Counseling 100% 90.9% 92.9% 100% 100% 100% 100% 100% 100%
MIT Information Quality Industry Symposium, July 15-17, 2009
397
Detailed Reports
• Results for individual indicators
• Documenting specifics of noncompliance and adverse events
• Identifying units that have a problem
• Demonstrating associations between care and outcomes
• Breakdowns of care into intermediate steps
Results for Individual Indicators
• Mechanism for identifying specific areas of improvement
MIT Information Quality Industry Symposium, July 15-17, 2009
398
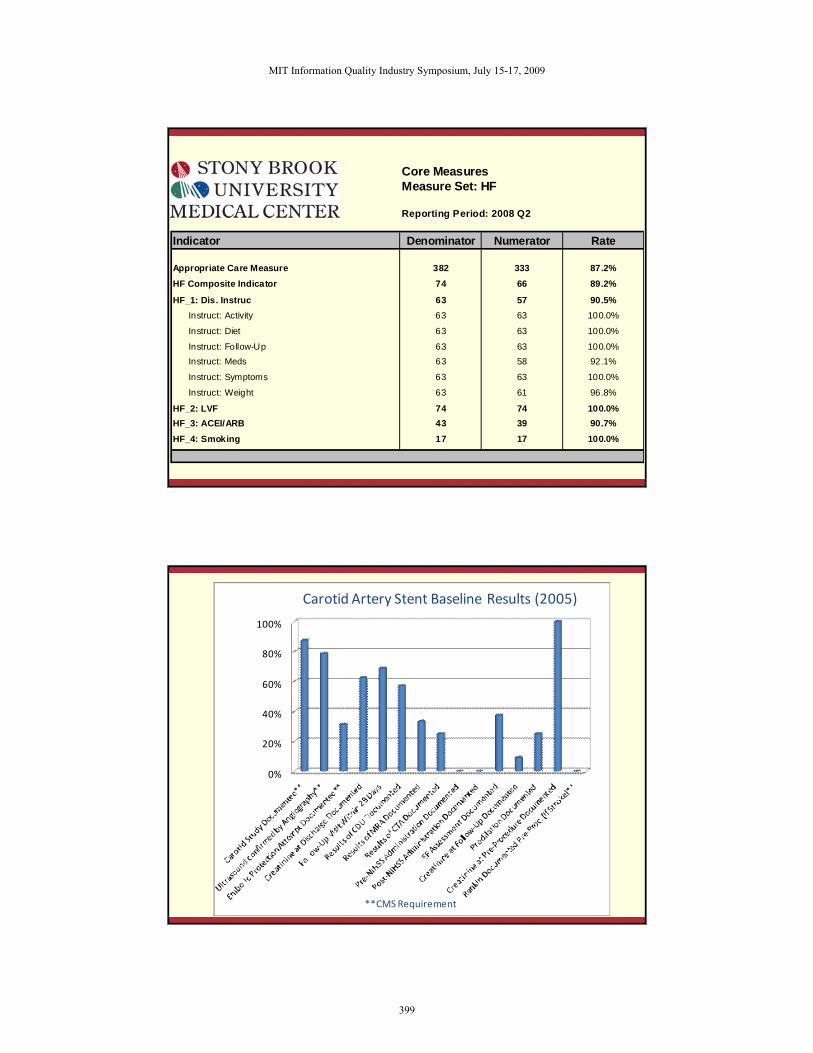
Core MeasuresMeasure Set: HF
Reporting Period: 2008 Q2
Indicator Denominator Numerator Rate
Appropriate Care Measure 382 333 87.2%HF Composite Indicator 74 66 89.2%
HF_1: Dis. Instruc 63 57 90.5%Instruct: Activity 63 63 100.0%
Instruct: Diet 63 63 100.0%
Instruct: Follow-Up 63 63 100.0%Instruct: Meds 63 58 92.1%
Instruct: Symptoms 63 63 100.0%
Instruct: Weight 63 61 96.8%
HF_2: LVF 74 74 100.0%HF_3: ACEI/ARB 43 39 90.7%HF_4: Smoking 17 17 100.0%
0%
20%
40%
60%
80%
100%
**CMS Requirement
Carotid Artery Stent Baseline Results (2005)
MIT Information Quality Industry Symposium, July 15-17, 2009
399
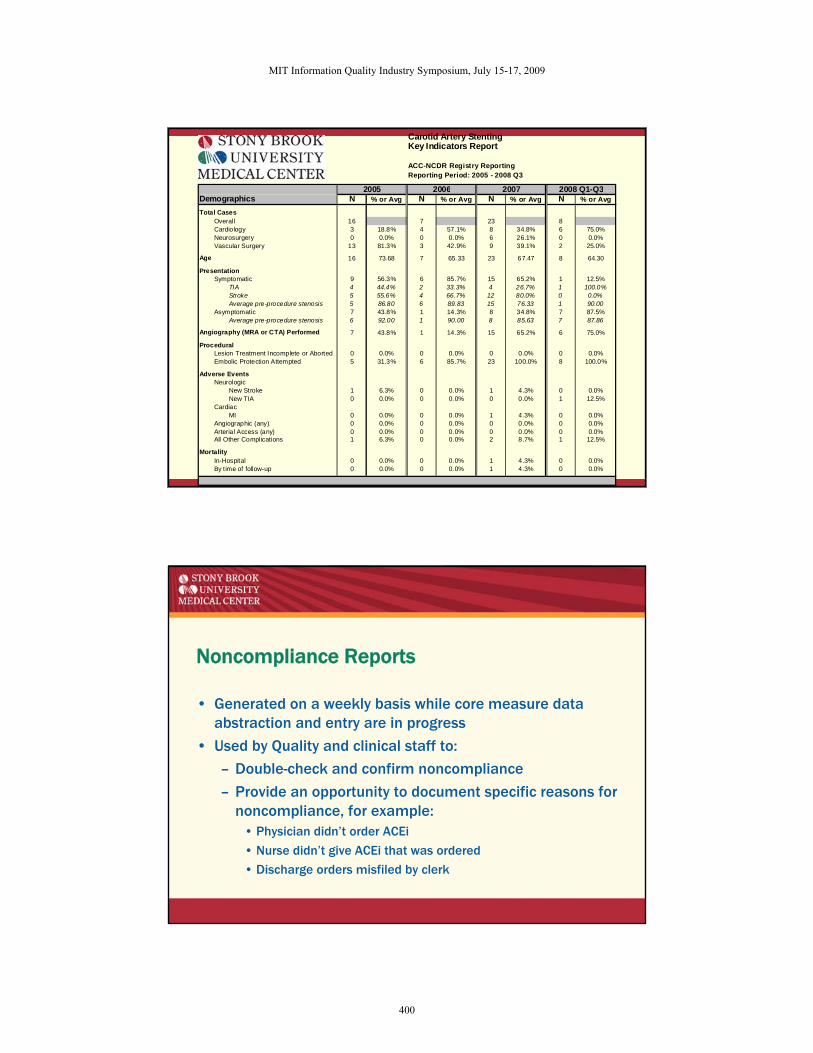
Carotid Artery StentingKey Indicators Report
ACC-NCDR Registry ReportingReporting Period: 2005 - 2008 Q3
2005 2006 2007 2008 Q1-Q3Demographics N % or Avg N % or Avg N % or Avg N % or Avg
Total CasesOverall 16 7 23 8Cardiology 3 18.8% 4 57.1% 8 34.8% 6 75.0%Neurosurgery 0 0.0% 0 0.0% 6 26.1% 0 0.0%Vascular Surgery 13 81.3% 3 42.9% 9 39.1% 2 25.0%
Age 16 73.68 7 65.33 23 67.47 8 64.30
PresentationSymptomatic 9 56.3% 6 85.7% 15 65.2% 1 12.5%
TIA 4 44.4% 2 33.3% 4 26.7% 1 100.0%Stroke 5 55.6% 4 66.7% 12 80.0% 0 0.0%Average pre-procedure stenosis 5 86.80 6 89.83 15 76.33 1 90.00
Asymptomatic 7 43.8% 1 14.3% 8 34.8% 7 87.5%Average pre-procedure stenosis 6 92.00 1 90.00 8 85.63 7 87.86
Angiography (MRA or CTA) Performed 7 43.8% 1 14.3% 15 65.2% 6 75.0%
ProceduralLesion Treatment Incomplete or Aborted 0 0.0% 0 0.0% 0 0.0% 0 0.0%Embolic Protection Attempted 5 31.3% 6 85.7% 23 100.0% 8 100.0%
Adverse EventsNeurologic
New Stroke 1 6.3% 0 0.0% 1 4.3% 0 0.0%New TIA 0 0.0% 0 0.0% 0 0.0% 1 12.5%
CardiacMI 0 0.0% 0 0.0% 1 4.3% 0 0.0%
Angiographic (any) 0 0.0% 0 0.0% 0 0.0% 0 0.0%Arterial Access (any) 0 0.0% 0 0.0% 0 0.0% 0 0.0%All Other Complications 1 6.3% 0 0.0% 2 8.7% 1 12.5%
MortalityIn-Hospital 0 0.0% 0 0.0% 1 4.3% 0 0.0%By time of follow-up 0 0.0% 0 0.0% 1 4.3% 0 0.0%
Noncompliance Reports
• Generated on a weekly basis while core measure data abstraction and entry are in progress
• Used by Quality and clinical staff to:
– Double-check and confirm noncompliance
– Provide an opportunity to document specific reasons for noncompliance, for example:
• Physician didn’t order ACEi
• Nurse didn’t give ACEi that was ordered
• Discharge orders misfiled by clerk
MIT Information Quality Industry Symposium, July 15-17, 2009
400
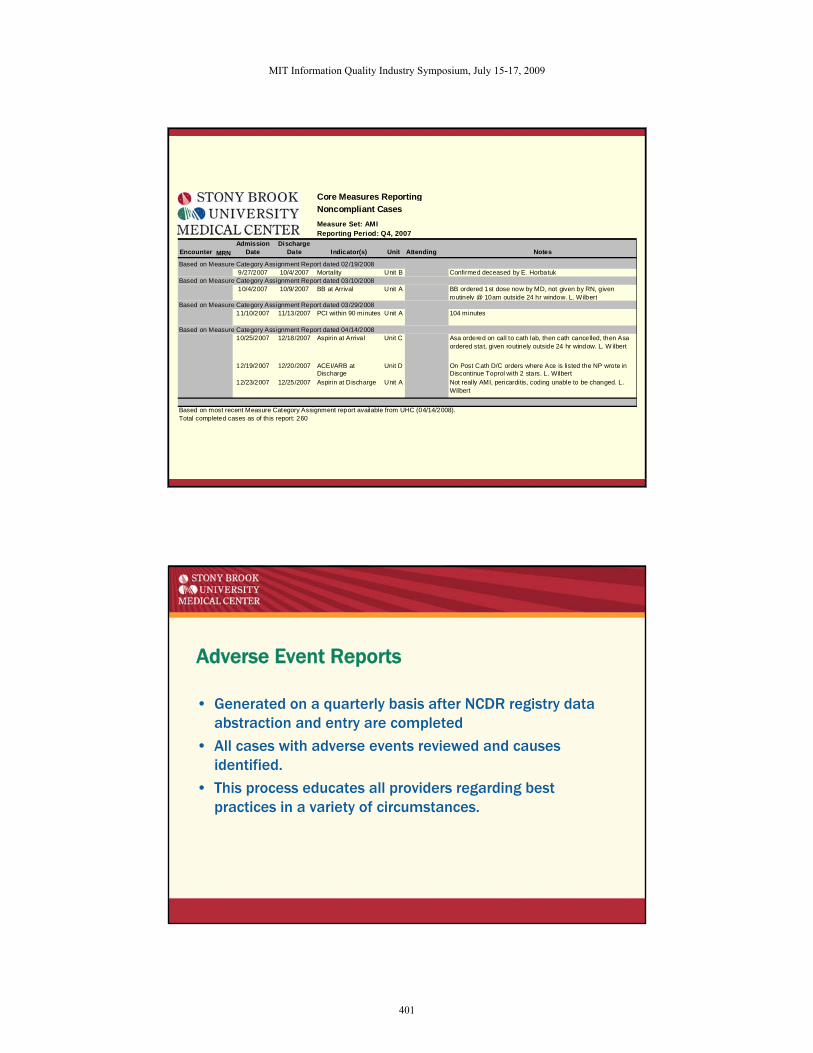
Core Measures ReportingNoncompliant CasesMeasure Set: AMIReporting Period: Q4, 2007
Encounter MRNAdmission
DateDischarge
Date Indicator(s) Unit Attending Notes
Based on Measure Category Assignment Report dated 02/19/20089/27/2007 10/4/2007 Mortality Unit B Confirmed deceased by E. Horbatuk
Based on Measure Category Assignment Report dated 03/10/200810/4/2007 10/9/2007 BB at Arrival Unit A BB ordered 1st dose now by MD, not given by RN, given
routinely @ 10am outside 24 hr window. L. W ilbertBased on Measure Category Assignment Report dated 03/29/2008
11/10/2007 11/13/2007 PCI within 90 minutes Unit A 104 minutes
Based on Measure Category Assignment Report dated 04/14/200810/25/2007 12/18/2007 Aspirin at Arrival Unit C Asa ordered on call to cath lab, then cath cancelled, then Asa
ordered stat, given routinely outside 24 hr window. L. W ilbert
12/19/2007 12/20/2007 ACEI/ARB at Discharge
Unit D On Post Cath D/C orders where Ace is listed the NP wrote in Discontinue Toprol with 2 stars. L. Wilbert
12/23/2007 12/25/2007 Aspirin at Discharge Unit A Not really AMI, pericarditis, coding unable to be changed. L. Wilbert
Based on most recent Measure Category Assignment report available from UHC (04/14/2008).Total completed cases as of this report: 260
Adverse Event Reports
• Generated on a quarterly basis after NCDR registry data abstraction and entry are completed
• All cases with adverse events reviewed and causes identified.
• This process educates all providers regarding best practices in a variety of circumstances.
MIT Information Quality Industry Symposium, July 15-17, 2009
401
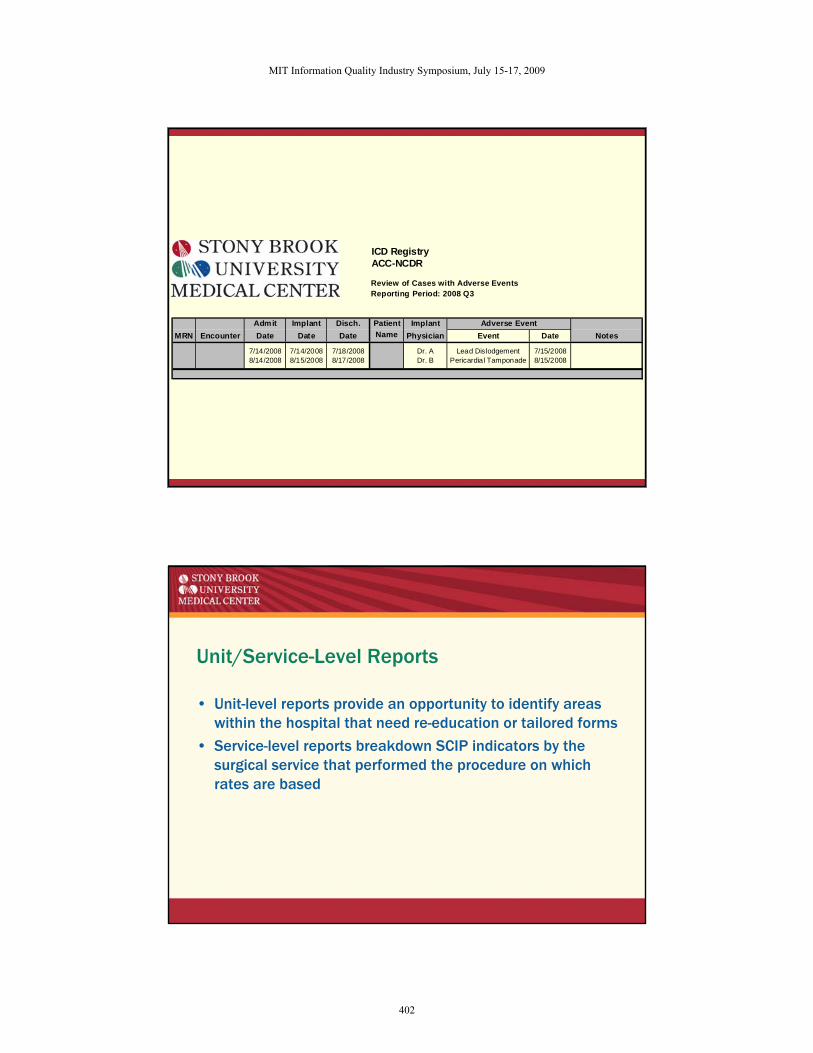
ICD RegistryACC-NCDR
Review of Cases with Adverse EventsReporting Period: 2008 Q3
Admit Implant Disch. Patient Implant Adverse EventMRN Encounter Date Date Date Name Physician Event Date Notes
7/14/2008 7/14/2008 7/18/2008 Dr. A Lead Dislodgement 7/15/20088/14/2008 8/15/2008 8/17/2008 Dr. B Pericardial Tamponade 8/15/2008
Unit/Service-Level Reports
• Unit-level reports provide an opportunity to identify areas within the hospital that need re-education or tailored forms
• Service-level reports breakdown SCIP indicators by the surgical service that performed the procedure on which rates are based
MIT Information Quality Industry Symposium, July 15-17, 2009
402
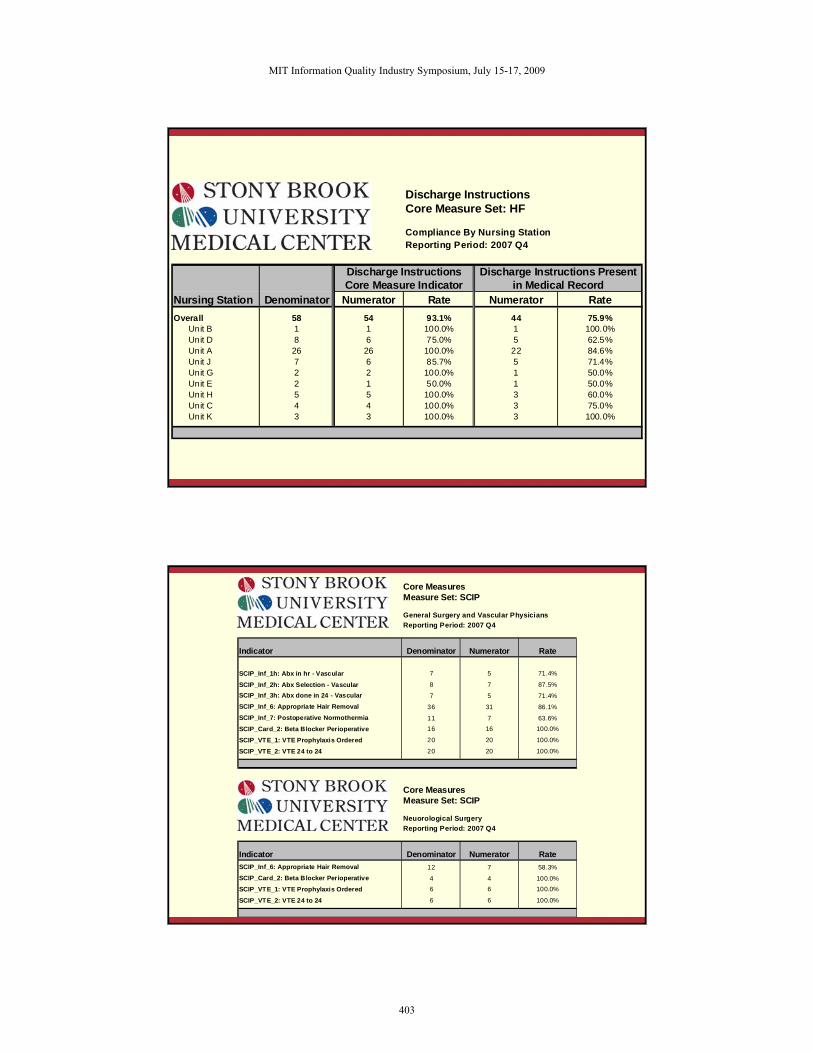
Discharge InstructionsCore Measure Set: HF
Compliance By Nursing StationReporting Period: 2007 Q4
Discharge Instructions Discharge Instructions PresentCore Measure Indicator in Medical Record
Nursing Station Denominator Numerator Rate Numerator RateOverall 58 54 93.1% 44 75.9%
Unit B 1 1 100.0% 1 100.0%Unit D 8 6 75.0% 5 62.5%Unit A 26 26 100.0% 22 84.6%Unit J 7 6 85.7% 5 71.4%Unit G 2 2 100.0% 1 50.0%Unit E 2 1 50.0% 1 50.0%Unit H 5 5 100.0% 3 60.0%Unit C 4 4 100.0% 3 75.0%Unit K 3 3 100.0% 3 100.0%
Core MeasuresMeasure Set: SCIP
General Surgery and Vascular PhysiciansReporting Period: 2007 Q4
Indicator Denominator Numerator Rate
SCIP_Inf_1h: Abx in hr - Vascular 7 5 71.4%
SCIP_Inf_2h: Abx Selection - Vascular 8 7 87.5%SCIP_Inf_3h: Abx done in 24 - Vascular 7 5 71.4%SCIP_Inf_6: Appropriate Hair Removal 36 31 86.1%SCIP_Inf_7: Postoperative Normothermia 11 7 63.6%SCIP_Card_2: Beta Blocker Perioperative 16 16 100.0%
SCIP_VTE_1: VTE Prophylaxis Ordered 20 20 100.0%
SCIP_VTE_2: VTE 24 to 24 20 20 100.0%
Core MeasuresMeasure Set: SCIP
Neuorological SurgeryReporting Period: 2007 Q4
Indicator Denominator Numerator RateSCIP_Inf_6: Appropriate Hair Removal 12 7 58.3%SCIP_Card_2: Beta Blocker Perioperative 4 4 100.0%SCIP_VTE_1: VTE Prophylaxis Ordered 6 6 100.0%
SCIP_VTE_2: VTE 24 to 24 6 6 100.0%
MIT Information Quality Industry Symposium, July 15-17, 2009
403
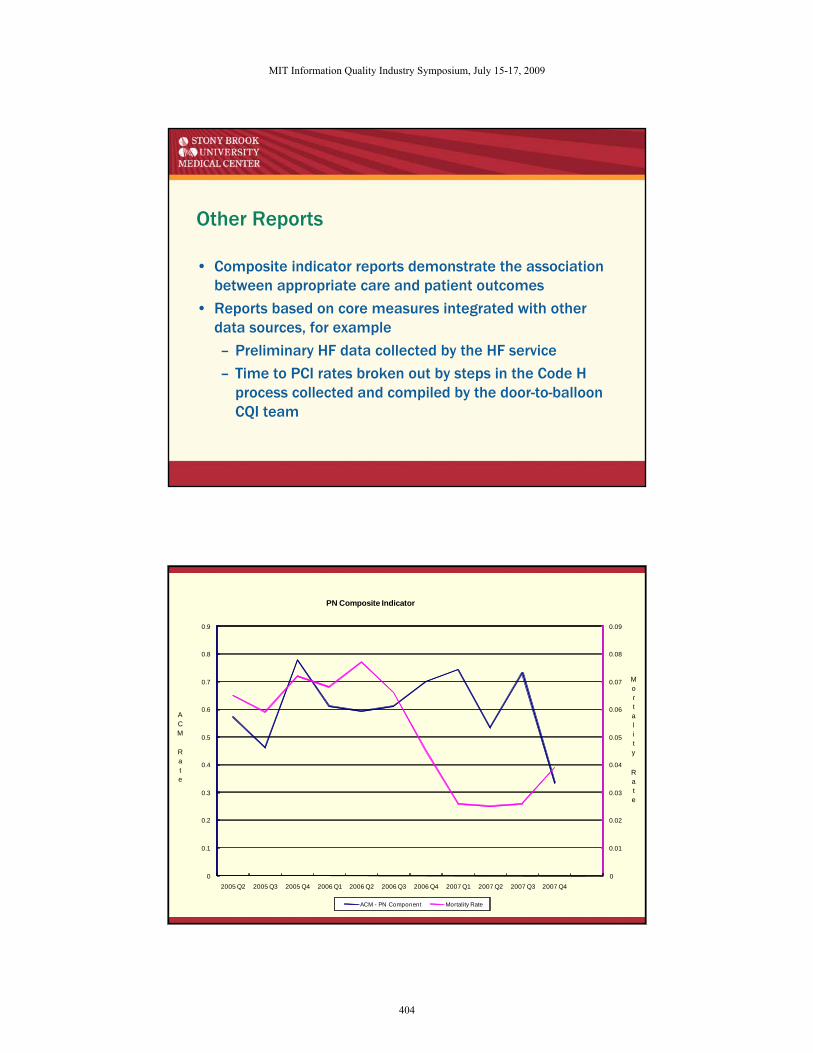
Other Reports
• Composite indicator reports demonstrate the association between appropriate care and patient outcomes
• Reports based on core measures integrated with other data sources, for example
– Preliminary HF data collected by the HF service
– Time to PCI rates broken out by steps in the Code H process collected and compiled by the door-to-balloon CQI team
0
0.01
0.02
0.03
0.04
0.05
0.06
0.07
0.08
0.09
0
0.1
0.2
0.3
0.4
0.5
0.6
0.7
0.8
0.9
2005 Q2 2005 Q3 2005 Q4 2006 Q1 2006 Q2 2006 Q3 2006 Q4 2007 Q1 2007 Q2 2007 Q3 2007 Q4
PN Composite Indicator
ACM - PN Component Mortality Rate
Mortality
Rate
ACM
Rate
MIT Information Quality Industry Symposium, July 15-17, 2009
404
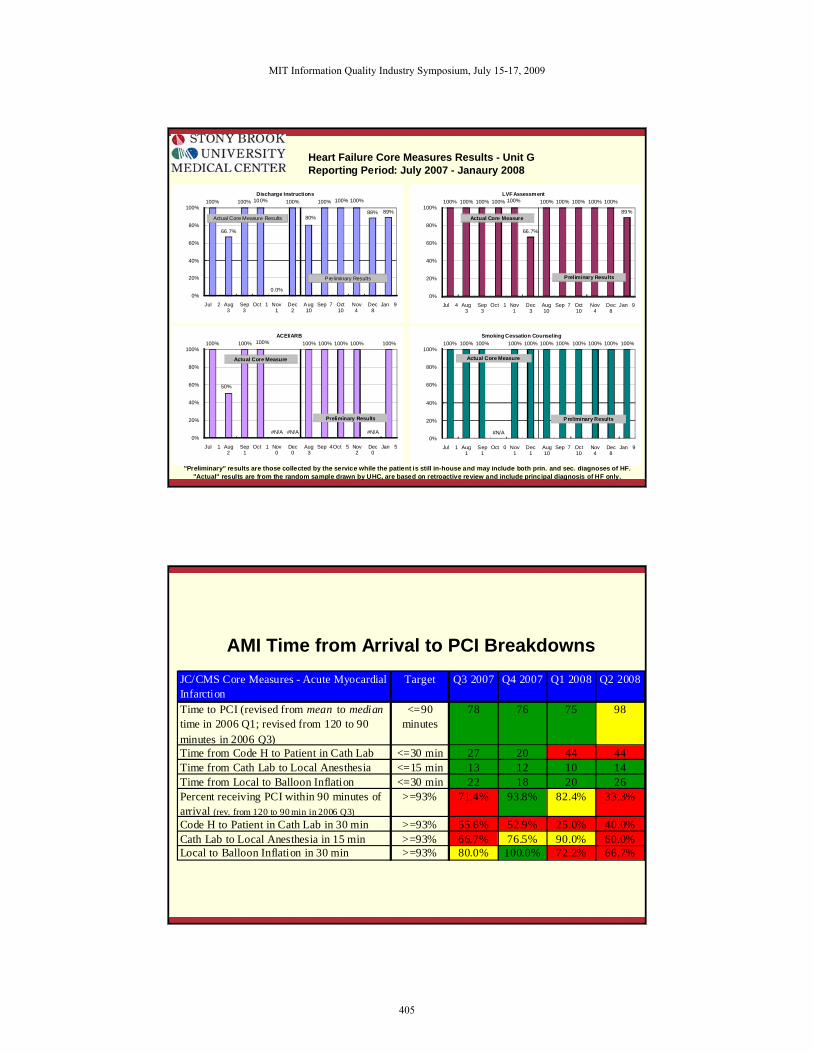
Heart Failure Core Measures Results - Unit GReporting Period: July 2007 - Janaury 2008
"Preliminary" results are those collected by the service while the patient is still in-house and may include both prin. and sec. diagnoses of HF."Actual" results are from the random sample drawn by UHC, are based on retroactive review and include principal diagnosis of HF only.
100%
66.7%
100% 100%
0.0%
100%
80%
100% 100% 100%
88% 89%
0%
20%
40%
60%
80%
100%
Jul 2 Aug 3
Sep 3
Oct 1 Nov 1
Dec 2
Aug 10
Sep 7 Oct 10
Nov 4
Dec 8
Jan 9
Discharge Instructions
Actual Core Measure Results
Preliminary Results
100% 100% 100% 100% 100%
66.7%
100% 100% 100% 100% 100%
89%
0%
20%
40%
60%
80%
100%
Jul 4 Aug 3
Sep 3
Oct 1 Nov 1
Dec 3
Aug 10
Sep 7 Oct 10
Nov 4
Dec 8
Jan 9
LVF Assessment
Actual Core Measure
Preliminary Results
100%
50%
100% 100%
#N/A #N/A
100% 100% 100% 100%
#N/A
100%
0%
20%
40%
60%
80%
100%
Jul 1 Aug 2
Sep 1
Oct 1 Nov 0
Dec 0
Aug 3
Sep 4Oct 5 Nov 2
Dec 0
Jan 5
ACEI/ARB
Actual Core Measure
Preliminary Results
100% 100% 100%
#N/A
100% 100% 100% 100% 100% 100% 100% 100%
0%
20%
40%
60%
80%
100%
Jul 1 Aug 1
Sep 1
Oct 0 Nov 1
Dec 1
Aug 10
Sep 7 Oct 10
Nov 4
Dec 8
Jan 9
Smoking Cessation Counseling
Actual Core Measure
Preliminary Results
AMI Time from Arrival to PCI BreakdownsJC/CMS Core Measures - Acute Myocardial Infarction
Target Q3 2007 Q4 2007 Q1 2008 Q2 2008
Time to PCI (revised from mean to median time in 2006 Q1; revised from 120 to 90 minutes in 2006 Q3)
<=90 minutes
78 76 75 98
Time from Code H to Patient in Cath Lab <=30 min 27 20 44 44Time from Cath Lab to Local Anesthesia <=15 min 13 12 10 14Time from Local to Balloon Inflation <=30 min 22 18 20 26Percent receiving PCI within 90 minutes of arrival (rev. from 120 to 90 min in 2006 Q3)
>=93% 71.4% 93.8% 82.4% 33.3%
Code H to Patient in Cath Lab in 30 min >=93% 55.6% 52.9% 25.0% 40.0%Cath Lab to Local Anesthesia in 15 min >=93% 66.7% 76.5% 90.0% 60.0%Local to Balloon Inflation in 30 min >=93% 80.0% 100.0% 72.2% 66.7%
MIT Information Quality Industry Symposium, July 15-17, 2009
405
Are All These Reports Any Help?
• Improvements in The Joint Commission/Centers for Medicare and Medicaid Services (TJC/CMS) core measure rates
• Each of the following core measure indicators has shown statistically significant improvement from the 2004 baseline through 2007 (the most recent full year for which data are available):
– Acute Myocardial Infarction (AMI)• Smoking cessation counseling
• Prescription of an angiotensin converting enzyme inhibitor (ACEi)/angiotensin receptor blocker (ARB) at discharge
.
Are All These Reports Any Help?
– Heart Failure (HF)• Smoking cessation counseling
• Discharge instructions
• Assessment of left ventricular systolic function (LVF)
– Pneumonia (PN)• Smoking cessation counseling
– Surgical Care Improvement Program (SCIP)• Appropriate antibiotic selection
• Timely discontinuation of prophylactic antibiotics
MIT Information Quality Industry Symposium, July 15-17, 2009
406
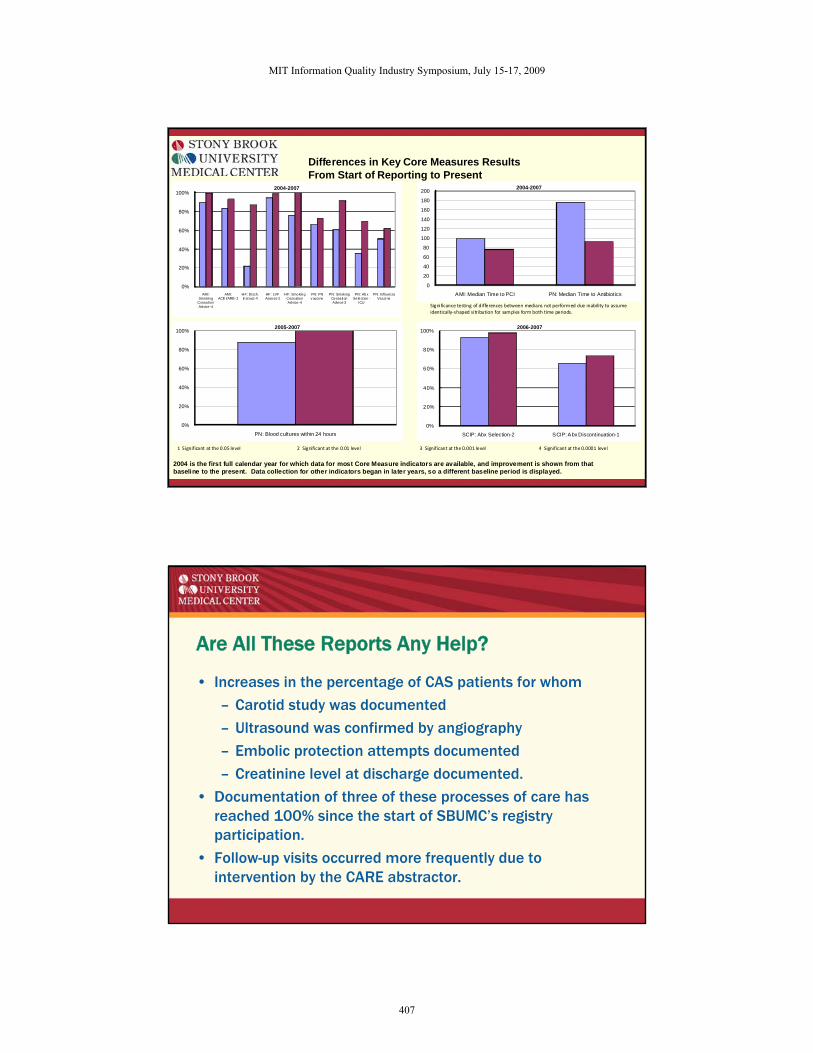
Differences in Key Core Measures ResultsFrom Start of Reporting to Present
2004 is the first full calendar year for which data for most Core Measure indicators are available, and improvement is shown from thatbaseline to the present. Data collection for other indicators began in later years, so a different baseline period is displayed.
0%
20%
40%
60%
80%
100%
AMI: Smoking
Cessation Advice-4
AMI: ACE i/ARB -2
HF: Disch. Instruct-4
HF: LVF Assess-2
HF: Smoking Cess ation Advice-4
PN: PN v accine
PN: Smok ing Cessation Advice-3
PN: Abx Selection -
ICU
PN: In fluenza Vaccine
2004-2007
0
20
40
60
80
100
120
140
160
180
200
AMI: Median Time to PCI PN: Median Time to Antibiotics
2004-2007
0%
20%
40%
60%
80%
100%
PN: Blood cultures within 24 hours
2005-2007
0%
20%
40%
60%
80%
100%
SCIP: Abx Selection-2 SCIP: Abx Discontinuation-1
2006-2007
Signi ficance testing of differences between medians not performed due inability to assume identically‐shaped si tr ibution for samples form both time periods.
1 Significant at the 0.05 level 2 Significant at the 0.01 level 3 Significant at the 0.001 level 4 Significant at the 0.0001 level
Are All These Reports Any Help?
• Increases in the percentage of CAS patients for whom
– Carotid study was documented
– Ultrasound was confirmed by angiography
– Embolic protection attempts documented
– Creatinine level at discharge documented.
• Documentation of three of these processes of care has reached 100% since the start of SBUMC’s registry participation.
• Follow-up visits occurred more frequently due to intervention by the CARE abstractor.
MIT Information Quality Industry Symposium, July 15-17, 2009
407
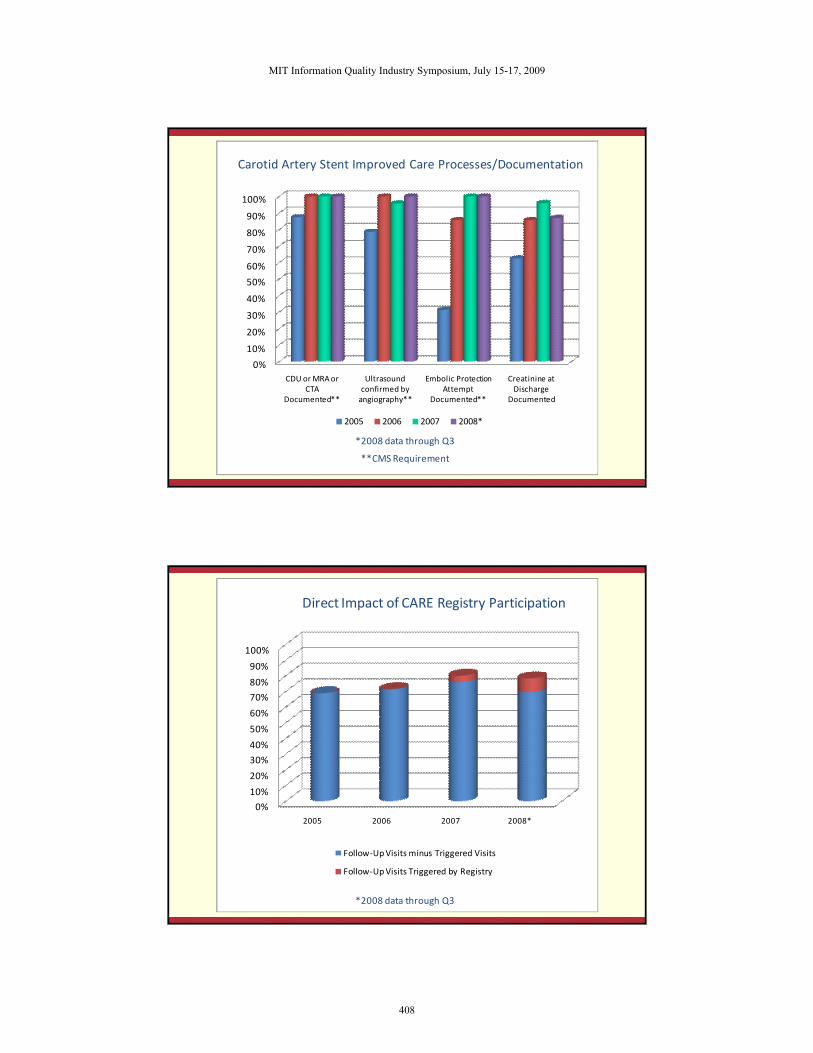
0%
10%
20%
30%
40%
50%
60%
70%
80%
90%
100%
CDU or MRA or CTA
Documented**
Ultrasound confirmed by angiography**
Embolic Protection Attempt
Documented**
Creatinine at Discharge
Documented
2005 2006 2007 2008*
**CMS Requirement
*2008 data through Q3
Carotid Artery Stent Improved Care Processes/Documentation
0%
10%
20%
30%
40%
50%
60%
70%
80%
90%
100%
2005 2006 2007 2008*
Follow‐Up Visits minus Triggered Visits
Follow‐Up Visits Triggered by Registry
*2008 data through Q3
Direct Impact of CARE Registry Participation
MIT Information Quality Industry Symposium, July 15-17, 2009
408

Elisa L. Horbatuk, MA
Data Manager, Decision Support Services
Stony Brook University Medical Center
1-631-444-3611
MIT Information Quality Industry Symposium, July 15-17, 2009
409