Embed Size (px)
Citation preview
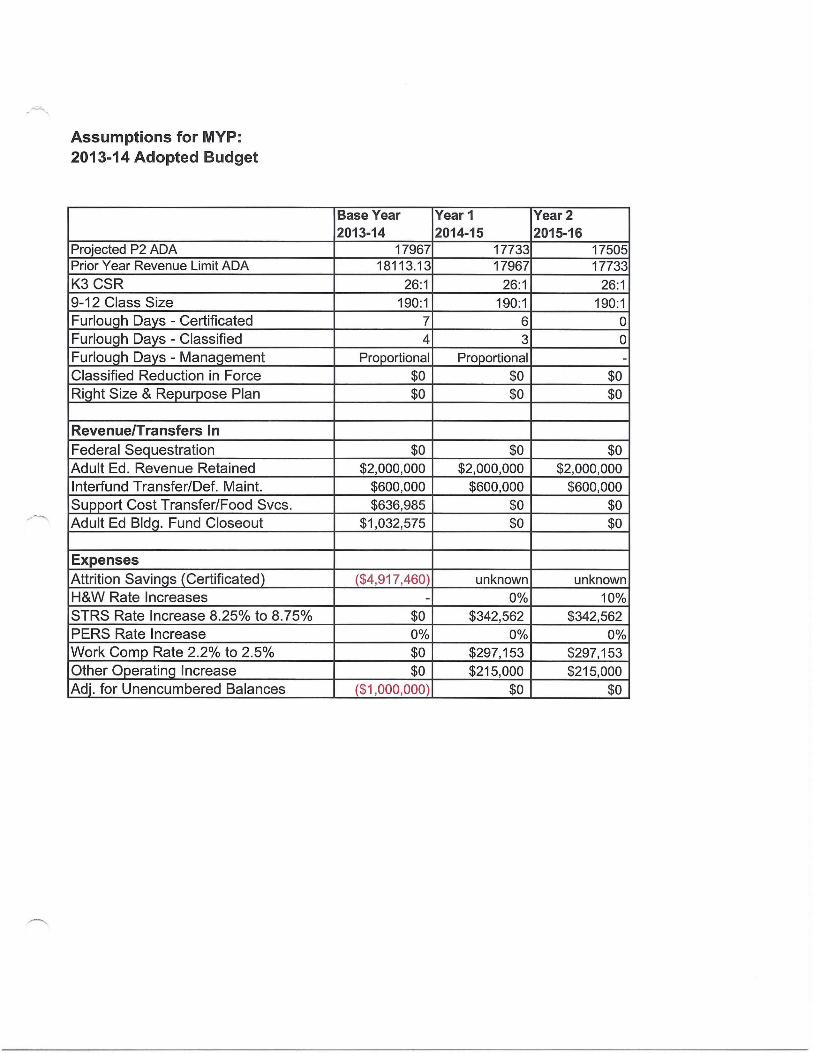
Assumptions for MYP: 2013-14 Adopted Budget
Projected P2 ADA Prior Year Revenue Limit ADA K3CSR 9-12 Class Size Furlough Days - Certificated Furlough Days - Classified Furlough Days - Management Classified Reduction in Force Right Size & Repurpose Plan
Revenue/Transfers In Federal Sequestration Adult Ed. Revenue Retained lnterfund Transfer/Def. Maint. Support Cost Transfer/Food Svcs. Adult Ed Bldg. Fund Closeout
Expenses Attrition Savings (Certificated) H&W Rate Increases STRS Rate Increase 8.25% to 8.75% PERS Rate Increase Work Camp Rate 2.2% to 2.5% Other Operating Increase Adj. for Unencumbered Balances
Base Year 2013-14
17967 18113.13
26:1 190:1
7 4
Proportional $0 $0
$0 $2,000,000
$600,000 $636,985
$1,032,575
($4,917,460) -
$0 0% $0 $0
($1 ,000,000)
Year1 Year2 2014-15 2015-16
17733 17505 17967 17733
26:1 26:1 190:1 190:1
6 0 3 0
Proportional -$0 $0 $0 $0
$0 $0 $2,000,000 $2,000,000
$600,000 $600,000 $0 $0 $0 $0
unknown unknown 0% 10%
$342,562 $342,562 0% 0%
$297,153 $297,153 $215,000 $215,000
$0 $0
Name
Revenues
Revenue Limit Sources
Federal Revenues
Other State Revenues
Other Local Revenues
Total Revenues
Expenditures
Certificated Salaries
Classified Salaries
Employee Benefits
Books and Supplies
Services and Other Operating
Capital Outlay
Other Outgo
Direct Support/Indirect Cost
Debt Service
Total Expenditures
Excess (Deficiency) of Revenues Over Expenditures
Other Financing Sources\Uses
lnterfund Transfers In
lnterfund Transfers Out
All Other Financing Sources
All Other Financing Uses
Contributions
Total Other Financing Sources\Uses
Net Increase (Decrease) in Fund Balance
Fund Balance
Beginning Fund Balance
Audit Adjustments
Other Restatements
Adjusted Beginning Fund Balance
Ending Fund Balance
Components of Ending Fund Balance
Reserved Balances
Revolving Cash
Stores
Prepaid Expenditures
Other Prepay
General Reserve
Legally Restricted Balance
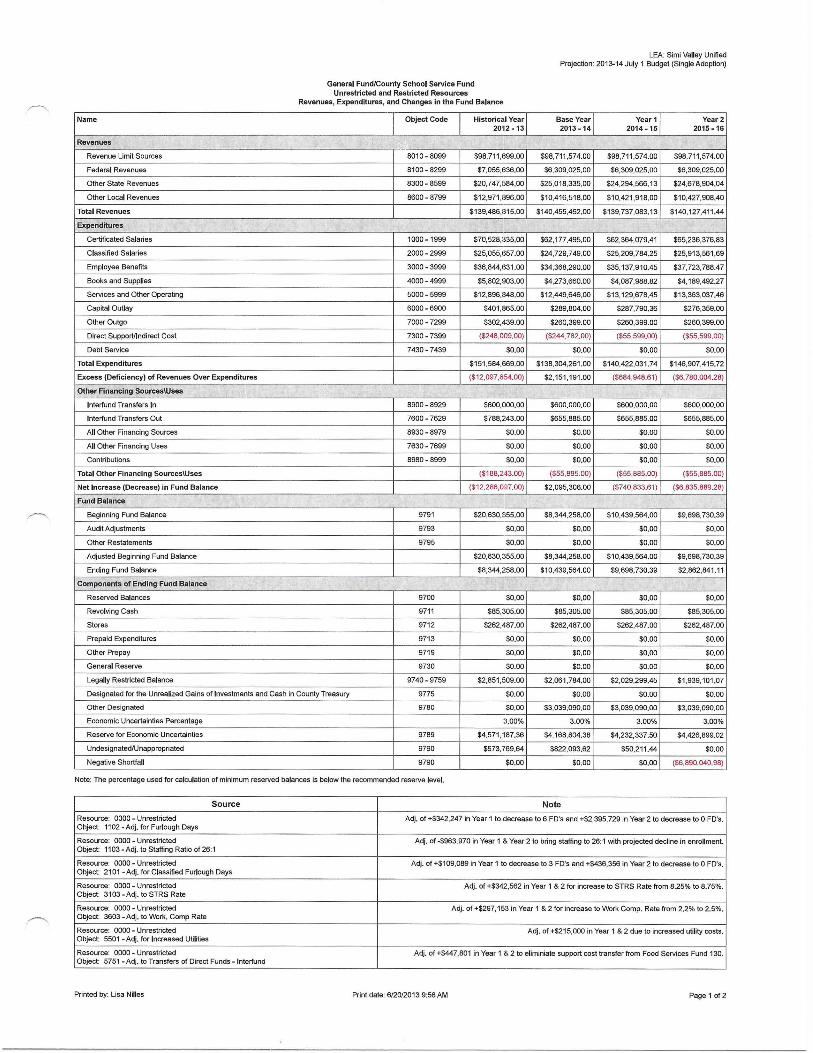
General Fund/County School Service Fund Unrestricted and Restricted Resources
Revenues, Expenditures, and Changes in the Fund Balance
Object Code Historical Year 2012-13
8010-8099 $98,711,699.00
8100- 8299 $7,055,636,00
8300-8599 $20,747,584.00
8600-8799 $12,971,896,00
$139,486,815.00
1000-1999 $70,528,335,00
2000-2999 $25,055,657,00
3000-3999 $36,844,631.00
4000 -4999 $5,802,903.00
5000 - 5999 $12,896,848.00
6000-6900 $401 ,865.00
7000 - 7299 $302,439.00
7300-7399 ($248,009.00)
7430-7439 $0.00
$151,584,669.00
($12,097,854.00)
8900-8929 $600,000.00
7600-7629 $788,243.00
8930-8979 $0.00
7630-7699 $0.00
8980-8999 $0.00
($188,243.00)
($12,286,097,00)
9791 $20,630,355.00
9793 $0.00
9795 $0.00
$20,630,355.00
$8,344,258.00
9700 $0,00
9711 $85,305.00
9712 $262,487.00
9713 $0.00
9719 $0,00
9730 $0.00
9740-9759 $2,851 ,509.00
LEA: Simi Valley Unified Projection: 201~14 July 1 Budget (Single Adoption)
Base Year Year1 Year2 2013-14 2014-15 2015-16
$98,711,574.00 $98,711,574.00 $98,711 ,574.00
$6,309,025,00 $6,309,025.00 $6,309,025,00
$25,018,335.00 $24,294,566.13 $24,678,904.04
$10,416,518.00 $10,421,918.00 $10,427,908.40
$140,455,452,00 $139,737,083.13 $140,127,411.44
$62,177,495,00 $62,364,079.41 $65,236,376,83
$24,729,749.00 $25,209,784.25 $25,913,561.69
$34,368,290,00 $35,137,910.45 $37,723,788.47
$4,273,660.00 $4,087,988.82 $4,189,492.27
$12,449,646.00 $13,129,678.45 $13,363,037.46
$289,804.00 $287,790.36 $276,359.00
$260,399,00 $260,399.00 $260,399,00
($244,782.00) ($55,599.00) ($55,599.00)
$0.00 $0.00 $0.00
$138,304,261.00 $140,422,031.74 $146,907,415.72
$2,151 ,191.00 ($684,948,61) ($6, 780,004.28)
$600,000.00 $600,000,00 $600,000.00
$655,885.00 $655,885.00 $655,885,00
$0.00 $0.00 $0.00
$0,00 $0.00 $0.00
$0,00 $0.00 $0.00
($55,885.00) ($55,885.00) ($55,885.00)
$2,095,306,00 ($740,833.61) ($6,835,889.28)
$8,344,258,00 $10,439,564.00 $9,698,730,39
$0,00 $0.00 $0.00
$0,00 $0.00 $0.00
$8,344,258.00 $10,439,564.00 $9,698,730.39
$10,439,564.00 $9,698,730.39 $2,862,841.11
$0.00 $0.00 $0.00
$85,305.00 $85,305,00 $85,305.00
$262,487.00 $262,487.00 $262,487.00
$0.00 $0.00 $0.00
$0.00 $0.00 $0.00
$0.00 $0.00 $0.00
$2,061,784.00 $2,029,299,45 $1 ,939,101 .07
Designated for the Unrealized Gains of Investments and Cash in County Treasury 9775 $0.00 $0.00 $0.00 $0.00
Other Designated 9780 $0,00 $3,039,090.00 $3,039,090.00 $3,039,090.00
Economic Uncertainties Percentage 3.00% 3.00% 3.00% 3.00%
Reserve for Economic Uncertainties 9789 $4,571,187.36 $4,168,804.38 $4,232,337,50 $4,426,899.02
Undesignated/Unappropriated 9790 $573,769.64 $822,093.62 $50,211.44 $0,00
Negative Shortfa ll 9790 $0.00 $0.00 $0.00 ($6,890,040.98)
Note: The percentage used for calculation of minimum reserved balances is below the recommended reserve level.
Source Note
Resource: 0000 ~ Unrestricted Adj. of +$342,247 in Year 1 to clecrease to 6 FD's and +$2,395,729 in Year 2 to decrease to 0 FD's. Object: 1102 -Adj. for Furlough Days
Resource: 0000 - Unrestricted Adj . of -$963,970 in Year 1 & Year 2 to bring staffing to 26:1 with projected decline in enrollment. Object: 1103 - Adj. to Staffing Ratio of 26:1
Resource: 0000 ~Unrestricted Adj. of +$109,089 in Year 1 to decrease to 3 FD's and +$436,356 in Year 2 to decrease to 0 FD's. Object: 2101-Adj. fo r Classified Furlough Days
Resource: 0000 ~ Unrestricted Adj. of +$342,562 in Year 1 & 2 for increase to STRS Rate from 8.25% to 8.75%. Object: 3103 -Adj. to STRS Rate
Resource: 0000- Unrestricted Adj. of +$297, 153 in Year 1 & 2 for increase to Work Camp. Rate from 2.2% to 2.5%. Object: 3603 - Adj. to Work. Comp Rate
Resource: 0000 - Unrestricted Adj. of +$215,000 in Year 1 & 2 due to increased utility costs. Object: 5501 - Adj. for Increased Utilities
Resource: 0000- Unrestricted Adj. of +$447,801 in Year 1 & 2 to eliminiate support cost transfer from Food Services Fund 130. Object: 5751 ~Adj . to Transfers of Direct Funds~ lnterfund
Printed by: Lisa Nilles Print date: 6/20/2013 9:56 AM Page 1 of2
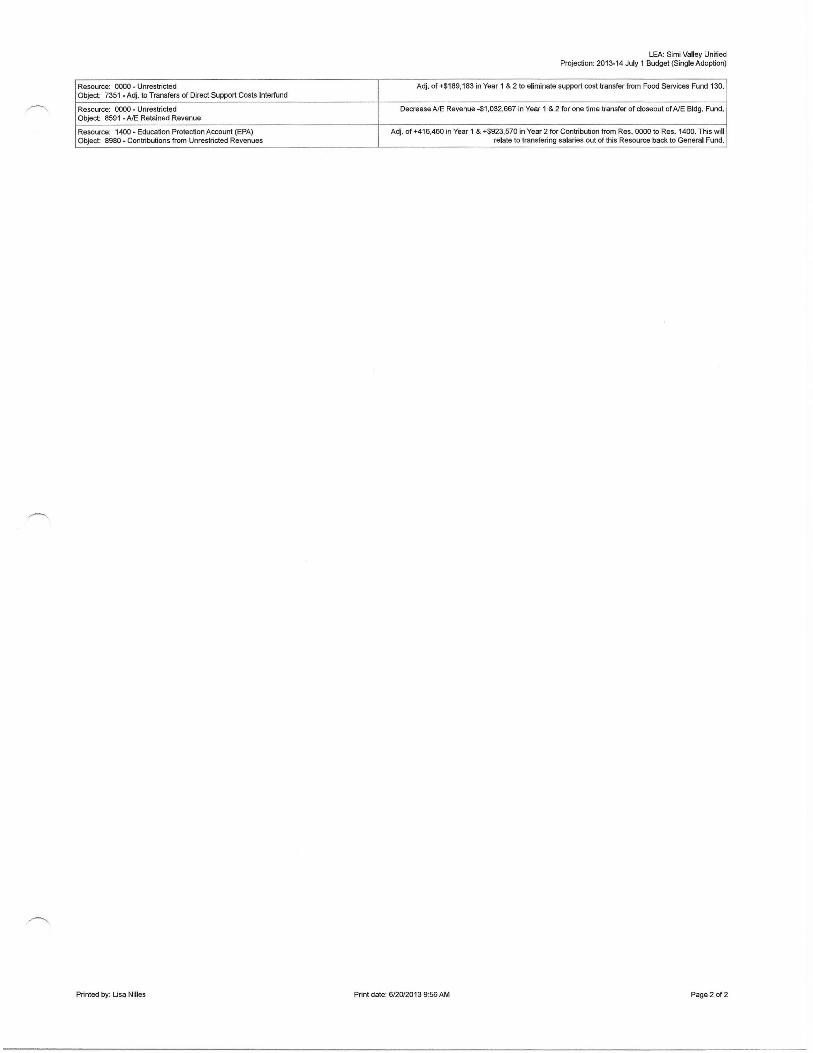
Resource: 0000 ~ Unrestricted Object: 7351 -Adj. to Transfers of Direct Support Costs lnterfund
Resource: 0000- Unrestricted Object: 8591 - AJE Retained Revenue
Resource: 1400 - Education Protection Account (EPA) Object: 8980- Contributions from Unrestricted Revenues
Printed by: Usa Nilles
LEA: Simi Valley Unified Projection: 2013-14 July 1 Budget (Single Adoption)
Adj . of +$189,183 in Year 1 & 2 to eliminate support cost transfer from Food Services Fund 130.
Decrease AlE Revenue -$1,032,667 in Year 1 & 2 for one time transfer of closeout of AlE Bldg. Fund.
Adj. of +416.460 in Year 1 & +$923,570 in Year 2 for Contribution from Res. 0000 to Res. 1400. This will relate to transfering salaries out of this Resource back to General Fund.
Print date: 6/20/2013 9:56AM Page 2 of2
Name
Revenues
Revenue Limit Sources
Federal Revenues
Other State Revenues
Other Local Revenues
Total Revenues
Expenditures I
Certificated Salaries
Classified Salaries
Employee Benefits
Books and Supplies
Services and Other Operating
Capital Outlay
Other Outgo
Direct Support/Indirect Cost
Debt Service
Total Expenditures
Excess (Deficiency) of Revenues Over Expenditures
Other Financing Sources\Uses
lnterfund Transfers In
lnterfund Transfers Out
All Other Financing Sources
All Other Financing Uses
Contributions
Total Other Financing Sources\Uses
Net Increase (Decrease) in Fund Balance
Fund Balance
Beginning Fund Balance
Audit Adjustments
Other Restatements
Adjusted Beginning Fund Balance
Ending Fund Balance
Components of Ending Fund Balance
Reserved Balances
Revolving Cash
Stores
Prepaid Expenditures
Other Prepay
General Reserve
Legally Restricted Balance
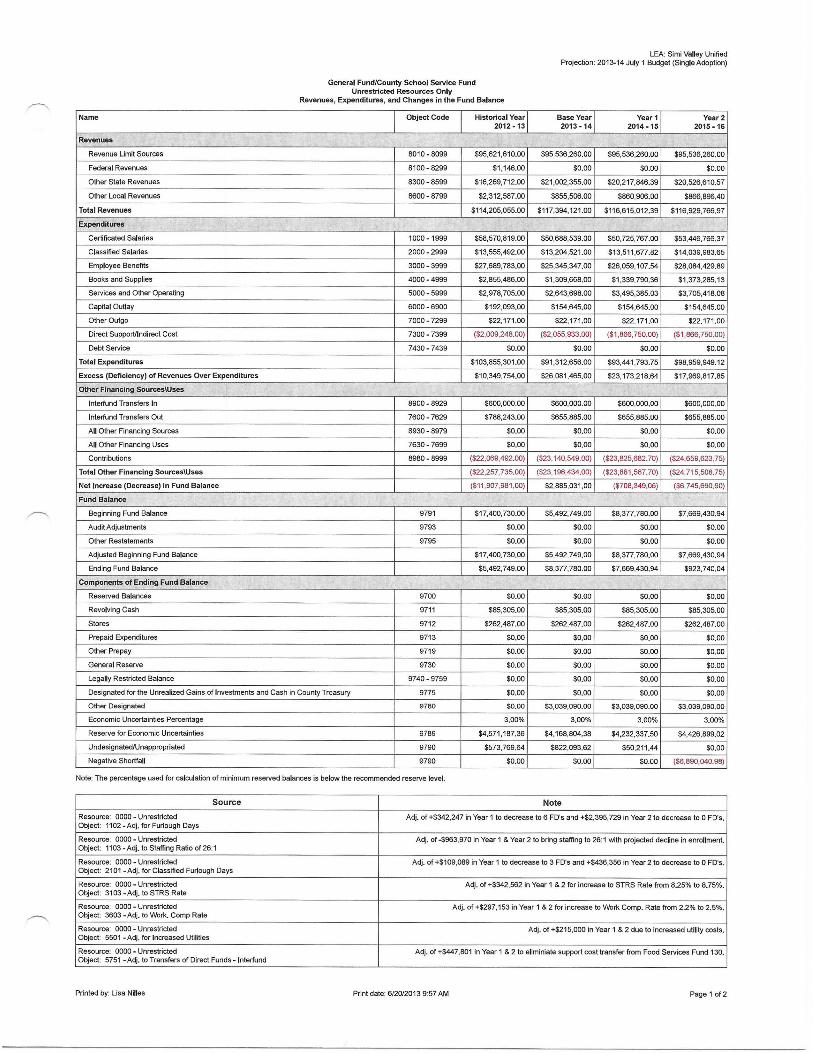
General Fund/County School Service Fund Unrestricted Resources Only
Revenues, Expenditures, and Changes in the Fund Balance
Object Code Historical Year 2012-13
8010-8099 $95,621,610.00
8100-8299 $1,146.00
8300-8599 $16,269,712.00
8600-8799 $2,312,587.00
$114,205,055.00
1000-1999 $58,570,819.00
2000-2999 $13,555,492.00
3000-3999 $27,689,783.00
4000-4999 $2,855,486.00
5000-5999 $2,978,705.00
6000- 6900 $192,093.00
7000-7299 $22,171.00
7300-7399 ($2,009,248.00)
7430-7439 $0.00
$103,855,301 .00
$10,349,754.00
8900-8929 $600,000.00
7600-7629 $788,243.00
8930-8979 $0.00
7630 -7699 $0.00
8980-8999 ($22,069,492.00)
($22,257, 735.00)
($11 ,907,981 .00)
9791 $17,400,730.00
9793 $0.00
9795 $0.00
$17,400,730.00
$5,492,749.00
9700 $0.00
9711 $85,305.00
9712 $262,487.00
9713 $0.00
9719 $0.00
9730 $0.00
9740-9759 $0.00
LEA: Simi Valley Unified Projection: 2013-14 July 1 Budget (Single Adoption)
Base Year Year1 Year2 2013-14 2014-15 2015-16
$95,536,260.00 $95,536,260.00 $95,536,260.00
$0.00 $0.00 $0.00
$21 ,002,355.00 $20,217,846.39 $20,526,610.57
$855,506.00 $860,906.00 $886,896.40
$117,384,121.00 $116,615,012.39 $116,929,786.97
$50,688,539.00 $50,725,767.00 $53,446,766.37
$13,204,521 .00 $13,511,677.82 $14,039,983.65
$25,345,347.00 $26,059,107.54 $28,084,429.89
$1,309,868.00 $1,339,790.36 $1,373,285.13
$2,643,698.00 $3,495,385.03 $3,705,418.08
$154,645.00 $154,645.00 $154,845.00
$22,171.00 $22,171.00 $22,171.00
($2,055,933.00) ($1 ,886, 750.00) ($1,866,750.00)
$0.00 $0.00 $0.00
$91 ,312,656.00 $93,441 '793. 75 $98,959,849.12
$26,081 ,465.00 $23,173,218.64 $17,969,817.85
$600,000.00 $600,000.00 $600,000.00
$655,885.00 $655,885.00 $655,885.00
$0.00 $0.00 $0.00
$0.00 $0.00 $0.00
($23,140,549.00) ($23,825,682.70) ($24.659,623.75)
($23, 196,434.00) ($23,881 ,567.70) ($24,715,508.75)
$2,885,031.00 ($708,349.06) ($6,745,690.90)
$5,492,749.00 $8,377,780.00 $7,869,430.94
$0.00 $0.00 $0.00
$0.00 $0.00 $0.00
$5,492,749.00 $8,377,780.00 $7,669,430.94
$8,377,780.00 $7,669,430.94 $923,740.04
$0.00 $0.00 $0.00
$85,305.00 $85,305.00 $85,305.00
$262,487.00 $262,487.00 $262,487.00
$0.00 $0.00 $0.00
$0.00 $0.00 $0.00
$0.00 $0.00 $0.00
$0.00 $0.00 $0.00
Designated for the Unrealized Gains of Investments and Cash in County Treasury 9775 $0.00 $0.00 $0.00 $0.00
Other Designated 9780 $0.00 $3,039,090.00 $3,039,090.00 $3,039,090.00
Economic Uncertainties Percentage 3.00% 3.00% 3,00% 3.00%
Reserve for Economic Uncertainties 9789 $4,571,187.36 $4,168,804.38 $4,232,337.50 $4,426,899.02
Undesignated/Unappropriated 9790 $573,769.64 $822,093.62 $50,211.44 $0.00
Negative Shortfall 9790 $0.00 $0.00 $0.00 ($6,890,040.98)
Note: The percentage used for calculation of minimum reserved balances is below the recommended reserve level.
Source Note
Resource: 0000- Unrestricted Adj. of +$342,247 in Year 1 to decrease to 6 FD's and +$2,395,729 in Year 2 to decrease to 0 FD's. Object: 1102 -Adj. for Furlough Days
Resource: 0000 - Unrestricted Adj. of -$963,970 in Year 1 & Year 2 to bring staffing to 26:1 with projected decline in enrollment. Object: 1103- Adj. to Staffing Ratio of 26:1
Resource: 0000- Unrestricted Adj. of +$109,089 in Year 1 to decrease to 3 FD's and +$436,356 in Year 2 to decrease to 0 FD's. Object: 2101 -Adj. for Classified Furlough Days
Resource: 0000 - Unrestricted Adj. of +$342,562 in Year 1 & 2 for increase to STRS Rate from 8.25% to 8.75%. Object: 3103 -Adj. to STRS Rate
Resource: 0000- Unrestricted Adj. of +$297, 153 in Year 1 & 2 for increase to Work Comp. Rate from 2.2% to 2.5%. Object: 3603- Adj. to Work. Camp Rate
Resource: 0000 - Unrestricted Adj. of +$215,000 in Year 1 & 2 due to increased utility costs. Object: 5501 -Adj. for Increased Utilities
Resource: 0000- Unrestricted Adj. of +$447,801 in Year 1 & 2 to eliminiate support cost transfer from Food Services Fund 130. Object: 5751 -Adj. to Transfers of Direct Funds- lnterfund
Printed by: Lisa Nilles Print date: 6/20/2013 9:57AM Page 1 of 2
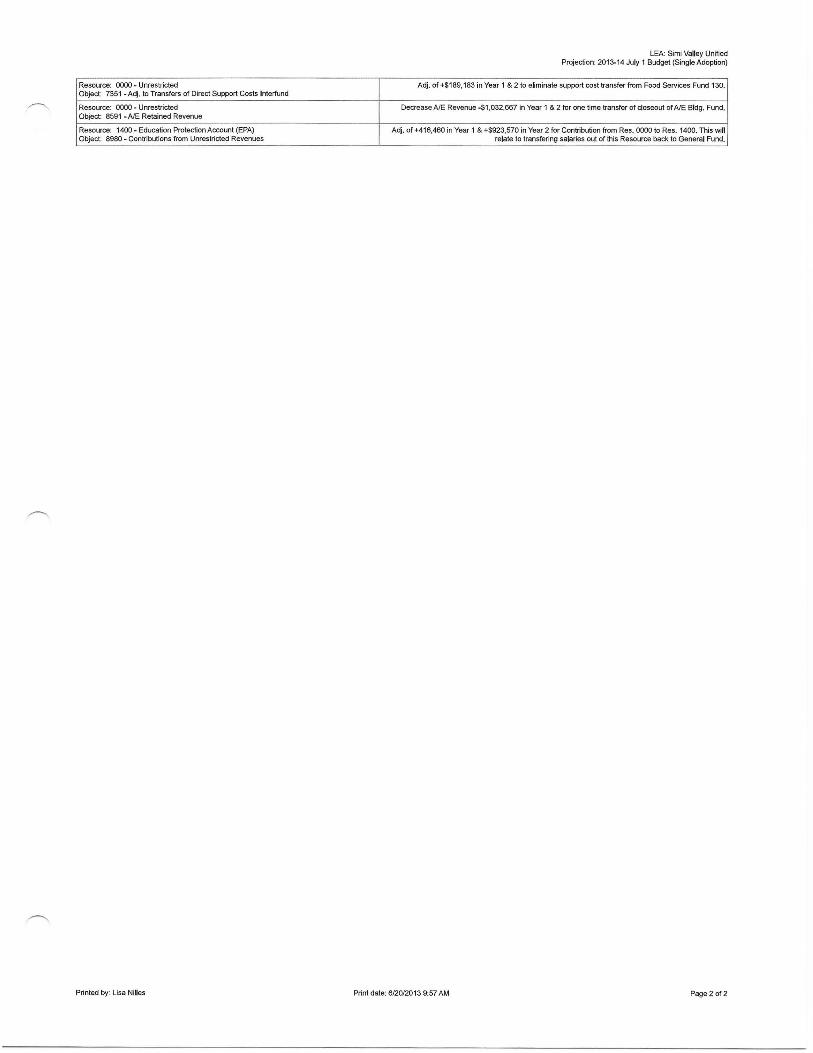
Resource: 0000- Unrestricted Object: 7351 -Adj. to Transfers of Direct Support Costs lnterfund
Resource: 0000- Unrestricted Object: 8591 -AlE Retained Revenue
Resource: 1400- Education Protection Account (EPA) Object: 8980- Contributions from Unrestricted Revenues
Printed by: Lisa Nilles
LEA: Simi Valley Unified Projection: 2013-14 July 1 Budget (Single Adoption)
Adj. of +$189, 183 in Year 1 & 2 to eliminate support cost transfer from Food Services Fund 130.
Decrease AlE Revenue -$1 ,032,667 in Year 1 & 2 for one time transfer of closeout of NE Bldg. Fund.
Adj. of +416,460 in Year 1 & +$923,570 in Year 2 for Contribution from Res. 0000 to Res. 1400. This will relate to transfering salaries out of this Resource back to General Fund.
Print date: 6/20/2013 9:57AM Page 2 of2
Name
Revenues
Revenue Limit Sources
Federal Revenues
Other State Revenues
Other Local Revenues
Total Revenues
Expenditures
Certificated Salaries
Classified Salaries
Employee Benefits
Books and Supplies
Services and Other Operating
Capital Outlay
Other Outgo
Direct Support/Indirect Cost
Debt Service
Total Expenditures
Excess (Deficiency) of Revenues Over Expenditures
other Financing Sources\Uses
lnterfund Transfers In
lnterfund Transfers Out
All Other Financing Sources
All Other Financing Uses
Contributions
Total Other Financing Sources\Uses
Net Increase (Decrease) in Fund Balance
Fund Balance
Beginning Fund Balance
Audit Adjustments
Other Restatements
Adjusted Beginning Fund Balance
Ending Fund Balance
Components of Ending Fund Balance
Reserved Balances
Revolving Cash
Stores
Prepaid Expenditures
Other Prepay
General Reserve
Legally Restricted Balance
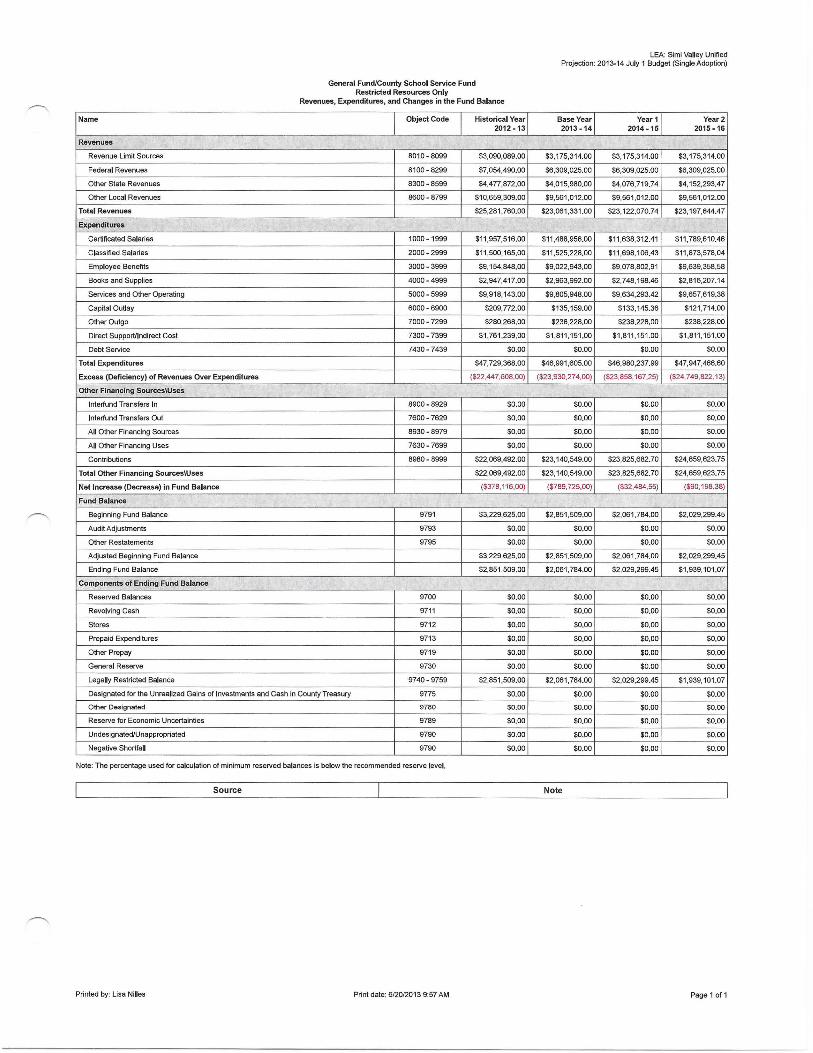
General Fund/County School Service Fund Restricted Resources Only
Revenues, Expenditures, and Changes in the Fund Balance
Object Code Historical Year 2012-13
8010-8099 $3,090,089.00
8100-8299 $7,054,490.00
8300-8599 $4,477,872.00
8600-8799 $10,659,309.00
$25,281,760.00
1000-1999 $11,957,516.00
2000-2999 $11,500,165.00
3000-3999 $9,154,848.00
4000-4999 $2,947,417.00
5000-5999 $9,918,143.00
6000-6900 $209,772.00
7000-7299 $280,268.00
7300-7399 $1,761,239.00
7430-7439 $0.00
$47,729,368.00
($22,447,608.00)
8900-8929 $0.00
7600-7629 $0.00
8930-8979 $0.00
7630-7699 $0.00
8980-8999 $22,069,492.00
$22,069,492.00
($378, 116.00)
9791 $3,229,625.00
9793 $0.00
9795 $0.00
$3,229,625.00
$2,851,509.00
9700 $0.00
9711 $0.00
9712 $0.00
9713 $0.00
9719 $0.00
9730 $0.00
9740-9759 $2,851 ,509.00
Designated for the Unrealized Gains of Investments and Cash in County Treasury 9775 $0.00
Other Designated 9780 $0.00
Reserve for Economic Uncertainties 9789 $0.00
Undesignated/Unappropriated 9790 $0.00
Negative Shortfall 9790 $0.00
Note: The percentage used for calculation of minimum reserved balances is below the recommended reserve level.
Source
Printed by: Lisa Nilles Print date: 6/20/2013 9:57AM
LEA: Simi Valley Unified Projection: 201~14 July 1 Budget (Single Adoption)
Base Year Year1 Year2 2013-14 2014-15 2015-16
$3,175,314.00 $3,175,314.00 $3,175,314.00
$6,309,025.00 $6,309,025.00 $6,309,025.00
$4,015,980.00 $4,076,719.74 $4,152,293.47
$9,561,012.00 $9,561 ,012.00 $9,561,012.00
$23,061,331.00 $23,122,070.74 $23,197,644.47
$11,488,956.00 $11,638,312.41 $11,789,610.46
$11,525,228.00 $11,698,106.43 $11,873,578.04
$9,022,943.00 $9,078,802.91 $9,639,358.58
$2,963,992.00 $2,748,198.46 $2,816,207.14
$9,805,848.00 $9,634,293.42 $9,657,619.38
$135,159.00 $133,145.36 $121,714.00
$238,228.00 $238,228.00 $238,228.00
$1,811,151 .00 $1,811,151.00 $1,811 ,151.00
$0.00 $0.00 $0.00
$46,991,605.00 $46,980,237.99 $47,947,466.60
($23,930,274.00) ($23,858, 167.25) ($24,749,822.13)
$0.00 $0.00 $0.00
$0.00 $0.00 $0.00
$0.00 $0.00 $0.00
$0.00 $0.00 $0.00
$23,140,549.00 $23,825,682.70 $24,659,623.75
$23,140,549.00 $23,825,682.70 $24,659,623.75
($789,725.00) ($32,484.55) ($90, 198.38)
$2,851,509.00 $2,061,784.00 $2,029,299.45
$0.00 $0.00 $0.00
$0.00 $0.00 $0.00
$2,851,509.00 $2,061 '784.00 $2,029,299.45
$2,061 '784.00 $2,029,299.45 $1,939,101.07
$0.00 $0.00 $0.00
$0.00 $0.00 $0.00
$0.00 $0.00 $0.00
$0.00 $0.00 $0.00
$0.00 $0.00 $0.00
$0.00 $0.00 $0.00
$2,061 ,784.00 $2,029,299.45 $1,939,101 .07
$0.00 $0.00 $0.00
$0.00 $0.00 $0.00
$0.00 $0.00 $0.00
$0.00 $0.00 $0.00
$0.00 $0.00 $0.00
Note
Page 1 of 1
~
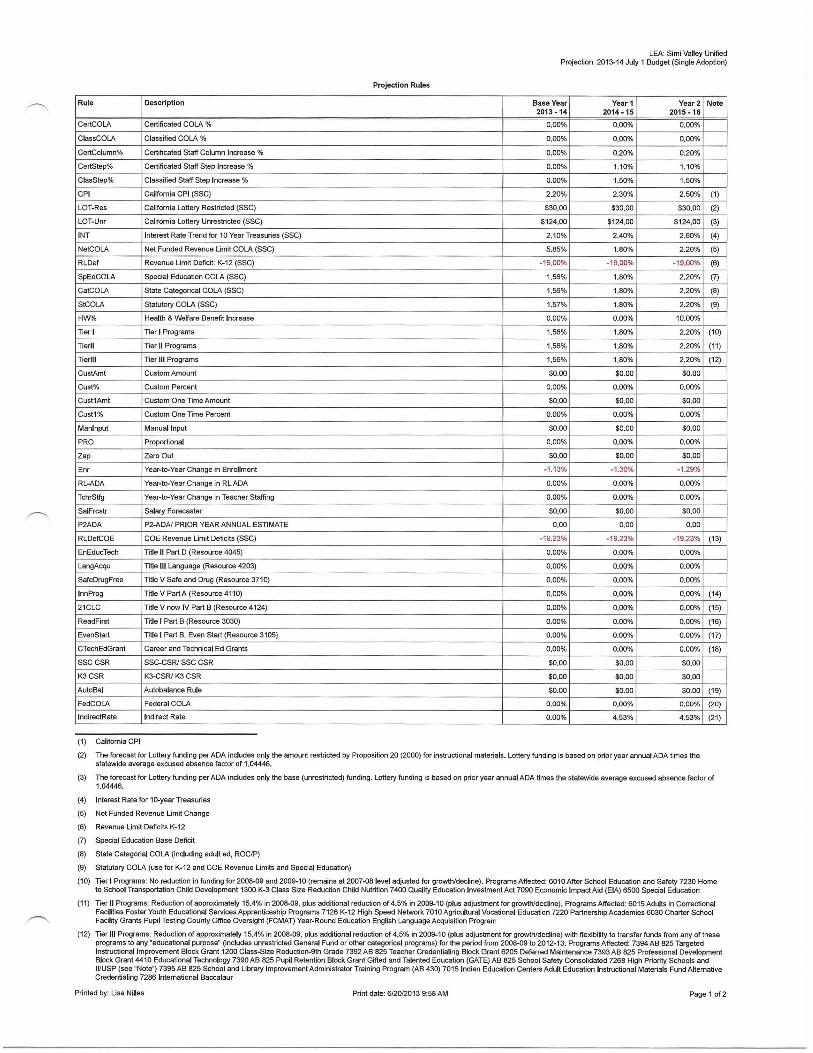
Rule Description
CertCOLA Certificated COLA %
ClassCOLA Classified COLA %
CertColumn% Certificated Staff Column Increase %
CertStep% Certificated Staff Step Increase %
ClasStep% Classified Staff Step Increase %
CPI Calfomia CPI (SSC)
LOT-Res California Lottery Restricted (SSC)
LOT-Unr California Lottery Unrestricted (SSC}
INT Interest Rate Trend for 10 Year Treasuries (SSC)
NetCOLA Net Funded Revenue Umit COLA (SSC)
RLDef Revenue Limit Deficit: K-12 (SSC)
SpEdCOLA Special Education COLA (SSC)
CatCOLA State Categorical COLA (SSC)
StCOLA Statutory COLA (SSC)
HW'/o Health & Welfare Benefit Increase
Tier I Tier I Programs
Tierll Tier II Programs
Tierlll Tier Ill Programs
CustAmt Custom Amount
Gust% Custom Percent
Cust1Amt Custom One Time Amount
Cust1% Custom One Time Percent
Manlnput Manual Input
PRO Proportional
Zap Zero Out
Enr Year-to-Year Change in Enrollment
RL-ADA Year-to-Year Change in RLADA
TchrStfg Year-to-Year Change in Teacher Staffing
SaiFrcstr Salary Forecaster
P2ADA P2-ADN PRIOR YEAR ANNUAL ESTIMATE
RLDefCOE COE Revenue Limit Deficits (SSC)
EnEducTech Title II Part D (Resource 4045)
LangAcqu Title Ill Language (Resource 4203)
SafeDrugFree Title V Safe and Drug (Resource 3710)
lnnProg Title V Part A (Resource 4110)
21CLC Title V now IV Part B (Resource 4124)
ReadFirst Title I Part B (Resource 3030)
EvenStart Title I Part B, Even Start (Resource 3105)
CTechEdGrant Career and Technical Ed Grants
sse csR SSC-CSR/ SSC CSR
K3CSR K:>-CSRI K3 CSR
AutoBal Autobalance Rule
FedCOLA Federal COLA
lndirectRate Indirect Rate
(1) California CPI
Projection Rules
LEA: Simi Valley Unified Projection: 201:>-14 July 1 Budget (Single Adoption)
Base Year Year1 Year2 Note 2013-14 2014-15 2015-16
0.00% 0.00% 0.00%
0.00% 0.00% 0.00%
0.00% 0.20% 0.20%
0.00% 1.10% 1.10%
0.00% 1.50% 1.50%
2.20% 2.30% 2.50% (1)
$30.00 $30.00 $30.00 (2)
$124.00 $124.00 $124.00 (3)
2.10% 2.40% 2.60% (4)
5.85% 1.80% 2.20% (5)
-19.00% -19.00% ~19.00% (6)
1.56% 1.80% 2.20% (7)
1.56% 1.80% 2.20% (8)
1.57% 1.80% 2.20% (9)
0.00% 0.00% 10.00%
1.56% 1.80% 2.20% (10)
1.56% 1.80% 2.20% (11)
1.56% 1.80% 2.20% (12)
$0.00 $0.00 $0.00
0.00% 0.00% 0.00%
$0.00 $0.00 $0.00
0.00% 0.00% 0.00%
$0.00 $0.00 $0.00
0,00% 0.00% 0.00%
$0.00 $0.00 $0.00
-1 .13% -1.30% -1.29%
0.00% 0.00% 0.00%
0.00% 0.00% 0.00%
$0.00 $0.00 $0.00
0.00 0.00 0.00
-19.23% -19.23% -19.23% (13)
0.00% 0.00% 0.00%
0.00% 0.00% 0.00%
0.00% 0.00% 0.00%
0.00% 0.00% 0.00% (14)
0.00% 0.00% 0.00% (15)
0.00% 0.00% 0.00% (16)
0.00% 0.00% 0.00% (17)
0.00% 0.00% 0.00% (18)
$0.00 $0.00 $0.00
$0.00 $0.00 $0.00
$0.00 $0.00 $0.00 (19)
0.00% 0.00% 0.00% (20)
0.00% 4.53% 4.53% (21)
(2) The forecast for Lottery funding per ADA includes only the amount restricted by Proposition 20 (2000) for instructional materials. Lottery funding is based on prior year annual ADA times the statewide average excused absence factor of 1.04446.
(3)
(4)
(5)
(6)
(7)
(8)
(9)
(10)
(11)
(12)
The forecast for Lottery funding per ADA includes only the base (unrestricted) funding. Lottery funding is based on prior year annual ADA times the statewide average excused absence factor of 1.04446.
Interest Rate for 10-year Treasuries
Net Funded Revenue Limit Change
Revenue Limit Deficits K-12
Special Education Base Deficit
State Categorial COLA (including adu~ ed, ROC/P)
Statutory COLA (use for K-12 and COE Revenue Limits and Special Education)
Tier I Programs: No reduction in funding for 2008-09 and 2009-10 (remains at 2007-08level adjusted for growth/decline). Programs Affected: 6010 After School Education and Safety 7230 Home to School Transportation Chi ld Development 1300 K-3 Class Size Reduction Child Nutrition 7400 Quality Education Investment Act 7090 Economic Impact Aid (EIA) 6500 Special Education
Tier II Programs: Reduction of approximately 15.4% in 2008-09, plus additional reduction of 4.5% in 2009-10 (plus adjustment for growth/decline). Programs Affected: 6015 Adults in Correctional Facilities Foster Youth Educational Services Apprenticeship Programs 7126 K-12 High Speed Network 7010 Agricultural Vocational Education 7220 Partnership Academies 6030 Charter School Facility Grants Pupil Testing County Office Oversight (FCMAT) Year-Round Education English Language Acquisition Program
Tier Ill Programs: Reduction of approximately 15.4% in 2008-09, plus additional reduction of 4.5% in 2009-10 (plus adjustment for growth/decline) with flexibility to transfer funds from any of these programs to any "educational purpose" (includes unrestricted General Fund or other categorical programs) for the period from 2008-09 to 2012-13. Programs Affected: 7394AB 825 Targeted Instructional Improvement Block Grant 1200 Class-Size Reductio~9th Grade 7392 AB 825 Teacher Credentialing Block Grant 6205 Deferred Maintenance 7393 AB 825 Professional Development Block Grant 4410 Educational Technology 7390 AB 825 Pupil Retention Block Grant Gifted and Talented Education (GATE) AB 825 School Safety Consolidated 7268 High Priority Schools and 11/USP (see uNote") 7395 AB 825 School and Library Improvement Administrator Training Program (AB 430) 70151ndian Education Centers Adult Education Instructional Materials Fund Alternative Credentialing 7286 International Baccalaur
Printed by: Lisa Nilles Print date: 6/20/2013 9:58AM Page 1 of2
(14) Title V, Part A (Innovative Programs) Resource 4110
(15) Title IV Part B (21st Century Learning Centers) Resource 4124
(16) Title I, Part B, Subpart 1 (Reading First) Resource 3030
(17) Title I. Part B, Subpart 3 (Even Start) Resource 3105
(18) Career and Technical Ed Grants
(19) Autobalance Rule
(20) Federal COLA
(21) Indirect Rate
Printed by: Lisa Nilles
Projection Rules
Print date: 6/20/2013 9:58AM
LEA: Simi Valley Unified Projection: 2013-14 July 1 Budget (Single Adoption)
Page 2 of2