Embed Size (px)
Citation preview
Assoc.Prof.Dr. Fuat ErdalInsurance Training Center, Istanbul
andIstanbul Technical University,
Dept of Management Engineering
The International Insurance Mediation Conference, March 28th-29th, 2011, Istanbul 1
Conceptual issues Aims Data and methodology Graphical representations Unit root tests Granger causality tests Financial crises Effect of insurance income on econ growth Effect of econ growth on insurance income Concluding remarks
The International Insurance Mediation Conference, March 28th-29th, 2011, Istanbul 2

A promise of compensation for specific potential future losses in exchange for a periodic payment.
Insurance is designed to protect the financial well-being of an individual, company or other entity in the case of unexpected loss.
Some forms of insurance are required by law, while others are optional. Agreeing to the terms of an insurance policy creates a contract between
the insured and the insurer. In exchange for payments from the insured (called premiums), the insurer
agrees to pay the policy holder a sum of money upon the occurrence of a specific event.
In most cases, the policy holder pays part of the loss (called the deductible), and the insurer pays the rest.
The International Insurance Mediation Conference, March 28th-29th, 2011, Istanbul 3
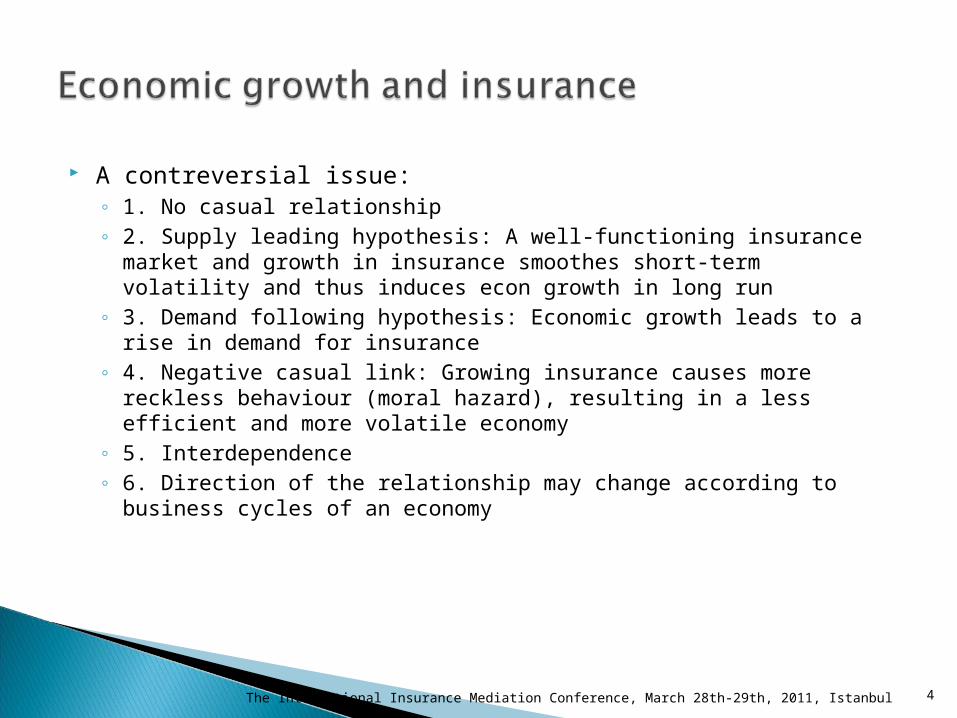
A contreversial issue:◦ 1. No casual relationship◦ 2. Supply leading hypothesis: A well-functioning insurance market and
growth in insurance smoothes short-term volatility and thus induces econ growth in long run
◦ 3. Demand following hypothesis: Economic growth leads to a rise in demand for insurance
◦ 4. Negative casual link: Growing insurance causes more reckless behaviour (moral hazard), resulting in a less efficient and more volatile economy
◦ 5. Interdependence◦ 6. Direction of the relationship may change according to business cycles
of an economy
The International Insurance Mediation Conference, March 28th-29th, 2011, Istanbul 4
The studies analysing the relationship between financial sector and growth focus on banking and stock market, ignoring the insurance sector
Empirical analyses on the role of insurance market are insufficient
The relationship between insurance and growth is contreversial and needs more empirical testing
Even there exists, direction of the causality is open to discussion:
Aim: To test all these arguments by time series data
The International Insurance Mediation Conference, March 28th-29th, 2011, Istanbul 5
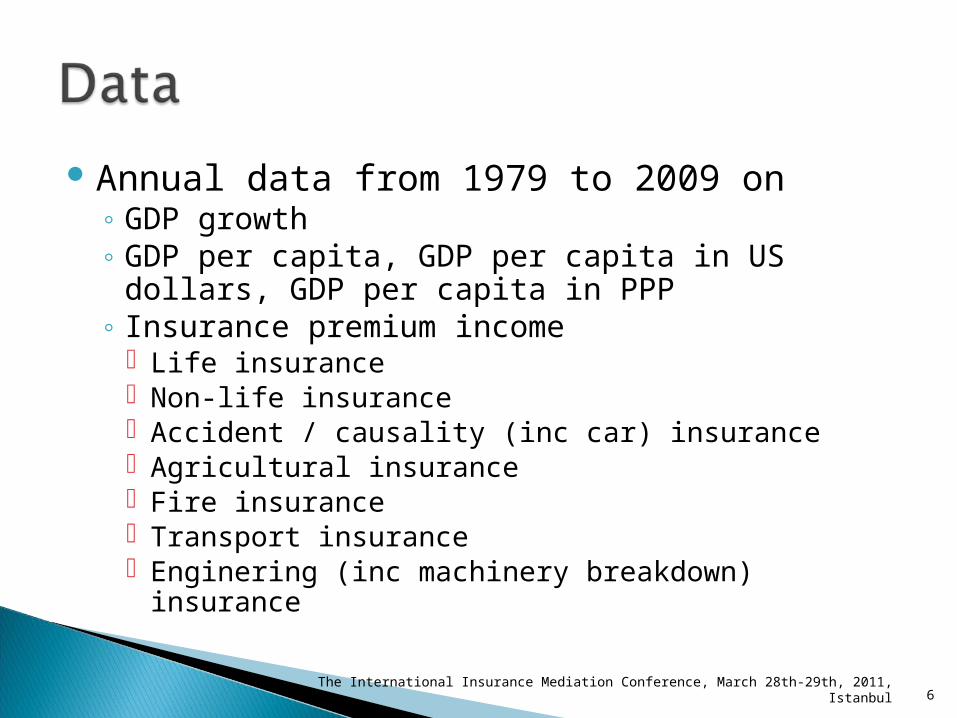
Annual data from 1979 to 2009 on◦ GDP growth◦ GDP per capita, GDP per capita in US dollars, GDP
per capita in PPP◦ Insurance premium income
Life insurance Non-life insurance Accident / causality (inc car) insurance Agricultural insurance Fire insurance Transport insurance Enginering (inc machinery breakdown) insurance
The International Insurance Mediation Conference, March 28th-29th, 2011, Istanbul 6

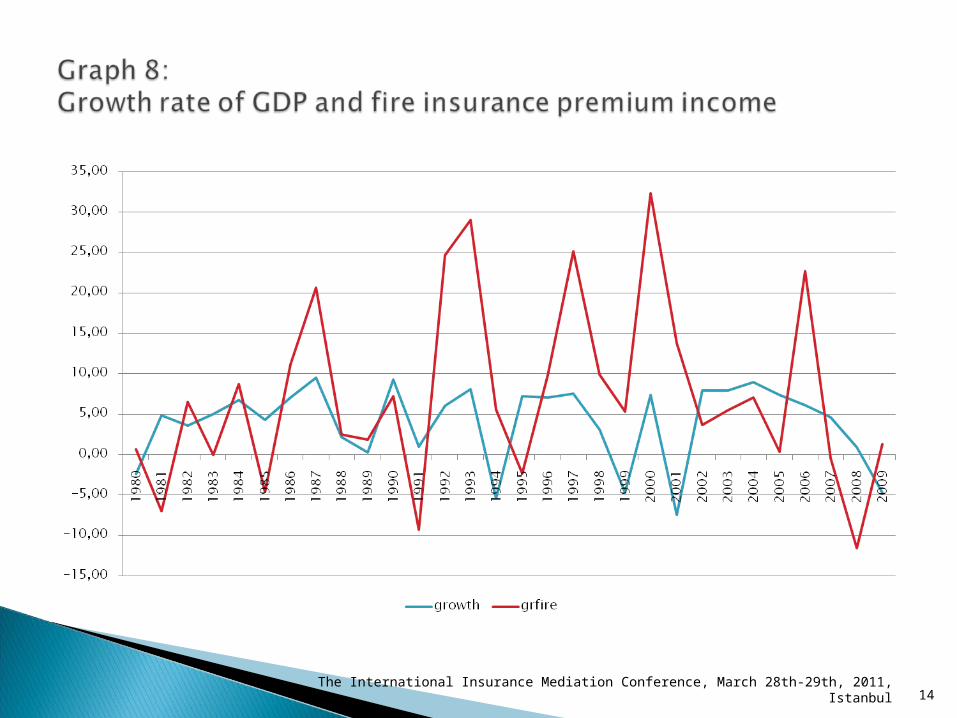
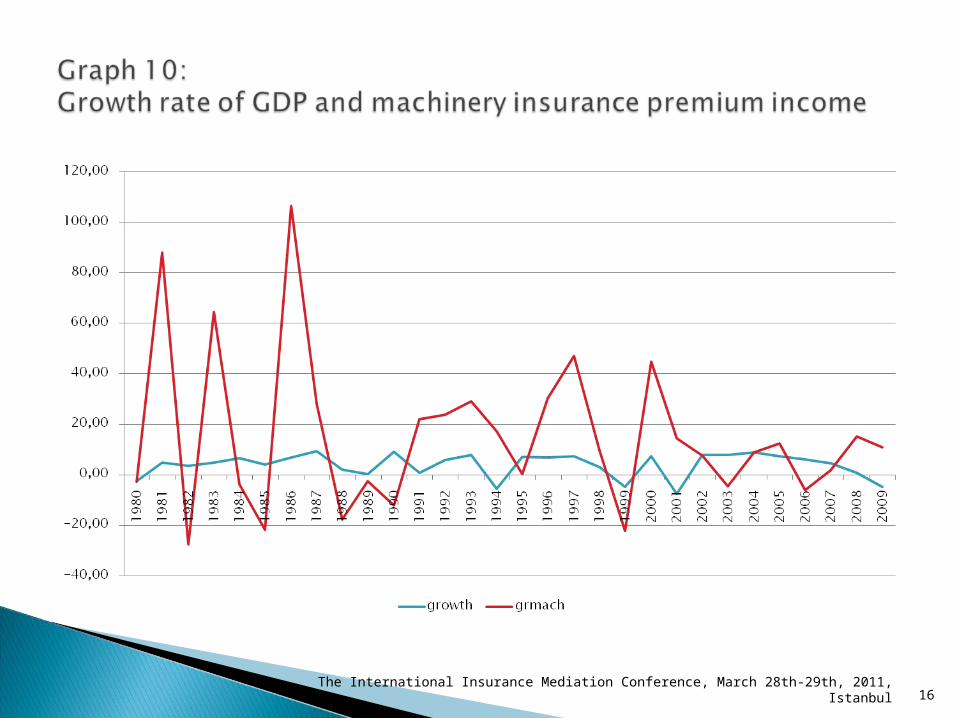
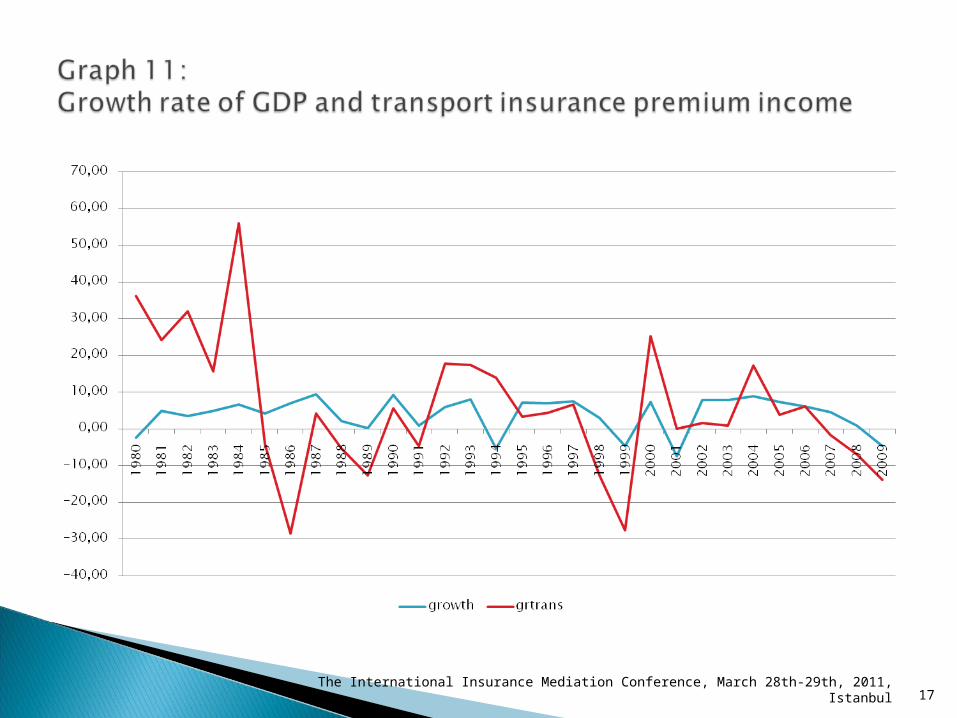
Graphical analyses Econometric time series analysis
◦ Stationarity tests to avoid from spurious regressions
◦ Granger causality test to find out if there exists a relationship
◦ OLS regression to examine the direction and magnitude of the relationship
The International Insurance Mediation Conference, March 28th-29th, 2011, Istanbul 7
The International Insurance Mediation Conference, March 28th-29th, 2011, Istanbul 8
The International Insurance Mediation Conference, March 28th-29th, 2011, Istanbul 9

The International Insurance Mediation Conference, March 28th-29th, 2011, Istanbul 10

The International Insurance Mediation Conference, March 28th-29th, 2011, Istanbul 11
The International Insurance Mediation Conference, March 28th-29th, 2011, Istanbul 12

The International Insurance Mediation Conference, March 28th-29th, 2011, Istanbul 13
The International Insurance Mediation Conference, March 28th-29th, 2011, Istanbul 14

The International Insurance Mediation Conference, March 28th-29th, 2011, Istanbul 15
The International Insurance Mediation Conference, March 28th-29th, 2011, Istanbul 16
The International Insurance Mediation Conference, March 28th-29th, 2011, Istanbul 17
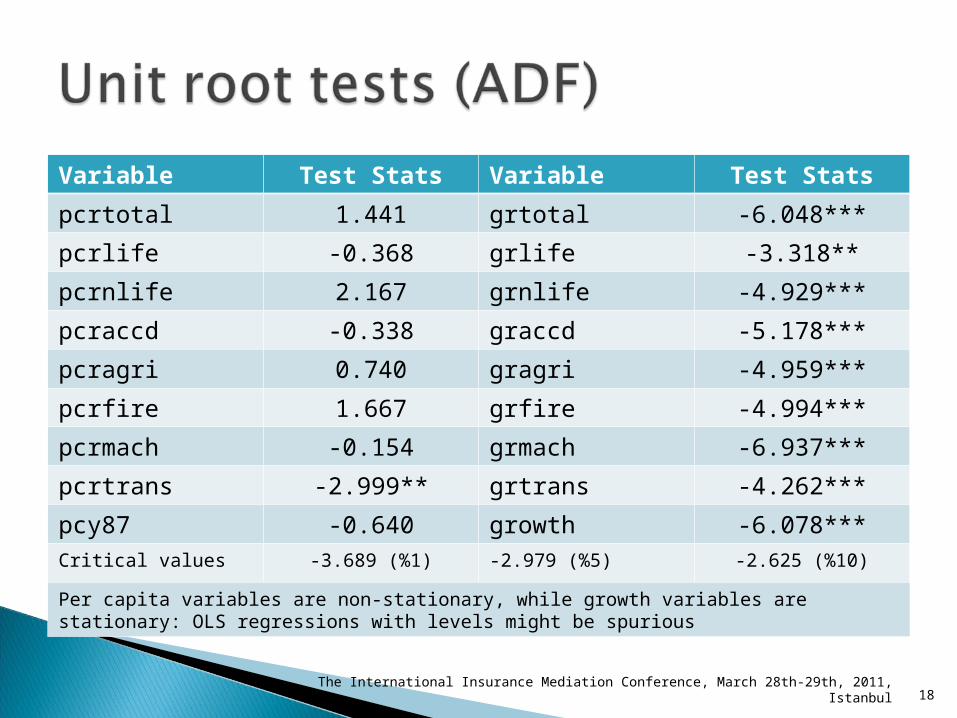
Variable Test Stats Variable Test Stats
pcrtotal 1.441 grtotal -6.048***
pcrlife -0.368 grlife -3.318**
pcrnlife 2.167 grnlife -4.929***
pcraccd -0.338 graccd -5.178***
pcragri 0.740 gragri -4.959***
pcrfire 1.667 grfire -4.994***
pcrmach -0.154 grmach -6.937***
pcrtrans -2.999** grtrans -4.262***
pcy87 -0.640 growth -6.078***Critical values -3.689 (%1) -2.979 (%5) -2.625 (%10)
Per capita variables are non-stationary, while growth variables are stationary: OLS regressions with levels might be spurious
The International Insurance Mediation Conference, March 28th-29th, 2011, Istanbul 18
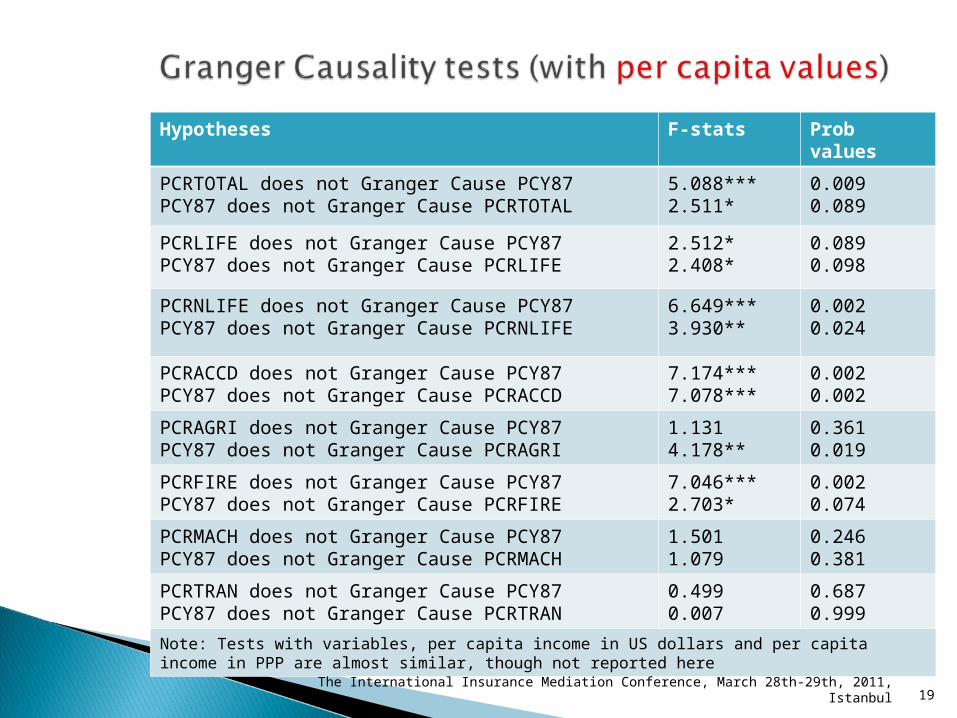
Hypotheses F-stats Prob values
PCRTOTAL does not Granger Cause PCY87PCY87 does not Granger Cause PCRTOTAL
5.088***2.511*
0.0090.089
PCRLIFE does not Granger Cause PCY87PCY87 does not Granger Cause PCRLIFE
2.512*2.408*
0.0890.098
PCRNLIFE does not Granger Cause PCY87PCY87 does not Granger Cause PCRNLIFE
6.649***3.930**
0.0020.024
PCRACCD does not Granger Cause PCY87PCY87 does not Granger Cause PCRACCD
7.174***7.078***
0.0020.002
PCRAGRI does not Granger Cause PCY87PCY87 does not Granger Cause PCRAGRI
1.1314.178**
0.3610.019
PCRFIRE does not Granger Cause PCY87PCY87 does not Granger Cause PCRFIRE
7.046***2.703*
0.0020.074
PCRMACH does not Granger Cause PCY87PCY87 does not Granger Cause PCRMACH
1.5011.079
0.2460.381
PCRTRAN does not Granger Cause PCY87PCY87 does not Granger Cause PCRTRAN
0.4990.007
0.6870.999
Note: Tests with variables, per capita income in US dollars and per capita income in PPP are almost similar, though not reported here
The International Insurance Mediation Conference, March 28th-29th, 2011, Istanbul 19
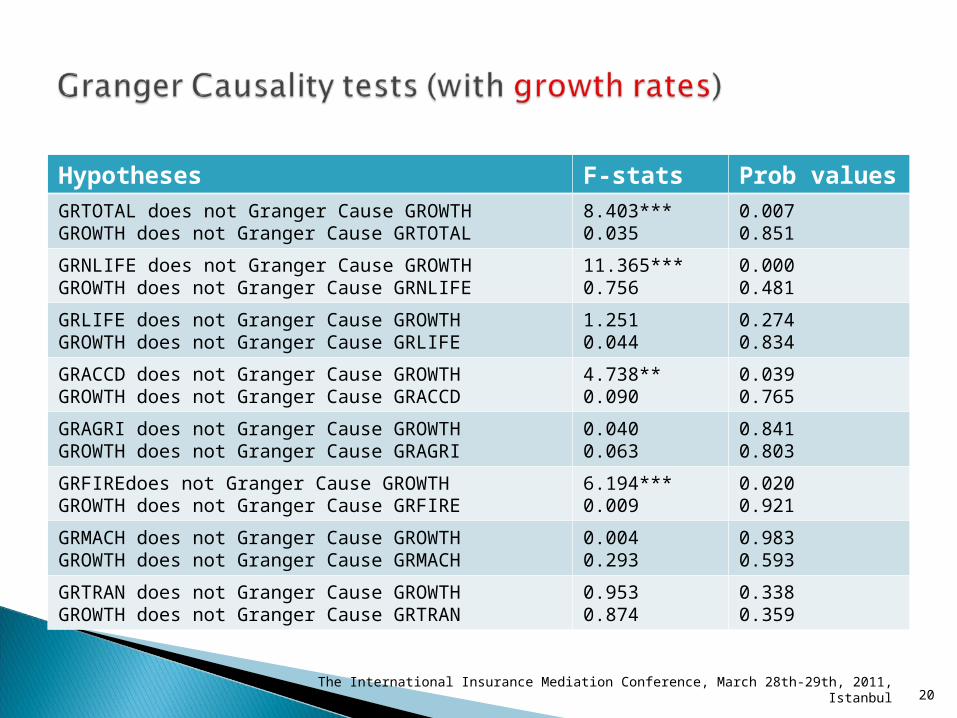
Hypotheses F-stats Prob valuesGRTOTAL does not Granger Cause GROWTHGROWTH does not Granger Cause GRTOTAL
8.403***0.035
0.0070.851
GRNLIFE does not Granger Cause GROWTHGROWTH does not Granger Cause GRNLIFE
11.365***0.756
0.0000.481
GRLIFE does not Granger Cause GROWTHGROWTH does not Granger Cause GRLIFE
1.2510.044
0.2740.834
GRACCD does not Granger Cause GROWTHGROWTH does not Granger Cause GRACCD
4.738**0.090
0.0390.765
GRAGRI does not Granger Cause GROWTHGROWTH does not Granger Cause GRAGRI
0.0400.063
0.8410.803
GRFIREdoes not Granger Cause GROWTHGROWTH does not Granger Cause GRFIRE
6.194***0.009
0.0200.921
GRMACH does not Granger Cause GROWTHGROWTH does not Granger Cause GRMACH
0.0040.293
0.9830.593
GRTRAN does not Granger Cause GROWTHGROWTH does not Granger Cause GRTRAN
0.9530.874
0.3380.359
The International Insurance Mediation Conference, March 28th-29th, 2011, Istanbul 20
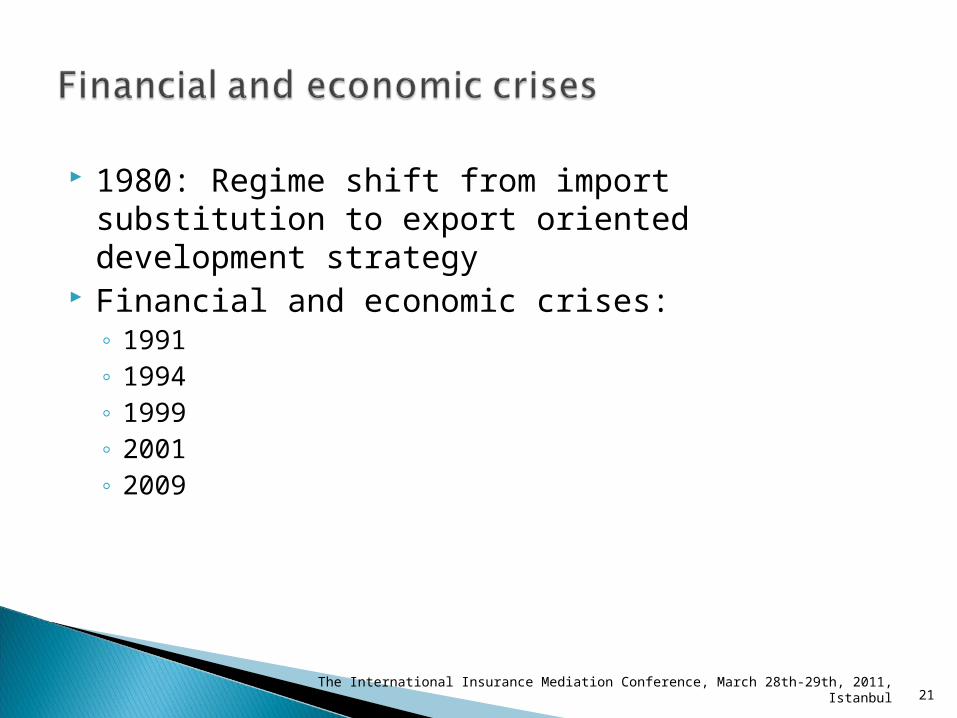
1980: Regime shift from import substitution to export oriented development strategy
Financial and economic crises:◦ 1991◦ 1994◦ 1999◦ 2001◦ 2009
The International Insurance Mediation Conference, March 28th-29th, 2011, Istanbul 21
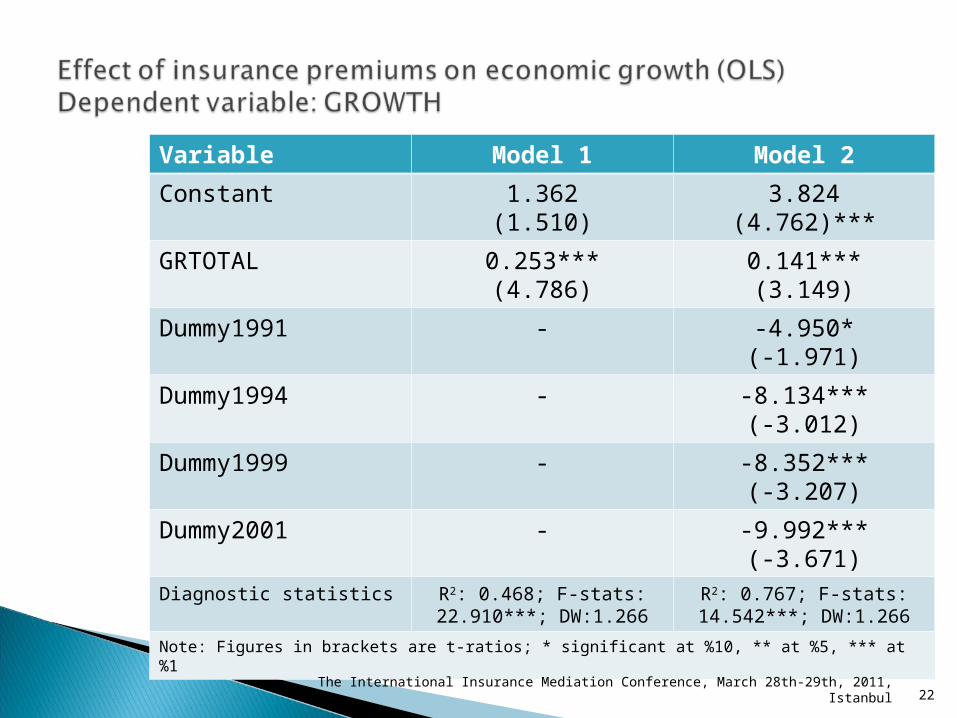
Variable Model 1 Model 2
Constant 1.362(1.510)
3.824(4.762)***
GRTOTAL 0.253***(4.786)
0.141***(3.149)
Dummy1991 - -4.950*(-1.971)
Dummy1994 - -8.134***(-3.012)
Dummy1999 - -8.352***(-3.207)
Dummy2001 - -9.992***(-3.671)
Diagnostic statistics R2: 0.468; F-stats: 22.910***; DW:1.266
R2: 0.767; F-stats: 14.542***; DW:1.266
Note: Figures in brackets are t-ratios; * significant at %10, ** at %5, *** at %1
The International Insurance Mediation Conference, March 28th-29th, 2011, Istanbul 22
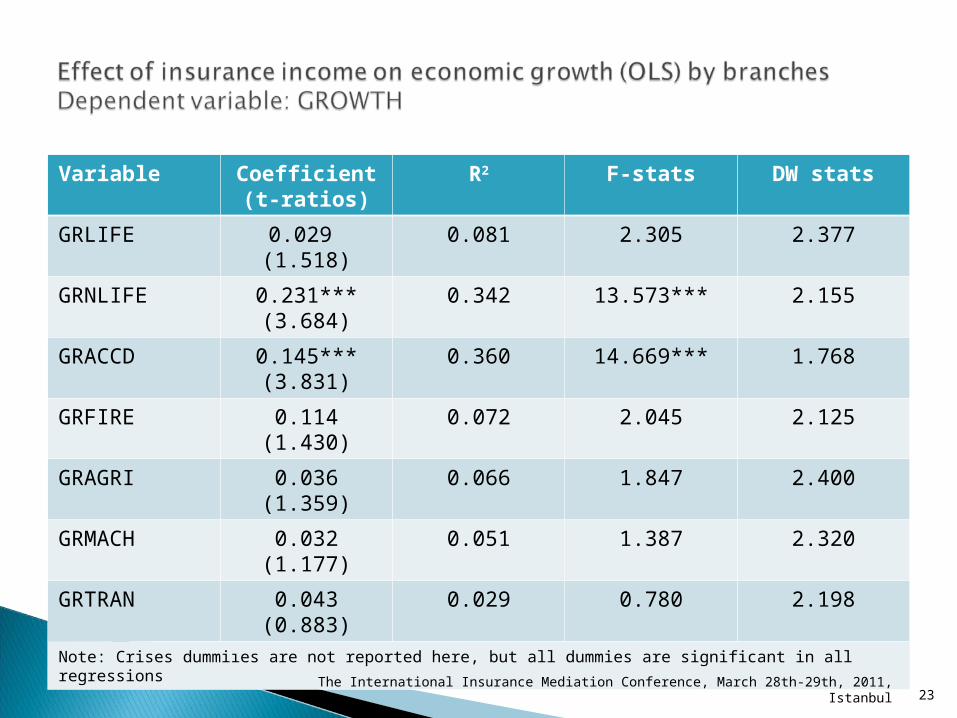
Variable Coefficient (t-ratios)
R2 F-stats DW stats
GRLIFE 0.029 (1.518)
0.081 2.305 2.377
GRNLIFE 0.231*** (3.684)
0.342 13.573*** 2.155
GRACCD 0.145*** (3.831)
0.360 14.669*** 1.768
GRFIRE 0.114(1.430)
0.072 2.045 2.125
GRAGRI 0.036(1.359)
0.066 1.847 2.400
GRMACH 0.032(1.177)
0.051 1.387 2.320
GRTRAN 0.043(0.883)
0.029 0.780 2.198
Note: Crises dummiıes are not reported here, but all dummies are significant in all regressions
The International Insurance Mediation Conference, March 28th-29th, 2011, Istanbul 23
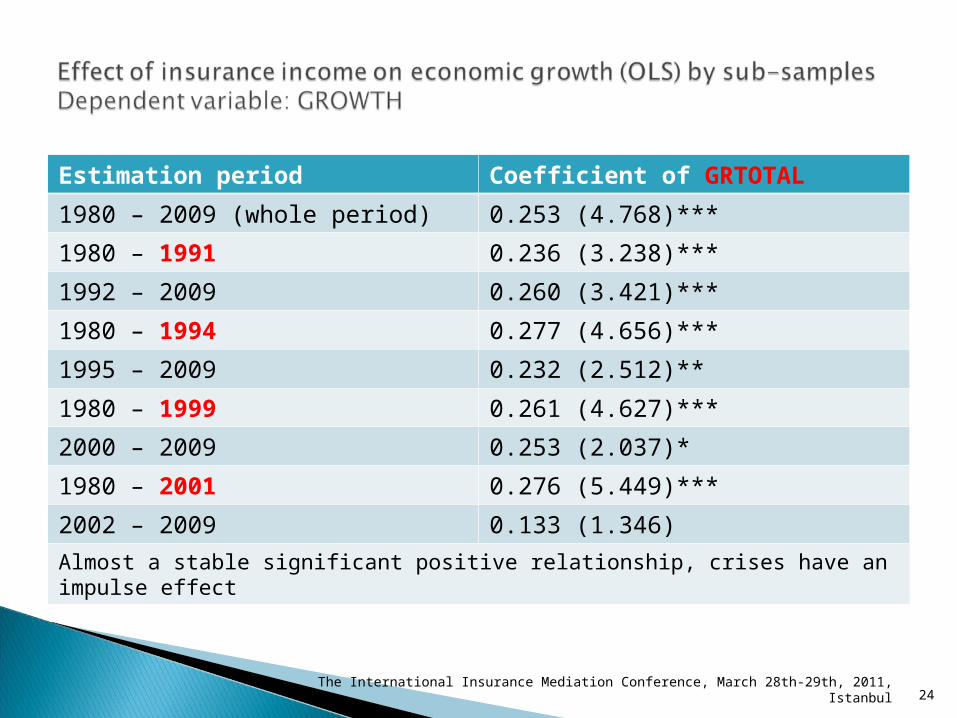
Estimation period Coefficient of GRTOTAL
1980 – 2009 (whole period) 0.253 (4.768)***
1980 – 1991 0.236 (3.238)***
1992 – 2009 0.260 (3.421)***
1980 – 1994 0.277 (4.656)***
1995 – 2009 0.232 (2.512)**
1980 – 1999 0.261 (4.627)***
2000 – 2009 0.253 (2.037)*
1980 – 2001 0.276 (5.449)***
2002 – 2009 0.133 (1.346)
Almost a stable significant positive relationship, crises have an impulse effect
The International Insurance Mediation Conference, March 28th-29th, 2011, Istanbul 24
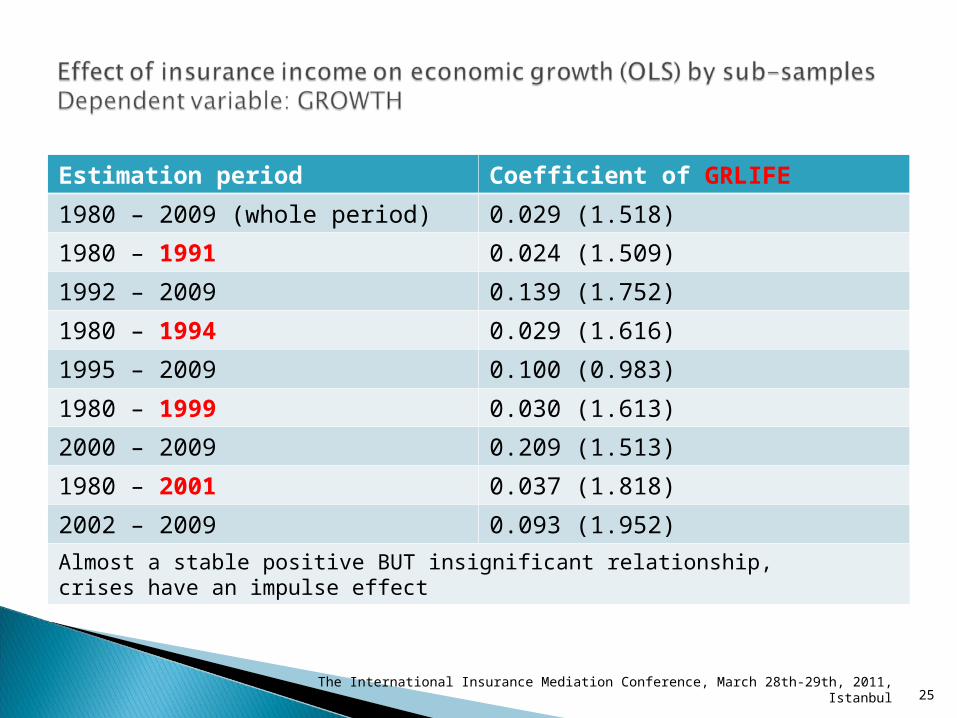
Estimation period Coefficient of GRLIFE
1980 – 2009 (whole period) 0.029 (1.518)
1980 – 1991 0.024 (1.509)
1992 – 2009 0.139 (1.752)
1980 – 1994 0.029 (1.616)
1995 – 2009 0.100 (0.983)
1980 – 1999 0.030 (1.613)
2000 – 2009 0.209 (1.513)
1980 – 2001 0.037 (1.818)
2002 – 2009 0.093 (1.952)
Almost a stable positive BUT insignificant relationship, crises have an impulse effect
The International Insurance Mediation Conference, March 28th-29th, 2011, Istanbul 25
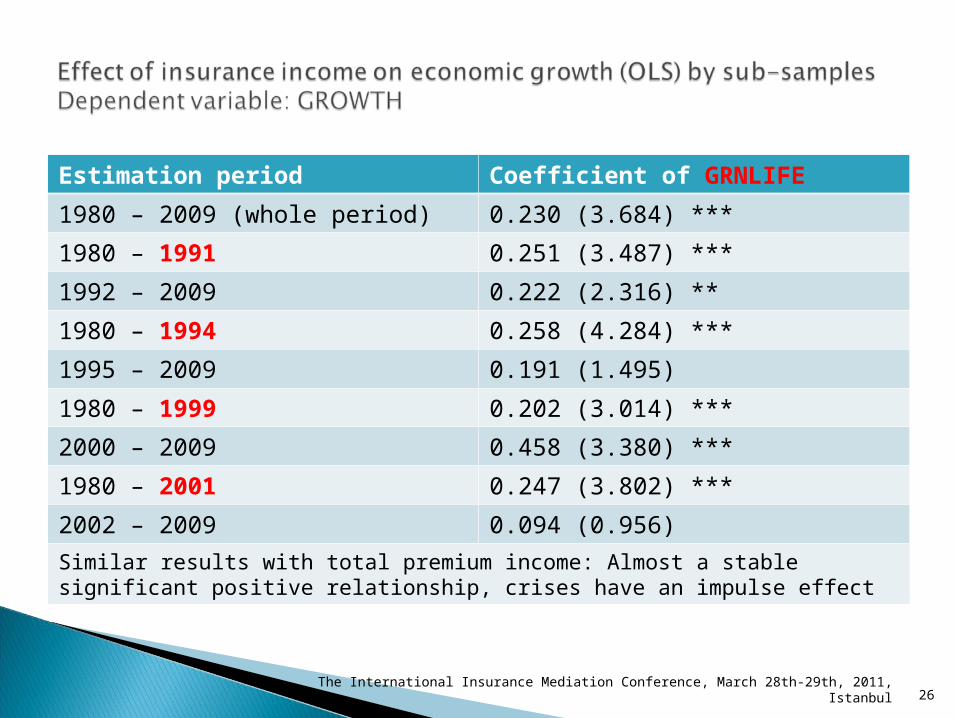
Estimation period Coefficient of GRNLIFE
1980 – 2009 (whole period) 0.230 (3.684) ***
1980 – 1991 0.251 (3.487) ***
1992 – 2009 0.222 (2.316) **
1980 – 1994 0.258 (4.284) ***
1995 – 2009 0.191 (1.495)
1980 – 1999 0.202 (3.014) ***
2000 – 2009 0.458 (3.380) ***
1980 – 2001 0.247 (3.802) ***
2002 – 2009 0.094 (0.956)
Similar results with total premium income: Almost a stable significant positive relationship, crises have an impulse effect
The International Insurance Mediation Conference, March 28th-29th, 2011, Istanbul 26
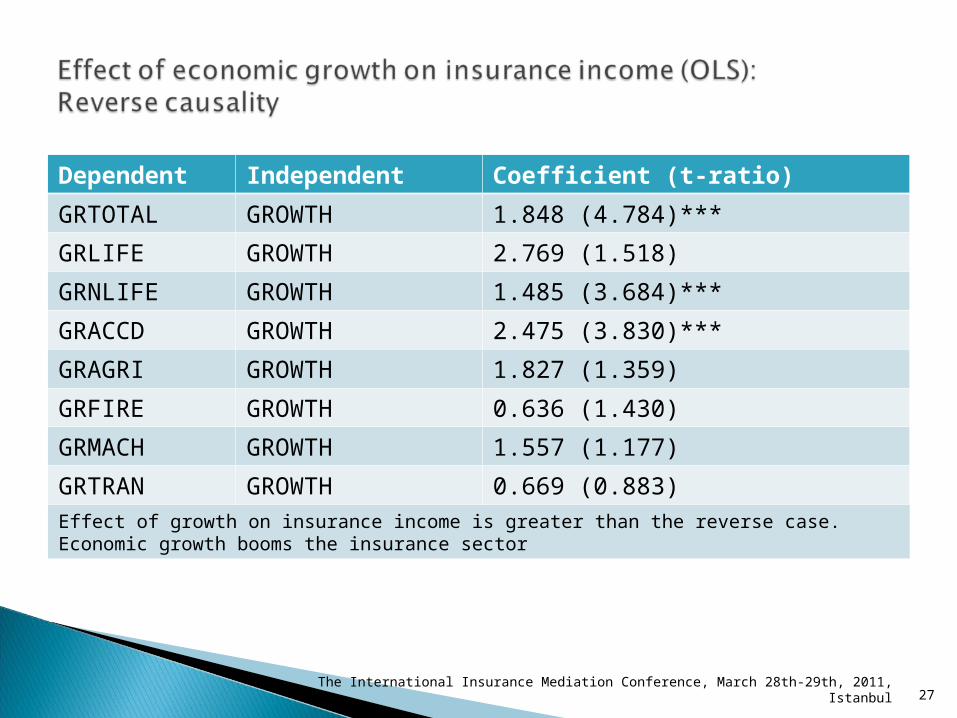
Dependent Independent Coefficient (t-ratio)
GRTOTAL GROWTH 1.848 (4.784)***
GRLIFE GROWTH 2.769 (1.518)
GRNLIFE GROWTH 1.485 (3.684)***
GRACCD GROWTH 2.475 (3.830)***
GRAGRI GROWTH 1.827 (1.359)
GRFIRE GROWTH 0.636 (1.430)
GRMACH GROWTH 1.557 (1.177)
GRTRAN GROWTH 0.669 (0.883)Effect of growth on insurance income is greater than the reverse case. Economic growth booms the insurance sector
The International Insurance Mediation Conference, March 28th-29th, 2011, Istanbul 27
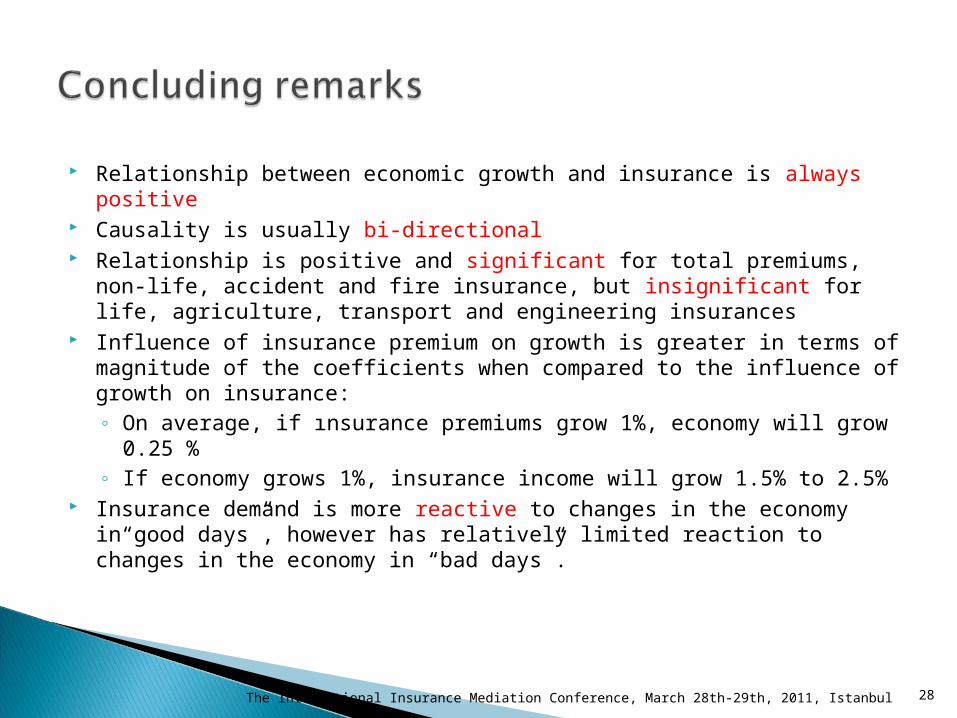
Relationship between economic growth and insurance is always positive Causality is usually bi-directional Relationship is positive and significant for total premiums, non-life,
accident and fire insurance, but insignificant for life, agriculture, transport and engineering insurances
Influence of insurance premium on growth is greater in terms of magnitude of the coefficients when compared to the influence of growth on insurance: ◦ On average, if ınsurance premiums grow 1%, economy will grow 0.25 %◦ If economy grows 1%, insurance income will grow 1.5% to 2.5%
Insurance demand is more reactive to changes in the economy in“good days”, however has relatively limited reaction to changes in the economy in “bad days”.
The International Insurance Mediation Conference, March 28th-29th, 2011, Istanbul 28


![Yong Fuat Meng[2008] MLJ 119](https://img.pdfslide.us/doc/110x75/577cc6f91a28aba7119fb23f/yong-fuat-meng2008-mlj-119.jpg)