Embed Size (px)
Citation preview
1
Associations between homeostasis model assessment (HOMA) and routinely examined
parameters in individuals with metabolic syndrome
Ladislav Štěpánek1, Dagmar Horáková1, Lubomír Štěpánek2, Ľubica Cibíčková3, David
Karásek3, Helena Vaverková3, Marie Nakládalová4, Ľubica Juríčková1, Helena Kollárová1
1Department of Public Health, Faculty of Medicine and Dentistry, Palacký University
Olomouc, Czech Republic
2Institute of Biophysics and Informatics, 1st Faculty of Medicine, Charles University, Czech
Republic
33rd Department of Internal Medicine – Nephrology, Rheumatology and Endocrinology,
University Hospital Olomouc and Faculty of Medicine and Dentistry, Palacky University
Olomouc, Czech Republic
4Department of Occupational Medicine, University Hospital Olomouc and Faculty of
Medicine and Dentistry, Palacký University Olomouc, Czech Republic
Corresponding author: Ladislav Štěpánek, Department of Public Health, Faculty of Medicine
and Dentistry, Palacký University Olomouc, Hněvotínská 3, 775 15 Olomouc, Czech
Republic. E-mail: [email protected]
Short title: Homeostasis model assessment and routine clinical parameters
Summary
The aim of the study was to investigate whether routine clinical parameters, including visceral
adiposity index (VAI) and atherogenic index of plasma (AIP), could become widely
applicable predictors of insulin resistance (IR), evaluated using homeostasis model
assessment (HOMA-IR, HOMA-β), with regard to presence of metabolic syndrome (MS).
The study comprised 188 individuals identified to meet the MS criteria during regular health
examinations and an equal number of age, sex-matched controls without MS. The strongest
2
correlations were noted between HOMA-IR and waist circumference (WC) in the MS group
(r=0.57) as well as between HOMA-IR and alanine aminotransferase (ALT, r=0.57) or
aspartate aminotransferase (r=0.56) in the controls, with a statistical significance of p<0.001.
In a multivariate linear regression model, the predictors of HOMA-IR were WC (linear
coefficient β=0.1, p<0.001), ALT (β=2.28, p<0.001) and systolic blood pressure (β=0.04,
p<0.001). HOMA-β was determined by WC (β=1.97, p=0.032) and ALT (β=99.49, p=0.004)
and inversely associated with age (β=-1.31, p=0.004). Neither VAI nor AIP were significant
predictors. The presence of MS was significantly associated with both HOMA-IR and
HOMA-β. These results indicate that WC and ALT appear to be reliable predictors of IR.
Comprehensive assessment of these parameters may serve for estimating the level of IR.
Key words: insulin resistance, homeostasis model assessment, visceral adiposity index,
atherogenic index of plasma, waist circumference
Introduction
Globally, chronic noninfectious diseases play an important role and increasingly
contribute to overall mortality. There is therefore a growing need to search for and use new
preventive methods. Metabolic syndrome (MS), grouping factors crucial for the development
of diseases of affluence, has been defined as a single nosological entity, among others, to
clearly identify individuals with high cardiovascular risk eligible for targeted preventive
interventions (Paniagua 2016).
Obesity is a major clinical problem in developed societies. It is well known that
obesity and MS are associated with increased morbidity and mortality (Matloch et al. 2016).
According to some definitions, visceral obesity, as measured by waist circumference (WC), is
stressed over other components of MS (Kassi et al. 2011). In the state of obesity, subjects
already present insulin resistance (IR) and hyperinsulinemia, probably the first step of a
dysfunctional metabolic system. Subsequently, other disorders develop gradually, in
3
particular hyperglycemia, dyslipidemia and hypertension, that is, those targeted by routine
screening in primary care (Paniagua 2016). It means that IR usually starts as early as at the
time when parameters of routine screening still may not show abnormal values. Effective
detection of early IR could therefore contribute to identification of potential at-risk
individuals. Similarly, effective and available objective assessment of IR in already identified
at-risk individuals with MS could aid in predicting complication such as type 2 diabetes
mellitus (T2DM).
A method for detecting IR that is easy to use in common clinical practice albeit still
rather expensive for widespread use is homeostasis model assessment (HOMA). Its
satisfactory correlation with the most accurate glucose clamp techniques has been confirmed
by numerous studies. These simple mathematical models based on the knowledge of a single
fasting glucose and insulin value reflect the level of resistance of peripheral tissues to insulin
(HOMA-IR) or pancreatic beta cell function (HOMA-β) (Wallace et al. 2004).
Recently, there has been an increase in information in the literature about a relatively
new predictive model called visceral adiposity index (VAI) that seems to be a reliable
indicator of visceral adipose dysfunction; its increase is strongly associated with
cardiometabolic risk (Amato et al. 2010). Similarly, atherogenic index of plasma (AIP) is
associated with cardiometabolic risk. AIP reflects the true relationship between protective and
atherogenic lipoprotein and is associated with the size of pre- and anti-atherogenic lipoprotein
particles (Li et al. 2018). Unlike HOMA, both VAI and AIP may be calculated without
knowing the patient’s insulin concentration and only routine parameters are needed (serum
lipids for AIP, plus basic anthropometric data for VAI).
The study aimed to assess the relationship between routinely used parameters and
indirect IR markers, namely HOMA, with respect to the presence of MS, and to explore
whether, and if so to what extent, VAI and AIP are associated with IR in those patients.
4
Methods
Study subjects
The study comprised two groups differing in the presence of MS. Those included in
the MS group met the International Diabetes Federation (IDF) criteria for diagnosing MS
(Alberti et al. 2005), one of the widespread and commonly used definition of MS. Between
March 2017 and September 2018, such individuals eligible for the study were selected in two
general practitioners’ offices in the Pardubice Region, Czech Republic. The MS group
comprised 188 individuals (73 males and 115 females) with a mean age of 56 years. In these
subjects, the below laboratory analysis were performed and, at the same time, their basic
anthropometric parameters (height, weight, WC) and blood pressure (BP), as a mean of three
resting recordings at a single visit, were measured. The obtained data were used to calculate
Body Mass Index (BMI), HOMA-IR, HOMA-β, VAI and AIP for each participant. An equal
number of controls without meeting the IDF criteria of MS was age- and sex-matched as par
with the MS group. Those included in the control group were selected from the database of
patients' first visits in an Outpatient center of the 3rd Department of Internal Medicine,
University Hospital Olomouc. None of the subjects of both groups was treated with oral
antidiabetic drugs or insulin.
The study was conducted according to the principles stated in the Declaration of
Helsinki. For being included in the study, all subjects signed informed consent forms after
they were explained all information regarding the study.
Laboratory analysis
All laboratories participating in the study meet the same national accreditation. In all
cases, the principles of proper laboratory practice were followed and the laboratories were
under systematic intra- and inter- laboratory control of the accuracy of examinations.
5
In the MS group, venous blood was always sampled in the morning, after 12-hour
fasting, in a single collection point of an accredited laboratory (MeDiLa Ltd., Pardubice).
There, under standard conditions, the following biochemistry parameters were analyzed:
glucose, total cholesterol (TC), low-density lipoprotein cholesterol (LDL-C), high-density
lipoprotein cholesterol (HDL-C), triglycerides, uric acid (UA), alanine aminotransferase
(ALT) and aspartate aminotransferase (AST). The above parameters were measured on the
Architect c16000 analyzer (Abbott Laboratories, Illinois, USA) using fresh serum on the day
of blood sampling. To determine serum insulin concentrations, serum was deep frozen within
no more than 2 hours from blood sampling. The separated serum was stored at –80°C until
assay. The insulin concentration analysis itself was carried out at the Department of Clinical
Biochemistry and Diagnostics, University Hospital Hradec Králové on the Architect i1000SR
analyzer (Abbott Laboratories) using chemiluminescent microparticle immunoassay.
In the control group, the same routine serum parameters were analyzed on the Cobas
8000 analyzer (Roche, Mannheim, Germany) on the day of blood sampling at the Department
of Clinical Biochemistry, University Hospital Olomouc. Serum insulin concentrations were
determined by the commercially available kits (Immunotech, Marseille, France) using specific
antibodies by IRMA methods.
Statistical analysis
Statistical analyses were conducted with the R software environment (R Foundation
for Statistical Computing, Austria; http://www.r-project.org/). All numerical variables were
characterized with descriptive statistics. Correlations of selected variables were quantified
with Pearson’s correlation coefficient (r) and the level of significance (p) was determined.
Multivariate linear regression was performed to examine the relationships between the
parameters, including VAI and AIP, as regressors of the dependent variables HOMA-IR and
HOMA-β. The results of regression analysis are presented in the form of linear coefficients
6
(β). P value of less than 0.05 indicates statistical significance. Extreme values of glucose and
insulin were found and excluded using the inner and outer fences method. All variables of our
interest followed normal or near-normal distribution. The following formulas were used to
calculate the aforementioned indices (Wallace et al. 2004, Dobiasova and Frochlich 2001,
Amato et al. 2010):
𝐻𝑂𝑀𝐴-𝐼𝑅 = 𝑔𝑙𝑢𝑐𝑜𝑠𝑒 × 𝑖𝑛𝑠𝑢𝑙𝑖𝑛
22.5
𝐻𝑂𝑀𝐴-𝛽 = 𝑖𝑛𝑠𝑢𝑙𝑖𝑛 × 20
𝑔𝑙𝑢𝑐𝑜𝑐𝑒 − 3.5
𝐴𝐼𝑃 = 𝑙𝑜𝑔𝑡𝑟𝑖𝑔𝑙𝑦𝑐𝑒𝑟𝑖𝑑𝑒𝑠
𝐻𝐷𝐿
𝑉𝐴𝐼 𝑖𝑛 𝑚𝑎𝑙𝑒𝑠 = (𝑊𝐶
39.68 + (1.88 × 𝐵𝑀𝐼)) × (
𝑡𝑟𝑖𝑔𝑙𝑦𝑐𝑒𝑟𝑖𝑑𝑒𝑠
1.03) × (
1.31
𝐻𝐷𝐿)
𝑉𝐴𝐼 𝑖𝑛 𝑓𝑒𝑚𝑎𝑙𝑒𝑠 = (𝑊𝐶
36.58 + (1.89 × 𝐵𝑀𝐼)) × (
𝑡𝑟𝑖𝑔𝑙𝑦𝑐𝑒𝑟𝑖𝑑𝑒𝑠
0.81) × (
1.52
𝐻𝐷𝐿)
Results
Characteristics of the study population
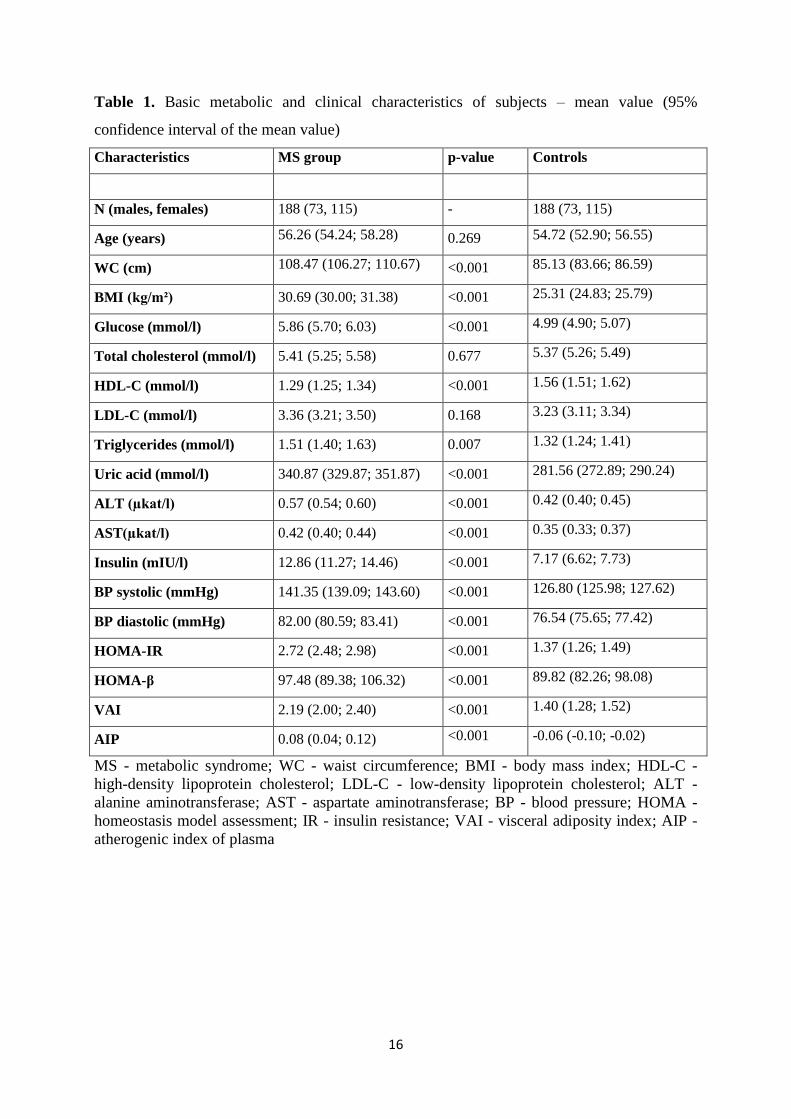
Basic metabolic and clinical characteristics are expressed as the mean of all values
with the lower and upper limits of the 95% confidence interval (Table 1). It is apparent that
most MS parameters were borderline or abnormal in the MS group. The mean values of WC
(112.9 cm in males, 105.7 cm in females) were within the obesity range (according the IDF
criteria) for both sexes. Those were individuals with visceral obesity only. As for other MS
diagnostic criteria, glucose levels ≥ 5.6 mmol/l were commonly observed, namely in 56.2% of
males and 49.6% of females. Glucose levels ≥ 7 mmol/l were present in 9.6% of males and
8.7% of females, respectively. As seen from Table 1, the mean systolic BP was slightly above
7
the threshold for the applied MS criteria whereas the mean diastolic BP was below the
threshold. Among the means of lipid parameters contained in the definition of MS, only
triglycerides in males (1.81. mmol/l) were abnormal. It must be noted, however, that long-
term antihypertensive and hypolipidemic therapy (both statins and fibrates) was widely used
in the MS group. In the control group, means of all MS parameters were normal with the only
exception of the borderline mean value of WC in females (80.2 cm). All tested parameters
differed significantly between the groups except for TC and LDL-C.
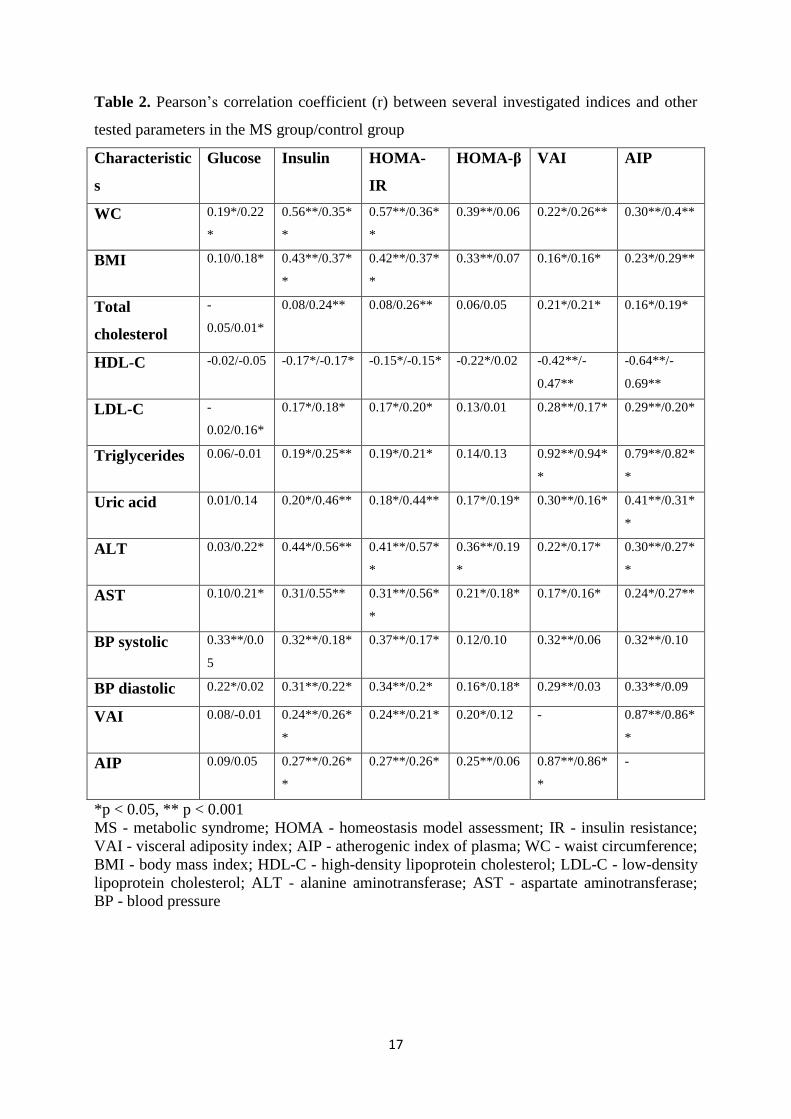
Correlation analysis
In the MS group, the highest correlation coefficients were noted between WC and IR
markers, namely correlations of WC with HOMA-IR (r = 0.57), HOMA-β (r = 0.39) and
insulin concentration alone (r = 0.56), as seen from Table 2 and Fig. 1. However, WC was
only weakly correlated with glucose alone (r = 0.19). Similar correlations were found for
BMI, with correlation coefficients being generally lower than in case of WC. Both HOMA
and insulin were also moderately correlated with liver transaminases, the strongest being
correlations of ALT with insulin concentration (r = 0.44) and HOMA-IR (r = 0.41).
Statistically significant were also correlations of systolic and diastolic BP with HOMA-IR (r
= 0.37 and r = 0.34, respectively), insulin concentration alone (r = 0.32 and r = 0.31,
respectively) and glucose (r = 0.33 and r = 0.22, respectively). As for the parameters not
directly associated with IR, there were statistically highly significant (p < 0.001) correlations
of WC and BMI with both systolic (r = 0.42 and r = 0.31, respectively) and diastolic BP (r =
0.45 and r = 0.36, respectively) and HDL-C (r = -0.34 and r = -0.32, respectively). As
expected, correlations of VAI and AIP with parameters included in their calculations were
strong and statistically significant. As for the parameters not included in the calculations of
VAI and AIP, the strongest correlations were found in BP and UA, specifically the strongest
between AIP and UA (r = 0.41).
8
In the control group, an association of the anthropometric indices with HOMA was
generally weaker than in the MS group, without an apparent difference between WC and BMI
(Table 2). There were moderate correlations of both insulin and HOMA-IR with ALT and
AST, respectively, with the highest correlation coefficient noted between HOMA-IR and ALT
(r = 0.57) (Fig. 2). Also notable was an association of UA with both insulin (r = 0.46) and
HOMA-IR (r = 0.44). Correlation coefficients of HOMA-β were generally very low (Table 2).
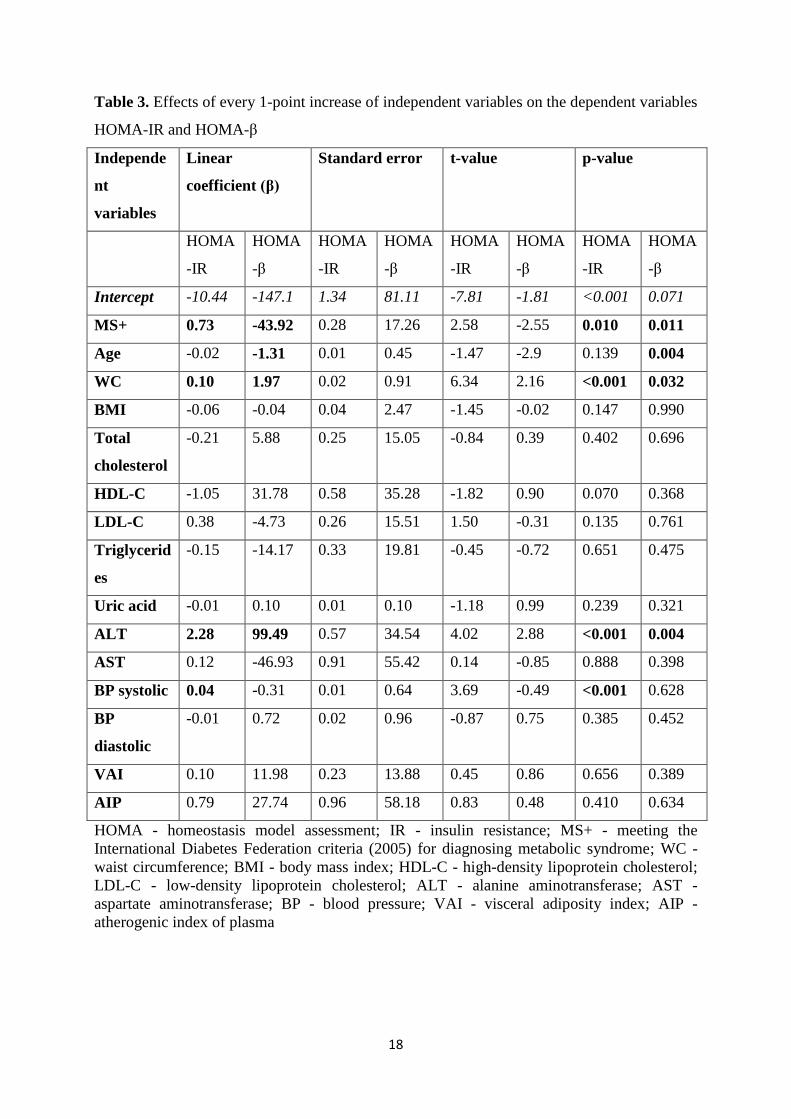
Regression analysis
The impact of individual HOMA predictors is expressed with multivariate linear
regression models that use linear coefficients (β) to show the effects of 1-point increases of
these predictors on HOMA (Table 3). As for HOMA-IR, there were statistically significant
results for its relationships with WC, ALT and systolic BP. For HOMA-β, the statistically
significant predictors were WC and ALT; unlike HOMA-IR, the result for an inverse
association between HOMA-β and age was statistically significant. The presence of MS was a
significant predictor of both HOMA-IR and HOMA-β. For example, if WC increases by 1
point, HOMA-IR and HOMA-β will increase by a mean of 0.1 (p < 0.001) and 1.97 (p =
0.032), respectively. If ALT increases by 1 point, the increases of HOMA-IR and HOMA-β
will increase by 2.28 (p < 0.001) and 99.49 (p = 0.004), respectively. With each year of age
HOMA-β will decrease by a mean of 1.31 (p = 0.004).
Discussion
The obtained results of both correlation and regression analyses demonstrate strong
relationships between WC and IR markers in individuals with MS. However, the same
regression analysis results were not observed for BMI. The ability of WC to predict IR may
be beneficial, mainly from a primary health care practitioner’s perspective, given the ease
with which WC is measured. Our results are similar to those of a cross-sectional study by
9
Huang et al. who used regression analysis of 144 individuals with T2DM to show that unlike
BMI, WC is a statistically significant predictor of HOMA-IR (Huang et al. 2012). Although a
cross-sectional study of 140 healthy individuals by Kurniawan et al. found, consistently with
the present study, a stronger correlation of HOMA-IR with WC (r = 0.46, p < 0.01) than
with BMI (r = 0.39, p < 0.01), regression analysis proved BMI to be a stronger predictor of
HOMA-IR than WC (Kurniawan et al. 2018). As demonstrated by our results, stronger and
more statistically significant correlations between WC and insulin or HOMA are in subjects
with MS than in metabolically healthy subjects (Table 2, Fig. 1).
Uniform reference values for HOMA have not been defined as yet. Tang et al. state
that HOMA cut-offs vary, depending on geographical area and the studied population. For
various European regions, HOMA-IR identifying established IR has been reported to range
from 2.0 to 3.8 (Tang et al. 2015). In the present study, the mean HOMA-IR was 2.72 in the
MS group, differing significantly from the mean HOMA-IR of 1.37 in the control group. In a
sample of 3636 males, Ying et al. demonstrated that HOMA-IR value increases as the number
of MS components increases. For males with 3 or more MS components, HOMA-IR was 2.64
(Ying et al. 2011). In our study, the mean HOMA-IR in males with MS was 2.98. Recent
decades have witnessed an increase in the prevalence of child MS. HOMA-IR cut-offs in
children differ from those in adults (Pastucha et al. 2013).
In their cross-sectional study of 50 MS patients (IDF-defined as in the present study)
and 24 healthy controls, Garg et al. found lower HOMA-β in MS patients than in controls
(66.80 vs. 144.27). In our study, the situation was opposite with the mean HOMA-β of 97.48
in the MS group and 89.82 in controls, respectively. In other words, insulin secretion of MS
subjects was less altered in the present study than in the analysis by Garg et al., however, our
controls exhibited much lower insulin secretion in comparison with the analysis (Garg et al.
2011). A Mexican study of 190 individuals meeting the MS criteria (NCEP ATP III) showed
10
a mean HOMA-β of 115.2 and progressive deterioration of β-cell function (HOMA-β
decrease) as the number of components of MS increased. In individuals with MS, the mean
insulin concentration was 11.9 mIU/l (Baez-Duarte et al. 2010). In the present study,
significant positive predictors of HOMA-β were WC and ALT. Therefore, the participants
probably had a persistent functional reserve capacity of the endocrine part of pancreas, with
excess insulin-dependent visceral adipose tissue inducing increased insulin production. The
inverse association of HOMA-β with age confirms an unsurprising decrease in pancreatic
endocrine function throughout the life span (Hirose et al. 2016).
The liver plays a central role in the systemic regulation of glucose and lipid
metabolism and aberrant hepatic insulin action is thought to be a primary driver of IR. In
pathologic states, insulin fails to appropriately regulate hepatic metabolism, leading to excess
production of glucose despite accelerated rates of lipid synthesis. As a consequence, IR
disorders such as obesity and T2DM are closely linked to nonalcoholic fatty liver disease
(NAFLD) (Santoleri and Titchenell 2019, Poledne et al. 2015). Markers of liver function,
specifically ALT, predict incident T2DM in various populations. In a study of 1309 healthy
individuals with IR quantified by clamp techniques, increased ALT was a biomarker of IR
with concomitant increased insulin secretion and decreased hepatic insulin clearance (Bonnet
et al. 2011). This is consistent with the positive associations of ALT with HOMA-IR as well
as of ALT with HOMA-β in the present study. A study of 1732 adults aged 18-23 years with
normal weight by Simental-Mendía et al. concluded that IR was significantly associated with
elevated ALT levels but not with elevated AST levels using logistic regression analysis
adjusted by age, sex, waist circumference and BMI (Simental-Mendía et al. 2017). This
corresponds with results of the regression model in the present study.
It is known that AIP is associated with obesity and increased cardiovascular risk.
Pearson’s correlation analysis of 5351 middle-aged males from Southeastern China revealed
11
that AIP was positively correlated with WC (r = 0.37, p < 0.001) (Shen et al. 2018). In their
study, Li et al. divided 2523 individuals with T2DM who had not been treated with lipid-
lowering drugs into tertiles based on their AIP values. There was a significant increase in
HOMA-IR between the tertiles. Multiple logistic regression analysis showed that WC,
HOMA-IR, fasting glucose, systolic BP and UA were independent risk factors for AIP (Li et
al. 2018). The present study documented several rather weak statistically highly significant
correlations of AIP (Table 2), however, regression analysis did not confirm the ability of AIP
to predict HOMA.
A cross-sectional study including 1834 Chinese adults with normal WC assessed the
correlation between VAI and HOMA-IR. VAI gradually increased across HOMA-IR quartiles
and correlation analysis showed that VAI was positively related to HOMA-IR. Logistic
regression analysis indicated that VAI elevation was the main risk factor for the increased
HOMA-IR in both genders (Ji et al. 2017). In the present study, regression analysis failed to
confirm a significant association between HOMA-IR and VAI and only showed statistically
significant correlations of VAI with LDL-C, UA and BP in the MS group (Table 2).
The study has certain limitations. One is the fact that it used laboratory data obtained
by single measurement, causing possible bias due to natural intra-individual variability of the
analyzed parameters, as is well known, for instance, in fasting glucose (Pasqualetti et al.
2017). Another limitation is that common long-term antihypertensive and hypolipidemic
therapy was widespread in the study population (especially in the MS group), affecting
plasma lipid levels and BP values.
In conclusion, correlation and regression analysis confirmed significant associations
between HOMA and some routinely examined parameters. In addition to systolic BP,
significant predictors for HOMA-IR were also ALT and WC, clearly the most significant
predictor. The association of WC with HOMA-IR increases with a number of metabolic
12
disorders present as indicated by the difference of correlation coefficients between the studied
groups. Thus, targeted assessment of these routine and easily available parameters may be
used to identify IR without the need to detect insulin. Primarily, the predictive ability of WC
must not be underestimated. The important predictors of HOMA-β were WC, ALT and age.
After further verification, these findings may considerably contribute to preventive measures,
particularly in primary care.
Conflict of Interest
There is no conflict of interest
Acknowledgments
This work was supported by IGA LF 2017 016 and MZ ČR – RVO FNOL 00098892.
References
ALBERTI KG, ZIMMET P, SHAW J: The metabolic syndrome - a new worldwide
definition. Lancet 366: 1059–1062, 2005.
AMATO MC, GIORDANO C, GALIA M, CRISCIMANNA A, VITABILE S, MIDIRI M,
GALLUZZO A: Visceral Adiposity Index A reliable indicator of visceral fat function
associated with cardiometabolic risk. Diabetes Care 33: 920–922, 2010.
BAEZ-DUARTE BG, SÁNCHEZ-GUILLÉN MDC, PÉREZ-FUENTES R, ZAMORA-
GINEZ I, LEON-CHAVEZ BA, REVILLA-MONSALVE C, ISLAS-ANDRADE S: β-cell
function is associated with metabolic syndrome in Mexican subjects. Diabetes Metab Syndr
Obes 3: 301-309, 2010.
BONNET F, DUCLUZEAU PH, GASTALDELLI A, LAVILLE M, ANDERWALD CH,
KONRAD T, MARI A, BALKAU B: Liver enzymes are associated with hepatic insulin
resistance, insulin secretion, and glucagon concentration in healthy men and women. Diabetes
60: 1660-1667, 2011.
13
DOBIASOVA M, FROHLICH J: The plasma parameter log (TG/HDL-C) as an atherogenic
index: correlation with lipoprotein particle size and esterification rate inapob-lipoprotein-
depleted plasma (FERHDL). Clin Bioch 34: 583-588, 2001.
GARG MK, DUTTA MK, MAHALLE N: Study of beta-cell function (by HOMA model) in
metabolic syndrome. Indian J Endocrinol Metab 15: S44-49, 2011.
HIROSE H, TAKAYAMA M, IWAO Y, KAWABE H: Effects of aging on visceral and
subcutaneous fat areas and on homeostasis model assessment of insulin resistance and insulin
secretion capacity in a comprehensive health checkup. J Atheroscler Thromb 23: 207-215,
2016.
HUANG LH, LIAO YL, HSU CH: Waist circumference is a better predictor than body mass
index of insulin resistance in type 2 diabetes. Obes Res Clin Pract 6: e263-346, 2012.
JI B, QU H, WANG H, WEI H, DENG H: Association between the visceral adiposity index
and homeostatic model assessment of insulin resistance in participants with normal waist
circumference. Angiology 68: 716-721, 2017.
KASSI E, PERVANIDOU P, KALTSAS G, CHROUSOS G: Metabolic syndrome:
definitions and controversies. BMC Med 9: 48, 2011.
KURNIAWAN LB, BAHRUN U, HATTA M, ARIF M: Body mass, total body fat
percentage, and visceral fat level predict insulin resistance better than waist circumference
and body mass index in healthy young male adults in Indonesia. J Clin Med 7: E96, 2018.
LI Z, HUANG Q, SUN L, BAO T, DAI Z: Atherogenic index in type 2 diabetes and its
relationship with chronic microvascular complications. Int J Endocrinol 2018: 1765835,
2018.
MATLOCH Z, KOTULÁK T, HALUZÍK M: The role of epicardial adipose tissue in heart
disease. Physiol Res 65: 23-32, 2016.
14
PANIAGUA JA: Nutrition, insulin resistance and dysfunctional adipose tissue determine the
different components of metabolic syndrome. World J Diabetes 7: 483–514, 2016.
PASQUALETTI S, BRAGA F, PANTEGHINI M: Pre-analytical and analytical aspects
affecting clinical reliability of plasma glucose results. Clin Biochem 50: 587-594, 2017.
PASTUCHA D, FILIPCIKOVA R, HORAKOVA D, RADOVA L, MARINOV Z,
MALINCIKOVA J, KOCVRLICH M, HORAK S, BEZDICKOVA M, DOBIAS M: The
incidence of metabolic syndrome in obese Czech children: the importance of early detection
of insulin resistance using homeostatic indexes HOMA-IR and QUICKI. Physiol Res 62: 277-
283, 2013.
POLEDNE R, KRALOVA LESNA I, CEJKOVA S: Adipose tissue and atherosclerosis.
Physiol Res 64: S395-S402, 2015.
SANTOLERI D, TITCHENELL PM: Resolving the Paradox of Hepatic Insulin Resistance.
Cell Mol Gastroenterol Hepatol 7: 447–456, 2019.
SHEN SW, LU Y, LI F, YANG CJ, FENG YB, LI HW, YAO WF, SHEN ZH: Atherogenic
index of plasma is an effective index for estimating abdominal obesity. Lipids Health Dis 17:
11, 2018.
SIMENTAL-MENDÍA LE, RODRÍGUEZ-MORÁN M, GÓMEZ-DÍAZ R, WACHER NH,
RODRÍGUEZ-HERNÁNDEZ H, GUERRERO-ROMERO F: Insulin resistance is associated
with elevated transaminases and low aspartate aminotransferase/alanine aminotransferase
ratio in young adults with normal weight. Eur J Gastroenterol Hepatol 29: 435-440, 2017.
TANG Q, LI X, SONG P, XU L: Optimal cut-off values for the homeostasis model
assessment of insulin resistance (HOMA-IR) and pre-diabetes screening: Developments in
research and prospects for the future. Drug Discov Ther 9: 380-385, 2015.
WALLACE TM, LEVY JC, MATTHEWS DR: Use and abuse of HOMA modeling. Diabetes
Care 27: 1487-1495, 2004.

15
YING X, SONG Z, ZHAO C, JIANG Y: Association between homeostasis model assessment
of insulin resistance (HOMA-IR) and components of metabolic syndrome in young Chinese
men. Iran J Public Health 40: 1-5, 2011.
16
Table 1. Basic metabolic and clinical characteristics of subjects – mean value (95%
confidence interval of the mean value)
MS - metabolic syndrome; WC - waist circumference; BMI - body mass index; HDL-C -
high-density lipoprotein cholesterol; LDL-C - low-density lipoprotein cholesterol; ALT -
alanine aminotransferase; AST - aspartate aminotransferase; BP - blood pressure; HOMA -
homeostasis model assessment; IR - insulin resistance; VAI - visceral adiposity index; AIP -
atherogenic index of plasma
Characteristics MS group p-value Controls
N (males, females) 188 (73, 115) - 188 (73, 115)
Age (years) 56.26 (54.24; 58.28) 0.269 54.72 (52.90; 56.55)
WC (cm) 108.47 (106.27; 110.67) <0.001 85.13 (83.66; 86.59)
BMI (kg/m²) 30.69 (30.00; 31.38) <0.001 25.31 (24.83; 25.79)
Glucose (mmol/l) 5.86 (5.70; 6.03) <0.001 4.99 (4.90; 5.07)
Total cholesterol (mmol/l) 5.41 (5.25; 5.58) 0.677 5.37 (5.26; 5.49)
HDL-C (mmol/l) 1.29 (1.25; 1.34) <0.001 1.56 (1.51; 1.62)
LDL-C (mmol/l) 3.36 (3.21; 3.50) 0.168 3.23 (3.11; 3.34)
Triglycerides (mmol/l) 1.51 (1.40; 1.63) 0.007 1.32 (1.24; 1.41)
Uric acid (mmol/l) 340.87 (329.87; 351.87) <0.001 281.56 (272.89; 290.24)
ALT (µkat/l) 0.57 (0.54; 0.60) <0.001 0.42 (0.40; 0.45)
AST(µkat/l) 0.42 (0.40; 0.44) <0.001 0.35 (0.33; 0.37)
Insulin (mIU/l) 12.86 (11.27; 14.46) <0.001 7.17 (6.62; 7.73)
BP systolic (mmHg) 141.35 (139.09; 143.60) <0.001 126.80 (125.98; 127.62)
BP diastolic (mmHg) 82.00 (80.59; 83.41) <0.001 76.54 (75.65; 77.42)
HOMA-IR 2.72 (2.48; 2.98) <0.001 1.37 (1.26; 1.49)
HOMA-β 97.48 (89.38; 106.32) <0.001 89.82 (82.26; 98.08)
VAI 2.19 (2.00; 2.40) <0.001 1.40 (1.28; 1.52)
AIP 0.08 (0.04; 0.12) <0.001 -0.06 (-0.10; -0.02)
17
Table 2. Pearson’s correlation coefficient (r) between several investigated indices and other
tested parameters in the MS group/control group
Characteristic
s
Glucose Insulin HOMA-
IR
HOMA-β VAI AIP
WC 0.19*/0.22
*
0.56**/0.35*
*
0.57**/0.36*
*
0.39**/0.06 0.22*/0.26** 0.30**/0.4**
BMI 0.10/0.18* 0.43**/0.37*
*
0.42**/0.37*
*
0.33**/0.07 0.16*/0.16* 0.23*/0.29**
Total
cholesterol
-
0.05/0.01*
0.08/0.24** 0.08/0.26** 0.06/0.05 0.21*/0.21* 0.16*/0.19*
HDL-C -0.02/-0.05 -0.17*/-0.17* -0.15*/-0.15* -0.22*/0.02 -0.42**/-
0.47**
-0.64**/-
0.69**
LDL-C -
0.02/0.16*
0.17*/0.18* 0.17*/0.20* 0.13/0.01 0.28**/0.17* 0.29**/0.20*
Triglycerides 0.06/-0.01 0.19*/0.25** 0.19*/0.21* 0.14/0.13 0.92**/0.94*
*
0.79**/0.82*
*
Uric acid 0.01/0.14 0.20*/0.46** 0.18*/0.44** 0.17*/0.19* 0.30**/0.16* 0.41**/0.31*
*
ALT 0.03/0.22* 0.44*/0.56** 0.41**/0.57*
*
0.36**/0.19
*
0.22*/0.17* 0.30**/0.27*
*
AST 0.10/0.21* 0.31/0.55** 0.31**/0.56*
*
0.21*/0.18* 0.17*/0.16* 0.24*/0.27**
BP systolic 0.33**/0.0
5
0.32**/0.18* 0.37**/0.17* 0.12/0.10 0.32**/0.06 0.32**/0.10
BP diastolic 0.22*/0.02 0.31**/0.22* 0.34**/0.2* 0.16*/0.18* 0.29**/0.03 0.33**/0.09
VAI 0.08/-0.01 0.24**/0.26*
*
0.24**/0.21* 0.20*/0.12 - 0.87**/0.86*
*
AIP 0.09/0.05 0.27**/0.26*
*
0.27**/0.26* 0.25**/0.06 0.87**/0.86*
*
-
*p < 0.05, ** p < 0.001
MS - metabolic syndrome; HOMA - homeostasis model assessment; IR - insulin resistance;
VAI - visceral adiposity index; AIP - atherogenic index of plasma; WC - waist circumference;
BMI - body mass index; HDL-C - high-density lipoprotein cholesterol; LDL-C - low-density
lipoprotein cholesterol; ALT - alanine aminotransferase; AST - aspartate aminotransferase;
BP - blood pressure
18
Table 3. Effects of every 1-point increase of independent variables on the dependent variables
HOMA-IR and HOMA-β
Independe
nt
variables
Linear
coefficient (β)
Standard error t-value p-value
HOMA
-IR
HOMA
-β
HOMA
-IR
HOMA
-β
HOMA
-IR
HOMA
-β
HOMA
-IR
HOMA
-β
Intercept -10.44 -147.1 1.34 81.11 -7.81 -1.81 <0.001 0.071
MS+ 0.73 -43.92 0.28 17.26 2.58 -2.55 0.010 0.011
Age -0.02 -1.31 0.01 0.45 -1.47 -2.9 0.139 0.004
WC 0.10 1.97 0.02 0.91 6.34 2.16 <0.001 0.032
BMI -0.06 -0.04 0.04 2.47 -1.45 -0.02 0.147 0.990
Total
cholesterol
-0.21 5.88 0.25 15.05 -0.84 0.39 0.402 0.696
HDL-C -1.05 31.78 0.58 35.28 -1.82 0.90 0.070 0.368
LDL-C 0.38 -4.73 0.26 15.51 1.50 -0.31 0.135 0.761
Triglycerid
es
-0.15 -14.17 0.33 19.81 -0.45 -0.72 0.651 0.475
Uric acid -0.01 0.10 0.01 0.10 -1.18 0.99 0.239 0.321
ALT 2.28 99.49 0.57 34.54 4.02 2.88 <0.001 0.004
AST 0.12 -46.93 0.91 55.42 0.14 -0.85 0.888 0.398
BP systolic 0.04 -0.31 0.01 0.64 3.69 -0.49 <0.001 0.628
BP
diastolic
-0.01 0.72 0.02 0.96 -0.87 0.75 0.385 0.452
VAI 0.10 11.98 0.23 13.88 0.45 0.86 0.656 0.389
AIP 0.79 27.74 0.96 58.18 0.83 0.48 0.410 0.634
HOMA - homeostasis model assessment; IR - insulin resistance; MS+ - meeting the
International Diabetes Federation criteria (2005) for diagnosing metabolic syndrome; WC -
waist circumference; BMI - body mass index; HDL-C - high-density lipoprotein cholesterol;
LDL-C - low-density lipoprotein cholesterol; ALT - alanine aminotransferase; AST -
aspartate aminotransferase; BP - blood pressure; VAI - visceral adiposity index; AIP -
atherogenic index of plasma
19
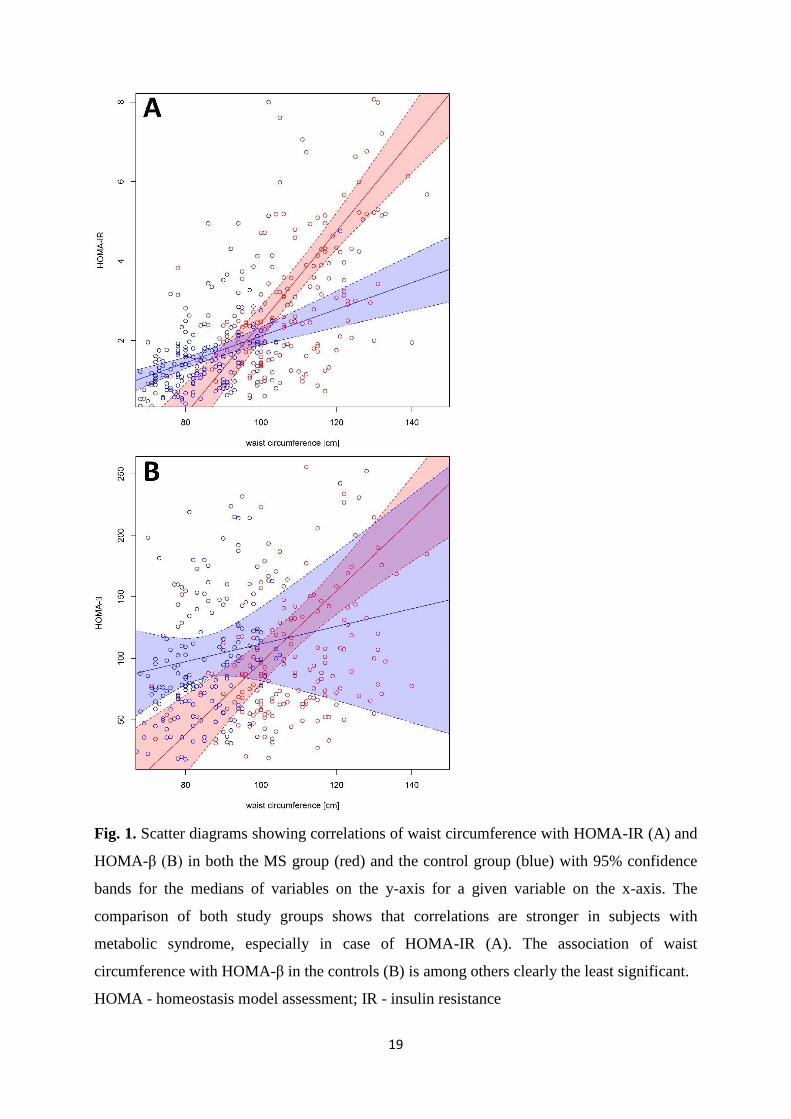
Fig. 1. Scatter diagrams showing correlations of waist circumference with HOMA-IR (A) and
HOMA-β (B) in both the MS group (red) and the control group (blue) with 95% confidence
bands for the medians of variables on the y-axis for a given variable on the x-axis. The
comparison of both study groups shows that correlations are stronger in subjects with
metabolic syndrome, especially in case of HOMA-IR (A). The association of waist
circumference with HOMA-β in the controls (B) is among others clearly the least significant.
HOMA - homeostasis model assessment; IR - insulin resistance
20
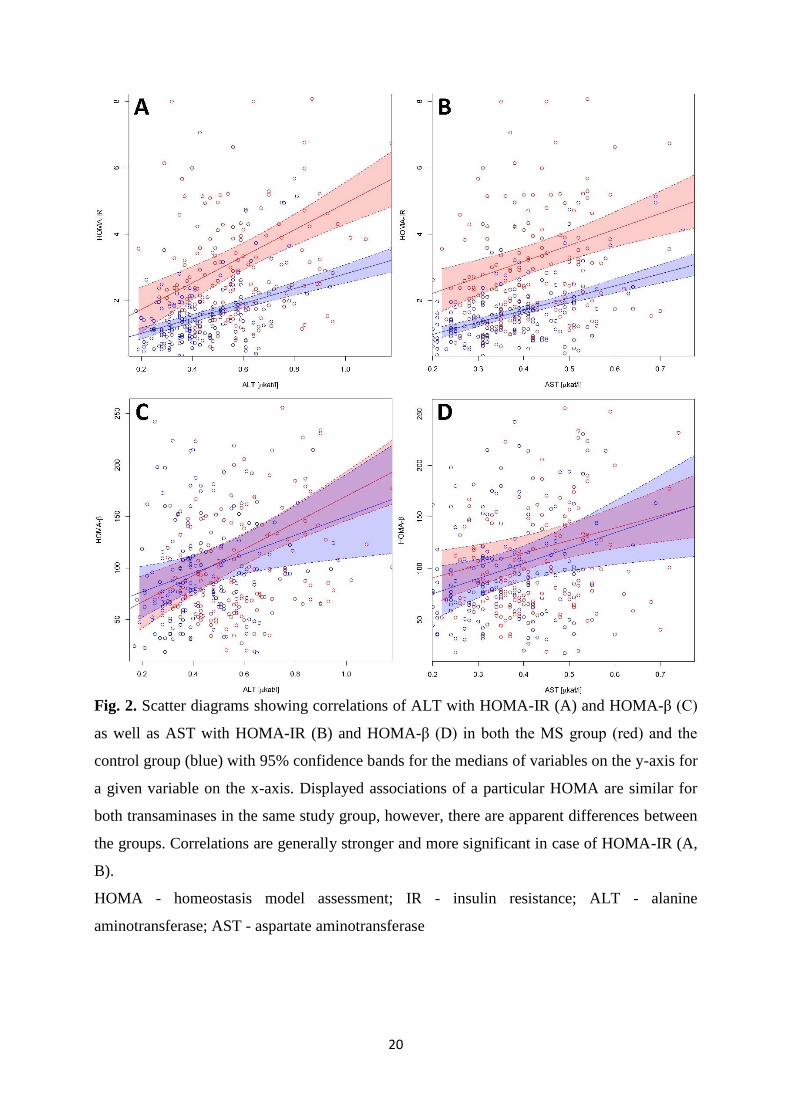
Fig. 2. Scatter diagrams showing correlations of ALT with HOMA-IR (A) and HOMA-β (C)
as well as AST with HOMA-IR (B) and HOMA-β (D) in both the MS group (red) and the
control group (blue) with 95% confidence bands for the medians of variables on the y-axis for
a given variable on the x-axis. Displayed associations of a particular HOMA are similar for
both transaminases in the same study group, however, there are apparent differences between
the groups. Correlations are generally stronger and more significant in case of HOMA-IR (A,
B).
HOMA - homeostasis model assessment; IR - insulin resistance; ALT - alanine
aminotransferase; AST - aspartate aminotransferase