Embed Size (px)
Citation preview
Association between walking, bicycling and built environment features in Shanghai
Kristen Day, Ph.D., NYUMariela Alfonzo, Ph.D., NYUZhan Guo, Ph.D., NYULin Lin, Ph.D., East China Normal University
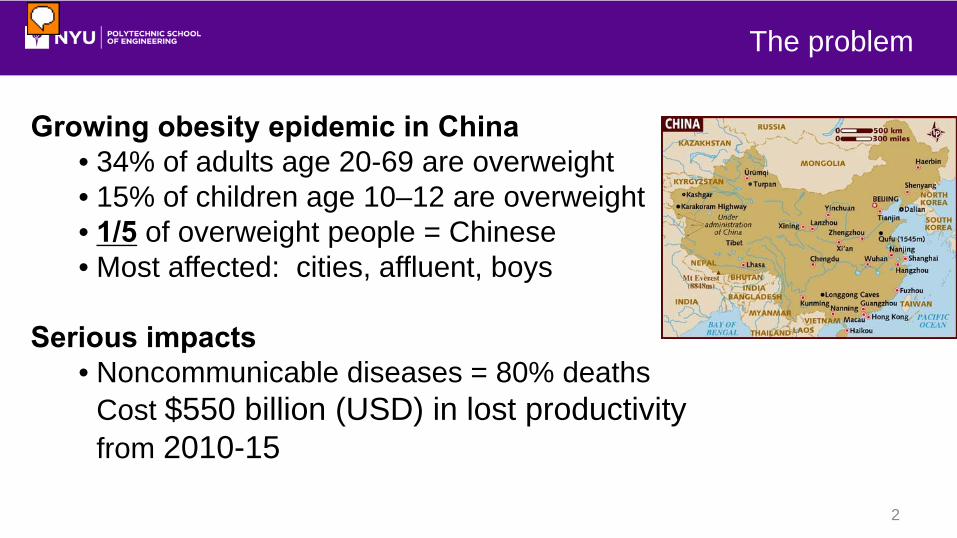
Growing obesity epidemic in China• 34% of adults age 20-69 are overweight• 15% of children age 10–12 are overweight• 1/5 of overweight people = Chinese• Most affected: cities, affluent, boys
Serious impacts• Noncommunicable diseases = 80% deaths
Cost $550 billion (USD) in lost productivity from 2010-15
2
The problem
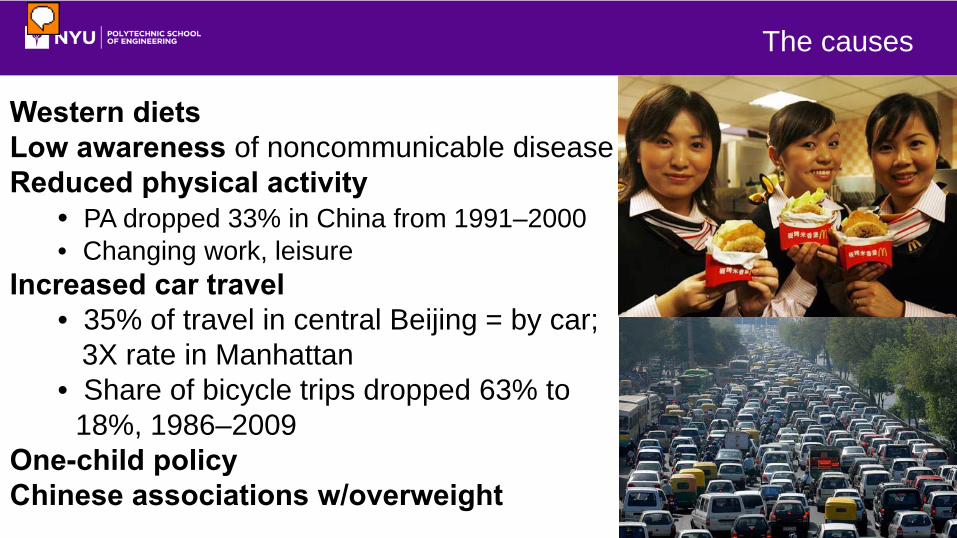
Western dietsLow awareness of noncommunicable diseaseReduced physical activity
• PA dropped 33% in China from 1991–2000• Changing work, leisure
Increased car travel• 35% of travel in central Beijing = by car;
3X rate in Manhattan• Share of bicycle trips dropped 63% to
18%, 1986–2009One-child policyChinese associations w/overweight
3
The causes
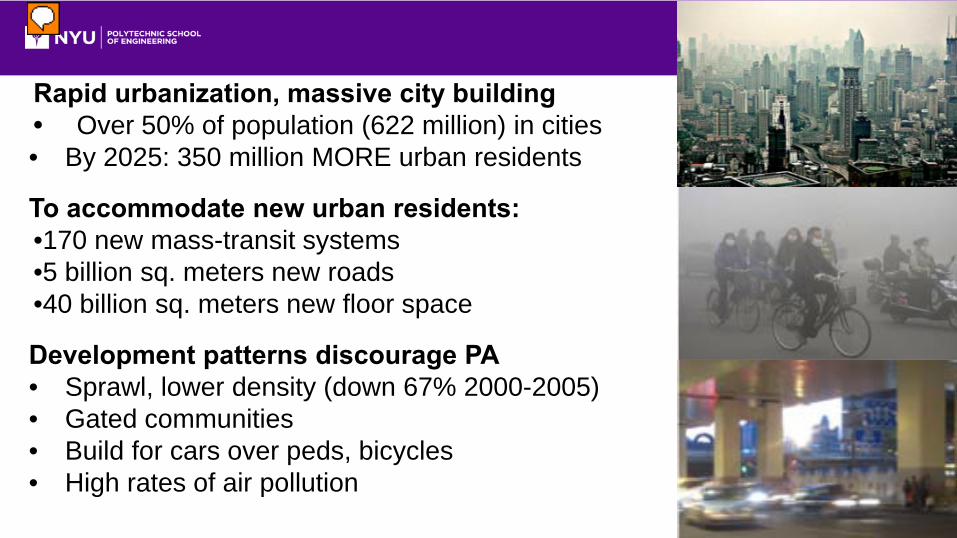
Rapid urbanization, massive city building• Over 50% of population (622 million) in cities• By 2025: 350 million MORE urban residents
To accommodate new urban residents:•170 new mass-transit systems•5 billion sq. meters new roads •40 billion sq. meters new floor space
Development patterns discourage PA• Sprawl, lower density (down 67% 2000-2005)• Gated communities• Build for cars over peds, bicycles• High rates of air pollution
4
RQ: What is the relationship between built environment features and physical activity in three Shanghai neighborhoods?
• Also collected data in 3 Hangzhou neighborhoods, analyzing now
Methods:(1) Typology of built environment features in Chinese cities tied
to physical activity• Used typology to select three neighborhoods
5
Our study
(2) Environmental audit of 3 neighborhoodsModified Irvine-Minnesota Inventory (IMI) to add features of Chinese cities = IMI-China (IMI-C)•Literature review*, interviews, observation of features of several Chinese cities
286 features: Visible air pollution, car parking on sidewalks, pedestrian tunnels, etc.Neighborhoods: 1 km area each, centered on subway station• Observed all segments in each
*Day, K., Alfonzo, M., Chen, Y., Guo, Z. & Lee, K. (2013). Overweight, obesity, and inactivity and urban design in rapidly growing Chinese cities. Health & Place, 21, 29–38.
6
Environmental audit
(3) Health survey of neighborhood residentsShortened version of 2012 China Health and Nutrition Survey
Questions: • Rates of walking, bicycling for travel and recreation; other
physical activities; health outcomes (BMI, other); demographics
Intercepted in public places outside grocery store, farmers market
Data collected on iPads by students at East China Normal University
7
Health survey
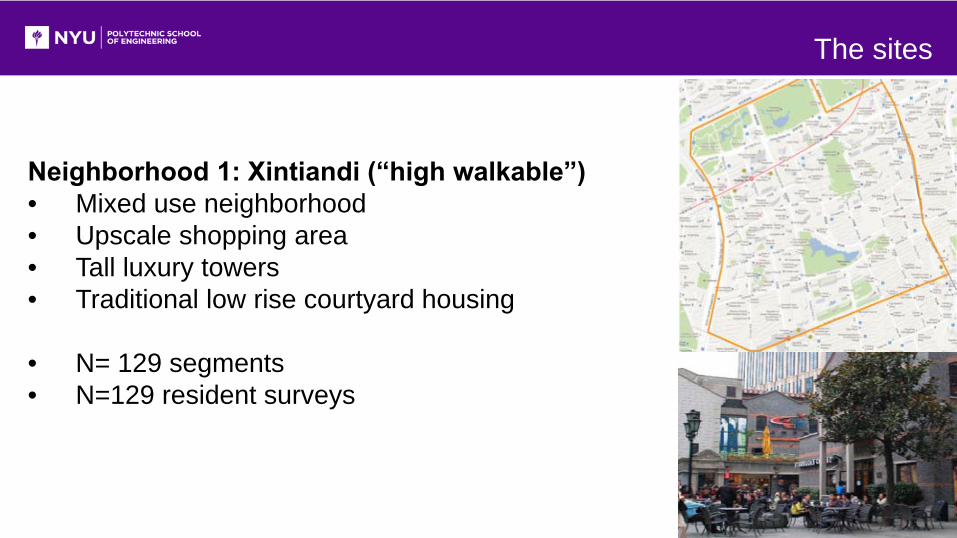
Neighborhood 1: Xintiandi (“high walkable”)• Mixed use neighborhood• Upscale shopping area• Tall luxury towers• Traditional low rise courtyard housing
• N= 129 segments• N=129 resident surveys
The sites
The sites
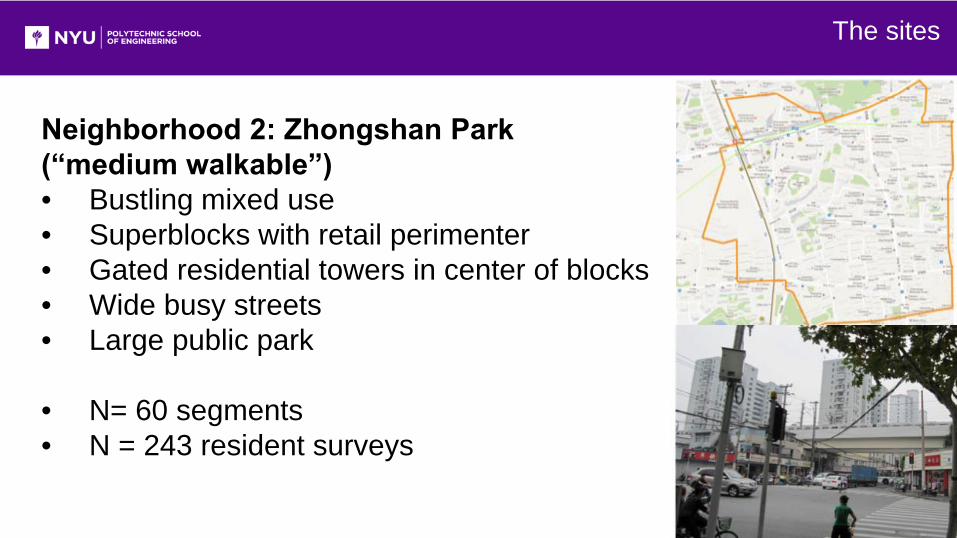
Neighborhood 2: Zhongshan Park (“medium walkable”)• Bustling mixed use• Superblocks with retail perimenter• Gated residential towers in center of blocks• Wide busy streets• Large public park
• N= 60 segments• N = 243 resident surveys
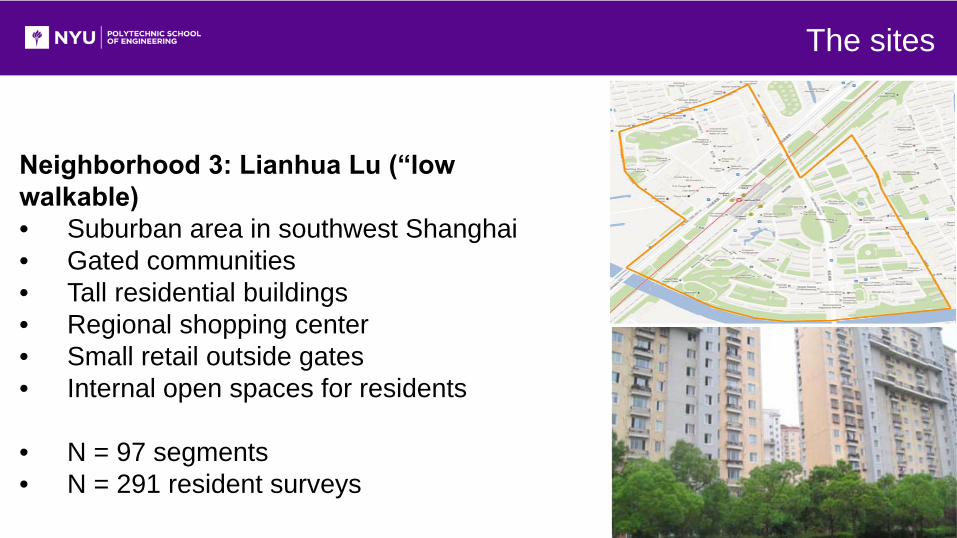
Neighborhood 3: Lianhua Lu (“low walkable)• Suburban area in southwest Shanghai• Gated communities • Tall residential buildings• Regional shopping center• Small retail outside gates• Internal open spaces for residents
• N = 97 segments• N = 291 resident surveys
The sites
Characterize built environment of three neighborhoods• Analyze environmental audit data using State of Place IndexTM
oProprietary algorithm, calculates overall “walkability” scoreo11 subscores measure urban design dimensions linked empirically
to walking, bicyclingoCalculated for each block, aggregated to neighborhoodoIndividual t-tests: do mean scores of two groups differ significantly?
Examine differences in health outcomes across neighborhoods• Descriptive analysis• Ordinary least squares (OLS) regression to examine differences in health outcomes (PA, BMI) across three neighborhoods
Analysis
11
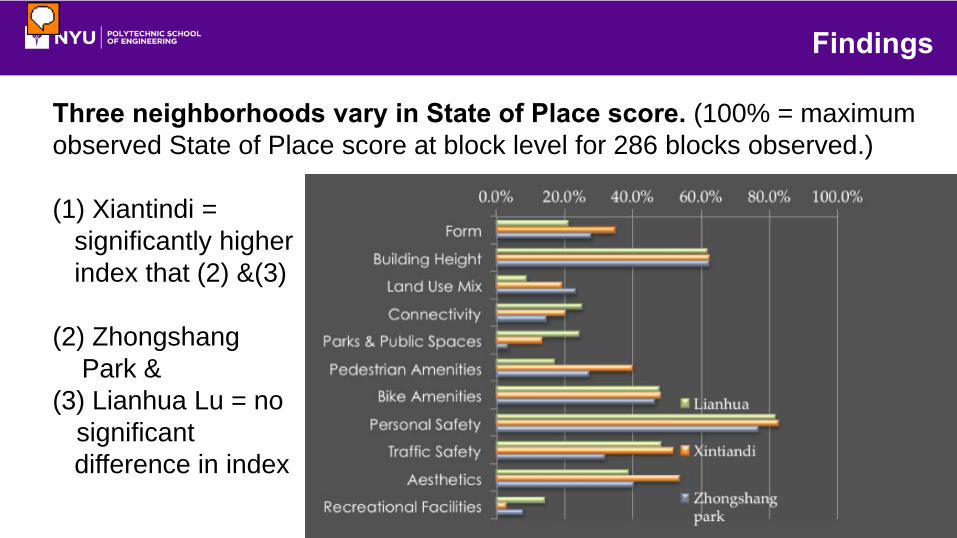
Three neighborhoods vary in State of Place score. (100% = maximum observed State of Place score at block level for 286 blocks observed.)
(1) Xiantindi =significantly higher index that (2) &(3)
(2) ZhongshangPark &
(3) Lianhua Lu = no significant difference in index
Findings
12
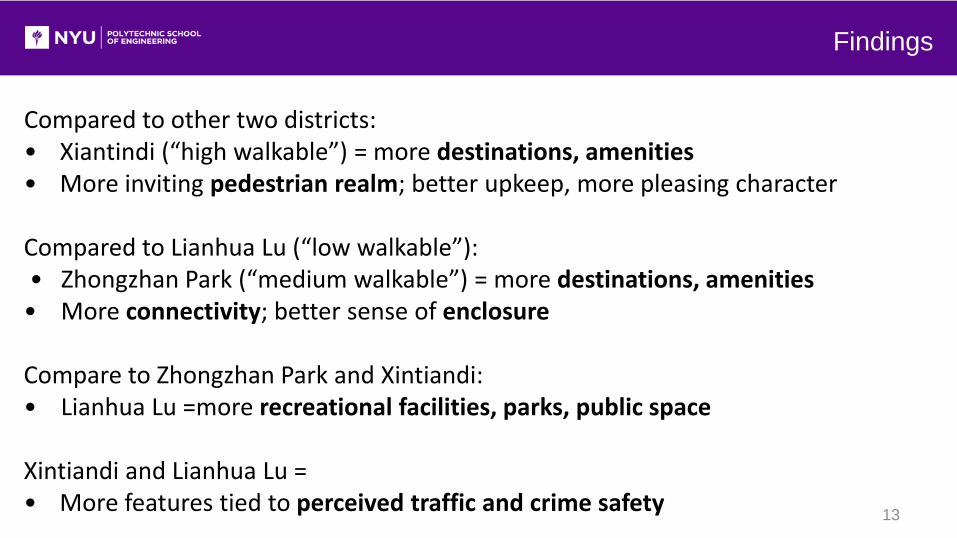
Compared to other two districts:• Xiantindi (“high walkable”) = more destinations, amenities• More inviting pedestrian realm; better upkeep, more pleasing character
Compared to Lianhua Lu (“low walkable”):• Zhongzhan Park (“medium walkable”) = more destinations, amenities• More connectivity; better sense of enclosure
Compare to Zhongzhan Park and Xintiandi:• Lianhua Lu =more recreational facilities, parks, public space
Xintiandi and Lianhua Lu = • More features tied to perceived traffic and crime safety
Findings
13
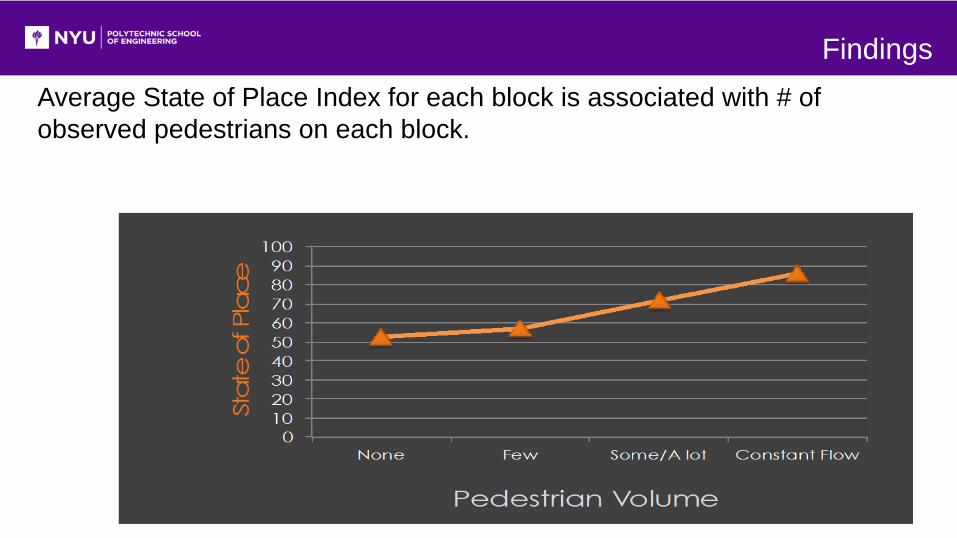
Average State of Place Index for each block is associated with # of observed pedestrians on each block.
Findings
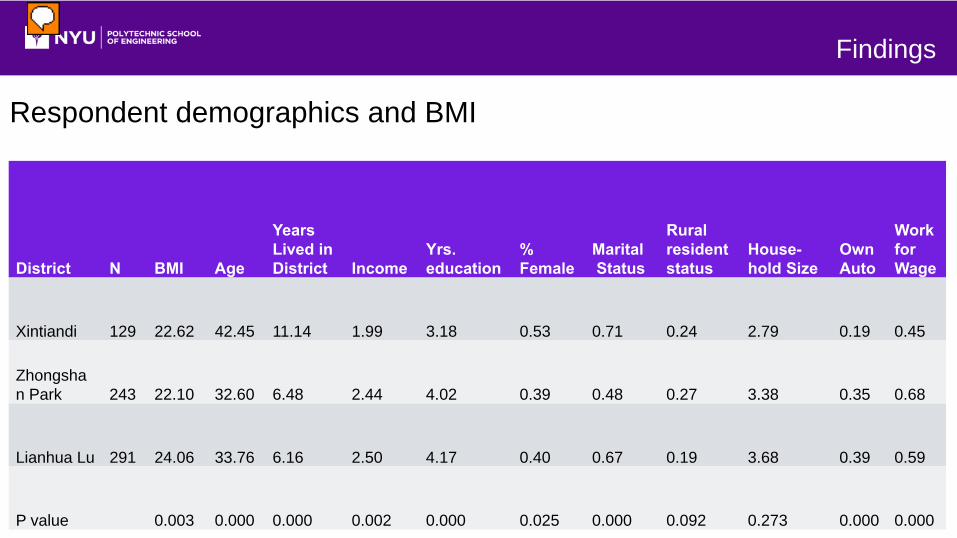
Respondent demographics and BMI
District N BMI Age
Years Lived in District Income
Yrs. education
% Female
MaritalStatus
Rural resident status
House-hold Size
Own Auto
Workfor Wage
Xintiandi 129 22.62 42.45 11.14 1.99 3.18 0.53 0.71 0.24 2.79 0.19 0.45
Zhongshan Park 243 22.10 32.60 6.48 2.44 4.02 0.39 0.48 0.27 3.38 0.35 0.68
Lianhua Lu 291 24.06 33.76 6.16 2.50 4.17 0.40 0.67 0.19 3.68 0.39 0.59
P value 0.003 0.000 0.000 0.002 0.000 0.025 0.000 0.092 0.273 0.000 0.000
Findings
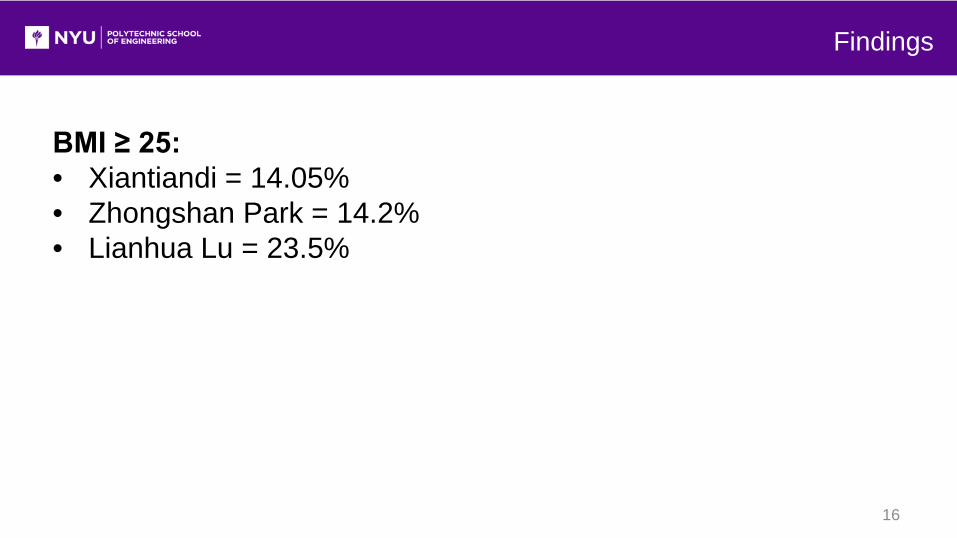
BMI ≥ 25:• Xiantiandi = 14.05%• Zhongshan Park = 14.2%• Lianhua Lu = 23.5%
Findings
16
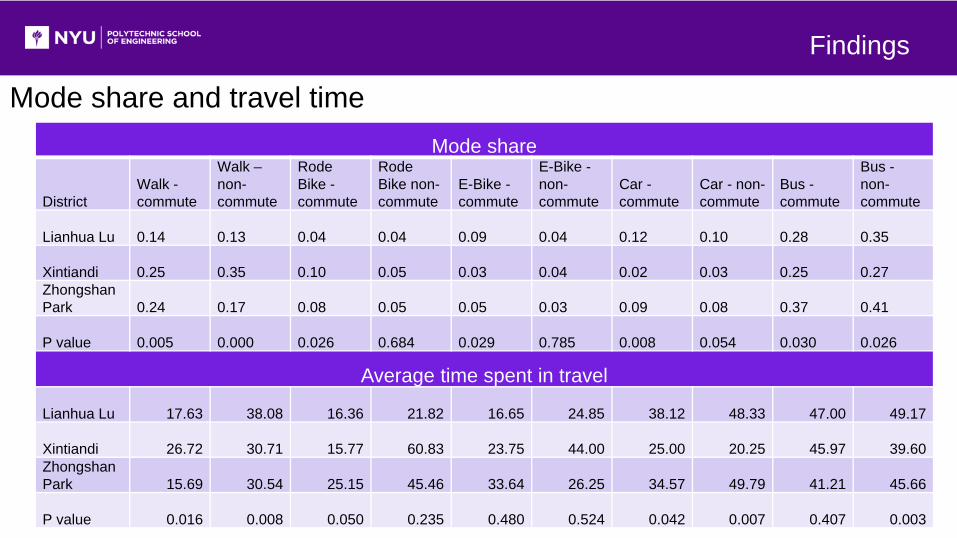
Mode share and travel timeMode share
DistrictWalk -commute
Walk –non-commute
Rode Bike -commute
Rode Bike non-commute
E-Bike -commute
E-Bike -non-commute
Car -commute
Car - non-commute
Bus -commute
Bus -non-commute
Lianhua Lu 0.14 0.13 0.04 0.04 0.09 0.04 0.12 0.10 0.28 0.35
Xintiandi 0.25 0.35 0.10 0.05 0.03 0.04 0.02 0.03 0.25 0.27Zhongshan Park 0.24 0.17 0.08 0.05 0.05 0.03 0.09 0.08 0.37 0.41
P value 0.005 0.000 0.026 0.684 0.029 0.785 0.008 0.054 0.030 0.026
Average time spent in travel
Lianhua Lu 17.63 38.08 16.36 21.82 16.65 24.85 38.12 48.33 47.00 49.17
Xintiandi 26.72 30.71 15.77 60.83 23.75 44.00 25.00 20.25 45.97 39.60Zhongshan Park 15.69 30.54 25.15 45.46 33.64 26.25 34.57 49.79 41.21 45.66
P value 0.016 0.008 0.050 0.235 0.480 0.524 0.042 0.007 0.407 0.003
Findings
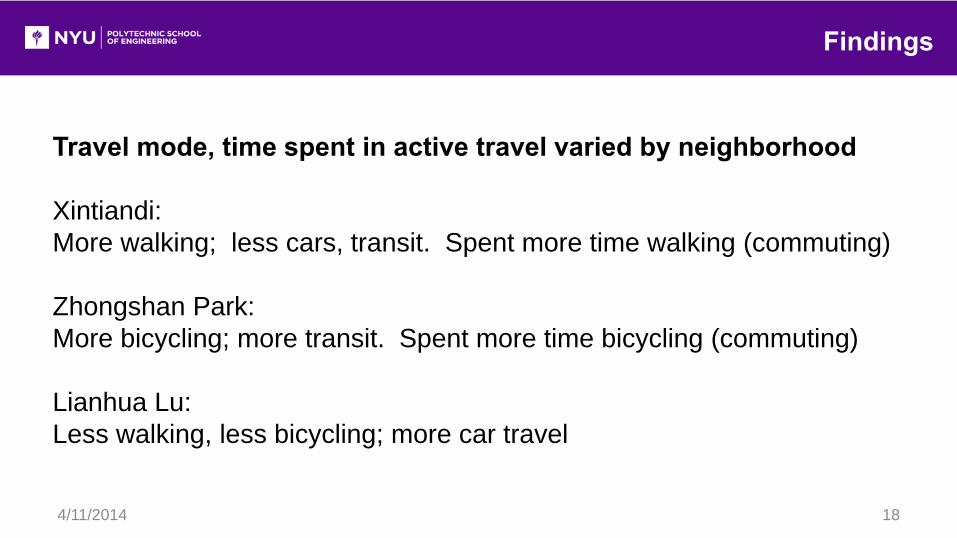
Travel mode, time spent in active travel varied by neighborhood
Xintiandi:More walking; less cars, transit. Spent more time walking (commuting)
Zhongshan Park:More bicycling; more transit. Spent more time bicycling (commuting)
Lianhua Lu:Less walking, less bicycling; more car travel
Findings
4/11/2014 18
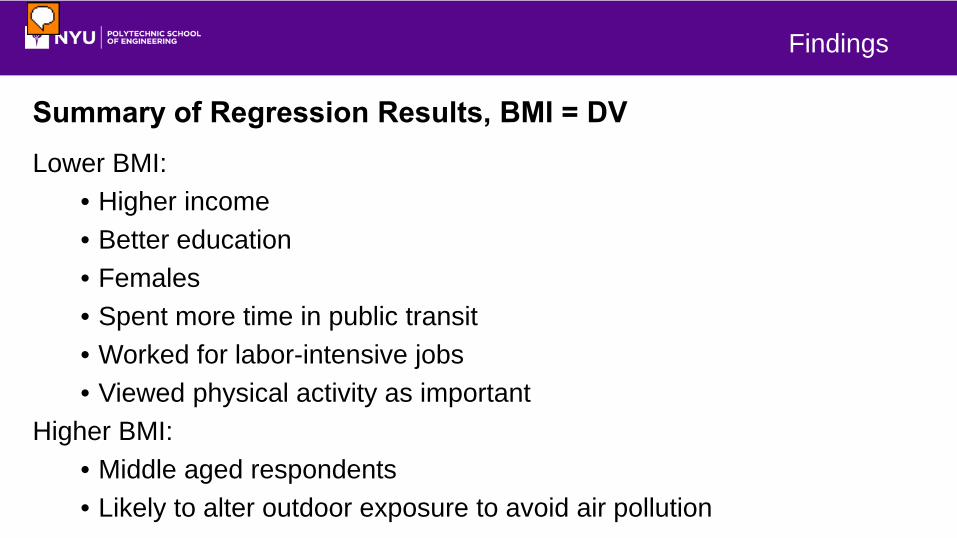
Summary of Regression Results, BMI = DVLower BMI:
• Higher income• Better education• Females• Spent more time in public transit• Worked for labor-intensive jobs• Viewed physical activity as important
Higher BMI:• Middle aged respondents• Likely to alter outdoor exposure to avoid air pollution
Findings
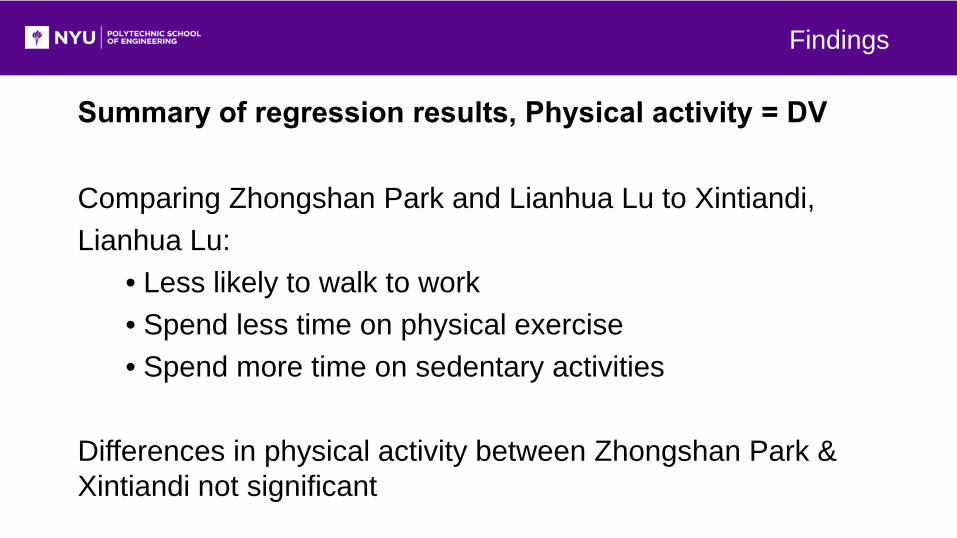
Summary of regression results, Physical activity = DV
Comparing Zhongshan Park and Lianhua Lu to Xintiandi,Lianhua Lu:
• Less likely to walk to work• Spend less time on physical exercise• Spend more time on sedentary activities
Differences in physical activity between Zhongshan Park & Xintiandi not significant
Findings
Next steps:• Are patterns the same in Hangzhou neighborhoods?• Seek support to expand to Southern China cities
Thank you to • Council on Tall Buildings and Urban Habitat• NYU Global Health Research Seed Grant program
Questions?
4/11/2014 21