Embed Size (px)
Citation preview
F-2,Block, Amity CampusSec-125, Nodia (UP)
India 201303
ASSIGNMENTSPROGRAM:SEMESTER-ISubject Name :Study COUNTRY :Permanent Enrollment Number (PEN) :Roll Number :Student Name :
INSTRUCTIONSa) Students are required to submit all three assignment sets.
ASSIGNMENT DETAILS MARKSAssignment A Five Subjective Questions 10Assignment B Three Subjective Questions + Case Study 10Assignment C 45 Objective Questions 10
b) Total weightage given to these assignments is 30%. OR 30 Marksc) All assignments are to be completed as typed in word/pdf.d) All questions are required to be attempted.e) All the three assignments are to be completed by due dates (specified
from time to time) and need to be submitted for evaluation by Amity University.
f) The evaluated assignment marks will be made available within six weeks. Thereafter, these will be destroyed at the end of each semester.
g) The students have to attached a scan signature in the form.
Signature : _________________________________Date : _________________________________
( √ ) Tick mark in front of the assignments submittedAssignment ‘A’ Assignment ‘B’ Assignment ‘C’
QUANTITATIVE APPLICATIONS IN MANAGEMENT
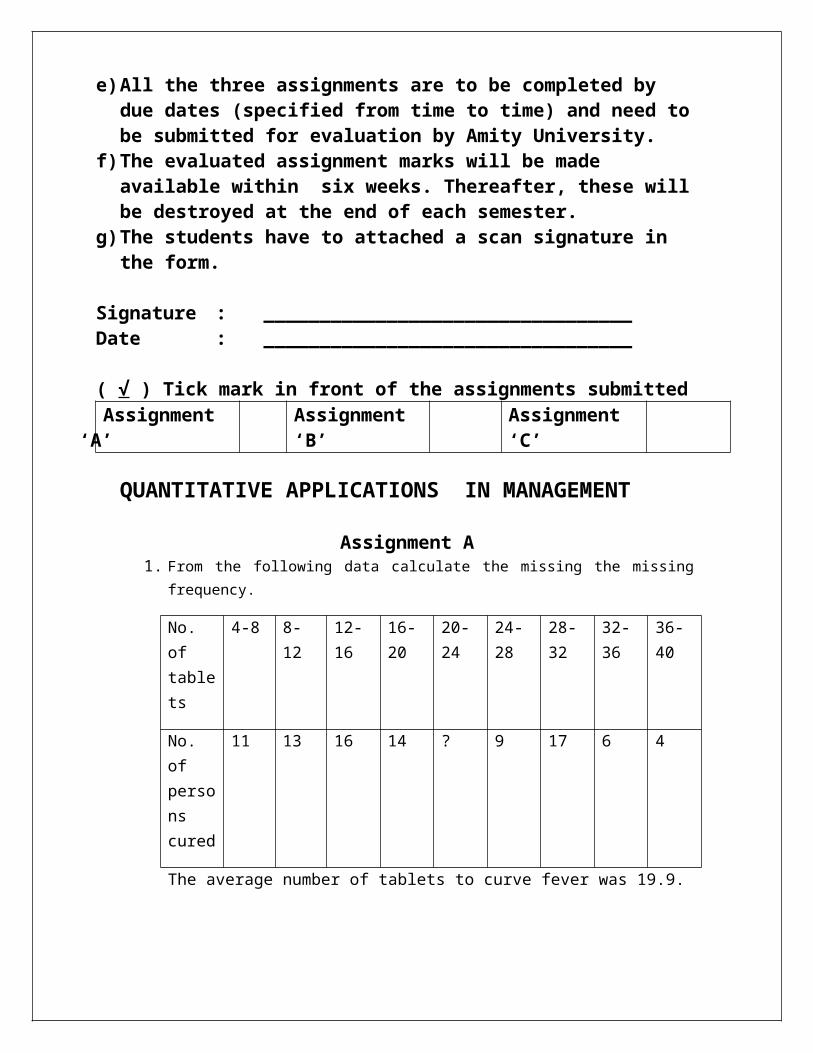
Assignment A1. From the following data calculate the missing the missing frequency.
No. of tablets
4-8 8-12 12-16 16-20 20-24 24-28 28-32 32-36 36-40
No. of persons cured
11 13 16 14 ? 9 17 6 4
The average number of tablets to curve fever was 19.9.
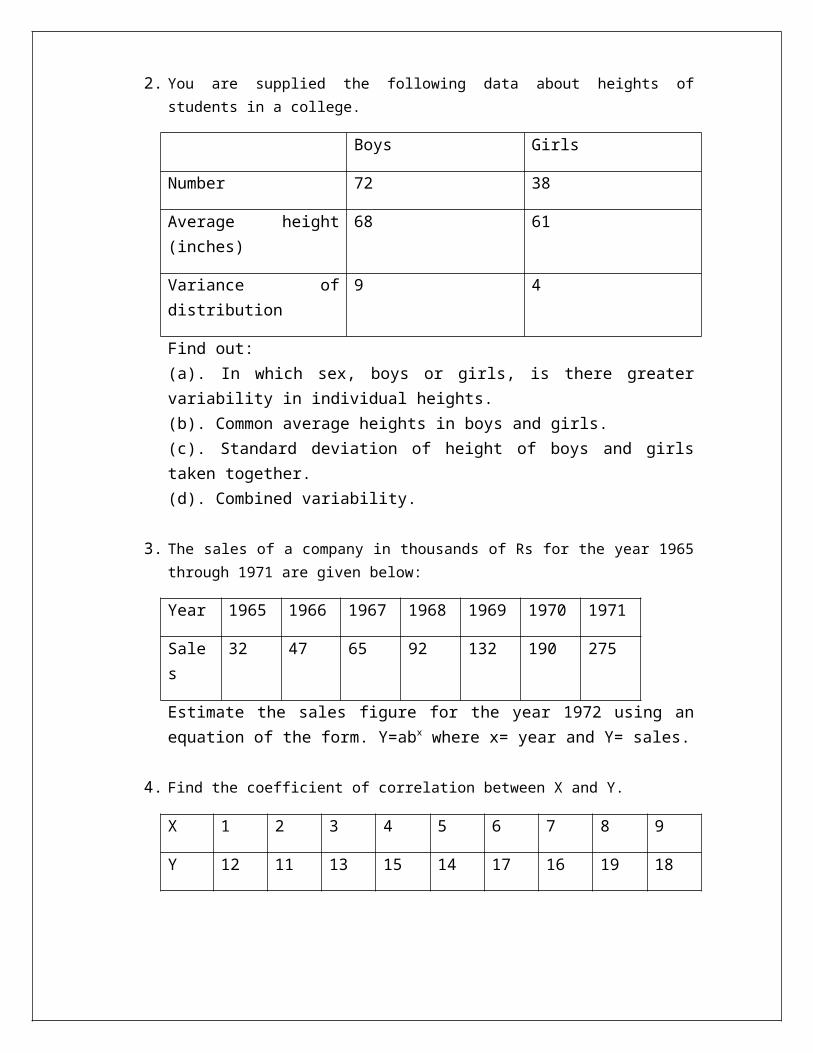
2. You are supplied the following data about heights of students in a college.
Boys Girls
Number 72 38
Average height (inches) 68 61
Variance of distribution 9 4
Find out:(a). In which sex, boys or girls, is there greater variability in individual heights.(b). Common average heights in boys and girls.(c). Standard deviation of height of boys and girls taken together.(d). Combined variability.
3. The sales of a company in thousands of Rs for the year 1965 through 1971 are given below:
Year 1965 1966 1967 1968 1969 1970 1971
Sales 32 47 65 92 132 190 275
Estimate the sales figure for the year 1972 using an equation of the form. Y=abx
where x= year and Y= sales.
4. Find the coefficient of correlation between X and Y.
X 1 2 3 4 5 6 7 8 9
Y 12 11 13 15 14 17 16 19 18
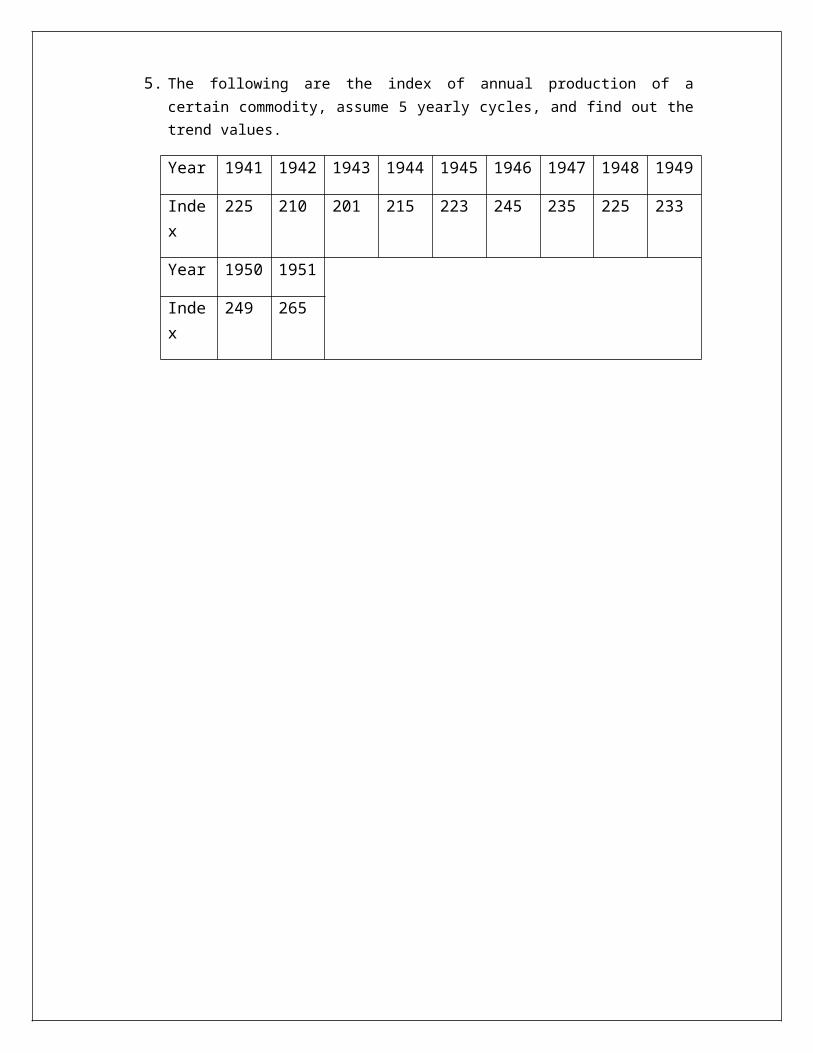
5. The following are the index of annual production of a certain commodity, assume 5 yearly cycles, and find out the trend values.
Year 1941 1942 1943 1944 1945 1946 1947 1948 1949
Index 225 210 201 215 223 245 235 225 233
Year 1950 1951
Index 249 265
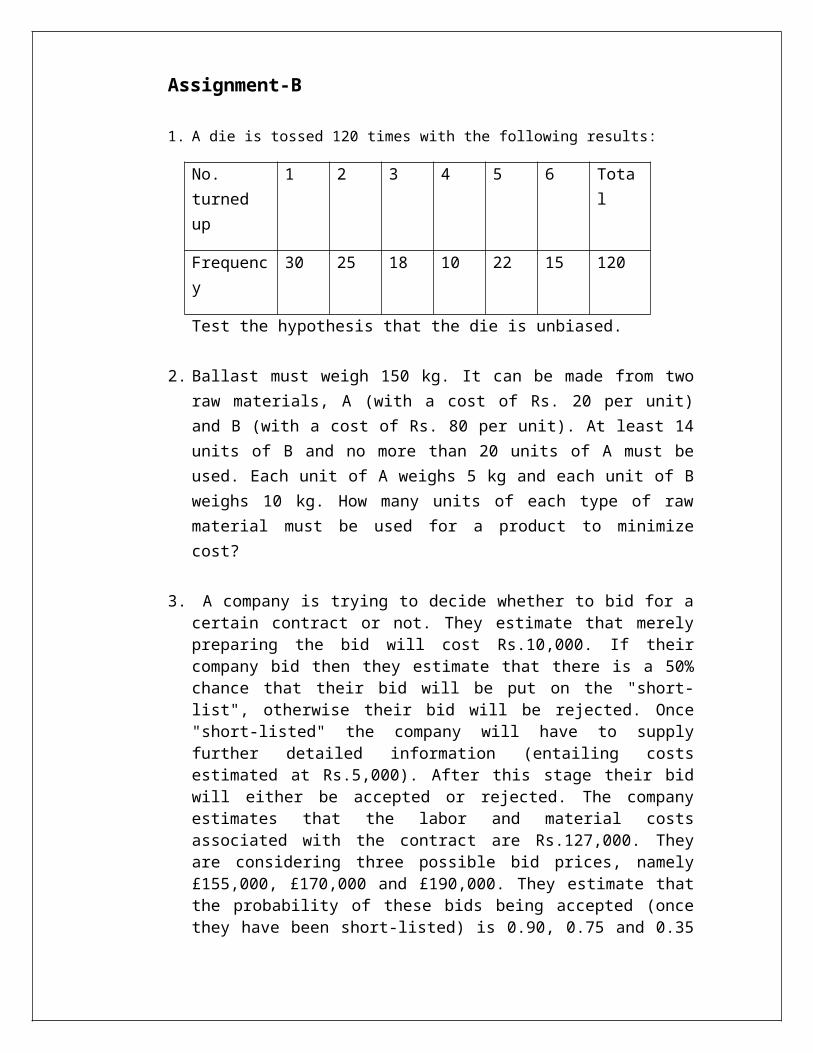
Assignment-B
1. A die is tossed 120 times with the following results:
No. turned up
1 2 3 4 5 6 Total
Frequency 30 25 18 10 22 15 120
Test the hypothesis that the die is unbiased.
2. Ballast must weigh 150 kg. It can be made from two raw materials, A (with a cost of Rs. 20 per unit) and B (with a cost of Rs. 80 per unit). At least 14 units of B and no more than 20 units of A must be used. Each unit of A weighs 5 kg and each unit of B weighs 10 kg. How many units of each type of raw material must be used for a product to minimize cost?
3. A company is trying to decide whether to bid for a certain contract or not. They estimate that merely preparing the bid will cost Rs.10,000. If their company bid then they estimate that there is a 50% chance that their bid will be put on the "short-list", otherwise their bid will be rejected. Once "short-listed" the company will have to supply further detailed information (entailing costs estimated at Rs.5,000). After this stage their bid will either be accepted or rejected. The company estimates that the labor and material costs associated with the contract are Rs.127,000. They are considering three possible bid prices, namely £155,000, £170,000 and £190,000. They estimate that the probability of these bids being accepted (once they have been short-listed) is 0.90, 0.75 and 0.35 respectively. What should the company do and what is the expected monetary value of your suggested course of action?
Case Study
The Department of Environment has theorized that pollution levels are higher in winter (I & IV Quarter) than summer (II & III Quarter) and that they are increasing over the years. The following data was collected:Quarter I II III IV1996 293 246 231 2821997 301 252 227 2911998 304 259 239 2961999 306 265 240 300a. Determine the seasonal indices and deseasonalize the data.b. Calculate the regression line that is described by this data.c. Are both the assumptions of the department of Environment correct? You may test to a significance level of 0.05.
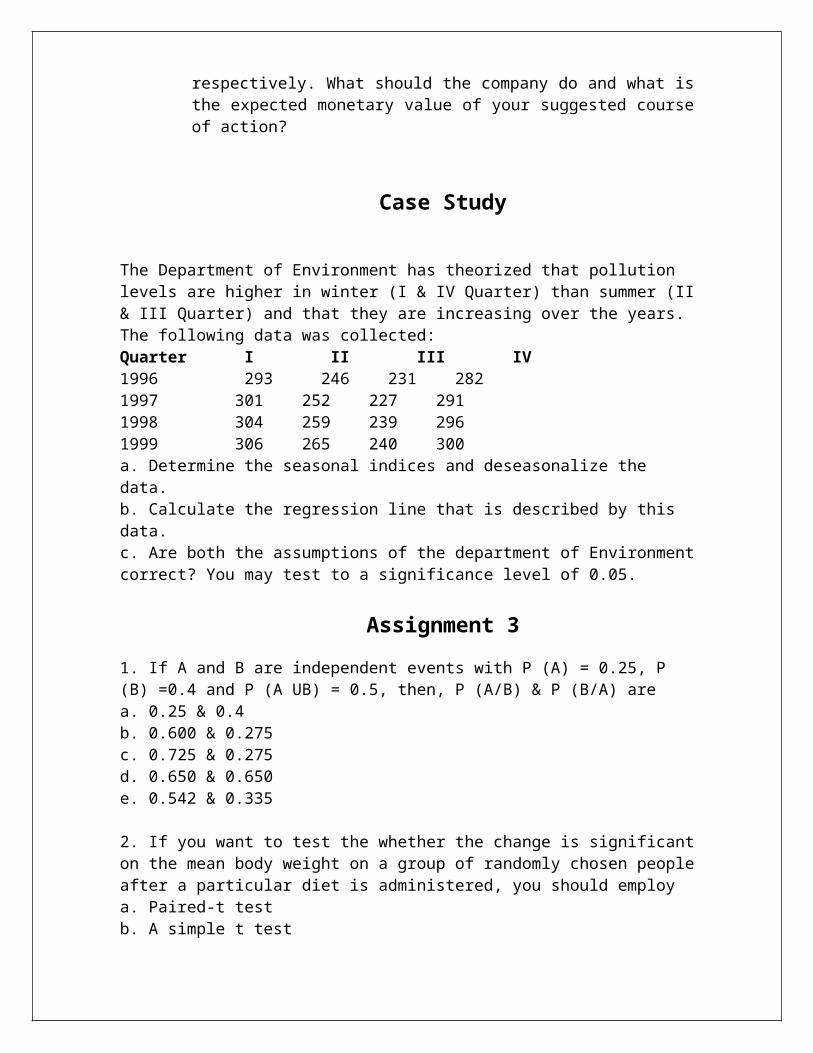
Assignment 3
1. If A and B are independent events with P (A) = 0.25, P (B) =0.4 and P (A UB) = 0.5, then, P (A/B) & P (B/A) area. 0.25 & 0.4b. 0.600 & 0.275c. 0.725 & 0.275d. 0.650 & 0.650e. 0.542 & 0.335
2. If you want to test the whether the change is significant on the mean body weight on a group of randomly chosen people after a particular diet is administered, you should employa. Paired-t testb. A simple t testc. An independent single sample t testd. An independent two sample t teste. Variance test
3. Cluster sampling isa. a non-probability sampling methodb. the same as convenience samplingc. a probability sampling methodd. Judgement samplinge. None of these alternatives is correct.
4. A LP problem has 3 decision variables and 5 constraints. How many non basic variables are there?a. 3b. 5c. 8d. 7e. 2
5. If a random variable X is distributed normally with mean 30 and variance 25, find out P(X>40)a. 0.222 0b. 0.0228c. 0.0954d. 0.0233e. 0.0919
6. A sampling method in which the population is divided into groups such that each group has a small variation with in itself and a wide variation between themselves and samples are drawn from each group is known asa. Random sampling
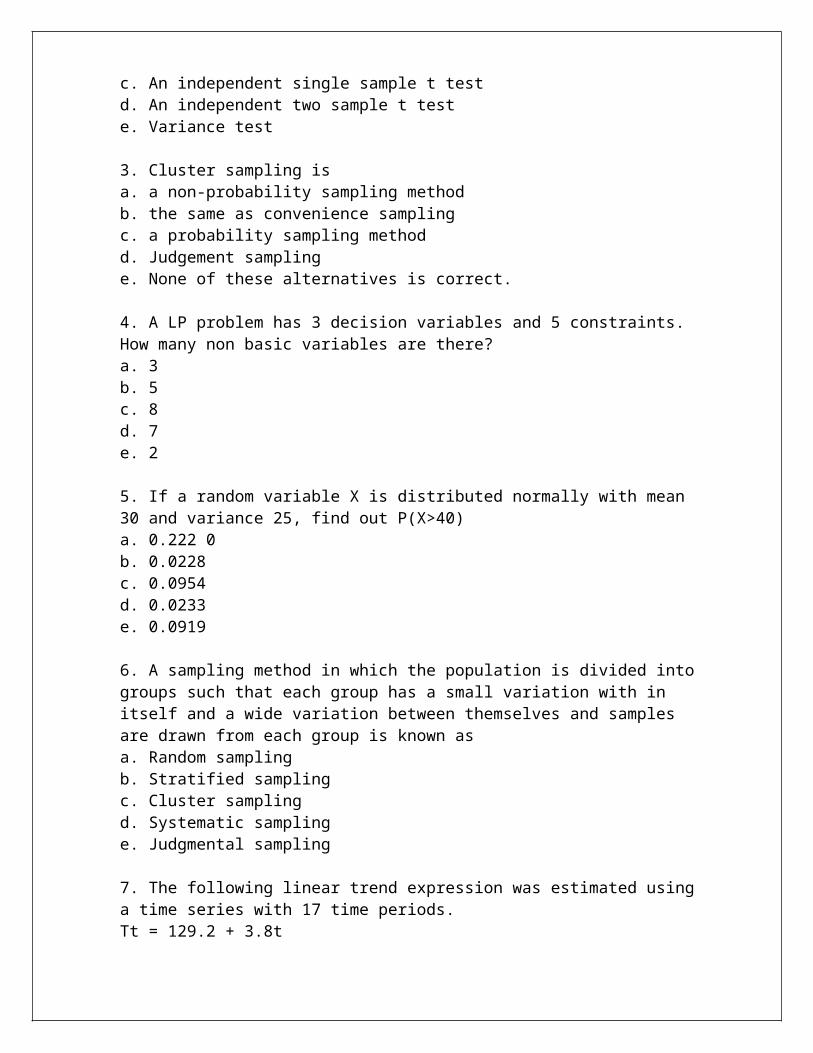
b. Stratified samplingc. Cluster samplingd. Systematic samplinge. Judgmental sampling
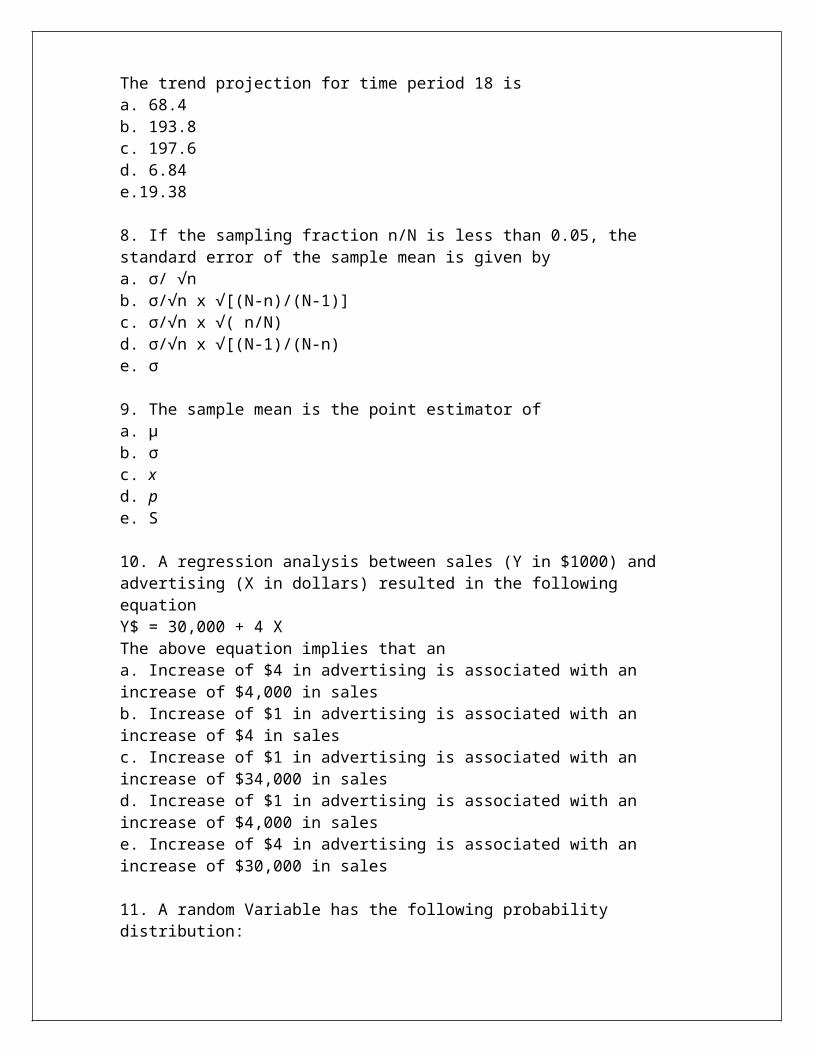
7. The following linear trend expression was estimated using a time series with 17 time periods.Tt = 129.2 + 3.8tThe trend projection for time period 18 isa. 68.4b. 193.8c. 197.6d. 6.84e.19.38
8. If the sampling fraction n/N is less than 0.05, the standard error of the sample mean is given bya. σ/ √nb. σ/√n x √[(N-n)/(N-1)]c. σ/√n x √( n/N)d. σ/√n x √[(N-1)/(N-n)e. σ
9. The sample mean is the point estimator ofa. μb. σc. xd. pe. S
10. A regression analysis between sales (Y in $1000) and advertising (X in dollars) resulted in the following equationY$ = 30,000 + 4 XThe above equation implies that an a. Increase of $4 in advertising is associated with an increase of $4,000 in salesb. Increase of $1 in advertising is associated with an increase of $4 in salesc. Increase of $1 in advertising is associated with an increase of $34,000 in salesd. Increase of $1 in advertising is associated with an increase of $4,000 in salese. Increase of $4 in advertising is associated with an increase of $30,000 in sales
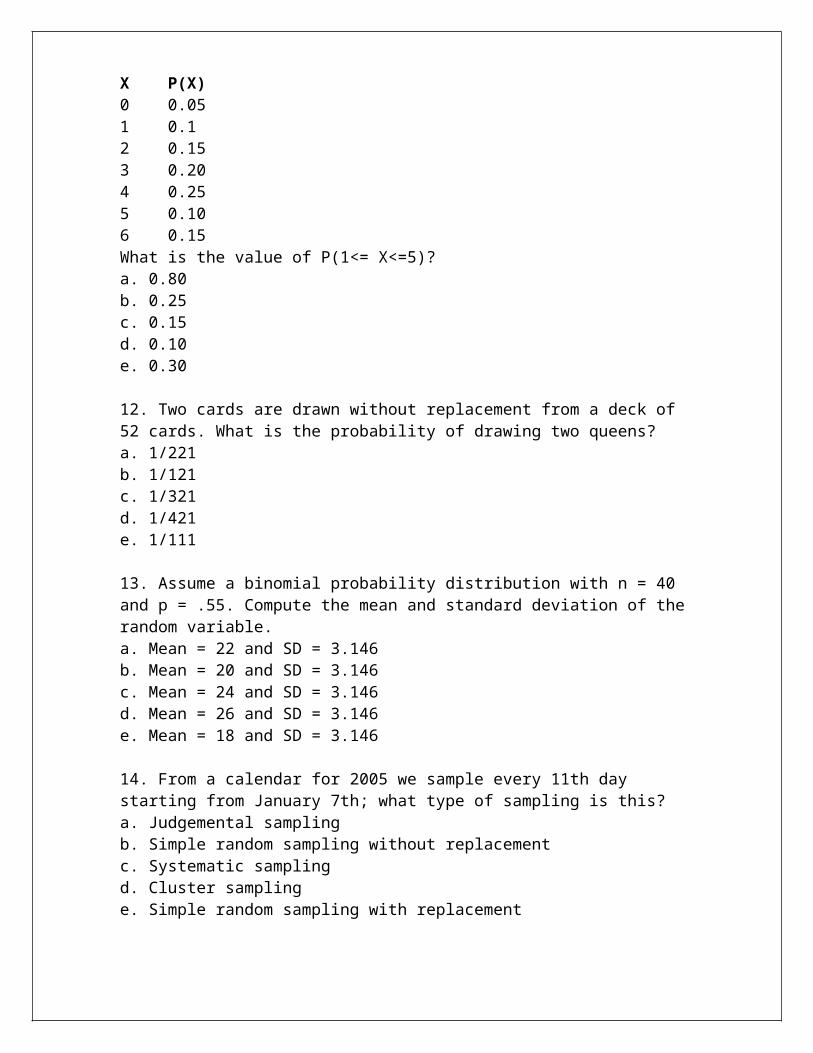
11. A random Variable has the following probability distribution:X P(X)0 0.051 0.12 0.153 0.204 0.255 0.10
6 0.15What is the value of P(1<= X<=5)?a. 0.80b. 0.25c. 0.15d. 0.10e. 0.30
12. Two cards are drawn without replacement from a deck of 52 cards. What is the probability of drawing two queens?a. 1/221b. 1/121c. 1/321d. 1/421e. 1/111
13. Assume a binomial probability distribution with n = 40 and p = .55. Compute the mean and standard deviation of the random variable.a. Mean = 22 and SD = 3.146b. Mean = 20 and SD = 3.146c. Mean = 24 and SD = 3.146d. Mean = 26 and SD = 3.146e. Mean = 18 and SD = 3.146
14. From a calendar for 2005 we sample every 11th day starting from January 7th; what type of sampling is this?a. Judgemental samplingb. Simple random sampling without replacementc. Systematic samplingd. Cluster samplinge. Simple random sampling with replacement
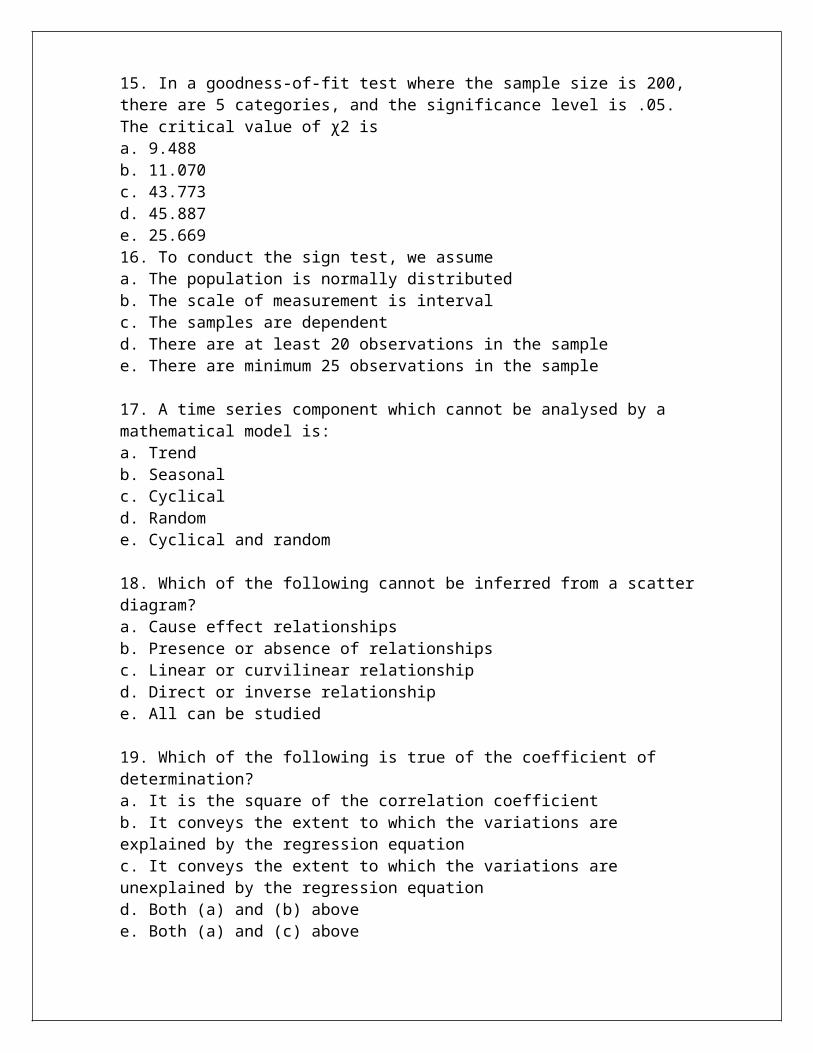
15. In a goodness-of-fit test where the sample size is 200, there are 5 categories, and the significance level is .05. The critical value of χ2 isa. 9.488b. 11.070c. 43.773d. 45.887e. 25.66916. To conduct the sign test, we assumea. The population is normally distributedb. The scale of measurement is intervalc. The samples are dependentd. There are at least 20 observations in the samplee. There are minimum 25 observations in the sample
17. A time series component which cannot be analysed by a mathematical model is:a. Trend
b. Seasonalc. Cyclicald. Randome. Cyclical and random
18. Which of the following cannot be inferred from a scatter diagram?a. Cause effect relationshipsb. Presence or absence of relationshipsc. Linear or curvilinear relationshipd. Direct or inverse relationshipe. All can be studied
19. Which of the following is true of the coefficient of determination?a. It is the square of the correlation coefficientb. It conveys the extent to which the variations are explained by the regression equationc. It conveys the extent to which the variations are unexplained by the regression equationd. Both (a) and (b) abovee. Both (a) and (c) above
20. When formulating Transportation LP problems, constraints usually deal with:a. The number of items to be transportedb. The shipping costs associated with transporting goodsc. The distance goods are to be transportedd. The number of origins and destinationse. The capacities of origins and requirements of destinations
21. If the coefficient of correlation between two variables X and Y is equal to one, then there isa. No relationship between variables X and Yb. A perfect positive linear relationship between variables X and Yc. A perfect negative linear relationship between variables X and Yd. A cause and affect relation exists between X and Ye. A weak association between variables X and Y
22. An inventor claims that her new petrol additive will drastically enhance the mileage of the petrol powered cars. Currently, the vehicle runs as average mileage 15 km for one litre of petrol. The appropriate null and alternative hypotheses in evaluating her claim will be (in the order of H0 and Ha)a. X=15, X > 15b. X = 15, X < 15,c. X > 15, X =15d. X =15, X = 15,e. X= 15, X = < 15
23. After deseasonalisation, a time series can be represented asa. Y = S x C x Ib. Y = T x S x C x I
c. Y = T x C x Id. Y = T x S x Ie. Y = T X S X C
24. If one regression coefficient is greater than unity then the other must be:a. Greater than the first oneb. Equal to unityc. Less than unityd. Equal to zeroe. Less than the first one
25. Which of the following statements is false?a. In a proper random sampling, every element of the population has a known (and often equal) chance of being selectedb. The precision of a sample mean or sample proportion depends only upon the sample size (and not the population size) in a proper random samplec. Convenience sampling often leads to biases in estimates since the sample is often not representative of the populationd. If a sample of 1000000 families is randomly selected from all of Kota (with about 8000000 families) and the average family income is computed, then the true value of the family income for all families in Kota is knowne. None of the above
26. For two variables x and y to be independent of each other which of the following must be truea. σx= σy
b. σ 2x = σ 2
y
c. Cov (x, y) = 0d.
e. E(x) = E(y)
27.Which of the following is a true measure of regret?a. Maximum possible profits – realized profitsb. Maximum of minimum profits – minimum of minimum profitsc. Maximum possible profits – foregone profitsd. Maximum of maximum profits – maximum of minimum profitse. Maximum possible profits – minimum of maximum profits.
28. A sample of 15 is drawn from a population size of 100. The finite population correction factor is a. 0.150b. 0.184c. 0.523
d. 0.834e. 0.9266
29. Which of the following represents repetitive and predictable movements around the trend line within a time period of one year or less?a. Secular trendb. Cyclical fluctuationc. Seasonal variationd. Irregular variatione. Temporary variation.
30. Which of the following is true with respect to the method of least squares?a. Sum of the squared values of the horizontal distances from the regression line to
the y-axis and the corresponding points of the dependent variable is minimizedb. Sum of the squared values of the vertical distances from the regression line to
the x-axis and the corresponding points of the independent variable is minimized
c. Sum of the squared values of the horizontal distance from each plotted point based on the observations to the regression line is minimized
d. Sum of the squared values of the vertical distance from each plotted point to the regression line is minimized
e. None of the above.
31. The probability that an observation, following a normal distribution, will lie within μ ± 1.3σ is a. 9.5 %b. 19.0%c. 40.3%d. 50.0%e. 80.6%
32. Arrivals of customers at an ATMs follow the Poisson distribution. The average arrivals per hour is 6. The probability of exact 6 arrivals in an hour isa. 1.00b. 0.50c. 0.25d. 0.16e. 0.10
33. If a random sample of size 15 is selected from a symmetrical population with a unique mode, the degrees of freedom of the observation is a. 14
b. 15c. 16d. 17e. 18
34. In regression analysis, ___________ represents how much each unit change of the independent variable changes the dependent variable.a. Slope b. Y – intercept c. Standard error of estimated. Dependent variable e. Coefficient of correlation
35. If two variables X and Y are perfectly positively correlated and their standard deviations are 5 and 10 respectively, then the covariance is a. 0.40b. 0.50c. 2.00d. 4.00e. 50.00
36. The sample proportion of ripe mangoes in a large consignment is 0.7. If the upper limit of a confidence interval for the proportion of ripe mangoes in the lot is 0.86, the lower limit is:
a. 0.64b. 0.54c. Depends on the confidence leveld. Depends on the sample sizee. Both (c) and (d) above
37. A contingency table for two attributes consists of 24 cells. The number of degrees of freedom for the chi square test statistic is:
a. Depends on the number of rows and columnsb. 24c. 23d. 14e. 15
38. Which of the following statements are true?
b. When the percent of trend is below 100, the relative cyclical trend is negative and conversely
c. When the percent of trend is below 100, the relative cyclical trend is positive and conversely
d. When the percent of trend is below 100, the relative cyclical trend is negative but not conversely
e. When the percent of trend is below 100, the relative cyclical trend is positive but not conversely
f. The two measures have to be considered independently
39. Which of the following is not true of random variations?a. They can be identified
b. It cannot be explained mathematicallyc. They occur in a random mannerd. They cannot be easily predictede. All are true
40. The loss from stocking a unit of a product not sold is Rs.30 while the profit from selling a unit of that product is Rs.50. The minimum probability of selling an extra unit that will justify stocking it is:a. 3/5b. 2/5c. 3/8d. 2/8e. 3/4