Embed Size (px)
DESCRIPTION
ACCOUNTS
Citation preview
EXECUTIVE SUMMARY
Tan Sri Dr Ahmad Tajuddin Ali
(Non-Independent Non-Executive Chairman)
Dato’ Wan Abdullah Wan Ibrahim
(Managing Director/Chief Executive Officer)
Dato’ Izzaddin Idris
(Non-Independent Non-Executive Director)
Md Ali Md Dewal
(Senior Independent Non-Executive Director)
Oh Kim Sun
(Independent Non-Executive Director)
Sheranjiv Sammanthan
(Non-Independent Non-Executive Director)
Professor Philip Sutton Cox
(Independent Non-Executive Director)
Lim Tian Huat
(Independent Non-Executive Director)
Dato’ Srikandan Kanagainthiram
(Independent Non-Executive Director)
YM Ungku Suseelawati Ungku Omar
(Independent Non-Executive Director)
1 | P a g e
EXECUTIVE SUMMARY
Y. Bhg. Tan Sri Dato’ Ir. (Dr) Wan Abdul
Rahman Bin Wan Yaacob
(Independent Non-Executive Chairman)
Y. Bhg. Tan Sri Dato’
Tan Boon Seng @ Krishnan
(Executive Deputy Chairman)
Y. Bhg. Dato’ Teh Kean Ming
(Chief Executive Officer & Managing Director)
Tan Gim Foo
(Deputy Chief Executive Officer &
Deputy Managing Director)
Y. Bhg. Datuk Yahya Bin Ya’ acob
(Senior Independent Non-Executive Director)
Y.Bhg. Tan Sri Abdul Halim Bin Ali
(Independent Non-Executive Director)
Y.Bhg. Datuk Oh Chong Peng
(Independent Non- Executive Director)
Y.Bhg. Datuk Hj Hasni Bin Harun
(Non-Executive Director)
2 | P a g e

UEM Land Berhad or now known as UEM Sunrise Berhad is a public company listed on
the Main Market of Bursa Malaysia Securities Berhad. It is the flagship Company for real estate
investment and property development businesses of UEM Group Berhad and Khazanah Nasional
Berhad which is an inversment holding arm of the Malaysia government. UEM Group is a whole
owned subsidiary by Khazanah, as a solid foundation.
As stated, UEM Sunrise Berhad which is the flagship for real estate and property
development has core competencies in macro township development, high-rise residential,
commercial, retail and integrated developments, as well as property management and project &
construction services. Making real estate and property development kind of field as the main
business of UEM Sunrise Berhad.
The Company, the master developer of Nusajaya is currently undertaking the
development of Nusajaya, one of the five flagship zones of Iskandar Malaysia, Johor into
Southeast Asia’s newest regional city. Upon completion, it will be the largest fully integrated
urban development in Southeast Asia that will provide significant investment, financial and
business opportunities to economic growth and development in the region. As being said out, the
development not only gave an impact to the company but also the surrounding of its activities
will received a huge positive impact upon the development itself.
Embracing innovation and technology, Nusajaya will be a role model of an economically,
socially and environmentally sustainable city for Southeast Asia. By doing so, other companies
can make this as a marking site on achieving greater success. With its modern infrastructure and
cutting edge architectural masterplan, the expected local and foreign investment inflows into
Nusajaya will propel economic growth and transform south Johor into an exciting centre of
economic development. This will be an historical moment where the development will make
south Johor into a place never think of.
3 | P a g e

Nusajaya spans close to 24,000 acres, with approximately 7,600 acres currently owned by
UEM Sunrise and at various stages of development. Nusajaya comprises a range of catalytic
developments including Kota Iskandar, the Johor State administrative centre which houses State
and Federal Government offices and others which development will be comprising mixed,
commercial projects with activity malls, campus offices, trade centres and residential
developments. Together with a mix of residential, commercial and industrial properties, hotels,
resorts and many other amenities, Nusajaya will emerge as a vibrant and dynamic destination
offering holistic and integrated lifestyle, with immense potential growth for investors. The
corporation is indeed making an income while pleasing the one’s connected.
Gerbang Nusajaya, the second phase development of Nusajaya is a 4,551 acre project
which will feature various catalytic developments including Nusajaya Tech Park, Motorsports
City, Signature Residences and Gerbang Nusantara. Gerbang Nusajaya will be developed over a
period of 25 years and will include components such as lifestyle & retail parks, campus offices &
industrial parks as well as residential precincts. Showing that the corporation can handle a long
term and huge project that will generate the income.
In the Central Region, UEM Sunrise is renowned for its award-winning, up-market high
rise residential projects as well as commercial developments largely in the Mont’Kiara enclave,
including 28 Mont’Kiara, Arcoris Mont’Kiara and Residensi22. It is also responsible for
introducing the concept of creative retail in Solaris Dutamas known as Publika. It is shown that
the corporation itself not only been active in business within the south region but also within the
central. On top of that handling a big project more than one at a time.
UEM Sunrise is also the owner of 98 acres of freehold site adjacent to the Central
Business District of Cyberjaya where Symphony Hills, an exclusive residential development and
the Country’s first Connected Intelligent Community resides, offering smart-home features and
community connectivity through high-speed broadband. UEM Sunrise has achieved a greater
concept of developing using the technology presently developed.
UEM Sunrise presence extends internationally into Vancouver, Canada via its mixed-use
development, Quintet and Aurora Melbourne Central in Melbourne, Australia. It also oversees
the sales and marketing of Khazanah and Temasek’s Marina One and DUO mixed-use
developments in Singapore. UEM Sunrise retains a landbank in Durban, South Africa.
4 | P a g e

IJM is one of Malaysia's leading conglomerates corporation ever established and is listed
on the Main Market of Bursa Malaysia Securities Berhad. Its core business activities are not sole
and encompass construction, property development, manufacturing and quarrying, infrastructure
concessions and plantations. Having a wide field of business showing the high generative income
obtain by the company which is why it IJM Corporation Berhad is listed on the Main Market of
Bursa Malaysia Securities Berhad.
Headquartered is located in Selangor, Malaysia, where the place itself is a strategic venue
which is one of the main core business state in Malaysia. IJM's regional aspirations have seen it
establish a growing presence in neighbouring developing markets with operations presently
spanning 10 countries, with primary focus in Malaysia, India, United Arab Emirates, China and
Indonesia. Going worldwide also expanding and fully utilize IJM Corporation Berhad on going
futher. IJM's phenomenal growth over the past three decades has been the result of its
unwavering focus on its core competencies, diversification into strategically related businesses
and selective expansion into new markets. While standing firm on the top, IJM Corporation
Berhad still aim to go higher in achieving their organizational goals.
Initially supporting in house needs, the Group's Industry Division quickly grew its operations
into scalable core activities focused on catering to demand from outside the Group. This was the
step on IJM expanding its business field. IJM continued to expand on its operations in this
division with strategic acquisitions such as the takeover of Industrial Concrete Products Berhad
in 2004 and successful market diversifications into China, India and Pakistan was a huge stone
step for IJM Corporation Berhad in standing where it is right now.
In April 2007, IJM acquired the Road Builder Group, its nearest competitor, to augment
its position as one of the country’s biggest builders. Making it to stand firm as one of the best
leading corporation in Malaysia. In addition to bolstering its construction order book, property
land bank and infrastructure portfolio, the enlarged Group enabled IJM to attain considerable
synergistic benefits, greater local prominence as well as attain a more sizeable balance sheet to
bid for larger jobs and facilitate its expansion into overseas markets. By doing so, the business of
5 | P a g e
IJM Corporation have extended to a whole new level where the corporation became larger and
achieving more business activities and projects throughout the years.
Leveraging on its construction expertise, the Group also owns and operates infrastructure
concessions to create long-term recurrent income streams. Initial advancements into concession
assets in Malaysia, however, proved elusive and, thus, an international focus was adopted. IJM's
involvement in overseas infrastructure privatisation schemes met with considerable success.
Amongst the corporation’s present investments in major overseas infrastructure projects are the
Western Access Tollway in Argentina, five tolled highways and the Gautami power plant in
India, and the Binh An water treatment concession in Vietnam. In Malaysia, the group owns and
operates three highways and port concessions from the RBH merger. IJM had previously
invested in and profitably sold several infrastructure assets in China. Making a stream of income
into IJM Corporation Berhad as an income that will always generate.
IJM's undertaking as a property developer began as a natural progression from its
experience in the construction business. The Group's property arm has since grown considerably.
IJM Land Berhad is one of the largest property developers in Malaysia with sprawling
townships, commercial buildings and high rise condominiums under development in key growth
areas throughout the country. Besides establishing itself as a reputable township developer in
India, IJM had also successfully undertaken ventures overseas in the past such as in Orlando
USA, Singapore and Australia. As stated showing that IJM also aim its business not only in
Malaysia but also in the foreign countries.
The Group also ventured into oil palm plantations in 1985 as a source of steady income to
cushion the cyclical nature of its core construction business. Where at that time the currency rate
of oil palm is high and demanding. This investment has since paid off handsomely towards the
corporation. Now listed on the Main Market of Bursa Securities, IJM Plantations Berhad has
contributed significantly to the Group's earnings over the years and has also accorded the Group
better resilience to weather macro-economic and input costs volatilities. Showing that the
Corporation itself is ready to dominate the oil palm plantation. It is currently expanding its
plantation operations throughout Indonesia in expanding the oil palm plantation business.
6 | P a g e
SUMMARY OF ANNUAL REPORT
Based on the income statement as 31st December, the operating revenue for 2010 is
RM471136000 while in 2011 is RM1703172000 and in 2012 is RM 1939676000. The highest
revenue for this company is in 2012 compare to the 2011 and 2010. The lowest revenue is in
2010 with RM 471136000, so this indicates that the company has improve its profitability by
increasing its sales revenue year by year.
Besides, the net profit for the year 2010 is RM 195537000, for 2011 is RM 302942000
and in 2012 is RM 447863000. As you can clearly see that in the year 2012 its net profit is
higher than both year which is 2011 and 2010. The highest is in 2012 with RM 447863000 and
the lowest is in 2010 with RM 195537000. This means that UEM Land increased their profit by
increasing its sales revenue in 2012 more than in 2011 and 2010.
Based on the Balance sheet as at 31st December, the total current assets in year 2010 is
RM 1782609000, in year 2011 is RM 3115162000 and in year 2012 is RM 4083978000. As you
can see the highest total assets is in year 2012 compare to 2011 and 2010. Between 2011 and
2010, the higher total assets is in 2011. In the year 2010, it has the lowest total assets than both
2011 and 2012. This show that this company has a good liquidity or which they can turned assets
into cash easily. Moreover, the non-current assets for UEM Land for the year 2010 is RM
2188524000 while in 2011 is RM4678595000 and in 2012 is RM5002507000. In 2012 the
company has higher non-current assets than in 2010 and 2011. The lowest non-current assets is
in 2010 with 2188524000, meaning UEM Land allocates the cost of the assets in 2012 is more
than 2011 and 2010 for which the assets will be used.
The non-current liability for 2010 is RM 569319000 and in year 2011 is RM 1772359000
whereas in 2012 is RM 1739978000. The lowest non-current liability is in 2010 with RM
569319000. The highest is in 2012 compare to both year in 2011 and 2010. These liabilities
7 | P a g e
represent in 2012 the money company owes is more than in 2011 and 2010. Furthermore, the
current liabilities in 2010 for UEM Land is RM 259864000, but in 2011 is RM 724785000 also
in 2012 is RM 1529472000. Hence, the highest current liabilities is in 2012 compared in 2011
and 2010. As for the lowest is in 2010. This shows that this company has grown in debt from
year to year.
8 | P a g e
SUMMARY OF ANNUAL REPORT
IJM Corporation which is one of the top corporation must have solid and stable foundation in
which they must up hold to. One of the few important prospect is net income of the firm itself.
For a big company as IJM Corporation, its net income had its ups and downs, where on 2010 its
net income had soar to 446 million. Where in the upcoming year which is 2011, the corporation’s
net income had fall back a little but went back up in the year of 2012. It can be seen that there’s a
fall of the net income in 2011 may due to the ineffectiveness and utilization of resource might be
not enough. The increased of the net income can be seen where from 304 million to 409 million
where there is an increase of 34.35% in its income growth between 2011 and 2012.
Other than that, revenue is a must watch figure in evaluating a company. As known
that revenue is corresponding with neither income nor profit, the graft line of the revenue is also
slightly the same. As stated, on 2010 the revenue of IJM Corporation Berhad had a revenue
worth of 4013 million where in 2011 the revenue of the firm had slightly decreased to 3721
million. But in the year of 2012, the corporation had stand tall again and made a revenue with the
amount of 4518 million. As well as the net income previously stated, the revenue is quite the
same where the revenue itself is align with the net income.
IJM Corporation a lot of assets which make it one if the stand tall firm in Malaysia.
The assets they had will always be used to generate more income for the upcoming future ahead.
The corporation itself own a sum of 12557 million of total asset in the year of 2010. The asset
had slightly went down the next upcoming year with the figure of 12554 million, showing that
there was an ineffective way in utilizing the assets. Following the next year which is 2012, the
total assets had rose up with a figure worth of 13891 million where it can be seen the way of the
corporation doing its activities do gave a positive return on them.
In summarizing the financial data of a company, the liabilities is an important thing to
be look into. Basically liabilities is known as the loan of a company or one would say liability
but in business activities, the higher the liability, the more business activities the company own.
9 | P a g e
Making it seem as a high and active firm. On the year of 2010, the corporation have a liability
that reached 5596 million where it had slightly increased in 2011 from the previously stated to
5988 million. Another year a full prosperity where the liability of the year in 2011 had increased
dramatically to the point of 6852 million.
Earnings per share is an important thing to be looking at. IJM Corporation Berhad had
given their shareholders of earnings per share worth 25.21 cent for basic and 24.84 cent for fully
diluted. Moving to the next year onward, the earnings per share had slightly drop to 23.88 cent
for basic and 23.26 for fully diluted. This incident can give a quite waver for the corporation in
maintaining its shareholders. On the year of 2012, the corporation went berserk and had an
earnings of 29.84 cent for its basic earnings per share. This had given a great trust to the
company and also its shareholder on the increase rate of earnings per share.
10 | P a g e
RATIOS 2010 2011 2012
Current ratio 6.86 times 4.30 times 2.67 times
Acid test ratio 6.70 times 4.13 times 2.59 times
Average collection period 354.00 days 217.70 days 337.14 days
Account receivable turnover 1.03 times 1.68 times 1.08 times
Inventory turnover 6.14 times 9.51 times 10.05 times
Debt ratio 20.88 % 32.04 % 35.98 %
Times interest earned 25.79 times 7.91times 13.93times
Total asset turnover 0.12 times 0.22 times 0.21 times
Fixed asset turnover 0.22 times 0.36 times 0.39 times
Gross profit margin 44.93 % 30.45 % 36.48 %
Operating profit margin 38.09 % 21.38 % 25.12 %
Net profit margin 41.54 % 17.79 % 23.09 %
Operating return on assets 5.38 % 5.22% 6.34 %
Return on equity(ROE) 6.23 % 5.85 % 7.86 %
11 | P a g e
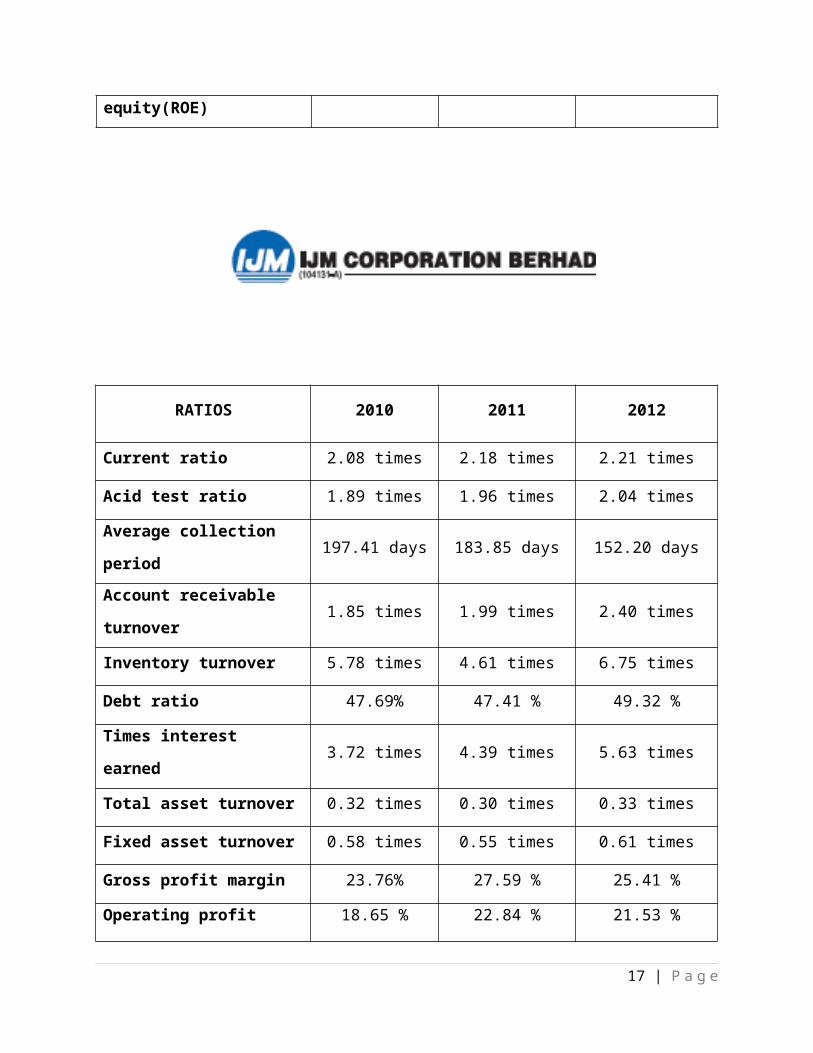
RATIOS 2010 2011 2012
Current ratio 2.08 times 2.18 times 2.21 times
Acid test ratio 1.89 times 1.96 times 2.04 times
Average collection period 197.41 days 183.85 days 152.20 days
Account receivable turnover 1.85 times 1.99 times 2.40 times
Inventory turnover 5.78 times 4.61 times 6.75 times
Debt ratio 47.69% 47.41 % 49.32 %
Times interest earned 3.72 times 4.39 times 5.63 times
Total asset turnover 0.32 times 0.30 times 0.33 times
Fixed asset turnover 0.58 times 0.55 times 0.61 times
Gross profit margin 23.76% 27.59 % 25.41 %
Operating profit margin 18.65 % 22.84 % 21.53 %
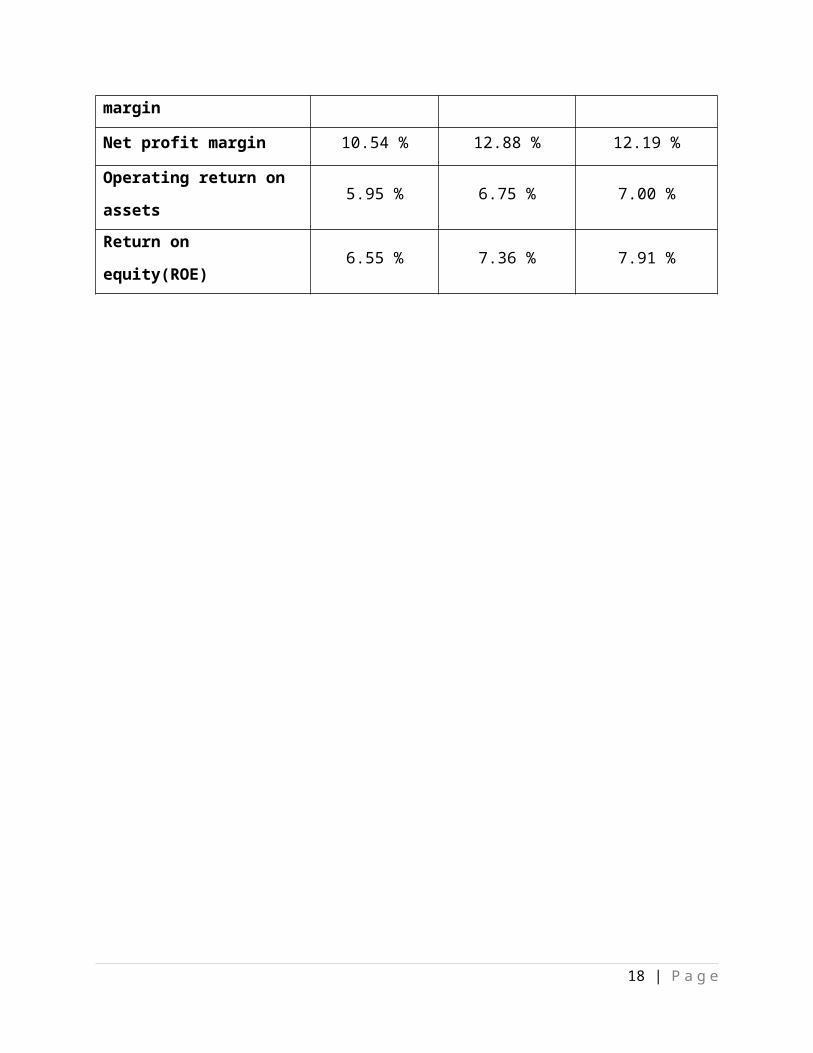
Net profit margin 10.54 % 12.88 % 12.19 %
Operating return on assets 5.95 % 6.75 % 7.00 %
Return on equity(ROE) 6.55 % 7.36 % 7.91 %
12 | P a g e
RATIO ANALYSIS
(Trends Analysis)
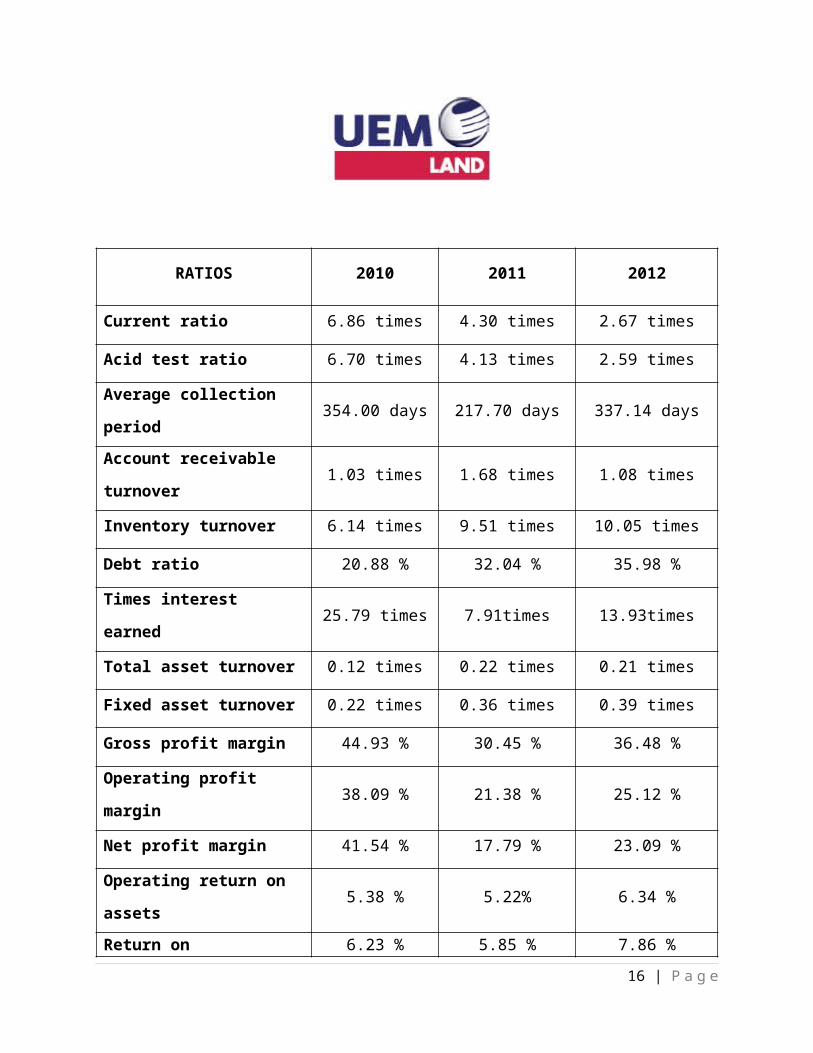
Based on the liquidity ratio which is current ratio and Acid test ratio, In 2010, UEM Land
Holdings current ratio is greater compare to year 2011. The company in 2010 has 6.86 times
assets whereas in 2011 has 4.30 times assets. Meanwhile, in year 2012 the company recorded a
current ratio of 2.67 times. This shows a decreasing trends of current ratio for the three
consecutive years. Therefore, it shows that in 2010, UEM Land has more sufficient short- term
assets to settle short- term liabilities.
Acid test ratio for UEM Land Holdings in year 2010 is higher compare to year 2011. The
acid test ratio for the company in 2010 is 6.70 times and in 2011 is 4.13 times while in 2012 is
2.59 times. UEM Land in 2010 is more capable in paying its liabilities and obligations due to the
higher acid test ratio.
13 | P a g e
2010 2011 20120
1
2
3
4
5
6
7
8
Current ratio Acid test ratio
Year
Tim
es
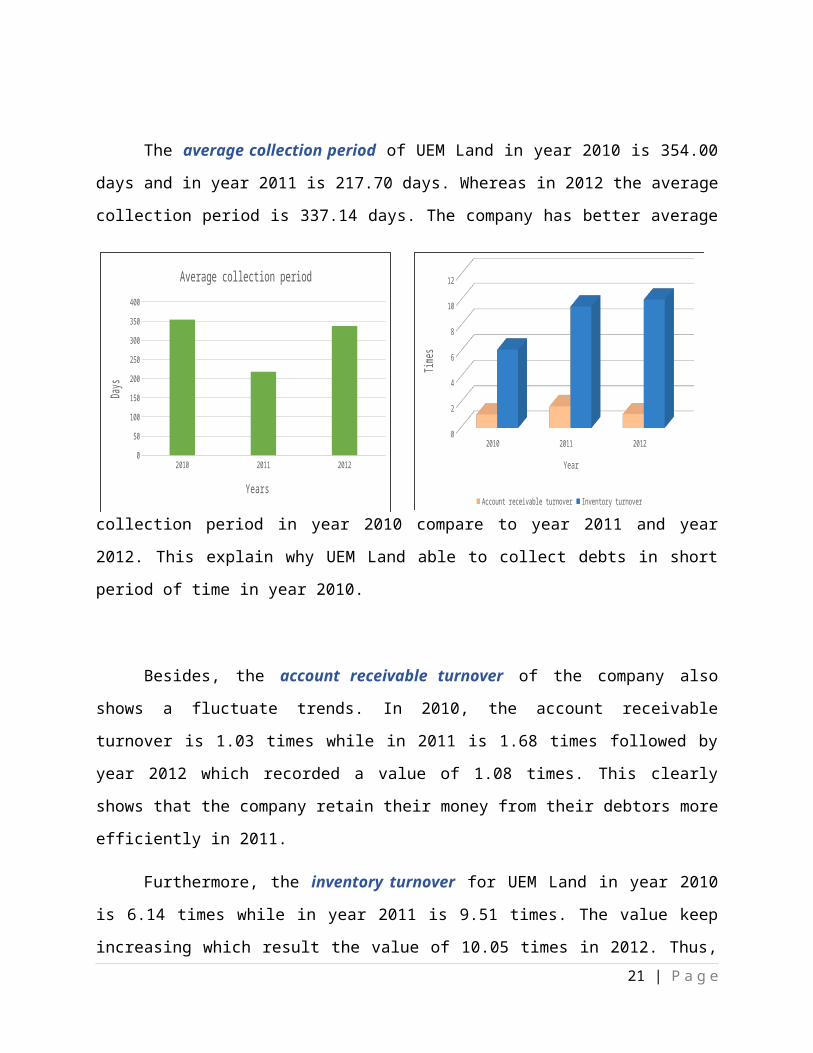
The average collection period of UEM Land in year 2010 is 354.00 days and in year
2011 is 217.70 days. Whereas in 2012 the average collection period is 337.14 days. The
company has better average collection period in year 2010 compare to year 2011 and year 2012.
This explain why UEM Land able to collect debts in short period of time in year 2010.
Besides, the account receivable turnover
1.03 times while in 2011 is 1.68 times followed by year 2012 which recorded a value of 1.08
times. This clearly shows that the company retain their money from their debtors more
efficiently in 2011.
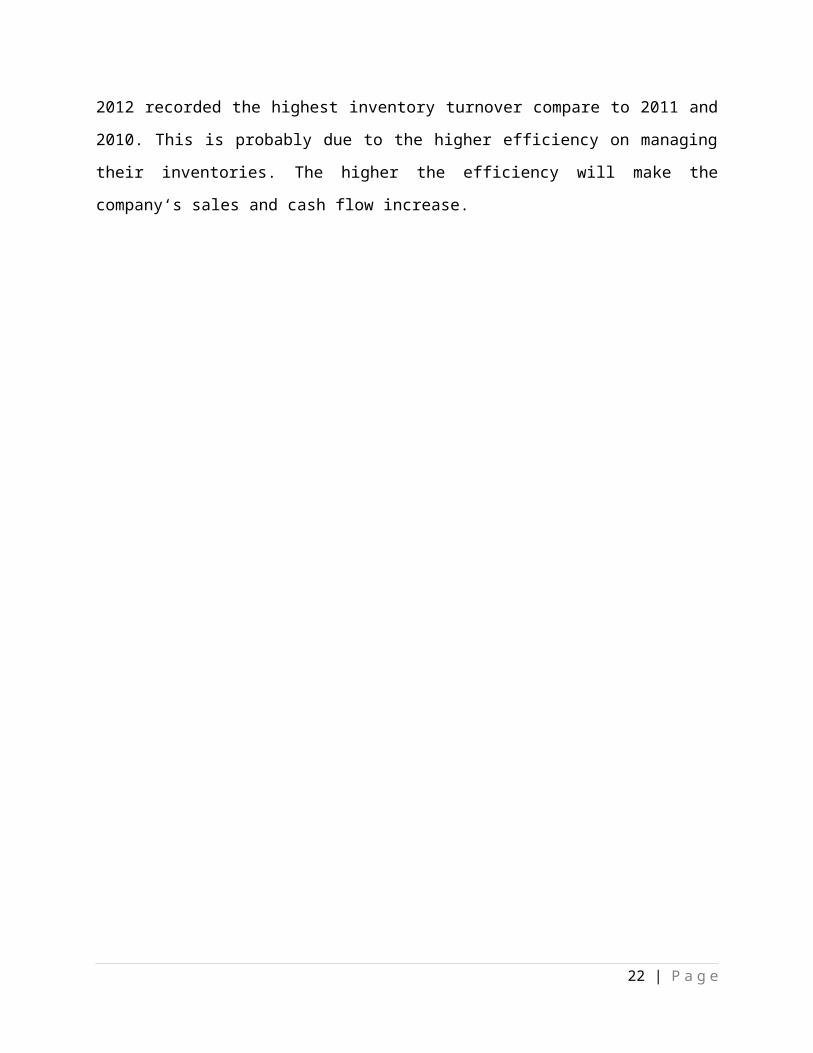
Furthermore, the inventory turnover for UEM Land in year 2010 is 6.14 times while in
year 2011 is 9.51 times. The value keep increasing which result the value of 10.05 times in 2012.
Thus, 2012 recorded the highest inventory turnover compare to 2011 and 2010. This is probably
due to the higher efficiency on managing their inventories. The higher the efficiency will make
the company‘s sales and cash flow increase.
14 | P a g e
2010 2011 20120
2
4
6
8
10
12
Account receivable turnover Inventory turnover
Year
Times
2010 2011 20120
50
100
150
200
250
300
350
400
Average collection period
Years
Days
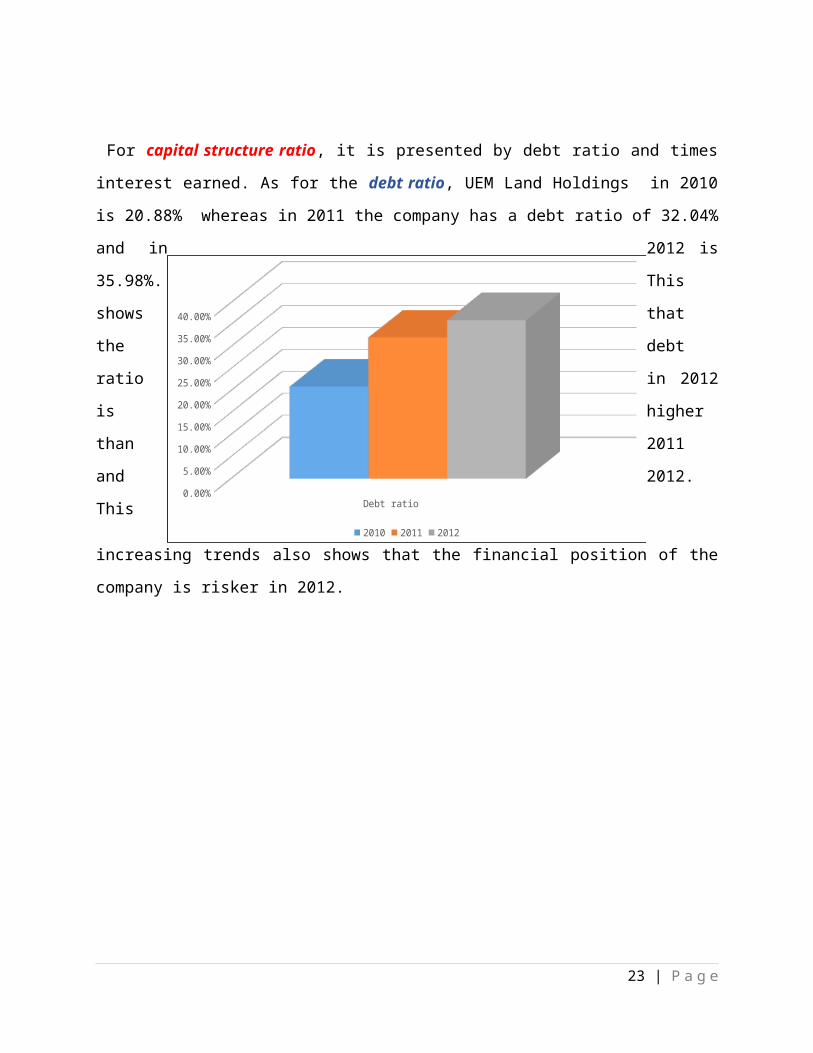
For capital structure ratio, it is presented by debt ratio and times interest earned. As for the debt
ratio, UEM Land Holdings in 2010 is 20.88% whereas in 2011 the company has a debt ratio of
32.04% and in 2012 is 35.98%. This shows that the debt ratio in 2012 is higher than 2011 and
2012. This increasing trends also shows that the financial position of the company is risker in
2012.
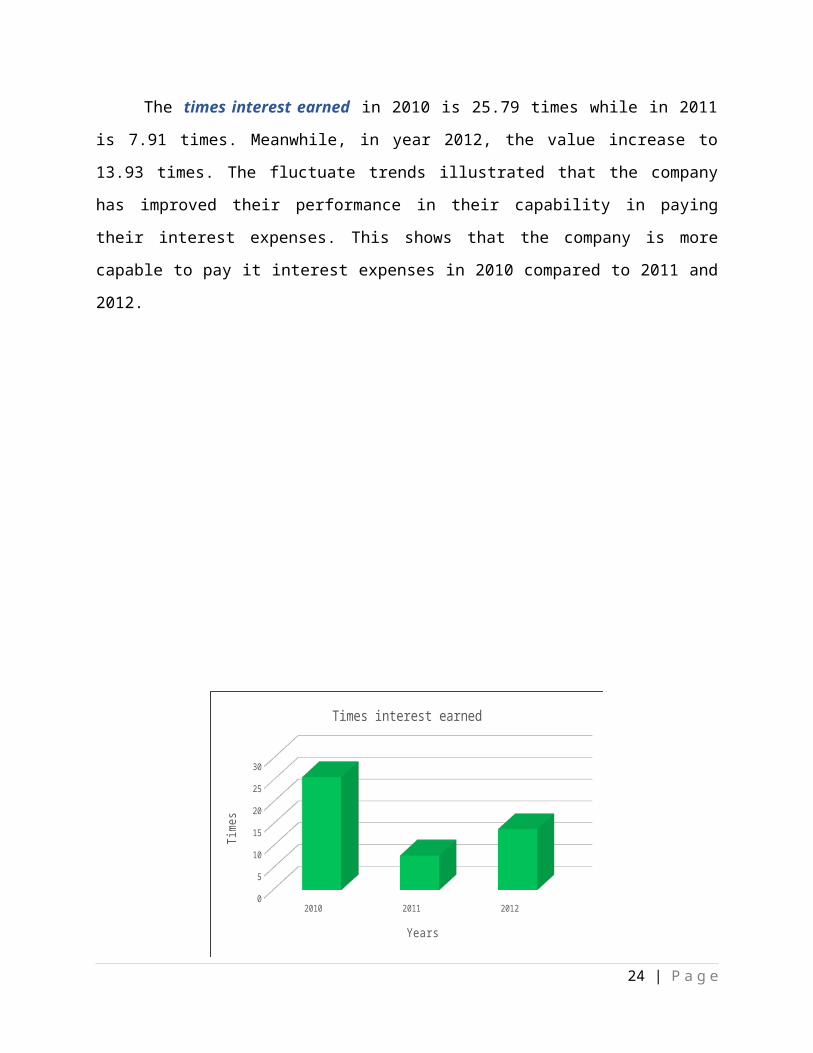
The times interest earned in 2010 is 25.79 times while in 2011 is 7.91 times. Meanwhile,
in year 2012, the value increase to 13.93 times. The fluctuate trends illustrated that the company
has improved their performance in their capability in paying their interest expenses. This shows
that the company is more capable to pay it interest expenses in 2010 compared to 2011 and 2012.
15 | P a g e
Debt ratio0.00%
5.00%
10.00%
15.00%
20.00%
25.00%
30.00%
35.00%
40.00%
2010 2011 2012
2010 2011 20120
5
10
15
20
25
30
Times interest earned
Years
Time
s
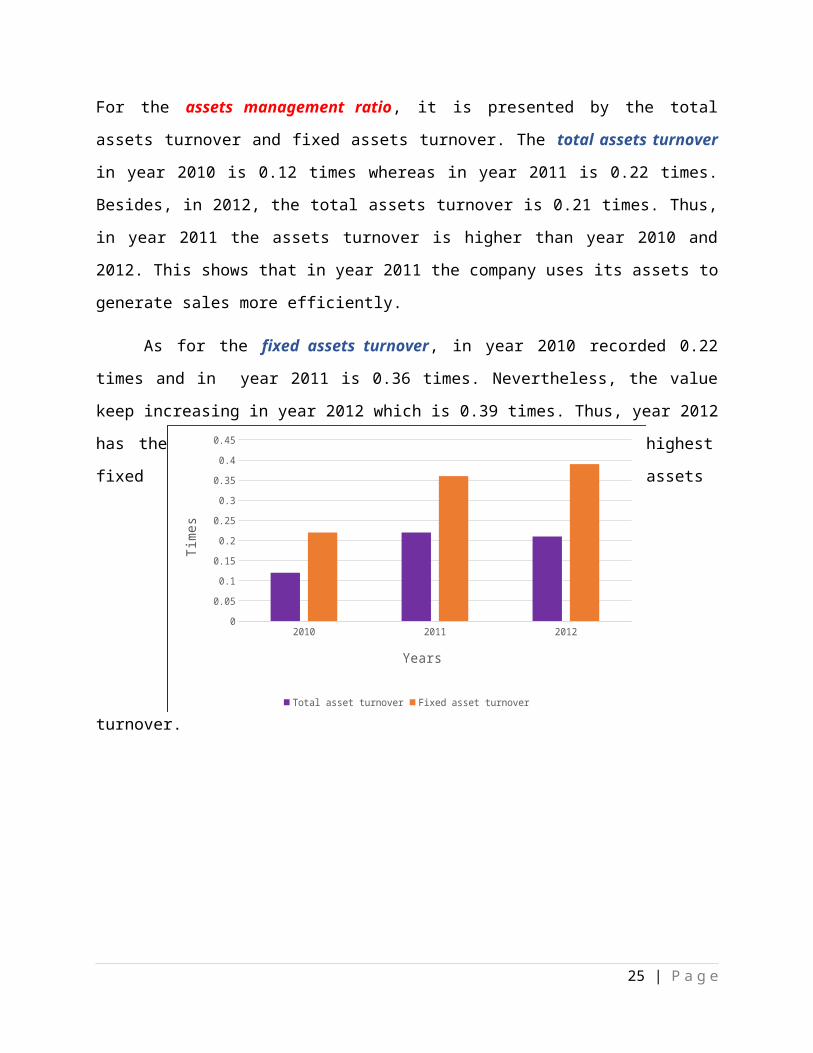
For the assets management ratio, it is presented by the total assets turnover and fixed assets
turnover. The total assets turnover in year 2010 is 0.12 times whereas in year 2011 is 0.22 times.
Besides, in 2012, the total assets turnover is 0.21 times. Thus, in year 2011 the assets turnover is
higher than year 2010 and 2012. This shows that in year 2011 the company uses its assets to
generate sales more efficiently.
As for the fixed assets turnover, in year 2010 recorded 0.22 times and in year 2011 is
0.36 times. Nevertheless, the value keep increasing in year 2012 which is 0.39 times. Thus, year
2012 has the highest fixed assets turnover.
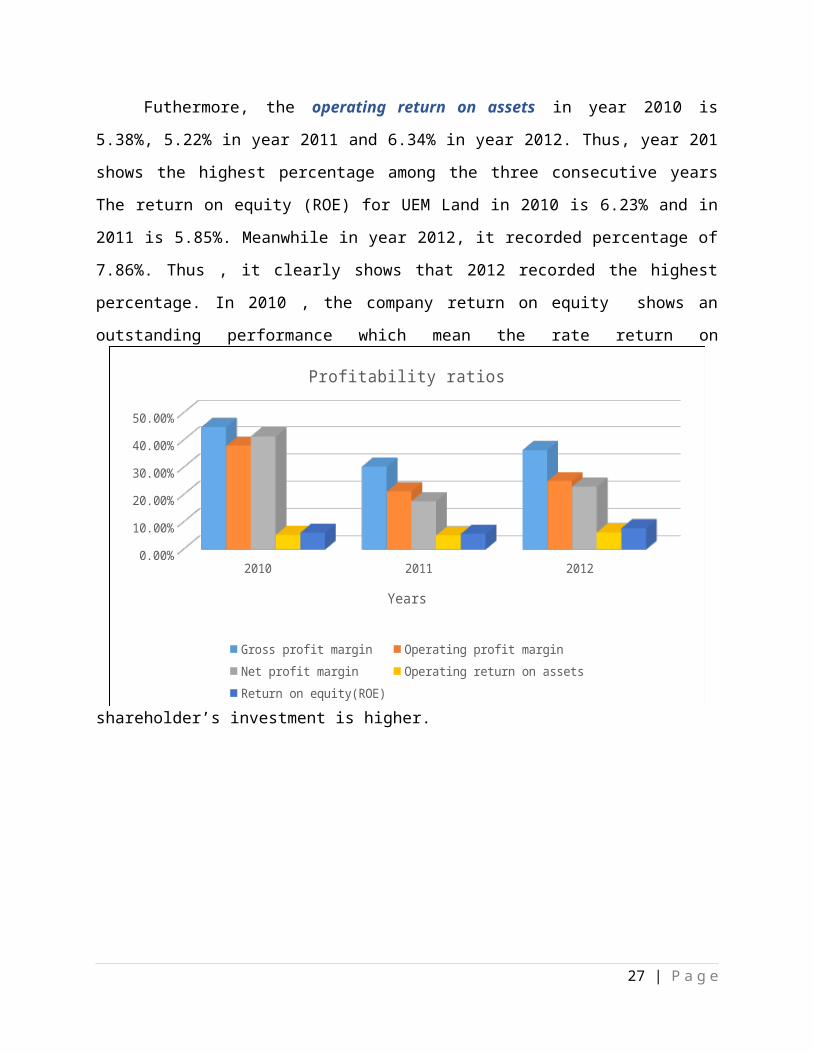
The profitability ratio is shown by the gross profit margin, operating profit margin, net profit
margin, operating return on assets and return on equity (ROE). For the gross profit margin, in
year 2010 recorded percentage of 4.93%, 30.45% in year 2011 and 36.48% in year 2012. The
operating profit margin at 2010 is 38.09% while in 2011 is at 21.38%. As for year 2012, the
percentage recorded is 25.12%. The net profit margin at 2010 is 41.54% and in 2011 is 17.79%
while in 2012 is 25.12% for UEM Land. Thus, year 2010 has the highest percentage for the three
ratio. This shows that the gross profit, operating profit and net profit generate per dollar of sales
is greater in 2010 compare to 2011 and 2012.
16 | P a g e
2010 2011 20120
0.05
0.1
0.15
0.2
0.25
0.3
0.35
0.4
0.45
Total asset turnover Fixed asset turnover
Years
Tim
es
Futhermore, the operating return on assets in year 2010 is 5.38%, 5.22% in year 2011
and 6.34% in year 2012. Thus, year 201 shows the highest percentage among the three
consecutive years The return on equity (ROE) for UEM Land in 2010 is 6.23% and in 2011 is
5.85%. Meanwhile in year 2012, it recorded percentage of 7.86%. Thus , it clearly shows that
2012 recorded the highest percentage. In 2010 , the company return on equity shows an
outstanding performance which mean the rate return on shareholder’s investment is higher.
17 | P a g e
2010 2011 20120.00%
5.00%
10.00%
15.00%
20.00%
25.00%
30.00%
35.00%
40.00%
45.00%
Profitability ratios
Gross profit margin Operating profit margin Net profit marginOperating return on assets Return on equity(ROE)
Years
RATIO ANALYSIS
(Trends Analysis)
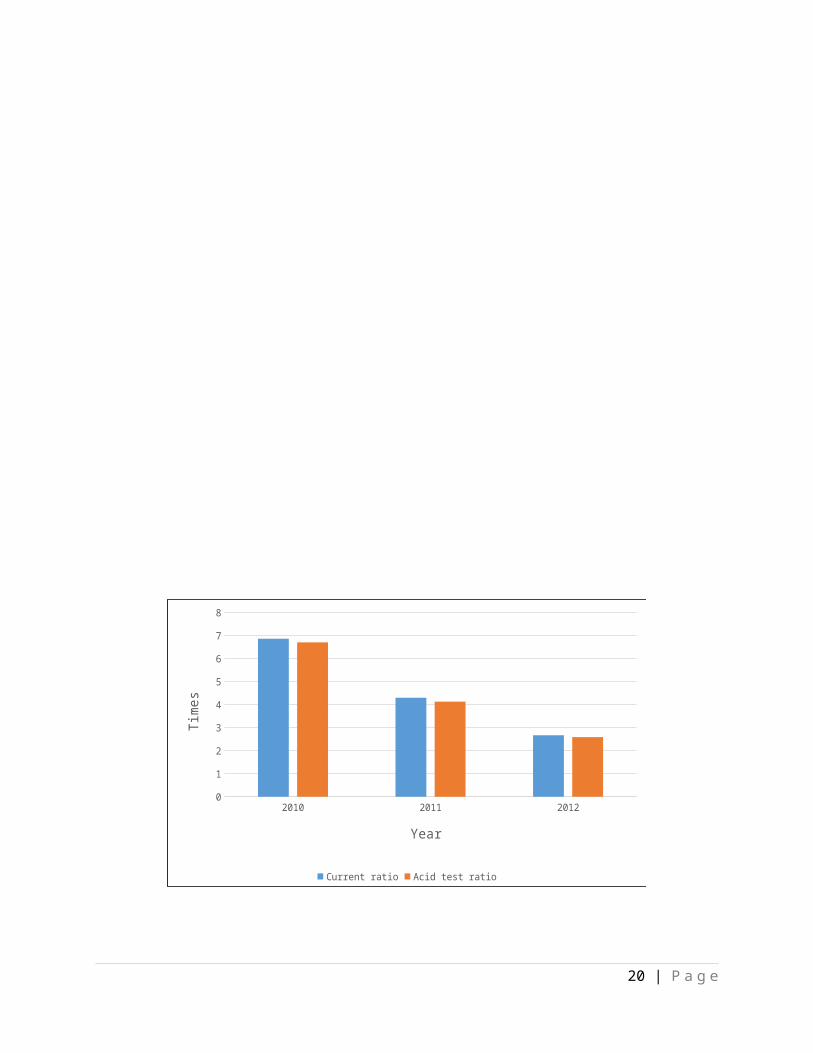
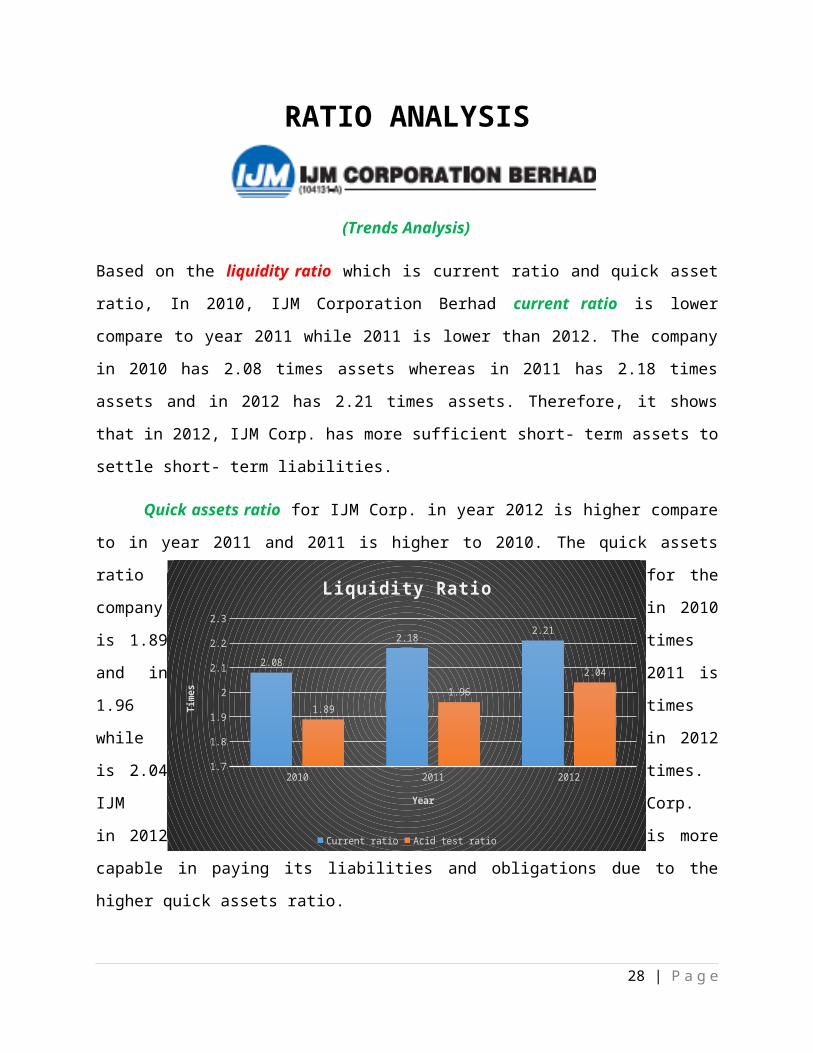
Based on the liquidity ratio which is current ratio and quick asset ratio, In 2010, IJM Corporation
Berhad current ratio is lower compare to year 2011 while 2011 is lower than 2012. The
company in 2010 has 2.08 times assets whereas in 2011 has 2.18 times assets and in 2012 has
2.21 times assets. Therefore, it shows that in 2012, IJM Corp. has more sufficient short- term
assets to settle short- term liabilities.
Quick assets ratio for IJM Corp. in year 2012 is higher compare to in year 2011 and 2011
is higher to 2010. The quick assets ratio for the company in 2010 is 1.89 times and in 2011 is
1.96 times while in 2012 is 2.04 times. IJM Corp. in 2012 is more capable in paying its liabilities
and obligations due to the higher quick assets ratio.
18 | P a g e
2010 2011 20121.7
1.8
1.9
2
2.1
2.2
2.3
2.08
2.182.21
1.89
1.96
2.04
Liquidity Ratio
Current ratio Acid test ratio
Year
Tim
es
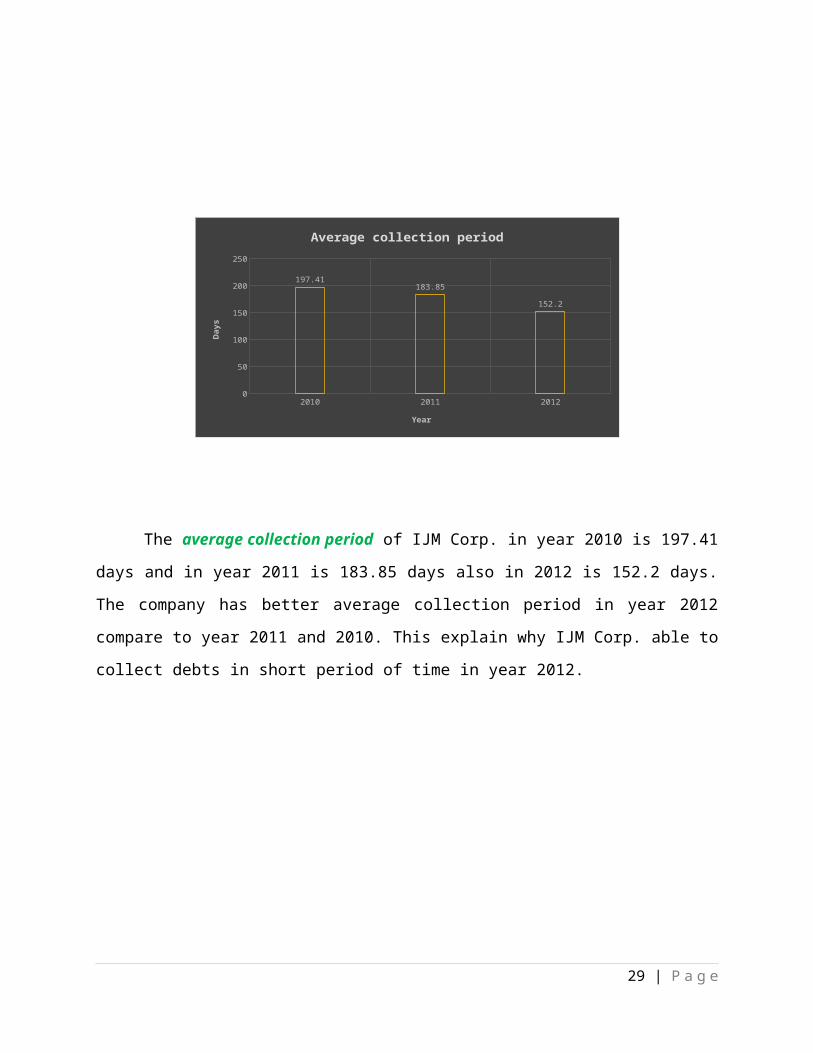
The average collection period of IJM Corp. in year 2010 is 197.41 days and in year 2011
is 183.85 days also in 2012 is 152.2 days. The company has better average collection period in
year 2012 compare to year 2011 and 2010. This explain why IJM Corp. able to collect debts in
short period of time in year 2012.
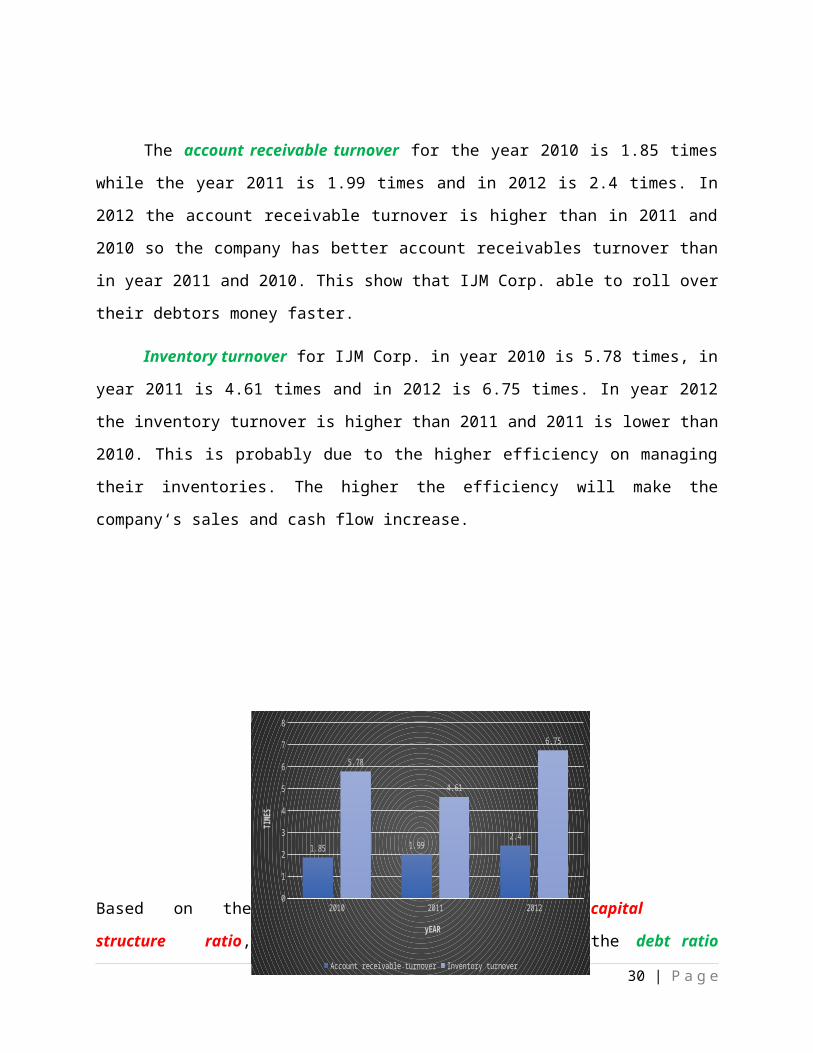
The account receivable turnover for the year 2010 is 1.85 times while the year 2011 is
1.99 times and in 2012 is 2.4 times. In 2012 the account receivable turnover is higher than in
2011 and 2010 so the company has better account receivables turnover than in year 2011 and
2010. This show that IJM Corp. able to roll over their debtors money faster.
Inventory turnover for IJM Corp. in year 2010 is 5.78 times, in year 2011 is 4.61 times
and in 2012 is 6.75 times. In year 2012 the inventory turnover is higher than 2011 and 2011 is
lower than 2010. This is probably due to the higher efficiency on managing their inventories.
The higher the efficiency will make the company‘s sales and cash flow increase.
19 | P a g e
2010 2011 20120
50
100
150
200
250
197.41183.85
152.2
Average collection period
Year
Day
s
2010 2011 20120
1
2
3
4
5
6
7
8
1.85 1.992.4
5.78
4.61
6.75
Account receivable turnover Inventory turnover
yEAR
TIMES
Based on the capital structure ratio, the debt ratio of IJM Corporation Berhad in 2010 is 47.69%
whereas in 2011 the company has a debt ratio of 47.41% while in year 2012 its debt ratio is
49.32%. This shows that the debt ratio in 2012 is higher than both 2011 and 2010 so this also
shows that the financial position of the company is riskier in 2012
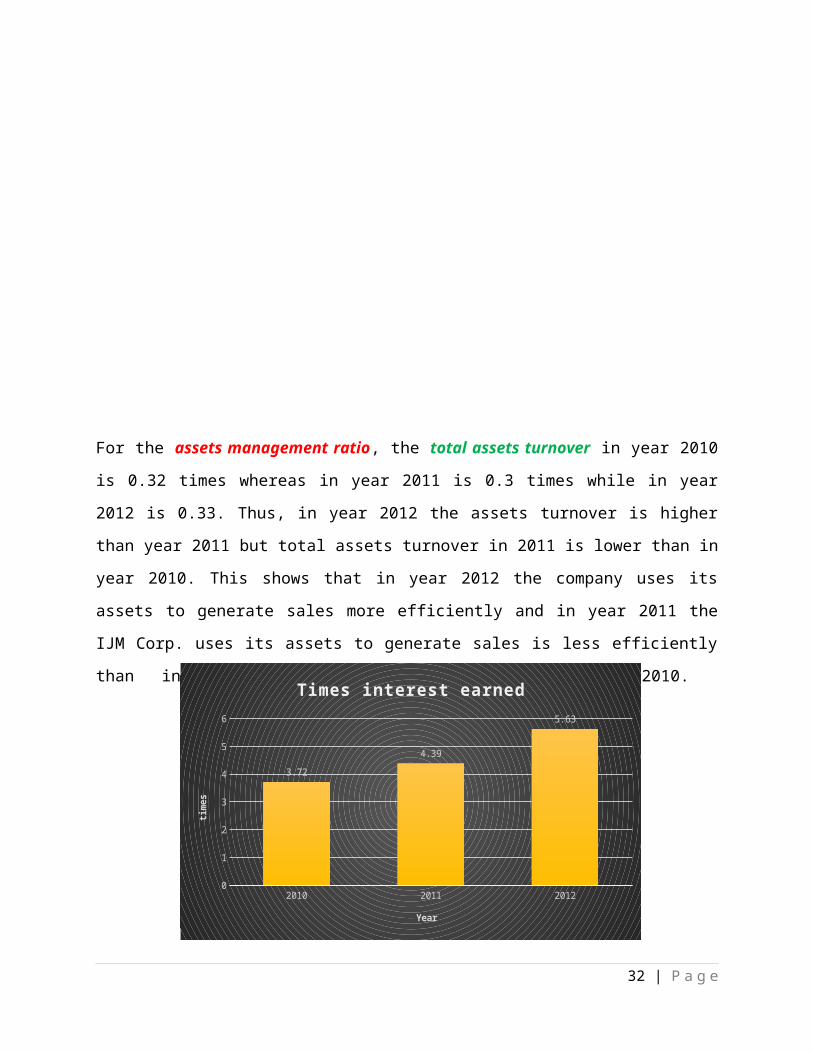
The times interest earned in 2010 is 3.72 times while in 2011 is 4.39 times and in 2012 is
5.63 times. This shows that the company is more capable to pay it interest expenses in 2011
compared to 2010. Hence in 2012 the company is more capable to pay its interest in 2012 than in
2011. The company grow in a positive way year by year and the graph of IJM Corp. is expected
to increase in future year.
20 | P a g e
2010 2011 201246
46.5
47
47.5
48
48.5
49
49.5
47.6947.41
49.32
Debt ratio
Year
Prce
ntag
e
2010 2011 20120
1
2
3
4
5
6
3.72
4.39
5.63
Times interest earned
Year
times
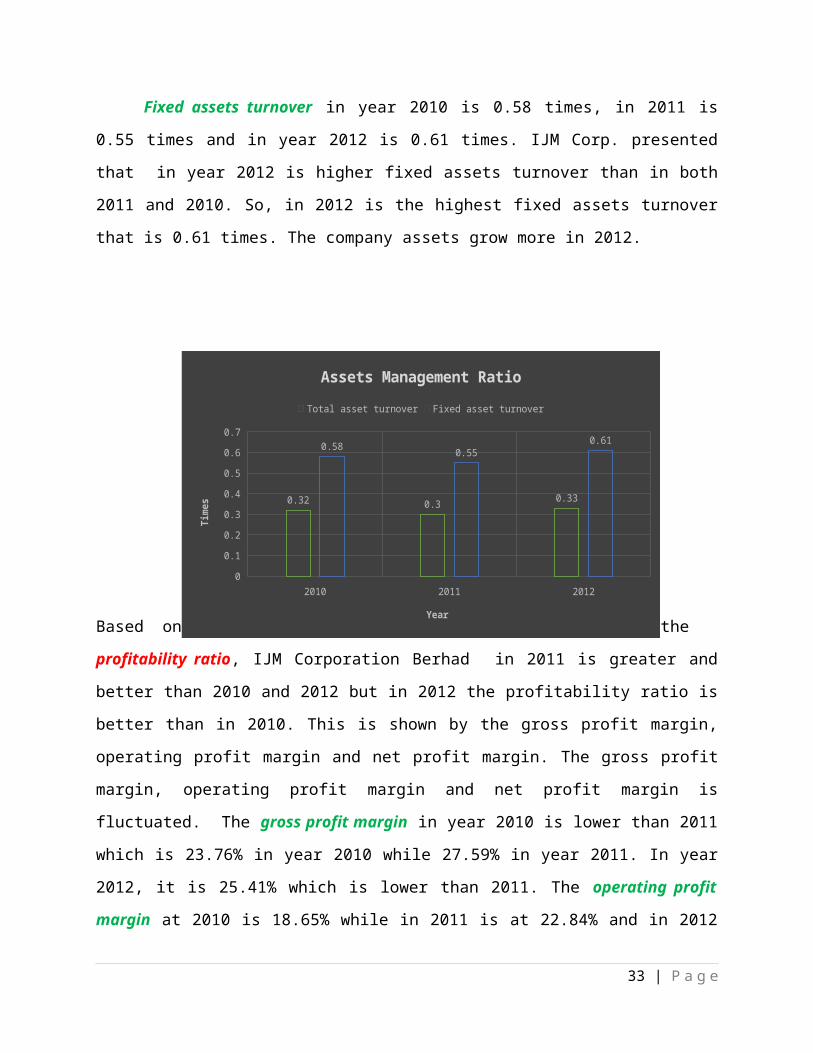
For the assets management ratio, the total assets turnover in year 2010 is 0.32 times whereas in
year 2011 is 0.3 times while in year 2012 is 0.33. Thus, in year 2012 the assets turnover is higher
than year 2011 but total assets turnover in 2011 is lower than in year 2010. This shows that in
year 2012 the company uses its assets to generate sales more efficiently and in year 2011 the IJM
Corp. uses its assets to generate sales is less efficiently than in 2010.
Fixed assets turnover in year 2010 is 0.58 times, in 2011 is 0.55 times and in year 2012
is 0.61 times. IJM Corp. presented that in year 2012 is higher fixed assets turnover than in both
2011 and 2010. So, in 2012 is the highest fixed assets turnover that is 0.61 times. The company
assets grow more in 2012.
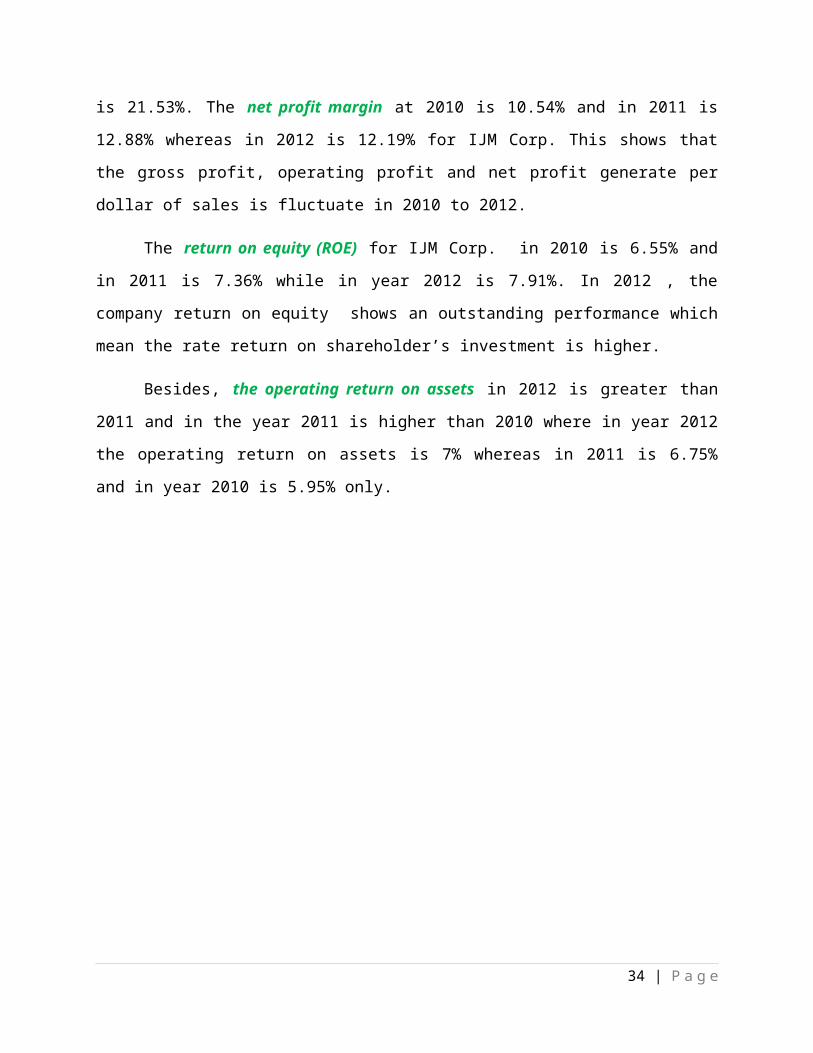
Based on the profitability ratio, IJM Corporation Berhad in 2011 is greater and better than 2010
and 2012 but in 2012 the profitability ratio is better than in 2010. This is shown by the gross
profit margin, operating profit margin and net profit margin. The gross profit margin, operating
profit margin and net profit margin is fluctuated. The gross profit margin in year 2010 is lower
than 2011 which is 23.76% in year 2010 while 27.59% in year 2011. In year 2012, it is 25.41%
which is lower than 2011. The operating profit margin at 2010 is 18.65% while in 2011 is at
22.84% and in 2012 is 21.53%. The net profit margin at 2010 is 10.54% and in 2011 is 12.88%
whereas in 2012 is 12.19% for IJM Corp. This shows that the gross profit, operating profit and
net profit generate per dollar of sales is fluctuate in 2010 to 2012.
21 | P a g e
2010 2011 20120
0.1
0.2
0.3
0.4
0.5
0.6
0.7
0.32 0.30.33
0.580.55
0.61
Assets Management Ratio
Total asset turnover Fixed asset turnover
Year
Tim
es
The return on equity (ROE) for IJM Corp. in 2010 is 6.55% and in 2011 is 7.36% while
in year 2012 is 7.91%. In 2012 , the company return on equity shows an outstanding
performance which mean the rate return on shareholder’s investment is higher.
Besides, the operating return on assets in 2012 is greater than 2011 and in the year 2011
is higher than 2010 where in year 2012 the operating return on assets is 7% whereas in 2011 is
6.75% and in year 2010 is 5.95% only.
Gross profit margin Operating profit margin
Net profit margin Operating return on assets
Return on equity(ROE)
0
5
10
15
20
25
30
Profitability Ratio
2010 2011 2012
Perce
ntag
e
22 | P a g e
RATIO ANALYSIS
UEM LAND HOLDINGS VS IJM CORPORATION BERHAD
(Cross-sectional Analysis)
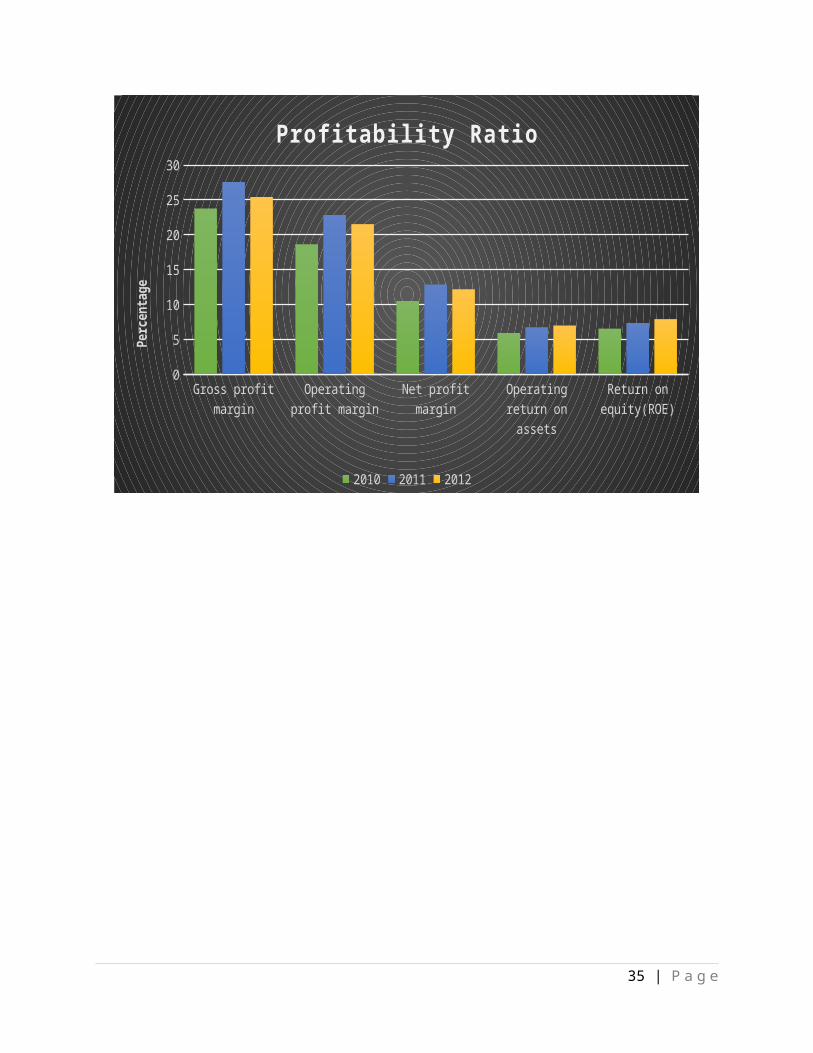
Based on the liquidity ratio which is current ratio and acid test ratio, In 2012, UEM Land
Holdings current ratio is greater compare to IJM Corp.Berhad. UEM Land has 2.67 times
assets whereas IJM Corp.has 2.21 times assets. This performance is also the same as in 2010 and
2011 which shows that UEM Land has higher current ratio. Therefore, it shows that UEM Land
has more sufficient short- term assets to settle short- term liabilities.
Likewise, acid test ratio for UEM Land in year 2012 is higher compare to IJM Corp. The
acid test ratio for the UEM Land in 2012 is 2.59 times and IJM Corp.is 2.04 times. This
outstanding performance by UEM Land are similar in year 2010 and 2011 with a higher acid test
ratio compare to IJM Corp. Therefore, UEM Land is more capable in paying its liabilities and
obligations due to the higher acid test ratio.
23 | P a g e
2010 2011 20120
1
2
3
4
5
6
7
8
UEM Land
Current ratio Acid test ratio
Year
Times
2010 2011 20121.7
1.8
1.9
2
2.1
2.2
2.3
2.08
2.182.21
1.89
1.96
2.04
IJM Corp.
Current ratio Acid test ratio
Year
Times
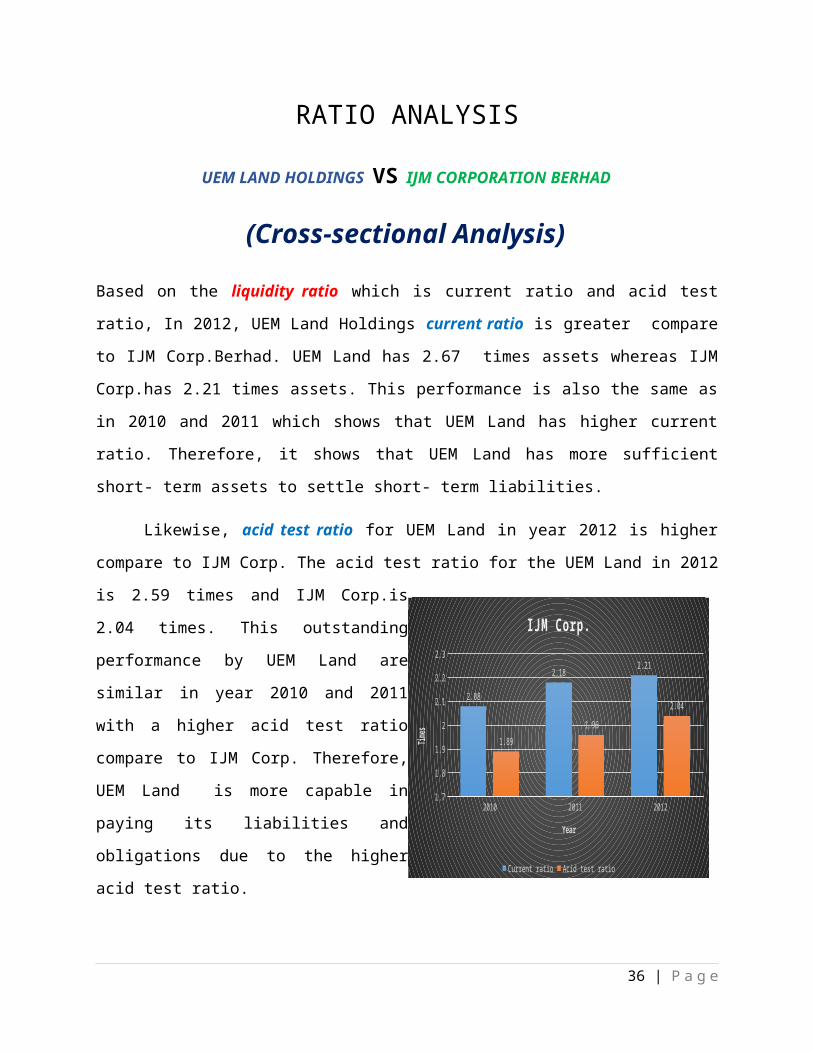
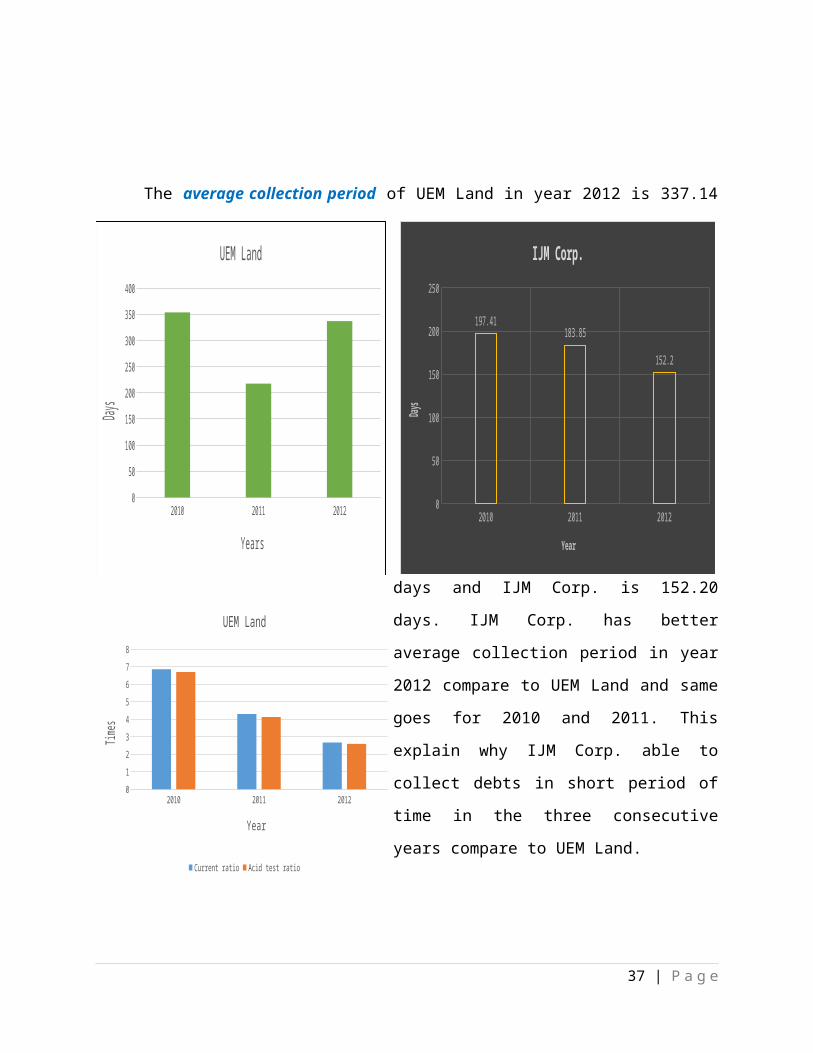
The average collection period of UEM Land in year 2012 is 337.14 days and IJM Corp.
is 152.20 days. IJM Corp. has better average collection period in year 2012 compare to UEM
Land and same goes for 2010 and 2011. This explain why IJM Corp. able to collect debts in
short period of time in the three consecutive years compare to UEM Land.
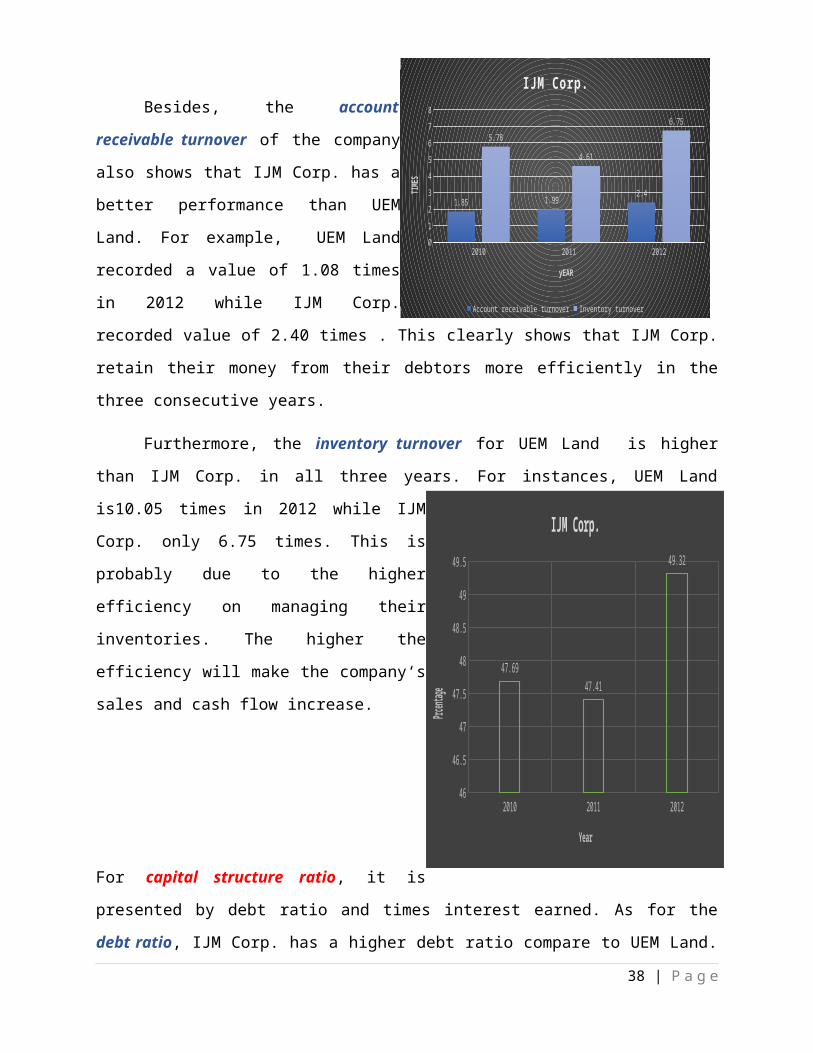
Besides, the account receivable turnover of the company also shows that IJM Corp. has
a better performance than UEM Land. For example, UEM Land recorded a value of 1.08 times
in 2012 while IJM Corp. recorded value of 2.40 times . This clearly shows that IJM Corp. retain
their money from their debtors more efficiently in the three consecutive years.
Furthermore, the inventory turnover for UEM Land is higher than IJM Corp. in all three
years. For instances, UEM Land is10.05 times in 2012 while IJM Corp. only 6.75 times. This is
probably due to the higher efficiency on managing their inventories. The higher the efficiency
will make the company‘s sales and cash flow increase.
24 | P a g e
2010 2011 20120
50
100
150
200
250
300
350
400
UEM Land
Years
Days
2010 2011 20120
50
100
150
200
250
197.41183.85
152.2
IJM Corp.
Year
Days
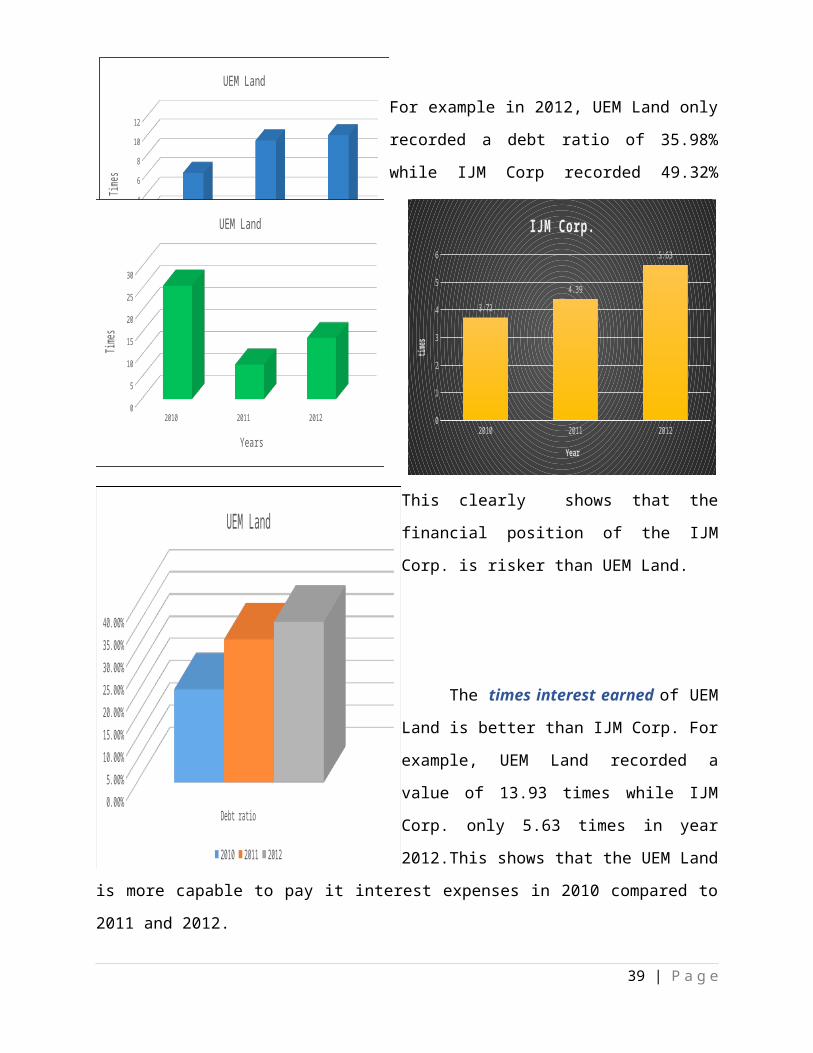
For capital structure ratio, it is presented by debt ratio and times interest earned. As for the debt
ratio, IJM Corp. has a higher debt ratio compare to UEM Land. For example in 2012, UEM
25 | P a g e
2010 2011 20120
2
4
6
8
10
12
UEM Land
Account receivable turnover Inventory turnover
Year
Times
2010 2011 20120
1
2
3
4
5
6
7
8
1.85 1.992.4
5.78
4.61
6.75
IJM Corp.
Account receivable turnover Inventory turnover
yEAR
TIMES
Debt ratio0.00%
5.00%
10.00%
15.00%
20.00%
25.00%
30.00%
35.00%
40.00%
UEM Land
2010 2011 2012
2010 2011 201246
46.5
47
47.5
48
48.5
49
49.5
47.6947.41
49.32
IJM Corp.
Year
Prcentag
e
The times interest earned of UEM Land is better than IJM Corp. For example, UEM
Land recorded a value of 13.93 times while IJM Corp. only 5.63 times in year 2012.This shows
that the UEM Land is more capable to pay it interest expenses in 2010 compared to 2011 and
2012.
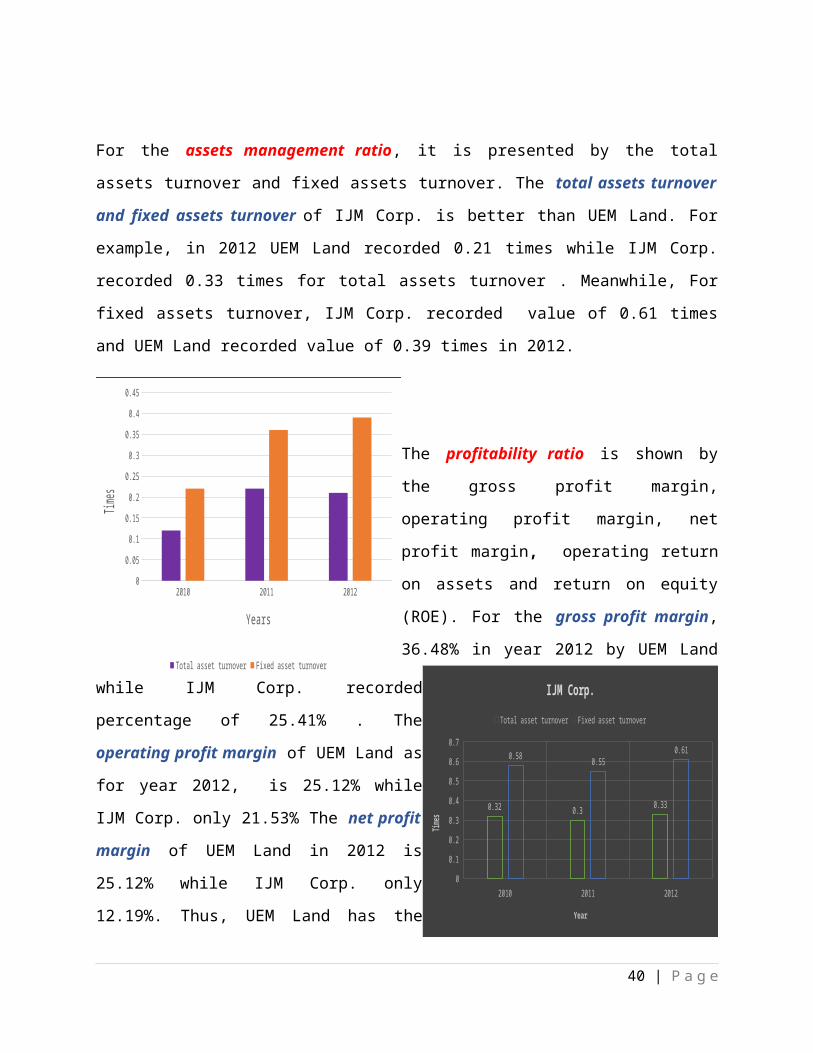
For
the
assets management ratio, it is presented by the
total assets turnover and fixed assets turnover. The total assets turnover and fixed assets
turnover of IJM Corp. is better than UEM Land. For example, in 2012 UEM Land recorded 0.21
times while IJM Corp. recorded 0.33 times for total assets turnover . Meanwhile, For fixed assets
turnover, IJM Corp. recorded value of 0.61 times and UEM Land recorded value of 0.39 times
in 2012.
26 | P a g e
2010 2011 20120
5
10
15
20
25
30
UEM Land
Years
Times
2010 2011 20120
1
2
3
4
5
6
3.72
4.39
5.63
IJM Corp.
Year
times
2010 2011 20120
0.05
0.1
0.15
0.2
0.25
0.3
0.35
0.4
0.45
Total asset turnover Fixed asset turnover
Years
Times
2010 2011 20120
0.1
0.2
0.3
0.4
0.5
0.6
0.7
0.32 0.30.33
0.580.55
0.61
IJM Corp.
Total asset turnover Fixed asset turnover
Year
Times
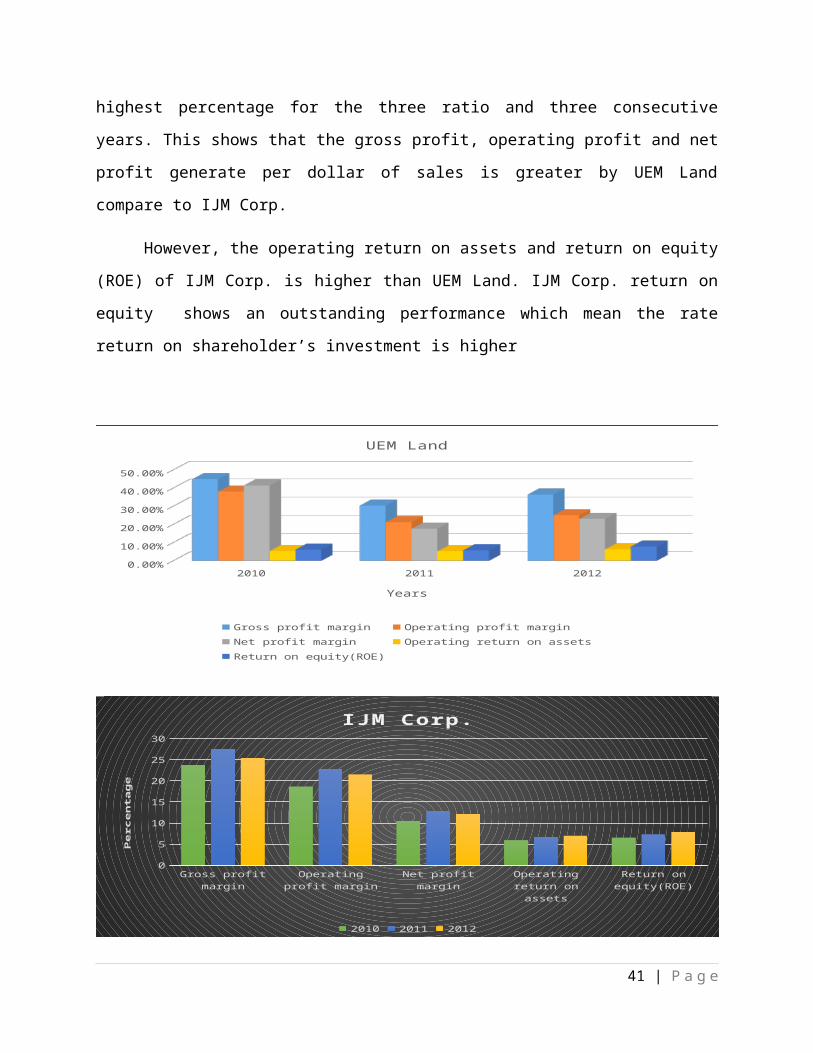
The profitability ratio is shown by the gross profit margin, operating profit margin, net profit
margin, operating return on assets and return on equity (ROE). For the gross profit margin,
36.48% in year 2012 by UEM Land while IJM Corp. recorded percentage of 25.41% . The
operating profit margin of UEM Land as for year 2012, is 25.12% while IJM Corp. only
21.53% The net profit margin of UEM Land in 2012 is 25.12% while IJM Corp. only 12.19%.
Thus, UEM Land has the highest percentage for the three ratio and three consecutive years. This
shows that the gross profit, operating profit and net profit generate per dollar of sales is greater
by UEM Land compare to IJM Corp.
However, the operating return on assets and return on equity (ROE) of IJM Corp. is
higher than UEM Land. IJM Corp. return on equity shows an outstanding performance which
mean the rate return on shareholder’s investment is higher
Gross profit margin Operating profit margin
Net profit margin Operating return on assets
Return on equity(ROE)
0
5
10
15
20
25
30
IJM Corp.
2010 2011 2012
Pe
rce
nta
ge
27 | P a g e
2010 2011 20120.00%
5.00%
10.00%
15.00%
20.00%
25.00%
30.00%
35.00%
40.00%
45.00%
UEM Land
Gross profit margin Operating profit margin Net profit marginOperating return on assets Return on equity(ROE)
Years
28 | P a g e
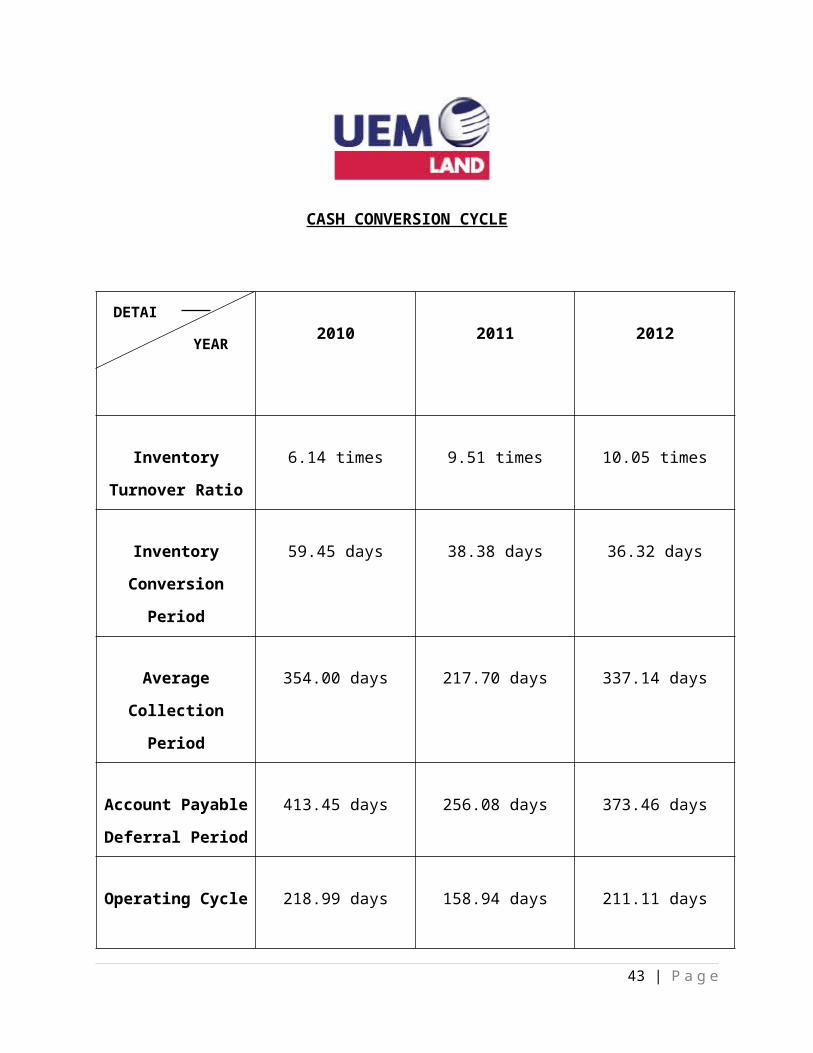
CASH CONVERSION CYCLE
2010 2011 2012
Inventory Turnover
Ratio
6.14 times 9.51 times 10.05 times
Inventory
Conversion Period
59.45 days 38.38 days 36.32 days
Average Collection
Period
354.00 days 217.70 days 337.14 days
Account Payable
Deferral Period
413.45 days 256.08 days 373.46 days
Operating Cycle 218.99 days 158.94 days 211.11 days
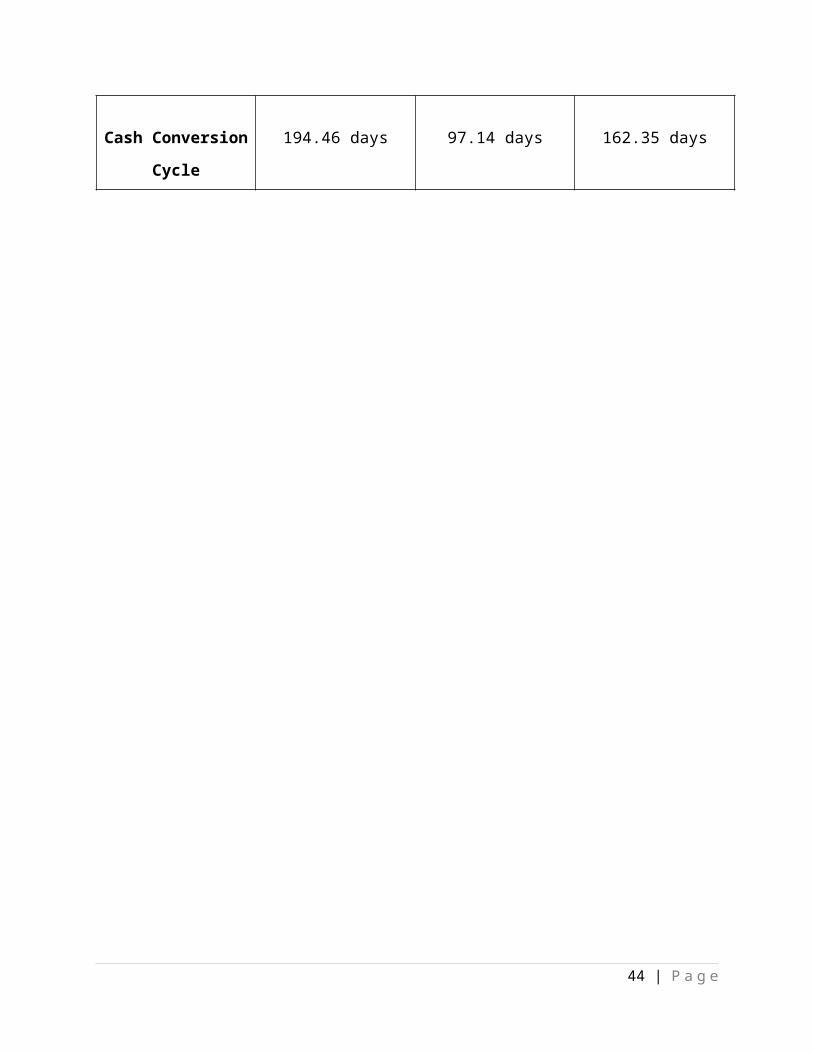
Cash Conversion
Cycle
194.46 days 97.14 days 162.35 days
29 | P a g e
YEAR
DETAIL
2012 2013 20140
2
4
6
8
10
12
1412.49
9.8
11.46
Inventory Turnover Ratio
Year
Tim
es
30 | P a g e
2012 2013 20140
5
10
15
20
25
30
35
40
29.22
37.24
31.85
Inventory Conversion Period
Year
Days

2012 2013 20140
5
10
15
20
25
30
11.31
27.47
10.95
Average Collection Period
Year
Days
2012 2013 20140
10
20
30
40
50
60
70
40.53
64.71
42.8
Operating Cycle
Year
Days
31 | P a g e
2012 2013 201425
25.5
26
26.5
27
27.5
26.2
27.19
25.8
Account Payable Deferral Period
Year
Days
2012 2013 20140
5
10
15
20
25
30
35
40
14.33
37.52
17
Cash Conversion Cycle
Year
Days
32 | P a g e
Inventory Turnover
Inventory Conversion Period
Average Collection Period
Operating Cycle
AccountPayable Deferral Period
Cash Coversion Cycle
0 10 20 30 40 50 60 70
11.46
31.85
10.95
42.8
25.8
17
9.8
37.24
27.47
64.71
27.19
37.52
12.49
29.22
11.31
40.53
26.2
14.33
Analysis
2012 2013 2014
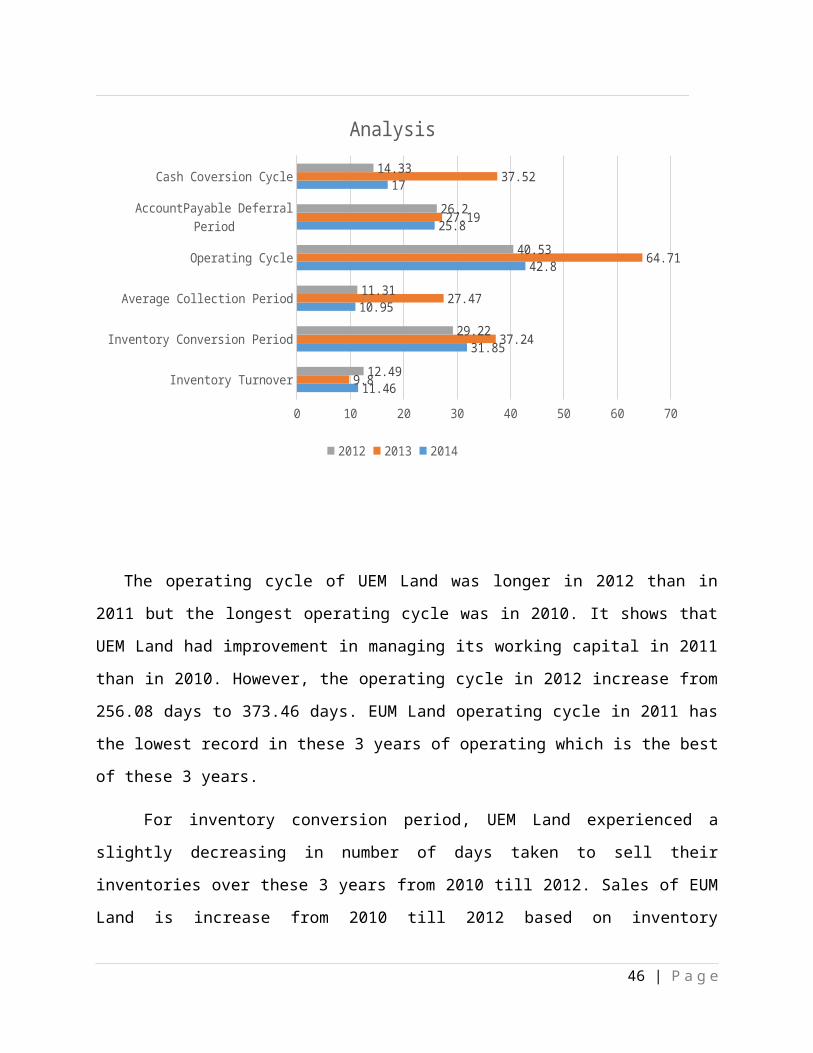
The operating cycle of UEM Land was longer in 2012 than in 2011 but the longest operating
cycle was in 2010. It shows that UEM Land had improvement in managing its working capital in
2011 than in 2010. However, the operating cycle in 2012 increase from 256.08 days to 373.46
days. EUM Land operating cycle in 2011 has the lowest record in these 3 years of operating
which is the best of these 3 years.
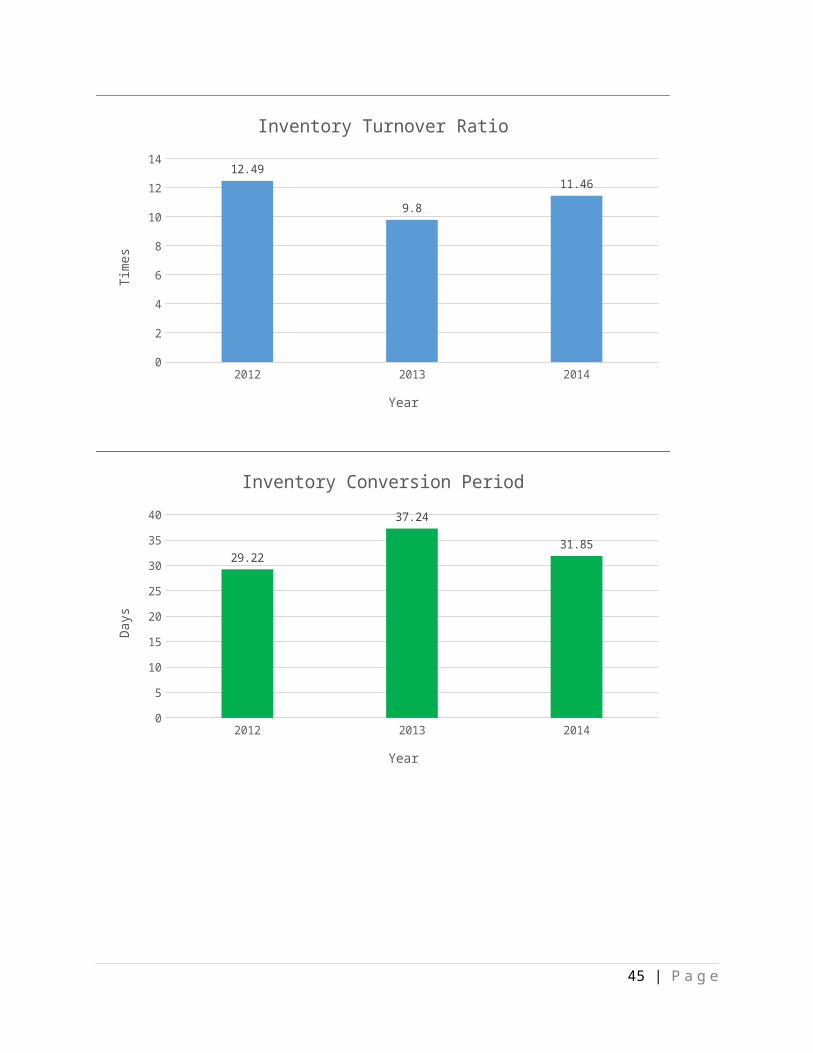
For inventory conversion period, UEM Land experienced a slightly decreasing in number
of days taken to sell their inventories over these 3 years from 2010 till 2012. Sales of EUM Land
is increase from 2010 till 2012 based on inventory conversion period, the inventories became
faster to convert into sales. Therefore, the best inventory conversion period was 2012.
In 2011, the chart shows that the average collection period for EUM Land is shorter than
2010. In 2011, it clearly shows that EUM Land able to collect from their account receivable
efficiently but in 2012 EUM Land had some problem in collecting debt from their account
receivable as the average collection period increase from 217.7 days to 337.14 days.
33 | P a g e
For account payable deferral period, 2011 has the lowest days among these 3 years. 2012 has
higher days than 2011 in paying its supplier but lower days than 2010. The average number of
days taken to pay its suppliers in 2010 is the highest among these 3 years which is the worst.
Conclusion, 2011 has the best account payable deferral period as the lowest days is the best.
34 | P a g e
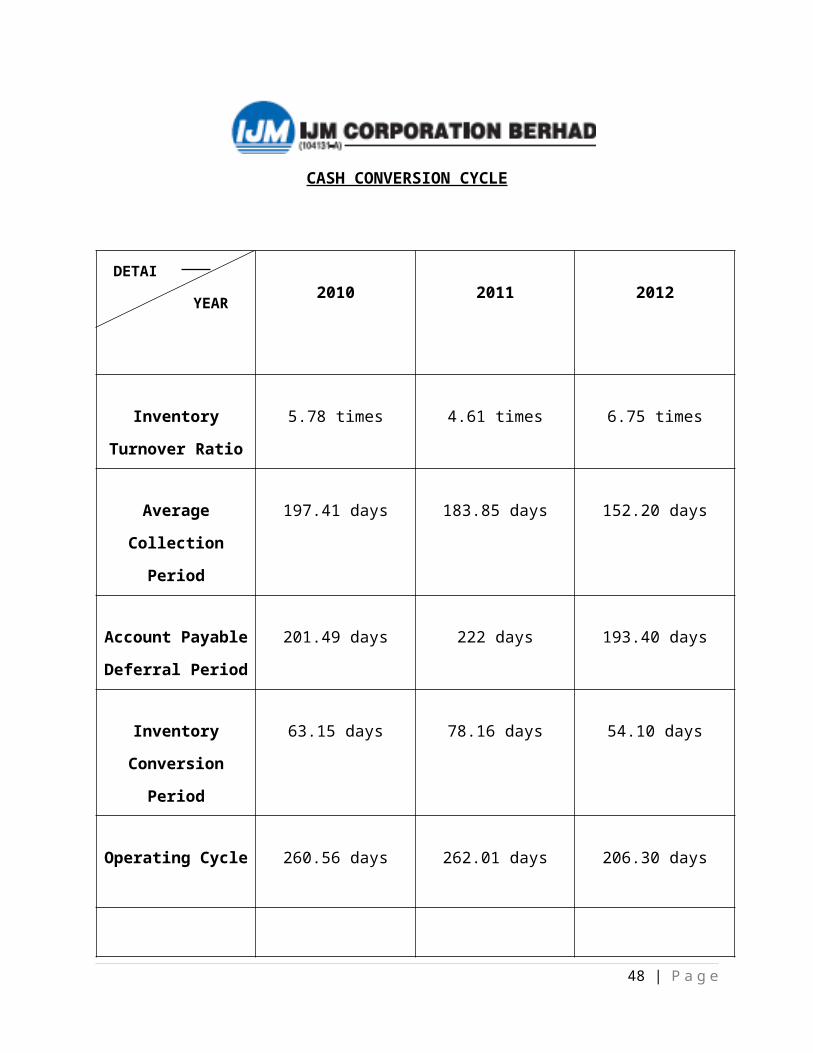
CASH CONVERSION CYCLE
2010 2011 2012
Inventory Turnover
Ratio
5.78 times 4.61 times 6.75 times
Average Collection
Period
197.41 days 183.85 days 152.20 days
Account Payable
Deferral Period
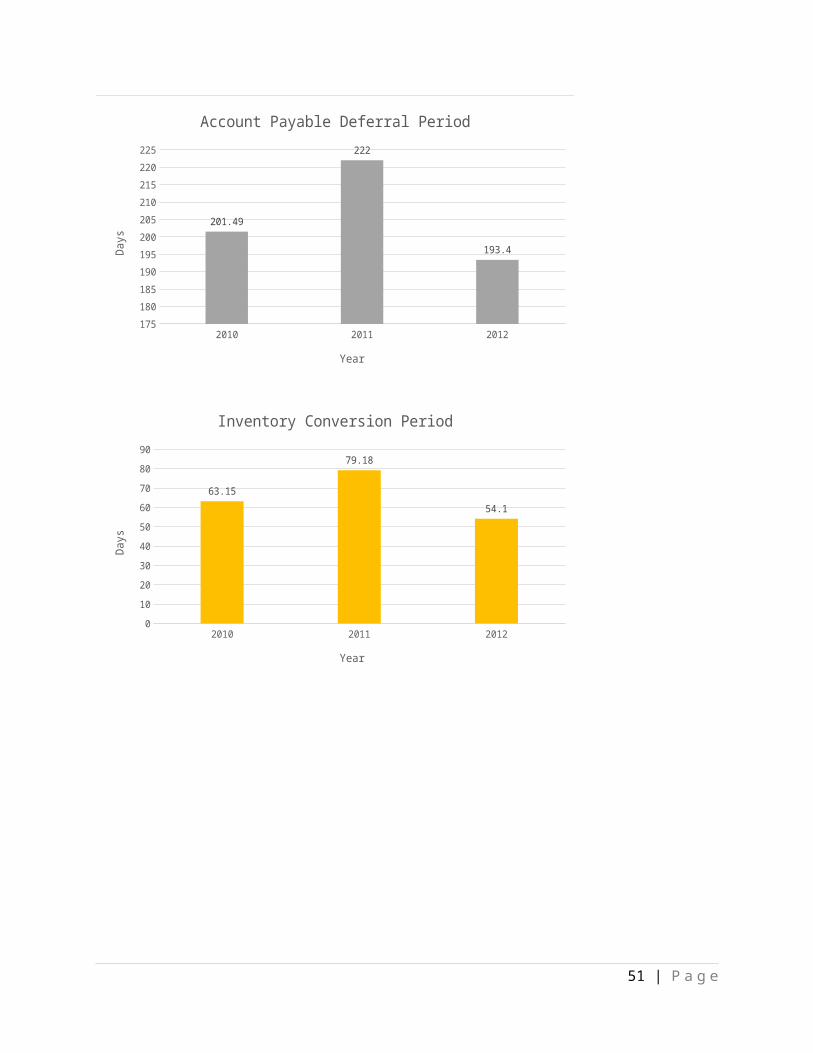
201.49 days 222 days 193.40 days
Inventory
Conversion Period
63.15 days 78.16 days 54.10 days
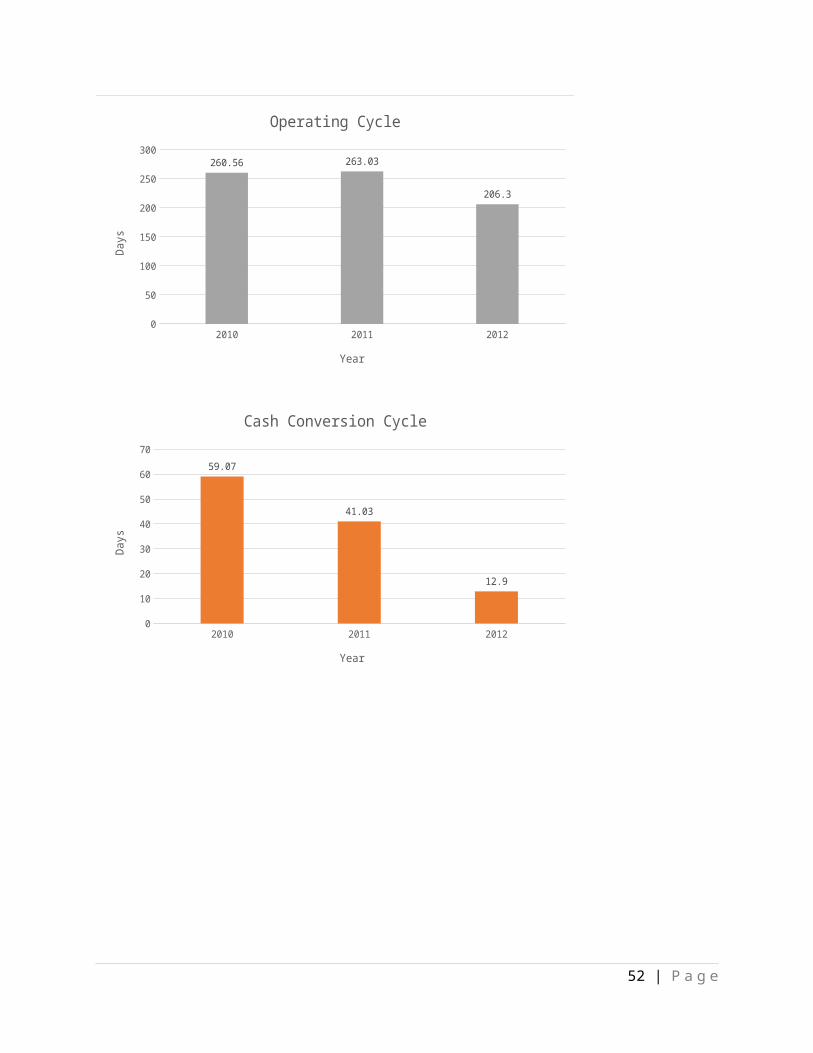
Operating Cycle 260.56 days 262.01 days 206.30 days
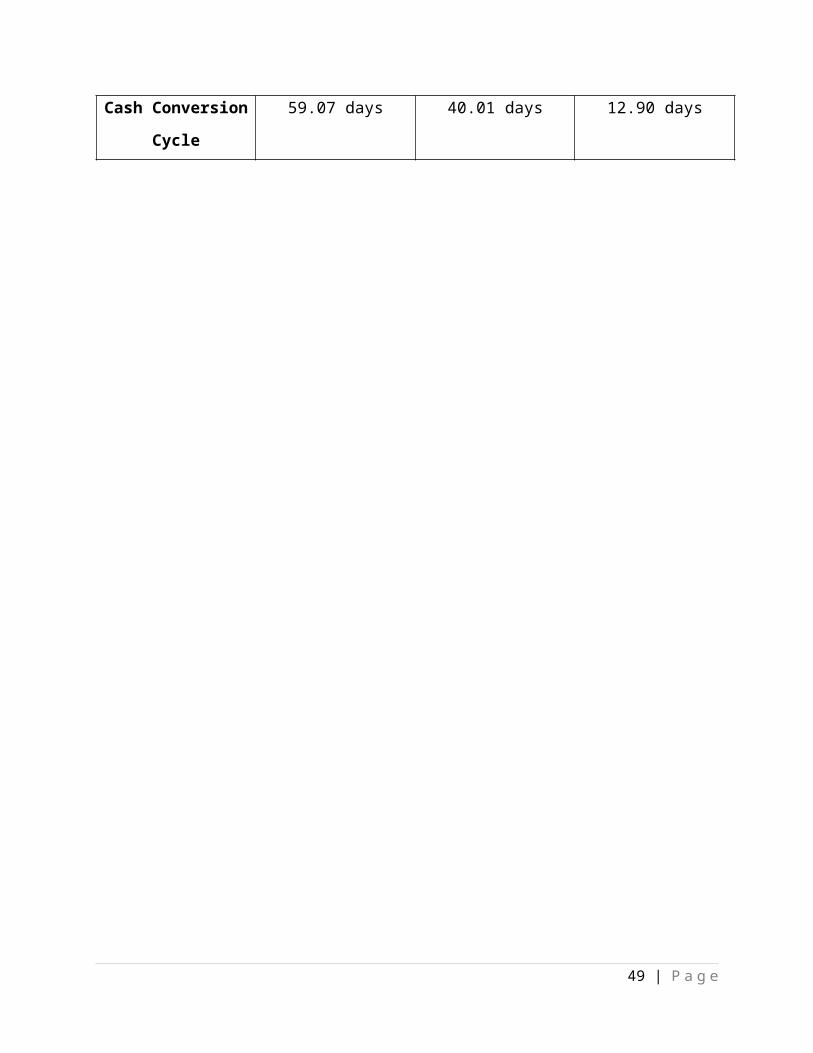
Cash Conversion
Cycle
59.07 days 40.01 days 12.90 days
35 | P a g e
YEAR
DETAIL
36 | P a g e
2010 2011 20120
1
2
3
4
5
6
7
8
5.78
4.61
6.75
Inventory Turnover Ratio
Year
Times
2010 2011 20120
50
100
150
200
250
197.41183.85
152.2
Average Collection Period
Year
Days
37 | P a g e
2010 2011 2012175
180
185
190
195
200
205
210
215
220
225
201.49
222
193.4
Account Payable Deferral Period
Year
Days
2010 2011 20120
10
20
30
40
50
60
70
80
90
63.15
79.18
54.1
Inventory Conversion Period
Year
Days
38 | P a g e
2010 2011 20120
50
100
150
200
250
300
260.56 263.03
206.3
Operating Cycle
Year
Days
2010 2011 20120
10
20
30
40
50
60
70
59.07
41.03
12.9
Cash Conversion Cycle
Year
Days
39 | P a g e
I nv en t o r y T
u r n o v er Rati o
Av er ag e Co l l
ec tio n Pe r i o
d
Ac c o u n t Pa y ab l e
Defe
r r a l P e r i o
d
I nv en t o r y C
o n v er s i on P
er i od
Op er ati n g C
y c l e
C a sh Co n v er s i o
n Cy c l e5
.78
19
7.4
1
20
1.4
9
63
.15
26
0.5
6
59
.07
4.6
1
18
3.8
5
22
2
79
.18
26
3.0
3
41
.03
6.7
5
15
2.2
19
3.4
54
.1
20
6.3
12
.9
Chart Title2010 2011 2012
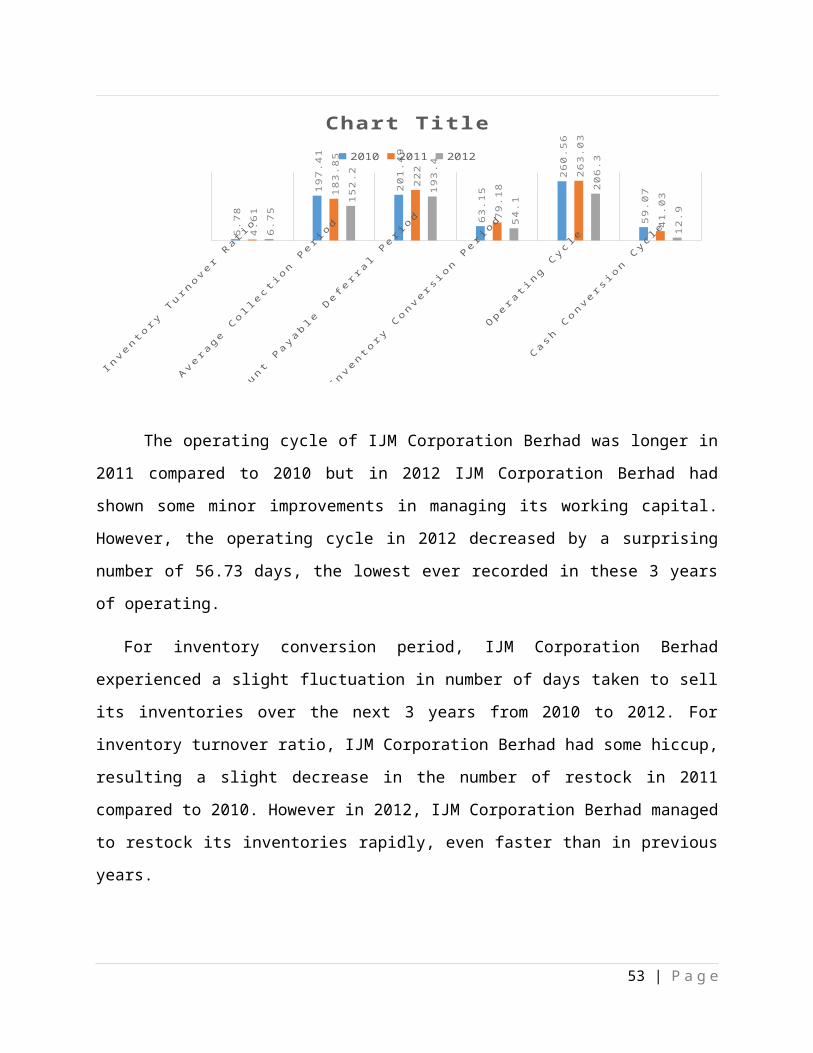
The operating cycle of IJM Corporation Berhad was longer in 2011 compared to 2010 but
in 2012 IJM Corporation Berhad had shown some minor improvements in managing its working
capital. However, the operating cycle in 2012 decreased by a surprising number of 56.73 days,
the lowest ever recorded in these 3 years of operating.
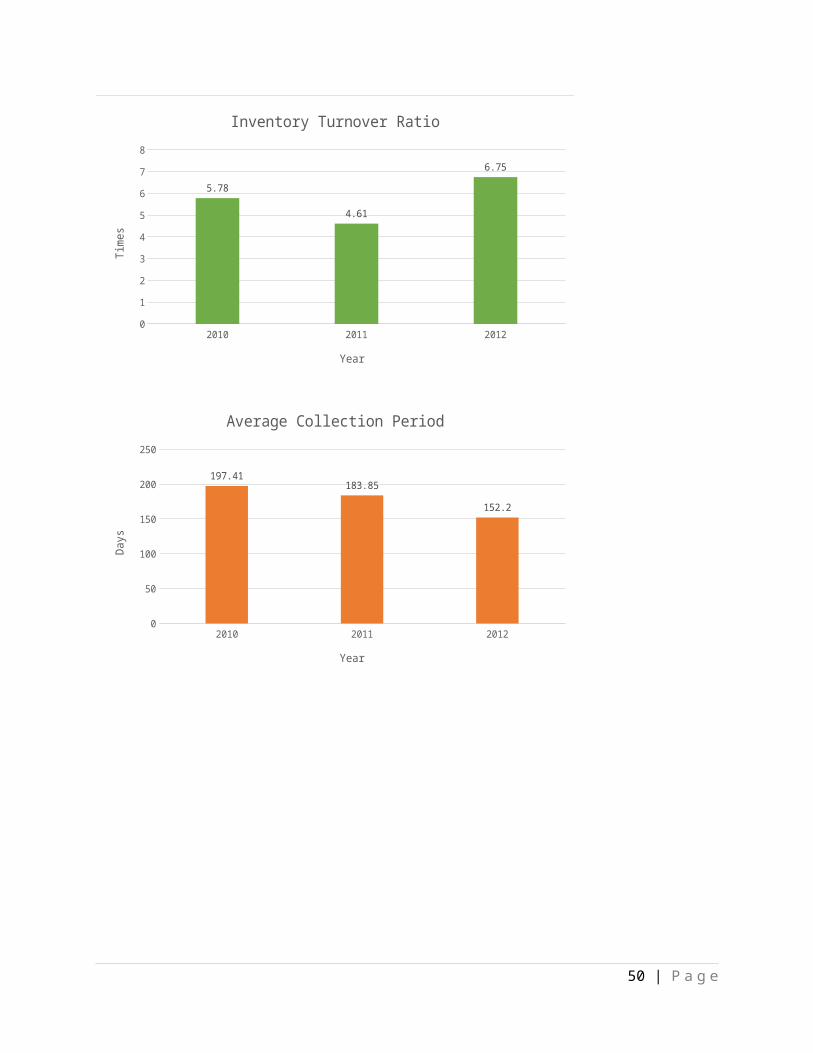
For inventory conversion period, IJM Corporation Berhad experienced a slight fluctuation in
number of days taken to sell its inventories over the next 3 years from 2010 to 2012. For
inventory turnover ratio, IJM Corporation Berhad had some hiccup, resulting a slight decrease in
the number of restock in 2011 compared to 2010. However in 2012, IJM Corporation Berhad
managed to restock its inventories rapidly, even faster than in previous years.
In 2011, the chart shows that the average collection period for IJM Corporation Berhad is
shorter compared to 2010. It clearly shows that IJM Corporation Berhad was able to collect from
their account receivable efficiently. Maintaining the record, in 2012, IJM Corporation Berhad
was even more efficient in collecting debt from its account receivables, proving the statement is
its shorter average number of days compared to year 2011 and 2010.
For accounts payable deferral period, from 2010 to 2012, the average number of days taken
to pay its suppliers fluctuate, but managed to score the lowest days in 2012 which had given IJM
Corporation Berhad trade credit to finance the firm.
40 | P a g e
CONCLUSION
Based on the financial position of both company , it can conclude that UEM Land has a better overall performance compare to IJM Corp. UEM Land is more liquid from IJM Corp. except for the average collection period and account receivable turnover ratio. As for the capital structure ratio, IJM Corp. is much more riskier than UEM Land while for assets management ratio, IJM Corp. shows a better performance. UEM Land as the best financial position in year 2010 while IJM Corp in year 2012.
Besides, the cash conversion cycle of IJM Corp. is much more better than UEM Land. UEM Land has better cash conversion cycle in year 2011 while IJM Corp. in year 2012. This is due to the low period of cash conversion cycle which illustrates how fast a company can convert resource inputs into cash flows.
41 | P a g e

RECOMMENDATION
From the point of view of a bankers the company that deserves additional capital is UEM Land
Holdings because it has a better performance than IJM Corp. Based on the capital structure ratio,
UEM Land are more capable to pay their interest expenses and debt . Thus, the bank are more
confident in giving loan to this company . Besides, this company is more liquid. So, it can
convert its assets to money in much more shorter period. The increasing revenue in three
consecutive years really shows that the company are really on track. The IJM Corp. does not
deserve additional capital because its financial position is more riskier.
From the point of view of an investors, UEM Land in a good investment because based on the
return on equity, its shows an increasing trends. Thus, it illustrates that the company has manage
to increase the rate of return of the shareholder investment. Although IJM Corp. shows a better
result, but the company make less profit. Thus in future may result in lack of income in the
company.
42 | P a g e
REFERENCES
1. http://www.uemsunrise.com/pdf/UEMLAND_AR2012.pdf 2. http://www.uemsunrise.com/pdf/UEMLAND_AR2011.pdf 3. http://www.financialreport.biz/File/AR/2011/7/29/3336%20-%202152222830876.pdf 4. http://www.financialreport.biz/File/AR/2012/7/30/3336%20-%202152178469349.pdf
43 | P a g e
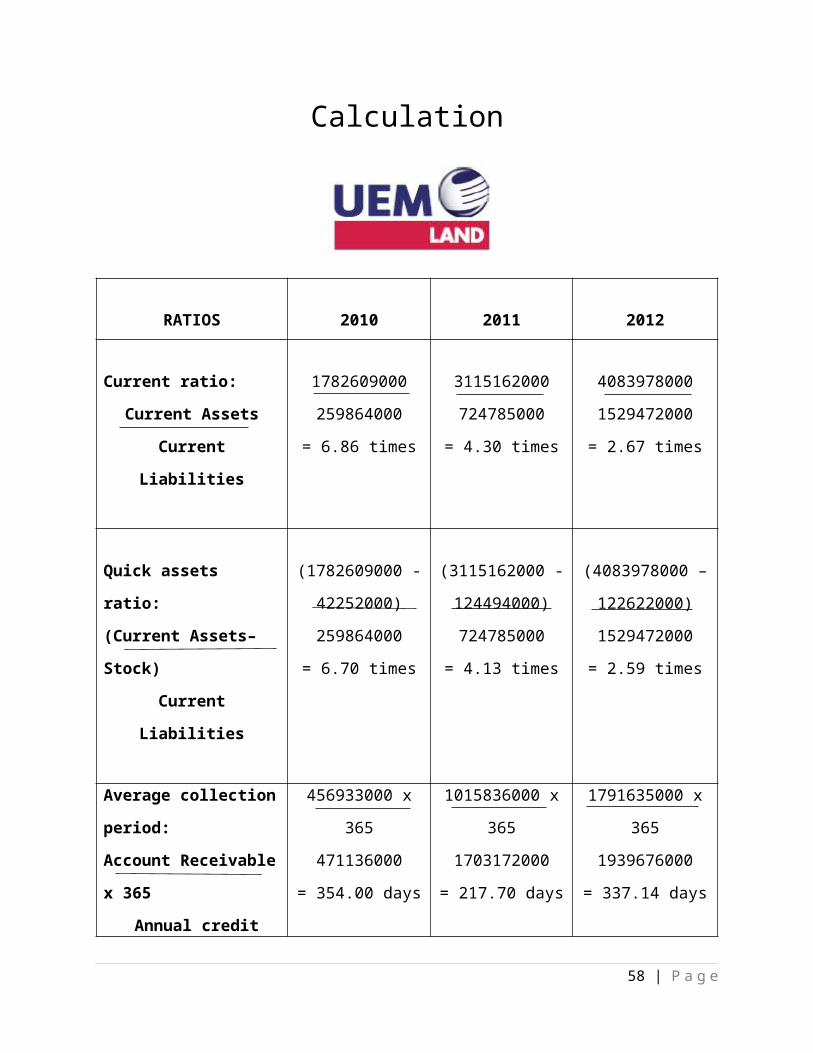
Calculation
RATIOS 2010 2011 2012
Current ratio:
Current Assets
Current Liabilities
1782609000
259864000
= 6.86 times
3115162000
724785000
= 4.30 times
4083978000
1529472000
= 2.67 times
Quick assets ratio:
(Current Assets–Stock)
Current Liabilities
(1782609000 -
42252000)
259864000
= 6.70 times
(3115162000 -
124494000)
724785000
= 4.13 times
(4083978000 –
122622000)
1529472000
= 2.59 times
Average collection
period:
Account Receivable x 365
Annual credit Sales
456933000 x 365
471136000
= 354.00 days
1015836000 x 365
1703172000
= 217.70 days
1791635000 x 365
1939676000
= 337.14 days
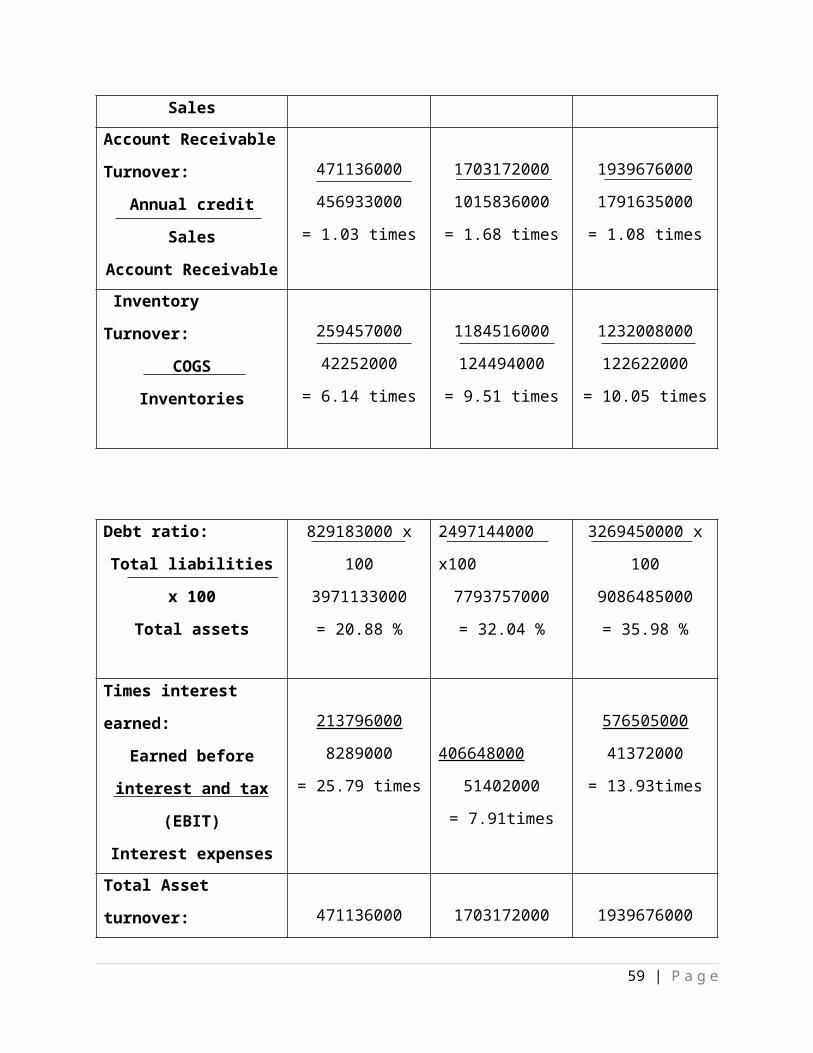
Account Receivable
Turnover:
Annual credit Sales
Account Receivable
471136000
456933000
= 1.03 times
1703172000
1015836000
= 1.68 times
1939676000
1791635000
= 1.08 times
Inventory Turnover:
COGS
Inventories
259457000
42252000
= 6.14 times
1184516000
124494000
= 9.51 times
1232008000
122622000
= 10.05 times
44 | P a g e
Debt ratio:
Total liabilities x 100
Total assets
829183000 x 100
3971133000
= 20.88 %
2497144000 x100
7793757000
= 32.04 %
3269450000 x 100
9086485000
= 35.98 %
Times interest earned:
Earned before interest
and tax (EBIT)
Interest expenses
213796000
8289000
= 25.79 times
406648000
51402000
= 7.91times
576505000
41372000
= 13.93times
Total Asset turnover:
Sales
Total assets
471136000
3971133000
= 0.12 times
1703172000
7793757000
= 0.22 times
1939676000
9086485000
= 0.21 times
Fixed Asset turnover:
Sales
Total Fixed assets
471136000
2188524000
= 0.22 times
1703172000
4678595000
= 0.36 times
1939676000
5002507000
= 0.39 times
Gross profit margin:
Gross profit x 100
sales
211679000 x 100
471136000
= 44.93 %
518656000 x 100
1703172000
= 30.45 %
707668000 x 100
1939676000
= 36.48 %
Operating profit margin:
Operating profit x 100
sales
179473000 x 100
471136000
= 38.09 %
364116000 x 100
1703172000
= 21.38 %
487171000 x 100
1939676000
= 25.12 %
45 | P a g e
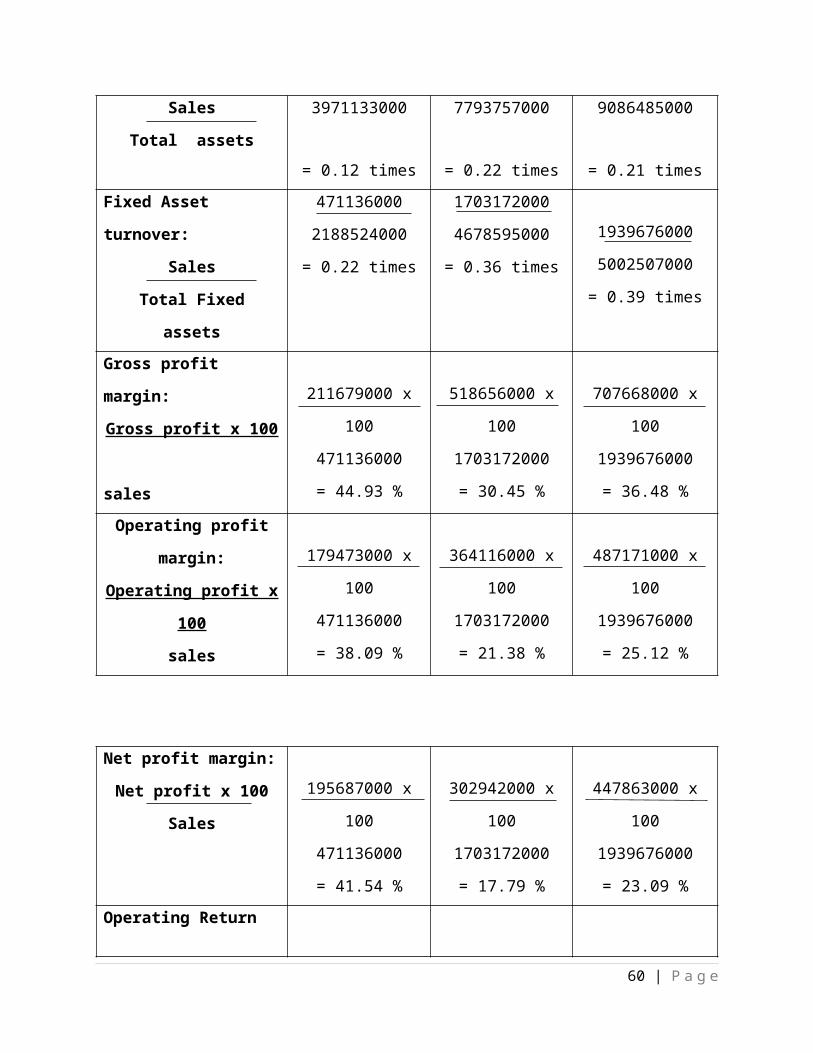
Net profit margin:
Net profit x 100
Sales
195687000 x 100
471136000
= 41.54 %
302942000 x 100
1703172000
= 17.79 %
447863000 x 100
1939676000
= 23.09 %
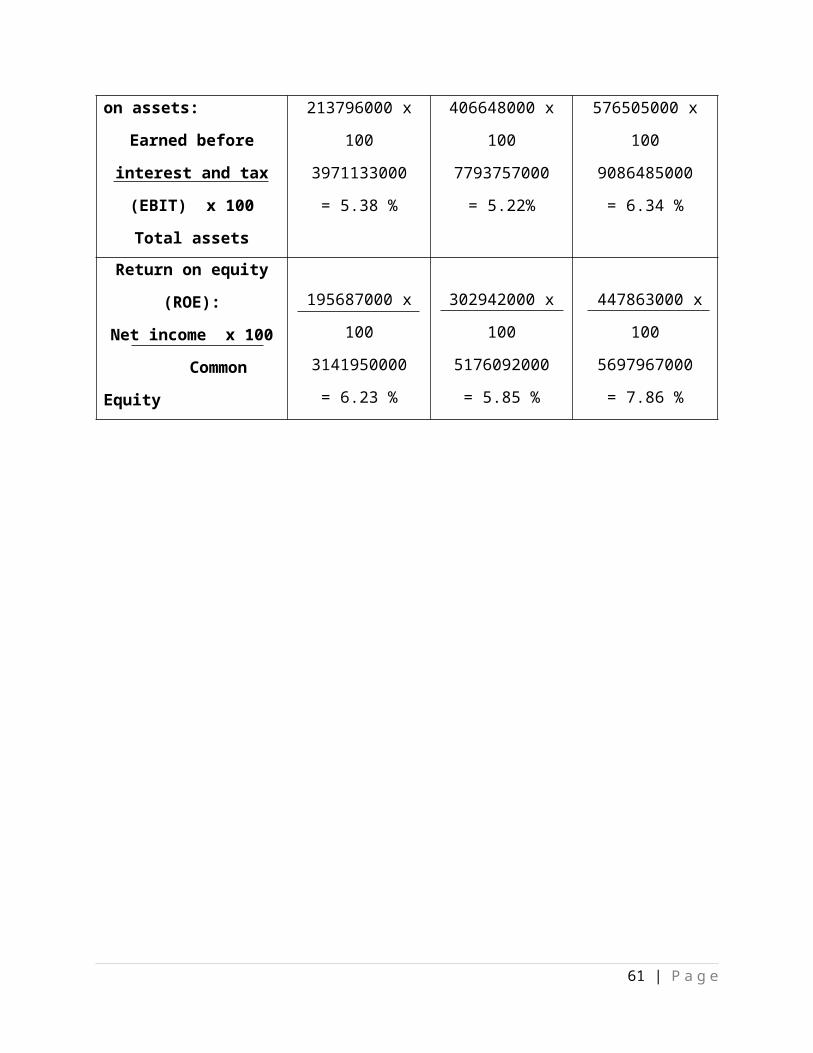
Operating Return on
assets:
Earned before interest
and tax (EBIT) x 100
Total assets
213796000 x 100
3971133000
= 5.38 %
406648000 x 100
7793757000
= 5.22%
576505000 x 100
9086485000
= 6.34 %
Return on equity (ROE):
Net income x 100
Common Equity
195687000 x 100
3141950000
= 6.23 %
302942000 x 100
5176092000
= 5.85 %
447863000 x 100
5697967000
= 7.86 %
46 | P a g e
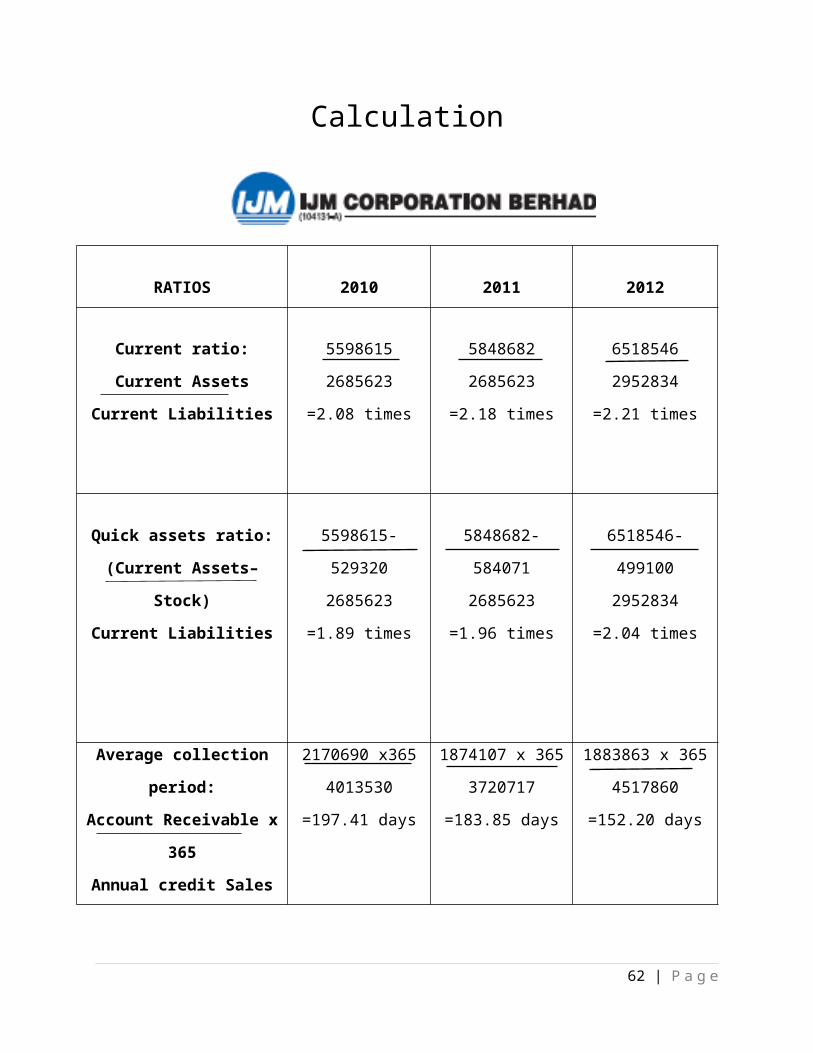
Calculation
RATIOS 2010 2011 2012
Current ratio:
Current Assets
Current Liabilities
5598615
2685623
=2.08 times
5848682
2685623
=2.18 times
6518546
2952834
=2.21 times
Quick assets ratio:
(Current Assets–Stock)
Current Liabilities
5598615-529320
2685623
=1.89 times
5848682-584071
2685623
=1.96 times
6518546-499100
2952834
=2.04 times
Average collection period:
Account Receivable x 365
Annual credit Sales
2170690 x365
4013530
=197.41 days
1874107 x 365
3720717
=183.85 days
1883863 x 365
4517860
=152.20 days
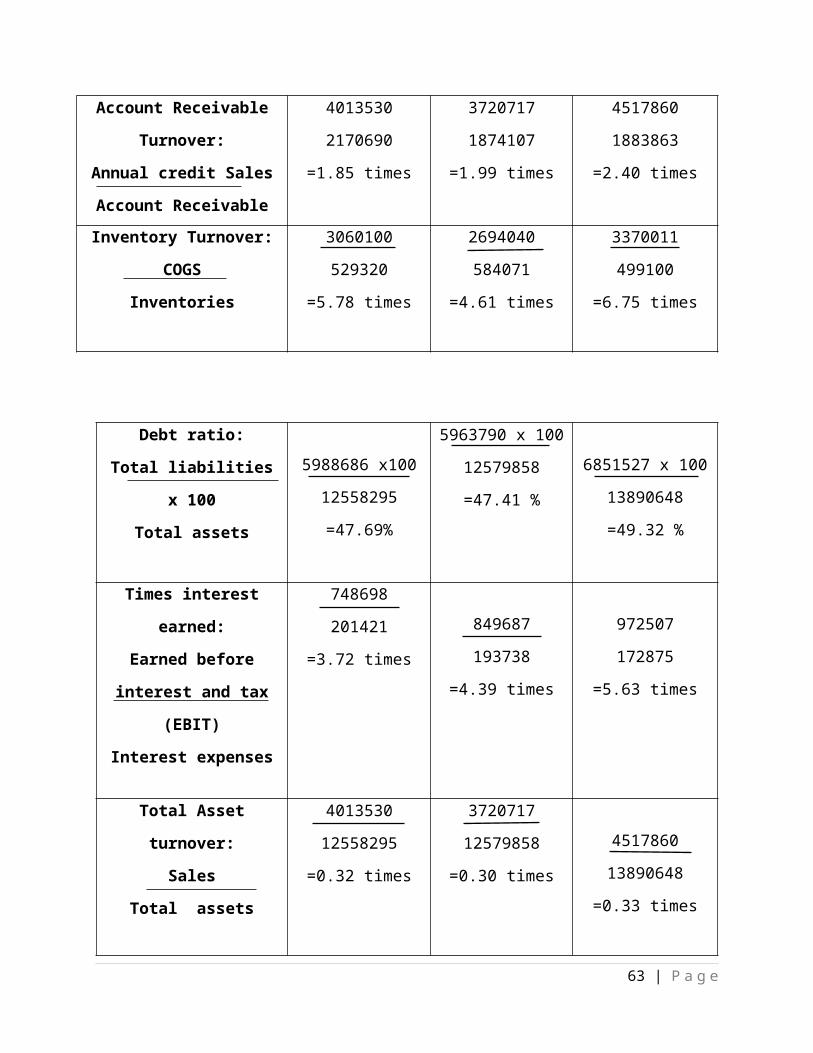
Account Receivable
Turnover:
Annual credit Sales
Account Receivable
4013530
2170690
=1.85 times
3720717
1874107
=1.99 times
4517860
1883863
=2.40 times
Inventory Turnover:
COGS
Inventories
3060100
529320
=5.78 times
2694040
584071
=4.61 times
3370011
499100
=6.75 times
47 | P a g e
Debt ratio:
Total liabilities x 100
Total assets
5988686 x100
12558295
=47.69%
5963790 x 100
12579858
=47.41 %
6851527 x 100
13890648
=49.32 %
Times interest earned:
Earned before interest
and tax (EBIT)
Interest expenses
748698
201421
=3.72 times
849687
193738
=4.39 times
972507
172875
=5.63 times
Total Asset turnover:
Sales
Total assets
4013530
12558295
=0.32 times
3720717
12579858
=0.30 times
4517860
13890648
=0.33 times
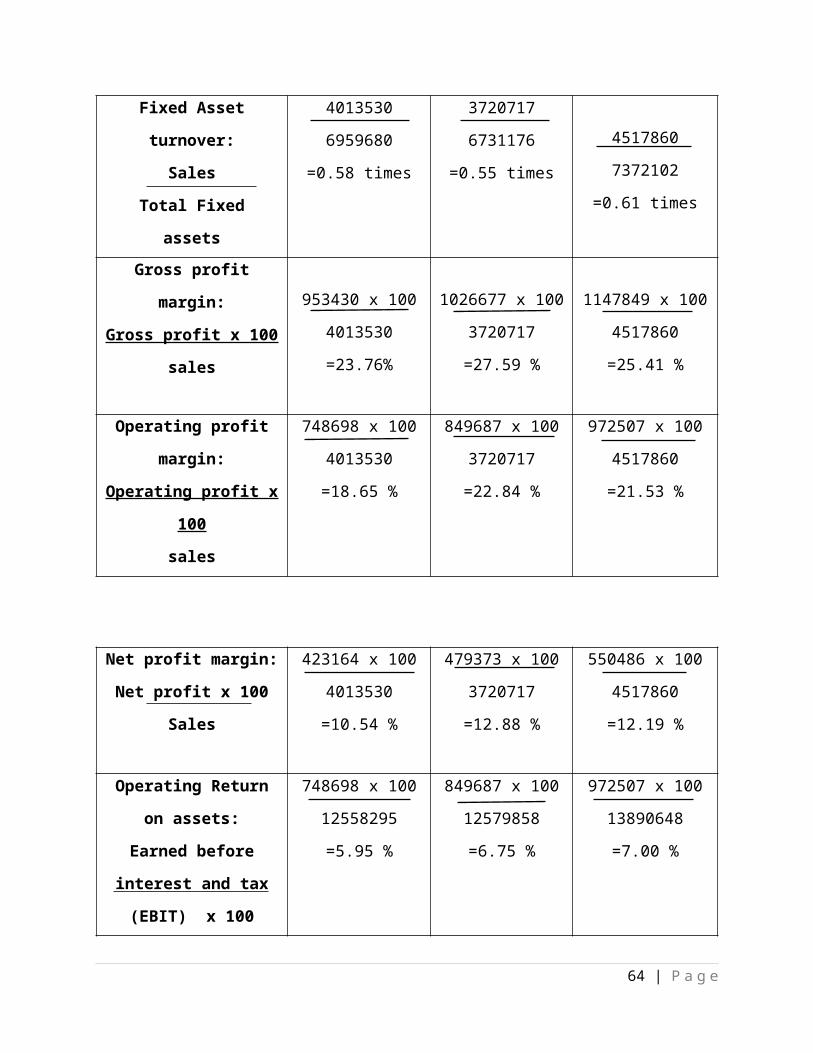
Fixed Asset turnover:
Sales
Total Fixed assets
4013530
6959680
=0.58 times
3720717
6731176
=0.55 times
4517860
7372102
=0.61 times
Gross profit margin:
Gross profit x 100
sales
953430 x 100
4013530
=23.76%
1026677 x 100
3720717
=27.59 %
1147849 x 100
4517860
=25.41 %
48 | P a g e
Operating profit margin:
Operating profit x 100
sales
748698 x 100
4013530
=18.65 %
849687 x 100
3720717
=22.84 %
972507 x 100
4517860
=21.53 %
Net profit margin:
Net profit x 100
Sales
423164 x 100
4013530
=10.54 %
479373 x 100
3720717
=12.88 %
550486 x 100
4517860
=12.19 %
Operating Return on
assets:
Earned before interest
and tax (EBIT) x 100
Total assets
748698 x 100
12558295
=5.95 %
849687 x 100
12579858
=6.75 %
972507 x 100
13890648
=7.00 %
Return on equity (ROE):
Net income x 100
CommonEquity
423164 x 100
6457359
=6.55 %
479373 x 100
6516907
=7.36 %
550486 x 100
6957698
=7.91 %
49 | P a g e
Calculation
CASH CONVERSION CYCLE
2010 2011 2012
Inventory Turnover
Ratio:
COGS
Inventory
259457000
422252000
= 6.14 times
1184516000
124494000
= 9.51 times
1232008000
122622000
= 10.05 times
Inventory
Conversion Period:
365
Inventory Turnover
Ratio
365
6.14
= 59.45 days
365
9.51
= 38.38days
365
10.05
= 36.32 days
Average Collection
Period:
Account Receivables
+Annual Credit Sales
456933000
471136000
365
= 354.00 days
1015836000
1703172000
365
= 217.70 days
1791635000
1939676000
365
50 | P a g e
YEAR
DETAIL
365 = 337.14 days
Operating Cycle:Inventory Conversion
Period
+
Average Collection
Period
59.45 + 354.00
= 413.45 days
38.38 + 217.70
= 256.08 days
36.32 + 373.14
= 373.46 days
Account Payable
Deferral Period:
365
COGS
Accounts Payables
365
259457000
155669000
= 218.99 days
365
1184516000
515787000
= 158.94 days
365
1232008000
712587000
= 211.11 days
Cash Conversion
Cycle:
Operating Cycle
-
Account Payable
Deferral Period
413.45 – 218.99
= 194.46 days
256.08 – 158.94
= 97.14 days
373.46 – 211.11
= 162.35 days
Calculation
CASH CONVERSION CYCLE
51 | P a g e
2010 2011 2012
Inventory Turnover Ratio:
COGSInventory
3060100000529320000
=5.78 times
2694040000584071000
=4.61 times
3370011000499100000
=6.75 times
Average CollectionPeriod:
Account Receivables+Annual Credit Sales
365
21706900004013530000
365
=197.41 days
18741070003720717000
365
=183.85 days
18838630004527860000
365
=152.20 days
Account Payable Deferral Period:
365COGS
Accounts Payables
36530601000001689300000
=201.49 days
36527297030001660175000
=222 days
36533700110001785685000
=193.40 days
Inventory Conversion Period:
365Inventory Turnover
Ratio
3655.78
=63.15 days
3654.67
=78.16 days
3656.75
=54.10 days
Operating Cycle:Inventory Conversion
Period+
63.15 + 197.41
=260.56 days
78.16 + 183.85
=262.01 days
54.10 + 152.20
=206.30 days
52 | P a g e
YEAR
DETAIL
Average Collection Period
Cash Conversion Cycle:
Operating Cycle-
Account Payable Deferral Period
260.56 – 201.49
=59.07 days
262.01 – 222
=40.01 days
206.30 – 193.40
=12.90 days
53 | P a g e

Annual Report UEM Land
54 | P a g e
55 | P a g e
56 | P a g e
57 | P a g e
58 | P a g e
59 | P a g e
Annual Report IJM Corp.
60 | P a g e
61 | P a g e
62 | P a g e
63 | P a g e
64 | P a g e