Embed Size (px)
Citation preview

Assigning Metrics for Optimization
Evaluation Measures
• Each evaluation measure (EM) is a category by which an option is ranked/graded– Example: A car can be ranked by mileage, top
speed, number of gears, and seating capacity.
• A metric (or value function) must be established for each EM
Value Functions
• A single value metric must be specified for each EM:
– Sometimes, lower ratings are preferred• Example: lower cost
– Sometimes, higher ratings are preferred • Example: higher mileage
– Choose the one that is applicable to the case.
• The scale of each metric must then be normalized to a range of 1.
Choosing a Value Function for an Evaluation Measure
• There are two types of value functions:– Piecewise linear
• Used for arbitrary scales of performance, attractiveness, etc. • Few data points are available• Good for expressing discontinuity
– Exponential• Used for stress, deflection, and other physical or concrete
factors.• Many data points can be obtained• Suitable for incorporating a risk factor

Example: Piecewise Linear Value Function
• The x-axis shows the grading scale for productivity (chosen arbitrarily)
• The y-axis shows the relative value of each grade• In this case, an improvement from a grade of -1 to
0 is as much as an improvement from 0 to 2.
Risk Tolerance
• How daring is the decision maker?– Risk tolerant: report a better score than is
calculated by the metric (positive – Risk averse: report a worse score than is
calculated (negative – Risk neutral: report the actual score (
• The risk level can be – Calculated using the method in the next slide– Estimated by looking at the different graphs
shown in the following slides or created by a simulation.

Technical Method for Solving ρ
• ρ > 0.1 * Range of Measurement
• Find mid-value score (i.e. value = 0.5)
• Assign value of 0.5 to a specific score
• Solve numerically or use a table– Calculate normalized mid-value (range of
scores 1)– Find normalized ρ– De-normalize ρ by multiplying by the range
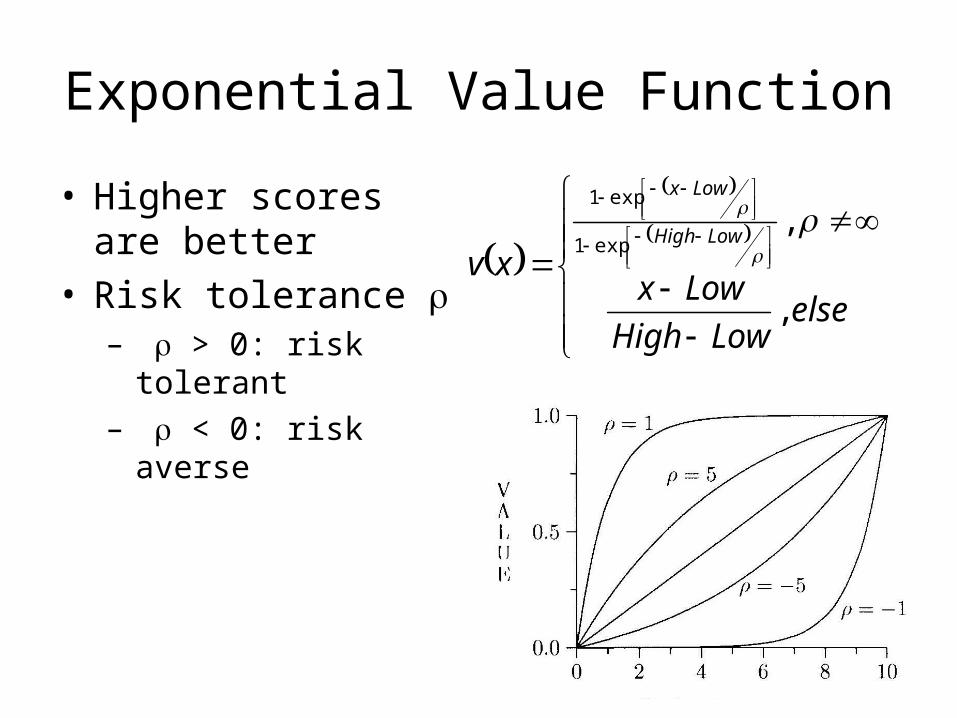
Exponential Value Function
• Higher scores are better
• Risk tolerance – > 0: risk tolerant– < 0: risk averse
elseLowHigh
Lowxxv
LowHigh
Lowx
,
,exp1
exp1
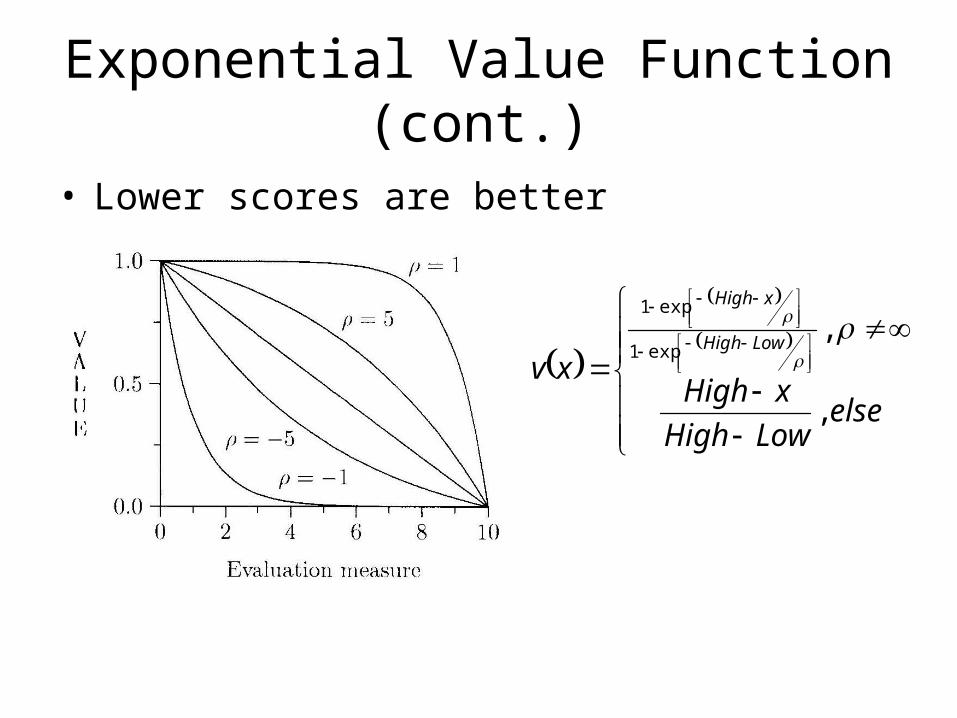
Exponential Value Function (cont.)
• Lower scores are better
elseLowHigh
xHighxv
LowHigh
xHigh
,
,exp1
exp1
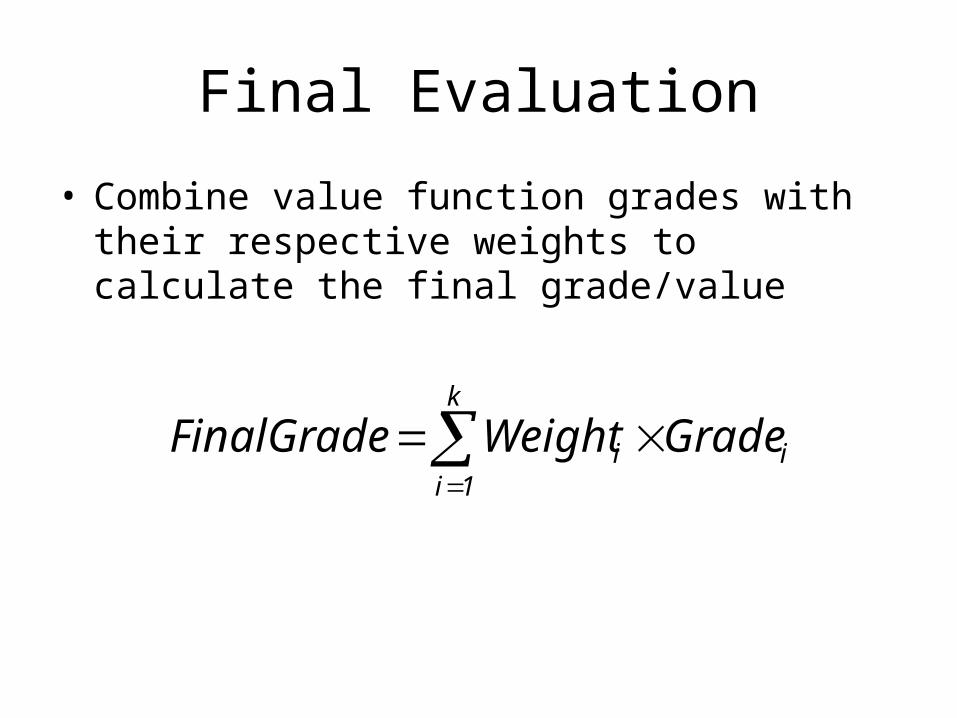
Final Evaluation
• Combine value function grades with their respective weights to calculate the final grade/value
k
1iii GradeWeightFinalGrade
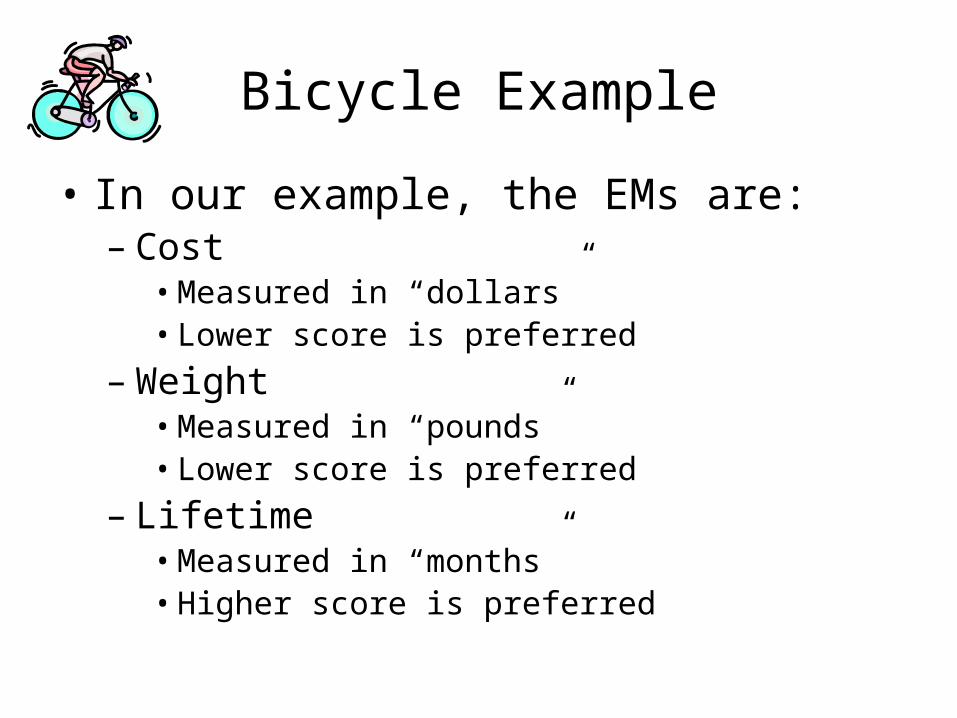
Bicycle Example
• In our example, the EMs are:– Cost
• Measured in “dollars” • Lower score is preferred
– Weight• Measured in “pounds” • Lower score is preferred
– Lifetime• Measured in “months” • Higher score is preferred

Bicycle Example (cont).
• We use the exponential value function.– Use a risk-averse outlook for personal safety,
e.g. set ρ = -5.
• The exponential value function has been built into an MS Excel module and will be explained/utilized in later lectures.