Embed Size (px)
Citation preview

1
Assets and the Poor: Evidence from Individual Development Accounts
Chapter in Inclusion in the American Dream: Assets, Poverty, and Public Policy Michael Sherraden and Lisa Morris, Editors
Mark Schreiner
Michael Sherraden Margaret Clancy
Lissa Johnson Jami Curley Min Zhan
Sondra Beverly Michal Grinstein-Weiss
June 2003
Center for Social Development
George Warren Brown School of Social Work Washington University in Saint Louis
Campus Box 1196, One Brookings Drive, Saint Louis, MO 63130-4899 Telephone: (314) 935-9778 Fax: (314) 935-8661
[email protected], http://gwbweb.wustl.edu/csd/ Acknowledgments We thank the private foundations that fund the American Dream Demonstration (ADD): Ford, Charles Stewart Mott, Joyce, F.B. Heron, John D. and Catherine T. MacArthur, Citigroup, Fannie Mae, Levi Strauss, Ewing Marion Kauffman, Rockefeller, and the Moriah Fund. We also thank the Evaluation Advisory Board: Margaret Clark, Claudia Coulton, Kathryn Edin, John Else, Robert Friedman, Irving Garfinkle, Karen Holden, Laurence Kotlikoff, Robert Plotnick, Salome Raheim, Marguerite Robinson, Clemente Ruíz Durán, and Thomas Shapiro. Robert Friedman, founder and chair of the Corporation for Enterprise Development (CFED), conceived and produced ADD. Brian Grossman, René Bryce-Laporte, and other CFED staff have also supported the evaluation of ADD.
Karen Edwards, Suzie Fragale, and Anupama Jacob provided consistently excellent managerial and editorial support. We are especially grateful to the host organizations in ADD and to their IDA staffs.

2
Assets and the Poor: Evidence from Individual Development Accounts
1. Introduction
The question of how to help the poor get rich is, in essence, the question of how to help them build assets. Poverty is a trap because resources are needed to produce resources. Poor people must consume most of their incoming resources, so they cannot save much. With low savings, they do not produce enough to increase their income enough to break the cycle.
To escape from poverty requires capital, be it human, physical, social, or financial. Many U.S. policies subsidize asset accumulation (Sherraden, 1991), sometimes to combat poverty. For example, the most important asset of the poor is their human capital, and the most widespread asset-subsidy policy is public education. Deductions for mortgage interest subsidize home ownership, the bedrock of the middle class and the second-most important asset of the poor. Subsidized student loans (and public colleges and universities) and subsidized retirement accounts are other common asset subsidies that reduce poverty. The Homestead Act (Williams, this volume) and the G.I. Bill subsidized assets for many poor people. Most asset subsidies, however, go disproportionately to the non-poor because they directly or indirectly require wealth. For example, local-school finance places the best public schools in wealthy neighborhoods. Tax-advantaged retirement accounts link subsidies to the human capital required to reach a high tax bracket. Subsidized debt is indirectly linked to wealth because loans can finance only part of a purchase and because wealth signals creditworthiness. Tax breaks for asset accumulation (such as tax deferments for Individual Retirement Accounts and 401(k) plans or tax deductions for student-loan interest and home-mortgage interest) are weak incentives for poor people in low tax brackets. Furthermore, larger loans mean larger subsidies, so the poor—who go to less-expensive colleges and buy less-expensive homes—get smaller subsidies. Whatever the administrative, targeting, and incentive reasons to link asset subsidies to wealth, loans, and taxes, the current system does less to include the poor than the non-poor. A new policy proposal designed to help the poor build assets—Individual Development Accounts (IDAs)—does not require wealth, tax breaks, or debt. Withdrawals from IDAs are matched if used to buy a home, to pay for post-secondary education, or to finance self-employment. Participants in IDAs also receive financial education and support from IDA staff. This chapter analyzes asset accumulation in IDAs by poor people in the American Dream Demonstration (ADD). The main results are: • Poor people can save and build assets in IDAs. It is unknown, however, whether they save
more than they would have without IDAs. • Income and welfare receipt were not linked with net deposits in IDAs. The very poor saved a
larger share of their income than the less-poor. Also, members of all racial/ethnic groups saved in IDAs, although some saved more than others.

3
• Institutional characteristics mattered. In particular, greater financial education was associated with greater saving, and higher match rates were associated with a greater likelihood of savings something but, given that something was saved, with lower savings.
• IDAs in ADD were costly. A different program structure and a different bundle of services
may be needed if access to IDAs is to become universal and permanent.
This chapter first presents IDAs and ADD and reviews relevant theory. It then discusses evidence from ADD on whether the poor can save in IDAs, who saves in IDAs, how IDAs work, and what IDAs cost. The final section discusses the main results from a policy perspective.

4
2. IDAs and ADD
Individual Development Accounts (IDAs) subsidize asset accumulation by the poor. IDAs differ from Individual Retirement Accounts (IRAs) or 401(k) plans in that IDAs:
• Target the poor rather than the non-poor • Provide subsidies through matches rather than through tax breaks • Require financial education IDAs decouple the asset-subsidy mechanism from wealth, taxes, and debt. With IDAs, people who pass an income test deposit post-tax dollars in insured, interest-bearing passbook savings accounts. They receive monthly statements, financial education, and support from staff and peers. Withdrawals are matched if used for home purchase, post-secondary education, or small business. (Some IDA programs also match for home repair, investment in retirement accounts, job training, or even cars or computers.) Withdrawals for other purposes are allowed, but they are not matched. Matches are disbursed directly to vendors.
Sherraden’s (1991) original IDA proposal calls for permanent accounts for all, opened at birth, with greater subsidies for the poor. Regardless of balances or activity, the poor would not be “on” or “off” IDAs any more than the non-poor are “on” or “off” IRAs. Funds for program costs and matches may come from public or private sources. As a simple way to subsidize saving for targeted goals, IDAs fit a wide range of public-policy purposes. 2.1 Intellectual history of IDAs
Although development economics has long focused on saving as central to long-term improvement in well-being, public policy in the United States somehow overlooked the importance of saving for the poor (Sherraden, 1991). Public assistance provided just enough cash to meet subsistence requirements, but it stopped short of transfers whose amounts and forms could help people break free of a poverty orbit.
In 1988, a movement started to include the poor in asset-subsidy policies. Friedman’s The Safety Net as Ladder proposed changes to public assistance to encourage development beyond mere subsistence. Haveman’s Starting Even said that “transfer payments are necessary but not sufficient” (p. 149). Sherraden’s “Rethinking Social Policy: Towards Assets” critiqued the subsistence paradigm and proposed IDAs as a step toward a development paradigm. The movement gained momentum (Ackerman and Alstott, 1999; Conley, 1999; Oliver and Shapiro, 1995; Shapiro and Wolff, 2001) and attracted support from many quarters. Bill Clinton—who as governor of Arkansas wrote the foreword to The Safety Net as Ladder—supported IDAs in his 1992 campaign and later proposed a large matched-savings program. In their 2000 platforms, both George W. Bush and Al Gore had billion-dollar IDA proposals. Currently, 37 states have IDA legislation, and, at the national level, the Savings for Working Families Act—if passed—would fund 300,000 IDA accounts. Outside the United States, Canada is sponsoring an IDA demonstration, and the United Kingdom’s Child Trust Fund will give an account and a deposit to each newborn, with larger deposits for children of poor families. 2.2 The American Dream Demonstration
The focal point of research on IDAs in the United States is the American Dream

5
Demonstration (ADD). ADD was run by the Corporation for Enterprise Development from 1997–2003 with private and public funds. Data from ADD covers 2,353 participants (excluding enrollees forced to quit because, for example, they moved away or died) in 14 programs across the United States. Schreiner et al. (2001) describe ADD programs and their rules.
Program staff entered IDA deposits and withdrawals for each participant for all months from when the IDA was opened until the last month for matchable deposits into the Management Information System for Individual Development Accounts (MIS IDA) (Johnson et al., 2000). In addition to monthly cash flows, MIS IDA records initial account-structure parameters, demographic and economic data on participants at enrollment, and intermittent events such as program exit or attendance at financial-education classes.
MIS IDA provides what may be the only high-frequency data on matched saving by the poor. The cash flows are unusually accurate; they come from records of depository institutions and satisfy accounting identities. All data were extensively cross-checked. Still, no data are perfect, and few caveats are in order. IDA staff are not researchers, and, despite a commitment to accurate data and support for the research, data quality varies through time and across programs. Time-constant demographics are very accurate. Time-varying economic data, regardless of accuracy, may change after enrollment, and, as in all surveys, income, assets, and liabilities are noisy and probably understated. Also, fields added to MIS IDA after ADD started were not always collected from all already-enrolled participants, especially those who had left. At the program level, the account-structure parameters in MIS IDA do not always match the rules used in practice or understood by participants. There is no foolproof way to know whether program staff recorded all intermittent events. Throughout this chapter, we take care to note when data issues might influence results. Schreiner et al. (2001) discuss the data at length.
The ADD data are unusually rich, but they cannot answer all questions. For example, the data cover only participants. In ADD, participants were both self-selected (they chose to join based on expected net benefits) and program-selected (most programs targeted people of color, the “working poor”, and/or women). Thus, the effects of use are tangled up with the effects of pre-existing characteristics correlated with selection. Without a credible way what would have happened without IDAs, there is no way to measure the impact of use (nor of eligibility) of IDAs. One program in ADD did randomize across qualified applicants, but that data is not yet available. Because of limited funds, ADD ran for a short time, and so it cannot tell us how poor savers would behave if they had permanent access to IDAs. If the goal is long-term improvement in well-being, if assets foster development, and if IDAs increase asset accumulation by the poor, then a permanent IDA program is probably better than a time-limited one. Sherraden (1991) hypothesizes that saving—by poor and non-poor alike—depends not only on rational choice but also on institutions. This research looks at how variation in institutions (such as match rates, match caps, and financial education) across groups of participants in ADD is associated with variation in saving outcomes. Although programs set rules before enrollment, the rules may still have depended in part on expected participant behavior, so endogeneity bias may affect the results on institutional characteristics to some unknown extent. The MIS IDA data show how participants saved in IDAs in ADD. This is not the grandest of questions, but it matters a lot, especially because some believe that the poor cannot save at all.
6
3. Savings theory and IDAs
This section describes theories of saving and asset accumulation and how the institutional structure of IDAs takes advantage of insights from these theories.
3.1 Saving and asset accumulation
Income is defined as the inflow of resources in a period of time. Assets are stocks of resources held at a point in time. Whether seen as assets or income, resources may be consumed (changed into forms no longer useful) or moved through time. Saving is an increase in assets (or net worth) in a period. Dissaving is a decrease in assets. Saving is not consuming income, and dissaving is consuming assets. Asset accumulation is a long-lasting increase in assets. Saving that consistently exceeds dissaving leads to asset accumulation. The concept of assets encompasses far more than financial assets as cash or as bank-account balances. The chief asset of most people—especially the poor—is human capital. People also possess household durables (such as homes, cars, clothes, furniture, and appliances) and producer durables (such as tools for self-employment). People also use social capital (networks, norms, and trust) to produce information, reduce transaction costs, to buffer shocks, and to soothe psyches. Sherraden (1991) presents a typology of assets and their returns. Asset accumulation matters because resources are required to earn income from production, to smooth consumption, to buffer risk, and to make large purchases. In the absence of constant, massive transfers from government, long-term improvement in individual well-being requires increased productive capacity. Because assets beget assets, escaping from poverty requires asset accumulation. Beyond these economic effects of resource use, Sherraden (1991) suggests that resource ownership has healthy effects on thoughts, behavior, goals, and overall well-being. People who own assets expect better future outcomes, and this expectation may spark hope that in turn changes current feelings, beliefs, and choices. 3.2 Three theories of saving and asset accumulation Theories of saving relevant to IDAs are economic, social/psychological, and behavioral. 3.2.1 Economic Theory
Economics assumes that people seek to maximize long-term well-being subject to constraints. People are assumed forward-looking and rational, and preferences are fixed. Choices and the distribution of their probable consequences are known and fixed. Preferences are the deus ex machina of unobserved causes that drives observed outcomes. For savings and the poor, the fundamental insight of economics is that people who must consume most of their incoming resources just to survive will not be able to save much. Also, because additional consumption is very valuable to people with low consumption, the poor pay more (in terms of foregone utility) to save. Because current savings (in human capital, financial assets, social networks, and producer and consumer durables) determines future production and thus future income, poverty can be a trap of low assets.

7
Economic theory also highlights the importance of indivisibilities. Some assets (such as houses) involve large, all-or-none purchases. Savings for such lumpy items is more difficult than saving for purchases that can be made in bits and pieces. Matches in IDAs address both rate-of-return issues and size-of-return issues. For example, the median match rate in ADD (2:1) may make saving a good deal for poor people despite the high cost in terms of foregone consumption. (Economic theory does not predict that greater rates of return will always lead to greater savings; this issue is taken up again below.) Also, the match changes a given level of savings into a higher level of asset accumulation, perhaps enough to purchase a large asset. 3.2.2 Social/psychological theories These theories—discussed in detail Beverly and Sherraden (1999)—emphasize that people are not always rational and that society shapes preferences. They look behind the deus ex machina of preferences to explain saving-related goals and expectations. Social/psychological theories assume that people do not always form their own goals or even know what choices are available, let alone know all possible consequences of choices. For example, people who see family and friends save are more likely to view saving as a possibility (Lusardi, 2000). Likewise, cultural norms may affect saving goals. For example, U.S. couples with children are more or less expected to own a home, but single and childless couples are not. Broad social norms also mold saving expectations. Americans learn that Benjamin Franklin was wise and that he advised that a penny saved was a penny earned. Many Japanese took their government’s suggestion that they should save one-fifth of income (Bernheim, 1994). In the United States, the home-mortgage interest deduction suggests that a home is a good investment. Likewise, the existence of 401(k) plans in the United States signal not only that workers can save but also that they should save. The institutional structure of IDAs builds on social/psychological theory in several ways. First, the existence of IDAs sends a message that the poor can (and perhaps should) save. In particular, the match attracts attention. Second, IDAs require financial education; people are not assumed to know how to save nor to know the consequences of saving. Third, IDA programs give feedback and social support via staff and peers. Fourth, planning for withdrawals encourages participants to make goals and to think about the benefits of saving. Fifth, participants receive monthly statements that remind them of their goals and track their progress. 3.2.3 Behavioral theory
Like social/psychological theory, behavioral theory relaxes some assumptions in economic theory. It recognizes that people impose systems of mental accounts on their resources (Shefrin and Thaler, 1988). For example, small windfalls—such as lottery wins—may be assigned to splurges. Likewise, people may be comfortable with debt for assets such as a home or a college education but not for eating out or for buying gifts. Behavioral theory also recognizes that people know that they can be their own enemy. People know that they are both forward-looking and short-sighted; they recognize that they will be tempted to spend even if saving would make them better off in the long term. Thus, they may create their own mental or external rewards and punishments that help them save rather than spend (Thaler, 1994; Maital, 1986). For example, they may commit to rules of thumb (and feel guilty when they break them) such as saving one spouse’s income “paying oneself first”. Payroll deduction, probably the most common self-commitment constraint, removes pay-day
8
temptations. Christmas Clubs and time deposits help people stick to saving plans by offering a substantial penalty for early withdrawal. IDAs fit behavioral theory because they help people to commit to save and to resist the temptation to dissave. First, IDAs create a new mental account: savings for a home (or college, or business). The distinct account (and reinforcement from staff that IDA funds are “off-limits”, even though unmatched withdrawals are, in fact, freely and always available) helps participants avoid viewing IDA balances as “spending money” (Beverly, et al., 2003). Second, the expression of the match cap (a limit) in terms of a monthly savings target (a goal) may encourage participants to set monthly savings goals. Third, automatic deposits into IDAs—when available—may help to curb temptations to spend because cash cannot “burn a hole in one’s pocket”. Fourth, the perceived obligation to save in IDAs may give participants a socially acceptable excuse to deny requests from members of social networks (Chiteji and Hamilton).

9
4. Can the poor save in IDAs? ADD shows that the poor can save in IDAs. (Of course, ADD does not address whether the poor saved more with IDAs than they would have without IDAs). 4.1 Participation
Enrollment. ADD enrolled 2,353 participants (line Aa in Table 1). The average length of participation was 26 months (line Ac).
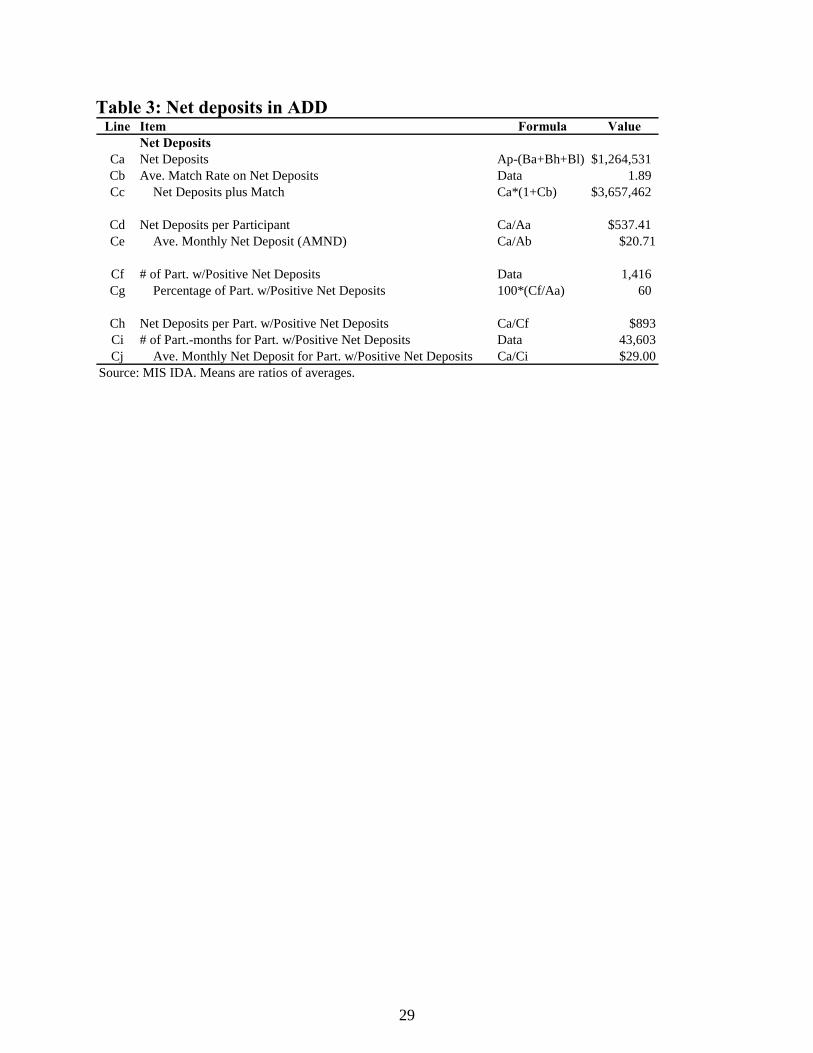
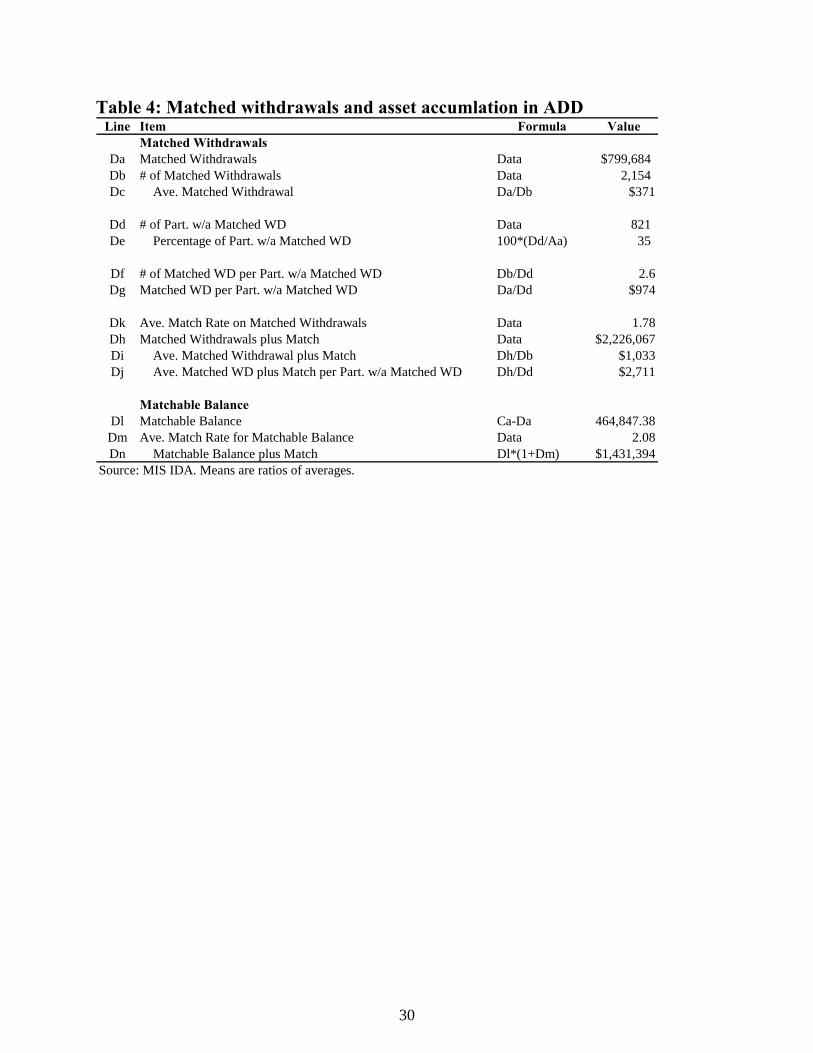
Savers. About 53 percent of participants in ADD were defined as savers because they held net deposits of at least $100 as of the last month in the data. Low savers (47 percent) may have saved and held balances for a time, but the maximum matched withdrawal that they possibly could make was less than $100. 4.2 Savings outcomes Gross deposits. In an average month, the average participant deposited $47.07 (line Am). Unmatched withdrawals. About 67 percent of participants made an unmatched withdrawal (line Bp of Table 2). The average participant in this group made 4.1 unmatched withdrawals, each worth an average of $127 (line Bn). In ADD, average unmatched withdrawal per participant ($526, line Br) almost equaled average net deposits ($537, line Cd of Table 3). Given the average match rate of 1.78:1, unmatched withdrawals represent lost potential matches worth about $936. The unexpected size and frequency of unmatched withdrawals in spite of their high opportunity cost highlights the difficulty of asset accumulation for the poor, even in the supportive institutional context of IDAs. At the same time, it highlights the importance of allowing poor savers to withdraw from their IDAs as they see fit. Net deposits. Defined as gross deposits minus unmatched withdrawals minus balances in excess of the match cap, average net deposits in ADD were $537 ($998 for savers). If all net deposits as of the last month in the data were used in matched withdrawals (in fact, 63 percent had already been matched, and the rest may be matched or withdrawn unmatched), then the average participant would accumulate $1,554 through IDAs ($2,886 for savers.) Average Monthly Net Deposit. AMND—defined as net deposits divided by months of participation—was $20.71 ($34.07 for savers). Median AMND was $8.25 ($30.38 for savers). With an average match rate of 1.78:1, the average participant accumulated about $58 per month or about $691 per year (for savers, $95 per month or $1,137 per year). Matched withdrawals. About 35 percent of participants had made a matched withdrawal as of the last month in the data (line De of Table 4). For this group, the average value of matched withdrawals was $974 (line Dg), and the average value of matched withdrawals plus matches was $2,711 (line Dj).
Matched uses. The largest number (26 percent) of matched withdrawals were for microenterprise, followed by home repair (22.0 percent), post-secondary education (21.5 percent), home purchase (20.9 percent), retirement (7 percent), and job training (2 percent). No matched withdrawals went for other uses. Of the 34 percent of savers without a matched withdrawal as of the last month in the data, 55 percent plan for home purchase, 19 percent for microenterprise, and 16 percent for education. The remaining 9 percent planned for retirement, home repair, or job training. Deposit frequency. On average, participants made deposits in 6 of every 12 months (line

10
Al of Table 1). Program staff promoted regular deposits out of the belief that slow-and-steady wins the saving race, that if people set a saving goal and then consume the rest (rather than setting a consumption goal and then saving the rest), then they will make a greater effort to save in difficult months.
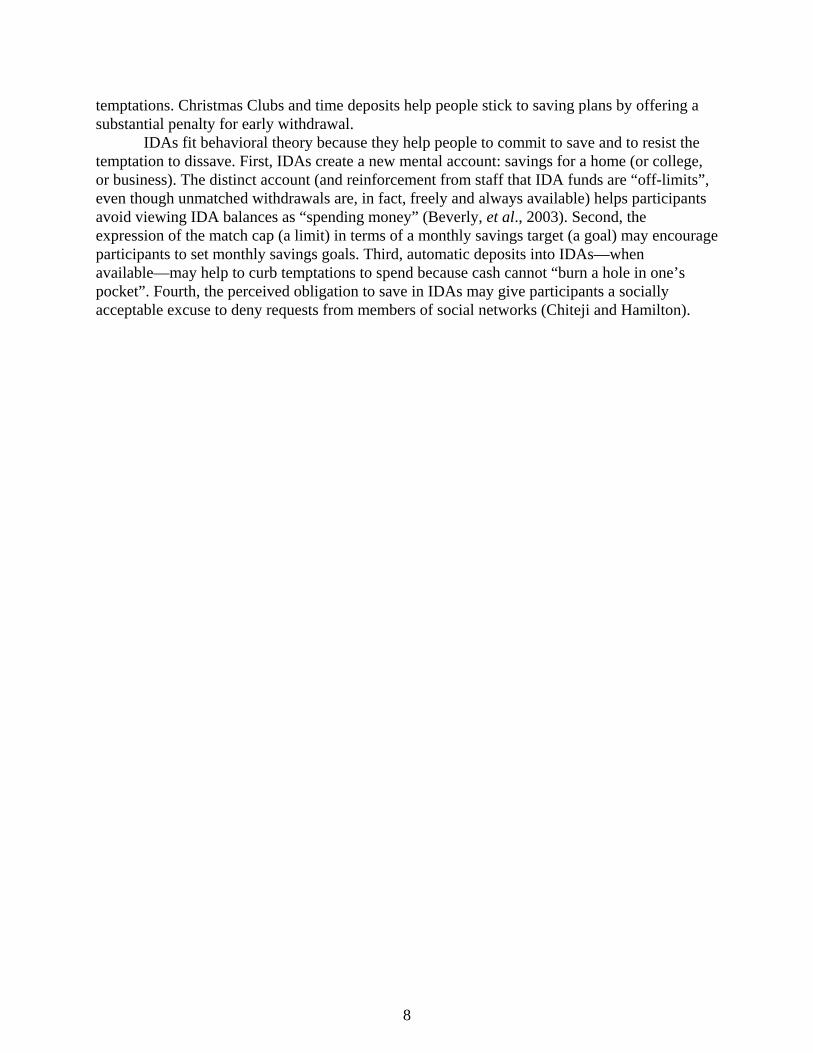
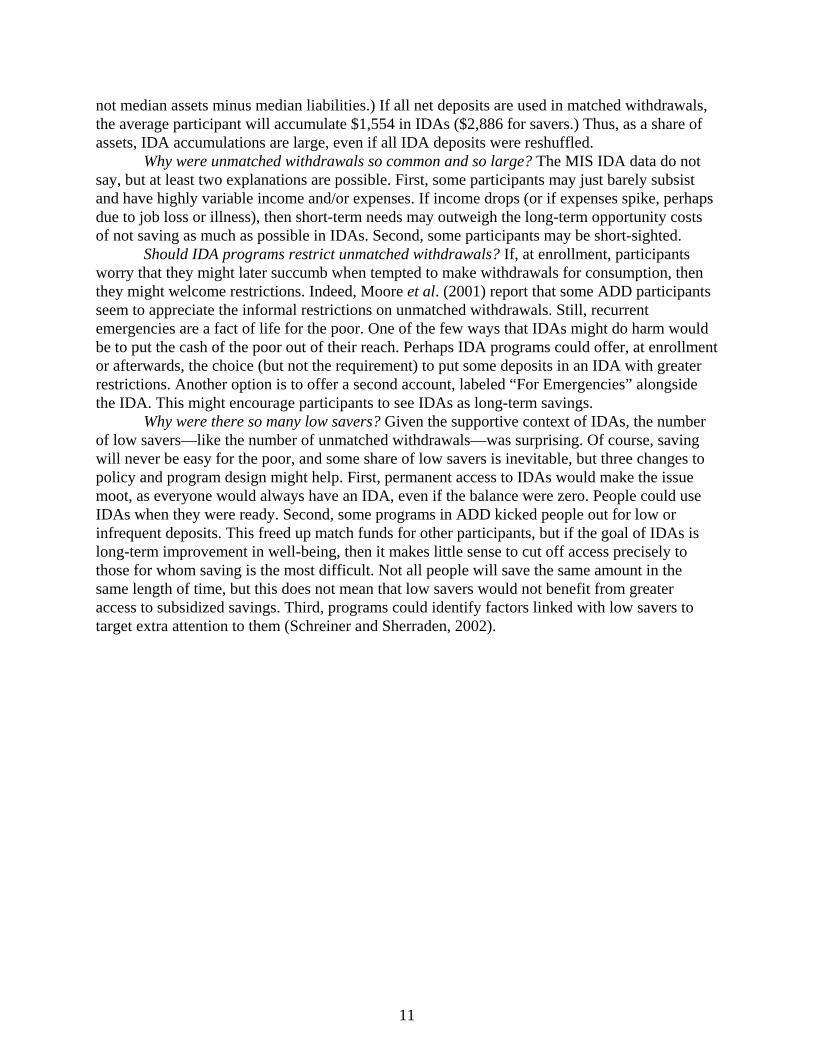
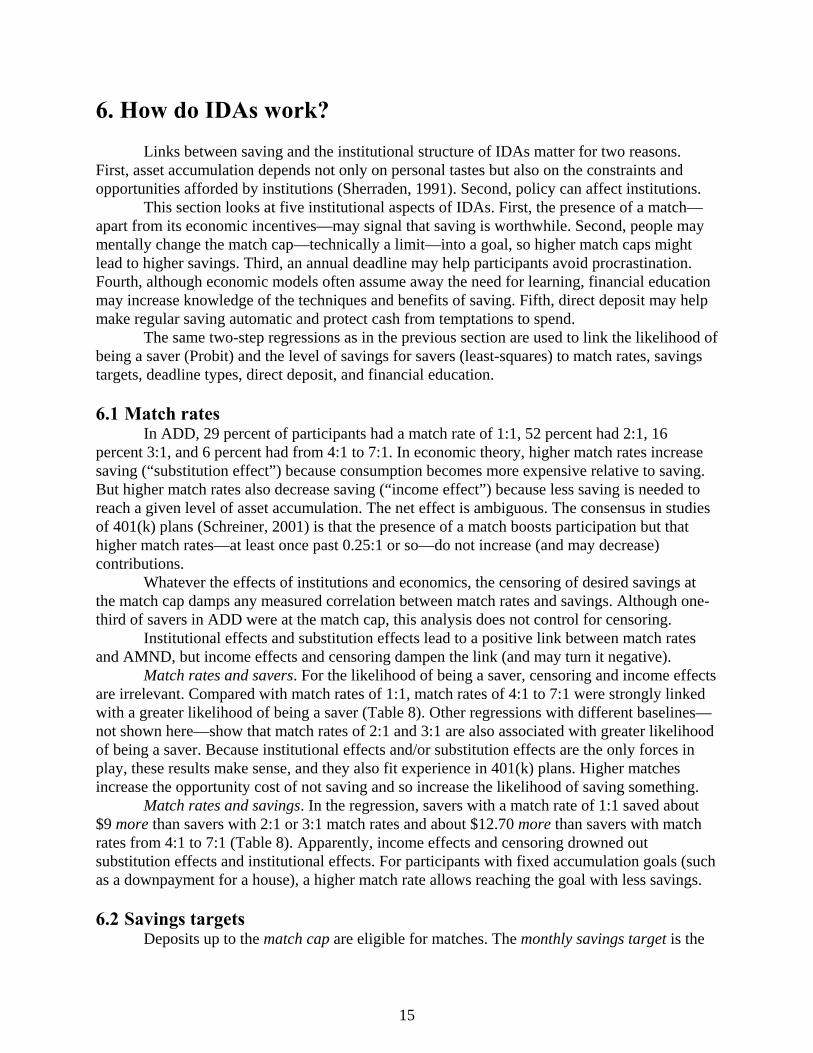
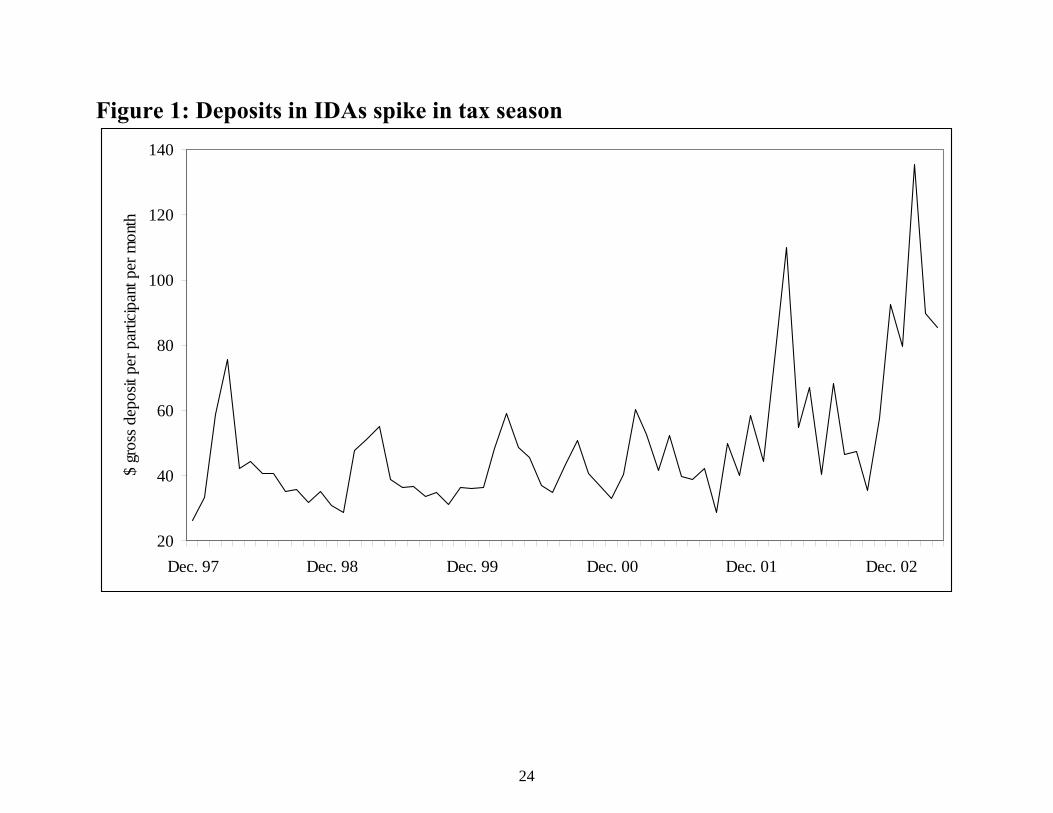
Saving rate. On average, net deposits in IDAs were 1.5 percent of income at enrollment (median 0.5 percent). Across participants, the savings rate decreased as income increased. As discussed later, perhaps the institutional effects of IDAs are stronger than the economic effects of income, and perhaps these institutional effects are strongest for poorer people. Utilization. On average, participants used 50 percent of their match-eligibility (median 21 percent). IDAs and EITC. Each year, net deposits in IDAs spiked in tax season (Figure 1). Participants likely save a chunk of tax refunds and/or the Earned Income Tax Credit. Some programs in ADD explicitly encourage this, and Beverly et al., Smeeding, and Souleles, 1999 support the idea that saving is easier from tax refunds and the EITC than from “regular” income. IDAs and deadlines. About 48 percent of participants had annual deadlines; for example, they could make up to $750 of matchable deposits each year for three years. The other 52 percent had “lifetime” deadlines; for example, they could make up to $2,250 of matchable deposits any time in three years. Figure 2 reveals two patterns. First, all participants—regardless of the type of deadline—saved more at the start than at the end. Various explanations are possible, including waning enthusiasm, concentration of staff support and financial education at the beginning, and/or shrinking stocks of assets to reshuffle into IDAs. Second, Figure 2 shows that saving by participants with annual deadlines spiked in the twelfth month of each year. Perhaps annual deadlines help poor people save in IDAs (just as they help non-poor people save in IRAs) by forcing them to make a use-it-or-lose-it decision that cannot be put off. 4.3 Questions and discussion
Can the poor save in IDAs? Participants in ADD saved about $21 per month, made deposits about every other month, and saved about $1 for every $2 that could be matched. With a match rate of 1.78:1, average accumulation in IDAs was about $700 per year.
The possibility that the poor—even the very poor—can save cannot be dismissed. IDAs may have the potential to boost saving and asset accumulation by some poor people.
Did the poor take full advantage of IDAs? On average, participants in ADD left about $470 in matches unused each year. Yet poor savers in IDAs are not so different from non-poor savers in IRAs. For example, 90 percent of IRA-eligible people in a given year do not contribute (Bernheim, 1997). Among IRA contributors, one-third save the maximum amount in three straight years; in IDAs in ADD, exactly one-third of savers saved the maximum amount.
Do the poor save more with IDAs than without? MIS IDA data cannot answer this. Are IDAs enough to make a difference? For the non-poor, a few hundred dollars—or even a few thousand dollars—may not seem like much. Participants in ADD do use IDAs, however, to buy assets expected to have high returns and that mark key steps in the life course. Perhaps more importantly, they say in qualitative research that IDAs improve their outlooks. Perhaps what matters is not only the amount saved but also the process (and the simple existence) of saving.
For perspective, median liquid assets at enrollment were $125 (outliers make the median more representative than the mean; see Schreiner et al., 2002). Median illiquid assets (mostly houses and cars) were $2,500, debt was $2,875, and net worth was $360. (Median net worth is
11
not median assets minus median liabilities.) If all net deposits are used in matched withdrawals, the average participant will accumulate $1,554 in IDAs ($2,886 for savers.) Thus, as a share of assets, IDA accumulations are large, even if all IDA deposits were reshuffled.
Why were unmatched withdrawals so common and so large? The MIS IDA data do not say, but at least two explanations are possible. First, some participants may just barely subsist and have highly variable income and/or expenses. If income drops (or if expenses spike, perhaps due to job loss or illness), then short-term needs may outweigh the long-term opportunity costs of not saving as much as possible in IDAs. Second, some participants may be short-sighted. Should IDA programs restrict unmatched withdrawals? If, at enrollment, participants worry that they might later succumb when tempted to make withdrawals for consumption, then they might welcome restrictions. Indeed, Moore et al. (2001) report that some ADD participants seem to appreciate the informal restrictions on unmatched withdrawals. Still, recurrent emergencies are a fact of life for the poor. One of the few ways that IDAs might do harm would be to put the cash of the poor out of their reach. Perhaps IDA programs could offer, at enrollment or afterwards, the choice (but not the requirement) to put some deposits in an IDA with greater restrictions. Another option is to offer a second account, labeled “For Emergencies” alongside the IDA. This might encourage participants to see IDAs as long-term savings. Why were there so many low savers? Given the supportive context of IDAs, the number of low savers—like the number of unmatched withdrawals—was surprising. Of course, saving will never be easy for the poor, and some share of low savers is inevitable, but three changes to policy and program design might help. First, permanent access to IDAs would make the issue moot, as everyone would always have an IDA, even if the balance were zero. People could use IDAs when they were ready. Second, some programs in ADD kicked people out for low or infrequent deposits. This freed up match funds for other participants, but if the goal of IDAs is long-term improvement in well-being, then it makes little sense to cut off access precisely to those for whom saving is the most difficult. Not all people will save the same amount in the same length of time, but this does not mean that low savers would not benefit from greater access to subsidized savings. Third, programs could identify factors linked with low savers to target extra attention to them (Schreiner and Sherraden, 2002).

12
5. Among the poor, who saves in IDAs? This section looks at how participant characteristics were associated with savings outcomes in IDAs. The question of whether IDAs are better suited to some people matters for two reasons. First, IDAs might be universal or targeted (for example, only to the “working poor”). Second, because IDAs require participants to save, some worry that IDAs may work only for the most-advantaged of the poor. ADD suggests that although more-advantaged people sometimes save more than others, even relatively disadvantaged people can still save in IDAs. 5.1 Comparison with the general U.S. low-income population Compared to people in households in the September 1995 Survey of Income and Program Participation with income at or below 200 percent of the family-size adjusted poverty threshold, participants in ADD were better educated, more likely to be employed, and more likely to have a bank account. This probably reflects how programs in ADD targeted the “working poor”. Participants are also more likely to be female (80 percent), African-American (47 percent), or never-married (49 percent, with 86 percent of these being women with children). This reflects how programs in ADD targeted the disadvantaged among the “working poor”. 5.2 Demographic and socio-economic characteristics
Two regressions were used to link a wide range of participant and program characteristics first with the likelihood of being a saver (Probit), and then, for savers, with AMND, the level of average monthly net deposits (ordinary least-squares). The two steps help control for unobserved factors that might influence AMND (Schreiner et al., 2002). Because of possible two-way causation between IDA participation and economic characteristics, the regressions use at-enrollment data. To control for possible two-way causation between program characteristics and programs’ expectations of participant behavior (as well as other program-level unobserved characteristics), both regressions include program fixed effects. The least-squares regression does not control for censoring of desired savings at the match cap.
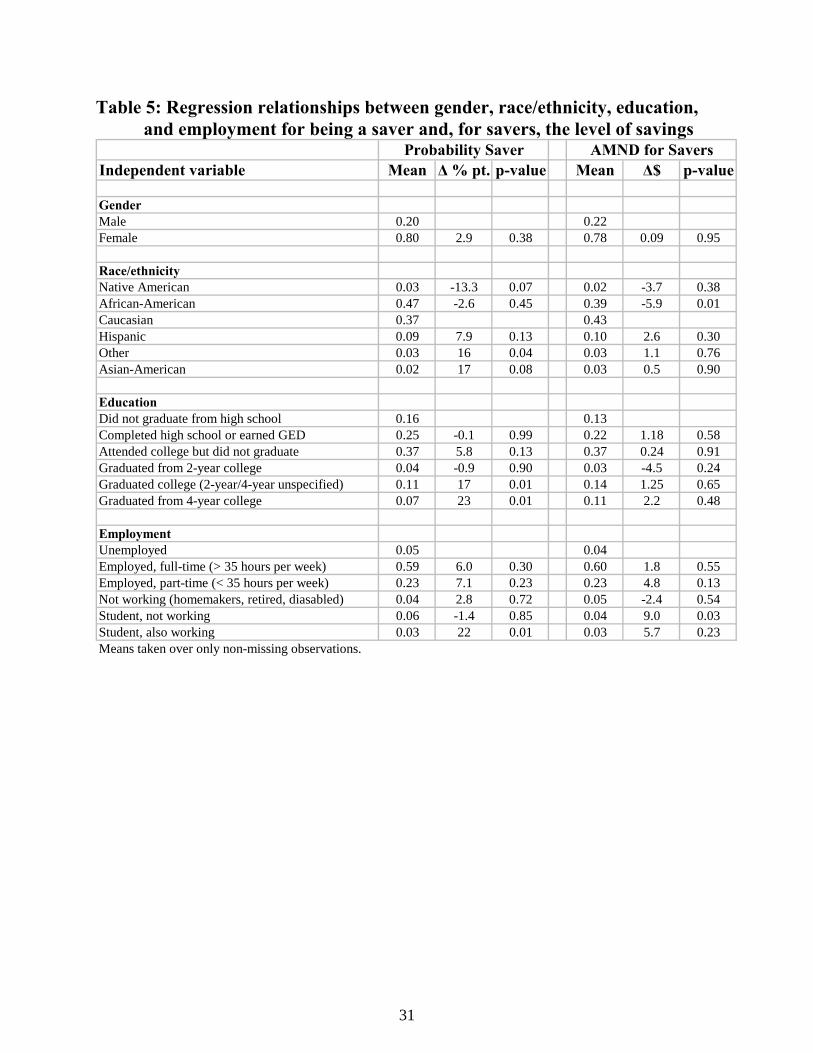
Missing values were handled with zero-order regression. The Probit was significant at p = 0.01, and R2 in the least-squares regression was 0.36. A series of tables report results from the two regressions relevant to this chapter. Full results are available on request. Gender. About 80 percent of participants in ADD were female. Gender was not associated with the likelihood of being a saver nor with AMND for savers (Table 5). Race/ethnicity. About 47 percent of participants in ADD were African-American, 37 percent were Caucasian, 9 percent Hispanic, 3 percent Native American, 2 percent Asian-American, and 3 percent “Other”. In the Probit “saver” regression, Asian-Americans and “Other” ethnicities were 17 and 16 percentage points more likely to be savers than Caucasians. Native Americans were 13 percentage points less likely to be savers. Caucasians, African-Americans, and Hispanics had about the same likelihood of being savers. In the least-squares “AMND” regression, the only significant estimate is that African-Americans save about $6 less per month. Of course, these associations are due not to race/ethnicity per se but rather to a constellation of socially produced unobserved factors (sedimented through centuries) linked with both saving and race/ethnicity. In a perfect model that controlled for everything, the estimated link between race/ethnicity and savings would be zero.

13
In the regressions here, observed factors explain about 80 percent of the gap. Even 20 percent, however, is large. Most analyses attribute to discrimination any differences in outcomes correlated with unobserved factors correlated with race/ethnicity. This is correct, but it forgets that differences in outcomes correlated with observed factors correlated with race/ethnicity are also due to discrimination. With more data, the correlation between outcomes and unobserved factors would shrink, but not because discrimination decreased. In the end, what matters are inclusive improvements in long-term well-being. This requires policies that shrink the gaps in observed and unobserved factors and thus lead to smaller gaps in savings and asset accumulation.
Do IDAs help narrow these gaps? The MIS IDA data do not reveal whether disadvantaged groups increased their savings more than other groups (or even whether IDAs increased savings for anyone). It is virtually impossible, however, for IDAs to have worsened the African-American/Caucasian wealth ratio. For example, the average Caucasian in ADD participated for 27.5 months, and the average African American participated for 24.4 months. With a match rate of 1.78:1, the worst case is that all IDA deposits from African Americans ($12.94 per month) came from shifted assets and that all deposits from Caucasians ($23.11) came from new savings. Even so, the ratio of net worth for participants in ADD in these two groups would fall from about 5.3:1 at enrollment ($5,486 for Caucasians versus $1,037 for African Americans) to about 4.5:1 (7,253 versus 1,600) at the end of ADD (although, in this example, the absolute gap increases). IDAs do not pretend to be a panacea for racial/ethnic gaps in wealth, but they do seem to have improved equity in at least some ways, and they certainly can improve access to institutionalized savings mechanisms for the poor regardless of race/ethnicity. Still, much more could be done, including within IDA programs. Education. About 84 percent of ADD participants had completed high school, and 24 percent had some type of college degree. Broadly, participants with a college degree were much more likely to be savers, but education was not linked with AMND. Employment. Because programs in ADD tended to target the “working poor”, most participants were employed; 78 percent worked full-time or part-time. Compared to the unemployed, students who were working were more likely to be savers (by 25 percentage points) and students who were not working saved about $8 more per month. These very large associations matter because educational accounts may be an important policy option. Receipt of public assistance. About 51 percent of participants in ADD received some type of public assistance—whether AFDC, TANF, food stamps, and/or SSI/SSDI—at or before enrollment. Controlling for other factors in the regressions, the receipt of public assistance was not correlated with savings outcomes (Table 6). While not conclusive, this bodes well for the possibility that even the very poor can save in IDAs (Zhan et al., 2003). Income. On average, participants in ADD were at 116 percent of the poverty line (median 106 percent). About 88 percent of participants were below 200 percent of poverty. In regressions, income was not strongly linked with being a saver nor with AMND. (The two statistically significant coefficients in Table 6 are very small.) Furthermore, across participants, the savings rate fell as income rose; the very poor saved a greater share of income in IDAs than the less-poor. Economic theory (Deaton, 1992) and U.S. data (Wolff, 1998) would not predict this. What explains this? First, a host of measurement issues tends to depress measured income more for the very poor than for the less-poor (Schreiner et al., 2001); this might induce a spurious negative correlation between income and the savings rate. Second, censoring of desired

14
savings at the match cap could also induce a spurious negative correlation. Third, the institutional features of IDAs—matches, targets, deadlines, direct deposit, financial education, and staff support—may have not only overshadowed the economic effect of income but also been strongest for the very poor (Sherraden, et al., 2003). For example, the pull of the savings target may be greater for those furthest away. Likewise, the match is a larger share of total resources for the very poor than for the less-poor. Furthermore, the very poor may have more to learn about how or why to save, so, in response to given a level of financial education, they may change their behavior more. Likewise, the very poor may have a greater use for social support. All three factors—measurement noise, censoring, and institutional effects—probably are at work, but the MIS IDA data cannot disentangle them. Still, the broad lesson is that less income did not imply less savings in IDAs. Assets. ADD participants who saved in the past—as shown by the presence at enrollment of a checking account, a home, or a car—were much more likely to be savers, although, given that they were savers, they did not save more (Table 7). Furthermore, the likelihood of being a saver increased (up to a point) with the balance in savings and checking accounts. (Ownership of a passbook account—regardless of balance—was associated with a lower likelihood of being a saver and a decrease in AMND.) MIS IDA does not reveal why past savers had more success: perhaps they had more assets to reshuffle, perhaps they were more comfortable with banks, or perhaps the presence of past savings marks unobserved characteristics that also lead to higher IDA savings. In any case, the results do not suggest that people who have not already saved cannot save in IDAs—clearly some can and do—but it does suggest that people who have already saved successfully in other forms tend also to have more success in IDAs. Debts. Participants with debt (regardless of the kind or amount) were about 7 percentage points less likely to be savers and, if they were savers, they saved $2.30 less per month. ADD reinforces the commonsense idea that debt inhibits saving. Other factors. The regressions controlled for a host of other participant characteristics, which, to conserve space, are not discussed here. Detailed results are available on request.
15
6. How do IDAs work? Links between saving and the institutional structure of IDAs matter for two reasons. First, asset accumulation depends not only on personal tastes but also on the constraints and opportunities afforded by institutions (Sherraden, 1991). Second, policy can affect institutions. This section looks at five institutional aspects of IDAs. First, the presence of a match—apart from its economic incentives—may signal that saving is worthwhile. Second, people may mentally change the match cap—technically a limit—into a goal, so higher match caps might lead to higher savings. Third, an annual deadline may help participants avoid procrastination. Fourth, although economic models often assume away the need for learning, financial education may increase knowledge of the techniques and benefits of saving. Fifth, direct deposit may help make regular saving automatic and protect cash from temptations to spend. The same two-step regressions as in the previous section are used to link the likelihood of being a saver (Probit) and the level of savings for savers (least-squares) to match rates, savings targets, deadline types, direct deposit, and financial education. 6.1 Match rates
In ADD, 29 percent of participants had a match rate of 1:1, 52 percent had 2:1, 16 percent 3:1, and 6 percent had from 4:1 to 7:1. In economic theory, higher match rates increase saving (“substitution effect”) because consumption becomes more expensive relative to saving. But higher match rates also decrease saving (“income effect”) because less saving is needed to reach a given level of asset accumulation. The net effect is ambiguous. The consensus in studies of 401(k) plans (Schreiner, 2001) is that the presence of a match boosts participation but that higher match rates—at least once past 0.25:1 or so—do not increase (and may decrease) contributions. Whatever the effects of institutions and economics, the censoring of desired savings at the match cap damps any measured correlation between match rates and savings. Although one-third of savers in ADD were at the match cap, this analysis does not control for censoring.
Institutional effects and substitution effects lead to a positive link between match rates and AMND, but income effects and censoring dampen the link (and may turn it negative). Match rates and savers. For the likelihood of being a saver, censoring and income effects are irrelevant. Compared with match rates of 1:1, match rates of 4:1 to 7:1 were strongly linked with a greater likelihood of being a saver (Table 8). Other regressions with different baselines—not shown here—show that match rates of 2:1 and 3:1 are also associated with greater likelihood of being a saver. Because institutional effects and/or substitution effects are the only forces in play, these results make sense, and they also fit experience in 401(k) plans. Higher matches increase the opportunity cost of not saving and so increase the likelihood of saving something. Match rates and savings. In the regression, savers with a match rate of 1:1 saved about $9 more than savers with 2:1 or 3:1 match rates and about $12.70 more than savers with match rates from 4:1 to 7:1 (Table 8). Apparently, income effects and censoring drowned out substitution effects and institutional effects. For participants with fixed accumulation goals (such as a downpayment for a house), a higher match rate allows reaching the goal with less savings. 6.2 Savings targets
Deposits up to the match cap are eligible for matches. The monthly savings target is the

16
match cap divided by the months in which matchable deposits are possible. Calling this a target reflects both that participants may change caps into targets and that many programs in ADD advised participants to try to deposit this amount each month. The average monthly savings target in ADD was $42, and average AMND was about half that. In the regressions, higher targets were strongly linked both with a greater likelihood of being a saver and—for savers—with higher AMND (Table 8). Two factors may explain this: • Institutional effects in which participants change limits into goals. People challenged with a
higher limit/goal may save more. • Desired net deposits are often censored, inducing a spurious positive correlation between
savings and match caps. 6.3 Deadlines In theory, deadlines might matter in two opposing ways. First, annual deadlines might help procrastinators to save regularly (nearly every financial advisors believes that, compared to irregular saving, regular saving leads to greater accumulation). Second, “lifetime” deadlines might allow participants to make very large deposits whenever they happen to have a large cash inflow. Still, because people with annual deadlines can have “excess” deposits in one year carried over and applied to the next year, the advantage of “lifetime” deadlines would seem small. Table 8 shows, however, that participants in ADD with “lifetime” deadlines were 1.4 percentage points more likely to be savers and—if they were savers—they saved $7.60 more per month. The reasons for this are unclear. 6.4 Direct deposit In theory, direct deposit should improve savings outcomes, both because it allows the saver to avoid having to decide monthly whether to save and because it reduces transaction costs. The MIS IDA data do not contain information on access (as opposed to use) to direct deposit in ADD. For participants, the use of direct deposit was associated with a greater likelihood of being a saver (a huge effect, 19 percentage points), although not with greater savings. 6.5 Financial education
Besides matches, a key feature of IDAs is required financial education. Evidence from 401(k) plans (Bernheim and Garrett, 1996; Bayer, Bernheim, and Scholz, 1996) suggests that financial education increases the likelihood of participation (akin to being a saver) and that the effects are largest for lower-income employees and for those who saved little before.
In ADD, the broad goals of the general financial education classes were:
• Increase awareness of savings as a wise choice through discussion of long-term benefits • Instill stronger future orientation through exercises in planning and budgeting • Transfer practical techniques to find cash to save, to deposit it in IDAs, and to leave it in • Communicate IDA rules • Provide a setting for peer support and for the exchange of experiences
MIS IDA recorded hours attended by each participant (Schreiner et al., 2001, discuss the

17
data in more detail). Average hours required were 12, and the average attendance was 10.4 hours.
Because participants who left ADD had fewer opportunities to attend financial education, the Probit regression on the likelihood of being a saver omits hours of financial education. In the least-squares AMND regression, net deposits increased $1 per month per hour of general financial education, up to 10 hours. After that point, more general financial education had no effect. This suggests that some financial education improves saving outcomes. Furthermore, short courses may be just as effective as longer courses.

18
7. What do IDAs cost?
Wise allocation of scarce resources requires some knowledge of costs. All resources have opportunity costs; a dollar used in an IDA is a dollar removed (at least implicitly) from some other use. What matters is not that IDAs have benefits for participants, nor that IDAs have benefits for society as a whole. Rather, what matters is that the social net benefits of the use of resources in IDAs exceed the social net benefits of those resources in their alternative use. Cost data in MIS IDA for ADD are spotty and cannot be cross-checked. Furthermore, some programs sometimes failed to record cost data. Thus, this section focuses on some simple estimates for the first 33 months at one site where a special cost study was made. Costs are probably higher than in a “typical” IDA program, as this site was one of the first IDA programs and so incurred extra expenses in start-up, policy work, and guidance for other IDA programs. Data collection for ADD itself added extra costs. The main results were (Schreiner, 2002): • One month of participation for one participant cost (excluding matches) about $64. • With net deposits of $29 per month, each dollar saved had a social cost of about $2.20. • With an average match rate of 1.5:1, $1 of asset accumulation cost society about $1.50. These estimates ignore non-financial costs as well as benefits of all kinds. They rest on a host of imprecise measurements, heroic assumptions, and back-of-the-envelope guesses. They also ignore many aspects of the bundle of inputs and outputs that is an IDA. Finally, the margin of error is unknown.
Are costs high or low? There is no benchmark to judge (but see Ng, 2001). The ultimate criterion is whether benefits exceed costs, but benefits are not yet measured. Furthermore, the possible efficiency of IDA programs is unknown. IDAs are young, and “best practices” continue to evolve. Still, measures of cost can inform policy even without measures of benefits by setting benchmarks and calling attention to efficiency (Schreiner and Yaron, 2002). Although average costs did fall through time and even though these rough cost estimates may have upward biases, IDAs are still costly. For example, even if costs fell to $1 per dollar of net deposits, funders—in particular, the federal government, the only possible funder for a permanent, universal IDA policy—might have difficulty supporting IDAs with the current bundle of services and decentralized structure, even if social benefits do turn out to exceed costs. At the same time, qualitative evidence from ADD suggests that participants place a high value on financial education and close contact with staff. The tension between the desire for intensive services and the cost structures that would allow for wide access may lead in the long term to two tiers of IDA designs, the first with broad access, simple services, and lower costs, and the second with targeted access, intensive services, and higher costs (Sherraden, 2000).

19
8. Summary and policy discussion To escape poverty requires asset accumulation. The United States has many policies that subsidize saving, but they often exclude the poor because they leverage existing wealth, operate via tax breaks, or require debt. Individual Development Accounts (IDAs) are a new policy proposal meant to help the poor build assets without these requirements. Withdrawals from IDAs are matched if used to buy a home, to pay for post-secondary education, or to finance self-employment. Participants also receive financial education and support from IDA staff. 8.1 Summary of results from the American Dream Demonstration The poor can save in IDAs. The 2,353 participants in ADD saved, on average, $20.71 per month. They made deposits in 6 of 12 months and used half of their match eligibility. Matched at 1.78:1, the average participant accumulated about $58 per month ($700 per year) in IDAs. Even the very poor can save in IDAs. Participants in ADD were more advantaged than the low-income population in some ways but more disadvantaged others. In some aspects—such as asset ownership—participants who were less poor saved more than participants who were very poor. Gender, income, and receipt of public assistance, however, were not linked with savings outcomes. In fact, the share of income saved in IDAs was greater for the very poor than for the less poor. Part of the explanation may be that institutional effects are strongest for the poorest. Racial/ethnic wealth gaps remain. Members of all racial/ethnic groups saved in IDAs, but there were large gaps among groups. Although IDAs decreased the ratio of Caucasian net worth to African-American net worth, the pattern of unequal outcomes is disturbing because it represents lost potential for asset building, particularly for African Americans and Native Americans. Future work should ask why this is and what might be done to improve inclusion. Institutions matter. The institutional structure of IDAs—match rate, savings target, deadline, direct deposit, and financial education—is strongly associated with savings outcomes. For example, higher match rates are linked with a greater likelihood of saving something but, given that something is saved, lower levels of saving. The likelihood of saving something also increases with the use of direct deposit. Each additional hour of financial education—up to 10 hours—is linked with a $1 increase in monthly net deposits. IDAs are costly. IDAs cost a lot because programs provide a lot of personal service. In the long term, two types of programs seem likely, one with a universal, permanent, low-cost design and one a local, temporary design that offers greater services but that costs more. 8.2 Policy discussion
This final section discusses broad IDA policy issues, often speculating beyond the evidence from the MIS IDA data for ADD. Do IDAs harm the poor? Some worry that access to IDAs will cause the poor hardship. After all, saving does mean postponing consumption, so, at least in the short term, people who save also consume less and, all else constant, are worse off. Savers make this short-term sacrifice because they expect that it will improve their long-term well-being. Of course, saving can be overdone, but saving in IDAs is voluntary; no one is forced to participate, and unmatched withdrawals are possible at any time. ADD provides little evidence that matches in IDAs have enticed participants to harm themselves by saving too much. Income and the receipt of public
20
assistance were both unrelated to saving outcomes, suggesting that even the very poor can save. How do institutions matter? Institutional explanations of saving performance are useful because of their potential to lead to policy implications. While ADD shows that institutions matter and Schreiner et al. (2001) and Beverly and Sherraden (1999) start to develop theory, informing public policy and program design requires knowledge not only that institutions matter but also how they matter. Do the poor use IDAs because the match provides a high rate of return? Do they use IDAs because of the social and psychological incentives and opportunities through staff and peer support and through the message that assets matter even for the poor? Or do they use IDAs to help commit themselves to save through regular goals an implicit penalties for unmatched withdrawals? Most likely, all these institutional aspects matter, but how much each matters is unknown. Will IDAs replace welfare? Some worry that IDAs will siphon funds away from cash subsistence support for the poor. (Some even worry that floating the idea that the poor can save will open the floodgates to arguments for doing away with cash assistance.) Also, a series of coincidences and misunderstandings has led some lawmakers to see IDAs as “welfare” rather than “asset-building” (Edwards and Mason, 2003). Of course, a dollar allocated to IDAs is a dollar not allocated elsewhere. Still, there is no evidence that funding IDAs has decreased funding for traditional welfare; indeed, funds for IDAs are a drop in the bucket compared to funds for cash assistance. Furthermore, states that fund IDAs do so only from TANF funds already earmarked for innovative or rainy-day uses. As Sherraden (1991, p. 294) writes, cash assistance is “absolutely essential”. Welfare aims to keep poor people from starving in the short term, while IDAs aim to help people develop in the long term. How long should IDA programs last? Sherraden’s (1991) original IDA proposal calls for universal, permanent accounts, opened at birth, with greater subsidies for the poor. In this sense, IDAs were never meant to be “programs” with ending dates any more than IRAs or 401(k) plans are. In practice, IDAs have been time-limited because advances in the field—funded as demonstrations—have outstripped policy development (Edwards and Mason, 2003). If, however, the goal is to improve the long-term well-being of the poor, then many practices common in demonstrations—such as setting deadlines for matched withdrawals or kicking out low savers—are counterproductive. (In contrast, IRAs and 401(k) plans do not kick out participants or suspend their tax benefits if they save small amounts or stop making contributions.) A better design would allow IDA participants to save and hold balances for as long as they wish. Some participants would be content to save for years without making a matched withdrawal, sometimes depositing regularly, sometimes not depositing, and sometimes making unmatched withdrawals in emergencies. But everyone would have an account, always available, and annual statements—regardless of balance—that would act as gentle reminders of the possibility of saving.

21
References Ackerman, Bruce, and Anne Alstott, The Stakeholder Society, New Haven: Yale Press, 1999. Bayer, Patrick J., Bernheim, B. Douglas, and John Karl Scholz, “The Effects of Financial Education in the Workplace: Evidence from a Survey of Employers,” National Bureau of Economic Research Working Paper No. 5655, 1996. Bernheim, B. Douglas, “Rethinking Savings Incentives,” pp. 259-311 in Alan J. Auerbach (ed) Fiscal Policy: Lessons from Economic Research, Cambridge, MA: MIT Press, 1997. _____, “Personal saving, information, and economic literacy: New directions for public policy,” pp. 53-78 in Tax Policy for Economic Growth in the 1990s, Washington, D.C.: American Council for Capital Formation, 1994. _____, and Daniel M. Garrett, “The Determinants and Consequences of Financial Education in the Workplace: Evidence from a Survey of Households,” National Bureau of Economic Research Working Paper No. 5667, 1996. Beverly, Sondra G.; Moore McBride, Amanda.; and Mark Schreiner, “A Framework of Asset-Accumulation Strategies”, Journal of Family and Economic Issues, Vol. 24, No. 2, 2003, pp. 143–156. _____, Tescher, Jennifer, and David Marzahl, “Low-Cost Bank Accounts and the EITC: How Financial Institutions Can Reach the Unbanked and Facilitate Saving”, this volume. _____, and Michael Sherraden, “Institutional Determinants of Savings: Implications for Low-Income Households and Public Policy,” Journal of Socio-Economics, Vol. 28, No. 4, 1999, pp. 457-473. Chiteji, Ngina; and Darrick Hamilton. “Family Matters: Kin Networks and Asset Accumulation”, this volume. Conley, Dalton, Being Black, Living in the Red: Race, Wealth, and Social Policy in America, Berkeley: University of California Press, 1999. Deaton, Angus, Understanding Consumption, Oxford: Clarendon Press, 1992. Edwards, Karen, and Lisa Marie Mason, “State Policy Trends for Individual Development Accounts in the United States: 1993–2003”, Center for Social Development, Washington University in Saint Louis, 2003. Friedman, Robert, The Safety Net as Ladder, Washington, D.C.: Council of State Policy and Planning Agencies, 1988.

22
Haveman, Robert, Starting Even, New York: Simon and Schuster, 1988. Johnson, Elizabeth, Hinterlong, James, and Michael Sherraden. (2000) “Strategies for Creating MIS Technology to Improve Social Work Practice and Research,” paper presented at the Technology Conference for Social Work Education and Practice, Charleston, August. Lusardi, Annamaria, “Explaining Why So Many Households Do Not Save,” manuscript, University of Chicago, 2000. Maital, Shlomo, “Prometheus Rebound: On Welfare-Improving Constraints,” Eastern Economic Journal, Vol. 12, No. 3, 1986, pp. 337-344. Moore, Amanda, Beverly, Sondra, Schreiner, Mark, Sherraden, Michael, Lombe, Margaret, Cho, Esther Yin-Nei, Johnson, Lissa, and Rebecca Vonderlack, Saving, IDA Programs, and Effects of IDAs: A Survey of Participants, Research Report, Center for Social Development, Washington University in Saint Louis, 2001. Ng, Guat Tin, “Costs of IDAs and Other Capital-Development Programs”, Center for Social Development Working Paper No. 01-8, Washington University in Saint Louis, 2001. Oliver, Melvin L., and Thomas M. Shapiro, Black Wealth/White Wealth, New York: Routledge, 1995. Schreiner, Mark, “What Do Individual Development Accounts Cost? The First Three Years at CAPTC”, Center for Social Development, Washington University in Saint Louis, 2002. _____, “Match Rates and Savings: Evidence from Individual Development Accounts”, Center for Social Development Working Paper No. 01–6, Washington University in Saint Louis, 2001. _____, Clancy, Margaret, and Michael Sherraden, Savings Performance in the American Dream Demonstration: Final Report, Center for Social Development, Washington University in St. Louis, 2002. _____, and Michael Sherraden, “Drop-out from Individual Development Accounts: Prediction and Prevention”, Center for Social Development Working Paper No. 02–2, Washington University in St. Louis, 2002. _____, and Jacob Yaron. Development Finance Institutions: Measuring Their Subsidy, Washington, D.C.: World Bank, 2001. _____, Sherraden, Michael, Clancy, Margaret, Johnson, Lissa, Curley, Jami, Grinstein-Weiss, Michal, Zhan, Min, and Sondra Beverly, Savings and Asset Accumulation in Individual Development Accounts, Center for Social Development, Washington University in Saint Louis, 2001. Shapiro, Thomas., and Edward N. Wolff, Assets for the Poor: The Benefits of Spreading Asset

23
Ownership, New York, Russell Sage Foundation, 2001. Shefrin, Hersh M., and Richard H. Thaler, “The Behavioral Life-Cycle Hypothesis,” Economic Journal, Vol. 26, 1988, pp. 609-643. Sherraden, Michael, “On Costs and the Future of Individual Development Accounts,” Comment, Center for Social Development, Washington University in Saint Louis, 2000. _____, Assets and the Poor, Armonk, NY: M.E. Sharpe, 1991. _____. “Rethinking Social Welfare: Toward Assets,” Social Policy, Vol. 18, No. 3, 1988, pp. 37-43. _____, Schreiner, Mark, and Sondra Beverly, “Income and Saving Performance in Individual Development Accounts”, Economic Development Quarterly, Vol. 17, No. 1, pp. 95–112, 2003. Smeeding, Timothy M., “The EITC and USAs/IDAs: Maybe a Marriage Made in Heaven?” this volume. Souleles, Nicholas S., “The Response of Household Consumption to Income-Tax Refunds,” American Economic Review, Vol. 89, No. 4, 1999, pp. 947-958. Thaler, Richard H., “Psychology and Savings Policies,” American Economic Review, Vol. 84, No. 2, 1994, pp. 186-192. Williams, Trina, “The Homestead Act: Our Earliest National Asset Policy,” this volume. Wolff, Edward N., “Recent Trends in the Size Distribution of Household Wealth,” Journal of Economic Perspectives, Vol. 12, No. 3, 1998, pp. 131-150. Zhan, Min, Sherraden, Michael, and Mark Schreiner, “Welfare Recipiency and Savings Outcomes in Individual Development Accounts”, manuscript, Center for Social Development, Washington University in Saint Louis, 2003.
24
Figure 1: Deposits in IDAs spike in tax season
20
40
60
80
100
120
140
Dec. 97 Dec. 98 Dec. 99 Dec. 00 Dec. 01 Dec. 02
$ gr
oss d
epos
it pe
r par
ticip
ant p
er m
onth

25
Figure 2: IDA deposits spike before annual deadlines
0
5
10
15
20
25
30
35
40
45
50
42 40 38 36 34 32 30 28 26 24 22 20 18 16 14 12 10 8 6 4 2 0
Months until end of saving period
Net
dep
osits
per
par
ticip
ant
per
mon
th
"Lifetime" deadline
"Annual" deadline

26

27
Table 1: Enrollment and gross deposits in ADD Line Item Formula Value
EnrollmentsAa # of Participants Data 2,353Ab # of Participant-months Data 61,066Ac Ave. Months of Participation Ab/Aa 26
Gross depositsAd Gross deposits Data $2,874,311Ae # of Deposits Data 39,428 Af Ave. Gross Deposit Ad/Ae $72.90
Ag # of Part. w/a Deposit Data 2,341Ah Percentage of Part. w/a Deposit 100*(Ag/Aa) 99
Ai # of Deposits per Part. w/a Deposit Ae/Ag 16.8 Aj Gross Deposit per Part. w/a Deposit Ad/Ag $1,228
Ak # of Part.-months w/a Deposit Data 31,526Al Deposit Frequency (%) 100*(Ak/Ab) 52
Am Gross Deposit per Part.-month Ad/Ab $47.07An Gross Deposit per Month w/a Deposit Ad/Ak $91.17
Ao Interest (Net of Fees) Data $40,668Ap Gross Deposits plus Interest Ad+Ao $2,914,979
Source: MIS IDA. Means are ratios of averages.

28
Table 2: Unmatched withdrawals and excess deposits in ADD Line Item Formula Value
Withdrawals of Excess BalancesBa Withdrawals of Excess Balances Data $698,844Bb # of Withdrawals of Excess Balances Data 1,964 Bc Ave. Withdrawal of Excess Balances Ba/Bb $356
Bd # of Part. w/a Withdrawal of Excess Balances Data 724Be Percentage of Part. w/a Withdrawal of Excess Balances 100*(Bd/Aa) 31
Bf # of WD of Excess Bal. per Part. w/a WD of Excess Bal. Bb/Bd 2.7Bg WD of Excess Bal. per Part. w/a WD of Excess Bal. Ba/Bd $965
Excess depositsBh Excess Balances over Match Cap Data $117,967Bi # of Part. w/Excess Balances Data 553Bj Percentage of Part. w/Excess Balances 100*(Bi/Aa) 24
Bk Excess Deposit per Part. w/Excess Balance Bh/Bi $213
Unmatched WithdrawalsBl Unmatched Withdrawals Data $833,636Bm # of Unmatched Withdrawals Data 6,568 Bn Ave. Unmatched Withdrawal Bm/Bl $127
Bo # of Part. w/an Unmatched WD Data 1,586Bp Percentage of Part. w/an. Unmatched WD 100*(Bo/Aa) 67
Bq # of Unmatched WD per Part. w/an Unmatched WD Bm/Bo 4.1Br Unmatched WD per Part. w/an Unmatched WD Bl/Bo $526
Source: MIS IDA. Means are ratios of averages.
29
Table 3: Net deposits in ADD Line Item Formula Value
Net DepositsCa Net Deposits Ap-(Ba+Bh+Bl) $1,264,531Cb Ave. Match Rate on Net Deposits Data 1.89Cc Net Deposits plus Match Ca*(1+Cb) $3,657,462
Cd Net Deposits per Participant Ca/Aa $537.41Ce Ave. Monthly Net Deposit (AMND) Ca/Ab $20.71
Cf # of Part. w/Positive Net Deposits Data 1,416Cg Percentage of Part. w/Positive Net Deposits 100*(Cf/Aa) 60
Ch Net Deposits per Part. w/Positive Net Deposits Ca/Cf $893Ci # of Part.-months for Part. w/Positive Net Deposits Data 43,603Cj Ave. Monthly Net Deposit for Part. w/Positive Net Deposits Ca/Ci $29.00
Source: MIS IDA. Means are ratios of averages.
30
Table 4: Matched withdrawals and asset accumlation in ADD Line Item Formula Value
Matched WithdrawalsDa Matched Withdrawals Data $799,684Db # of Matched Withdrawals Data 2,154Dc Ave. Matched Withdrawal Da/Db $371
Dd # of Part. w/a Matched WD Data 821De Percentage of Part. w/a Matched WD 100*(Dd/Aa) 35
Df # of Matched WD per Part. w/a Matched WD Db/Dd 2.6Dg Matched WD per Part. w/a Matched WD Da/Dd $974
Dk Ave. Match Rate on Matched Withdrawals Data 1.78Dh Matched Withdrawals plus Match Data $2,226,067Di Ave. Matched Withdrawal plus Match Dh/Db $1,033Dj Ave. Matched WD plus Match per Part. w/a Matched WD Dh/Dd $2,711
Matchable BalanceDl Matchable Balance Ca-Da 464,847.38Dm Ave. Match Rate for Matchable Balance Data 2.08Dn Matchable Balance plus Match Dl*(1+Dm) $1,431,394
Source: MIS IDA. Means are ratios of averages.
31
Table 5: Regression relationships between gender, race/ethnicity, education, and employment for being a saver and, for savers, the level of savings
Independent variable Mean ∆ % pt. p-value Mean ∆$ p-value
GenderMale 0.20 0.22Female 0.80 2.9 0.38 0.78 0.09 0.95
Race/ethnicityNative American 0.03 -13.3 0.07 0.02 -3.7 0.38African-American 0.47 -2.6 0.45 0.39 -5.9 0.01Caucasian 0.37 0.43Hispanic 0.09 7.9 0.13 0.10 2.6 0.30Other 0.03 16 0.04 0.03 1.1 0.76Asian-American 0.02 17 0.08 0.03 0.5 0.90
EducationDid not graduate from high school 0.16 0.13Completed high school or earned GED 0.25 -0.1 0.99 0.22 1.18 0.58Attended college but did not graduate 0.37 5.8 0.13 0.37 0.24 0.91Graduated from 2-year college 0.04 -0.9 0.90 0.03 -4.5 0.24Graduated college (2-year/4-year unspecified) 0.11 17 0.01 0.14 1.25 0.65Graduated from 4-year college 0.07 23 0.01 0.11 2.2 0.48
EmploymentUnemployed 0.05 0.04Employed, full-time (> 35 hours per week) 0.59 6.0 0.30 0.60 1.8 0.55Employed, part-time (< 35 hours per week) 0.23 7.1 0.23 0.23 4.8 0.13Not working (homemakers, retired, diasabled) 0.04 2.8 0.72 0.05 -2.4 0.54Student, not working 0.06 -1.4 0.85 0.04 9.0 0.03Student, also working 0.03 22 0.01 0.03 5.7 0.23Means taken over only non-missing observations.
Probability Saver AMND for Savers

32
Table 6: Regression relationships on receipt of public assistance and income for being a saver and, for savers, the level of savings
Independent variable Mean ∆ % pt. p-value Mean ∆$ p-value
Receipt of public assistanceTANF or AFDC never 0.62 0.64TANF or AFDC formerly 0.38 -0.3 0.92 0.36 -1.81 0.21
TANF currently 0.10 -3.8 0.43 0.08 1.74 0.53
No SSI/SSDI 0.89 0.89Receives SSI/SSDI 0.11 2.8 0.58 0.11 2.60 0.30
No food stamps 0.83 0.84Receives food stamps 0.17 6.07 0.15 0.16 -3.1 0.18
Household income ($ monthly)Total income 1,377 1,418
Recurrent income (spline) 1,154 1,1530 to $800 666 -0.0071 0.32 654 0.0037 0.31$801 to $1,600 363 0.0001 0.98 362 -0.0002 0.96$1,601 or more 125 0.0030 0.54 137 0.0059 0.01
Intermittent income 223 0.0047 0.17 266 0.0051 0.01Means taken over only non-missing observations.
AMND for SaversProbability Saver

33
Table 7: Regression results on assets and liabilities for being a saver and, for savers, the level of savings
Independent variable Mean ∆ % pt. p-value Mean ∆$ p-value
Liquid assetsPossession of a passbook savings accountNo 0.50 0.45Yes 0.50 -6.7 0.03 0.55 -3.1 0.06
Balance in passbook savings 220 282$1 to $700 (spline) 124 0.04 0.01 158 0.01 0.30$701 to $2,200 76 -0.01 0.10 98 0.00 0.38$2,201 or more 20 -0.01 0.57 26 0.01 0.43
Possession of a checking accountNo 0.36 0.25Yes 0.64 11 0.01 0.75 0.11 0.95
Balance in checking 213 283$1 to $1,500 (spline) 193 0.01 0.01 253 0.00 0.44$1,501 or more 20 -0.01 0.47 29 0.00 0.39
Illiquid assetsRenter 0.84 0.77Home owner 0.16 13 0.02 0.23 3.4 0.17
No car 0.35 0.27Car owner 0.65 9.2 0.01 0.73 -0.1 0.98
Value of illiquid assets 12,864 0.00 0.40 18,167 0.00 1.00
LiabilitiesNo debt 0.32 0.31Some debt 0.68 -6.7 0.03 0.69 -2.3 0.15
Value of liabilities 9,797 0.00 0.13 12,987 0.00 0.19Means taken over only non-missing observations.
Probability Saver AMND for Savers

34
Table 8: Regression results on institutional aspects for being a saver and, for savers, the level of savings
Independent variable Mean ∆ % pt. p-value Mean ∆$ p-value
Match rate1:1 0.29 0.302:1 0.52 7 0.14 0.49 -9.1 0.013:1 0.16 12 0.17 0.17 -8.7 0.074:1 to 7:1 0.06 15 0.06 0.06 -12.7 0.01
Match capMonthly savings target 42 0.22 0.04 42 0.64 0.01
Match-cap structureAnnual 0.52 0.49Lifetime 0.48 1.4 0.84 0.51 7.6 0.04
Use of direct deposit to IDA accountNo 0.94 0.92Yes 0.06 19 0.01 0.08 -1.7 0.51
Hours of general financial educationTotal (spline) 12.4 13.1More than zero 1.8 0.781 to 10 9.5 9.9 1.0 0.0311 to 20 2.3 2.7 0.07 0.7921 or more 0.6 0.6 0.32 0.27Means taken over only non-missing observations.
AMND for SaversProbability Saver