Embed Size (px)
Citation preview

153
Chapter - VI
ASSETS AND INDEBTEDNESS
Assets and indebtedness are two important correlates of poverty. The first round
survey collected detailed information on these two aspects. In this chapter we will make a
detailed analysis of the pattern and access to assets and the incidence of indebtedness
across various groups.
Assets
We begin with total assets (excluding land); cattle and land asset per capita in
table 6.1 to give an overall idea regarding the asset position and its distribution across
various districts, castes and classes..
In total assets Gopalganj and Rohtas fare the best among the districts. Purnea
turns out to be the poorest. The disparity in asset holding is quite high. Per capita asset
holding in Gopalganj is 2.75 times higher than that of Purnea. In case of both cattle and
landholding, Rohtas tops followed by Gaya. The inter-district disparity in cattle assets
and land holding is relatively less.
In terms of class, for both total assets and landholding there is almost consistent
increase from casual non-cultivating agricultural labour to landlord class up the ladder.
However, in cattle holding, the upward movement peaks at middle peasants and then it
comes down.
In terms of caste, picture is somewhat mixed. In terms of total assets Kurmi tops
followed by Bhumihar. Backward caste Muslims are the poorest among all castes. In
terms of cattle assets, however, Yadav ranks the highest followed by Bhumihar.
Scheduled caste and backward Muslims come at the bottom. In terms of landholding,
Bhumihar has the highest land per capita followed by Kurmi. Scheduled caste hardly
owns any land.

154
Table 6.1:Per Capita Assets Holding of Different Types Per Capita Value of
Total assets(Rs.) Cattles (Rs) Land (Acre) District
Gaya 6114.43 776.41 0.22 Gopalganj 8444.12 641.24 0.19 Madhubani 4666.53 601.76 0.15 Nalanda 7627.06 710.61 0.19 Purnea 3062.46 611.36 0.21 Rohtas 8225.32 851.65 0.25 Class Non-Culti. Casual Agri. Lab. 2307.62 289.8 0.01 Non-Culti. Attached Agri. Lab. 2491.71 227.88 0.00 Culti. Casual Agri. Lab. 3567.99 711.8 0.11 Culti. Attached Agri. Lab. 3439.77 670.97 0.07 Poor-Middle Peasants 5640.53 824.55 0.14 Middle Peasants 8552.36 1314.32 0.34 Big Peasants 10216.92 1111.33 0.50 Landlord 14147.50 630.85 0.57 Non-Agriculturist 4844.32 194.62 0.02 Caste Brahmin & Kayastha 9148.40 696.29 0.38 Bhumihar & Rajput 12989.99 1154.67 0.56 Backward Caste I 3605.15 607.09 0.20 Kurmi 13990.38 950.45 0.45 Yadav 6313.28 1428.62 0.28 Koiri 9051.78 871.67 0.26 Other Backward II 6033.15 577.79 0.16 Scheduled Caste 3444.97 379.73 0.03 Scheduled Tribe 5185.64 698.53 0.19 Upper Caste Muslim 4594.29 602.69 0.26 Backward Caste Muslim 2560.8 418.19 0.10 All 5746.46 676.38 0.20 Mere higher level of assets does not ensure that the certain groups are better placed in
terms of scope of future development. Level of productive assets and their distribution in
different use will be more important in getting better idea regarding this dynamism.
Again, higher level and proportion of non-productive asset is not necessarily unwarranted
since they would reflect on quality of life.
Tables 6.2 and 6.3 show the distribution of total assets into productive and non-
productive assets in absolute amount and percentage respectively. Productive assets are

155
further subdivided into four categories namely milch animal, other cattle, agricultural
implements and non-agricultural assets.
The distribution between productive and non-productive assets gives interesting
picture. The top position in asset per capita in Gopalganj has been due to its high level of
non-productive assets whereas the close second position held by Rohtas district stands
far higher in its level of productive assets. The average level of productive assets of
Gopalganj district is even marginally lower than of Nalanda district. Interestingly, the
poorest district Purnea has more than one-third of total assets in productive use but for all
other districts productive assets did not even reach one-fourth mark of total assets.
Classwise, non-productive assets show almost high consistent rise from non-
cultivating casual agricultural labour to landlord class. In case of productive asset (except
land), there is also rise but it is not substantial particularly from middle peasants to
landlord class. The reason being there is a fall in the share of productive assets in total
assets from middle peasants to landlord class. The share of productive assets in total
assets is one-fourth or more of total assets for cultivating agricultural labour and middle
peasants.
Castewise, Bhumihar tops in non-productive assets and Kurmi in productive
assets and Muslim backward caste has the lowest amount of assets in both productive and
non-productive categories. The status of scheduled caste households is marginally better.
But the share of productive assets in total assets is highest in case of upper caste
Muslims and Yadav caste.
The distribution of productive assets into milch animal, other cattle, agricultural
implements and non-agricultural assets shows considerable variation. Across district,
because of higher level of productive assets, Rohtas district tops in milch animal,
agricultural implements and non-agricultural assets. Only in the case of other cattle, Gaya
tops. In ownership of agricultural implements and milch animal per household Rohtas
district has almost double than that of the next highest district. It also gets reflected in the
share of milch animal and agricultural implements in productive assets---having a share
of one-fourth and one-third in productive assets. However, the poorest district Purnea
also has one-fourth of the productive assets in milch animal.

156
Table 6.2: Distribution of Assets (in Rs.) Agricultural Non-Agricultural Productive Non-Productive
Milch Animal Other Cattle Implements Assets Assets Assets District
Gaya 2026.79 3204.17 1795.12 1190.52 8216.6 31047.27 Gopalganj 1628.50 3002.15 2549.89 2816.00 9996.55 56800.44 Madhubani 1243.81 2059.46 1457.80 876.76 5637.83 21256.42 Nalanda 2170.03 2488.58 2866.64 2665.18 10190.43 37887.69 Purnea 1290.52 1660.10 1129.63 957.16 5037.41 9588.16 Rohtas 4049.71 2811.10 5431.23 3655.16 15947.21 49592.37 Class Non-Culti. Casual Agri. Lab. 763.80 586.50 21.53 247.87 1619.70 8695.19 Non-Culti. Attached Agri. Lab.
673.75 456.25 14.95 76.90 1221.85 9258.91
Culti. Casual Agri. Lab. 1742.41 2544.39 695.78 604.94 5587.51 16556.68 Culti. Attached Agri. Lab. 1899.81 2144.87 265.91 373.07 4683.67 12708.07 Poor-Middle Peasants 2015.96 4750.28 740.82 840.65 8347.7 33637.44 Middle Peasants 3675.22 5357.32 3921.43 2264.95 15218.91 45651.84 Big Peasants 3081.21 4070.67 6698.51 3236.81 17087.2 59028.99 Landlord 2148.57 1956.96 5716.39 7461.51 17283.44 76182.95 Non-Agriculturist 595.95 330.51 16.73 2803.97 3747.16 21220.29 Caste Brahmin & Kayastha 2602.06 2144.28 5782.23 3118.73 13647.32 53903.53 Bhumihar & Rajput 3322 4249.58 6956.42 5275.05 19803.07 76350.01 Backward Caste I 1548.76 1794.46 348.96 402.14 4094.28 16738.71 Kurmi 2515.03 3573.22 6880.70 7548.29 20517.25 67312.94 Yadav 4461.39 5168.89 2277.30 1089.18 12996.76 31403.18 Koiri 2445.42 4090.25 2557.43 3232.10 12325.19 57238.33 Other Backward II 1250.93 2764.42 2163.88 1060.08 7239.32 32267.01 Scheduled Caste 914.69 1223.51 354.62 1016.26 3509.08 14644.14 Scheduled Tribe 1363.25 2320.94 460.26 410.17 4554.62 20810.69 Upper Caste Muslim 944.27 2055.88 3071.79 2014.80 8086.74 17963.76 Backward Caste Muslim 873.16 1383.25 372.45 656.20 3285.06 10002.49 All 1837.92 2387.94 2166.59 1731.84 8124.30 29556.12

157
Table 6.3: Percentage Distribution of Assets Distribution of Productive Assets Distribution of total Assets District Agricultural Non-Agricultural Productive Non-Productive
Milch Animal Other Cattle Implements Assets Assets Assets District Gaya 24.67 39.00 21.85 14.49 20.93 79.07 Gopalganj 16.29 30.03 25.51 28.17 14.97 85.03 Madhubani 22.06 36.53 25.86 15.55 20.96 79.04 Nalanda 21.29 24.42 28.13 26.15 21.20 78.80 Purnea 25.62 32.96 22.42 19.00 34.44 65.56 Rohtas 25.39 17.63 34.06 22.92 24.33 75.67 Class Non-Culti. Casual Agri. Lab. 47.16 36.21 1.33 15.30 15.70 84.30 Non-Culti. Attached Agri. Lab.
55.14 37.34 1.22 6.29 11.66 88.34
Culti. Casual Agri. Lab. 31.18 45.54 12.45 10.83 25.23 74.77 Culti. Attached Agri. Lab. 40.56 45.79 5.68 7.97 26.93 73.07 Poor-Middle Peasants 24.15 56.91 8.87 10.07 19.88 80.12 Middle Peasants 24.15 35.20 25.77 14.88 25.00 75.00 Big Peasants 18.03 23.82 39.20 18.94 22.45 77.55 Landlord 12.43 11.32 33.07 43.17 18.49 81.51 Non-Agriculturist 15.90 8.82 0.45 74.83 15.01 84.99 Caste Brahmin & Kayastha 19.07 15.71 42.37 22.85 20.20 79.80 Bhumihar & Rajput 16.78 21.46 35.13 26.64 20.60 79.40 Backward Caste I 37.83 43.83 8.52 9.82 19.65 80.35 Kurmi 12.26 17.42 33.54 36.79 23.36 76.64 Yadav 34.33 39.77 17.52 8.38 29.27 70.73 Koiri 19.84 33.19 20.75 26.22 17.72 82.28 Other Backward II 17.28 38.19 29.89 14.64 18.32 81.68 Scheduled Caste 26.07 34.87 10.11 28.96 19.33 80.67 Scheduled Tribe 29.93 50.96 10.11 9.01 17.96 82.04 Upper Caste Muslim 11.68 25.42 37.99 24.91 31.04 68.96 Backward Caste Muslim 26.58 42.11 11.34 19.98 24.72 75.28 All 22.62 29.39 26.67 21.32 21.56 78.44

158
Across class, the consistent increase, as one go up the ladder, observed in
productive asset breaks down at disaggregated level. In case of milch animal and other
cattle the highest amount is at the level of middle peasants. In case of agricultural
implements, the increase reaches its highest level at big peasants’ level. Only in case of
non-agricultural assets it reaches the highest level at the landlord level. Interestingly, non-
agricultural asset holding of landlord class is more than double that of the next highest
holding class of big peasants. It shows that it is the landlord class who has diversified
most in non-agricultural activities. It also gets reflected in their higher share of non-
agricultural assets in productive assets. As expected, for non-agricultural class the
proportion of investment in this activity is the highest. However, in the case of other type
of productive asset holding they are almost at the bottom both in absolute amount and in
share terms. For all agricultural labour class and poor middle peasants, their main
productive asset is animal assets---for these classes milch animal and other cattle assets
combined constitute nearly fourth-fifth or more of total productive assets. On the other
hand, landlord and non-agricultural classes’ possession in cattle assets are less than one-
fourth of their total productive asset holding.
Across castes, interesting variation is observed. In terms of both milch animal and
other cattle assets Yadav is at the top. It also gets reflected in share of milch animal and
other cattle in productive asset. In milch animal its share is the highest and in other cattle
its share is the second highest. However, the shares of other cattle in productive asset is
the highest in the case of scheduled caste constituting more than half of their total
productive asset. For Kurmi caste, their milch animal and other cattle asset in percentage
term is one of the lowest across all castes. They are also relatively lower in case of upper
castes of Brahmin & Kayastha and Bhumihar & Rajput as well.
In the case of productive assets, both in agricultural implements and non-
agricultural assets, Kurmi and Bhumihar castes are at the top. But in terms of level of
non-agricultural assets, possession of Kurmi caste is almost fifty percent higher than that
of next highest caste Bhumihar. It also gets reflected in their far higher share of non-
agricultural assets compared to all other castes. But in case of agricultural implements,
Brahmin caste holds the highest share in productive asset. Backward caste I and

159
scheduled tribe fall in the lowest rung in terms of both level and percentage share of
agricultural implements and non-agricultural assets in productive assets.
Table 6.4 shows to what extent level of assets holding gets translated into
quality of life. It depicts the quality of living in terms of inter-relation between housing
and consumer durable – both falling in the category of non-productive assets. It is
explained through matrix of housing status and status of ownership of consumer durable.
District-wise, Gopalganj, Nalanda and Rohtas on one side and Gaya, Madhubani
and Purnea on the other fall in two contrasting pattern of quality of living with former
being the better-off side. The better off districts at least have one-third pucca houses and
surely one-fifteenth of households has modern gadgets. In contrast, worse off districts
have one-tenth or much less pucca houses and less than one-fortieth households possess
modern gadgets. But Purnea is much poorer than the other two poor districts of Gaya and
Madhubani with nine-tenth of households having kutcha houses and seven-tenth of
households having nothing or little consumer durables. Gaya seems to be the best among
poor districts with about three-fifth of household having semi-pucca houses and about
two-fifth households having some households items.
Among the better off districts, the contrast of living is most stark in Gopalganj
with nearly half of their households living in kutcha houses and similar proportion having
nothing or little consumer durables. In agriculturally prosperous Rohtas district, it is least
stark with more than half of households living in semi-pucca houses and similar
proportion having some items of consumer durables.
Examining the distribution of consumer durables and housing status it is clear that
in all the districts, households give first priority to quality of housing and then to
acquisition of consumer durables. It can be seen that, households having pucca houses
have maximum occurrence in consumer durable category of ‘some items’. But in case of
semi-pucca houses the picture is a contrast between north Bihar districts of Gopalganj,
Madhubani and Purnea with that of south Bihar districts of Gaya, Nalanda and Rohtas. In
north Bihar households semi-pucca houses have maximum occurrence in consumer
durable category of ‘some items’ whereas, in south Bihar district the maximum
occurrence in consumer durable category is ‘nothing or little’.

160
Table 6.4: Quality of Living -- Inter-relation between Housing and Consumer Durable District: Gaya
Gopalganj
Consumer Nothing or Some Modern Consumer Nothing or Some Modern Durable Little Items Gadgets Total Durable Little Items Gadgets Total Housing Housing Kutcha 25.3 5.4 0.1 30.8 kutcha 31.1 13.9 45.0 Semi-Pucca 31.9 26.1 0.8 58.8 Semi-Pucca 8.0 13.0 0.7 21.7 Pucca 2.3 6.7 1.4 10.4 Pucca 9.2 17.4 6.7 33.2 Total 59.5 38.2 2.3 100.0 Total 48.3 44.3 7.4 100.0 Madhubani Nalanda Consumer Nothing or Some Modern Consumer Nothing or Some Modern Durable Little Items Gadgets Total Durable Little Items Gadgets Total Housing Housing kutcha 54 14.9 0.1 69 kutcha 19.8 1.5 0.1 21.4 Semi-Pucca 11 11.6 0.9 23.5 Semi-Pucca 26.1 17.4 2 45.5 Pucca 0.9 5.5 1.1 7.5 Pucca 12.7 15.8 4.6 33.1 Total 65.9 32 2.2 100.1 Total 58.7 34.7 6.6 100 Purnea Rohtas Consumer Nothing or Some Modern Consumer Nothing or Some Modern Durable Little Items Gadgets Total Durable Little Items Gadgets Total Housing Housing kutcha 67.7 20.8 0.9 89.4 kutcha 8.6 1.4 10 Semi-Pucca 2.9 4.4 0.5 7.8 Semi-Pucca 28.4 27.7 1.7 57.8 Pucca 0.9 1 1 2.9 Pucca 3.3 22.6 6.3 32.2 Total 71.5 26.2 2.4 100.1 Total 40.3 51.7 8 100 Class: Non-Culti. Casual Agri. Lab. Non-Culti. Attached Agri. Lab. Consumer Nothing or Some Modern Consumer Nothing or Some Modern Durable Little Items Gadgets Total Durable Little Items Gadgets Total Housing Housing kutcha 68 7.5 0.1 75.6 kutcha 60.8 8.3 69.1 Semi-Pucca 16.3 5.7 0.1 22.1 Semi-Pucca 15.8 1.8 17.6 Pucca 1.4 0.8 0.2 2.4 Pucca 13.5 13.5 Total 85.7 14 0.3 100 Total 90 10 100 Culti. Casual Agri. Lab. Culti. Attached Agri. Lab. Consumer Nothing or Some Modern Consumer Nothing or Some Modern Durable Little Items Gadgets Total Durable Little Items Gadgets Total Housing Housing kutcha 48.8 12.9 0.3 62.0 kutcha 56.9 13.8 70.7 Semi-Pucca 14.9 12.4 0.7 28.0 Semi-Pucca 16.2 8.4 24.6 Pucca 3.9 6.0 0.1 10.0 Pucca 3.5 1.2 4.7 Total 67.9 31.3 1.1 100.3 Total 76.6 23.4 100

161
Table 6.4 Contd.. CLASS Poor-Middle Peasants Middle Peasants Consumer Nothing or Some Modern Consumer Nothing or Some Modern Durable Little Items Gadgets Total Durable Little Items Gadgets Total Housing Housing Kutcha 22.8 13.2 0.2 36.2 kutcha 14.2 11.8 0.6 26.6 Semi-Pucca 19.7 25.2 0.9 45.8 Semi-Pucca 20.2 25.3 0.7 46.2 Pucca 6.7 8.3 3.0 18.0 Pucca 9.4 15.0 2.9 27.3 Total 49.2 46.8 4.1 100.1 Total 43.8 52.0 4.2 100.0 Big Peasants Landlord Consumer Nothing or Some Modern Consumer Nothing or Some Modern Durable Little Items Gadgets Total Durable Little Items Gadgets Total Housing Housing Kutcha 14.9 13.8 0.3 29.0 kutcha 9.3 11.8 0.4 21.5 Semi-Pucca 13.4 22.6 2.5 38.5 Semi-Pucca 10.1 21.8 3.6 35.5 Pucca 3.9 20.9 7.7 32.5 Pucca 3.8 26.9 12.4 43.1 Total 32.2 57.3 10.5 100.0 Total 23.2 60.5 16.3 100.0 Non-Agriculturist Consumer Nothing or Some Modern Durable Little Items Gadgets Total Housing Kutcha 37.2 14.9 0.5 52.6 Semi-Pucca 19.2 16.3 0.5 36.0 Pucca 3.9 5.1 2.4 11.4 Total 60.3 36.3 3.4 100.0 CASTE: Brahmin & Kayastha Bhumihar & Rajput Consumer Nothing or Some Modern Consumer Nothing or Some Modern Durable Little Items Gadgets Total Durable Little Items Gadgets Total Housing Housing kutcha 23.5 17.4 0.9 41.8 Kutcha 7.5 9.6 0.2 17.3 Semi-Pucca 7.8 19.8 2.3 29.9 Semi-Pucca 15.8 24.6 4.5 44.9 Pucca 2.3 18.9 7.1 28.3 Pucca 4.0 22.8 11.0 37.8 Total 33.6 56.1 10.3 100 Total 27.3 57.0 15.7 100.0 Backward Caste I Yadav Consumer Nothing or Some Modern Consumer Nothing or Some Modern Durable Little Items Gadgets Total Durable Little Items Gadgets Total Housing Housing kutcha 52.9 12.9 0.6 66.4 kutcha 25.2 11.3 36.5 Semi-Pucca 13.9 9.8 0.4 24.1 Semi-Pucca 26.5 21.7 0.8 49 Pucca 3.6 4.6 1.6 9.8 Pucca 4.4 9.0 1.1 14.5 Total 70.3 27 2.6 99.9 Total 56.1 42.0 1.9 100.0
162
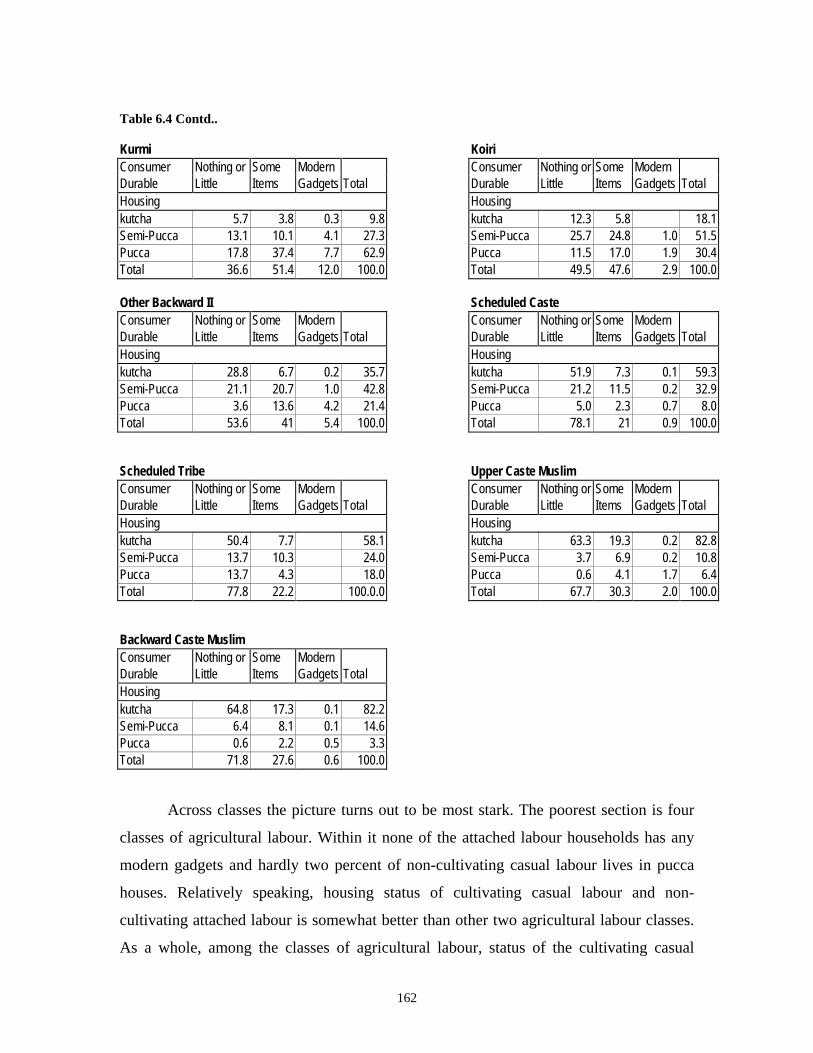
Table 6.4 Contd.. Kurmi Koiri Consumer Nothing or Some Modern Consumer Nothing or Some Modern Durable Little Items Gadgets Total Durable Little Items Gadgets Total Housing Housing kutcha 5.7 3.8 0.3 9.8 kutcha 12.3 5.8 18.1 Semi-Pucca 13.1 10.1 4.1 27.3 Semi-Pucca 25.7 24.8 1.0 51.5 Pucca 17.8 37.4 7.7 62.9 Pucca 11.5 17.0 1.9 30.4 Total 36.6 51.4 12.0 100.0 Total 49.5 47.6 2.9 100.0 Other Backward II Scheduled Caste Consumer Nothing or Some Modern Consumer Nothing or Some Modern Durable Little Items Gadgets Total Durable Little Items Gadgets Total Housing Housing kutcha 28.8 6.7 0.2 35.7 kutcha 51.9 7.3 0.1 59.3 Semi-Pucca 21.1 20.7 1.0 42.8 Semi-Pucca 21.2 11.5 0.2 32.9 Pucca 3.6 13.6 4.2 21.4 Pucca 5.0 2.3 0.7 8.0 Total 53.6 41 5.4 100.0 Total 78.1 21 0.9 100.0 Scheduled Tribe Upper Caste Muslim Consumer Nothing or Some Modern Consumer Nothing or Some Modern Durable Little Items Gadgets Total Durable Little Items Gadgets Total Housing Housing kutcha 50.4 7.7 58.1 kutcha 63.3 19.3 0.2 82.8 Semi-Pucca 13.7 10.3 24.0 Semi-Pucca 3.7 6.9 0.2 10.8 Pucca 13.7 4.3 18.0 Pucca 0.6 4.1 1.7 6.4 Total 77.8 22.2 100.0.0 Total 67.7 30.3 2.0 100.0 Backward Caste Muslim Consumer Nothing or Some Modern Durable Little Items Gadgets Total Housing kutcha 64.8 17.3 0.1 82.2 Semi-Pucca 6.4 8.1 0.1 14.6 Pucca 0.6 2.2 0.5 3.3 Total 71.8 27.6 0.6 100.0
Across classes the picture turns out to be most stark. The poorest section is four
classes of agricultural labour. Within it none of the attached labour households has any
modern gadgets and hardly two percent of non-cultivating casual labour lives in pucca
houses. Relatively speaking, housing status of cultivating casual labour and non-
cultivating attached labour is somewhat better than other two agricultural labour classes.
As a whole, among the classes of agricultural labour, status of the cultivating casual

163
labour is the best. Even among the best of the agricultural labour class, only one-eighth
lives in pucca houses and hardly one percent of them have modern gadgets. In all
agricultural labour classes, more than two-fifth of the households lives in kutcha houses.
In contrast, in case of the landlords two-third of the households live in pucca houses and
only one-fifth live in kutcha houses. In terms of consumer durables, every sixth landlord
household possesses modern gadgets and only one-fourth of the households owns hardly
any consumer durable. The other classes namely non-agricultural households, poor-
middle peasants, middle peasants and big peasants fall in between in the ascending order.
So the upward movement of classes follow systematic pattern. It can be seen that 12 per
cent of non-agricultural households, 18 per cent of poor middle peasants, 27 percents of
middle peasants and 33 percent of big peasants live in pucca houses. Again, more than
half of non-agricultural households, 36 per cent of poor middle peasants, 27 percent of
middle peasant and 22 percent of big peasants live in kutcha houses. Similar systematic
pattern can also be seen in case of consumer durables as well.
The inter-relation between housing status and consumer durables gives the
following findings:
Across classes households owning pucca houses have maximum occurrence in
consumer durable category of ‘some items’. But in case of semi-pucca houses, all
agricultural labour classes and non-agricultural classes households with semi-pucca
houses have maximum occurrence in ‘little or nothing’ consumer durable category. But,
classes in higher categories i.e. from poor middle peasants to landlord classes households
with semi-pucca houses have maximum occurrence in the consumer durable category of
‘some items’. In case of kutcha house-owning households except for landlord class for all
other classes maximum occurrence is in ‘nothing or little’ consumer durable category.
The disparity in quality of living also gets reflected across castes as well. Kurmi,
Koiri, Brahmin etc. and Bhumihar etc. are well-off section in rural Bihar and scheduled
caste tribe and backward caste Muslims form the lower side with other backward caste
II, Yadav, backward caste I and upper caste Muslim households falling in the middle. In
quality of living, taking housing status and consumer durable ownership, the Kurmi and
Bhumihar etc. occupy the top position with Kurmi being better endowed with housing
and Bhumihar relatively better in ownership of consumer durables. Only 3 percent of

164
backward caste Muslims own pucca houses and none of the scheduled tribe households
own any modern gadgets. More than four-fifth of backward and upper caste Muslim
households lives in kutcha houses. Among the better off castes, two-fifth of Brahmins
stay in kutcha houses and one-third of them hardly own any consumer durable. Similar is
the case of other backward caste II. So caste disparity among two relatively better off
castes is quite high. The well off caste of Koiri shows much lower status in terms of
consumer durable with almost half of the households hardly owning any consumer
durable.
The inter-relation between housing status and consumer durable shows that
similar to class, across castes households owning ‘pucca’ houses have maximum
occurrence in consumer durable category of ‘some items’. The picture is contrasting in
the case of ownership of semi-pucca houses. Brahmin etc. and Bhumihar etc. show
maximum occurrence in the consumer durable category of ‘some items’, whereas for all
other castes the maximum occurrence is in the category of ‘little or nothing’.
Interestingly, Bhumihar households living in kutcha houses also have maximum
occurrence in the consumer durable category of ‘some items’’
To sum up, it can be seen that in total assets Gopalganj district tops closely
followed by Rohtas. Purnea lies at the bottom. But in both land and cattle assets Rohtas
tops. The highest productive asset is in Rohtas. Its productive asset holding is fifty
percent more than the Nalanda district that follows it. Gopalganj tops in total asset per
capita because of its very high level of non-productive assets. Better position of Rohtas
district in productive assets is due to its higher quality of milch animal and much higher
level of agricultural machinery and implements. So growth in mechanisation of
agriculture and development of animal husbandry has gone hand in hand. But only one-
fourth of its total assets is productive. But the poorest Purnea district has one-third of its
total assets in productive uses. It gets reflected in quality of living with nine-tenth and
seven-tenth of its households living in kutcha houses and very little consumer durable.
But higher level of non-productive assets in Gopalganj has not led to better quality of
living of its populace in relation to Rohtas district. In terms of quality of housing and
consumer durable households in Rohtas is better off than that of Gopalganj. It shows that
the distribution of non-productive asset is starker in Gopalganj.
165
Across classes, in total assets and landholding consistent rise from casual non-
cultivating agricultural labour to landlord class is observed. But the smooth upward
movement breaks down at disaggregated level. In both milch animal and other cattle the
peak is reached at middle peasants and in respect of agricultural implements it is reached
at big peasants. From agricultural labour to poor peasants productive asset holding is
mainly in milch animal. It shows that animal husbandry is vigorously taken up to middle
peasants and big peasants use most improved technology in agricultural operation. But
highest level of productive asset holding achieved by landlord class is due to their far
higher level of non-agricultural assets. It shows that landlord class has diversified into
non-agricultural activity with vigour. As expected, non-agricultural class has the highest
proportion of productive assets in non-agricultural assets. Even the non-productive asset
holding of landlords are considerably higher than the next better off class of big peasants.
It gets reflected in their best quality of living among all classes. Two-fifth of landlords
live in pucca houses and every sixth landlord household has some modern gadgets. In
contrast, two-third of all labour class lives in kutcha houses and similar proportion hardly
has any consumer durable.
In the case of the castes, the picture is somewhat mixed. Kurmi tops in total
assets followed by Bhumihar etc. Scheduled caste and backward caste Muslims lie in the
bottom. Bhumihar etc. has the highest landholding. Yadav has far higher level of milch
animal asset and relatively high level of other cattle assets than all other castes showing
its dominance in animal husbandry. Kurmi caste tops in productive asset holding because
of its much larger non-agricultural productive assets reflecting its diversification in non-
agricultural activities. However, proportion of productive asset in total asset is highest in
relatively poor upper caste Muslims followed by Yadav. Bhumihar etc. is endowed with
much larger proportion of non-productive assets. But it gets reflected in their ownership
of better type of consumer durable with almost every sixth household having modern
gadgets. But much larger proportion of Kurmi households lives in pucca houses. In
contrast, four-fifth of backward and upper caste Muslims lives in kutcha houses and
scheduled tribes and backward caste Muslims hardly own any modern gadgets.
The above-mentioned scenario shows the stark contrast in asset holding and
quality of living in terms of geographical spread, class and caste.
166
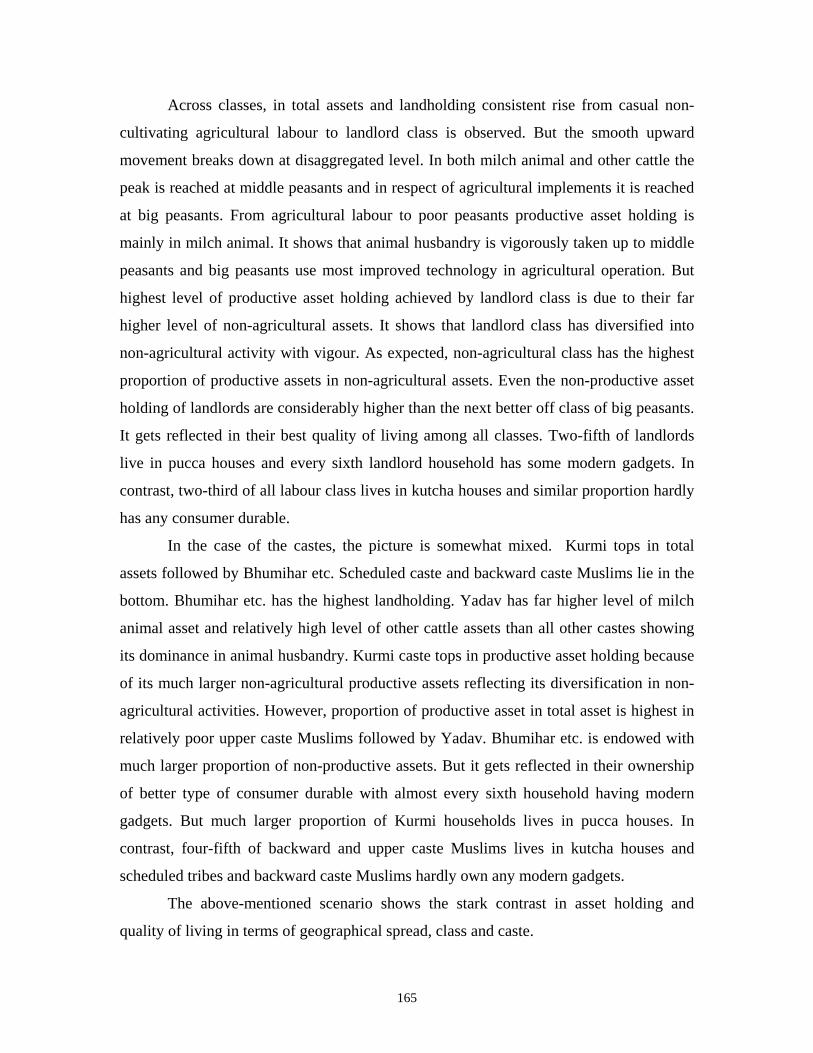
Indebtedness
In this section we begin with average level of debt per household and proportion
of household indebted by both traditional and institutional sources(see table 6.5).
The level of indebtedness and percentage of households indebted district-wise
shows that . Madhubani is the most indebted district followed by another north Bihar
district of Gopalganj, which is followed by agriculturally prosperous district of Rohtas.
Traditional loan per household is highest in Madhubani district followed again by
Gopalganj. Gaya has lowest level of debt and also lowest proportion of households
indebted. In case of modern debt, interestingly Purnea has highest level of debt even
when proportion of households taking loan from this source is less than even 10 percent.
Inter-district variations in the level of indebtedness from modern source is not much with
the exception of Nalanda. Here, the least proportion of households is also indebted
among all districts. However, proportion of households indebted from modern source is
high for more prosperous district of Gopalganj and Rohtas.
Class-wise, mean amount of traditional debt rises from non-cultivating casual
labour to poor middle peasants, then fall for middle peasant and again rises up to landlord
class but never to rise to the level of middle peasants’ category. Percentage of indebted
households is highest for attached labour (more than half) and lowest for landlord class
(less than one-fourth) with other classes falling in between. Proportion of indebted
households shows continuous fall from poor middle peasants to landlord class. The rise in
mean level of traditional debt from middle peasants to landlord class is caused by higher
level of traditional debt per household.
Caste-wise, it can be seen that mean level of traditional debt is highest for
Brahmin caste and lowest for scheduled caste and tribes. Backward caste II (i.e. Kurmi,
Yadav, Koiri and other backward castes II) fall below Brahmin although mean level of
traditional debt is far lower. The reason being both average debt of indebted households
as well as proportion of indebted households is far higher in Brahmin caste.
167
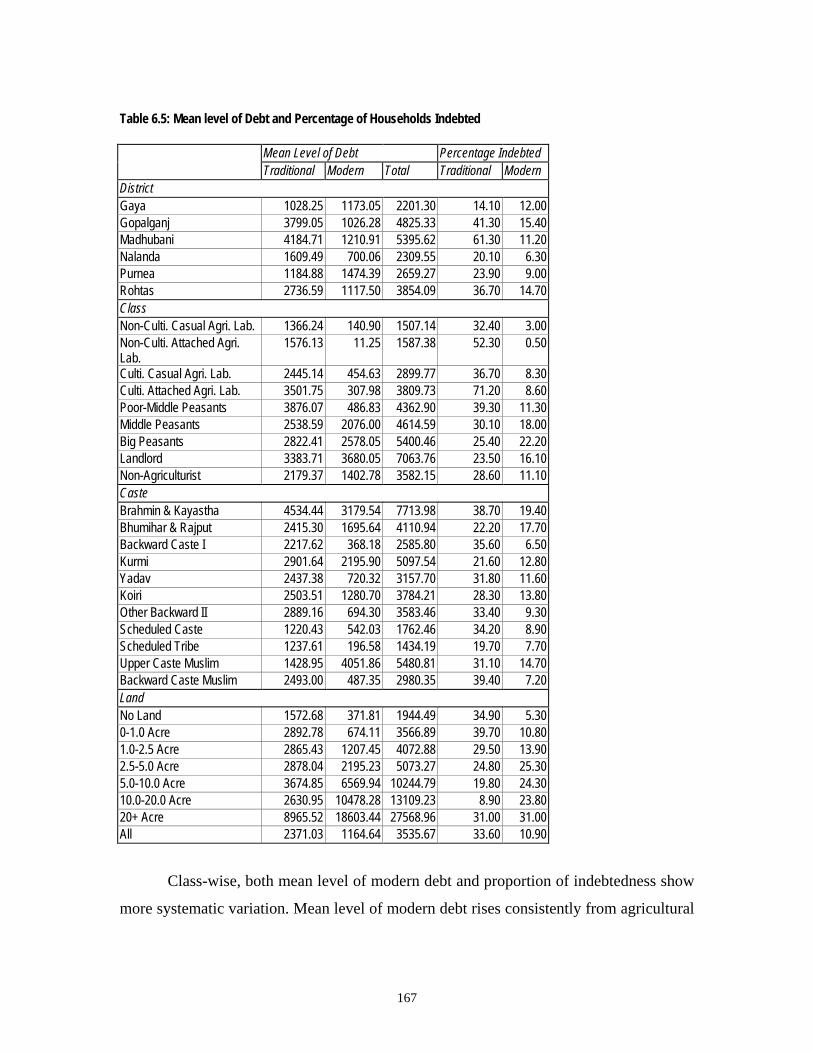
Table 6.5: Mean level of Debt and Percentage of Households Indebted
Mean Level of Debt Percentage Indebted
Traditional Modern Total Traditional Modern District Gaya 1028.25 1173.05 2201.30 14.10 12.00 Gopalganj 3799.05 1026.28 4825.33 41.30 15.40 Madhubani 4184.71 1210.91 5395.62 61.30 11.20 Nalanda 1609.49 700.06 2309.55 20.10 6.30 Purnea 1184.88 1474.39 2659.27 23.90 9.00 Rohtas 2736.59 1117.50 3854.09 36.70 14.70 Class Non-Culti. Casual Agri. Lab. 1366.24 140.90 1507.14 32.40 3.00 Non-Culti. Attached Agri. Lab.
1576.13 11.25 1587.38 52.30 0.50
Culti. Casual Agri. Lab. 2445.14 454.63 2899.77 36.70 8.30 Culti. Attached Agri. Lab. 3501.75 307.98 3809.73 71.20 8.60 Poor-Middle Peasants 3876.07 486.83 4362.90 39.30 11.30 Middle Peasants 2538.59 2076.00 4614.59 30.10 18.00 Big Peasants 2822.41 2578.05 5400.46 25.40 22.20 Landlord 3383.71 3680.05 7063.76 23.50 16.10 Non-Agriculturist 2179.37 1402.78 3582.15 28.60 11.10 Caste Brahmin & Kayastha 4534.44 3179.54 7713.98 38.70 19.40 Bhumihar & Rajput 2415.30 1695.64 4110.94 22.20 17.70 Backward Caste I 2217.62 368.18 2585.80 35.60 6.50 Kurmi 2901.64 2195.90 5097.54 21.60 12.80 Yadav 2437.38 720.32 3157.70 31.80 11.60 Koiri 2503.51 1280.70 3784.21 28.30 13.80 Other Backward II 2889.16 694.30 3583.46 33.40 9.30 Scheduled Caste 1220.43 542.03 1762.46 34.20 8.90 Scheduled Tribe 1237.61 196.58 1434.19 19.70 7.70 Upper Caste Muslim 1428.95 4051.86 5480.81 31.10 14.70 Backward Caste Muslim 2493.00 487.35 2980.35 39.40 7.20 Land No Land 1572.68 371.81 1944.49 34.90 5.30 0-1.0 Acre 2892.78 674.11 3566.89 39.70 10.80 1.0-2.5 Acre 2865.43 1207.45 4072.88 29.50 13.90 2.5-5.0 Acre 2878.04 2195.23 5073.27 24.80 25.30 5.0-10.0 Acre 3674.85 6569.94 10244.79 19.80 24.30 10.0-20.0 Acre 2630.95 10478.28 13109.23 8.90 23.80 20+ Acre 8965.52 18603.44 27568.96 31.00 31.00 All 2371.03 1164.64 3535.67 33.60 10.90
Class-wise, both mean level of modern debt and proportion of indebtedness show
more systematic variation. Mean level of modern debt rises consistently from agricultural

168
labour class to landlord class and proportion indebted also show similar rise up to the
level of big peasants.
Similar to traditional debt, in modern debt also the Brahmin etc. shows high level
of debt per household as well as highest proportion of household indebted. Upper caste
Muslim comes second highest in mean level but with somewhat less proportion of
indebted households. In contrast, scheduled caste and tribes and backward caste I occupy
the bottom rung with low level of mean debt and the least proportions of their households
are indebted from this source.
Land sizewise, mean level of institutional debt shows very systematic rise as one
moves up the landsize group. But in case of traditional debt, no pattern is observed except
for low level of debt of ‘no land’ households and substantial higher level of debt in the
case of land size group ‘20+ acre’.
In case of interest rate charged by traditional loan the households in Purnea
district pay interest at astronomical level, more than 100 per cent per annum. Lowest
interest rate charged is in Madhubani with little over 50 percent. In all other districts
interest charged fall in the narrow range of 66--74 percent.
Class-wise, the interest charged, shows less variability. No doubt, the lowest rung
of class i.e. agricultural labour classes (except for cultivating attached labour and non-
agricultural classes pay more than 70 percent rate interest with non-cultivating attached
labour paying as high as 88 percent rate of interest. Interested in the case of the
traditional loan, shows very little variation.
Apart from the quantum of debt, the burden of debt gets reflected by interest
charged on them. Table 6.6 presents interest rate charged by institutional and traditional
sources across different sections of households. Interest rate charged by institutional
source show very little variation ranging from 13 to 14 percent rate of interest.

169
Table 6.6: Interest Paid by Institutional and Traditional Source
Interest Paid per Annum(%) Institutional Traditional
District Gaya 13.69 71.16 Gopalganj 13.05 67.51 Madhubani 13.66 56.50 Nalanda 13.49 66.83 Purnea 13.57 106.33 Rohtas 13.71 74.43 Class Non-Culti. Casual Agri. Lab. 13.68 79.53 Non-Culti. Attached Agri. Lab.
14.00 88.21
Culti. Casual Agri. Lab. 13.57 71.97 Culti. Attached Agri. Lab. 13.52 62.03 Poor-Middle Peasants 12.92 63.83 Middle Peasants 13.35 57.43 Big Peasants 13.63 63.21 Landlord 13.51 55.35 Non-Agriculturist 13.50 71.02 Caste Brahmin & Kayastha 13.54 61.89 Bhumihar & Rajput 13.68 57.15 Backward Caste I 13.54 67.99 Kurmi 13.87 63.73 Yadav 13.55 59.60 Koiri 13.24 57.42 Other Backward II 13.32 61.96 Scheduled Caste 13.41 72.74 Scheduled Tribe 14.00 120.00 Upper Caste Muslim 13.97 93.84 Backward Caste Muslim 13.30 84.31 Land No Land 13.59 77.34 0-1.0 Acre 13.51 65.55 1.0-2.5 Acre 13.44 62.80 2.5-5.0 Acre 13.62 69.50 5.0-10.0 Acre 13.45 51.78 10.0-20.0 Acre 13.40 70.80 20+ Acre 13.56 60.00 All 13.53 70.73
Caste-wise, the variation is again quite high being more than that of the district in
case of traditional loans. Scheduled tribes households pay a whipping 120 percent rate of
interest. Lower than those are upper and backward caste Muslims. Landed caste of
Bhumihar, etc. Koiri and Yadav pay lowest rate of interest i.e. less than 60 percent. Other
170
castes fall in between. So, the castes with lowest asset holding, the most vulnerable one,
pay the highest rate of interest. The average interest paid by all households in traditional
loan is still very high at about 70 percent per annum.
Not all loans from traditional source are obtained against paying exorbitant
interest rate. Some of the loans are taken by mortgaging land and some are obtained at no
interest rate. The former shows the severity aspect of traditional loan and the latter the
most favourable condition. These are presented in table 6.7.
Mortgaging of land is highest in Gaya district so much so that nearly one-tenth of
all traditional loans is against mortgaged land. In Madhubani and Rohtas district it is the
minimum. Madhubani incidentally has also least proportion of households availing loans
at no interest rate. Conversely, the districts of Gaya and Gopalganj with very high
proportion of traditional loan against mortgaged land also experience very high
proportion of indebted households manage ready and loan at no interest (more than one
month).
Class-wise, more variation is observed. Landlord class is seen to be the highest
recipient of traditional loan against mortgaged land whereas non-cultivating agricultural
labour and non-agriculturist households expectedly turn out to be the lowest recipient. In
case of getting loans at no interest, high proportion of poor middle peasants and non-
cultivating attached labour manage to get traditional loan at no interest.
Across caste, in case of both mortgaged land and loans at no interest the better off
caste households constitute the highest proportion. Bhumihar and Koiri caste households
score very high on both these counts. However, Kurmi caste seems to be in best position.
Hardly one percent of them gets traditional loans against mortgaged land and nearly one-
fourth of Kurmi households manage loans at no interest. The poor castes like scheduled
caste and tribe, backward caste I and backward caste Muslim households indulge much
less in these processes of obtaining loans.
Land sizewise, households with higher land size holding occupy highest position
in these practices. One-third of all households of ’10.0-20.0’ acre size groups and ‘20+’
acre size group get loans by mortgaging land and at no interest rate respectively. The
households with land size group ‘5.0-10.0’ acre get lowest proportion of loans in these
two procedures as well.

171
Table 6. 7: Percentage of Indebted Households Mortgaged Land and Paid no Interest
Percentage of Households in Traditional Loan
Mortgaged Paid No Land Interest
District
Gaya 9.54 24.05 Gopalganj 7.21 28.83 Madhubani 2.11 4.46 Nalanda 6.32 18.96 Purnea 5.57 7.82 Rohtas 2.22 8.44 Class
Non-Culti. Casual Agri. Lab. 1.27 3.61 Non-Culti. Attached Agri. Lab.
2.87 22.00
Culti. Casual Agri. Lab. 3.35 11.13 Culti. Attached Agri. Lab. 7.65 10.93 Poor-Middle Peasants 4.72 25.47 Middle Peasants 2.61 16.61 Big Peasants 8.58 15.61 Landlord 14.14 17.68 Non-Agriculturist 2.21 10.62 Caste Brahmin & Kayastha 8.00 9.52 Bhumihar & Rajput 14.44 20.32 Backward Caste I 3.15 8.07 Kurmi 1.27 22.78 Yadav 6.35 14.64 Koiri 11.06 28.97 Other Backward II 5.05 20.17 Scheduled Caste 0.78 8.62 Scheduled Tribe Upper Caste Muslim 1.00 11.94 Backward Caste Muslim 3.34 9.08 Land No Land 0.33 7.37 0-1.0 Acre 5.54 12.67 1.0-2.5 Acre 10.14 18.04 2.5-5.0 Acre 9.27 22.58 5.0-10.0 Acre 1.24 1.96 10.0-20.0 Acre 33.33 20+ Acre 11.11 33.33 All 4.39 11.85

172
The purpose for which institutional loans are taken gives indication about the
extent of their productive use and the kinds of productive purposes the serve. Table 6.8
presents the purpose of institutional loans having four categories namely capital
investment in agriculture, current investment in agriculture, non-agricultural investment
and others (all other purposes clubbed together).
District-wise, it can be seen that, highest proportion of households availing
institutional loans is for current investment in agricultural purpose except for Gopalganj
district where for non-agricultural investment uses are the maximum. It also gets
reflected in the highest proportion of non-agricultural assets holding as already seen in
table 2 of asset section. Interestingly, both in agriculturally prosperous Rohtas district and
agriculturally most backward Purnea district, more than half of the households take
institutional loan for current investment in agriculture. Incidentally, smallest proportion
of households using institutional loan for capital investment in agriculture and in non-
agricultural investment is in Rohtas district. Households in Madhubani district are
investing almost in equal number in three purposes namely current investment in
agriculture, capital investment in agriculture and in non-agricultural investment. Gaya
district households are actually siphoning the fund to other non-productive uses in
maximum proportion.
Class-wise, quite expectedly, middle peasants to landlord households take
institutional loans mostly for current and capital investment in agriculture. In similar
fashion, it is also true for non-cultivation agricultural labour and non-agriculturist
households in non-agricultural investment. Surprisingly, more than half of poor middle
peasants is using institutional loans for non-agricultural investment. The siphoning of
institutional loan for other purposes is indulged maximum by cultivating agricultural
labour households.

173
Table 6.8: Institutional Loan by Purpose
Percentage Distribution of Purpose of Loan Taken
Capital Investment In
Current Investment In
Non-Agri.
Agriculture Agriculture Investment Others Distric
Gaya 8.50 44.80 23.30 23.40 Gopalganj 13.60 34.20 36.60 15.60 Madhubani 29.60 29.60 28.30 12.50 Nalanda 26.50 47.80 21.20 4.41 Purnea 12.30 56.30 16.90 14.50 Rohtas 7.80 56.70 16.10 19.40 Class Non-Culti. Casual Agri. Lab. 16.00 21.30 46.80 16.00 Non-Culti. Attached Agri. Lab.
100.00
Culti. Casual Agri. Lab. 15.70 35.40 20.10 28.80 Culti. Attached Agri. Lab. 4.50 29.50 25.00 40.90 Poor-Middle Peasants 1.60 32.80 55.70 9.80 Middle Peasants 12.50 51.60 25.00 10.90 Big Peasants 21.60 54.10 13.90 10.40 Landlord 21.50 45.90 19.30 13.30 Non-Agriculturist 5.70 25.00 54.50 14.80 Caste Brahmin & Kayastha 19.80 51.70 17.50 11.00 Bhumihar & Rajput 22.80 52.30 12.10 12.80 Backward Caste I 14.40 44.70 25.80 15.20 Kurmi 36.20 34.00 21.30 8.50 Yadav 12.90 42.40 22.00 22.70 Koiri 15.50 66.20 5.60 12.70 Other Backward II 8.00 30.00 39.00 23.00 Scheduled Caste 15.90 27.60 40.10 16.40 Scheduled Tribe 44.40 55.60 Upper Caste Muslim 15.80 60.00 12.60 11.60 Backward Caste Muslim 9.40 35.90 32.50 22.20 Land No Land 8.00 32.40 38.90 20.70 0-1.0 Acre 11.50 37.60 32.80 18.10 1.0-2.5 Acre 16.00 43.60 19.30 21.10 2.5-5.0 Acre 18.50 63.40 14.20 3.90 5.0-10.0 Acre 39.50 42.00 5.00 13.40 10.0-20.0 Acre 32.50 62.50 5.00 20+ Acre 55.60 33.30 11.10 All 16.40 43.70 24.40 15.50

174
Caste-wise, more than half of households belonging to landed castes of Brahmin
etc. Bhumihar etc. and Koiri caste takes institutional loans for current investment in
agriculture. Among castes, maximum proportion of Kurmi caste households uses
institutional loan for capital investment in agriculture i.e. more that one-third, far higher
than any other caste. Scheduled caste and tribe and other backward caste II households’
use of institutional loan is maximum (more than two-fifth) in non-agricultural investment
purpose. However, investment of Koiri caste households in non-agricultural sector is the
least. Kurmi caste households invest in most balanced manner in all these sources of
productive investment. Yadav and other backward caste II households indulge in
diverting fund to other purpose in most significant manner and least diversion is noticed
in case of Kurmi caste households.
Land sizewise, more proportion of institutional loans are utilised in capital
investment in agriculture as one goes up the ladder of land sizeholding. In non-
agricultural investment almost a reverse trend is observed except for highest land size
holding size group. In case of current investment in agriculture, there is considerable
variation across landsize groups without any distinct trend. Smaller size group holding
indulges more in siphoning of institutional loan for other purpose than larger land holding
households.
Traditional loans are taken for more wide ranging purposes than institutional loans. These
are largely taken for unproductive purposes since institutional loan for consumers are
hardly available in rural Bihar. Table 6.9 lists several purposes for which traditional
loans are used. These include non-productive purposes like consumption, illness and
exceptional social expenditure and productive purpose like current and capital investment
in agriculture and non-agricultural investment and other specified purposes.
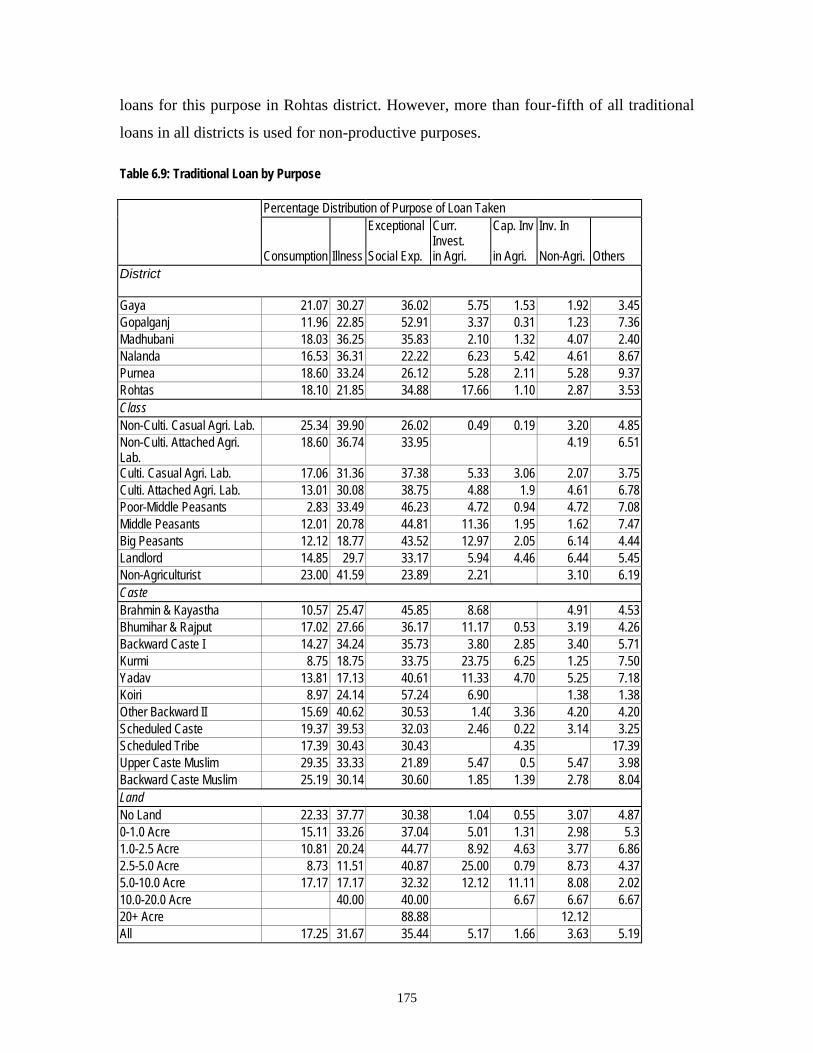
Across districts, maximum proportion of traditional loans is taken either for
illness or for exceptional social expenditure. In Gaya, Gopalganj and Rohtas these are
taken mostly for exceptional social expenditure and for Madhubani, Nalanda and Purnea
districts these are taken mostly for illness. The poorest district of Purnea tops in utilising
maximum proportion of traditional loans for consumption purposes. Use of traditional
debt for current investment in agriculture has more than three time proportional
occurrence in Rohtas district than any other district reflecting the need for institutional
175
loans for this purpose in Rohtas district. However, more than four-fifth of all traditional
loans in all districts is used for non-productive purposes. Table 6.9: Traditional Loan by Purpose
Percentage Distribution of Purpose of Loan Taken
Exceptional Curr. Invest.
Cap. Inv Inv. In
Consumption Illness Social Exp. in Agri. in Agri. Non-Agri. Others District
Gaya 21.07 30.27 36.02 5.75 1.53 1.92 3.45 Gopalganj 11.96 22.85 52.91 3.37 0.31 1.23 7.36 Madhubani 18.03 36.25 35.83 2.10 1.32 4.07 2.40 Nalanda 16.53 36.31 22.22 6.23 5.42 4.61 8.67 Purnea 18.60 33.24 26.12 5.28 2.11 5.28 9.37 Rohtas 18.10 21.85 34.88 17.66 1.10 2.87 3.53 Class Non-Culti. Casual Agri. Lab. 25.34 39.90 26.02 0.49 0.19 3.20 4.85 Non-Culti. Attached Agri. Lab.
18.60 36.74 33.95 4.19 6.51
Culti. Casual Agri. Lab. 17.06 31.36 37.38 5.33 3.06 2.07 3.75 Culti. Attached Agri. Lab. 13.01 30.08 38.75 4.88 1.9 4.61 6.78 Poor-Middle Peasants 2.83 33.49 46.23 4.72 0.94 4.72 7.08 Middle Peasants 12.01 20.78 44.81 11.36 1.95 1.62 7.47 Big Peasants 12.12 18.77 43.52 12.97 2.05 6.14 4.44 Landlord 14.85 29.7 33.17 5.94 4.46 6.44 5.45 Non-Agriculturist 23.00 41.59 23.89 2.21 3.10 6.19 Caste Brahmin & Kayastha 10.57 25.47 45.85 8.68 4.91 4.53 Bhumihar & Rajput 17.02 27.66 36.17 11.17 0.53 3.19 4.26 Backward Caste I 14.27 34.24 35.73 3.80 2.85 3.40 5.71 Kurmi 8.75 18.75 33.75 23.75 6.25 1.25 7.50 Yadav 13.81 17.13 40.61 11.33 4.70 5.25 7.18 Koiri 8.97 24.14 57.24 6.90 1.38 1.38 Other Backward II 15.69 40.62 30.53 1.40 3.36 4.20 4.20 Scheduled Caste 19.37 39.53 32.03 2.46 0.22 3.14 3.25 Scheduled Tribe 17.39 30.43 30.43 4.35 17.39 Upper Caste Muslim 29.35 33.33 21.89 5.47 0.5 5.47 3.98 Backward Caste Muslim 25.19 30.14 30.60 1.85 1.39 2.78 8.04 Land No Land 22.33 37.77 30.38 1.04 0.55 3.07 4.87 0-1.0 Acre 15.11 33.26 37.04 5.01 1.31 2.98 5.3 1.0-2.5 Acre 10.81 20.24 44.77 8.92 4.63 3.77 6.86 2.5-5.0 Acre 8.73 11.51 40.87 25.00 0.79 8.73 4.37 5.0-10.0 Acre 17.17 17.17 32.32 12.12 11.11 8.08 2.02 10.0-20.0 Acre 40.00 40.00 6.67 6.67 6.67 20+ Acre 88.88 12.12 All 17.25 31.67 35.44 5.17 1.66 3.63 5.19
176
Across classes, variations are far more than the districts. Use of traditional loan
for illness is maximum for non-cultivating agricultural labour and non-agriculturist class.
For all cultivating classes ranging from agricultural labour to landlord use of traditional
loans is maximum for exceptional social purposes. More than 10 percent of traditional
loans taken by middle peasants and big peasants are utilised for current investment in
agriculture exhibiting the need for institutional loans for these classes of cultivators.
However, use of traditional loans for other purposes do not show any definite trend with
little variation as well.
Across castes, upper caste households and well-to-do landed backward caste
households use traditional loan maximum for exceptional social expenditure purpose. For
other castes, use of traditional loans are either maximum for illness or it is little less than
exceptional social expenditure. Interestingly, nearly one-fourth of all traditional loans
taken by Kurmi households is used for current investment in agriculture. Also it is more
than 10 percent for Bhumihar etc. and Yadav caste reflecting the need of institutional
loan for this purpose.
Across landsize groups, except for households with ‘no land’, for all landholding
households, use of traditional loan is highest for exceptional social expenditure purpose.
More than one-fifth of traditional loans taken by landless households is used for
consumption showing their precarious economic condition. One-fourth of all traditional
loans taken by households with ‘2.5-5.0’ acre landholding are used for current investment
in agriculture reflecting huge shortage of productive capital for these sections of
households.
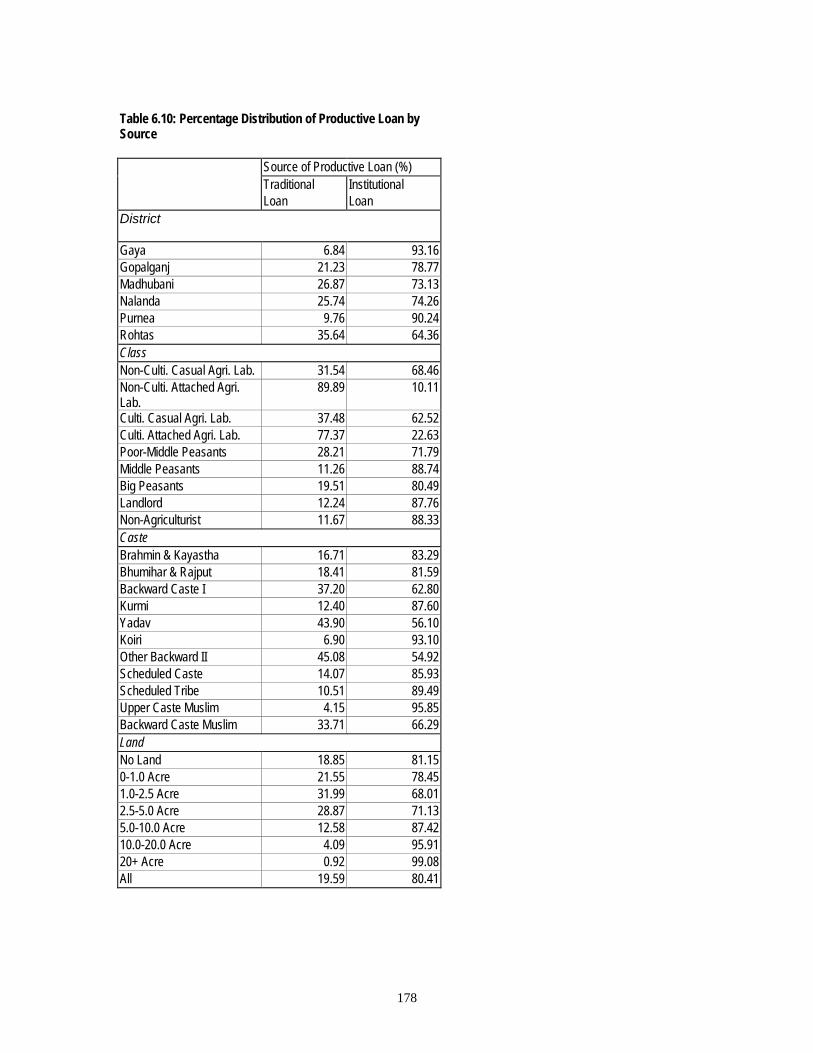
Table 6.10 presents percentage amount of productive loans obtained from
institutional and traditional sources.. The percentage of productive loans source-wise
shows the manner in which the institutional sources have been able to meet the
productive investment requirement of Bihar plain covered in our survey. The districtwise
break-up shows that in agriculturally developed district of Rohtas more than one-third of
the productive investment is still met by traditional source.
Class-wise, it can be seen that agricultural labour classes and poor middle peasant
household still meet a good proportion of their productive investment from traditional
sources. So institutional loans for this section of households needs to be more

177
streamlined. Particularly, attached labour classes hardly have any access to institutional
loans.
Across castes, it can be seen that backward caste I, Yadav, other backward caste
II and backward Muslims still rely substantially on traditional loans even for productive
investment. Traditional source even now meets more than one-third of their productive
investment showing relatively less access to institutional loans for these caste groups.
Land sizewise, highest two landsize groups ’10.0-20.0’ acre and more than 20+ acre
households’ need for productive investment is more or less met by the institutional
sources. But households with 5 acre or less landholding still depends substantially on
traditional sources for their productive investment requirement.
In the end, it will be interesting to compare and contrast the distribution of
productive use of institutional and traditional loans. Table 6.11 gives the contrasting
picture of institutional and traditional loan by productive purpose. For institutional loan
across district it shows that the maximum use of productive loan is for current investment
in agriculture. For traditional loan also it is true except for Madhubani district where
maximum use is made for current investment in non-agriculture. Relatively speaking,
institutional loans are relatively more used in capital investment in non-agriculture than
traditional loans except for Purnea district. In contrast, traditional loans are relatively
more used for current investment in non-agriculture than institutional loans.
Across classes, institutional loans in non-agricultural productive investment
mainly go to capital investment for almost all classes whereas for several classes
traditional loans go mostly to current investment in non-agriculture. But for agricultural
sector both institutional loans and traditional loans go largely to current investment.
Across caste, no clear picture can be observed. However, for almost all landsize
group, in case of non-agricultural sector institutional sources largely finance the capital
investment and traditional sector largely finance the current investment requirement. But
for agricultural sector, both traditional and institutional loans are largely taken for current
investment requirement in agriculture.
178
Table 6.10: Percentage Distribution of Productive Loan by Source
Source of Productive Loan (%)
Traditional Institutional Loan Loan
District
Gaya 6.84 93.16 Gopalganj 21.23 78.77 Madhubani 26.87 73.13 Nalanda 25.74 74.26 Purnea 9.76 90.24 Rohtas 35.64 64.36 Class Non-Culti. Casual Agri. Lab. 31.54 68.46 Non-Culti. Attached Agri. Lab.
89.89 10.11
Culti. Casual Agri. Lab. 37.48 62.52 Culti. Attached Agri. Lab. 77.37 22.63 Poor-Middle Peasants 28.21 71.79 Middle Peasants 11.26 88.74 Big Peasants 19.51 80.49 Landlord 12.24 87.76 Non-Agriculturist 11.67 88.33 Caste Brahmin & Kayastha 16.71 83.29 Bhumihar & Rajput 18.41 81.59 Backward Caste I 37.20 62.80 Kurmi 12.40 87.60 Yadav 43.90 56.10 Koiri 6.90 93.10 Other Backward II 45.08 54.92 Scheduled Caste 14.07 85.93 Scheduled Tribe 10.51 89.49 Upper Caste Muslim 4.15 95.85 Backward Caste Muslim 33.71 66.29 Land No Land 18.85 81.15 0-1.0 Acre 21.55 78.45 1.0-2.5 Acre 31.99 68.01 2.5-5.0 Acre 28.87 71.13 5.0-10.0 Acre 12.58 87.42 10.0-20.0 Acre 4.09 95.91 20+ Acre 0.92 99.08 All 19.59 80.41

179
Table 6.11: Percentage Distribution of Productive Loans by Purpose Institutional Loans Traditional Loans
Curr. Inv. In Agriculture
Cap. Inv. In Agriculture
Curr. Inv. In Non-Agri.
Cap. Inv. In Non-Agri.
Curr. Inv. In Agriculture
Cap. Inv. In Agriculture
Curr. Inv. In Non-Agri.
Cap. Inv. In Non-Agri.
District
Gaya 58.48 11.11 13.45 16.96 62.5 16.67 16.67 4.17 Gopalganj 40.48 16.10 11.22 32.20 68.75 6.25 18.75 6.25 Madhubani 33.83 33.83 7.14 25.19 28.00 17.60 32.80 21.60 Nalanda 50.00 27.78 1.85 20.37 38.33 33.33 18.33 10.00 Purnea 65.84 14.40 10.70 9.05 41.67 16.67 18.75 22.92 Rohtas 70.34 9.66 1.38 18.62 81.63 5.10 9.18 4.08 Class Non-Culti. Casual Agri. Lab. 25.32 18.99 22.78 32.91 12.50 5.00 67.50 15.00 Non-Culti. Attached Agri. Lab. 100.00 22.22 77.78 Culti. Casual Agri. Lab. 49.69 22.09 11.04 17.18 50.94 29.25 9.43 10.38 Culti. Attached Agri. Lab. 50.00 7.69 3.85 38.46 42.86 16.67 16.67 23.81 Poor-Middle Peasants 36.36 1.82 18.18 43.64 45.45 9.09 36.36 9.09 Middle Peasants 57.93 14.02 2.44 25.61 76.09 13.04 4.35 6.52 Big Peasants 60.39 24.07 3.94 11.60 61.29 9.68 15.32 13.71 Landlord 52.99 24.79 8.55 13.68 35.29 26.47 32.35 5.88 Non-Agriculturist 29.33 6.67 18.67 45.33 41.67 25.00 33.33 Caste Brahmin & Kayastha 58.12 22.22 4.7 14.96 63.89 18.06 18.05 Bhumihar & Rajput 60.00 26.15 4.62 9.23 75.00 3.57 10.71 10.71 Backward Caste I 52.68 16.96 15.18 15.18 37.84 28.38 28.38 5.41 Kurmi 37.21 39.53 23.26 76.00 20.00 4.00 Yadav 54.90 16.67 4.90 23.53 53.25 22.08 10.39 14.29 Koiri 75.81 17.74 6.45 83.33 16.67 Other Backward II 38.96 10.39 10.39 40.25 15.63 37.50 21.88 25.00 Scheduled Caste 32.99 19.07 14.95 32.99 42.31 3.85 46.15 7.69 Scheduled Tribe 44.44 44.44 11.11 100.00 Upper Caste Muslim 67.86 17.86 11.90 2.38 47.83 4.35 4.35 43.48 Backward Caste Muslim 46.15 12.09 5.49 36.26 30.77 23.08 23.08 23.08 Land No Land 40.83 10.09 18.35 30.73 22.35 11.76 44.71 21.18 0-1.0 Acre 45.93 14.00 10.75 29.32 53.90 14.06 14.06 17.97 1.0-2.5 Acre 55.3 20.28 5.07 19.35 51.49 26.73 10.89 10.89 2.5-5.0 Acre 65.98 19.26 4.10 10.66 72.41 2.30 17.24 8.05 5.0-10.0 Acre 48.54 45.63 0.97 4.85 38.71 35.48 22.58 3.23 10.0-20.0 Acre 62.50 32.50 5.00 33.333 33.33 33.33 20+ Acre 33.33 55.56 11.11 100.00 All 51.76 19.42 8.35 20.47 49.43 15.86 20.46 14.25
Suming Up
To sum up, mean level of traditional debt is highest in Madhubani district and
maximum proportion of households is also indebted from this source. But they manage to
get it at lowest interest rate (56 percent) and least proportion of households is mortgaging

180
land. In contrast, poorest Purnea (in asset term) shows lowest level of traditional debt and
a low percentage of indebted households. But they pay exorbitant interest rate (106
percent) and a small percentage of these loans are at no interest. Relatively prosperous
Gopalganj district, no doubt, shows high level of debt from this source and substantial
proportion of indebted households but more than one-fourth of such loans are interest
free. Classwise, as one goes up the class ladder from agricultural labour to landlord class,
level of traditional debt goes up but interest rate charged also declines. Land sizewise,
landless households show high percentage of indebtedness with low level of debt and
they pay highest interest rate with small proportion of household (7 percent) manging to
get it at no interest. In contrast, highest landsize group ‘20+ acre’ indicates much larger
level of debt and high proportion of indebtedness but they manage traditional loan at
relatively low interest rate (60 percent) and even one-third of such loans are interest free.
Caste-wise, Kurmi seems to be best off with high level of debt, moderate proportion of
indebted households, more than one-fifth of such loans being interest free and hardly
anybody mortgaging land. Scheduled tribe is in worst position paying whopping (120
percent) interest rate and none of them receives loan at no interest.
In the case of institutional loans, interestingly Purnea shows highest level of debt
with small proportion (less than one-tenth) of households taking loans. In relatively
prosperous Gopalganj and Rohtas, higher proportion of households has managed to get
loan from this source. Class-wise more systematic pattern is observed. Both level of
institutional debt and proportion of household indebted show rise from agricultural labour
to landlord and to big peasants respectively. Caste-wise, scheduled caste, scheduled tribe
and backward caste I households manage to get meagre amount of institutional loan and
that too much small proportions of households. Land sizewise, larger size groups get
much higher level of institutional debt but not necessarily higher proportion of
households in these groups are taking loans. Interest rate variation in institutional loans is
quite low.
Examining the purpose of loan district-wise, it can be seen that the use of
institutional loan is highest for current investment in agriculture except for Gopalganj
district where its maximum use is in non-agricultural investment. It gets reflected in its
highest proportion of non-agricultural assets among districts. Class-wise, from middle

181
peasants to landlord class, largest use of institutional loan is in current investment in
agriculture. Expectedly, largest uses of loan for non-cultivation classes are in non-
agricultural investment. Surprisingly, more than half of institutional loans of poor-middle
peasants is used for non-agricultural purposes. Castewise, landed castes of Bhumihar etc.,
Brahmin etc. and Koiri largely take institutional loan for current investment in
agriculture. But Kurmi caste makes largest use of it in capital investment in agriculture
showing their dynamism in agricultural development. Scheduled caste and scheduled
tribes mostly use it in non-agricultural investment. Land sizewise, except for highest
landsize group ‘20+ acre’ that use it maximum for capital investment in agriculture, rest
of all land owning groups use it maximum for current investment in agriculture.
To what extent institutional loans are able to meet the productive investment
requirement of rural Bihar. The findings show that the institutional loans have been
unable to meet the growing requirement of productive loan. It can be seen from the fact
that most agriculturally prosperous Rohtas district’s one-third of productive investment
requirement is still met by traditional loans whereas for poorest Purnea district,
institutional loans meet 90 percent of its productive investment requirement. Classwise,
poor classes up to poor-middle peasants, castewise Yadav, other backward caste II and
backward caste Muslim and landholding up to ‘5 acre’ still has to rely substantially on
traditional loan for productive use. Institutional loans for these sections of the populace
need to be streamlined.
Traditional loans are mostly used for unproductive purposes. Across districts,
traditional loans are used maximum either for illness or for exceptional social
expenditure. Class-wise for all non-cultivating classes, its highest use is for illness and
that for other classes it is for exceptional social expenditure showing vulnerability of non-
cultivating classes. Caste-wise similar pattern is observed. For upper castes and landed
backward castes, maximum use of it is made for exceptional social expenditure and for
the rest poorer castes it is for illness. Land sizewise, except for landless households that
use it maximum for illness, for all other land-owning households its use is most for
exceptional social expenditure.