Embed Size (px)
Citation preview
ASSET/LIABILITY MANAGEMENT - YEAR 2
“Interest Rate Risk Measurement & Management”
Raleigh A. Trovillion Executive Vice President
UMB Bank Investment Division
St. Louis, MO [email protected]
314-612-8039
July 31, 2018
Investment Banking Division
Raleigh A. “Andy” Trovillion
Executive Vice President
Institutional Banking, UMB Bank
Graduate School of Banking
Madison, Wisconsin
July 31, 2018
INTEREST RATE RISK MEASUREMENT AND
MANAGEMENT

2
Investment Banking Division
This communication is provided for informational purposes only. UMB Bank, n.a. and UMB Financial Corporation are not liable for any errors, omissions, or misstatements. This is not an offer or solicitation for the purchase or sale of any financial instrument, nor a solicitation to participate in any trading strategy, nor an official confirmation of any transaction. The information is believed to be reliable, but we do not warrant its completeness or accuracy. Past performance is no indication of future results. The numbers cited are for illustrative purposes only. UMB Financial Corporation, its affiliates, and its employees are not in the business of providing tax or legal advice. Any materials or tax‐related statements are not intended or written to be used, and cannot be used or relied upon, by any such taxpayer for the purpose of avoiding tax penalties. Any such taxpayer should seek advice based on the taxpayer's particular circumstances from an independent tax advisor. The opinions expressed herein are those of the author and do not necessarily represent the opinions of UMB or UMB Financial Corporation. Products offered through UMB Bank, n.a. Investment Banking Division are: Not FDIC Insured, May Lose Value, Not Bank Guaranteed.
UMB Bank, n.a.
Investment Banking Division
1010 Grand Blvd
Kansas City, MO 64106
866.651.9262

Objectives of this Class
Understand the methods for measuring interest rate risk in financial institutions.Understand the concept of interest rate risk, how it is measured and how it is managed.Review and preparation for Intersession Project.
3

Class Outline
Interest Rate Risk Management and the Asset/Liability Management ProcessMeasuring Interest Rate Risk
• Income Simulation Model• Economic Value of Equity• Static Gap
Keys to Effective Interest Rate Risk Management• Non-Maturity Deposits: Bank Specific• Loan Pre-payment Assumptions: Bank Specific• Rate Shocks vs. Rate Ramps and Parallel vs. Non-Parallel• Back testing the model• Stress Testing the Balance Sheet• Derivatives
Review of Intersession Project
4
Interest Rate Risk and the Asset/Liability Process
The term “asset and liability management” refers to the processes of acquiring and deploying funds to maximize net interest income and the economic value of equity(EVE) of the bank while controlling financial risks.
5

Sources of Interest Rate Risk
Interest Rate Risk is:•The exposure to earnings and economic value arising from adverse movements in interest rates and balance sheet changes.
Sources of Interest Rate Risk:•Repricing/Maturity Mismatch Risk•Option Risk•Yield Curve Risk•Basis Risk•Price or Value Risk
6
Repricing Risk
Results from a mismatch in the amount assets and liabilities that mature/reprice in a given time frame (1 year).What type of loan terms do borrowers want? What do most depositors want?Option Risk: callable bonds in the investment portfolio. Mortgage-backed products in the investment portfolio.Loan pre-payments.Repricing risk is generally the easiest risk to capture and model.
7

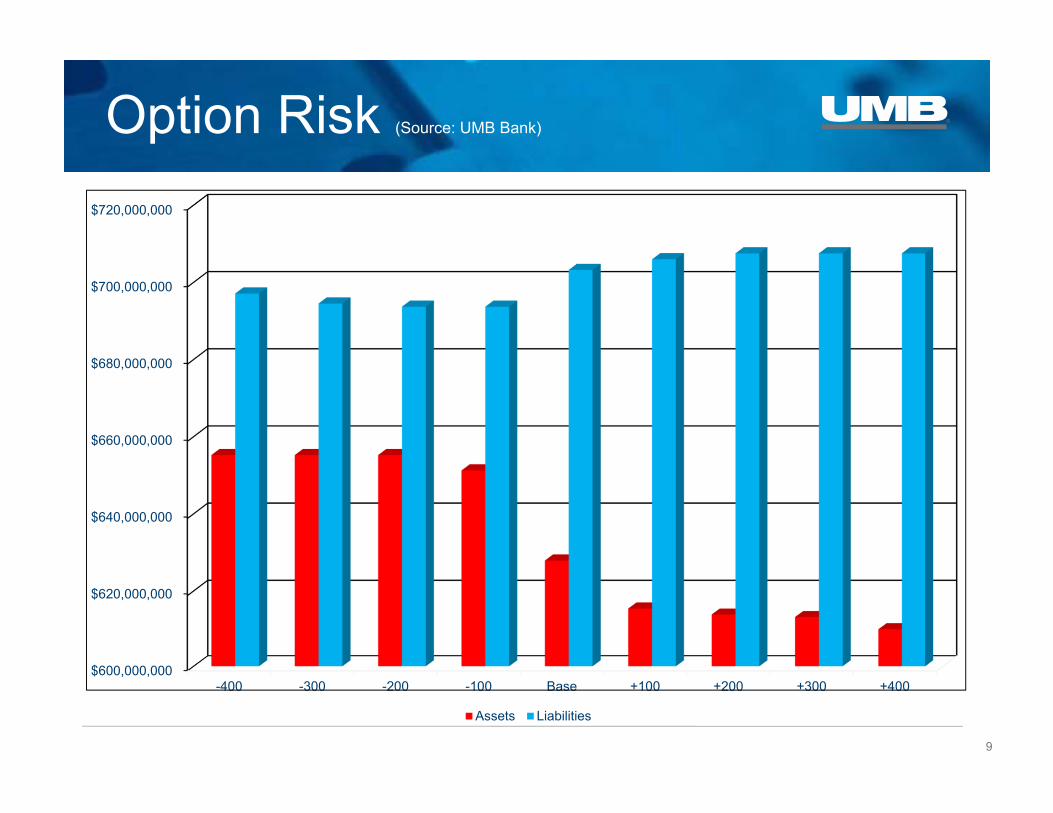
Option Risk (Source: UMB Bank)
-300 -200 -100 Base +100 +200 +300
Assets $ 655,246,631 $ 655,246,631 $ 651,251,373 $ 627,903,338 $ 615,384,262 $ 613,776,195 $ 613,111,798
Liabilities $ 694,534,932 $ 693,705,515 $ 693,705,515 $ 703,225,237 $ 705,977,789 $ 707,526,127 $ 707,526,127
Gap $ (39,288,301) $ (38,458,884) $ (42,454,142) $ (75,321,899) $ (90,593,527) $ (93,749,932) $ (94,414,329)
8
Option Risk (Source: UMB Bank)
$600,000,000
$620,000,000
$640,000,000
$660,000,000
$680,000,000
$700,000,000
$720,000,000
-400 -300 -200 -100 Base +100 +200 +300 +400
Assets Liabilities
9
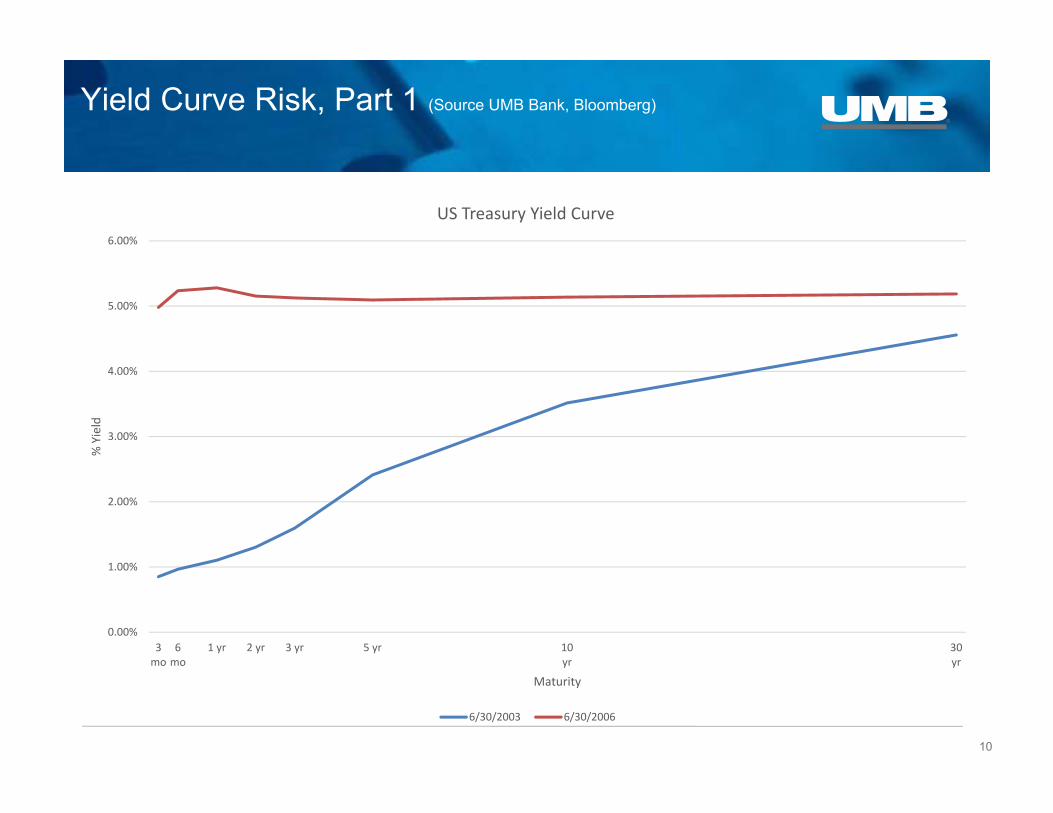
Yield Curve Risk, Part 1 (Source UMB Bank, Bloomberg)
10
0.00%
1.00%
2.00%
3.00%
4.00%
5.00%
6.00%
3mo
6mo
1 yr 2 yr 3 yr 5 yr 10yr
30yr
% Yield
Maturity
US Treasury Yield Curve
6/30/2003 6/30/2006
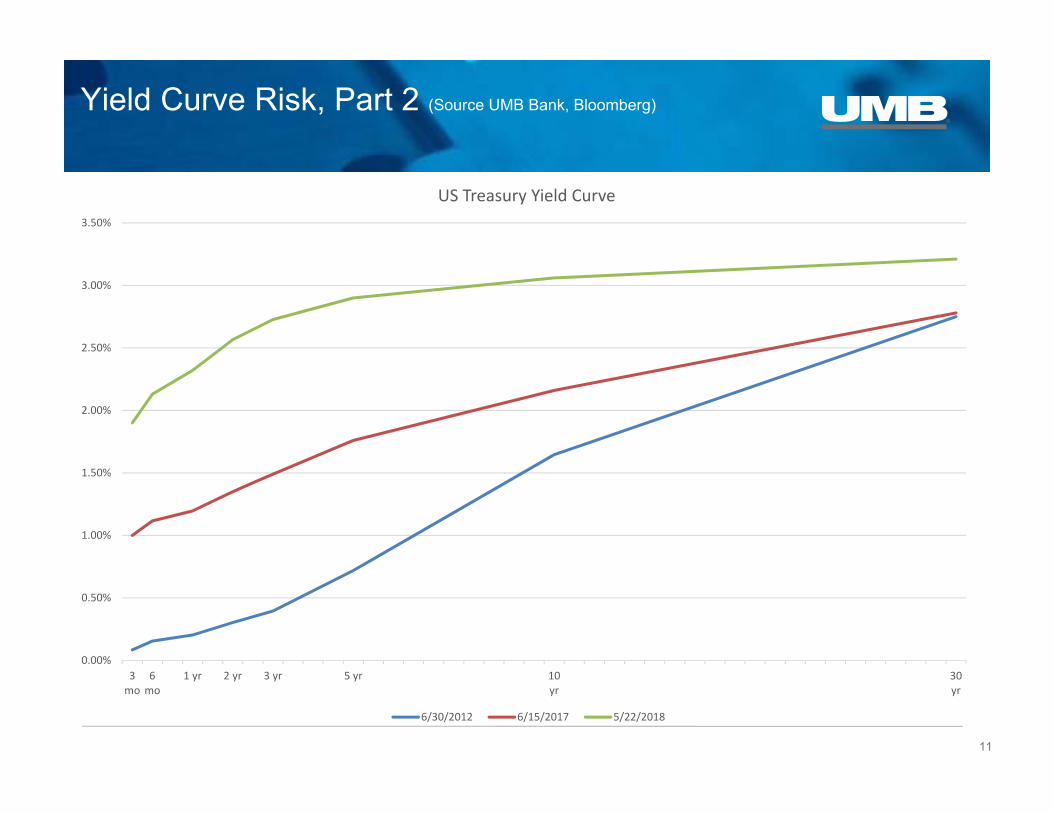
Yield Curve Risk, Part 2 (Source UMB Bank, Bloomberg)
11
0.00%
0.50%
1.00%
1.50%
2.00%
2.50%
3.00%
3.50%
3mo
6mo
1 yr 2 yr 3 yr 5 yr 10yr
30yr
US Treasury Yield Curve
6/30/2012 6/15/2017 5/22/2018

Basis Risk (Source: UMB Bank, Bloomberg)
12
0.00
1.00
2.00
3.00
4.00
5.00
6.00
7.00
8.00
9.00
6/1/20
03
11/1/200
3
4/1/20
04
9/1/20
04
2/1/20
05
7/1/20
05
12/1/200
5
5/1/20
06
10/1/200
6
3/1/20
07
8/1/20
07
1/1/20
08
6/1/20
08
11/1/200
8
4/1/20
09
9/1/20
09
2/1/20
10
7/1/20
10
12/1/201
0
5/1/20
11
10/1/201
1
3/1/20
12
8/1/20
12
1/1/20
13
6/1/20
13
11/1/201
3
4/1/20
14
9/1/20
14
2/1/20
15
7/1/20
15
12/1/201
5
5/1/20
16
10/1/201
6
3/1/20
17
8/1/20
17
1/1/20
18
%
Yield
Basis Risk: Variations in the rate of change in two different indicies (source: Bloomberg)
US Prime 5 Year T‐Note 1 Month LIBOR
Price or Value Risk
As interest rates change, prices of assets and liabilities change.• Rising rates=falling prices
• Falling rates=rising prices
Price or value risk is also influenced by maturity and duration. • Longer duration = larger price change
13
Measuring Interest Rate Risk
Near-term risk to earnings (EAR)• Income Simulation
• Static Gap
Longer-term risk to capital (EVE)• Present value measurement of assets and liabilities and their cash flows discounted using today’s
rates.
• Measures the exposure to the bank’s capital resulting from changes in interest rates.
14

Income Simulation
Focuses on actual income changes under many different interest rate changes.
Allows for more in-depth discovery of risks and opportunities to improve net interest margin.
Permits more sophisticated analysis of the balance sheet by using non-parallel rate changes, rate ramps and “what-if” scenarios.
“What-if” loan volume increases 15% in the next 12 months?
“What-if” we issue $15 million in brokered CDs to fund the loan growth?
“What-if” we sell $10 million in securities to reinvest at higher interest rates?
15

Earnings at Risk Detail (Source: UMB Bank)
16

Economic Value of Equity (Source: UMB Bank)
17

Economic Value of Equity Detail (Source: UMB Bank)
18

Economic Value of Equity Detail (Source: UMB Bank)
19
Static Gap
Measures the miss-match between the repricing interval of assets and liabilities with a given time frame-generally one year.
May be able to approximate the directional exposure a bank faces to interest rate changes.
However, static gap misses key information and behavior characteristics.
20

Challenges with Measuring Interest Rate Risk: Non-maturity Deposits (Source: Sandler, O’Neil)
For most financial institutions, non-maturity deposits account for almost 70% of total funding sources.
How rate sensitive are these deposits? When interest rates rise, how quickly will you have to raise your rates and by how much?
If you don’t raise your rates and the deposits leave, how, and at what cost, will you replace the funding?
21
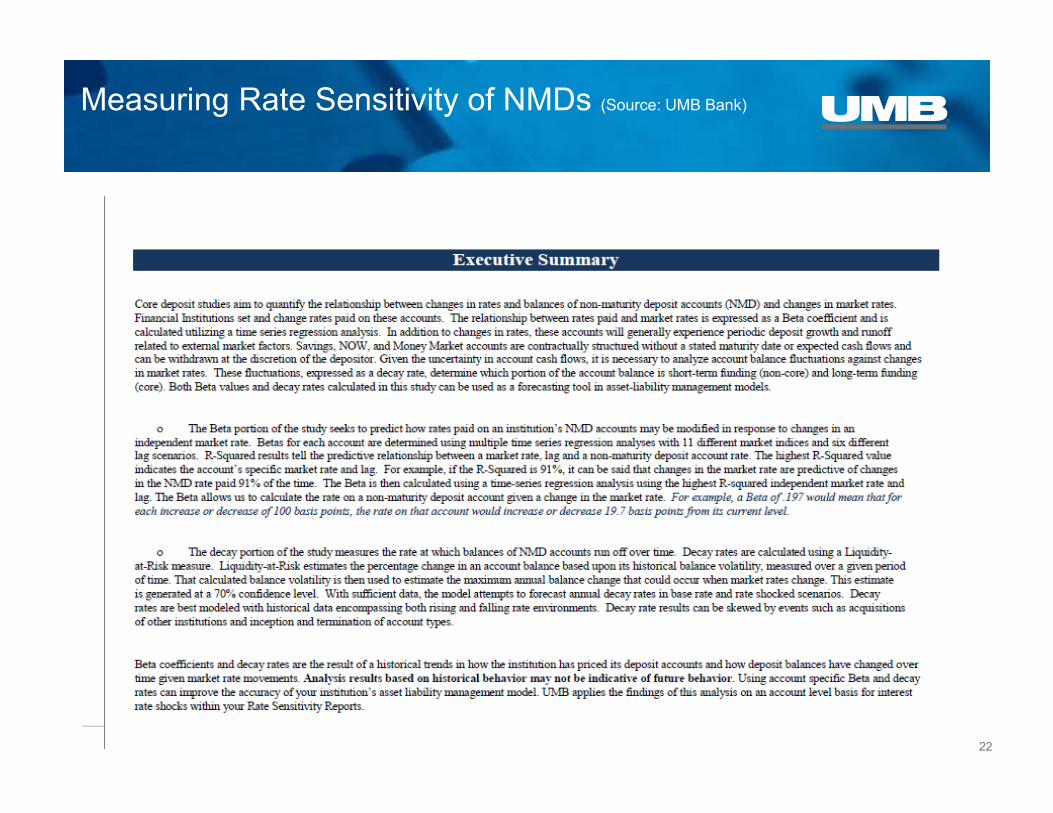
Measuring Rate Sensitivity of NMDs (Source: UMB Bank)
22
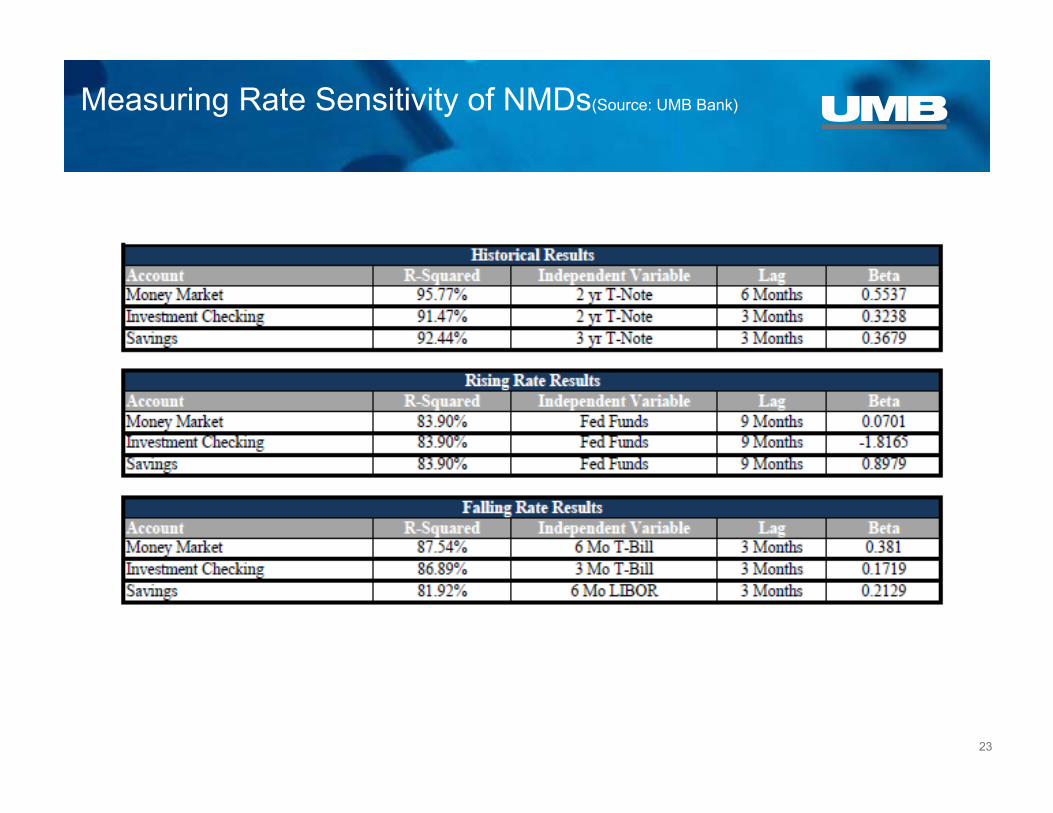
Measuring Rate Sensitivity of NMDs(Source: UMB Bank)
23

Measuring Rate Sensitivity of NMDs(Source: UMB Bank)
24

25
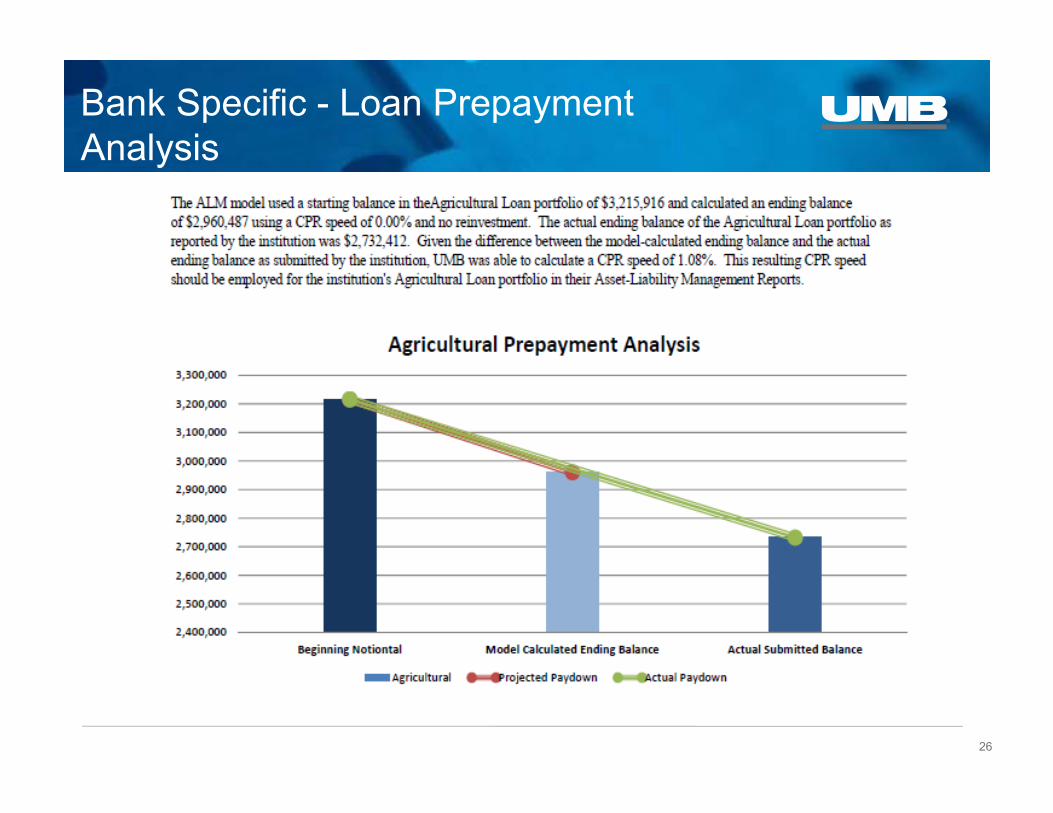
Bank Specific - Loan Prepayment Analysis
26
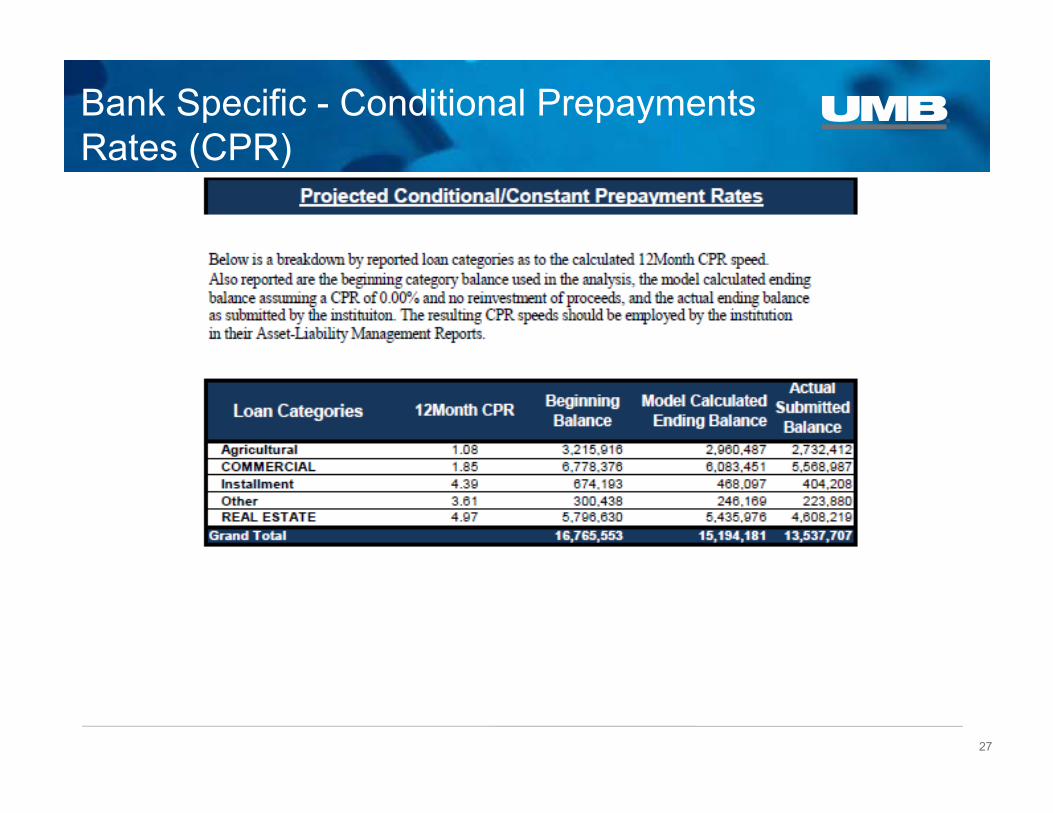
Bank Specific - Conditional Prepayments Rates (CPR)
27
Using Rate Ramps vs. Rate Shocks
A rate shock analysis calculates the immediate price of a security given an immediate change in interest rates.
• It is often considered a “worst case” scenario for market value change
• While it may well be a worst case, it is unrealistic
• Since 1947, interest rates have changed by 300 basis points in a 14 month time frame only twice! The average time frame for 300 basis points rate changes is 38 months.
A rate ramp assumes a given rate change over a period of time, 36 months for example. In theory, it is therefore more accurate as it reflects a “normal” rate change.
• It can incorporate a change in the shape of the yield curve
The net effect is to reduce the potential market value loss over time because bonds age and “roll down” the yield curve.
• Reinvestment issues?
Non-parallel rate changes should be modeled as well. Short-term rates generally change at a much faster pace than long-term rates. Where are bank’s liabilities priced?
28
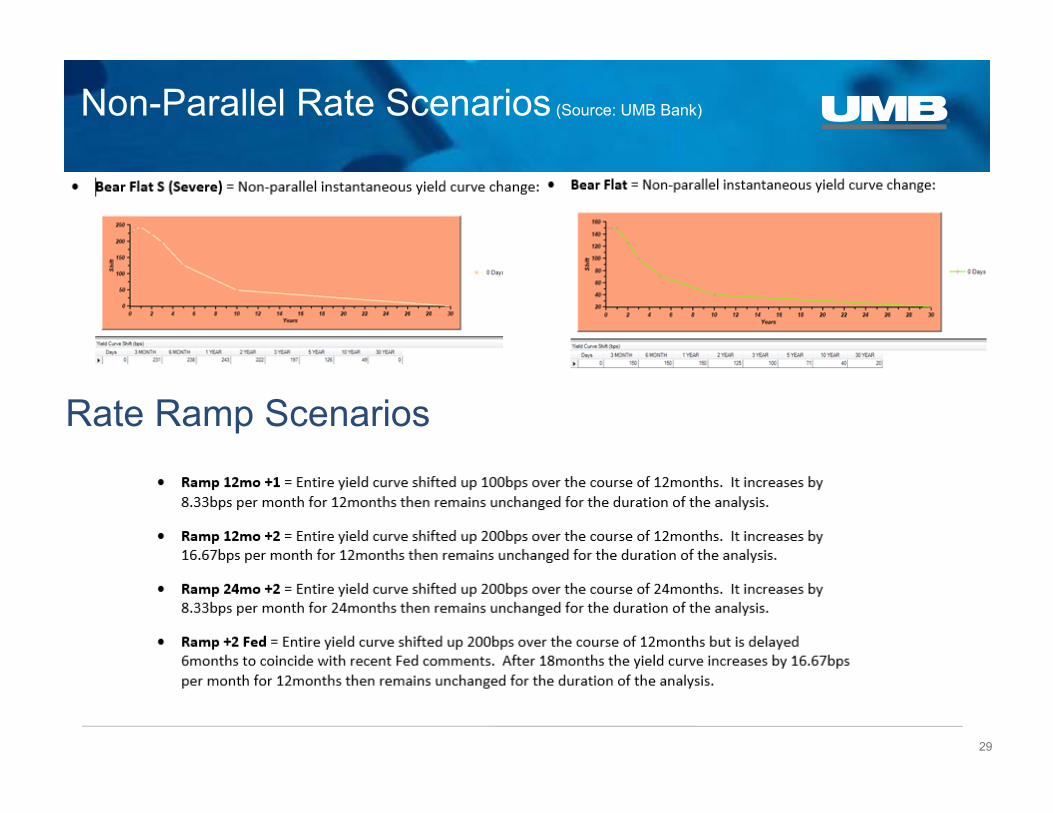
Non-Parallel Rate Scenarios (Source: UMB Bank)
29
Rate Ramp Scenarios
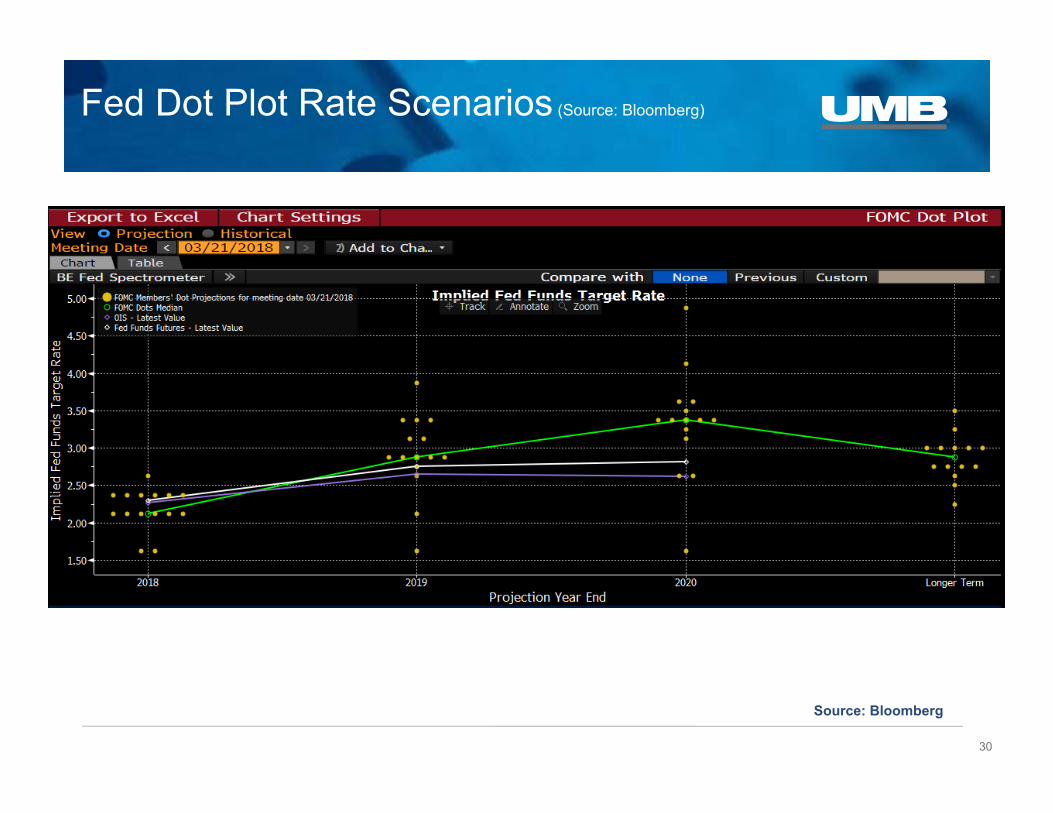
Fed Dot Plot Rate Scenarios (Source: Bloomberg)
30
Source: Bloomberg
31
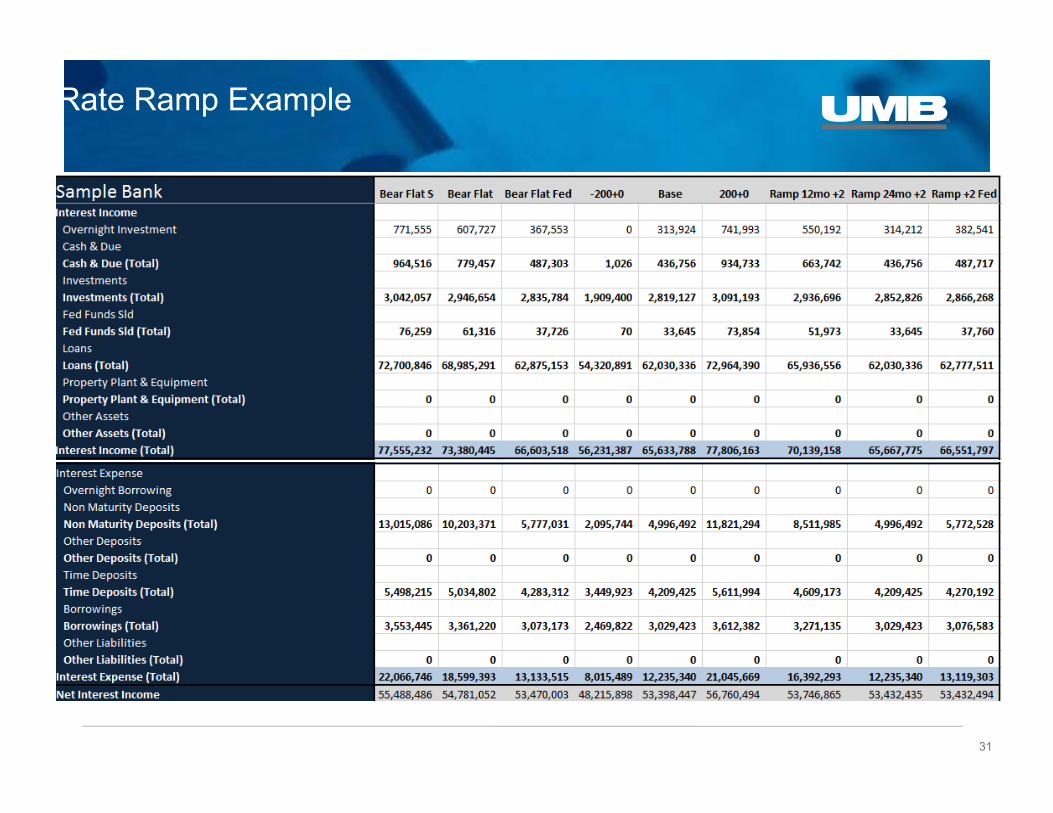
Rate Ramp Example
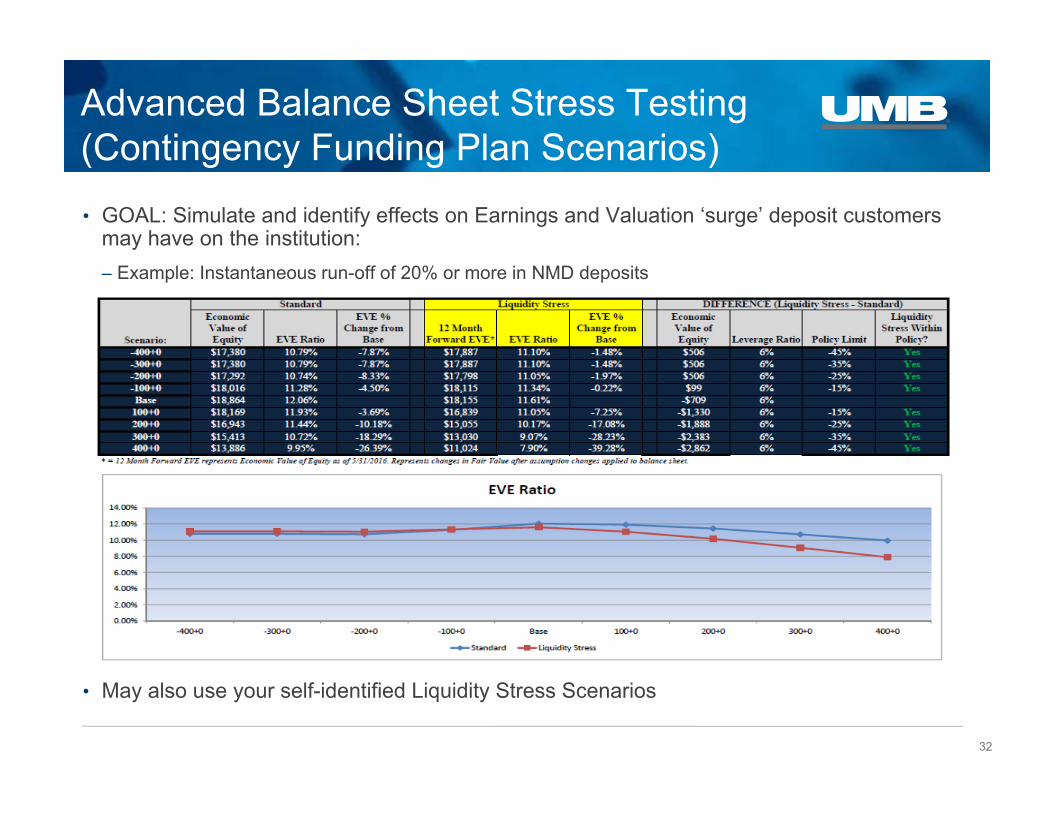
Advanced Balance Sheet Stress Testing (Contingency Funding Plan Scenarios)• GOAL: Simulate and identify effects on Earnings and Valuation ‘surge’ deposit customers
may have on the institution:– Example: Instantaneous run-off of 20% or more in NMD deposits
• May also use your self-identified Liquidity Stress Scenarios
32
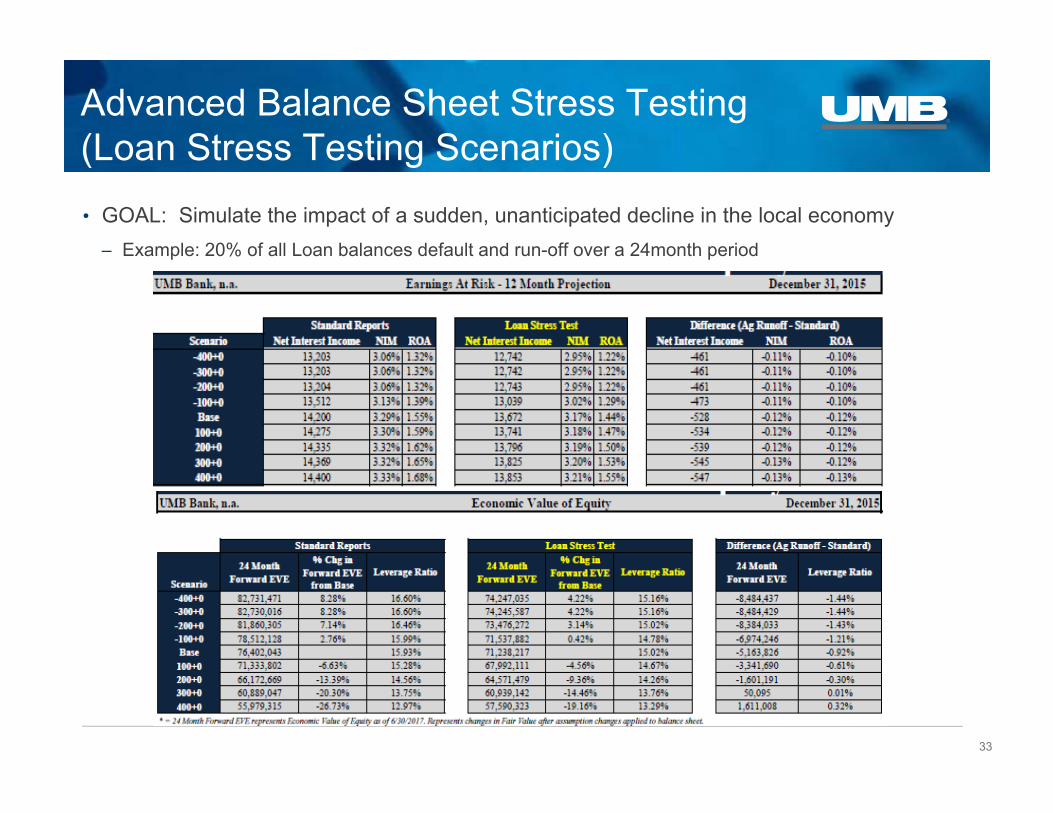
Advanced Balance Sheet Stress Testing (Loan Stress Testing Scenarios)• GOAL: Simulate the impact of a sudden, unanticipated decline in the local economy
– Example: 20% of all Loan balances default and run-off over a 24month period
33
Back Testing the Interest Rate Risk Model
Back testing the interest rate risk model is a key management process. It is designed to measure the accuracy of the key assumptions made.
• Rate change
• Rate sensitivities of financial instruments
• Verify the actual behavior of non-maturity deposits
Provides verification that key assumptions are indeed accurate.
34
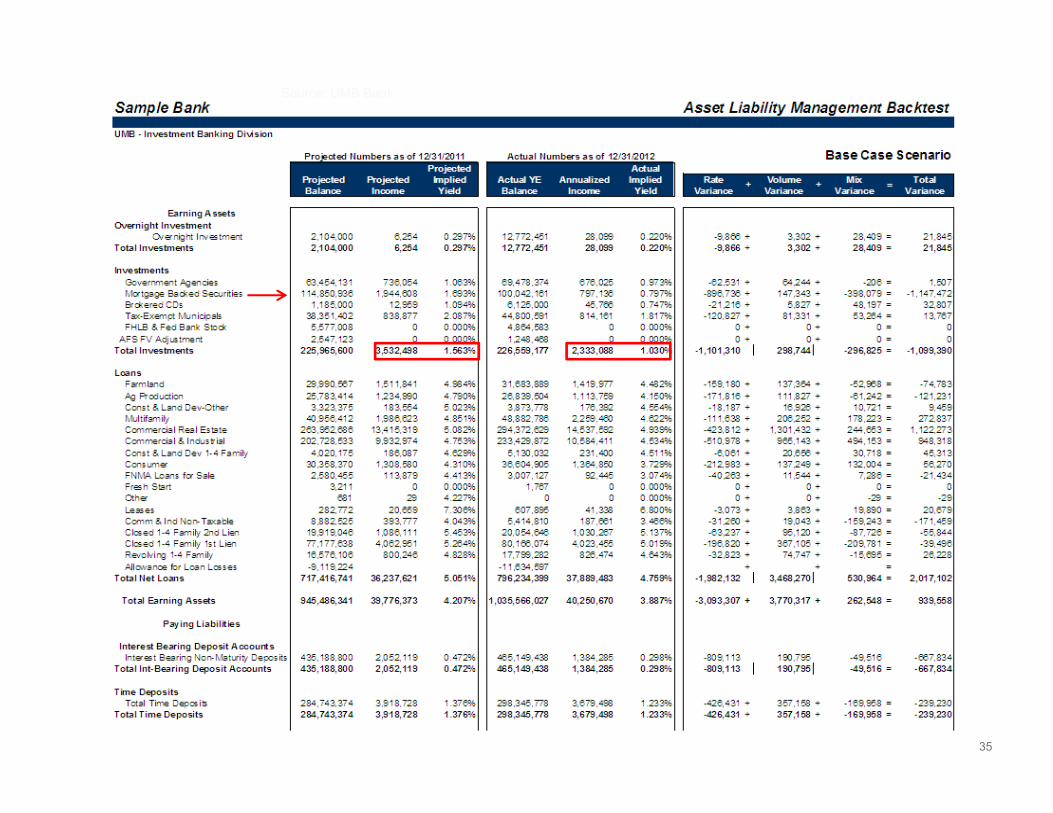
Source: UMB Bank
35

Source: UMB Bank
36
How Manage Interest Rate Risk
• Perhaps the most difficult part of asset/liability management.
• RATE. VOLUME. MIX.
• The bond portfolio quickly becomes the best asset/liability tool you have.• YOU have complete control of the portfolio. YOU determine duration. YOU determine option risk. YOU determine
structure.
• Traditionally bank management would shorten assets or liabilities or lengthen depending upon the risk profile of the bank and the anticipated direction of interest rates.– However, there are current income considerations to keep in mind as your change pricing and terms in
an effort to reduce a risk profile. How much will it cost you to change customer behavior?
• There are many other tools available today. Specifically, access to other “wholesale” sources of funding (brokered CDs, overnight deposits, FHLB advances, forward advances, etc.)
• Off balance sheet hedging.
37
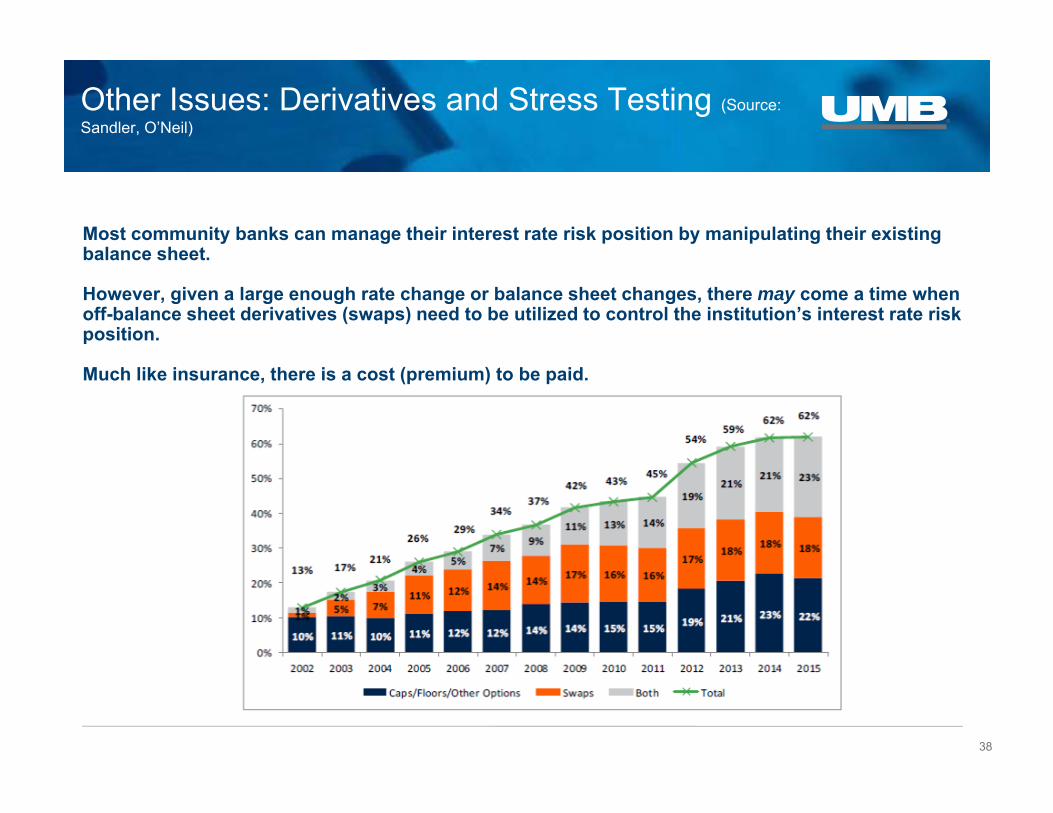
Other Issues: Derivatives and Stress Testing (Source: Sandler, O’Neil)
Most community banks can manage their interest rate risk position by manipulating their existing balance sheet.
However, given a large enough rate change or balance sheet changes, there may come a time when off-balance sheet derivatives (swaps) need to be utilized to control the institution’s interest rate risk position.
Much like insurance, there is a cost (premium) to be paid.
38
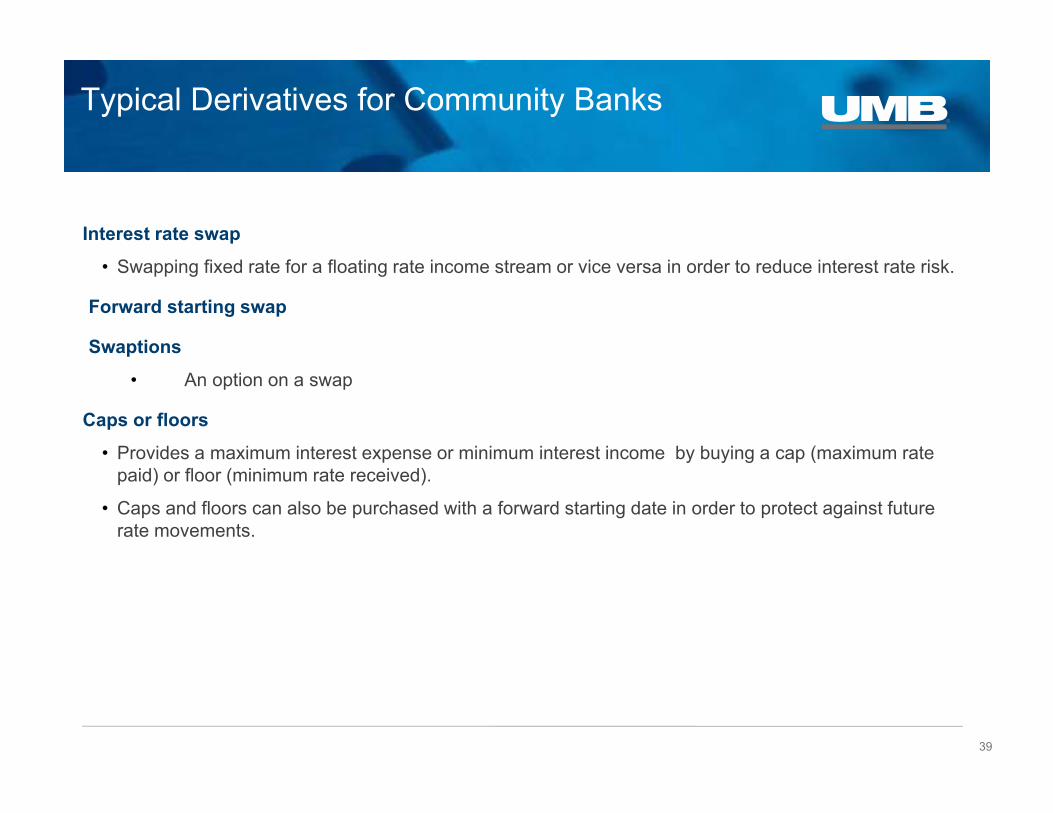
Typical Derivatives for Community Banks
Interest rate swap• Swapping fixed rate for a floating rate income stream or vice versa in order to reduce interest rate risk.
Forward starting swap
Swaptions• An option on a swap
Caps or floors• Provides a maximum interest expense or minimum interest income by buying a cap (maximum rate
paid) or floor (minimum rate received).
• Caps and floors can also be purchased with a forward starting date in order to protect against future rate movements.
39
Intersession Project Part 3:Measuring and Managing Interest Rate Risk
Explain how your institution measures interest rate risk
Analyze “optionality”
Assess how the bank treats its non-maturity/indeterminate deposits
Obtain reports, assess risk level, back testing, etc.
Questions?
40
Contact Information
Raleigh A. “Andy” Trovillion
Executive Vice President
UMB Bank
#2 South Broadway
Saint Louis, Mo. 63102
800-433-5962
41