Embed Size (px)
Citation preview
Tenterfield Shire Council – Fleet Asset Management Plan
i | P a g e
Tenterfield Shire Council
Fleet
Asset Management Plan
Adopted 26 June 2013 (213/13
Asset Management for Small, Rural or Remote Communities
Tenterfield Shire Council – Fleet Asset Management Plan
ii | P a g e
Document Control
Asset Management for Small, Rural or Remote Communities
Document ID: draft fleet asset management plan may 2013.docx
Rev No Date Revision Details Author Reviewer Approver
1.01 05 June 2012 Initial draft John Haddock
Brad Foan
Ralf Stoeckler
2.01 7/6/2013 Revision 1 – Change Template, integrate recent renewals and , improve future renewal and improvement planning
Brad Foan
Dennis Gascoigne
Dennis Gascoigne
Asset Management for Small, Rural or Remote Communities Practice Note
The Institute of Public Works Engineering Australia.
www.ipwea.org.au/AM4SRRC
© Copyright 2011 – All rights reserved.
Tenterfield Shire Council – Fleet Asset Management Plan
iii | P a g e
Table of contents
1. Executive summary ....................................................................................................................................... vi
1.1. Context ................................................................................................................................................. vi 1.2. The Fleet service................................................................................................................................... vi 1.3. What does it cost? ................................................................................................................................ vi 1.4. What we will do ................................................................................................................................... vi 1.5. What we cannot do ............................................................................................................................. vii 1.6. Managing the risks .............................................................................................................................. vii 1.7. The next steps ..................................................................................................................................... vii 1.8. Questions you may have ..................................................................................................................... vii
2. Introduction ................................................................................................................................................... 1
2.1. Background ........................................................................................................................................... 1 2.2. Goals and objectives of asset management .......................................................................................... 2 2.3. Plan framework ..................................................................................................................................... 3 2.4. Community consultation ....................................................................................................................... 3
3. Levels of service ............................................................................................................................................. 4
3.1. Customer Research and Expectations ................................................................................................... 4 3.2. Legislative Requirements ...................................................................................................................... 4 3.3. Levels of service .................................................................................................................................... 5
4. Future Demand .............................................................................................................................................. 7
4.1. Demand forecast ................................................................................................................................... 7 4.2. Changes in technology .......................................................................................................................... 7 4.3. Demand management planning ............................................................................................................ 8 4.4. New assets for growth .......................................................................................................................... 8
5. Lifecycle management plan ........................................................................................................................... 9
5.1. Background data ................................................................................................................................... 9
5.1.1. Physical parameters .......................................................................................................................... 9 5.1.2. Asset capacity and performance..................................................................................................... 10 5.1.3. Asset condition ............................................................................................................................... 10
5.2. Asset valuations .................................................................................................................................. 17 5.2. Risk management plan ........................................................................................................................ 18 5.3. Routine maintenance plan .................................................................................................................. 19
5.3.1. Maintenance plan ........................................................................................................................... 19 5.3.2. Operations and Maintenance Strategies ........................................................................................ 20 5.3.3. Asset hierarchy ............................................................................................................................... 20 5.3.4. Critical Assets .................................................................................................................................. 20 5.3.1. Standards and specifications .......................................................................................................... 21
5.4. Summary of future operations and maintenance expenditures ......................................................... 21 5.5. Renewal/replacement plan ................................................................................................................. 22
5.5.1. Renewal plan................................................................................................................................... 22 5.5.2. Renewal and Replacement Strategies ............................................................................................ 22 5.5.3. Renewal ranking criteria ................................................................................................................. 23 5.5.1. Renewal and Replacement standards............................................................................................. 23 5.5.2. Summary of projected renewals ..................................................................................................... 24
5.6. Creation/acquisition/upgrade plan ..................................................................................................... 24
5.6.1. Selection criteria ............................................................................................................................. 24 5.6.2. Capital Investment Strategies ......................................................................................................... 24 5.6.3. Summary of future upgrade/new assets expenditure .................................................................... 25
Tenterfield Shire Council – Fleet Asset Management Plan
iv | P a g e
5.7. Disposal plan ....................................................................................................................................... 25 5.8. Service Consequences and Risks ......................................................................................................... 26
5.8.1. What we cannot do......................................................................................................................... 26 5.8.2. Service consequences ..................................................................................................................... 26
6. Financial summary ....................................................................................................................................... 27
6.1. Financial statements and projections ................................................................................................. 27
6.1.1. Financial sustainability in service delivery ...................................................................................... 27 6.1.2. Expenditure projections for long term financial plan ..................................................................... 29
6.2. Funding strategy .................................................................................................................................. 30 6.3. Valuation forecasts.............................................................................................................................. 30 6.4. Key assumptions made in financial forecasts ...................................................................................... 30 6.5. Forecast Reliability and Confidence .................................................................................................... 30
7. Asset management practices ....................................................................................................................... 31
7.1. Accounting/financial systems.............................................................................................................. 31
7.1.1. Accounting and financial systems ................................................................................................... 31 7.1.2. Accountabilities for financial systems ............................................................................................. 31 7.1.3. Accounting standards and regulations ........................................................................................... 31 7.1.4. Capital/maintenance threshold ...................................................................................................... 31 7.1.5. Required changes to accounting financial systems arising from this AM Plan ............................... 31
7.2. Asset management systems ................................................................................................................ 31
7.2.1. Asset management system ............................................................................................................. 31 7.2.2. Asset registers ................................................................................................................................. 31 7.2.3. Linkage from asset management to financial system ..................................................................... 31 7.2.4. Accountabilities for asset management system and data .............................................................. 31 7.2.5. Required changes to asset management system arising from this AM Plan .................................. 32
7.3. Information flow requirements and processes ................................................................................... 32 7.4. Standards and guidelines .................................................................................................................... 32
8. Plan improvement and monitoring .............................................................................................................. 33
8.1. Performance measures ....................................................................................................................... 33 8.2. Improvement plan ............................................................................................................................... 33 8.3. Monitoring and review procedures .................................................................................................... 33
10. References ................................................................................................................................................... 34 11. Appendices ................................................................................................................................................... 35 Appendix A: Asset register and physical properties ............................................................................................ 36 Appendix B Plant Item Number Cross Reference ................................................................................................ 44 Appendix C Projected 10 year capital renewal program ..................................................................................... 45 Appendix D Planned upgrade/exp/new 10 year capital program ...................................................................... 46 Appendix E Abbreviations ................................................................................................................................... 47 Appendix F Glossary ............................................................................................................................................ 48
Tenterfield Shire Council – Fleet Asset Management Plan
v | P a g e
List of tables
Table 2-1 Assets covered by this plan ................................................................................................................................. 1 Table 2-2 Council goals and how these are addressed in this plan .................................................................................... 2 Table 3-1 Legislative requirements ..................................................................................................................................... 4 Table 3-2 Current Service levels ......................................................................................................................................... 6 Table 4-1 Demand factors, projections and impact on community ................................................................................... 7 Table 4-2 Changes in technology and forecast effect on service delivery .......................................................................... 7 Table 4-3 Demand Management Plan Summary ................................................................................................................ 8 Table 5-1 IIMM description of condition .......................................................................................................................... 10 Table 5-2 Fleet valuation summary .................................................................................................................................. 17 Table 5-3 Critical risks and treatment plans ..................................................................................................................... 18 Table 5-4 Maintenance expenditure trends ..................................................................................................................... 19 Table 5-5 Asset Service Hierarchy ..................................................................................................................................... 20 Table 5-6 Critical Assets and Service Level Objectives...................................................................................................... 21 Table 5-7 Useful Lives of Assets ........................................................................................................................................ 22 Table 5-8 Renewal and Replacement Priority Ranking Criteria ........................................................................................ 23 Table 5-9 Upgrade/new assets priority ranking criteria ................................................................................................... 24 Table 6-1 Projected and budgeted renewals and expenditure shortfall .......................................................................... 29 Table 6-2 Expenditure projections for long term financial plan ....................................................................................... 29 Table 8-1 Improvement plan ............................................................................................................................................ 33
List of figures
Figure 2-1 Asset physical profile ......................................................................................................................................... 1 Figure 5-1 Asset age profile ................................................................................................................................................ 9 Figure 5-2 Trucks condition profile ................................................................................................................................... 11 Figure 5-3 Earth Moving Plant condition profile............................................................................................................... 13 Figure 5-4 Minor Plant and Equipment condition profile ................................................................................................. 13 Figure 5-5 Trailers condition profile ................................................................................................................................. 14 Figure 5-6 Specialised Plant condition profile .................................................................................................................. 16 Figure 5-7 Light Vehicle condition profile ......................................................................................................................... 16 Figure 5-8 Mowers and Slashes condition profile ............................................................................................................ 17 Figure 5-9 Projected Operations and Maintenance Expenditure ..................................................................................... 21 Figure 5-10 Forecast renewal program ............................................................................................................................ 24 Figure 5-11 Projected Capital Upgrade/New Asset Expenditure ...................................................................................... 25 Figure 5-12 Assets Identified for Disposal ........................................................................................................................ 26 Figure 6-1 Projected funding requirements vs. forecast budgets (combined renewals and new assets) ........................ 27
Tenterfield Shire Council – Fleet Asset Management Plan
vi | P a g e
1. Executive summary
1.1. Context
Tenterfield Shire Council’s Fleet comprises of a diverse combination of heavy road maintenance plant, trucks, trailers, light transport vehicles, minor plant and equipment. The Fleet is utilized to facilitate the maintenance and construction of the road and services networks, provide mobility to Councils workforce and support essential services in the town of Tenterfield, its villages, state forest, national parks and neighbouring rural district. The provision of the Fleet in an operative condition is essential for the ongoing serviceability of infrastructure that supports the main industries of the region of agriculture and tourism.
The main issue associated with the management of the Fleet asset is funding to address basic maintenance and renewal requirements. Of specific concern is the condition of numerous old units which are near or exceeding their service life, thus requiring additional maintenance and repair.
Due to limited available resources, Tenterfield Shire Council prioritises the extension of our fleet and addition of new assets as low priority, focusing instead on maintenance, renewal and replacement of existing assets to maintain a modest level of service.
1.2. The Fleet service
The Fleet comprises of:
Motor Graders 4
Backhoes 3
Excavators 1
Bulldozers 1
Prime Movers 1
Heavy Tippers 2
Medium Tippers 4
Light Tippers 1
Garbage Compactors 3
Landfill Compactors 1
Water Carts 4
Light Trailers 13
Heavy Trailers 5
Rollers 4
Mowers 8
Slashers 3
Mobile Crane 1
Pavement Patch Truck 1
Crane Truck 1
Service Truck 1
Hilux 4WD Utilities 19
Hilux 2WD Utilities 1
Landcruser Utilities 5
RAV 4 Sedans 6
Corolla Sedans 1
Prado Wagons 1
Navara 4WD Utilities 1
Heavy Trailers 5
Specialised Plant Items 7
Tractors 4WD 3
Minor Plant Items 14
These assets have a replacement value of $10,689,000.
1.3. What does it cost?
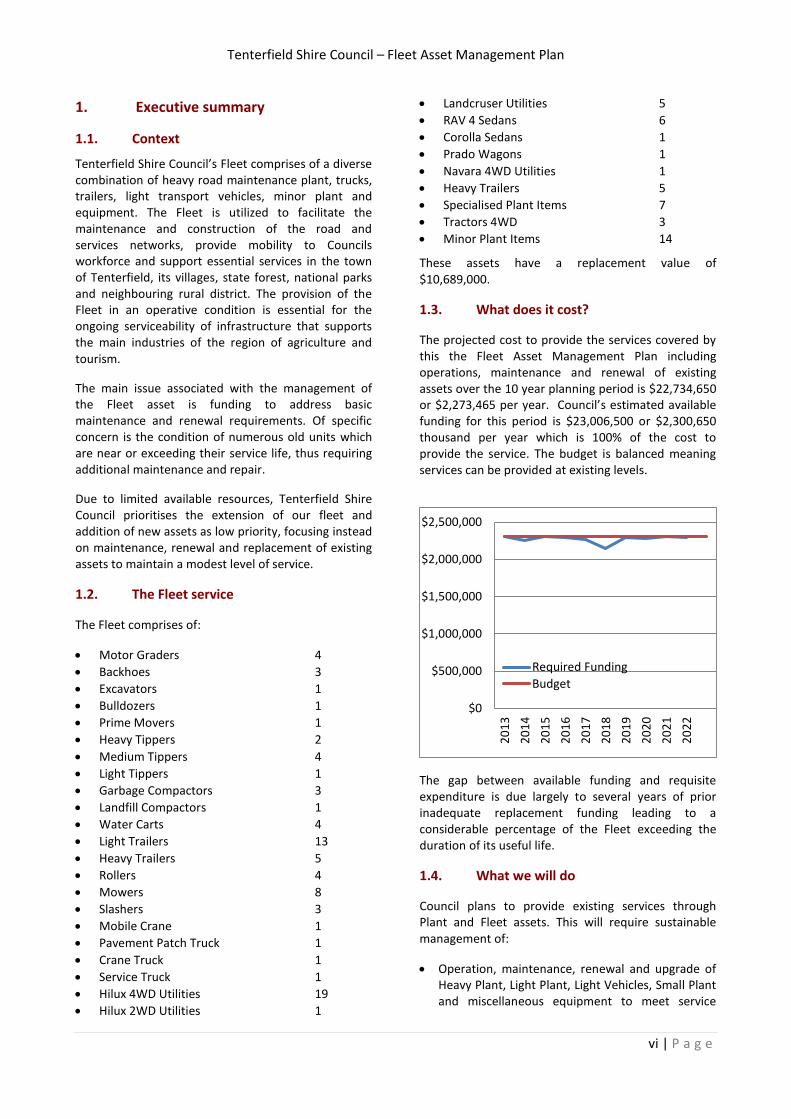
The projected cost to provide the services covered by this the Fleet Asset Management Plan including operations, maintenance and renewal of existing assets over the 10 year planning period is $22,734,650 or $2,273,465 per year. Council’s estimated available funding for this period is $23,006,500 or $2,300,650 thousand per year which is 100% of the cost to provide the service. The budget is balanced meaning services can be provided at existing levels.
The gap between available funding and requisite expenditure is due largely to several years of prior inadequate replacement funding leading to a considerable percentage of the Fleet exceeding the duration of its useful life.
1.4. What we will do
Council plans to provide existing services through Plant and Fleet assets. This will require sustainable management of:
Operation, maintenance, renewal and upgrade of Heavy Plant, Light Plant, Light Vehicles, Small Plant and miscellaneous equipment to meet service
$0
$500,000
$1,000,000
$1,500,000
$2,000,000
$2,500,000
20
13
20
14
20
15
20
16
20
17
20
18
20
19
20
20
20
21
20
22
Required Funding
Budget
Tenterfield Shire Council – Fleet Asset Management Plan
vii | P a g e
levels within the limitations set by council in annual budgets.
Disposal of underutilised fleet items and the inclusion of alternate fleet items required within the next 10 year planning period with the asset management plan being adjusted as required to account for these items.
1.5. What we cannot do
Council does not have enough funding to provide all services at the desired service levels without disposal of some minor, non-key items or to provide new services. Services that cannot be provided under present funding levels are:
Replacement of non-key fleet assets at their optimal age.
Acquire additional plant or equipment unless there is a demonstrated efficiency gain.
1.6. Managing the risks
There are risks associated with providing the service and not being able to complete all identified activities and projects. We have identified major risks as:
Rising costs of fuel and increasing purchase prices for new assets.
Increasing community expectations for road and services networks.
Decrease in the value of the existing fleet due to age and damage.
We will endeavour to manage these risks within the available funding by:
Managing and maintaining the existing plant and equipment.
Monitoring the efficiency and suitability of the existing plant and equipment to ensure items are replaced at the optimal time.
Monitoring the demand, utilistion, and sutability of the existing plant to deliver the required service levels sustainably.
1.7. The next steps
The actions resulting from this asset management plan are:
Identify options for additional funding including state and federal infrastructure grants, and special rates variations.
Improve the quality of renewal and maintenance prioritisation through updates to condition rating systems.
Monitor the provision of Plant and Equipment alongside the community expectations for roads and services.
Monitor utilisation and adjust internal hire rates to maintain the sustainability of existing services.
1.8. Questions you may have
What is this plan about?
This asset management plan covers the Tenterfield Shire Council Plant and Equipment. These assets include heavy road maintenance plant, trucks, trailers, light transport vehicles, generators and minor plant equipment.
What is an Asset Management Plan?
Asset management planning is a comprehensive process to ensure delivery of services from Council’s fleet is provided in a financially sustainable manner.
An asset management plan details information about fleet assets including actions required to provide an agreed level of service in the most cost effective manner. The Plan defines the services to be provided, how the services are provided and what funds are required to provide the services.
Why may there be a funding shortfall?
Most of the Council’s transport network was constructed from government grants, or by other government organizations such as the NSW Department of Works which were often provided and accepted without consideration of ongoing operations, maintenance and replacement needs. Recent budgets have not considered the pending need to renew assets including fleet, and have instead relied on continuous repairs.
Many of these assets are approaching the later years of their life and require replacement. The useful life of the assets is decreasing and maintenance costs are increasing.
Councils’ present funding levels are sufficient to continue to provide existing services at current levels in the medium or long term, however there are significant risks that must be effectively managed.
Tenterfield Shire Council – Fleet Asset Management Plan
viii | P a g e
What options do we have?
Resolving the funding shortfall involves several steps:
1. Improving asset knowledge so that data accurately records the asset inventory, how assets are performing and when assets are not able to provide the required service levels,
2. Improving our efficiency in operating, maintaining, replacing existing and new assets to optimise life cycle costs,
3. Identifying and managing risks associated with providing services from an aging fleet,
4. Making trade-offs between service levels and costs to ensure that the community receives the best return from infrastructure,
5. Identifying assets surplus to needs for disposal to make savings in future operations and maintenance costs
6. Consulting with the community to ensure that fleet services and costs meet community needs and are affordable,
7. Developing partnership with other bodies, where available to provide services;
8. Seeking additional funding from governments and other bodies to better reflect a ‘whole of government’ funding approach to infrastructure services.
What happens if we have a shortfall?
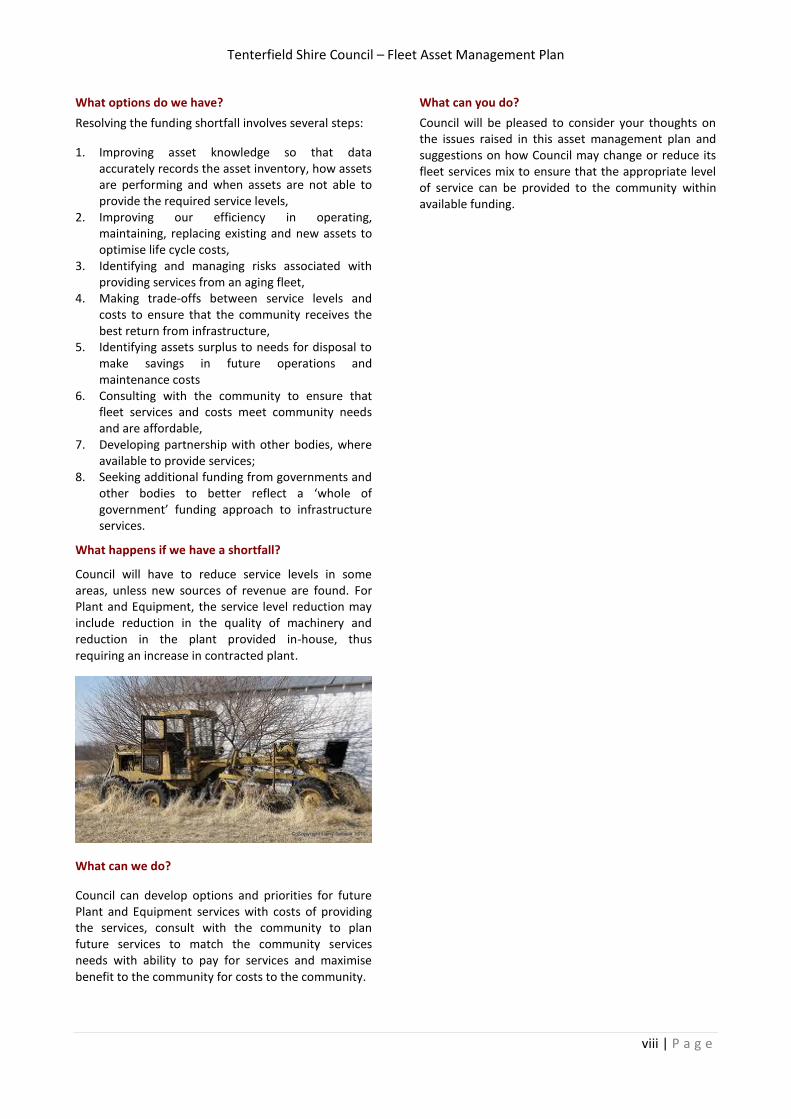
Council will have to reduce service levels in some areas, unless new sources of revenue are found. For Plant and Equipment, the service level reduction may include reduction in the quality of machinery and reduction in the plant provided in-house, thus requiring an increase in contracted plant.
What can we do?
Council can develop options and priorities for future Plant and Equipment services with costs of providing the services, consult with the community to plan future services to match the community services needs with ability to pay for services and maximise benefit to the community for costs to the community.
What can you do?
Council will be pleased to consider your thoughts on the issues raised in this asset management plan and suggestions on how Council may change or reduce its fleet services mix to ensure that the appropriate level of service can be provided to the community within available funding.
Tenterfield Shire Council – Fleet Asset Management Plan
1 | P a g e
2. Introduction
2.1. Background
This asset management plan demonstrates responsive management of assets (and services provided from assets), compliance with regulatory requirements, and communicates funding levels needed to provide the required levels of service.
The asset management plan is to be read with Council’s Asset Management Policy and the following associated planning documents:
Road Network Management Plan
Community Strategic Plan
Local Environment Plan
Operational Plan
Workforce Management Plan
Annual Report
MapInfo Spatial Asset Register
Other Asset Management Plans
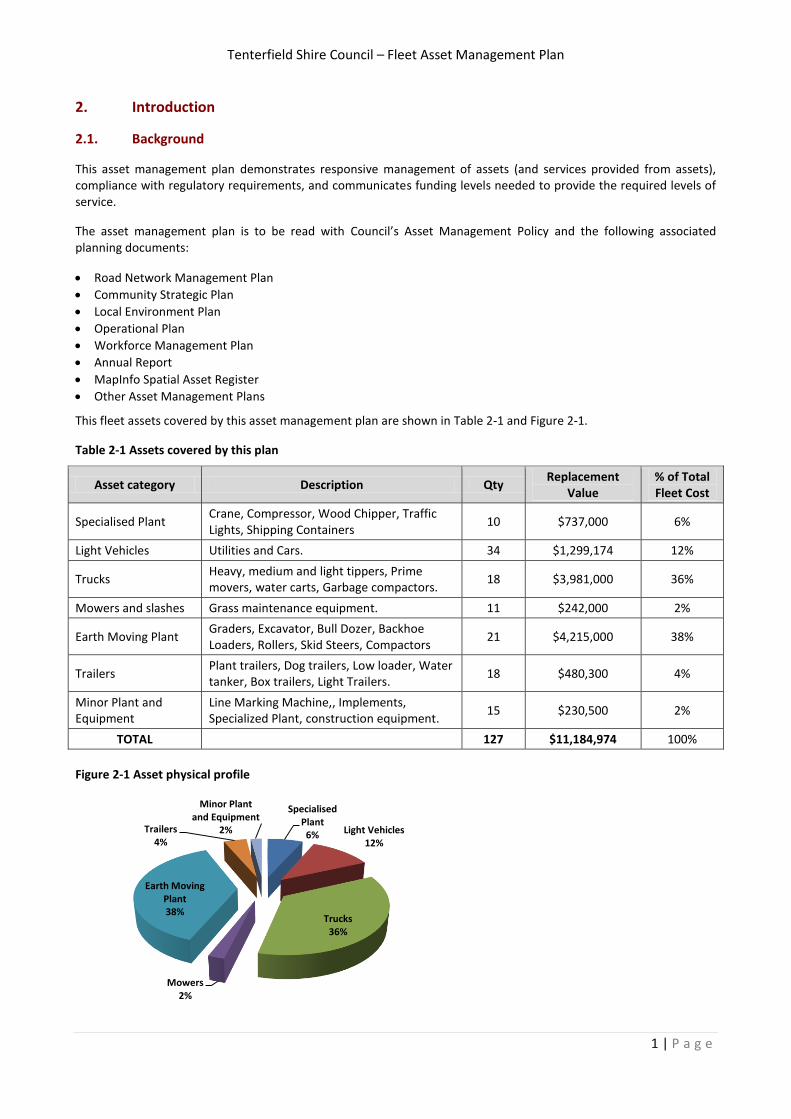
This fleet assets covered by this asset management plan are shown in Table 2-1 and Figure 2-1.
Table 2-1 Assets covered by this plan
Asset category Description Qty Replacement
Value % of Total Fleet Cost
Specialised Plant Crane, Compressor, Wood Chipper, Traffic Lights, Shipping Containers
10 $737,000 6%
Light Vehicles Utilities and Cars. 34 $1,299,174 12%
Trucks Heavy, medium and light tippers, Prime movers, water carts, Garbage compactors.
18 $3,981,000 36%
Mowers and slashes Grass maintenance equipment. 11 $242,000 2%
Earth Moving Plant Graders, Excavator, Bull Dozer, Backhoe Loaders, Rollers, Skid Steers, Compactors
21 $4,215,000 38%
Trailers Plant trailers, Dog trailers, Low loader, Water tanker, Box trailers, Light Trailers.
18 $480,300 4%
Minor Plant and Equipment
Line Marking Machine,, Implements, Specialized Plant, construction equipment.
15 $230,500 2%
TOTAL 127 $11,184,974 100%
Figure 2-1 Asset physical profile
Specialised Plant6% Light Vehicles
12%
Trucks36%
Mowers2%
Earth Moving Plant38%
Trailers4%
Minor Plant and Equipment
2%
Tenterfield Shire Council – Fleet Asset Management Plan
2 | P a g e
2.2. Goals and objectives of asset management
Council’s primary objective is to provide services to its community. Many of these services are provided by infrastructure assets. Council has acquired infrastructure assets from other government bodies (i.e. NSW Department of Works), by ‘purchase’, by contract, construction by council staff and by donation of assets constructed by developers and others to meet increased levels of service.
Council’s goal in managing infrastructure assets is to meet the community’s desired level of service in the most cost effective manner for present and future consumers. The key elements of infrastructure asset management are:
Taking a life cycle approach,
Developing cost-effective management strategies for the long term,
Providing a defined level of service and monitoring performance,
Understanding and meeting the demands of growth through demand management and infrastructure investment,
Managing risks associated with asset failures,
Sustainable use of physical resources,
Continuous improvement in asset management practices.
The goal of this asset management plan is to:
Document the services/service levels to be provided and the costs of providing the service,
Communicate the consequences for service levels and risk, where desired funding is not available, and
Provide information to assist decision makers in trading off service levels, costs and risks to provide services in a financially sustainable manner.
This asset management plan is prepared under the direction of Council’s vision, mission, goals and objectives.
Council’s mission is:
Quality Nature, Quality Heritage, Quality Lifestyle
Council’s vision is:
To establish a shire where the environment will be protected and enhanced to ensure sustainability and inter-generational equity,
To recognise and actively develop our cultural strengths and unique heritage,
To establish a prosperous shire through balanced, sustainable economic growth managed in a way to create quality lifestyles and satisfy the employment, environmental and social aims of the community,
To establish a community spirit which encourages a quality lifestyle, supports health and social well-being, promotes family life and lifestyle choices,
To establish a community spirit which promotes opportunities to participate in sport and recreation, promotes equal access to all services and facilities, and
To encourage all people to participate in the economic and social life of the community with a supportive attitude towards equal life chances and equal opportunity for access to the Shire’s resources.
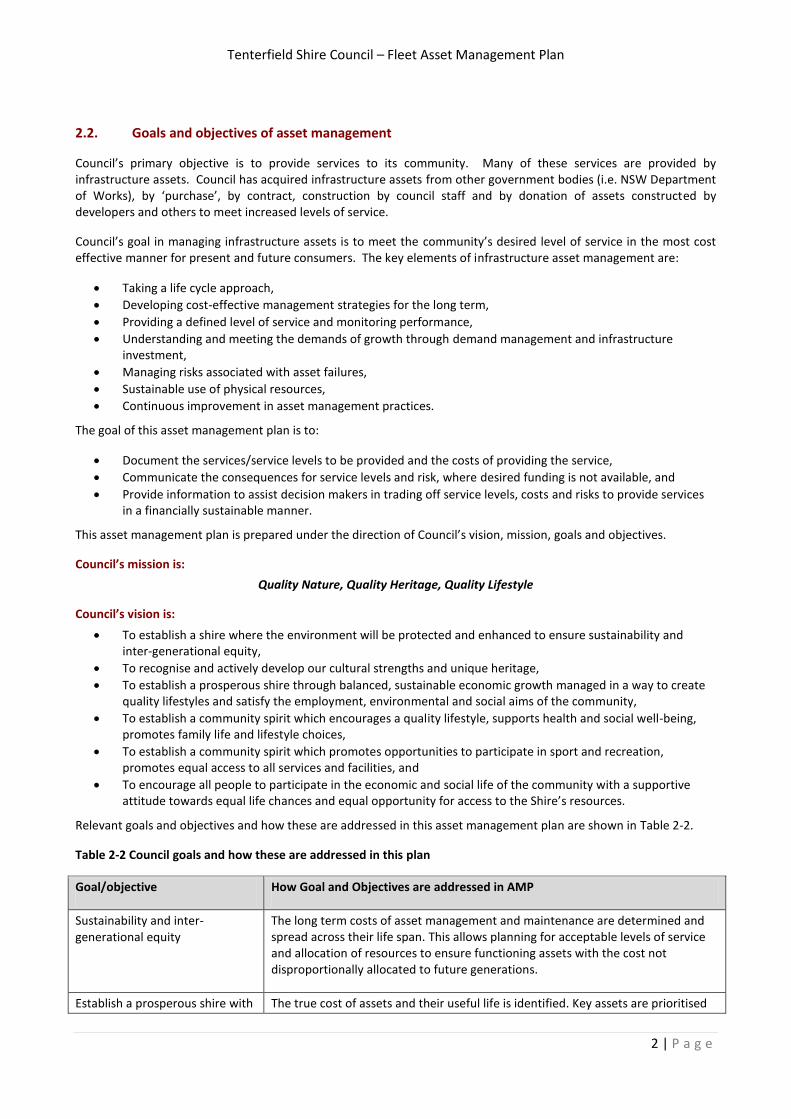
Relevant goals and objectives and how these are addressed in this asset management plan are shown in Table 2-2.
Table 2-2 Council goals and how these are addressed in this plan
Goal/objective How Goal and Objectives are addressed in AMP
Sustainability and inter-generational equity
The long term costs of asset management and maintenance are determined and spread across their life span. This allows planning for acceptable levels of service and allocation of resources to ensure functioning assets with the cost not disproportionally allocated to future generations.
Establish a prosperous shire with The true cost of assets and their useful life is identified. Key assets are prioritised
Tenterfield Shire Council – Fleet Asset Management Plan
3 | P a g e
Goal/objective How Goal and Objectives are addressed in AMP
quality lifestyle and economic development
and realistic levels of service established.
Equal access to recreation, services and facilities
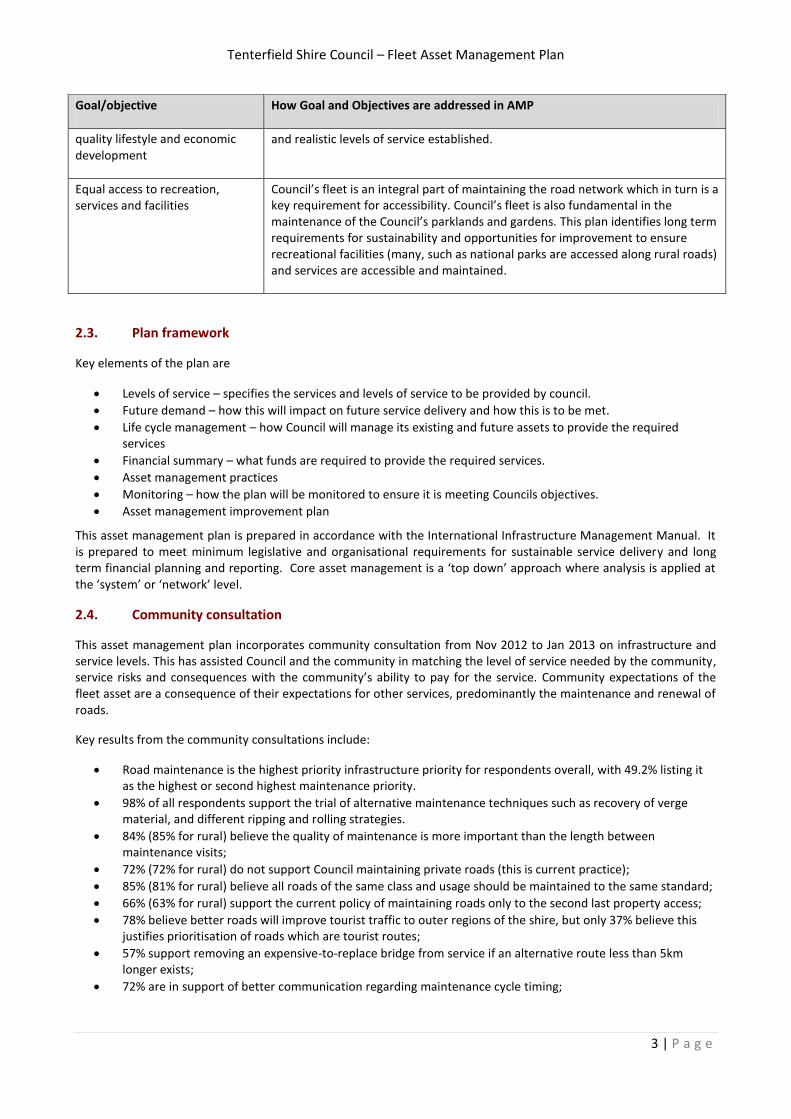
Council’s fleet is an integral part of maintaining the road network which in turn is a key requirement for accessibility. Council’s fleet is also fundamental in the maintenance of the Council’s parklands and gardens. This plan identifies long term requirements for sustainability and opportunities for improvement to ensure recreational facilities (many, such as national parks are accessed along rural roads) and services are accessible and maintained.
2.3. Plan framework
Key elements of the plan are
Levels of service – specifies the services and levels of service to be provided by council.
Future demand – how this will impact on future service delivery and how this is to be met.
Life cycle management – how Council will manage its existing and future assets to provide the required services
Financial summary – what funds are required to provide the required services.
Asset management practices
Monitoring – how the plan will be monitored to ensure it is meeting Councils objectives.
Asset management improvement plan
This asset management plan is prepared in accordance with the International Infrastructure Management Manual. It is prepared to meet minimum legislative and organisational requirements for sustainable service delivery and long term financial planning and reporting. Core asset management is a ‘top down’ approach where analysis is applied at the ‘system’ or ‘network’ level.
2.4. Community consultation
This asset management plan incorporates community consultation from Nov 2012 to Jan 2013 on infrastructure and service levels. This has assisted Council and the community in matching the level of service needed by the community, service risks and consequences with the community’s ability to pay for the service. Community expectations of the fleet asset are a consequence of their expectations for other services, predominantly the maintenance and renewal of roads.
Key results from the community consultations include:
Road maintenance is the highest priority infrastructure priority for respondents overall, with 49.2% listing it as the highest or second highest maintenance priority.
98% of all respondents support the trial of alternative maintenance techniques such as recovery of verge material, and different ripping and rolling strategies.
84% (85% for rural) believe the quality of maintenance is more important than the length between maintenance visits;
72% (72% for rural) do not support Council maintaining private roads (this is current practice);
85% (81% for rural) believe all roads of the same class and usage should be maintained to the same standard;
66% (63% for rural) support the current policy of maintaining roads only to the second last property access;
78% believe better roads will improve tourist traffic to outer regions of the shire, but only 37% believe this justifies prioritisation of roads which are tourist routes;
57% support removing an expensive-to-replace bridge from service if an alternative route less than 5km longer exists;
72% are in support of better communication regarding maintenance cycle timing;
Tenterfield Shire Council – Fleet Asset Management Plan
4 | P a g e
3. Levels of service
3.1. Customer Research and Expectations
Council completed a “road show” presenting the challenges facing the Tenterfield Shire in maintaining and improving assets in Nov/Dec 2012. As part of this process, and through subsequent surveys mailed to every Tenterfield Shire Resident (also online), the service expectations and level of understanding regarding asset management were determined.
3.2. Legislative Requirements
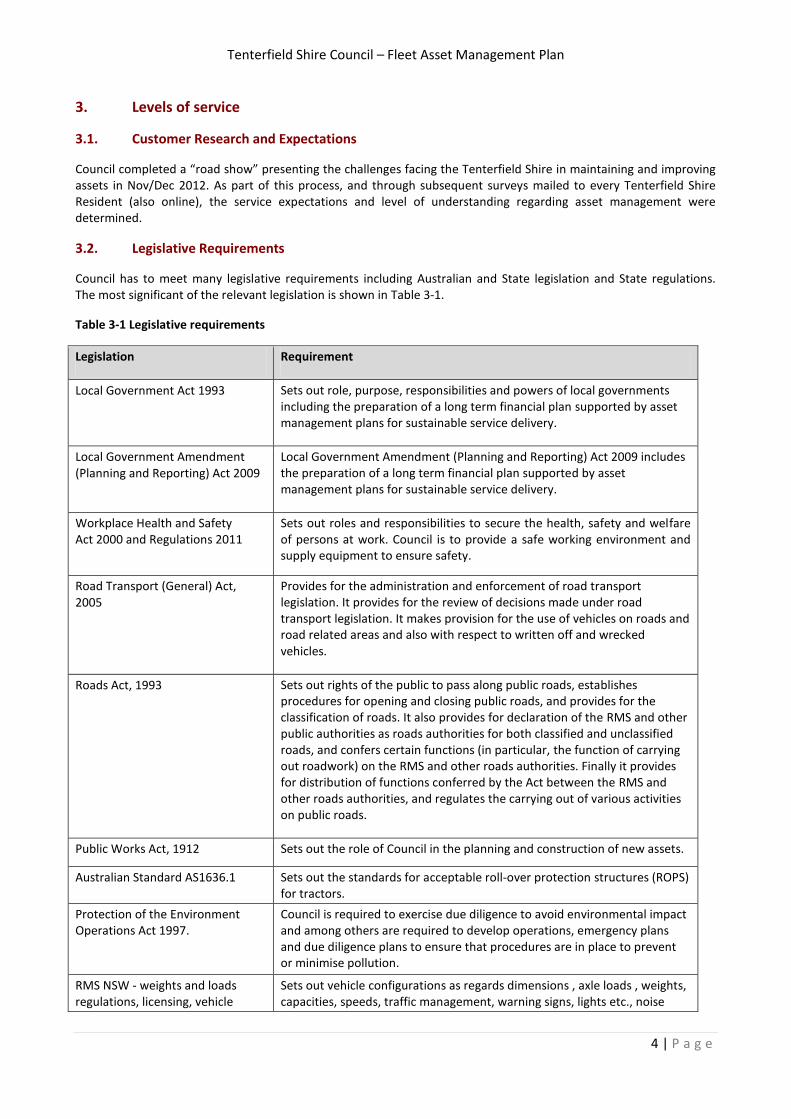
Council has to meet many legislative requirements including Australian and State legislation and State regulations. The most significant of the relevant legislation is shown in Table 3-1.
Table 3-1 Legislative requirements
Legislation Requirement
Local Government Act 1993 Sets out role, purpose, responsibilities and powers of local governments including the preparation of a long term financial plan supported by asset management plans for sustainable service delivery.
Local Government Amendment (Planning and Reporting) Act 2009
Local Government Amendment (Planning and Reporting) Act 2009 includes the preparation of a long term financial plan supported by asset management plans for sustainable service delivery.
Workplace Health and Safety Act 2000 and Regulations 2011
Sets out roles and responsibilities to secure the health, safety and welfare of persons at work. Council is to provide a safe working environment and supply equipment to ensure safety.
Road Transport (General) Act, 2005
Provides for the administration and enforcement of road transport legislation. It provides for the review of decisions made under road transport legislation. It makes provision for the use of vehicles on roads and road related areas and also with respect to written off and wrecked vehicles.
Roads Act, 1993 Sets out rights of the public to pass along public roads, establishes procedures for opening and closing public roads, and provides for the classification of roads. It also provides for declaration of the RMS and other public authorities as roads authorities for both classified and unclassified roads, and confers certain functions (in particular, the function of carrying out roadwork) on the RMS and other roads authorities. Finally it provides for distribution of functions conferred by the Act between the RMS and other roads authorities, and regulates the carrying out of various activities on public roads.
Public Works Act, 1912 Sets out the role of Council in the planning and construction of new assets.
Australian Standard AS1636.1 Sets out the standards for acceptable roll-over protection structures (ROPS) for tractors.
Protection of the Environment Operations Act 1997.
Council is required to exercise due diligence to avoid environmental impact and among others are required to develop operations, emergency plans and due diligence plans to ensure that procedures are in place to prevent or minimise pollution.
RMS NSW - weights and loads regulations, licensing, vehicle
Sets out vehicle configurations as regards dimensions , axle loads , weights, capacities, speeds, traffic management, warning signs, lights etc., noise
Tenterfield Shire Council – Fleet Asset Management Plan
5 | P a g e
inspections, registration, safety and compliance, Road traffic act , Highways act, NSW Motor Traffic Act 1909 No. 5,Roads and Maritime Services QA Specification G22
emissions, chemical emissions, minimum safety standards, licensing requirements, conditional registration, registration – including requirements etc.
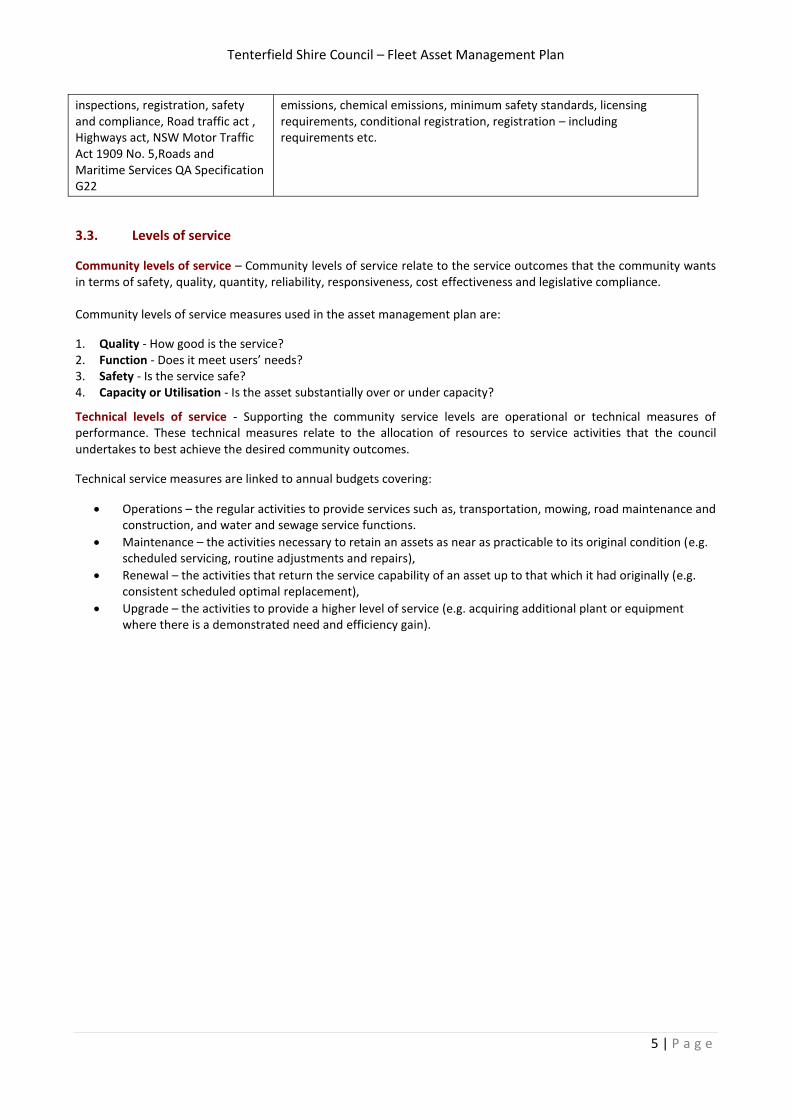
3.3. Levels of service
Community levels of service – Community levels of service relate to the service outcomes that the community wants in terms of safety, quality, quantity, reliability, responsiveness, cost effectiveness and legislative compliance.
Community levels of service measures used in the asset management plan are:
1. Quality - How good is the service? 2. Function - Does it meet users’ needs? 3. Safety - Is the service safe? 4. Capacity or Utilisation - Is the asset substantially over or under capacity?
Technical levels of service - Supporting the community service levels are operational or technical measures of performance. These technical measures relate to the allocation of resources to service activities that the council undertakes to best achieve the desired community outcomes.
Technical service measures are linked to annual budgets covering:
Operations – the regular activities to provide services such as, transportation, mowing, road maintenance and construction, and water and sewage service functions.
Maintenance – the activities necessary to retain an assets as near as practicable to its original condition (e.g. scheduled servicing, routine adjustments and repairs),
Renewal – the activities that return the service capability of an asset up to that which it had originally (e.g. consistent scheduled optimal replacement),
Upgrade – the activities to provide a higher level of service (e.g. acquiring additional plant or equipment where there is a demonstrated need and efficiency gain).
Tenterfield Shire Council – Fleet Asset Management Plan
6 | P a g e
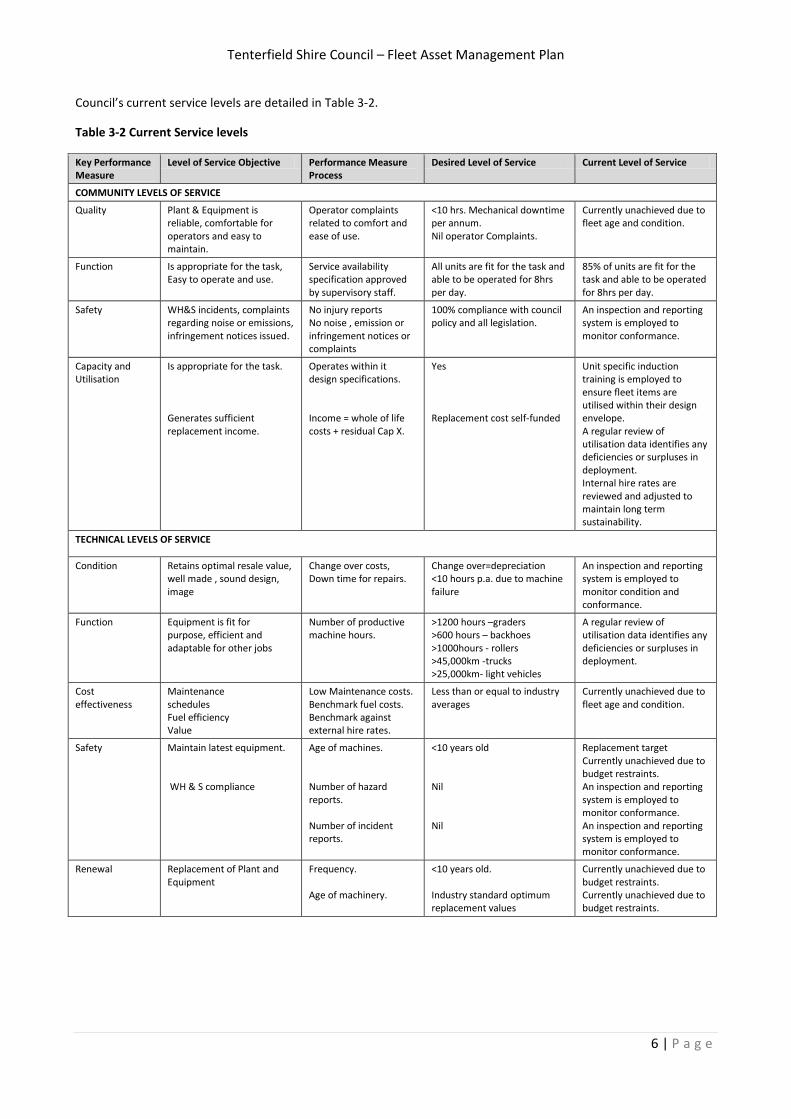
Council’s current service levels are detailed in Table 3-2.
Table 3-2 Current Service levels
Key Performance Measure
Level of Service Objective Performance Measure Process
Desired Level of Service Current Level of Service
COMMUNITY LEVELS OF SERVICE
Quality Plant & Equipment is reliable, comfortable for operators and easy to maintain.
Operator complaints related to comfort and ease of use.
<10 hrs. Mechanical downtime per annum. Nil operator Complaints.
Currently unachieved due to fleet age and condition.
Function Is appropriate for the task, Easy to operate and use.
Service availability specification approved by supervisory staff.
All units are fit for the task and able to be operated for 8hrs per day.
85% of units are fit for the task and able to be operated for 8hrs per day.
Safety WH&S incidents, complaints regarding noise or emissions, infringement notices issued.
No injury reports No noise , emission or infringement notices or complaints
100% compliance with council policy and all legislation.
An inspection and reporting system is employed to monitor conformance.
Capacity and Utilisation
Is appropriate for the task. Generates sufficient replacement income.
Operates within it design specifications. Income = whole of life costs + residual Cap X.
Yes Replacement cost self-funded
Unit specific induction training is employed to ensure fleet items are utilised within their design envelope. A regular review of utilisation data identifies any deficiencies or surpluses in deployment. Internal hire rates are reviewed and adjusted to maintain long term sustainability.
TECHNICAL LEVELS OF SERVICE
Condition Retains optimal resale value, well made , sound design, image
Change over costs, Down time for repairs.
Change over=depreciation <10 hours p.a. due to machine failure
An inspection and reporting system is employed to monitor condition and conformance.
Function Equipment is fit for purpose, efficient and adaptable for other jobs
Number of productive machine hours.
>1200 hours –graders >600 hours – backhoes >1000hours - rollers >45,000km -trucks >25,000km- light vehicles
A regular review of utilisation data identifies any deficiencies or surpluses in deployment.
Cost effectiveness
Maintenance schedules Fuel efficiency Value
Low Maintenance costs. Benchmark fuel costs. Benchmark against external hire rates.
Less than or equal to industry averages
Currently unachieved due to fleet age and condition.
Safety Maintain latest equipment. WH & S compliance
Age of machines. Number of hazard reports. Number of incident reports.
<10 years old Nil Nil
Replacement target Currently unachieved due to budget restraints. An inspection and reporting system is employed to monitor conformance. An inspection and reporting system is employed to monitor conformance.
Renewal Replacement of Plant and Equipment
Frequency. Age of machinery.
<10 years old. Industry standard optimum replacement values
Currently unachieved due to budget restraints. Currently unachieved due to budget restraints.
Tenterfield Shire Council – Fleet Asset Management Plan
7 | P a g e
4. Future Demand
4.1. Demand forecast
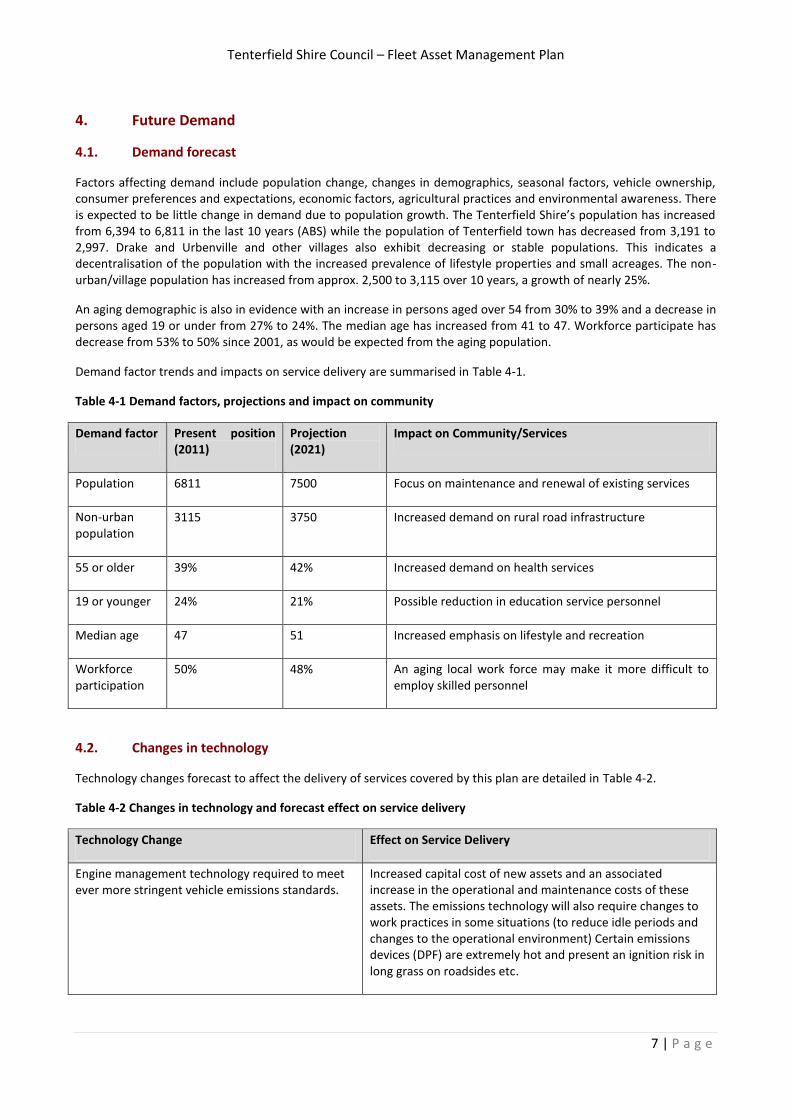
Factors affecting demand include population change, changes in demographics, seasonal factors, vehicle ownership, consumer preferences and expectations, economic factors, agricultural practices and environmental awareness. There is expected to be little change in demand due to population growth. The Tenterfield Shire’s population has increased from 6,394 to 6,811 in the last 10 years (ABS) while the population of Tenterfield town has decreased from 3,191 to 2,997. Drake and Urbenville and other villages also exhibit decreasing or stable populations. This indicates a decentralisation of the population with the increased prevalence of lifestyle properties and small acreages. The non-urban/village population has increased from approx. 2,500 to 3,115 over 10 years, a growth of nearly 25%.
An aging demographic is also in evidence with an increase in persons aged over 54 from 30% to 39% and a decrease in persons aged 19 or under from 27% to 24%. The median age has increased from 41 to 47. Workforce participate has decrease from 53% to 50% since 2001, as would be expected from the aging population.
Demand factor trends and impacts on service delivery are summarised in Table 4-1.
Table 4-1 Demand factors, projections and impact on community
Demand factor Present position (2011)
Projection (2021)
Impact on Community/Services
Population 6811 7500 Focus on maintenance and renewal of existing services
Non-urban population
3115 3750 Increased demand on rural road infrastructure
55 or older 39% 42% Increased demand on health services
19 or younger 24% 21% Possible reduction in education service personnel
Median age 47 51 Increased emphasis on lifestyle and recreation
Workforce participation
50% 48% An aging local work force may make it more difficult to employ skilled personnel
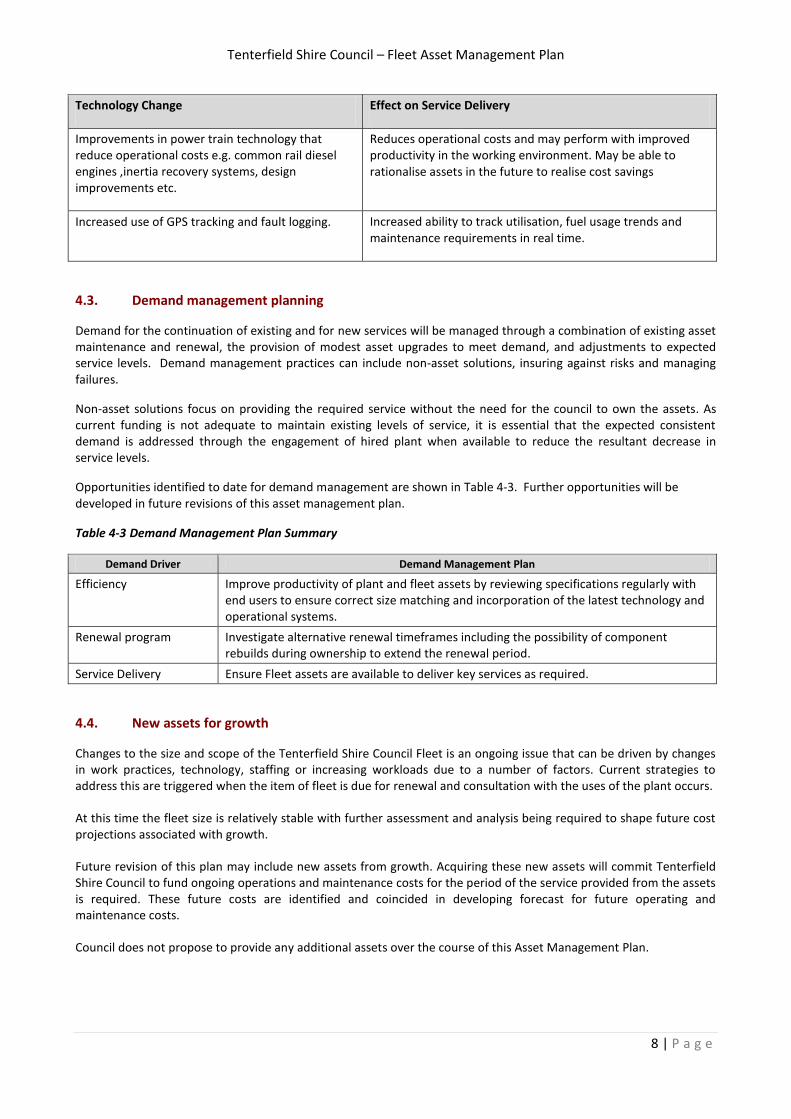
4.2. Changes in technology
Technology changes forecast to affect the delivery of services covered by this plan are detailed in Table 4-2.
Table 4-2 Changes in technology and forecast effect on service delivery
Technology Change Effect on Service Delivery
Engine management technology required to meet ever more stringent vehicle emissions standards.
Increased capital cost of new assets and an associated increase in the operational and maintenance costs of these assets. The emissions technology will also require changes to work practices in some situations (to reduce idle periods and changes to the operational environment) Certain emissions devices (DPF) are extremely hot and present an ignition risk in long grass on roadsides etc.
Tenterfield Shire Council – Fleet Asset Management Plan
8 | P a g e
Technology Change Effect on Service Delivery
Improvements in power train technology that reduce operational costs e.g. common rail diesel engines ,inertia recovery systems, design improvements etc.
Reduces operational costs and may perform with improved productivity in the working environment. May be able to rationalise assets in the future to realise cost savings
Increased use of GPS tracking and fault logging. Increased ability to track utilisation, fuel usage trends and maintenance requirements in real time.
4.3. Demand management planning
Demand for the continuation of existing and for new services will be managed through a combination of existing asset maintenance and renewal, the provision of modest asset upgrades to meet demand, and adjustments to expected service levels. Demand management practices can include non-asset solutions, insuring against risks and managing failures.
Non-asset solutions focus on providing the required service without the need for the council to own the assets. As current funding is not adequate to maintain existing levels of service, it is essential that the expected consistent demand is addressed through the engagement of hired plant when available to reduce the resultant decrease in service levels.
Opportunities identified to date for demand management are shown in Table 4-3. Further opportunities will be developed in future revisions of this asset management plan.
Table 4-3 Demand Management Plan Summary
Demand Driver Demand Management Plan
Efficiency Improve productivity of plant and fleet assets by reviewing specifications regularly with end users to ensure correct size matching and incorporation of the latest technology and operational systems.
Renewal program Investigate alternative renewal timeframes including the possibility of component rebuilds during ownership to extend the renewal period.
Service Delivery Ensure Fleet assets are available to deliver key services as required.
4.4. New assets for growth
Changes to the size and scope of the Tenterfield Shire Council Fleet is an ongoing issue that can be driven by changes in work practices, technology, staffing or increasing workloads due to a number of factors. Current strategies to address this are triggered when the item of fleet is due for renewal and consultation with the uses of the plant occurs.
At this time the fleet size is relatively stable with further assessment and analysis being required to shape future cost projections associated with growth.
Future revision of this plan may include new assets from growth. Acquiring these new assets will commit Tenterfield Shire Council to fund ongoing operations and maintenance costs for the period of the service provided from the assets is required. These future costs are identified and coincided in developing forecast for future operating and maintenance costs.
Council does not propose to provide any additional assets over the course of this Asset Management Plan.
Tenterfield Shire Council – Fleet Asset Management Plan
9 | P a g e
5. Lifecycle management plan
The lifecycle management plan details how Council plans to manage and operate the assets at the agreed levels of service (defined in Section 3) while optimising life cycle costs.
5.1. Background data
5.1.1. Physical parameters
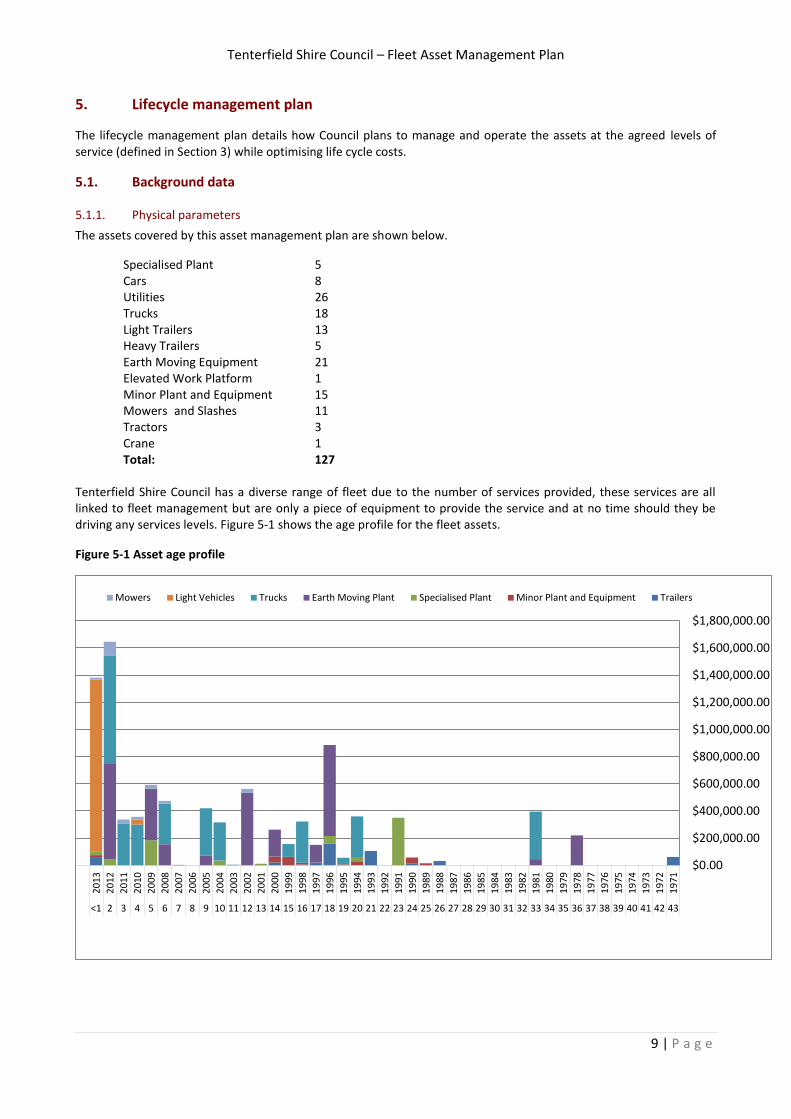
The assets covered by this asset management plan are shown below.
Specialised Plant 5 Cars 8 Utilities 26 Trucks 18 Light Trailers 13 Heavy Trailers 5 Earth Moving Equipment 21 Elevated Work Platform 1 Minor Plant and Equipment 15 Mowers and Slashes 11 Tractors 3 Crane 1 Total: 127
Tenterfield Shire Council has a diverse range of fleet due to the number of services provided, these services are all linked to fleet management but are only a piece of equipment to provide the service and at no time should they be driving any services levels. Figure 5-1 shows the age profile for the fleet assets.
Figure 5-1 Asset age profile
$0.00
$200,000.00
$400,000.00
$600,000.00
$800,000.00
$1,000,000.00
$1,200,000.00
$1,400,000.00
$1,600,000.00
$1,800,000.00
19
71
19
72
19
73
19
74
19
75
19
76
19
77
19
78
19
79
19
80
19
81
19
82
19
83
19
84
19
85
19
86
19
87
19
88
19
89
19
90
19
91
19
92
19
93
19
94
19
95
19
96
19
97
19
98
19
99
20
00
20
01
20
02
20
03
20
04
20
05
20
06
20
07
20
08
20
09
20
10
20
11
20
12
20
13
4342414039383736353433323130292827262524232221201918171615141312111098765432<1
Mowers Light Vehicles Trucks Earth Moving Plant Specialised Plant Minor Plant and Equipment Trailers
Tenterfield Shire Council – Fleet Asset Management Plan
10 | P a g e
5.1.2. Asset capacity and performance
Council’s services are generally provided to meet design standards where these are available and when available funding allows.
Locations where deficiencies in service performance are known are detailed below;
Operator Damage Operator damage to fleet equipment which has a significant effect on scheduled maintenance, recourses and availability of equipment which effect service delivery and customer satisfaction.
Utilisation Underutilised equipment that is the result of staffing, seasonal weather and communication across departments.
Downtime Consistent mechanical failures due to fleet age and condition.
Maintenance Excessive maintenance cost due to fleet age and condition.
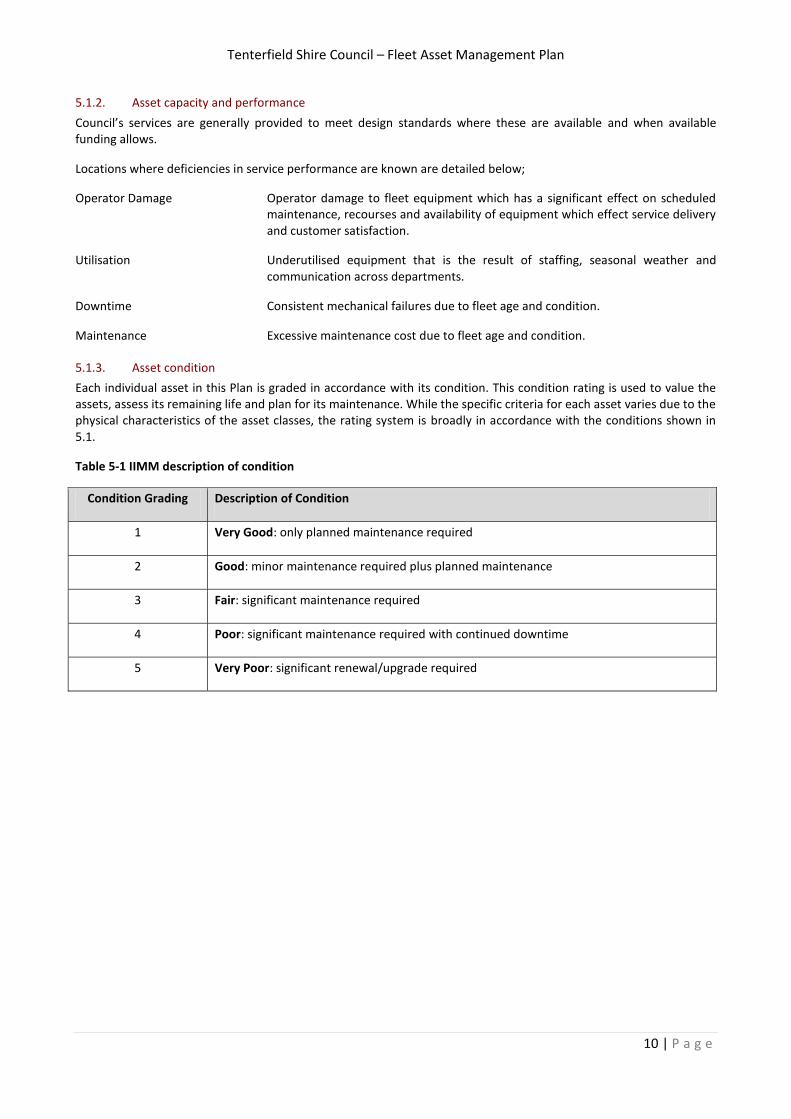
5.1.3. Asset condition
Each individual asset in this Plan is graded in accordance with its condition. This condition rating is used to value the assets, assess its remaining life and plan for its maintenance. While the specific criteria for each asset varies due to the physical characteristics of the asset classes, the rating system is broadly in accordance with the conditions shown in 5.1.
Table 5-1 IIMM description of condition
Condition Grading Description of Condition
1 Very Good: only planned maintenance required
2 Good: minor maintenance required plus planned maintenance
3 Fair: significant maintenance required
4 Poor: significant maintenance required with continued downtime
5 Very Poor: significant renewal/upgrade required
Tenterfield Shire Council – Fleet Asset Management Plan
11 | P a g e
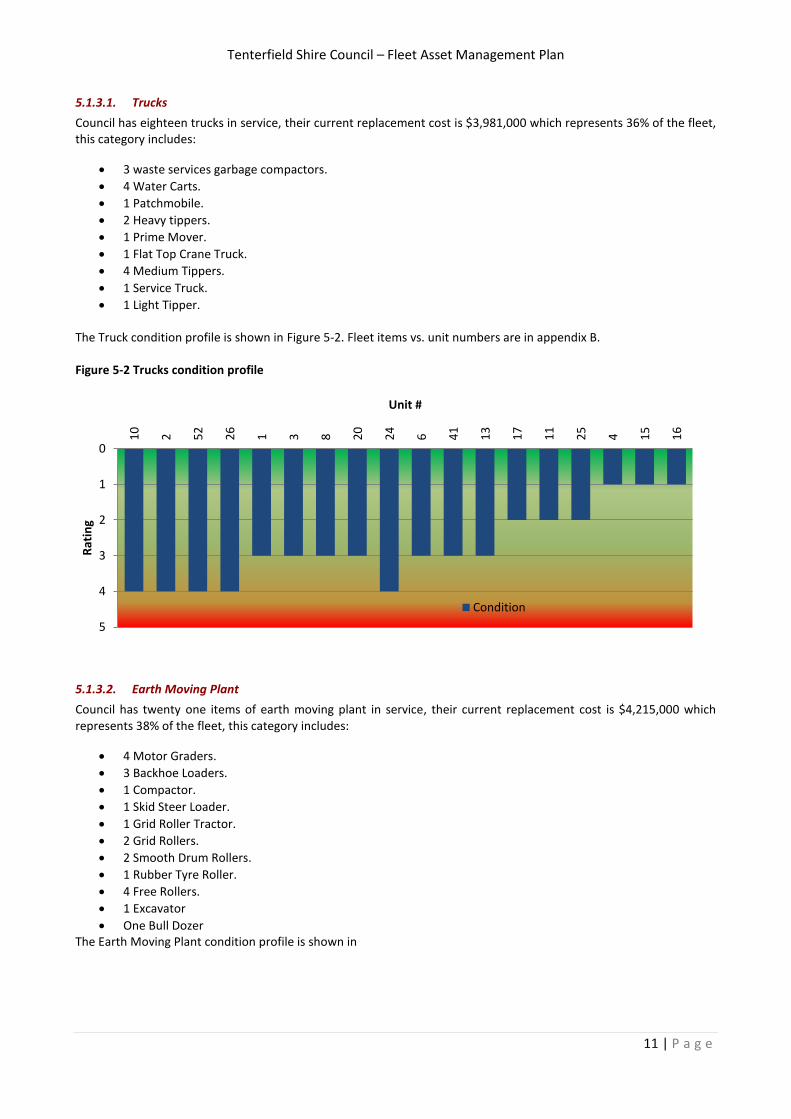
5.1.3.1. Trucks
Council has eighteen trucks in service, their current replacement cost is $3,981,000 which represents 36% of the fleet, this category includes:
3 waste services garbage compactors.
4 Water Carts.
1 Patchmobile.
2 Heavy tippers.
1 Prime Mover.
1 Flat Top Crane Truck.
4 Medium Tippers.
1 Service Truck.
1 Light Tipper. The Truck condition profile is shown in Figure 5-2. Fleet items vs. unit numbers are in appendix B.
Figure 5-2 Trucks condition profile
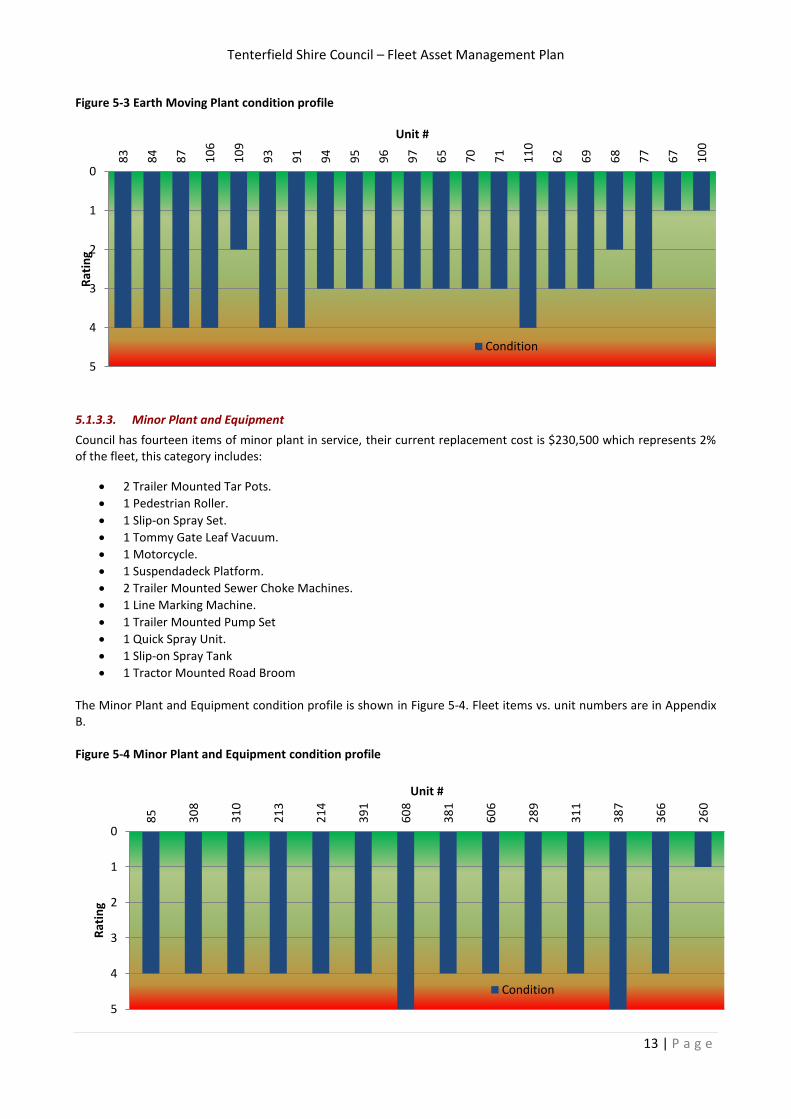
5.1.3.2. Earth Moving Plant
Council has twenty one items of earth moving plant in service, their current replacement cost is $4,215,000 which represents 38% of the fleet, this category includes:
4 Motor Graders.
3 Backhoe Loaders.
1 Compactor.
1 Skid Steer Loader.
1 Grid Roller Tractor.
2 Grid Rollers.
2 Smooth Drum Rollers.
1 Rubber Tyre Roller.
4 Free Rollers.
1 Excavator
One Bull Dozer The Earth Moving Plant condition profile is shown in
0
1
2
3
4
5
10
2 52
26
1 3 8 20
24
6 41
13
17
11
25
4 15
16
Rat
ing
Unit #
Condition
Tenterfield Shire Council – Fleet Asset Management Plan
12 | P a g e
Figure 5-3. Fleet items vs. unit numbers are in appendix B.
Tenterfield Shire Council – Fleet Asset Management Plan
13 | P a g e
Figure 5-3 Earth Moving Plant condition profile
5.1.3.3. Minor Plant and Equipment
Council has fourteen items of minor plant in service, their current replacement cost is $230,500 which represents 2% of the fleet, this category includes:
2 Trailer Mounted Tar Pots.
1 Pedestrian Roller.
1 Slip-on Spray Set.
1 Tommy Gate Leaf Vacuum.
1 Motorcycle.
1 Suspendadeck Platform.
2 Trailer Mounted Sewer Choke Machines.
1 Line Marking Machine.
1 Trailer Mounted Pump Set
1 Quick Spray Unit.
1 Slip-on Spray Tank
1 Tractor Mounted Road Broom The Minor Plant and Equipment condition profile is shown in Figure 5-4. Fleet items vs. unit numbers are in Appendix B. Figure 5-4 Minor Plant and Equipment condition profile
0
1
2
3
4
5
83
84
87
10
6
10
9
93
91
94
95
96
97
65
70
71
11
0
62
69
68
77
67
10
0
Rat
ing
Unit #
Condition
0
1
2
3
4
5
85
30
8
31
0
21
3
21
4
39
1
60
8
38
1
60
6
28
9
31
1
38
7
36
6
26
0
Rat
ing
Unit #
Condition
Tenterfield Shire Council – Fleet Asset Management Plan
14 | P a g e
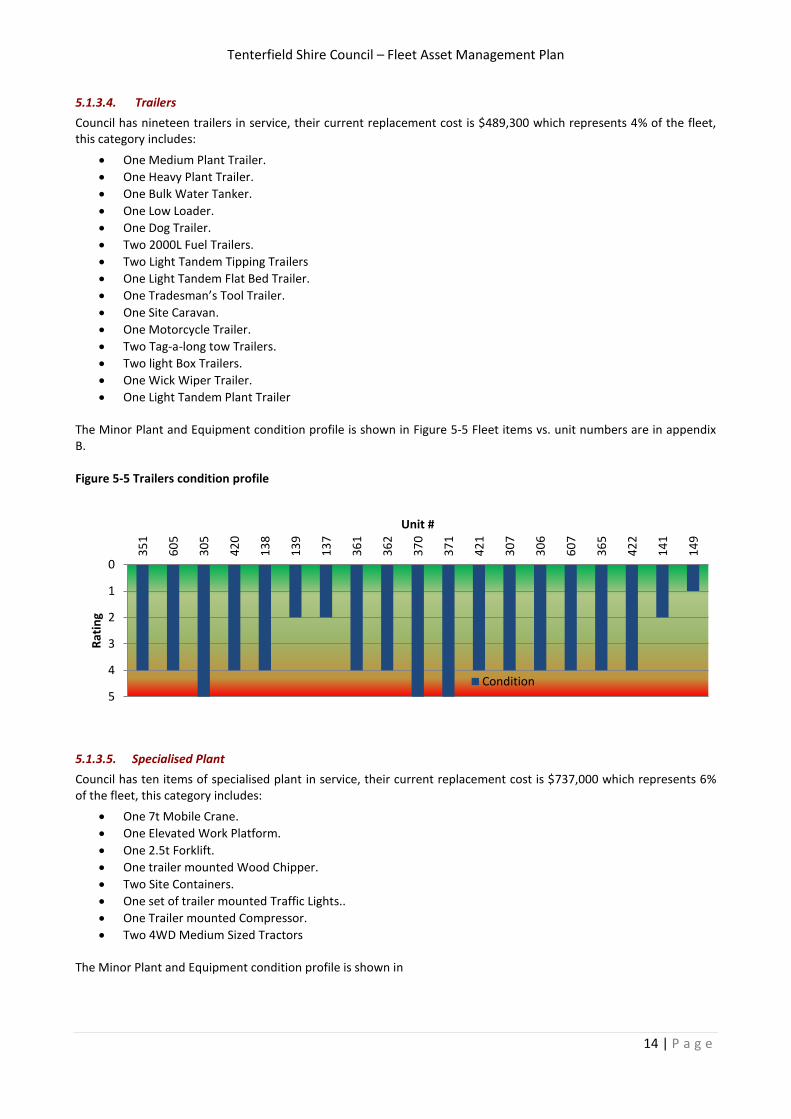
5.1.3.4. Trailers
Council has nineteen trailers in service, their current replacement cost is $489,300 which represents 4% of the fleet, this category includes:
One Medium Plant Trailer.
One Heavy Plant Trailer.
One Bulk Water Tanker.
One Low Loader.
One Dog Trailer.
Two 2000L Fuel Trailers.
Two Light Tandem Tipping Trailers
One Light Tandem Flat Bed Trailer.
One Tradesman’s Tool Trailer.
One Site Caravan.
One Motorcycle Trailer.
Two Tag-a-long tow Trailers.
Two light Box Trailers.
One Wick Wiper Trailer.
One Light Tandem Plant Trailer The Minor Plant and Equipment condition profile is shown in Figure 5-5 Fleet items vs. unit numbers are in appendix B. Figure 5-5 Trailers condition profile
5.1.3.5. Specialised Plant
Council has ten items of specialised plant in service, their current replacement cost is $737,000 which represents 6% of the fleet, this category includes:
One 7t Mobile Crane.
One Elevated Work Platform.
One 2.5t Forklift.
One trailer mounted Wood Chipper.
Two Site Containers.
One set of trailer mounted Traffic Lights..
One Trailer mounted Compressor.
Two 4WD Medium Sized Tractors The Minor Plant and Equipment condition profile is shown in
0
1
2
3
4
5
35
1
60
5
30
5
42
0
13
8
13
9
13
7
36
1
36
2
37
0
37
1
42
1
30
7
30
6
60
7
36
5
42
2
14
1
14
9
Rat
ing
Unit #
Condition
Tenterfield Shire Council – Fleet Asset Management Plan
15 | P a g e
Figure 5-6.
Tenterfield Shire Council – Fleet Asset Management Plan
16 | P a g e
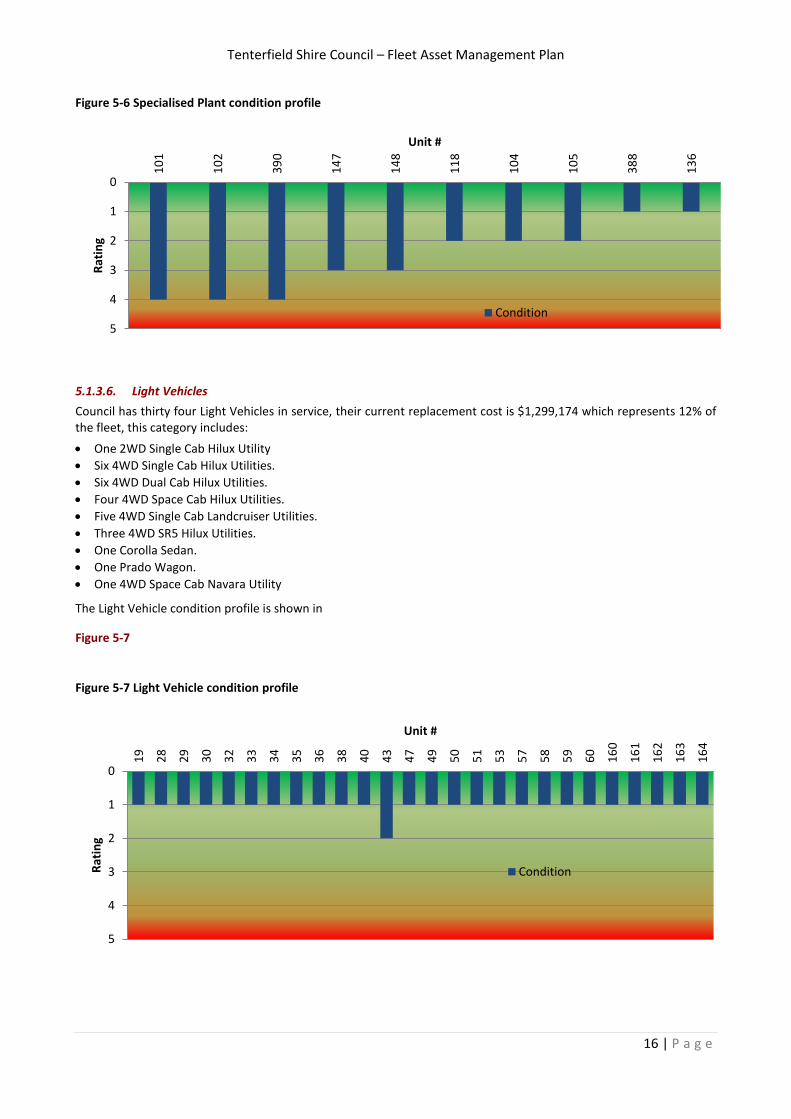
Figure 5-6 Specialised Plant condition profile
5.1.3.6. Light Vehicles
Council has thirty four Light Vehicles in service, their current replacement cost is $1,299,174 which represents 12% of the fleet, this category includes:
One 2WD Single Cab Hilux Utility
Six 4WD Single Cab Hilux Utilities.
Six 4WD Dual Cab Hilux Utilities.
Four 4WD Space Cab Hilux Utilities.
Five 4WD Single Cab Landcruiser Utilities.
Three 4WD SR5 Hilux Utilities.
One Corolla Sedan.
One Prado Wagon.
One 4WD Space Cab Navara Utility
The Light Vehicle condition profile is shown in
Figure 5-7
Figure 5-7 Light Vehicle condition profile
0
1
2
3
4
5
10
1
10
2
39
0
14
7
14
8
11
8
10
4
10
5
38
8
13
6
Rat
ing
Unit #
Condition
0
1
2
3
4
5
19
28
29
30
32
33
34
35
36
38
40
43
47
49
50
51
53
57
58
59
60
16
0
16
1
16
2
16
3
16
4
Rat
ing
Unit #
Condition
Tenterfield Shire Council – Fleet Asset Management Plan
17 | P a g e
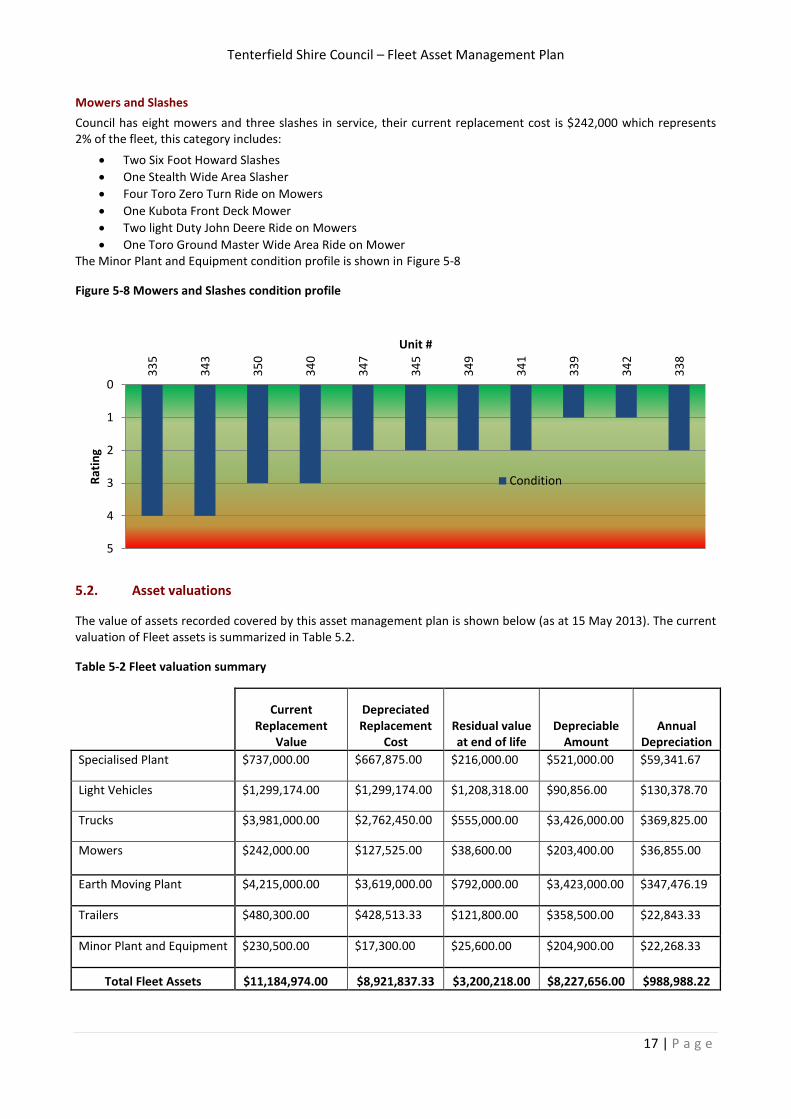
Mowers and Slashes
Council has eight mowers and three slashes in service, their current replacement cost is $242,000 which represents 2% of the fleet, this category includes:
Two Six Foot Howard Slashes
One Stealth Wide Area Slasher
Four Toro Zero Turn Ride on Mowers
One Kubota Front Deck Mower
Two light Duty John Deere Ride on Mowers
One Toro Ground Master Wide Area Ride on Mower The Minor Plant and Equipment condition profile is shown in Figure 5-8
Figure 5-8 Mowers and Slashes condition profile
5.2. Asset valuations
The value of assets recorded covered by this asset management plan is shown below (as at 15 May 2013). The current valuation of Fleet assets is summarized in Table 5.2.
Table 5-2 Fleet valuation summary
Current Replacement
Value
Depreciated Replacement
Cost Residual value at end of life
Depreciable Amount
Annual Depreciation
Specialised Plant $737,000.00 $667,875.00 $216,000.00 $521,000.00 $59,341.67
Light Vehicles $1,299,174.00 $1,299,174.00 $1,208,318.00 $90,856.00 $130,378.70
Trucks $3,981,000.00 $2,762,450.00 $555,000.00 $3,426,000.00 $369,825.00
Mowers $242,000.00 $127,525.00
$38,600.00 $203,400.00 $36,855.00
Earth Moving Plant $4,215,000.00 $3,619,000.00 $792,000.00 $3,423,000.00 $347,476.19
Trailers $480,300.00 $428,513.33 $121,800.00 $358,500.00 $22,843.33
Minor Plant and Equipment $230,500.00 $17,300.00 $25,600.00 $204,900.00 $22,268.33
Total Fleet Assets $11,184,974.00 $8,921,837.33 $3,200,218.00 $8,227,656.00 $988,988.22
0
1
2
3
4
5
33
5
34
3
35
0
34
0
34
7
34
5
34
9
34
1
33
9
34
2
33
8
Rat
ing
Unit #
Condition
Tenterfield Shire Council – Fleet Asset Management Plan
18 | P a g e
Various ratios of asset consumption and expenditure have been prepared to help guide and gauge asset management performance and trends over time.
Rate of Annual Asset Consumption 12.1% (Depreciation/Depreciable Amount)
Rate of Annual Asset Renewal 12.1% (Capital renewal exp/Depreciable amount)
Council is currently renewing assets at 12.1% of the rate they are being consumed each year and is not increasing the size of the asset base.
To provide services in a financially sustainable manner, Council will need to ensure that it is renewing assets at the rate they are being consumed over the medium-long term and funding the life cycle costs for all new assets and services in its long term financial plan.
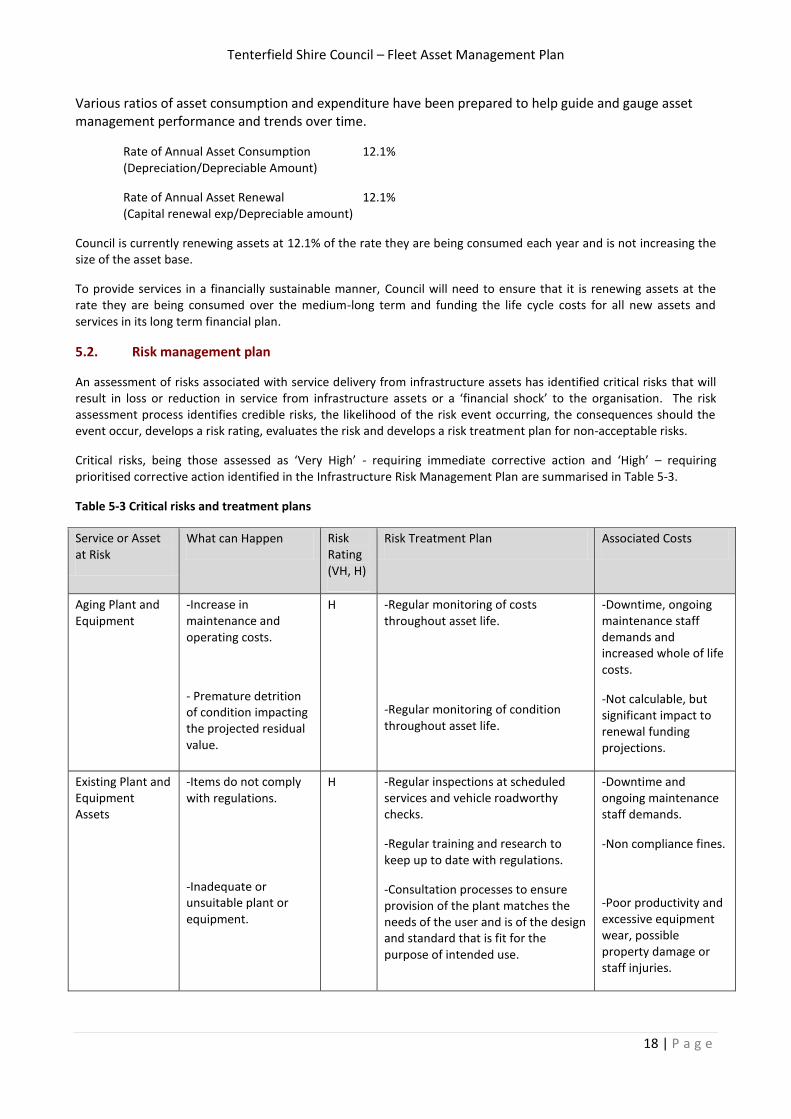
5.2. Risk management plan
An assessment of risks associated with service delivery from infrastructure assets has identified critical risks that will result in loss or reduction in service from infrastructure assets or a ‘financial shock’ to the organisation. The risk assessment process identifies credible risks, the likelihood of the risk event occurring, the consequences should the event occur, develops a risk rating, evaluates the risk and develops a risk treatment plan for non-acceptable risks.
Critical risks, being those assessed as ‘Very High’ - requiring immediate corrective action and ‘High’ – requiring prioritised corrective action identified in the Infrastructure Risk Management Plan are summarised in Table 5-3.
Table 5-3 Critical risks and treatment plans
Service or Asset at Risk
What can Happen Risk Rating (VH, H)
Risk Treatment Plan Associated Costs
Aging Plant and Equipment
-Increase in maintenance and operating costs.
- Premature detrition of condition impacting the projected residual value.
H -Regular monitoring of costs throughout asset life.
-Regular monitoring of condition throughout asset life.
-Downtime, ongoing maintenance staff demands and increased whole of life costs.
-Not calculable, but significant impact to renewal funding projections.
Existing Plant and Equipment Assets
-Items do not comply with regulations.
-Inadequate or unsuitable plant or equipment.
H -Regular inspections at scheduled services and vehicle roadworthy checks.
-Regular training and research to keep up to date with regulations.
-Consultation processes to ensure provision of the plant matches the needs of the user and is of the design and standard that is fit for the purpose of intended use.
-Downtime and ongoing maintenance staff demands.
-Non compliance fines.
-Poor productivity and excessive equipment wear, possible property damage or staff injuries.
Tenterfield Shire Council – Fleet Asset Management Plan
19 | P a g e
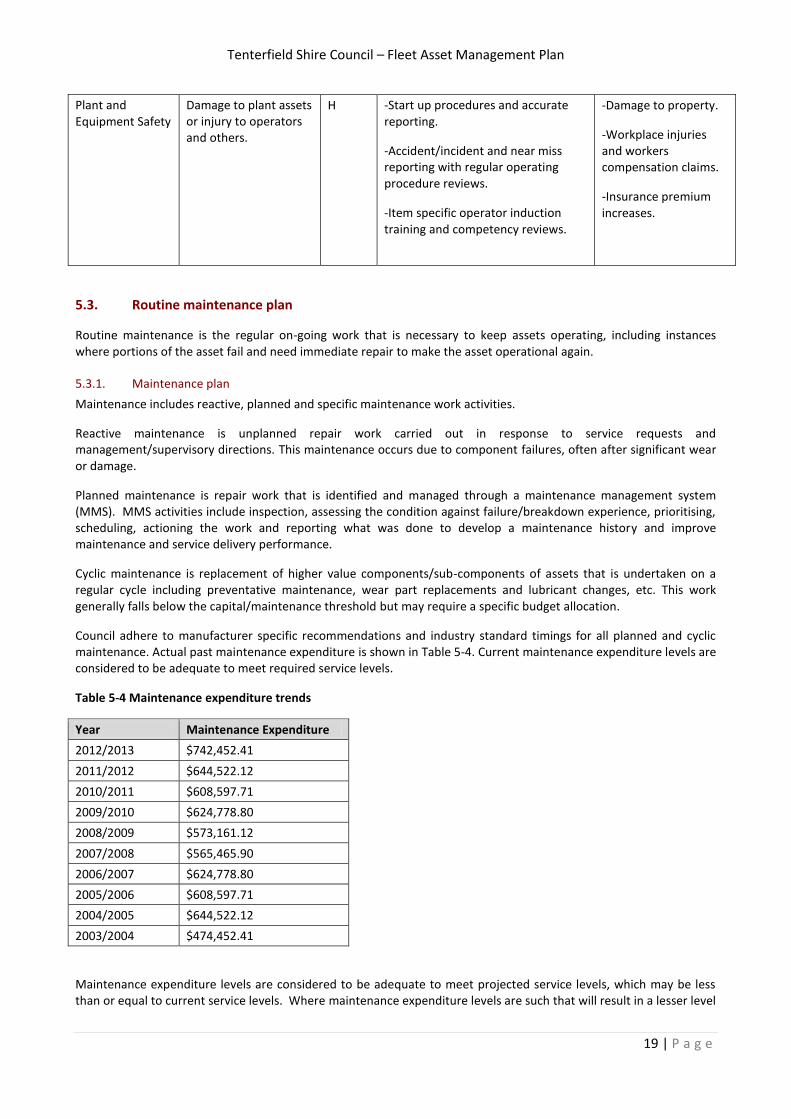
Plant and Equipment Safety
Damage to plant assets or injury to operators and others.
H -Start up procedures and accurate reporting.
-Accident/incident and near miss reporting with regular operating procedure reviews.
-Item specific operator induction training and competency reviews.
-Damage to property.
-Workplace injuries and workers compensation claims.
-Insurance premium increases.
5.3. Routine maintenance plan
Routine maintenance is the regular on-going work that is necessary to keep assets operating, including instances where portions of the asset fail and need immediate repair to make the asset operational again.
5.3.1. Maintenance plan
Maintenance includes reactive, planned and specific maintenance work activities.
Reactive maintenance is unplanned repair work carried out in response to service requests and management/supervisory directions. This maintenance occurs due to component failures, often after significant wear or damage.
Planned maintenance is repair work that is identified and managed through a maintenance management system (MMS). MMS activities include inspection, assessing the condition against failure/breakdown experience, prioritising, scheduling, actioning the work and reporting what was done to develop a maintenance history and improve maintenance and service delivery performance.
Cyclic maintenance is replacement of higher value components/sub-components of assets that is undertaken on a regular cycle including preventative maintenance, wear part replacements and lubricant changes, etc. This work generally falls below the capital/maintenance threshold but may require a specific budget allocation.
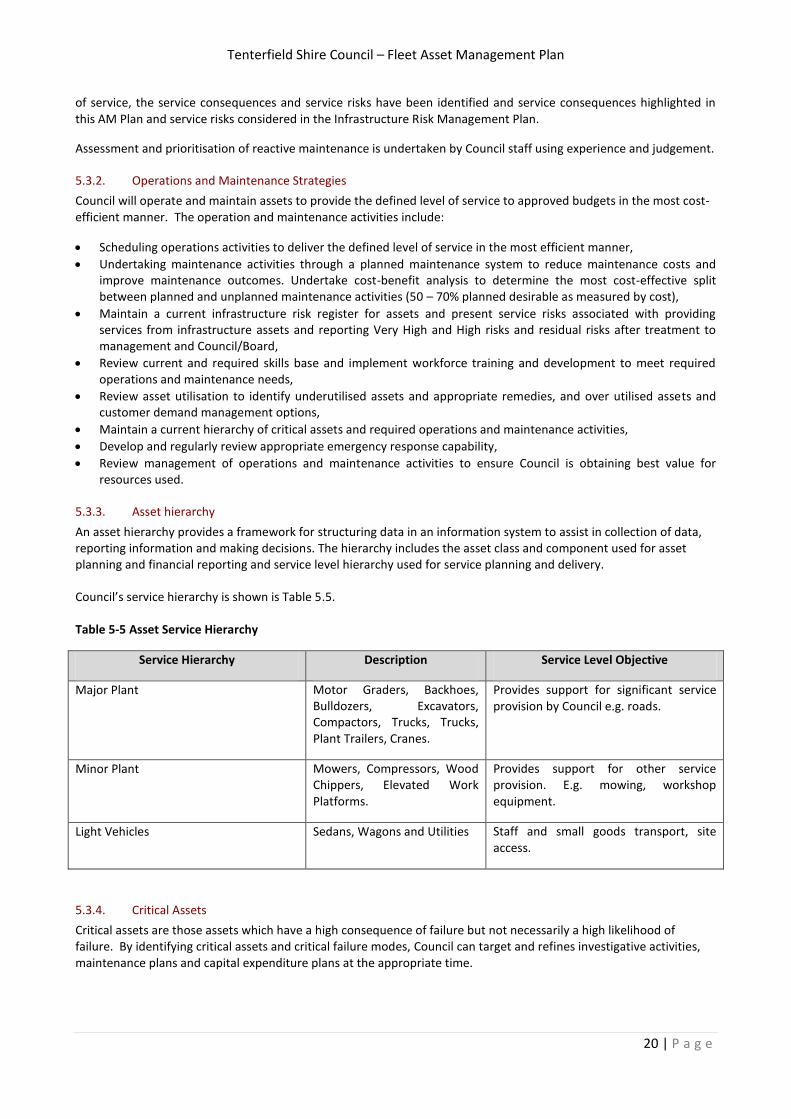
Council adhere to manufacturer specific recommendations and industry standard timings for all planned and cyclic maintenance. Actual past maintenance expenditure is shown in Table 5-4. Current maintenance expenditure levels are considered to be adequate to meet required service levels.
Table 5-4 Maintenance expenditure trends
Year Maintenance Expenditure
2012/2013 $742,452.41
2011/2012 $644,522.12
2010/2011 $608,597.71
2009/2010 $624,778.80
2008/2009 $573,161.12
2007/2008 $565,465.90
2006/2007 $624,778.80
2005/2006 $608,597.71
2004/2005 $644,522.12
2003/2004 $474,452.41
Maintenance expenditure levels are considered to be adequate to meet projected service levels, which may be less than or equal to current service levels. Where maintenance expenditure levels are such that will result in a lesser level
Tenterfield Shire Council – Fleet Asset Management Plan
20 | P a g e
of service, the service consequences and service risks have been identified and service consequences highlighted in this AM Plan and service risks considered in the Infrastructure Risk Management Plan.
Assessment and prioritisation of reactive maintenance is undertaken by Council staff using experience and judgement.
5.3.2. Operations and Maintenance Strategies
Council will operate and maintain assets to provide the defined level of service to approved budgets in the most cost-efficient manner. The operation and maintenance activities include:
Scheduling operations activities to deliver the defined level of service in the most efficient manner,
Undertaking maintenance activities through a planned maintenance system to reduce maintenance costs and improve maintenance outcomes. Undertake cost-benefit analysis to determine the most cost-effective split between planned and unplanned maintenance activities (50 – 70% planned desirable as measured by cost),
Maintain a current infrastructure risk register for assets and present service risks associated with providing services from infrastructure assets and reporting Very High and High risks and residual risks after treatment to management and Council/Board,
Review current and required skills base and implement workforce training and development to meet required operations and maintenance needs,
Review asset utilisation to identify underutilised assets and appropriate remedies, and over utilised assets and customer demand management options,
Maintain a current hierarchy of critical assets and required operations and maintenance activities,
Develop and regularly review appropriate emergency response capability,
Review management of operations and maintenance activities to ensure Council is obtaining best value for resources used.
5.3.3. Asset hierarchy
An asset hierarchy provides a framework for structuring data in an information system to assist in collection of data, reporting information and making decisions. The hierarchy includes the asset class and component used for asset planning and financial reporting and service level hierarchy used for service planning and delivery. Council’s service hierarchy is shown is Table 5.5. Table 5-5 Asset Service Hierarchy
Service Hierarchy Description Service Level Objective
Major Plant Motor Graders, Backhoes, Bulldozers, Excavators, Compactors, Trucks, Trucks, Plant Trailers, Cranes.
Provides support for significant service provision by Council e.g. roads.
Minor Plant Mowers, Compressors, Wood Chippers, Elevated Work Platforms.
Provides support for other service provision. E.g. mowing, workshop equipment.
Light Vehicles Sedans, Wagons and Utilities Staff and small goods transport, site access.
5.3.4. Critical Assets
Critical assets are those assets which have a high consequence of failure but not necessarily a high likelihood of failure. By identifying critical assets and critical failure modes, Council can target and refines investigative activities, maintenance plans and capital expenditure plans at the appropriate time.
Tenterfield Shire Council – Fleet Asset Management Plan
21 | P a g e
Operations and maintenances activities may be targeted to mitigate critical assets failure and maintain service levels. These activities may include increased inspection frequency, higher maintenance intervention levels, etc. Critical assets failure modes and required operations and maintenance activities are detailed in Table 5-6
Table 5-6 Critical Assets and Service Level Objectives
Critical Assets Critical Failure Mode Operations & Maintenance Activities
Garbage Compactors -Component Failure. -Reduced Productivity. -Major Repairs resulting in lengthy downtime.
-Increased preventative maintenance program. -Frequent inspections for wear and deterioration. -Reduced period between scheduled maintenance activities.
Seca Sewer Choke Machine -Component Failure. -Reduced Productivity. -Major Repairs resulting in lengthy downtime.
-Increased preventative maintenance program. -Frequent inspections for wear and deterioration. -Reduced period between scheduled maintenance activities.
5.3.1. Standards and specifications
Maintenance work is carried out in accordance with the following Standards and Specifications.
Roads and Maritime Services QA Specification G22
Industry standards and regulations.
Manufactures specifications.
Workplace Health and Safety Act 2000 and Regulations 2011
NSW Motor Traffic Act 1909 No. 5
Australian Standard AS1636.1
Protection of the Environment Operations Act 1997.
5.4. Summary of future operations and maintenance expenditures
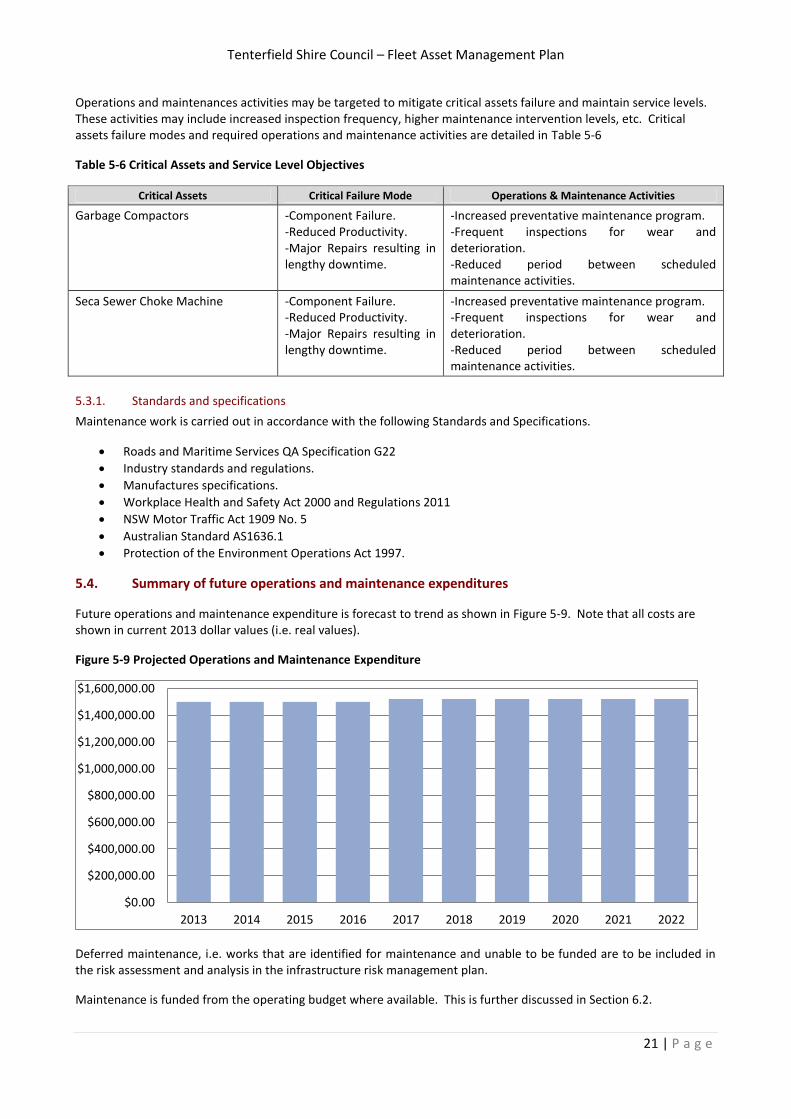
Future operations and maintenance expenditure is forecast to trend as shown in Figure 5-9. Note that all costs are shown in current 2013 dollar values (i.e. real values).
Figure 5-9 Projected Operations and Maintenance Expenditure
Deferred maintenance, i.e. works that are identified for maintenance and unable to be funded are to be included in the risk assessment and analysis in the infrastructure risk management plan.
Maintenance is funded from the operating budget where available. This is further discussed in Section 6.2.
$0.00
$200,000.00
$400,000.00
$600,000.00
$800,000.00
$1,000,000.00
$1,200,000.00
$1,400,000.00
$1,600,000.00
2013 2014 2015 2016 2017 2018 2019 2020 2021 2022
Tenterfield Shire Council – Fleet Asset Management Plan
22 | P a g e
5.5. Renewal/replacement plan
Renewal expenditure is the replacement of an existing item which does not increase the asset’s design capacity but restores, rehabilitates, replaces or renews an existing asset to its original service potential. Work over and above restoring an asset to original service potential is upgrade/expansion expenditure.
5.5.1. Renewal plan
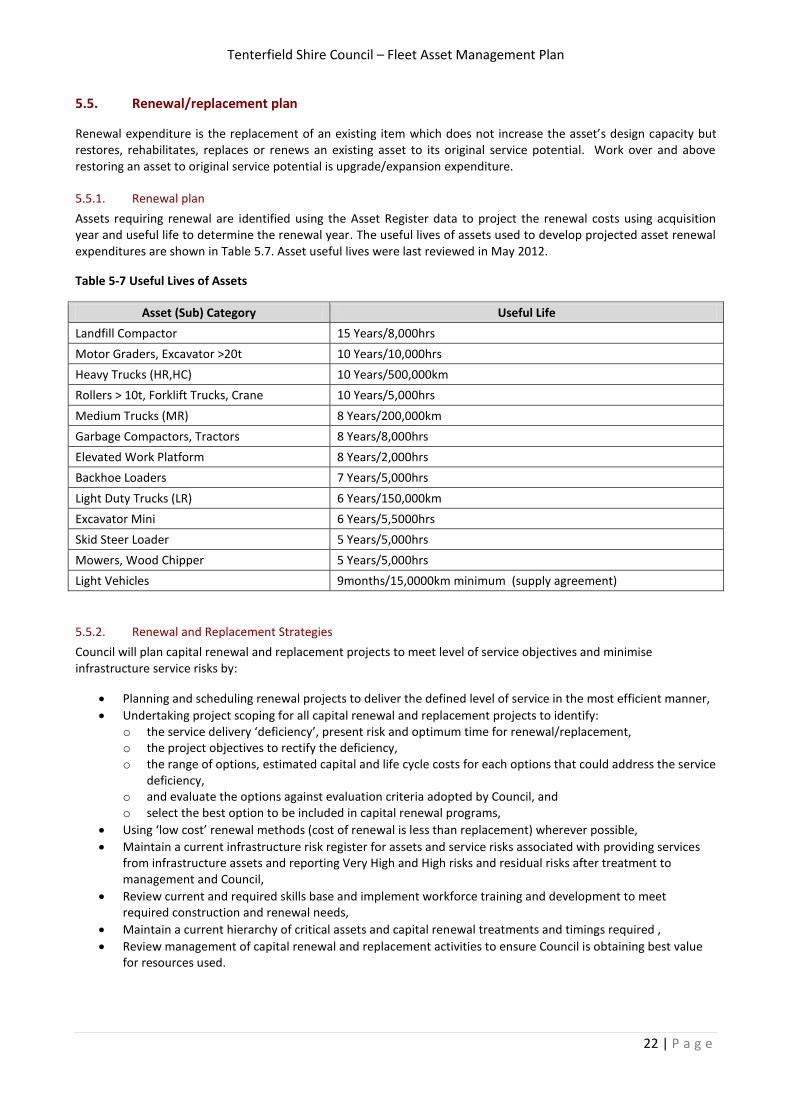
Assets requiring renewal are identified using the Asset Register data to project the renewal costs using acquisition year and useful life to determine the renewal year. The useful lives of assets used to develop projected asset renewal expenditures are shown in Table 5.7. Asset useful lives were last reviewed in May 2012.
Table 5-7 Useful Lives of Assets
Asset (Sub) Category Useful Life
Landfill Compactor 15 Years/8,000hrs
Motor Graders, Excavator >20t 10 Years/10,000hrs
Heavy Trucks (HR,HC) 10 Years/500,000km
Rollers > 10t, Forklift Trucks, Crane 10 Years/5,000hrs
Medium Trucks (MR) 8 Years/200,000km
Garbage Compactors, Tractors 8 Years/8,000hrs
Elevated Work Platform 8 Years/2,000hrs
Backhoe Loaders 7 Years/5,000hrs
Light Duty Trucks (LR) 6 Years/150,000km
Excavator Mini 6 Years/5,5000hrs
Skid Steer Loader 5 Years/5,000hrs
Mowers, Wood Chipper 5 Years/5,000hrs
Light Vehicles 9months/15,0000km minimum (supply agreement)
5.5.2. Renewal and Replacement Strategies
Council will plan capital renewal and replacement projects to meet level of service objectives and minimise infrastructure service risks by:
Planning and scheduling renewal projects to deliver the defined level of service in the most efficient manner,
Undertaking project scoping for all capital renewal and replacement projects to identify: o the service delivery ‘deficiency’, present risk and optimum time for renewal/replacement, o the project objectives to rectify the deficiency, o the range of options, estimated capital and life cycle costs for each options that could address the service
deficiency, o and evaluate the options against evaluation criteria adopted by Council, and o select the best option to be included in capital renewal programs,
Using ‘low cost’ renewal methods (cost of renewal is less than replacement) wherever possible,
Maintain a current infrastructure risk register for assets and service risks associated with providing services from infrastructure assets and reporting Very High and High risks and residual risks after treatment to management and Council,
Review current and required skills base and implement workforce training and development to meet required construction and renewal needs,
Maintain a current hierarchy of critical assets and capital renewal treatments and timings required ,
Review management of capital renewal and replacement activities to ensure Council is obtaining best value for resources used.
Tenterfield Shire Council – Fleet Asset Management Plan
23 | P a g e
5.5.3. Renewal ranking criteria
Asset renewal and replacement is typically undertaken to either:
Ensure the reliability of the fleet to deliver the services it facilitates (eg replacing a garbage compactor that has reduced reliability through age), or
To ensure the fleet is of sufficient quality to meet the service requirements (eg capacity to provide the service at the desired level).
It is possible to get some indication of capital renewal and replacement priorities by identifying assets or asset groups that:
Have a high consequence of failure,
Have a high utilisation and subsequent impact on users would be greatest,
The total value represents the greatest net value to Council,
Have the highest average age relative to their expected lives,
Are identified in the AM Plan as key cost factors,
Have high operational or maintenance costs, and
Where replacement with modern equivalent assets would yield operational savings. The ranking criteria used to determine priority of identified renewal and replacement proposals is detailed in Table 5-8.
Table 5-8 Renewal and Replacement Priority Ranking Criteria
Criteria Weighting
Current service level of asset requiring renewal and expected life, including safety considerations.
70%
Affordability 30%
Total 100%
5.5.1. Renewal and Replacement standards
Renewal is carried out in accordance with the following Standards and Specifications.
Council Policy
Local Government Act 1993
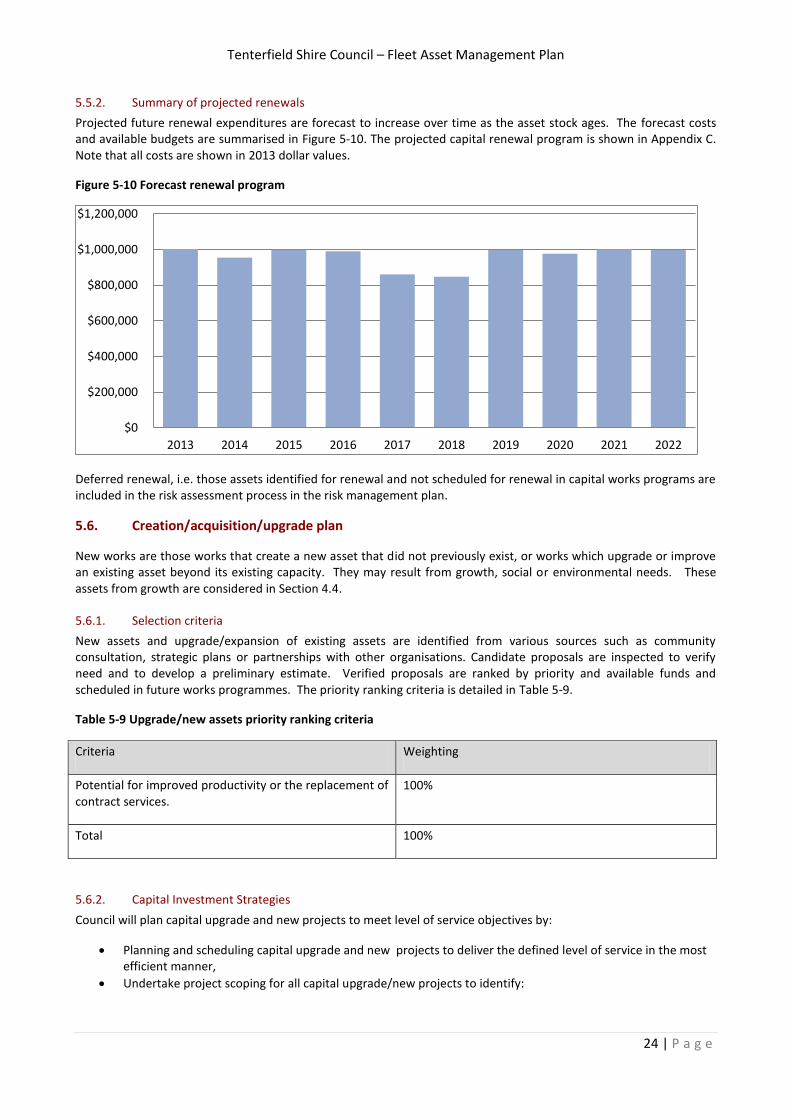
Tenterfield Shire Council – Fleet Asset Management Plan
24 | P a g e
5.5.2. Summary of projected renewals
Projected future renewal expenditures are forecast to increase over time as the asset stock ages. The forecast costs and available budgets are summarised in Figure 5-10. The projected capital renewal program is shown in Appendix C. Note that all costs are shown in 2013 dollar values.
Figure 5-10 Forecast renewal program
Deferred renewal, i.e. those assets identified for renewal and not scheduled for renewal in capital works programs are included in the risk assessment process in the risk management plan.
5.6. Creation/acquisition/upgrade plan
New works are those works that create a new asset that did not previously exist, or works which upgrade or improve an existing asset beyond its existing capacity. They may result from growth, social or environmental needs. These assets from growth are considered in Section 4.4.
5.6.1. Selection criteria
New assets and upgrade/expansion of existing assets are identified from various sources such as community consultation, strategic plans or partnerships with other organisations. Candidate proposals are inspected to verify need and to develop a preliminary estimate. Verified proposals are ranked by priority and available funds and scheduled in future works programmes. The priority ranking criteria is detailed in Table 5-9.
Table 5-9 Upgrade/new assets priority ranking criteria
Criteria Weighting
Potential for improved productivity or the replacement of contract services.
100%
Total 100%
5.6.2. Capital Investment Strategies
Council will plan capital upgrade and new projects to meet level of service objectives by:
Planning and scheduling capital upgrade and new projects to deliver the defined level of service in the most efficient manner,
Undertake project scoping for all capital upgrade/new projects to identify:
$0
$200,000
$400,000
$600,000
$800,000
$1,000,000
$1,200,000
2013 2014 2015 2016 2017 2018 2019 2020 2021 2022
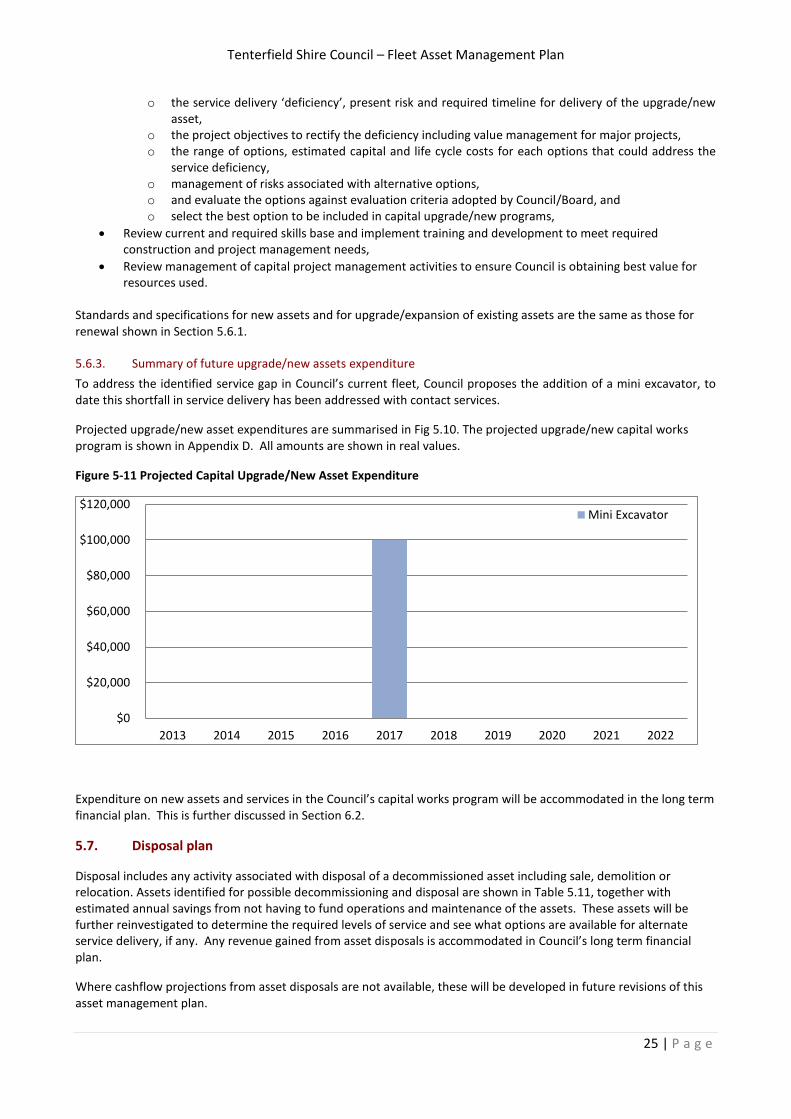
Tenterfield Shire Council – Fleet Asset Management Plan
25 | P a g e
o the service delivery ‘deficiency’, present risk and required timeline for delivery of the upgrade/new asset,
o the project objectives to rectify the deficiency including value management for major projects, o the range of options, estimated capital and life cycle costs for each options that could address the
service deficiency, o management of risks associated with alternative options, o and evaluate the options against evaluation criteria adopted by Council/Board, and o select the best option to be included in capital upgrade/new programs,
Review current and required skills base and implement training and development to meet required construction and project management needs,
Review management of capital project management activities to ensure Council is obtaining best value for resources used.
Standards and specifications for new assets and for upgrade/expansion of existing assets are the same as those for renewal shown in Section 5.6.1.
5.6.3. Summary of future upgrade/new assets expenditure
To address the identified service gap in Council’s current fleet, Council proposes the addition of a mini excavator, to date this shortfall in service delivery has been addressed with contact services.
Projected upgrade/new asset expenditures are summarised in Fig 5.10. The projected upgrade/new capital works program is shown in Appendix D. All amounts are shown in real values.
Figure 5-11 Projected Capital Upgrade/New Asset Expenditure
Expenditure on new assets and services in the Council’s capital works program will be accommodated in the long term financial plan. This is further discussed in Section 6.2.
5.7. Disposal plan
Disposal includes any activity associated with disposal of a decommissioned asset including sale, demolition or relocation. Assets identified for possible decommissioning and disposal are shown in Table 5.11, together with estimated annual savings from not having to fund operations and maintenance of the assets. These assets will be further reinvestigated to determine the required levels of service and see what options are available for alternate service delivery, if any. Any revenue gained from asset disposals is accommodated in Council’s long term financial plan.
Where cashflow projections from asset disposals are not available, these will be developed in future revisions of this asset management plan.
$0
$20,000
$40,000
$60,000
$80,000
$100,000
$120,000
2013 2014 2015 2016 2017 2018 2019 2020 2021 2022
Mini Excavator
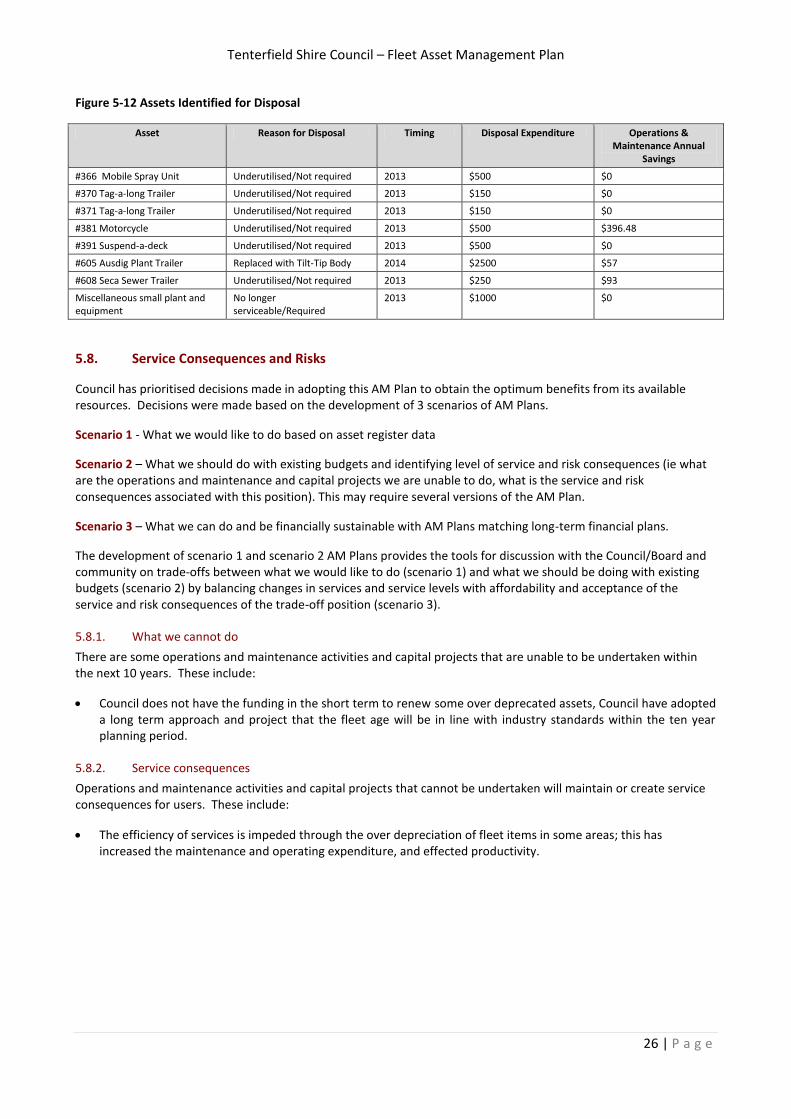
Tenterfield Shire Council – Fleet Asset Management Plan
26 | P a g e
Figure 5-12 Assets Identified for Disposal
Asset Reason for Disposal Timing Disposal Expenditure Operations & Maintenance Annual
Savings
#366 Mobile Spray Unit Underutilised/Not required 2013 $500 $0
#370 Tag-a-long Trailer Underutilised/Not required 2013 $150 $0
#371 Tag-a-long Trailer Underutilised/Not required 2013 $150 $0
#381 Motorcycle Underutilised/Not required 2013 $500 $396.48
#391 Suspend-a-deck Underutilised/Not required 2013 $500 $0
#605 Ausdig Plant Trailer Replaced with Tilt-Tip Body 2014 $2500 $57
#608 Seca Sewer Trailer Underutilised/Not required 2013 $250 $93
Miscellaneous small plant and equipment
No longer serviceable/Required
2013 $1000 $0
5.8. Service Consequences and Risks
Council has prioritised decisions made in adopting this AM Plan to obtain the optimum benefits from its available resources. Decisions were made based on the development of 3 scenarios of AM Plans.
Scenario 1 - What we would like to do based on asset register data
Scenario 2 – What we should do with existing budgets and identifying level of service and risk consequences (ie what are the operations and maintenance and capital projects we are unable to do, what is the service and risk consequences associated with this position). This may require several versions of the AM Plan.
Scenario 3 – What we can do and be financially sustainable with AM Plans matching long-term financial plans.
The development of scenario 1 and scenario 2 AM Plans provides the tools for discussion with the Council/Board and community on trade-offs between what we would like to do (scenario 1) and what we should be doing with existing budgets (scenario 2) by balancing changes in services and service levels with affordability and acceptance of the service and risk consequences of the trade-off position (scenario 3).
5.8.1. What we cannot do
There are some operations and maintenance activities and capital projects that are unable to be undertaken within the next 10 years. These include:
Council does not have the funding in the short term to renew some over deprecated assets, Council have adopted a long term approach and project that the fleet age will be in line with industry standards within the ten year planning period.
5.8.2. Service consequences
Operations and maintenance activities and capital projects that cannot be undertaken will maintain or create service consequences for users. These include:
The efficiency of services is impeded through the over depreciation of fleet items in some areas; this has increased the maintenance and operating expenditure, and effected productivity.
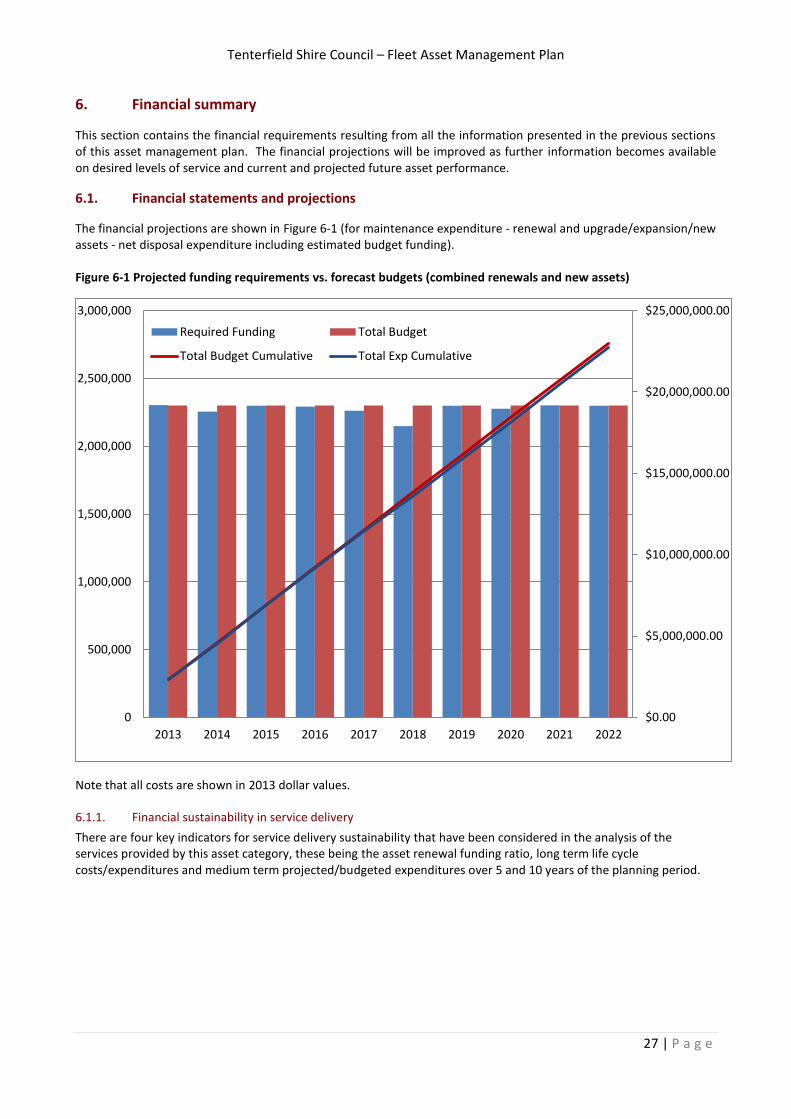
Tenterfield Shire Council – Fleet Asset Management Plan
27 | P a g e
6. Financial summary
This section contains the financial requirements resulting from all the information presented in the previous sections of this asset management plan. The financial projections will be improved as further information becomes available on desired levels of service and current and projected future asset performance.
6.1. Financial statements and projections
The financial projections are shown in Figure 6-1 (for maintenance expenditure - renewal and upgrade/expansion/new assets - net disposal expenditure including estimated budget funding). Figure 6-1 Projected funding requirements vs. forecast budgets (combined renewals and new assets)
Note that all costs are shown in 2013 dollar values.
6.1.1. Financial sustainability in service delivery
There are four key indicators for service delivery sustainability that have been considered in the analysis of the services provided by this asset category, these being the asset renewal funding ratio, long term life cycle costs/expenditures and medium term projected/budgeted expenditures over 5 and 10 years of the planning period.
$0.00
$5,000,000.00
$10,000,000.00
$15,000,000.00
$20,000,000.00
$25,000,000.00
0
500,000
1,000,000
1,500,000
2,000,000
2,500,000
3,000,000
2013 2014 2015 2016 2017 2018 2019 2020 2021 2022
Required Funding Total Budget
Total Budget Cumulative Total Exp Cumulative
Tenterfield Shire Council – Fleet Asset Management Plan
28 | P a g e
6.1.1.1. Asset Renewal Funding Ratio
Asset Renewal Funding Ratio 100%
The Asset Renewal Funding Ratio is the most important indicator and reveals that over the next 10 years, Council is forecasting that it will have 100% of the funds required for the optimal renewal and replacement of its assets.
Long term - life cycle cost
Life cycle costs (or whole of life costs) are the average costs that are required to sustain the service levels over the longest asset life. Life cycle costs include operations and maintenance expenditure and asset consumption (depreciation expense). The life cycle cost for the services covered in this asset management plan is $2.36 million per year (operations and maintenance expenditure plus depreciation expense in year 1).
Life cycle costs can be compared to life cycle expenditure to give an indicator of sustainability in service provision. Life cycle expenditure includes operations, maintenance and capital renewal expenditure in year 1. Life cycle expenditure will vary depending on the timing of asset renewals. The life cycle expenditure at the start of the plan is $2.35 million (operations and maintenance expenditure plus budgeted capital renewal expenditure in year 1).
The life cycle costs and life cycle expenditure comparison highlights any difference between present outlays and the average cost of providing the service over the long term. If the life cycle expenditure is less than that life cycle cost, it is most likely that outlays will need to be increased or cuts in services made in the future.
Knowing the extent and timing of any required increase in outlays and the service consequences if funding is not available will assist organisations in providing services to their communities in a financially sustainable manner. This is the purpose of the asset management plans and long term financial plan.
Medium term – 10 year financial planning period
This asset management plan identifies the projected operations, maintenance and capital renewal expenditures required to provide an agreed level of service to the community over a 10 year period. This provides input into 10 year financial and funding plans aimed at providing the required services in a sustainable manner.
These projected expenditures may be compared to budgeted expenditures in the 10 year period to identify any funding shortfall. In a core asset management plan, a gap is generally due to increasing asset renewals for ageing assets.
The projected operations, maintenance and capital renewal expenditure required over the 10 year planning period is $2.27 million per year.
Estimated (budget) operations, maintenance and capital renewal funding is $2.3 million per year giving a balanced result and a 10 year sustainability indicator of 1. This indicates that Council has the projected expenditures needed to provide the services documented in the asset management plan.
Medium term – 5 year financial planning period
The projected operations, maintenance and capital renewal expenditure required over the first 5 years of the planning period is $2.3 million per year.
Estimated (budget) operations, maintenance and capital renewal funding is $2.3 million per year giving a balanced result and a 10 year sustainability indicator of 1. This is 100% of projected expenditures giving a 5 year sustainability indicator of 1.
Financial sustainability indicators
Providing services from infrastructure in a sustainable manner requires the matching and managing of service levels, risks, projected expenditures and funding to achieve a financial sustainability indicator of 1.0 for the first years of the asset management plan and ideally over the 10 year life of the AM Plan.
Table 6-1 shows the projected and budgeted renewals.
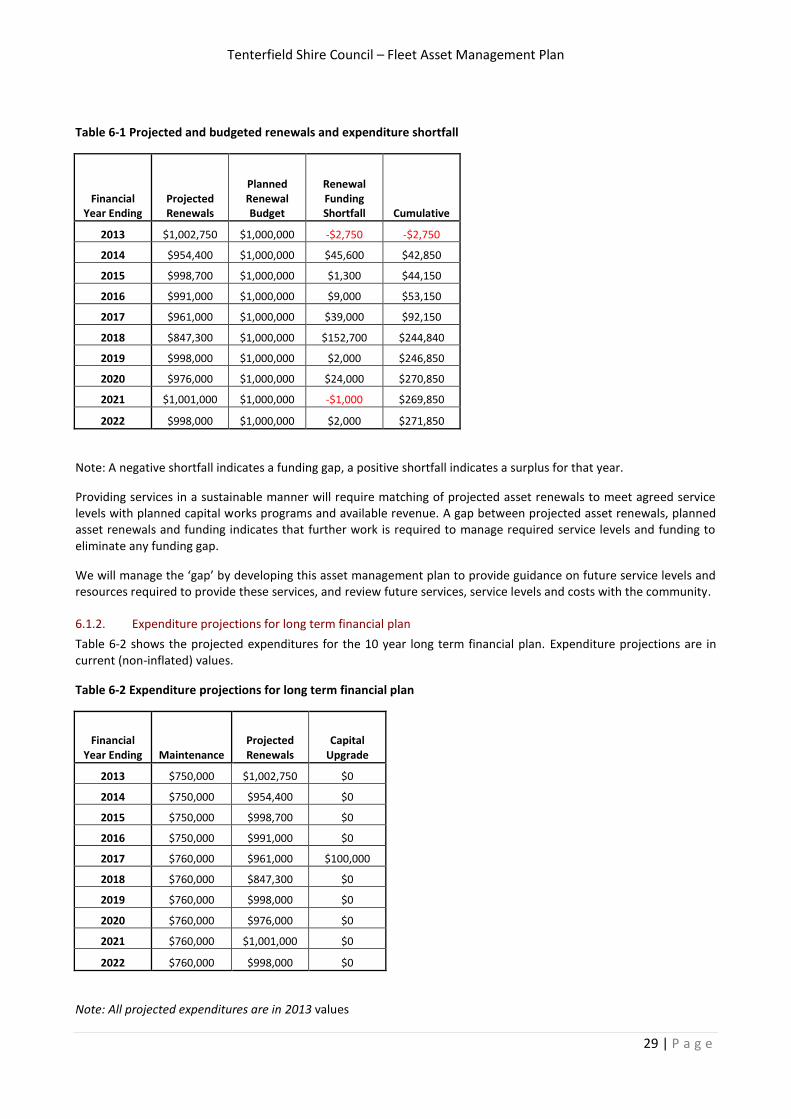
Tenterfield Shire Council – Fleet Asset Management Plan
29 | P a g e
Table 6-1 Projected and budgeted renewals and expenditure shortfall
Financial Year Ending
Projected Renewals
Planned Renewal Budget
Renewal Funding Shortfall Cumulative
2013 $1,002,750 $1,000,000 -$2,750 -$2,750
2014 $954,400 $1,000,000 $45,600 $42,850
2015 $998,700 $1,000,000 $1,300 $44,150
2016 $991,000 $1,000,000 $9,000 $53,150
2017 $961,000 $1,000,000 $39,000 $92,150
2018 $847,300 $1,000,000 $152,700 $244,840
2019 $998,000 $1,000,000 $2,000 $246,850
2020 $976,000 $1,000,000 $24,000 $270,850
2021 $1,001,000 $1,000,000 -$1,000 $269,850
2022 $998,000 $1,000,000 $2,000 $271,850
Note: A negative shortfall indicates a funding gap, a positive shortfall indicates a surplus for that year.
Providing services in a sustainable manner will require matching of projected asset renewals to meet agreed service levels with planned capital works programs and available revenue. A gap between projected asset renewals, planned asset renewals and funding indicates that further work is required to manage required service levels and funding to eliminate any funding gap.
We will manage the ‘gap’ by developing this asset management plan to provide guidance on future service levels and resources required to provide these services, and review future services, service levels and costs with the community.
6.1.2. Expenditure projections for long term financial plan
Table 6-2 shows the projected expenditures for the 10 year long term financial plan. Expenditure projections are in current (non-inflated) values.
Table 6-2 Expenditure projections for long term financial plan
Financial Year Ending Maintenance
Projected Renewals
Capital Upgrade
2013 $750,000 $1,002,750 $0
2014 $750,000 $954,400 $0
2015 $750,000 $998,700 $0
2016 $750,000 $991,000 $0
2017 $760,000 $961,000 $100,000
2018 $760,000 $847,300 $0
2019 $760,000 $998,000 $0
2020 $760,000 $976,000 $0
2021 $760,000 $1,001,000 $0
2022 $760,000 $998,000 $0
Note: All projected expenditures are in 2013 values
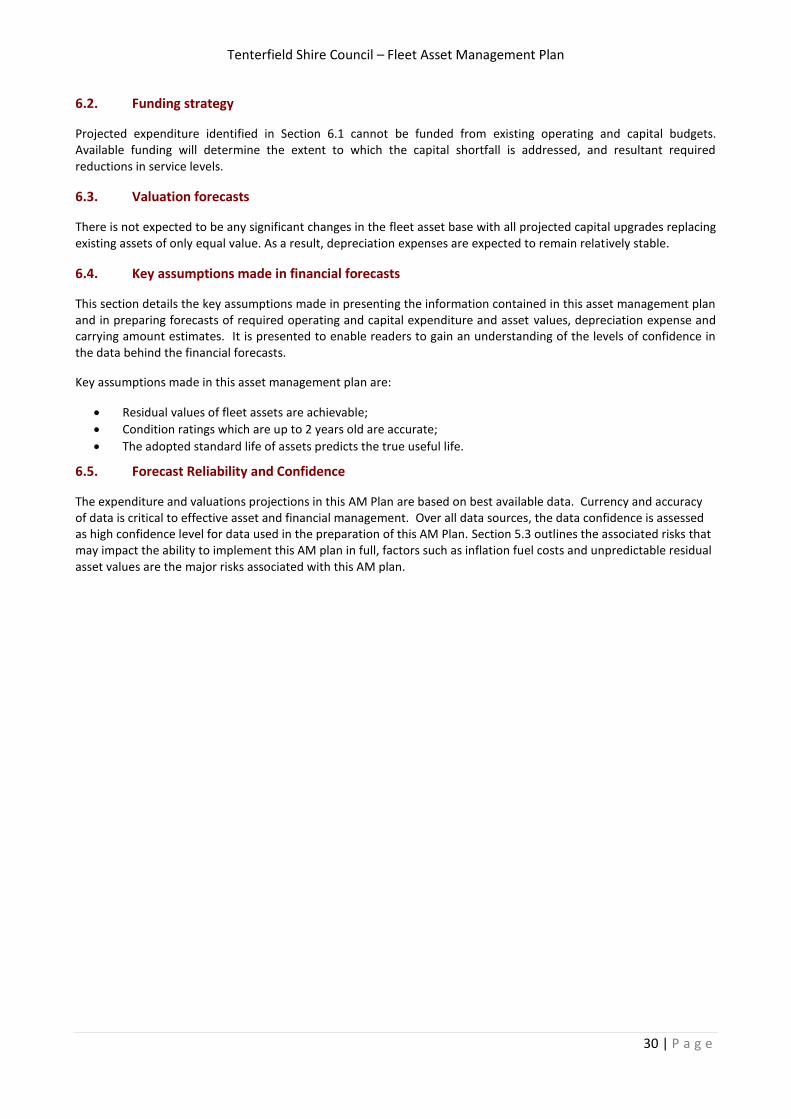
Tenterfield Shire Council – Fleet Asset Management Plan
30 | P a g e
6.2. Funding strategy
Projected expenditure identified in Section 6.1 cannot be funded from existing operating and capital budgets. Available funding will determine the extent to which the capital shortfall is addressed, and resultant required reductions in service levels.
6.3. Valuation forecasts
There is not expected to be any significant changes in the fleet asset base with all projected capital upgrades replacing existing assets of only equal value. As a result, depreciation expenses are expected to remain relatively stable.
6.4. Key assumptions made in financial forecasts
This section details the key assumptions made in presenting the information contained in this asset management plan and in preparing forecasts of required operating and capital expenditure and asset values, depreciation expense and carrying amount estimates. It is presented to enable readers to gain an understanding of the levels of confidence in the data behind the financial forecasts.
Key assumptions made in this asset management plan are:
Residual values of fleet assets are achievable;
Condition ratings which are up to 2 years old are accurate;
The adopted standard life of assets predicts the true useful life.
6.5. Forecast Reliability and Confidence
The expenditure and valuations projections in this AM Plan are based on best available data. Currency and accuracy of data is critical to effective asset and financial management. Over all data sources, the data confidence is assessed as high confidence level for data used in the preparation of this AM Plan. Section 5.3 outlines the associated risks that may impact the ability to implement this AM plan in full, factors such as inflation fuel costs and unpredictable residual asset values are the major risks associated with this AM plan.
Tenterfield Shire Council – Fleet Asset Management Plan
31 | P a g e
7. Asset management practices
7.1. Accounting/financial systems
7.1.1. Accounting and financial systems
Council employs the Authority enterprise Business System provided by Civica. This is currently planned for replacement by the Horizon system in 2013/2014.
7.1.2. Accountabilities for financial systems
The Director of Corporate Services is responsible for the control of Council’s accounting systems.
7.1.3. Accounting standards and regulations
Australia accounting standards (AASB) local Government, code of accounting practice and financial reporting, Council’s accounting policy, the local government Act (LGA) and regulations.
In accordance with asset capitalisation policy expenditure which has benefit expected to last more than twelve month should be capitalized. Capital expender includes renewal, expansion and upgrade.
7.1.4. Capital/maintenance threshold
The aim of the capitalisation policy is to set a capitalisation threshold above which assets are required to be recorded by Council in its financial statements. The process for this is the capitalisation process and is achieved by the recording the capital cost of the acquisition of assets into Council’s financial system and then into the asset management system. Fleet assets are those with original purchase price above a capitalisation threshold of $5,000 and an expected life of 12 months. Procurement of items less than the threshold is treated as an expense. Procurement of items to rebuild or repair fleet assets are considered an expense.
7.1.5. Required changes to accounting financial systems arising from this AM Plan
A review of Council’s capital/maintenance thresholds.
Clarification of renewal expenditure within the maintenance budget by creating a special “renewal” job number.
7.2. Asset management systems
7.2.1. Asset management system
Council employs the Conquest asset management module of the Authority enterprise Business System provided by Civica.
7.2.2. Asset registers
Council employs the Conquest asset management module of the Authority enterprise Business System provided by Civica. Additional asset management registers are maintained in the Engineering Department by the Fleet Manager and are included in Appendix A .
7.2.3. Linkage from asset management to financial system
The Conquest asset management and accounting systems are integrated internally within the Authority system. Updating of data in Conquest from registers and independent valuations is manual.
7.2.4. Accountabilities for asset management system and data
The GIS officer is responsible for updating the Conquest system up to date. The Asset Manager is responsible for ensuring data in Conquest is as accurate as possible and concords with the Engineering Asset Registers.
Tenterfield Shire Council – Fleet Asset Management Plan
32 | P a g e
7.2.5. Required changes to asset management system arising from this AM Plan
Improved integration of the Engineering Asset Registers and the asset management components managed by Finance is required. The current implementation of a replacement system called Horizon is expected to dramatically improve this integration.
7.3. Information flow requirements and processes
The key information flows into this asset management plan are:
Council strategic and operational plans,
Service requests from the community,
Network assets information,
The unit rates for categories of work/materials,
Current levels of service, expenditures, service deficiencies and service risks,
Projections of various factors affecting future demand for services and new assets acquired by Council,
Future capital works programs,
Financial asset values.
The key information flows from this asset management plan are:
The projected Works Program and trends,
The resulting budget and long term financial plan expenditure projections,
Financial sustainability indicators.
These will impact the Long Term Financial Plan, Strategic Longer-Term Plan, annual budget and departmental business plans and budgets.
7.4. Standards and guidelines
Standards, guidelines and policy documents referenced in this asset management plan are:
2011 Stormwater Assets Revaluation provided by CPA Associates Pty Ltd
IMEA National Manual, 1994
Australian Rainfall & Runoff.
Tenterfield Shire Council Policy 1.014 – Asset Management
Tenterfield Shire Council Road Network Management Plan 2013
Tenterfield Shire Council Policy 1.016
Roads and Maritime Services QA Specification G22
Workplace Health and Safety Act 2000 and Regulations 2011
NSW Motor Traffic Act 1909 No. 5
Australian Standard AS1636.1
Protection of the Environment Operations Act 1997.
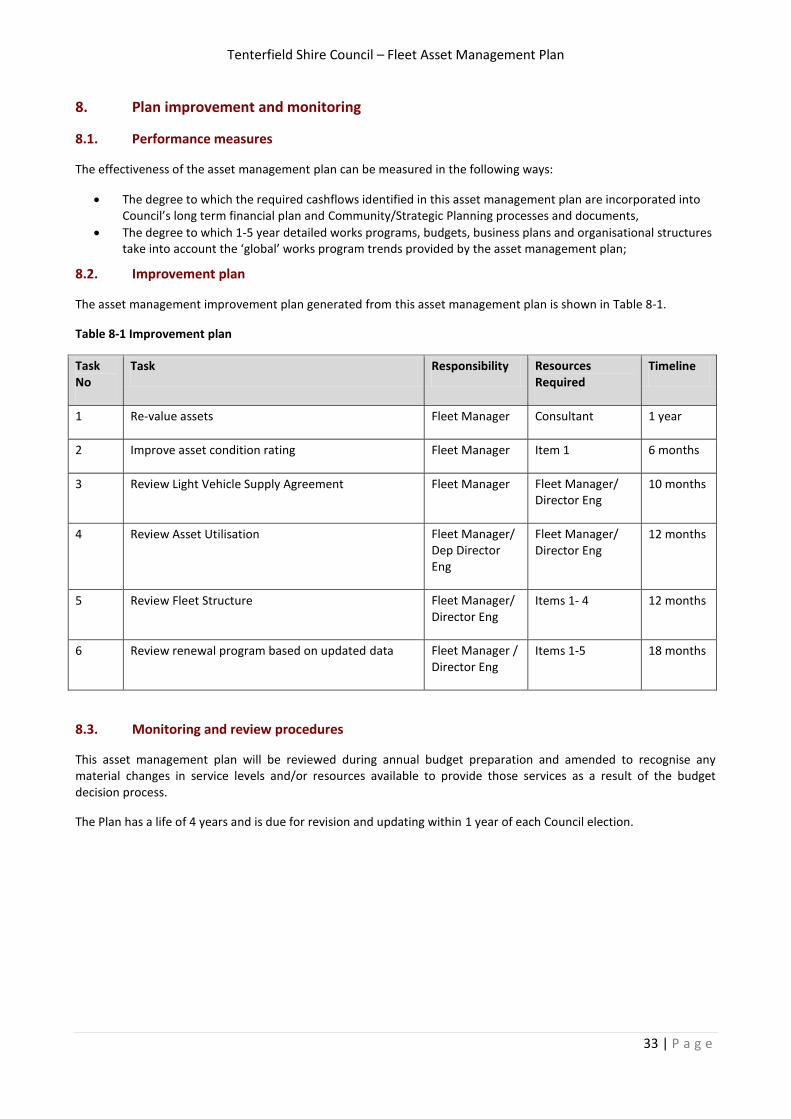
Tenterfield Shire Council – Fleet Asset Management Plan
33 | P a g e
8. Plan improvement and monitoring
8.1. Performance measures
The effectiveness of the asset management plan can be measured in the following ways:
The degree to which the required cashflows identified in this asset management plan are incorporated into Council’s long term financial plan and Community/Strategic Planning processes and documents,
The degree to which 1-5 year detailed works programs, budgets, business plans and organisational structures take into account the ‘global’ works program trends provided by the asset management plan;
8.2. Improvement plan
The asset management improvement plan generated from this asset management plan is shown in Table 8-1.
Table 8-1 Improvement plan
Task No
Task Responsibility Resources Required
Timeline
1 Re-value assets Fleet Manager Consultant 1 year
2 Improve asset condition rating Fleet Manager Item 1 6 months
3 Review Light Vehicle Supply Agreement Fleet Manager Fleet Manager/ Director Eng
10 months
4 Review Asset Utilisation Fleet Manager/ Dep Director Eng
Fleet Manager/ Director Eng
12 months
5 Review Fleet Structure Fleet Manager/ Director Eng
Items 1- 4 12 months
6 Review renewal program based on updated data Fleet Manager / Director Eng
Items 1-5 18 months
8.3. Monitoring and review procedures
This asset management plan will be reviewed during annual budget preparation and amended to recognise any material changes in service levels and/or resources available to provide those services as a result of the budget decision process.
The Plan has a life of 4 years and is due for revision and updating within 1 year of each Council election.
Tenterfield Shire Council – Fleet Asset Management Plan
34 | P a g e
10. References
Tenterfield Shire Council, 2013, Road Network Management Plan www.tenterfield.nsw.gov.au
DVC, 2006, Asset Investment Guidelines, Glossary, Department for Victorian Communities, Local Government Victoria, Melbourne, http://www.dpcd.vic.gov.au/localgovernment/publications-and-research/asset-management-and-financial.
IPWEA, 2006, International Infrastructure Management Manual, Institute of Public Works Engineering Australia, Sydney, www.ipwea.org.au.
IPWEA, 2008, NAMS.PLUS Asset Management Institute of Public Works Engineering Australia, Sydney, www.ipwea.org.au/namsplus
IPWEA, 2009, Australian Infrastructure Financial Management Guidelines, Institute of Public Works Engineering Australia, Sydney, www.ipwea.org.au/AIFMG.
IPWEA, 2011, Asset Management for Small, Rural or Remote Communities Practice Note No. 4, Institute of Public Works Engineering Australia, Sydney, www.ipwea.org.au/AM4SRRC.
IPWEA, 2011, International Infrastructure Management Manual, Institute of Public Works Engineering Australia, Sydney, www.ipwea.org.au.
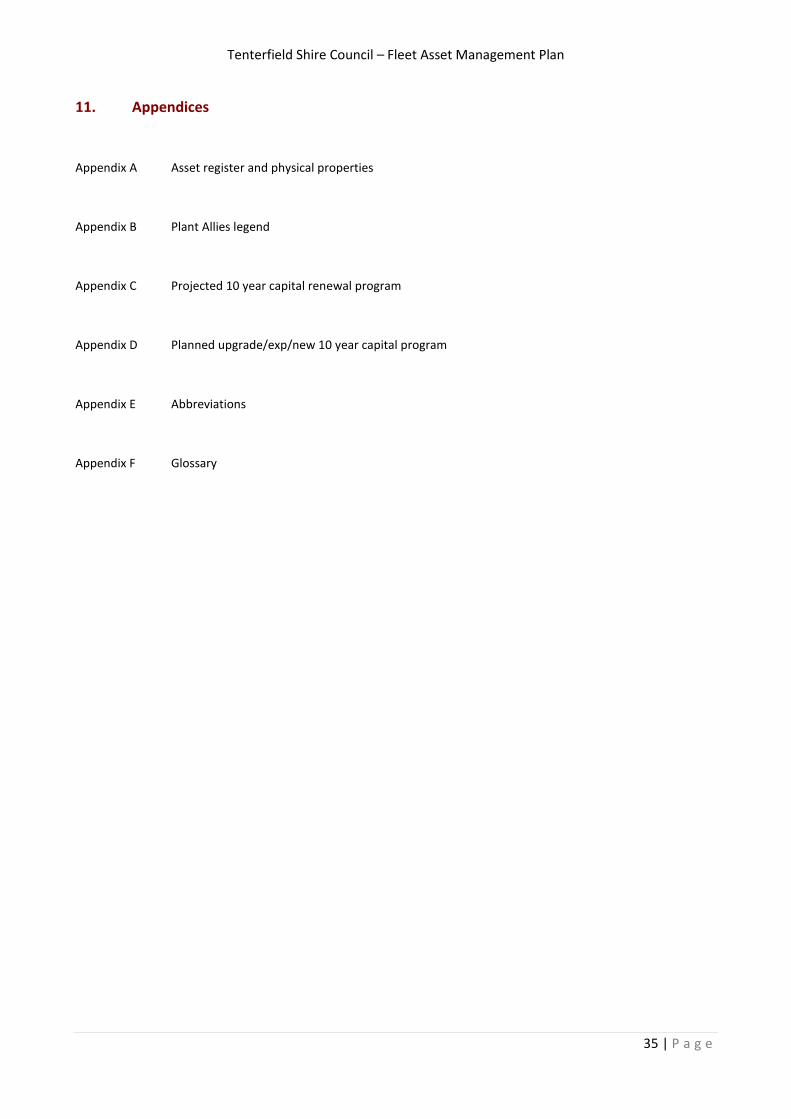
Tenterfield Shire Council – Fleet Asset Management Plan
35 | P a g e
11. Appendices
Appendix A Asset register and physical properties
Appendix B Plant Allies legend
Appendix C Projected 10 year capital renewal program
Appendix D Planned upgrade/exp/new 10 year capital program
Appendix E Abbreviations
Appendix F Glossary
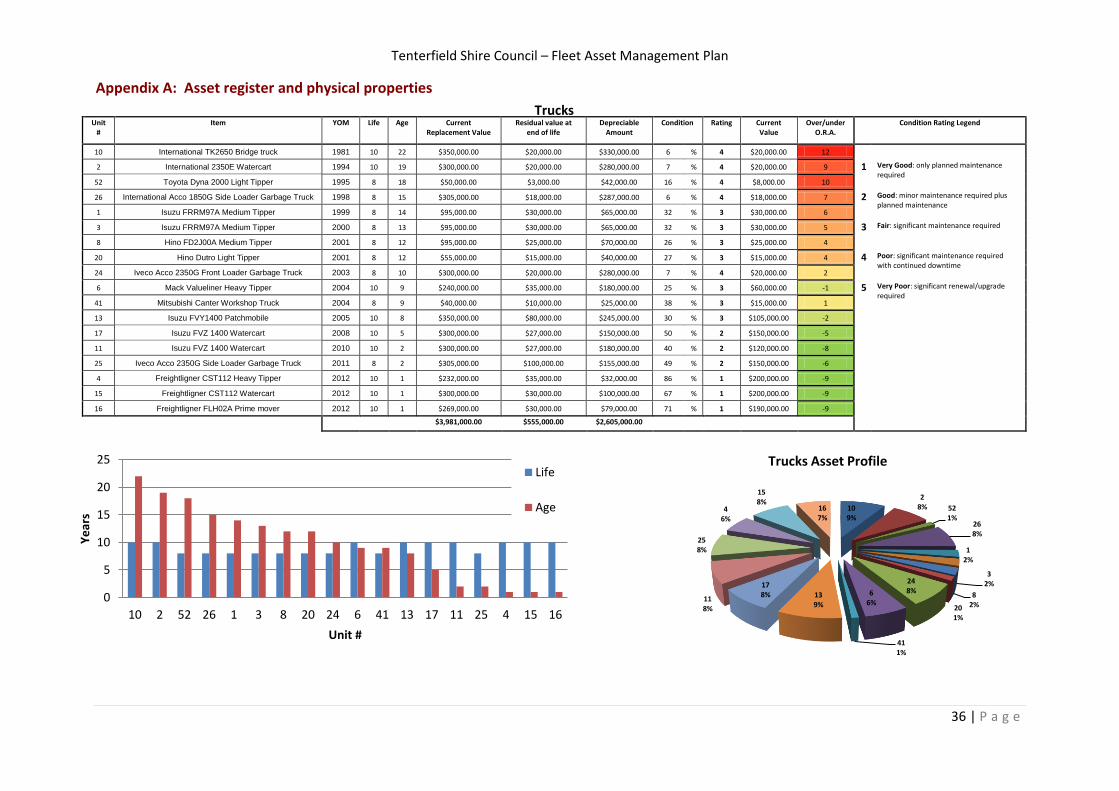
Tenterfield Shire Council – Fleet Asset Management Plan
36 | P a g e
Appendix A: Asset register and physical properties
Trucks Unit
# Item YOM Life Age Current
Replacement Value Residual value at
end of life Depreciable
Amount Condition Rating Current
Value Over/under
O.R.A. Condition Rating Legend
10 International TK2650 Bridge truck 1981 10 22 $350,000.00 $20,000.00 $330,000.00 6 % 4 $20,000.00 12
2 International 2350E Watercart 1994 10 19 $300,000.00 $20,000.00 $280,000.00 7 % 4 $20,000.00 9 1 Very Good: only planned maintenance required
52 Toyota Dyna 2000 Light Tipper 1995 8 18 $50,000.00 $3,000.00 $42,000.00 16 % 4 $8,000.00 10
26 International Acco 1850G Side Loader Garbage Truck 1998 8 15 $305,000.00 $18,000.00 $287,000.00 6 % 4 $18,000.00 7 2 Good: minor maintenance required plus planned maintenance
1 Isuzu FRRM97A Medium Tipper 1999 8 14 $95,000.00 $30,000.00 $65,000.00 32 % 3 $30,000.00 6
3 Isuzu FRRM97A Medium Tipper 2000 8 13 $95,000.00 $30,000.00 $65,000.00 32 % 3 $30,000.00 5 3 Fair: significant maintenance required
8 Hino FD2J00A Medium Tipper 2001 8 12 $95,000.00 $25,000.00 $70,000.00 26 % 3 $25,000.00 4
20 Hino Dutro Light Tipper 2001 8 12 $55,000.00 $15,000.00 $40,000.00 27 % 3 $15,000.00 4 4 Poor: significant maintenance required with continued downtime
24 Iveco Acco 2350G Front Loader Garbage Truck 2003 8 10 $300,000.00 $20,000.00 $280,000.00 7 % 4 $20,000.00 2
6 Mack Valueliner Heavy Tipper 2004 10 9 $240,000.00 $35,000.00 $180,000.00 25 % 3 $60,000.00 -1 5 Very Poor: significant renewal/upgrade required
41 Mitsubishi Canter Workshop Truck 2004 8 9 $40,000.00 $10,000.00 $25,000.00 38 % 3 $15,000.00 1
13 Isuzu FVY1400 Patchmobile 2005 10 8 $350,000.00 $80,000.00 $245,000.00 30 % 3 $105,000.00 -2
17 Isuzu FVZ 1400 Watercart 2008 10 5 $300,000.00 $27,000.00 $150,000.00 50 % 2 $150,000.00 -5
11 Isuzu FVZ 1400 Watercart 2010 10 2 $300,000.00 $27,000.00 $180,000.00 40 % 2 $120,000.00 -8
25 Iveco Acco 2350G Side Loader Garbage Truck 2011 8 2 $305,000.00 $100,000.00 $155,000.00 49 % 2 $150,000.00 -6
4 Freightligner CST112 Heavy Tipper 2012 10 1 $232,000.00 $35,000.00 $32,000.00 86 % 1 $200,000.00 -9
15 Freightligner CST112 Watercart 2012 10 1 $300,000.00 $30,000.00 $100,000.00 67 % 1 $200,000.00 -9
16 Freightligner FLH02A Prime mover 2012 10 1 $269,000.00 $30,000.00 $79,000.00 71 % 1 $190,000.00 -9 $3,981,000.00 $555,000.00 $2,605,000.00
13178%
258%
46%
158%
167%
Trucks Asset Profile
Total Asset Value $3,331,000.
0
5
10
15
20
25
10 2 52 26 1 3 8 20 24 6 41 13 17 11 25 4 15 16
Ye
ars
Unit #
Life
Age 109%
28% 52
1%268%
12%
32%
82%20
1%
248%6
6%
411%
139%
178%
118%
258%
46%
158%
167%
Trucks Asset Profile
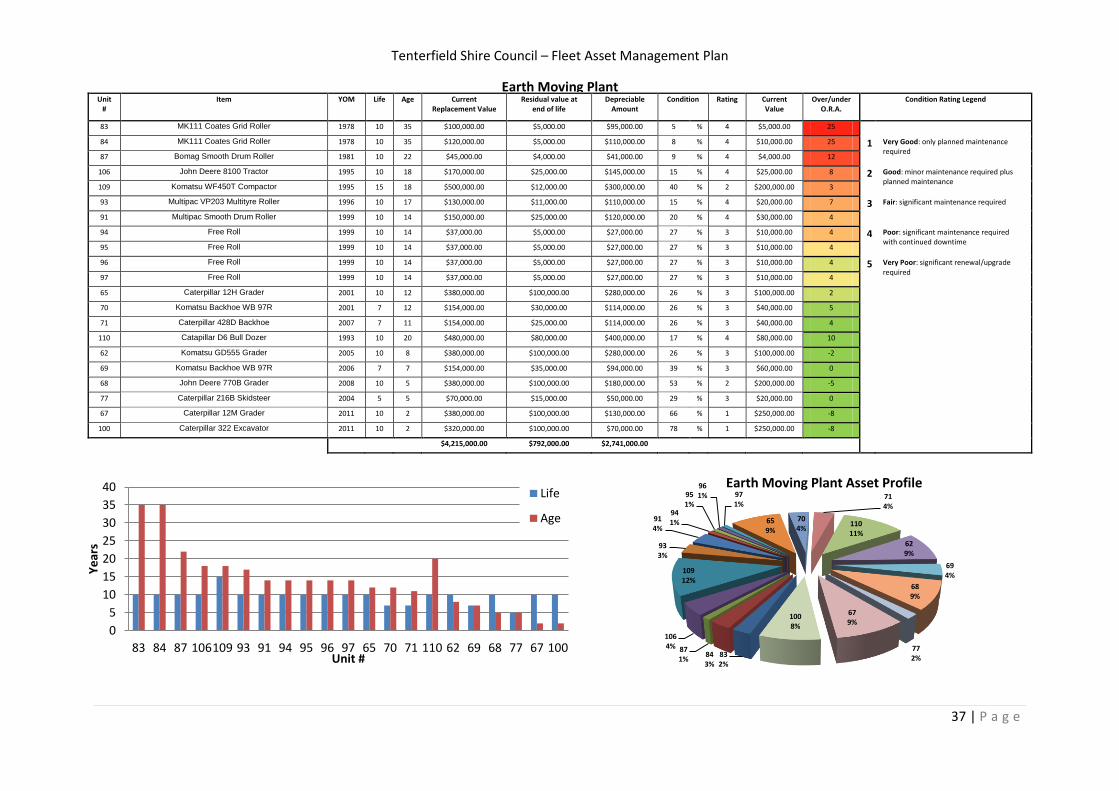
Tenterfield Shire Council – Fleet Asset Management Plan
37 | P a g e
Earth Moving Plant Unit
# Item YOM Life Age Current
Replacement Value Residual value at
end of life Depreciable
Amount Condition Rating Current
Value Over/under
O.R.A. Condition Rating Legend
83 MK111 Coates Grid Roller 1978 10 35 $100,000.00 $5,000.00 $95,000.00 5 % 4 $5,000.00 25
84 MK111 Coates Grid Roller 1978 10 35 $120,000.00 $5,000.00 $110,000.00 8 % 4 $10,000.00 25 1 Very Good: only planned maintenance required
87 Bomag Smooth Drum Roller 1981 10 22 $45,000.00 $4,000.00 $41,000.00 9 % 4 $4,000.00 12
106 John Deere 8100 Tractor 1995 10 18 $170,000.00 $25,000.00 $145,000.00 15 % 4 $25,000.00 8 2 Good: minor maintenance required plus planned maintenance
109 Komatsu WF450T Compactor 1995 15 18 $500,000.00 $12,000.00 $300,000.00 40 % 2 $200,000.00 3
93 Multipac VP203 Multityre Roller 1996 10 17 $130,000.00 $11,000.00 $110,000.00 15 % 4 $20,000.00 7 3 Fair: significant maintenance required
91 Multipac Smooth Drum Roller 1999 10 14 $150,000.00 $25,000.00 $120,000.00 20 % 4 $30,000.00 4
94 Free Roll 1999 10 14 $37,000.00 $5,000.00 $27,000.00 27 % 3 $10,000.00 4 4 Poor: significant maintenance required with continued downtime
95 Free Roll 1999 10 14 $37,000.00 $5,000.00 $27,000.00 27 % 3 $10,000.00 4
96 Free Roll 1999 10 14 $37,000.00 $5,000.00 $27,000.00 27 % 3 $10,000.00 4 5 Very Poor: significant renewal/upgrade required
97 Free Roll 1999 10 14 $37,000.00 $5,000.00 $27,000.00 27 % 3 $10,000.00 4
65 Caterpillar 12H Grader 2001 10 12 $380,000.00 $100,000.00 $280,000.00 26 % 3 $100,000.00 2 70 Komatsu Backhoe WB 97R 2001 7 12 $154,000.00 $30,000.00 $114,000.00 26 % 3 $40,000.00 5 71 Caterpillar 428D Backhoe 2007 7 11 $154,000.00 $25,000.00 $114,000.00 26 % 3 $40,000.00 4
110 Catapillar D6 Bull Dozer 1993 10 20 $480,000.00 $80,000.00 $400,000.00 17 % 4 $80,000.00 10 62 Komatsu GD555 Grader 2005 10 8 $380,000.00 $100,000.00 $280,000.00 26 % 3 $100,000.00 -2 69 Komatsu Backhoe WB 97R 2006 7 7 $154,000.00 $35,000.00 $94,000.00 39 % 3 $60,000.00 0 68 John Deere 770B Grader 2008 10 5 $380,000.00 $100,000.00 $180,000.00 53 % 2 $200,000.00 -5 77 Caterpillar 216B Skidsteer 2004 5 5 $70,000.00 $15,000.00 $50,000.00 29 % 3 $20,000.00 0 67 Caterpillar 12M Grader 2011 10 2 $380,000.00 $100,000.00 $130,000.00 66 % 1 $250,000.00 -8
100 Caterpillar 322 Excavator 2011 10 2 $320,000.00 $100,000.00 $70,000.00 78 % 1 $250,000.00 -8
$4,215,000.00 $792,000.00 $2,741,000.00
0
5
10
15
20
25
30
35
40
83 84 87 106109 93 91 94 95 96 97 65 70 71 110 62 69 68 77 67 100
Ye
ars
Unit #
Life
Age
832%
843%
871%
1064%
10912%
933%
914%
941%
951%
961% 97
1%
659%
704%
714%
11011%
629%
694%
689%
772%
679%
1008%
Earth Moving Plant Asset Profile
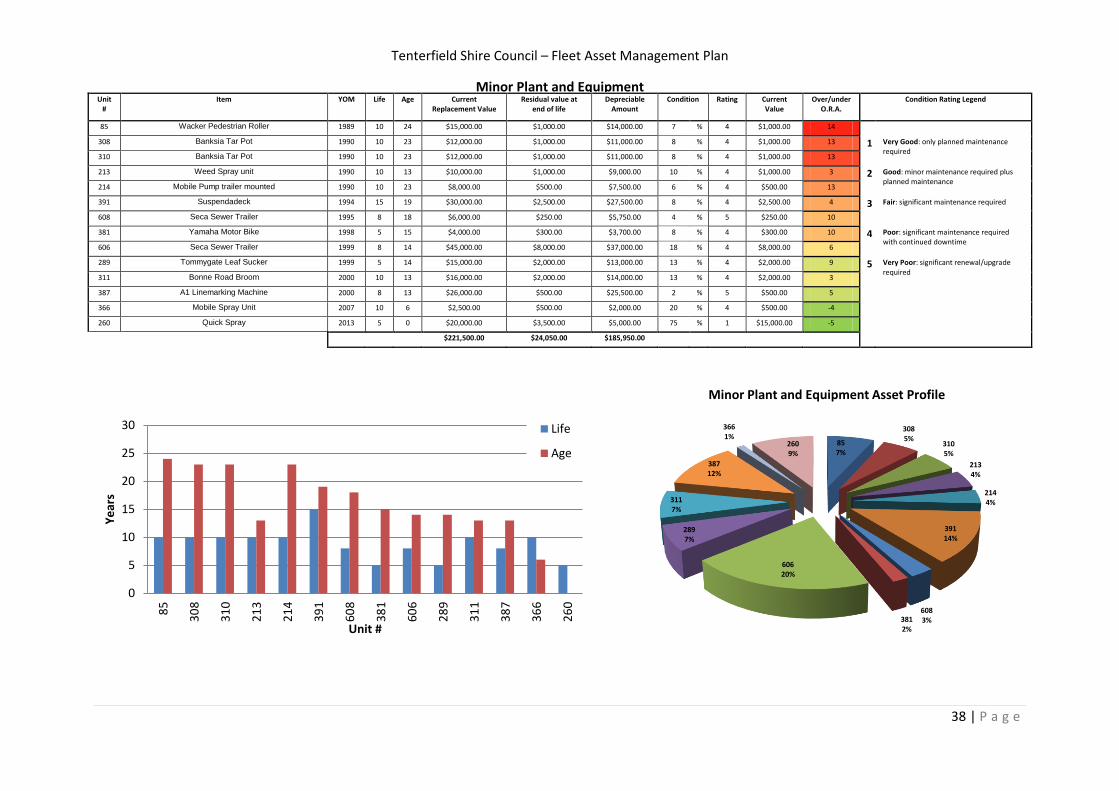
Tenterfield Shire Council – Fleet Asset Management Plan
38 | P a g e
Minor Plant and Equipment Unit
# Item YOM Life Age Current
Replacement Value Residual value at
end of life Depreciable
Amount Condition Rating Current
Value Over/under
O.R.A. Condition Rating Legend
85 Wacker Pedestrian Roller 1989 10 24 $15,000.00 $1,000.00 $14,000.00 7 % 4 $1,000.00 14
308 Banksia Tar Pot 1990 10 23 $12,000.00 $1,000.00 $11,000.00 8 % 4 $1,000.00 13 1 Very Good: only planned maintenance required
310 Banksia Tar Pot 1990 10 23 $12,000.00 $1,000.00 $11,000.00 8 % 4 $1,000.00 13
213 Weed Spray unit 1990 10 13 $10,000.00 $1,000.00 $9,000.00 10 % 4 $1,000.00 3 2 Good: minor maintenance required plus planned maintenance
214 Mobile Pump trailer mounted 1990 10 23 $8,000.00 $500.00 $7,500.00 6 % 4 $500.00 13
391 Suspendadeck 1994 15 19 $30,000.00 $2,500.00 $27,500.00 8 % 4 $2,500.00 4 3 Fair: significant maintenance required
608 Seca Sewer Trailer 1995 8 18 $6,000.00 $250.00 $5,750.00 4 % 5 $250.00 10
381 Yamaha Motor Bike 1998 5 15 $4,000.00 $300.00 $3,700.00 8 % 4 $300.00 10 4 Poor: significant maintenance required with continued downtime
606 Seca Sewer Trailer 1999 8 14 $45,000.00 $8,000.00 $37,000.00 18 % 4 $8,000.00 6
289 Tommygate Leaf Sucker 1999 5 14 $15,000.00 $2,000.00 $13,000.00 13 % 4 $2,000.00 9 5 Very Poor: significant renewal/upgrade required
311 Bonne Road Broom 2000 10 13 $16,000.00 $2,000.00 $14,000.00 13 % 4 $2,000.00 3
387 A1 Linemarking Machine 2000 8 13 $26,000.00 $500.00 $25,500.00 2 % 5 $500.00 5 366 Mobile Spray Unit 2007 10 6 $2,500.00 $500.00 $2,000.00 20 % 4 $500.00 -4 260 Quick Spray 2013 5 0 $20,000.00 $3,500.00 $5,000.00 75 % 1 $15,000.00 -5
$221,500.00 $24,050.00 $185,950.00
0
5
10
15
20
25
30
85
30
8
31
0
21
3
21
4
39
1
60
8
38
1
60
6
28
9
31
1
38
7
36
6
26
0
Ye
ars
Unit #
Life
Age857%
3085%
3105%
2134%
2144%
39114%
6083%381
2%
60620%
2897%
3117%
38712%
3661%
2609%
Minor Plant and Equipment Asset Profile
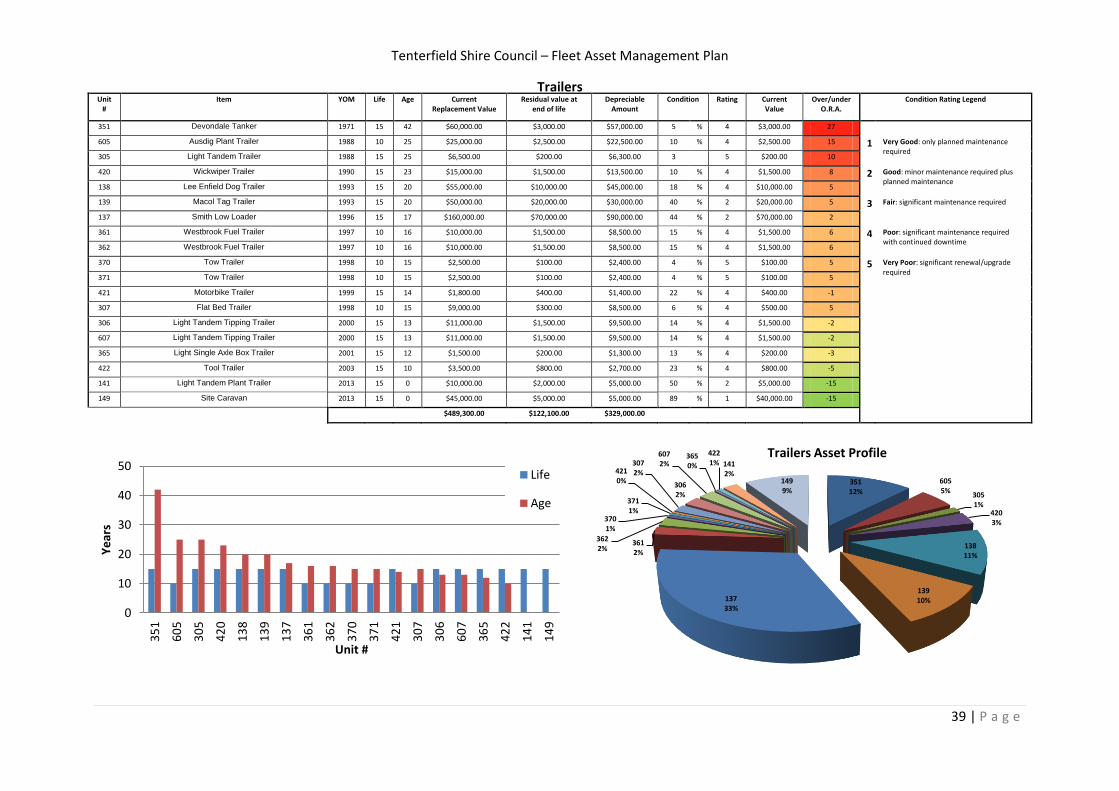
Tenterfield Shire Council – Fleet Asset Management Plan
39 | P a g e
Trailers Unit
# Item YOM Life Age Current
Replacement Value Residual value at
end of life Depreciable
Amount Condition Rating Current
Value Over/under
O.R.A. Condition Rating Legend
351 Devondale Tanker 1971 15 42 $60,000.00 $3,000.00 $57,000.00 5 % 4 $3,000.00 27
605 Ausdig Plant Trailer 1988 10 25 $25,000.00 $2,500.00 $22,500.00 10 % 4 $2,500.00 15 1 Very Good: only planned maintenance required
305 Light Tandem Trailer 1988 15 25 $6,500.00 $200.00 $6,300.00 3
5 $200.00 10
420 Wickwiper Trailer 1990 15 23 $15,000.00 $1,500.00 $13,500.00 10 % 4 $1,500.00 8 2 Good: minor maintenance required plus planned maintenance
138 Lee Enfield Dog Trailer 1993 15 20 $55,000.00 $10,000.00 $45,000.00 18 % 4 $10,000.00 5
139 Macol Tag Trailer 1993 15 20 $50,000.00 $20,000.00 $30,000.00 40 % 2 $20,000.00 5 3 Fair: significant maintenance required
137 Smith Low Loader 1996 15 17 $160,000.00 $70,000.00 $90,000.00 44 % 2 $70,000.00 2
361 Westbrook Fuel Trailer 1997 10 16 $10,000.00 $1,500.00 $8,500.00 15 % 4 $1,500.00 6 4 Poor: significant maintenance required with continued downtime
362 Westbrook Fuel Trailer 1997 10 16 $10,000.00 $1,500.00 $8,500.00 15 % 4 $1,500.00 6 370 Tow Trailer 1998 10 15 $2,500.00 $100.00 $2,400.00 4 % 5 $100.00 5 5 Very Poor: significant renewal/upgrade
required 371 Tow Trailer 1998 10 15 $2,500.00 $100.00 $2,400.00 4 % 5 $100.00 5 421 Motorbike Trailer 1999 15 14 $1,800.00 $400.00 $1,400.00 22 % 4 $400.00 -1
307 Flat Bed Trailer 1998 10 15 $9,000.00 $300.00 $8,500.00 6 % 4 $500.00 5
306 Light Tandem Tipping Trailer 2000 15 13 $11,000.00 $1,500.00 $9,500.00 14 % 4 $1,500.00 -2
607 Light Tandem Tipping Trailer 2000 15 13 $11,000.00 $1,500.00 $9,500.00 14 % 4 $1,500.00 -2
365 Light Single Axle Box Trailer 2001 15 12 $1,500.00 $200.00 $1,300.00 13 % 4 $200.00 -3
422 Tool Trailer 2003 15 10 $3,500.00 $800.00 $2,700.00 23 % 4 $800.00 -5 141 Light Tandem Plant Trailer 2013 15 0 $10,000.00 $2,000.00 $5,000.00 50 % 2 $5,000.00 -15 149 Site Caravan 2013 15 0 $45,000.00 $5,000.00 $5,000.00 89 % 1 $40,000.00 -15
$489,300.00 $122,100.00 $329,000.00
0
10
20
30
40
50
35
1
60
5
30
5
42
0
13
8
13
9
13
7
36
1
36
2
37
0
37
1
42
1
30
7
30
6
60
7
36
5
42
2
14
1
14
9
Ye
ars
Unit #
Life
Age
35112%
6055%
3051%
4203%
13811%
13910%137
33%
3612%
3622%
3701%
3711%
4210%
3072%
3062%
6072%
3650%
4221% 141
2%1499%
Trailers Asset Profile
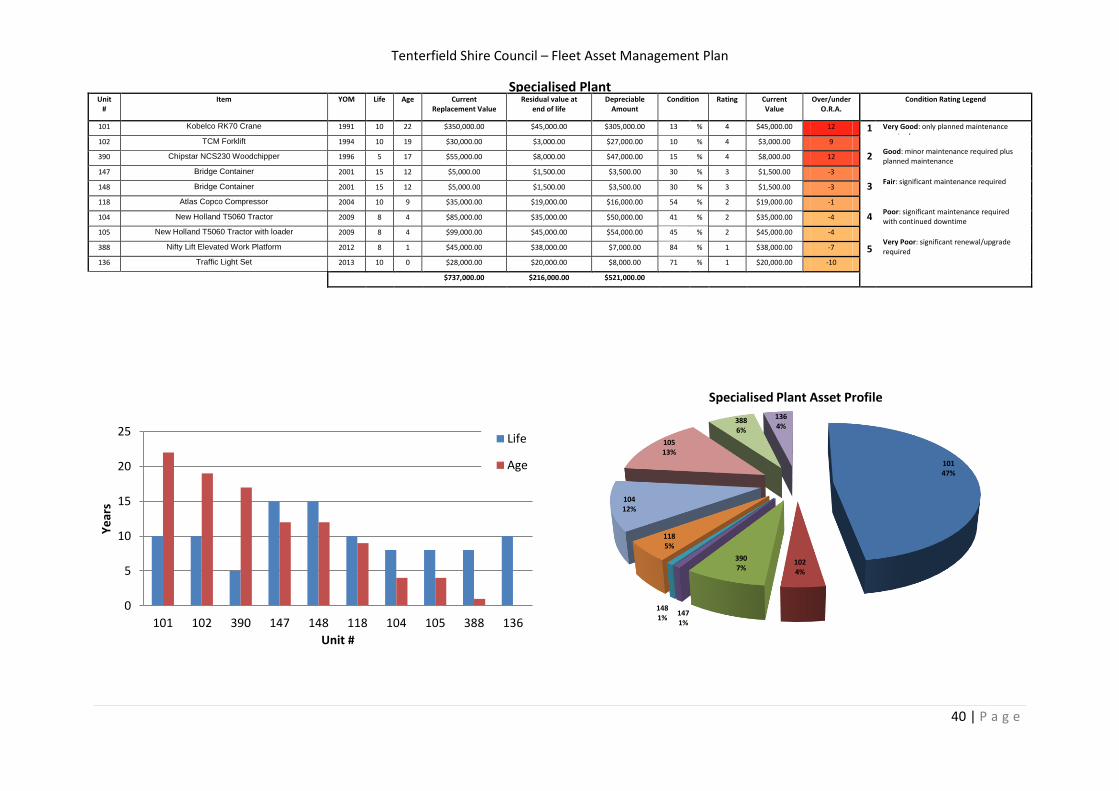
Tenterfield Shire Council – Fleet Asset Management Plan
40 | P a g e
Specialised Plant Unit
# Item YOM Life Age Current
Replacement Value Residual value at
end of life Depreciable
Amount Condition Rating Current
Value Over/under
O.R.A. Condition Rating Legend
101 Kobelco RK70 Crane 1991 10 22 $350,000.00 $45,000.00 $305,000.00 13 % 4 $45,000.00 12 1 Very Good: only planned maintenance required
102 TCM Forklift 1994 10 19 $30,000.00 $3,000.00 $27,000.00 10 % 4 $3,000.00 9 2
Good: minor maintenance required plus planned maintenance
390 Chipstar NCS230 Woodchipper 1996 5 17 $55,000.00 $8,000.00 $47,000.00 15 % 4 $8,000.00 12
147 Bridge Container 2001 15 12 $5,000.00 $1,500.00 $3,500.00 30 % 3 $1,500.00 -3 3
Fair: significant maintenance required
148 Bridge Container 2001 15 12 $5,000.00 $1,500.00 $3,500.00 30 % 3 $1,500.00 -3
118 Atlas Copco Compressor 2004 10 9 $35,000.00 $19,000.00 $16,000.00 54 % 2 $19,000.00 -1 4
Poor: significant maintenance required with continued downtime
104 New Holland T5060 Tractor 2009 8 4 $85,000.00 $35,000.00 $50,000.00 41 % 2 $35,000.00 -4
105 New Holland T5060 Tractor with loader 2009 8 4 $99,000.00 $45,000.00 $54,000.00 45 % 2 $45,000.00 -4 Very Poor: significant renewal/upgrade required
388 Nifty Lift Elevated Work Platform 2012 8 1 $45,000.00 $38,000.00 $7,000.00 84 % 1 $38,000.00 -7 5 136 Traffic Light Set 2013 10 0 $28,000.00 $20,000.00 $8,000.00 71 % 1 $20,000.00 -10
$737,000.00 $216,000.00 $521,000.00
0
5
10
15
20
25
101 102 390 147 148 118 104 105 388 136
Ye
ars
Unit #
Life
Age 10147%
1024%
3907%
1471%
1481%
1185%
10412%
10513%
3886%
1364%
Specialised Plant Asset Profile
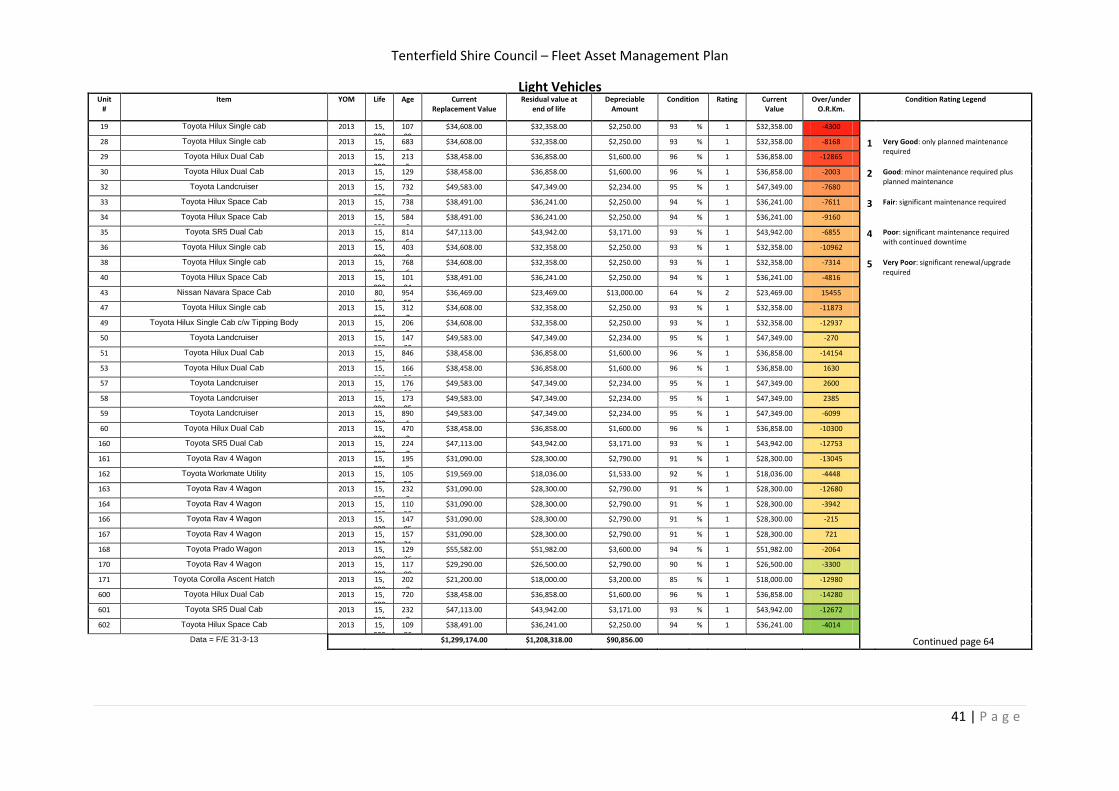
Tenterfield Shire Council – Fleet Asset Management Plan
41 | P a g e
Light Vehicles Unit
# Item YOM Life Age Current
Replacement Value Residual value at
end of life Depreciable
Amount Condition Rating Current
Value Over/under
O.R.Km. Condition Rating Legend
19 Toyota Hilux Single cab 2013 15,000
10700
$34,608.00 $32,358.00 $2,250.00 93 % 1 $32,358.00 -4300
28 Toyota Hilux Single cab 2013 15,000
6832
$34,608.00 $32,358.00 $2,250.00 93 % 1 $32,358.00 -8168 1 Very Good: only planned maintenance required
29 Toyota Hilux Dual Cab 2013 15,000
2135
$38,458.00 $36,858.00 $1,600.00 96 % 1 $36,858.00 -12865
30 Toyota Hilux Dual Cab 2013 15,000
12997
$38,458.00 $36,858.00 $1,600.00 96 % 1 $36,858.00 -2003 2 Good: minor maintenance required plus planned maintenance
32 Toyota Landcruiser 2013 15,000
7320
$49,583.00 $47,349.00 $2,234.00 95 % 1 $47,349.00 -7680
33 Toyota Hilux Space Cab 2013 15,000
7389
$38,491.00 $36,241.00 $2,250.00 94 % 1 $36,241.00 -7611 3 Fair: significant maintenance required
34 Toyota Hilux Space Cab 2013 15,000
5840
$38,491.00 $36,241.00 $2,250.00 94 % 1 $36,241.00 -9160
35 Toyota SR5 Dual Cab 2013 15,000
8145
$47,113.00 $43,942.00 $3,171.00 93 % 1 $43,942.00 -6855 4 Poor: significant maintenance required with continued downtime
36 Toyota Hilux Single cab 2013 15,000
4038
$34,608.00 $32,358.00 $2,250.00 93 % 1 $32,358.00 -10962 38 Toyota Hilux Single cab 2013 15,
000 768
6 $34,608.00 $32,358.00 $2,250.00 93 % 1 $32,358.00 -7314 5 Very Poor: significant renewal/upgrade
required 40 Toyota Hilux Space Cab 2013 15,
000 10184
$38,491.00 $36,241.00 $2,250.00 94 % 1 $36,241.00 -4816 43 Nissan Navara Space Cab 2010 80,
000 95455
$36,469.00 $23,469.00 $13,000.00 64 % 2 $23,469.00 15455
47 Toyota Hilux Single cab 2013 15,000
3127
$34,608.00 $32,358.00 $2,250.00 93 % 1 $32,358.00 -11873
49 Toyota Hilux Single Cab c/w Tipping Body 2013 15,000
2063
$34,608.00 $32,358.00 $2,250.00 93 % 1 $32,358.00 -12937
50 Toyota Landcruiser 2013 15,000
14730
$49,583.00 $47,349.00 $2,234.00 95 % 1 $47,349.00 -270
51 Toyota Hilux Dual Cab 2013 15,000
846 $38,458.00 $36,858.00 $1,600.00 96 % 1 $36,858.00 -14154
53 Toyota Hilux Dual Cab 2013 15,000
16630
$38,458.00 $36,858.00 $1,600.00 96 % 1 $36,858.00 1630
57 Toyota Landcruiser 2013 15,000
17600
$49,583.00 $47,349.00 $2,234.00 95 % 1 $47,349.00 2600
58 Toyota Landcruiser 2013 15,000
17385
$49,583.00 $47,349.00 $2,234.00 95 % 1 $47,349.00 2385
59 Toyota Landcruiser 2013 15,000
8901
$49,583.00 $47,349.00 $2,234.00 95 % 1 $47,349.00 -6099
60 Toyota Hilux Dual Cab 2013 15,000
4700
$38,458.00 $36,858.00 $1,600.00 96 % 1 $36,858.00 -10300
160 Toyota SR5 Dual Cab 2013 15,000
2247
$47,113.00 $43,942.00 $3,171.00 93 % 1 $43,942.00 -12753
161 Toyota Rav 4 Wagon 2013 15,000
1955
$31,090.00 $28,300.00 $2,790.00 91 % 1 $28,300.00 -13045
162 Toyota Workmate Utility 2013 15,000
10552
$19,569.00 $18,036.00 $1,533.00 92 % 1 $18,036.00 -4448
163 Toyota Rav 4 Wagon 2013 15,000
2320
$31,090.00 $28,300.00 $2,790.00 91 % 1 $28,300.00 -12680
164 Toyota Rav 4 Wagon 2013 15,000
11058
$31,090.00 $28,300.00 $2,790.00 91 % 1 $28,300.00 -3942
166 Toyota Rav 4 Wagon 2013 15,000
14785
$31,090.00 $28,300.00 $2,790.00 91 % 1 $28,300.00 -215
167 Toyota Rav 4 Wagon 2013 15,000
15721
$31,090.00 $28,300.00 $2,790.00 91 % 1 $28,300.00 721
168 Toyota Prado Wagon 2013 15,000
12936
$55,582.00 $51,982.00 $3,600.00 94 % 1 $51,982.00 -2064
170 Toyota Rav 4 Wagon 2013 15,000
11700
$29,290.00 $26,500.00 $2,790.00 90 % 1 $26,500.00 -3300
171 Toyota Corolla Ascent Hatch 2013 15,000
2020
$21,200.00 $18,000.00 $3,200.00 85 % 1 $18,000.00 -12980
600 Toyota Hilux Dual Cab 2013 15,000
720 $38,458.00 $36,858.00 $1,600.00 96 % 1 $36,858.00 -14280 601 Toyota SR5 Dual Cab 2013 15,
000 232
8 $47,113.00 $43,942.00 $3,171.00 93 % 1 $43,942.00 -12672
602 Toyota Hilux Space Cab 2013 15,000
10986
$38,491.00 $36,241.00 $2,250.00 94 % 1 $36,241.00 -4014
Data = F/E 31-3-13
$1,299,174.00 $1,208,318.00 $90,856.00
Continued page 64
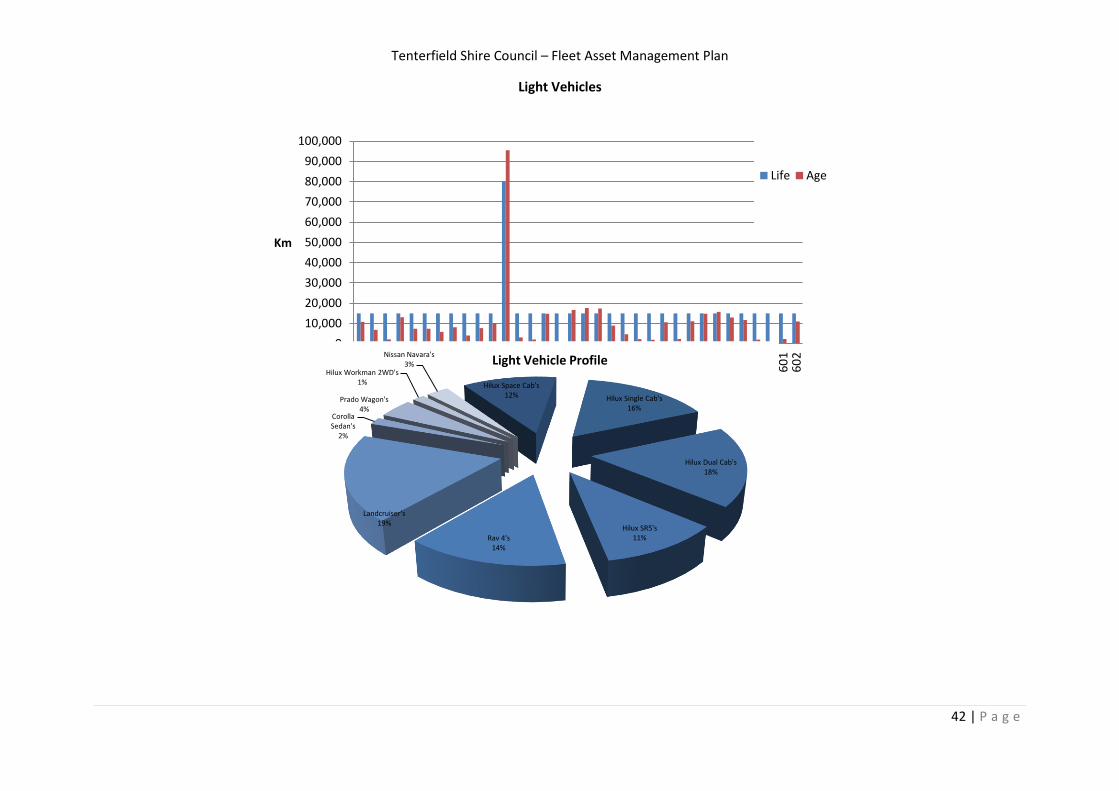
Tenterfield Shire Council – Fleet Asset Management Plan
42 | P a g e
Light Vehicles
0
10,000
20,000
30,000
40,000
50,000
60,000
70,000
80,000
90,000
100,000
19
28
29
30
32
33
34
35
36
38
40
43
47
49
50
51
53
57
58
59
60
16
01
61
16
21
63
16
41
66
16
71
68
17
01
71
60
06
01
60
2
Km
Unit #
Life Age
Hilux Space Cab's12% Hilux Single Cab's
16%
Hilux Dual Cab's18%
Hilux SR5's11%Rav 4's
14%
Landcruiser's19%
Corolla Sedan's
2%
Prado Wagon's4%
Hilux Workman 2WD's1%
Nissan Navara's3% Light Vehicle Profile
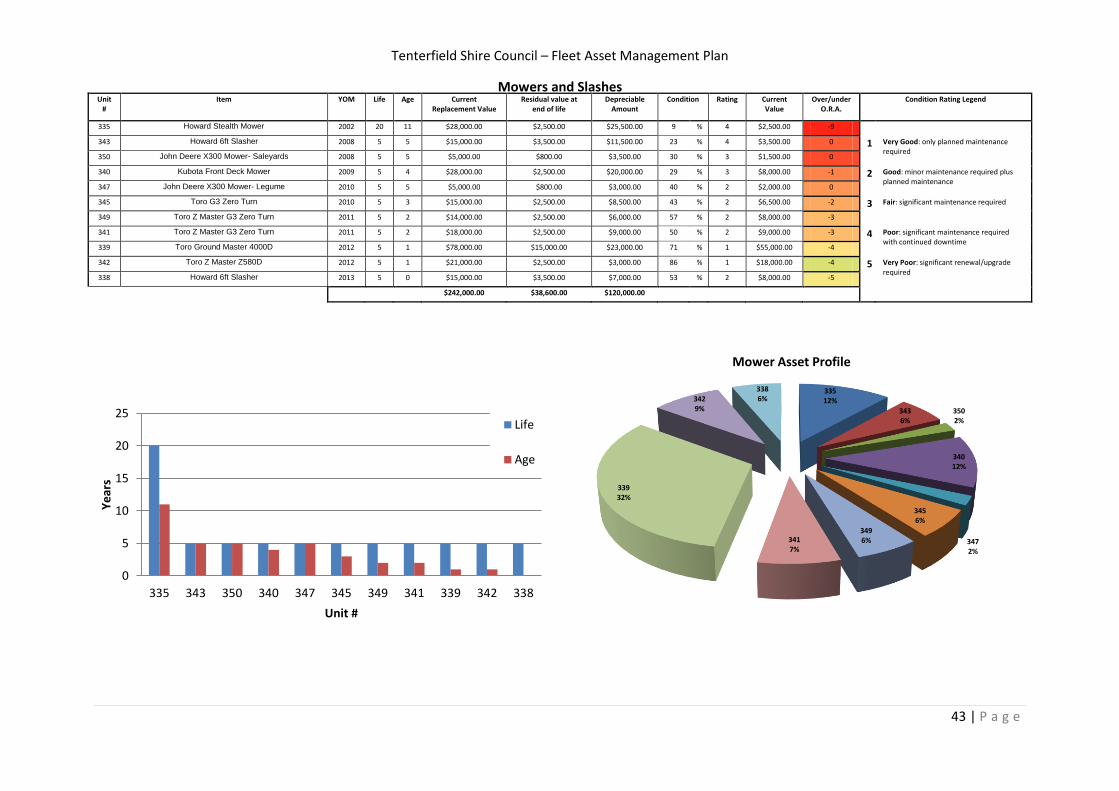
Tenterfield Shire Council – Fleet Asset Management Plan
43 | P a g e
Mowers and Slashes Unit
# Item YOM Life Age Current
Replacement Value Residual value at
end of life Depreciable
Amount Condition Rating Current
Value Over/under
O.R.A. Condition Rating Legend
335 Howard Stealth Mower 2002 20 11 $28,000.00 $2,500.00 $25,500.00 9 % 4 $2,500.00 -9
343 Howard 6ft Slasher 2008 5 5 $15,000.00 $3,500.00 $11,500.00 23 % 4 $3,500.00 0 1 Very Good: only planned maintenance required
350 John Deere X300 Mower- Saleyards 2008 5 5 $5,000.00 $800.00 $3,500.00 30 % 3 $1,500.00 0
340 Kubota Front Deck Mower 2009 5 4 $28,000.00 $2,500.00 $20,000.00 29 % 3 $8,000.00 -1 2 Good: minor maintenance required plus planned maintenance
347 John Deere X300 Mower- Legume 2010 5 5 $5,000.00 $800.00 $3,000.00 40 % 2 $2,000.00 0
345 Toro G3 Zero Turn 2010 5 3 $15,000.00 $2,500.00 $8,500.00 43 % 2 $6,500.00 -2 3 Fair: significant maintenance required
349 Toro Z Master G3 Zero Turn 2011 5 2 $14,000.00 $2,500.00 $6,000.00 57 % 2 $8,000.00 -3
341 Toro Z Master G3 Zero Turn 2011 5 2 $18,000.00 $2,500.00 $9,000.00 50 % 2 $9,000.00 -3 4 Poor: significant maintenance required with continued downtime
339 Toro Ground Master 4000D 2012 5 1 $78,000.00 $15,000.00 $23,000.00 71 % 1 $55,000.00 -4
342 Toro Z Master Z580D 2012 5 1 $21,000.00 $2,500.00 $3,000.00 86 % 1 $18,000.00 -4 5 Very Poor: significant renewal/upgrade required
338 Howard 6ft Slasher 2013 5 0 $15,000.00 $3,500.00 $7,000.00 53 % 2 $8,000.00 -5
$242,000.00 $38,600.00 $120,000.00
0
5
10
15
20
25
335 343 350 340 347 345 349 341 339 342 338
Ye
ars
Unit #
Life
Age
33512%
3436%
3502%
34012%
3472%
3456%
3496%341
7%
33932%
3429%
3386%
Mower Asset Profile
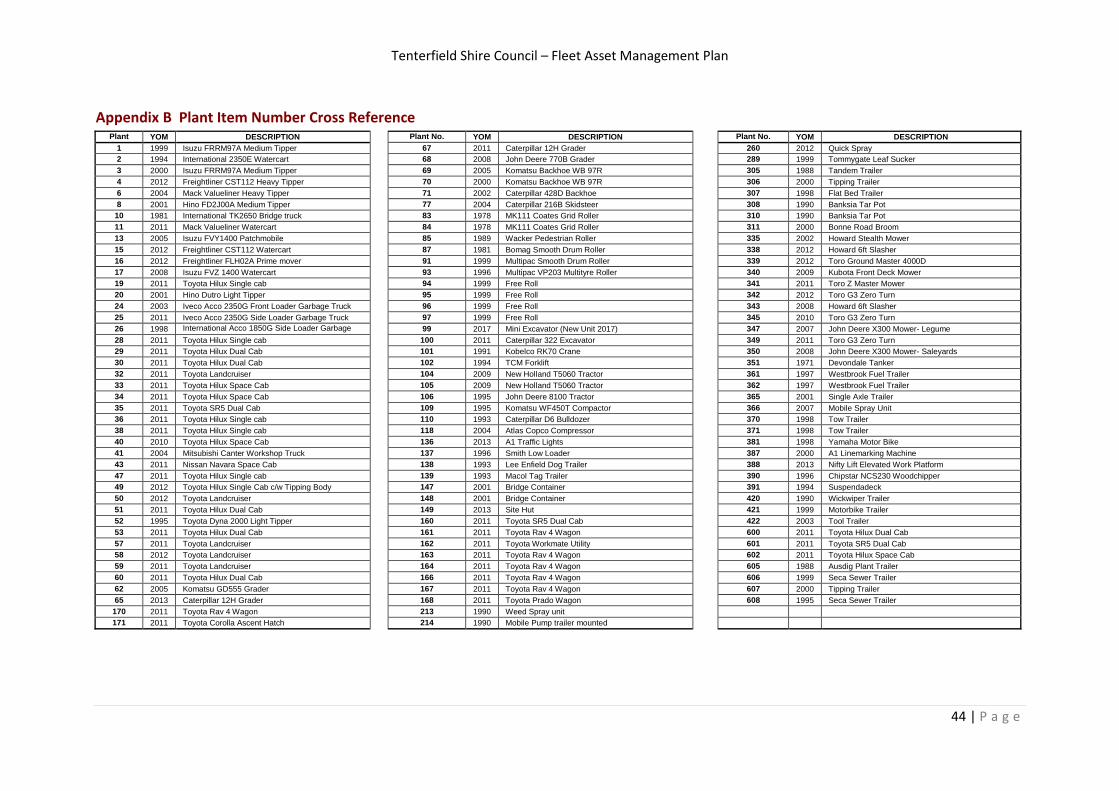
Tenterfield Shire Council – Fleet Asset Management Plan
44 | P a g e
Appendix B Plant Item Number Cross Reference Plant No.
(abbrev)
YOM DESCRIPTION Plant No. (abbrev)
YOM DESCRIPTION Plant No. (abbrev)
YOM DESCRIPTION
1 1999 Isuzu FRRM97A Medium Tipper 67 2011 Caterpillar 12H Grader 260 2012 Quick Spray
2 1994 International 2350E Watercart 68 2008 John Deere 770B Grader 289 1999 Tommygate Leaf Sucker
3 2000 Isuzu FRRM97A Medium Tipper 69 2005 Komatsu Backhoe WB 97R 305 1988 Tandem Trailer
4 2012 Freightliner CST112 Heavy Tipper 70 2000 Komatsu Backhoe WB 97R 306 2000 Tipping Trailer
6 2004 Mack Valueliner Heavy Tipper 71 2002 Caterpillar 428D Backhoe 307 1998 Flat Bed Trailer
8 2001 Hino FD2J00A Medium Tipper 77 2004 Caterpillar 216B Skidsteer 308 1990 Banksia Tar Pot
10 1981 International TK2650 Bridge truck 83 1978 MK111 Coates Grid Roller 310 1990 Banksia Tar Pot
11 2011 Mack Valueliner Watercart 84 1978 MK111 Coates Grid Roller 311 2000 Bonne Road Broom
13 2005 Isuzu FVY1400 Patchmobile 85 1989 Wacker Pedestrian Roller 335 2002 Howard Stealth Mower
15 2012 Freightliner CST112 Watercart 87 1981 Bomag Smooth Drum Roller 338 2012 Howard 6ft Slasher
16 2012 Freightliner FLH02A Prime mover 91 1999 Multipac Smooth Drum Roller 339 2012 Toro Ground Master 4000D
17 2008 Isuzu FVZ 1400 Watercart 93 1996 Multipac VP203 Multityre Roller 340 2009 Kubota Front Deck Mower
19 2011 Toyota Hilux Single cab 94 1999 Free Roll 341 2011 Toro Z Master Mower
20 2001 Hino Dutro Light Tipper 95 1999 Free Roll 342 2012 Toro G3 Zero Turn
24 2003 Iveco Acco 2350G Front Loader Garbage Truck 96 1999 Free Roll 343 2008 Howard 6ft Slasher
25 2011 Iveco Acco 2350G Side Loader Garbage Truck 97 1999 Free Roll 345 2010 Toro G3 Zero Turn
26 1998 International Acco 1850G Side Loader Garbage Truck
99 2017 Mini Excavator (New Unit 2017) 347 2007 John Deere X300 Mower- Legume
28 2011 Toyota Hilux Single cab 100 2011 Caterpillar 322 Excavator 349 2011 Toro G3 Zero Turn
29 2011 Toyota Hilux Dual Cab 101 1991 Kobelco RK70 Crane 350 2008 John Deere X300 Mower- Saleyards
30 2011 Toyota Hilux Dual Cab 102 1994 TCM Forklift 351 1971 Devondale Tanker
32 2011 Toyota Landcruiser 104 2009 New Holland T5060 Tractor 361 1997 Westbrook Fuel Trailer
33 2011 Toyota Hilux Space Cab 105 2009 New Holland T5060 Tractor 362 1997 Westbrook Fuel Trailer
34 2011 Toyota Hilux Space Cab 106 1995 John Deere 8100 Tractor 365 2001 Single Axle Trailer
35 2011 Toyota SR5 Dual Cab 109 1995 Komatsu WF450T Compactor 366 2007 Mobile Spray Unit
36 2011 Toyota Hilux Single cab 110 1993 Caterpillar D6 Bulldozer 370 1998 Tow Trailer
38 2011 Toyota Hilux Single cab 118 2004 Atlas Copco Compressor 371 1998 Tow Trailer
40 2010 Toyota Hilux Space Cab 136 2013 A1 Traffic Lights 381 1998 Yamaha Motor Bike
41 2004 Mitsubishi Canter Workshop Truck 137 1996 Smith Low Loader 387 2000 A1 Linemarking Machine
43 2011 Nissan Navara Space Cab 138 1993 Lee Enfield Dog Trailer 388 2013 Nifty Lift Elevated Work Platform
47 2011 Toyota Hilux Single cab 139 1993 Macol Tag Trailer 390 1996 Chipstar NCS230 Woodchipper
49 2012 Toyota Hilux Single Cab c/w Tipping Body 147 2001 Bridge Container 391 1994 Suspendadeck
50 2012 Toyota Landcruiser 148 2001 Bridge Container 420 1990 Wickwiper Trailer
51 2011 Toyota Hilux Dual Cab 149 2013 Site Hut 421 1999 Motorbike Trailer
52 1995 Toyota Dyna 2000 Light Tipper 160 2011 Toyota SR5 Dual Cab 422 2003 Tool Trailer
53 2011 Toyota Hilux Dual Cab 161 2011 Toyota Rav 4 Wagon 600 2011 Toyota Hilux Dual Cab
57 2011 Toyota Landcruiser 162 2011 Toyota Workmate Utility 601 2011 Toyota SR5 Dual Cab
58 2012 Toyota Landcruiser 163 2011 Toyota Rav 4 Wagon 602 2011 Toyota Hilux Space Cab
59 2011 Toyota Landcruiser 164 2011 Toyota Rav 4 Wagon 605 1988 Ausdig Plant Trailer
60 2011 Toyota Hilux Dual Cab 166 2011 Toyota Rav 4 Wagon 606 1999 Seca Sewer Trailer
62 2005 Komatsu GD555 Grader 167 2011 Toyota Rav 4 Wagon 607 2000 Tipping Trailer
65 2013 Caterpillar 12H Grader 168 2011 Toyota Prado Wagon 608 1995 Seca Sewer Trailer
170 2011 Toyota Rav 4 Wagon 213 1990 Weed Spray unit
171 2011 Toyota Corolla Ascent Hatch 214 1990 Mobile Pump trailer mounted
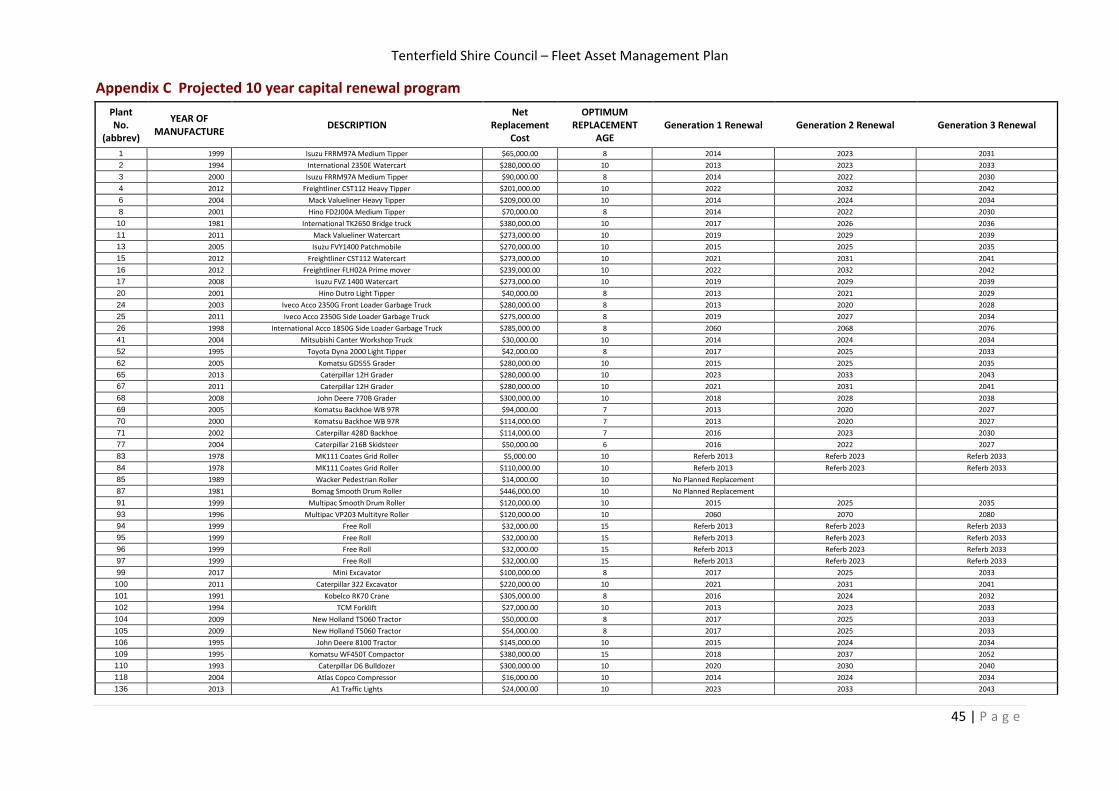
Tenterfield Shire Council – Fleet Asset Management Plan
45 | P a g e
Appendix C Projected 10 year capital renewal program
Plant No.
(abbrev)
YEAR OF MANUFACTURE
DESCRIPTION Net
Replacement Cost
OPTIMUM REPLACEMENT
AGE Generation 1 Renewal Generation 2 Renewal Generation 3 Renewal
1 1999 Isuzu FRRM97A Medium Tipper $65,000.00 8 2014 2023 2031
2 1994 International 2350E Watercart $280,000.00 10 2013 2023 2033
3 2000 Isuzu FRRM97A Medium Tipper $90,000.00 8 2014 2022 2030
4 2012 Freightliner CST112 Heavy Tipper $201,000.00 10 2022 2032 2042
6 2004 Mack Valueliner Heavy Tipper $209,000.00 10 2014 2024 2034
8 2001 Hino FD2J00A Medium Tipper $70,000.00 8 2014 2022 2030
10 1981 International TK2650 Bridge truck $380,000.00 10 2017 2026 2036
11 2011 Mack Valueliner Watercart $273,000.00 10 2019 2029 2039
13 2005 Isuzu FVY1400 Patchmobile $270,000.00 10 2015 2025 2035
15 2012 Freightliner CST112 Watercart $273,000.00 10 2021 2031 2041
16 2012 Freightliner FLH02A Prime mover $239,000.00 10 2022 2032 2042
17 2008 Isuzu FVZ 1400 Watercart $273,000.00 10 2019 2029 2039
20 2001 Hino Dutro Light Tipper $40,000.00 8 2013 2021 2029
24 2003 Iveco Acco 2350G Front Loader Garbage Truck $280,000.00 8 2013 2020 2028
25 2011 Iveco Acco 2350G Side Loader Garbage Truck $275,000.00 8 2019 2027 2034
26 1998 International Acco 1850G Side Loader Garbage Truck $285,000.00 8 2060 2068 2076
41 2004 Mitsubishi Canter Workshop Truck $30,000.00 10 2014 2024 2034
52 1995 Toyota Dyna 2000 Light Tipper $42,000.00 8 2017 2025 2033
62 2005 Komatsu GD555 Grader $280,000.00 10 2015 2025 2035
65 2013 Caterpillar 12H Grader $280,000.00 10 2023 2033 2043
67 2011 Caterpillar 12H Grader $280,000.00 10 2021 2031 2041
68 2008 John Deere 770B Grader $300,000.00 10 2018 2028 2038
69 2005 Komatsu Backhoe WB 97R $94,000.00 7 2013 2020 2027
70 2000 Komatsu Backhoe WB 97R $114,000.00 7 2013 2020 2027
71 2002 Caterpillar 428D Backhoe $114,000.00 7 2016 2023 2030
77 2004 Caterpillar 216B Skidsteer $50,000.00 6 2016 2022 2027
83 1978 MK111 Coates Grid Roller $5,000.00 10 Referb 2013 Referb 2023 Referb 2033
84 1978 MK111 Coates Grid Roller $110,000.00 10 Referb 2013 Referb 2023 Referb 2033
85 1989 Wacker Pedestrian Roller $14,000.00 10 No Planned Replacement
87 1981 Bomag Smooth Drum Roller $446,000.00 10 No Planned Replacement
91 1999 Multipac Smooth Drum Roller $120,000.00 10 2015 2025 2035
93 1996 Multipac VP203 Multityre Roller $120,000.00 10 2060 2070 2080
94 1999 Free Roll $32,000.00 15 Referb 2013 Referb 2023 Referb 2033
95 1999 Free Roll $32,000.00 15 Referb 2013 Referb 2023 Referb 2033
96 1999 Free Roll $32,000.00 15 Referb 2013 Referb 2023 Referb 2033
97 1999 Free Roll $32,000.00 15 Referb 2013 Referb 2023 Referb 2033
99 2017 Mini Excavator $100,000.00 8 2017 2025 2033
100 2011 Caterpillar 322 Excavator $220,000.00 10 2021 2031 2041
101 1991 Kobelco RK70 Crane $305,000.00 8 2016 2024 2032
102 1994 TCM Forklift $27,000.00 10 2013 2023 2033
104 2009 New Holland T5060 Tractor $50,000.00 8 2017 2025 2033
105 2009 New Holland T5060 Tractor $54,000.00 8 2017 2025 2033
106 1995 John Deere 8100 Tractor $145,000.00 10 2015 2024 2034
109 1995 Komatsu WF450T Compactor $380,000.00 15 2018 2037 2052
110 1993 Caterpillar D6 Bulldozer $300,000.00 10 2020 2030 2040
118 2004 Atlas Copco Compressor $16,000.00 10 2014 2024 2034
136 2013 A1 Traffic Lights $24,000.00 10 2023 2033 2043
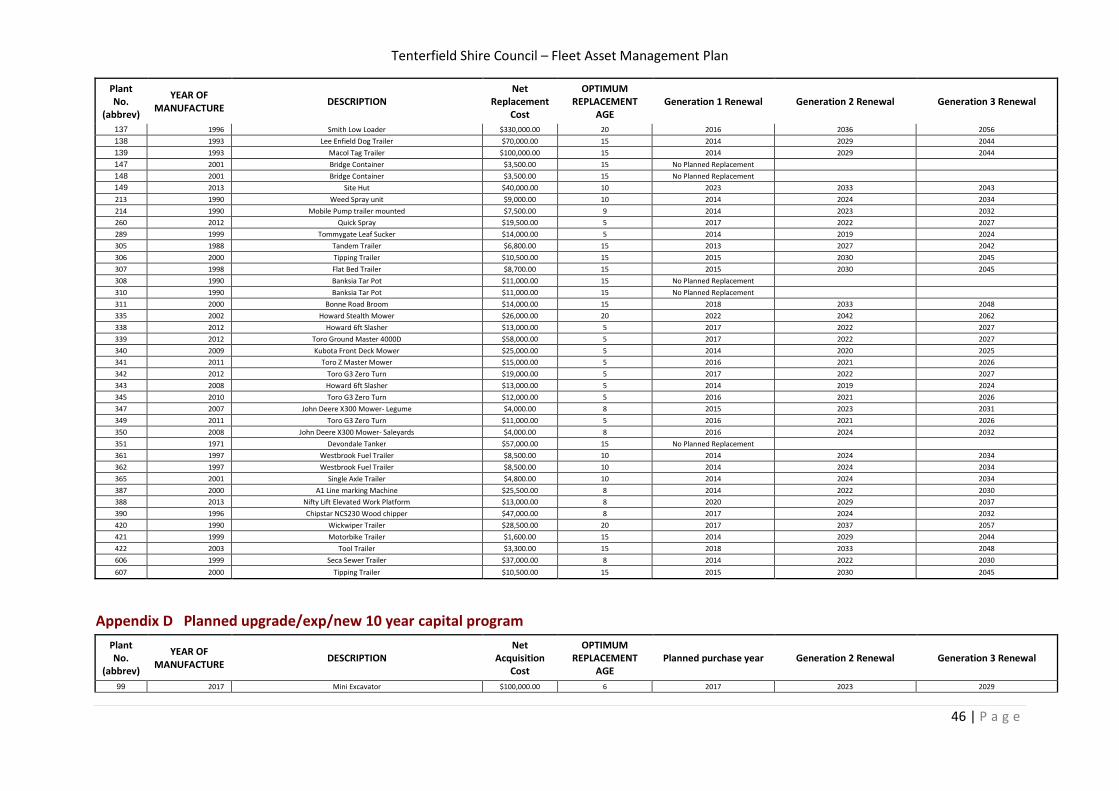
Tenterfield Shire Council – Fleet Asset Management Plan
46 | P a g e
Plant No.
(abbrev)
YEAR OF MANUFACTURE
DESCRIPTION Net
Replacement Cost
OPTIMUM REPLACEMENT
AGE Generation 1 Renewal Generation 2 Renewal Generation 3 Renewal
137 1996 Smith Low Loader $330,000.00 20 2016 2036 2056
138 1993 Lee Enfield Dog Trailer $70,000.00 15 2014 2029 2044
139 1993 Macol Tag Trailer $100,000.00 15 2014 2029 2044
147 2001 Bridge Container $3,500.00 15 No Planned Replacement
148 2001 Bridge Container $3,500.00 15 No Planned Replacement
149 2013 Site Hut $40,000.00 10 2023 2033 2043
213 1990 Weed Spray unit $9,000.00 10 2014 2024 2034
214 1990 Mobile Pump trailer mounted $7,500.00 9 2014 2023 2032
260 2012 Quick Spray $19,500.00 5 2017 2022 2027
289 1999 Tommygate Leaf Sucker $14,000.00 5 2014 2019 2024
305 1988 Tandem Trailer $6,800.00 15 2013 2027 2042
306 2000 Tipping Trailer $10,500.00 15 2015 2030 2045
307 1998 Flat Bed Trailer $8,700.00 15 2015 2030 2045
308 1990 Banksia Tar Pot $11,000.00 15 No Planned Replacement
310 1990 Banksia Tar Pot $11,000.00 15 No Planned Replacement
311 2000 Bonne Road Broom $14,000.00 15 2018 2033 2048
335 2002 Howard Stealth Mower $26,000.00 20 2022 2042 2062
338 2012 Howard 6ft Slasher $13,000.00 5 2017 2022 2027
339 2012 Toro Ground Master 4000D $58,000.00 5 2017 2022 2027
340 2009 Kubota Front Deck Mower $25,000.00 5 2014 2020 2025
341 2011 Toro Z Master Mower $15,000.00 5 2016 2021 2026
342 2012 Toro G3 Zero Turn $19,000.00 5 2017 2022 2027
343 2008 Howard 6ft Slasher $13,000.00 5 2014 2019 2024
345 2010 Toro G3 Zero Turn $12,000.00 5 2016 2021 2026
347 2007 John Deere X300 Mower- Legume $4,000.00 8 2015 2023 2031
349 2011 Toro G3 Zero Turn $11,000.00 5 2016 2021 2026
350 2008 John Deere X300 Mower- Saleyards $4,000.00 8 2016 2024 2032
351 1971 Devondale Tanker $57,000.00 15 No Planned Replacement
361 1997 Westbrook Fuel Trailer $8,500.00 10 2014 2024 2034
362 1997 Westbrook Fuel Trailer $8,500.00 10 2014 2024 2034
365 2001 Single Axle Trailer $4,800.00 10 2014 2024 2034
387 2000 A1 Line marking Machine $25,500.00 8 2014 2022 2030
388 2013 Nifty Lift Elevated Work Platform $13,000.00 8 2020 2029 2037
390 1996 Chipstar NCS230 Wood chipper $47,000.00 8 2017 2024 2032
420 1990 Wickwiper Trailer $28,500.00 20 2017 2037 2057
421 1999 Motorbike Trailer $1,600.00 15 2014 2029 2044
422 2003 Tool Trailer $3,300.00 15 2018 2033 2048
606 1999 Seca Sewer Trailer $37,000.00 8 2014 2022 2030
607 2000 Tipping Trailer $10,500.00 15 2015 2030 2045
Appendix D Planned upgrade/exp/new 10 year capital program
Plant No.
(abbrev)
YEAR OF MANUFACTURE
DESCRIPTION Net
Acquisition Cost
OPTIMUM REPLACEMENT
AGE Planned purchase year Generation 2 Renewal Generation 3 Renewal
99 2017 Mini Excavator $100,000.00 6 2017 2023 2029
Tenterfield Shire Council – Fleet Asset Management Plan
47 | P a g e
Appendix E Abbreviations
AAAC Average annual asset consumption
AMP Asset management plan
ARI Average recurrence interval
BOD Biochemical (biological) oxygen demand
CRC Current replacement cost
CWMS Community wastewater management systems
DA Depreciable amount
EF Earthworks/formation
IRMP Infrastructure risk management plan
LCC Life Cycle cost
LCE Life cycle expenditure
MMS Maintenance management system
PCI Pavement condition index
RNMP Road network management plan
RNAMP Road network asset management plan (this plan)
RV Residual value
SWAMP Stormwater asset management plan
vph Vehicles per hour
Tenterfield Shire Council – Fleet Asset Management Plan
48 | P a g e
Appendix F Glossary
Annual service cost (ASC)
1) Reporting actual cost
The annual (accrual) cost of providing a service including operations, maintenance, depreciation, finance/opportunity and disposal costs less revenue.
2) For investment analysis and budgeting
An estimate of the cost that would be tendered, per annum, if tenders were called for the supply of a service to a performance specification for a fixed term. The Annual Service Cost includes operations, maintenance, depreciation, finance/ opportunity and disposal costs, less revenue.
Asset
A resource controlled by an entity as a result of past events and from which future economic benefits are expected to flow to the entity. Infrastructure assets are a sub-class of property, plant and equipment which are non-current assets with a life greater than 12 months and enable services to be provided.
Asset class
A group of assets having a similar nature or function in the operations of an entity, and which, for purposes of disclosure, is shown as a single item without supplementary disclosure.
Asset condition assessment
The process of continuous or periodic inspection, assessment, measurement and interpretation of the resultant data to indicate the condition of a specific asset so as to determine the need for some preventative or remedial action.
Asset management (AM)
The combination of management, financial, economic, engineering and other practices applied to physical assets with the objective of providing the required level of service in the most cost effective manner.
Average annual asset consumption (AAAC)*
The amount of an organisation’s asset base consumed during a reporting period (generally a year). This may be calculated by dividing the depreciable amount by the useful life (or total future economic benefits/service potential) and totalled for each and every asset OR by dividing the carrying amount (depreciated replacement cost) by the remaining useful life (or remaining future economic benefits/service potential) and totalled for each and every asset in an asset category or class.
Borrowings
A borrowing or loan is a contractual obligation of the borrowing entity to deliver cash or another financial asset to the lending entity over a specified period of time or at a specified point in time, to cover both the initial capital provided and the cost of the interest incurred for providing this capital. A borrowing or loan provides the means for the borrowing entity to finance outlays (typically physical assets) when it has insufficient funds of its own to do so, and for the lending entity to make a financial return, normally in the form of interest revenue, on the funding provided.
Capital expenditure
Relatively large (material) expenditure, which has benefits, expected to last for more than 12 months. Capital expenditure includes renewal, expansion and upgrade. Where capital projects involve a combination of renewal, expansion and/or upgrade expenditures, the total project cost needs to be allocated accordingly.
Capital expenditure - expansion
Expenditure that extends the capacity of an existing asset to provide benefits, at the same standard as is currently enjoyed by existing beneficiaries, to a new group of users. It is discretionary expenditure, which increases future operations and maintenance costs, because it increases the organisation’s asset base, but may be associated with additional revenue from the new user group, eg. extending a drainage or road network, the provision of an oval or park in a new suburb for new residents.
Capital expenditure - new
Expenditure which creates a new asset providing a new service/output that did not exist beforehand. As it increases service potential it may impact revenue and will increase future operations and maintenance expenditure.
Capital expenditure - renewal
Expenditure on an existing asset or on replacing an existing asset, which returns the service capability of the asset up to that which it had originally. It is periodically required expenditure, relatively large (material) in value compared with the value of the components or sub-components of the asset being renewed. As it reinstates existing service potential, it generally has no impact on revenue, but may reduce future operations and maintenance expenditure if completed at the optimum time, eg. resurfacing or resheeting a material part of a road network, replacing a material section of a drainage network with pipes of the same capacity, resurfacing an oval.
Tenterfield Shire Council – Fleet Asset Management Plan
49 | P a g e
Capital expenditure - upgrade
Expenditure, which enhances an existing asset to provide a higher level of service or expenditure that will increase the life of the asset beyond that which it had originally. Upgrade expenditure is discretionary and often does not result in additional revenue unless direct user charges apply. It will increase operations and maintenance expenditure in the future because of the increase in the organisation’s asset base, eg. widening the sealed area of an existing road, replacing drainage pipes with pipes of a greater capacity, enlarging a grandstand at a sporting facility.
Capital funding
Funding to pay for capital expenditure.
Capital grants
Monies received generally tied to the specific projects for which they are granted, which are often upgrade and/or expansion or new investment proposals.
Capital investment expenditure
See capital expenditure definition
Capitalisation threshold
The value of expenditure on non-current assets above which the expenditure is recognised as capital expenditure and below which the expenditure is charged as an expense in the year of acquisition.
Carrying amount
The amount at which an asset is recognised after deducting any accumulated depreciation / amortisation and accumulated impairment losses thereon.
Class of assets
See asset class definition
Component
Specific parts of an asset having independent physical or functional identity and having specific attributes such as different life expectancy, maintenance regimes, risk or criticality.
Cost of an asset
The amount of cash or cash equivalents paid or the fair value of the consideration given to acquire an asset at the time of its acquisition or construction, including any costs necessary to place the asset into service. This includes one-off design and project management costs.
Current replacement cost (CRC)
The cost the entity would incur to acquire the asset on the reporting date. The cost is measured by reference to the lowest cost at which the gross future economic benefits could be obtained in the normal course of business or the minimum it would cost, to replace the existing asset with a technologically modern equivalent new asset (not a second hand one) with the same economic benefits (gross service potential) allowing for any differences in the quantity and quality of output and in operating costs.
Depreciable amount
The cost of an asset, or other amount substituted for its cost, less its residual value.
Depreciated replacement cost (DRC)
The current replacement cost (CRC) of an asset less, where applicable, accumulated depreciation calculated on the basis of such cost to reflect the already consumed or expired future economic benefits of the asset.
Depreciation / amortisation
The systematic allocation of the depreciable amount (service potential) of an asset over its useful life.
Economic life
See useful life definition.
Expenditure
The spending of money on goods and services. Expenditure includes recurrent and capital.
Fair value
The amount for which an asset could be exchanged, or a liability settled, between knowledgeable, willing parties, in an arms length transaction.
Funding gap
A funding gap exists whenever an entity has insufficient capacity to fund asset renewal and other expenditure necessary to be able to appropriately maintain the range and level of services its existing asset stock was originally designed and intended to deliver. The service capability of the existing asset stock should be determined assuming no additional operating revenue, productivity improvements, or net financial liabilities above levels currently planned or projected. A current funding gap means service levels have already or are currently falling. A projected funding gap if not addressed will result in a future diminution of existing service levels.
Heritage asset
An asset with historic, artistic, scientific, technological, geographical or environmental qualities that is held
Tenterfield Shire Council – Fleet Asset Management Plan
50 | P a g e
and maintained principally for its contribution to knowledge and culture and this purpose is central to the objectives of the entity holding it.
Impairment Loss
The amount by which the carrying amount of an asset exceeds its recoverable amount.
Infrastructure assets
Physical assets that contribute to meeting the needs of organisations or the need for access to major economic and social facilities and services, eg. roads, drainage, footpaths and cycleways. These are typically large, interconnected networks or portfolios of composite assets. The components of these assets may be separately maintained, renewed or replaced individually so that the required level and standard of service from the network of assets is continuously sustained. Generally the components and hence the assets have long lives. They are fixed in place and are often have no separate market value.
Investment property
Property held to earn rentals or for capital appreciation or both, rather than for:
(a) use in the production or supply of goods or services or for administrative purposes; or
(b) sale in the ordinary course of business.
Key performance indicator
A qualitative or quantitative measure of a service or activity used to compare actual performance against a standard or other target. Performance indicators commonly relate to statutory limits, safety, responsiveness, cost, comfort, asset performance, reliability, efficiency, environmental protection and customer satisfaction.
Level of service
The defined service quality for a particular service/activity against which service performance may be measured. Service levels usually relate to quality, quantity, reliability, responsiveness, environmental impact, acceptability and cost.
Life Cycle Cost
Total LCC The total cost of an asset throughout its life including planning, design, construction, acquisition, operation, maintenance, rehabilitation and disposal costs.
Average LCC The life cycle cost (LCC) is average cost to provide the service over the longest asset life cycle. It comprises annual operations, maintenance and asset consumption expense, represented by depreciation
expense. The Life Cycle Cost does not indicate the funds required to provide the service in a particular year.
Life Cycle Expenditure
The Life Cycle Expenditure (LCE) is the actual or planned annual operations, maintenance and capital renewal expenditure incurred in providing the service in a particular year. Life Cycle Expenditure may be compared to average Life Cycle Cost to give an initial indicator of life cycle sustainability.
Loans / borrowings
See borrowings.
Maintenance
All actions necessary for retaining an asset as near as practicable to its original condition, including regular ongoing day-to-day work necessary to keep assets operating, e.g. road patching but excluding rehabilitation or renewal. It is operating expenditure required to ensure that the asset reaches its expected useful life.
Planned maintenance
Repair work that is identified and managed through a maintenance management system (MMS). MMS activities include inspection, assessing the condition against failure/breakdown criteria/experience, prioritising scheduling, actioning the work and reporting what was done to develop a maintenance history and improve maintenance and service delivery performance.
• Reactive maintenance
Unplanned repair work that is carried out in response to service requests and management/supervisory directions.
• Significant maintenance
Maintenance work to repair components or replace sub-components that needs to be identified as a specific maintenance item in the maintenance budget.
• Unplanned maintenance
Corrective work required in the short-term to restore an asset to working condition so it can continue to deliver the required service or to maintain its level of security and integrity.
Maintenance and renewal gap
Difference between estimated budgets and projected required expenditures for maintenance and renewal
Tenterfield Shire Council – Fleet Asset Management Plan
51 | P a g e
of assets to achieve/maintain specified service levels, totalled over a defined time (e.g. 5, 10 and 15 years).
Maintenance and renewal sustainability index
Ratio of estimated budget to projected expenditure for maintenance and renewal of assets over a defined time (e.g. 5, 10 and 15 years).
Maintenance expenditure
Recurrent expenditure, which is periodically or regularly required as part of the anticipated schedule of works required to ensure that the asset achieves its useful life and provides the required level of service. It is expenditure, which was anticipated in determining the asset’s useful life.
Materiality
The notion of materiality guides the margin of error acceptable, the degree of precision required and the extent of the disclosure required when preparing general purpose financial reports. Information is material if its omission, misstatement or non-disclosure has the potential, individually or collectively, to influence the economic decisions of users taken on the basis of the financial report or affect the discharge of accountability by the management or governing body of the entity.
Modern equivalent asset
Assets that replicate what is in existence with the most cost-effective asset performing the same level of service. It is the most cost efficient, currently available asset which will provide the same stream of services as the existing asset is capable of producing. It allows for technology changes and, improvements and efficiencies in production and installation techniques
Net present value (NPV)
The value to the organisation of the cash flows associated with an asset, liability, activity or event calculated using a discount rate to reflect the time value of money. It is the net amount of discounted total cash inflows after deducting the value of the discounted total cash outflows arising from e.g. the continued use and subsequent disposal of the asset after deducting the value of the discounted total cash outflows.
Non-revenue generating investments
Investments for the provision of goods and services to sustain or improve services to the community that are not expected to generate any savings or revenue to the Council, eg. parks and playgrounds, footpaths, roads and bridges, libraries, etc.
Operations expenditure
Recurrent expenditure, which is continuously required to provide a service. In common use the term typically includes, e.g. power, fuel, staff, plant equipment, on-costs and overheads but excludes maintenance and depreciation. Maintenance and depreciation is on the other hand included in operating expenses.
Operating expense
The gross outflow of economic benefits, being cash and non cash items, during the period arising in the course of ordinary activities of an entity when those outflows result in decreases in equity, other than decreases relating to distributions to equity participants.
Pavement management system
A systematic process for measuring and predicting the condition of road pavements and wearing surfaces over time and recommending corrective actions.
PMS Score
A measure of condition of a road segment determined from a Pavement Management System.
Rate of annual asset consumption
A measure of average annual consumption of assets (AAAC) expressed as a percentage of the depreciable amount (AAAC/DA). Depreciation may be used for AAAC.
Rate of annual asset renewal
A measure of the rate at which assets are being renewed per annum expressed as a percentage of depreciable amount (capital renewal expenditure/DA).
Rate of annual asset upgrade
A measure of the rate at which assets are being upgraded and expanded per annum expressed as a percentage of depreciable amount (capital upgrade/expansion expenditure/DA).
Recoverable amount
The higher of an asset's fair value, less costs to sell and its value in use.
Recurrent expenditure
Relatively small (immaterial) expenditure or that which has benefits expected to last less than 12 months. Recurrent expenditure includes operations and maintenance expenditure.
Recurrent funding
Funding to pay for recurrent expenditure.
Rehabilitation
See capital renewal expenditure definition above.
Tenterfield Shire Council – Fleet Asset Management Plan
52 | P a g e
Remaining useful life
The time remaining until an asset ceases to provide the required service level or economic usefulness. Age plus remaining useful life is useful life.
Renewal
See capital renewal expenditure definition above.
Renewal sustainability
The proportion of the annual depreciation expense that is covered by renewal of assets = Renewal Expense / Annual Depreciation Cost.
Residual value
The estimated amount that an entity would currently obtain from disposal of the asset, after deducting the estimated costs of disposal, if the asset were already of the age and in the condition expected at the end of its useful life.
Revenue generating investments
Investments for the provision of goods and services to sustain or improve services to the community that are expected to generate some savings or revenue to offset operating costs, e.g. public halls and theatres, childcare centres, sporting and recreation facilities, tourist information centres, etc.
Risk management
The application of a formal process to the range of possible values relating to key factors associated with a risk in order to determine the resultant ranges of outcomes and their probability of occurrence.
Section or segment
A self-contained part or piece of an infrastructure asset.
Service potential
The total future service capacity of an asset. It is normally determined by reference to the operating capacity and economic life of an asset. A measure of service potential is used in the not-for-profit sector/public sector to value assets, particularly those not producing a cash flow.
Service potential remaining
A measure of the future economic benefits remaining in assets. It may be expressed in dollar values (Fair Value) or as a percentage of total anticipated future economic benefits. It is also a measure of the percentage of the asset’s potential to provide services that is still available for use in providing services (Depreciated Replacement Cost/Depreciable Amount).
Strategic Longer-Term Plan
A plan covering the term of office of councillors (4 years minimum) reflecting the needs of the community for the foreseeable future. It brings together the detailed requirements in the council’s longer-term plans such as the asset management plan and the long-term financial plan. The plan is prepared in consultation with the community and details where the council is at that point in time, where it wants to go, how it is going to get there, mechanisms for monitoring the achievement of the outcomes and how the plan will be resourced.
Specific Maintenance
Replacement of higher value components/sub-components of assets that is undertaken on a regular cycle including repainting, building roof replacement, cycle, replacement of air conditioning equipment, etc. This work generally falls below the capital/ maintenance threshold and needs to be identified in a specific maintenance budget allocation.
Sub-component
Smaller individual parts that make up a component part.
Useful life
Either:
(a) the period over which an asset is expected to be available for use by an entity, or
(b) the number of production or similar units expected to be obtained from the asset by the entity.
It is estimated or expected time between placing the asset into service and removing it from service, or the estimated period of time over which the future economic benefits embodied in a depreciable asset, are expected to be consumed by the council.
Value in Use
The present value of future cash flows expected to be derived from an asset or cash generating unit. It is deemed to be depreciated replacement cost (DRC) for those assets whose future economic benefits are not primarily dependent on the asset's ability to generate net cash inflows, where the entity would, if deprived of the asset, replace its remaining future economic benefits.