Embed Size (px)
Citation preview

```
Asset Management in Europe An Overview of the Asset Management Industry November 2020
12th edition Facts and Figures

INTRODUCTION
TABLE OF CONTENTS
1 Asset Management in Europe
Table of Contents Key Findings and Figures .................................................................................................................... 2
Introduction ............................................................................................................................................ 4
1. Role of Third-Party Asset Managers.......................................................................................... 5
1.1. Introduction ................................................................................................................................ 5
1.2. The role of asset management in the economy ................................................................... 6
1.3. A standalone industry ............................................................................................................... 8
2. Assets under Management in Europe ....................................................................................... 9
2.1. Evolution of European AuM .................................................................................................... 9
2.2. AuM in investment funds and discretionary mandates ..................................................... 10
3. Clients of the European Asset Management Industry .......................................................... 13
3.1. Clients at the European level ................................................................................................ 13
3.2. Clients at country level ........................................................................................................... 14
4. Asset Allocation in Europe ........................................................................................................ 16
4.1. Investment portfolios .............................................................................................................. 16
4.2. Asset allocation of investment funds and discretionary mandates ................................. 17
5. Financing of the Euro Area by European Asset Managers .................................................. 19
5.1. Funding contribution of euro area investment funds ......................................................... 19
5.2. Overall funding contribution of asset managers ................................................................ 21
5.3. Financing of the economy outside of the euro area .......................................................... 23
6. Industry Organisation ................................................................................................................. 24
6.1. Asset management companies ............................................................................................ 24
6.2. Profitability ............................................................................................................................... 25
6.3. Employment ............................................................................................................................. 26
Data Annex .......................................................................................................................................... 28
Contacts ............................................................................................................................................... 31
Endnotes .............................................................................................................................................. 31

INTRODUCTION
KEY FINDINGS AND FIGURES
2 Asset Management in Europe
Key Findings and Figures
The role of asset managers
Asset managers help investors manage their savings by offering products and solutions to channel savings into capital market instruments. They select investment opportunities and engage with investee companies to hold companies accountable, not least for their ESG performance.
In this way, they also help the economy by funding new investment projects and providing liquidity to the markets. This generates returns for clients, taking into account the specific risk appetite and investment horizon of each client.
Assets under management in Europe
Assets managed by third-party asset managers in Europe rose continuously between 2012 and 2017, thanks to the strong performance of the financial markets.
The sharp drop in stock markets at the end of 2018 led to a decline in assets under management. AuM rebounded in 2019 but the Covid-19 crisis brutally reversed this trend, which led to an estimated 11% decline in the first quarter of 2020. AuM picked up again in the second quarter.
AuM in European countries
Asset management in Europe is mainly concentrated in six countries where almost 85% of the asset management activity takes place.
The United Kingdom is the largest European asset management market, followed by France, Germany, Switzerland and Italy. The presence of large financial centres can explain the market concentration in these countries. The Netherlands follows in this ranking thanks to the size of Dutch occupational pension funds.
Assets under Management in Europe EUR trillions, percent of GDP
AuM in European Countries at the End of 2018 EUR trillions, percent of total
Key Role of Asset Management in the Economy
INTRODUCTION
KEY FINDINGS AND FIGURES
3 Asset Management in Europe
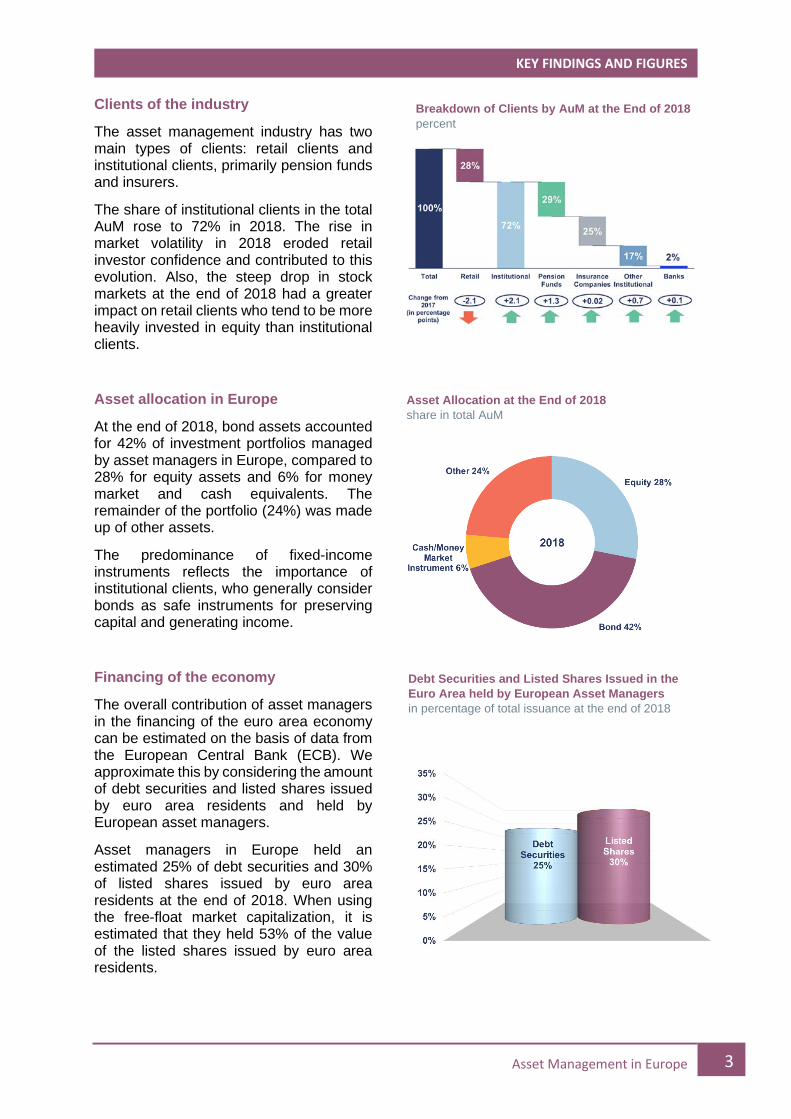
Clients of the industry
The asset management industry has two main types of clients: retail clients and institutional clients, primarily pension funds and insurers.
The share of institutional clients in the total AuM rose to 72% in 2018. The rise in market volatility in 2018 eroded retail investor confidence and contributed to this evolution. Also, the steep drop in stock markets at the end of 2018 had a greater impact on retail clients who tend to be more heavily invested in equity than institutional clients.
Asset allocation in Europe
At the end of 2018, bond assets accounted for 42% of investment portfolios managed by asset managers in Europe, compared to 28% for equity assets and 6% for money market and cash equivalents. The remainder of the portfolio (24%) was made up of other assets.
The predominance of fixed-income instruments reflects the importance of institutional clients, who generally consider bonds as safe instruments for preserving capital and generating income.
Financing of the economy
The overall contribution of asset managers in the financing of the euro area economy can be estimated on the basis of data from the European Central Bank (ECB). We approximate this by considering the amount of debt securities and listed shares issued by euro area residents and held by European asset managers.
Asset managers in Europe held an estimated 25% of debt securities and 30% of listed shares issued by euro area residents at the end of 2018. When using the free-float market capitalization, it is estimated that they held 53% of the value of the listed shares issued by euro area residents.
Breakdown of Clients by AuM at the End of 2018 percent
Asset Allocation at the End of 2018 share in total AuM
Debt Securities and Listed Shares Issued in the Euro Area held by European Asset Managers in percentage of total issuance at the end of 2018

INTRODUCTION
INTRODUCTION
4 Asset Management in Europe
Introduction The EFAMA Asset Management in Europe report provides a precise picture of the European asset management industry, focusing on the countries where assets are managed. It comments on recent developments and outlines the role of asset managers in the economy.
The report is divided into six main sections. Section 1 provides an overview of the role of asset management in the economy, the services they provide to investors and the specificities compared to other financial service institutions. Section 2 highlights the trends in total assets under management (AuM) in Europe, with a breakdown by country and by investment funds and discretionary mandates. Section 3 provides an overview of the industry’s clients, while Section 4 focuses on the asset allocation of European asset managers. Section 5 estimates how much the investment fund industry contributes to the financing of the economy. Finally, Section 6 looks at the industrial organisation of the asset management industry, its profitability and its contribution to the European economy in terms of employment. The report is primarily based on data provided by eighteen EFAMA member associations on the value of the assets managed at the end of 2018: Austria, Belgium, Bulgaria, Croatia, Denmark, France, Germany, Greece, Hungary, Italy, Netherlands, Poland, Portugal, Slovenia, Switzerland, Spain, Turkey and the United Kingdom. Additional internal and external data have been used to estimate the assets managed in the other European countries. The report also provides an estimation of the assets under management in Europe at the end of December 2019 and June 2020. Finally, for the first time, the report presents data from McKinsey on the European asset managers’ share of overall European financial assets, the growth of active/passive investment strategies and the profitability of the industry.

1. ROLE THIRD-PARTY ASSET MANAGERS
1. ROLE OF THIRD-PARTY ASSET MANAGERS
5 Asset Management in Europe
1. Role of Third-Party Asset Managers 1.1. Introduction Third-party asset managers (hereafter "asset managers" for the sake of simplicity) manage assets on behalf of retail and institutional investors to achieve a specific investment goal as set out by their clients, taking into account their investment style preference, risk tolerance and financial situation. Asset management companies are the most important type of buy-side institutions. Other examples of buy-side institutions are pension funds and life insurance companies, which are often clients of asset managers. On the opposite side are sell-side institutions, such as investment banks and brokerage firms. According to McKinsey, the share of European financial assets managed by European asset managers was at 29% at the end of 2019, with EUR 18 trillion being managed for institutional clients and EUR 8 trillion for retail clients.i Since 2010, the share of externally managed financial assets has increased by 5 percentage points. For institutional investors, this share increased from 23% in 2010 to 28% in 2019, while for retail investors it rose from 28% to 34%. In the institutional market, the trend toward greater outsourcing has been buoyed by the lack of opportunities in “vanilla” fixed income, inducing asset owners to search for third party management in fixed income high-yield strategies and alternatives. In the retail market, this trend has been supported by a sustained equity bull market coupled with zero or negative effective rates, which led to an increase in the demand for investment funds.
Looking forward, there remains a massive opportunity for asset managers to increase conversion of unmanaged and internally managed assets, particularly in the institutional market, where internally managed assets reached EUR 48 trillion in 2019. It is also expected that the implementation of the European Commission’s new action plan for the Capital Markets Union, which was presented in September 2020, will lead to a larger number of European households shifting some of their savings from bank accounts to capital market instruments, such as investment funds.
EXHIBIT 1.1 Europe Total Financial Assets EUR trillions
EXHIBIT 1.2 European Financial Assets %Share managed by third-party asset managers
Source: McKinsey & Company Global Growth Cube

1. ROLE THIRD-PARTY ASSET MANAGERS
1. ROLE OF THIRD-PARTY ASSET MANAGERS
6 Asset Management in Europe
1.2. The role of asset management in the economy Channelling savings towards investment A crucial role of asset managers is to channel savings toward investment. Asset managers help investors manage their savings to achieve a specific investment goal. They do so by creating different products and solutions that match investors’ needs and investing with a view to maximising returns while taking into account the different risk appetites of their clients. Linking investors and the real economy By providing equity capital in both primary (IPOs and private placements) and secondary markets, as well as debt financing to corporations and governments, asset managers help these entities meet their short-term funding needs and long-term capital requirements. In this way, they play an important intermediary role in the financial system by funding new investment projects and generating returns to millions of savers and investors.
EXHIBIT 1.3 Key Role of Asset Management in the Economy and the Markets

1. ROLE THIRD-PARTY ASSET MANAGERS
1. ROLE OF THIRD-PARTY ASSET MANAGERS
7 Asset Management in Europe
Serving the needs of investors Asset managers give their clients access to a wide range of traditional and alternative product offerings to diversify their portfolios among various financial instruments, asset classes, industries and geographical locations and achieve their investment goals in a way that might not be available to them otherwise. This yields substantial benefits for the asset managers’ clients.
• Lower investment risk
Asset managers can help reach the right level of diversification for their clients by providing access to a broad range of asset classes. They have access to ample quality research as well as professional databases and software packages that help them reduce risk by monitoring developments in industries, countries and regions in which they invest, with the purpose of screening out bad investment opportunities and detecting advantageous ones.
• Liquidity provision
Asset managers closely monitor the liquidity situation in the markets and the profile of their clients in order to anticipate the evolution of inflows and outflows and the risk of rapid and large net outflows. They also have in place risk management policies and portfolio management procedures to ensure that they can meet their liquidity provision obligation in stressed market conditions.
• Lower costs Asset managers’ ability to trade in large blocks of securities allows them to reduce transaction costs. Taking into consideration that monitoring activities have a cost, asset managers benefit from economies of scale that households and many other investors would find very difficult to achieve.
Engaging and improving the governance of investee companies Asset managers also play an important role as stewards of the companies in which they invest with the aim to maintain and enhance the long-term value of companies for investors. Concerns are communicated through engagement, which includes direct contact with management or boards and voting at shareholder meetings. Divestment is often a last resort, when engagement has failed. More broadly, engagement with investee companies enables asset managers to hold companies accountable, not least for their ESG performance.

1. ROLE THIRD-PARTY ASSET MANAGERS
1. ROLE OF THIRD-PARTY ASSET MANAGERS
8 Asset Management in Europe
1.3. A standalone industry Asset managers exhibit a number of distinguishing features that set them apart from commercial banks, investment banks, insurance companies and pension funds. Four main features help differentiate asset managers from other financial services providers. Agency business model Asset managers are bound by regulation to act in the best interest of their clients and invest in accordance with a predefined set of rules and principles. As such, they owe a number of fiduciary duties to their clients, including duties to exercise reasonable care, to disclose conflicts of interest and to act in good faith. Asset managers must provide the information necessary for investors to make informed decisions and report regularly on how their investments are doing. These fiduciary duties arise as a matter of common law, as a matter of statute and/or as a matter of contract. As a result, investors have a remedy in case of breach of duty and the interests of fund managers and investors are aligned. Limited balance sheet risk Asset managers do not act as providers of credit to individuals or corporations, nor do they provide custody or related services. They do not act as counterparties in derivatives, financing or securities transactions. Moreover, they are bound by specific constraints as to the use of leverage and operations with borrowed money and are required to hold sufficient regulatory capital, all of which under the supervision of the relevant national authority. In this way, there is no asset-liability mismatch on their balance sheets, which are very small compared to the balance sheets of banks and insurance companies. Protection of client assets Asset managers are subject to a robust regulatory framework, which requires them to, among other things, establish comprehensive risk management and compliance policies and procedures. Investment fund assets must generally be entrusted to depositories, which have some oversight responsibilities in addition to the safekeeping of fund assets. In mandated asset management, there is a requirement that client assets be held separately from the firm’s assets. These regulatory regimes protect clients from a liquidation or failure of their asset manager, in particular as the clients’ assets remain outside the reach of the creditors of the asset manager at all times. Fee-based compensation Asset managers generate revenue principally from an agreed-upon fee based on the client’s AuM. This is in contrast with commission-based compensation, in which a firm makes money based on the amount of trades carried out or the amount of assets sold to the client. Fee-based asset management aligns the investor's and adviser's goals as, if the client's assets grow, the compensation of asset managers increases and vice-versa. It also implies that reduced AuM, due to market movements or client withdrawals, results in decreased revenues.

2. ROLE THIRD-PARTY ASSET MANAGERS
2. ASSETS UNDER MANAGEMENT IN EUROPE
9 Asset Management in Europe
2. Assets under Management in Europe 2.1. Evolution of European AuM Assets managed by European asset managers amounted to EUR 23.8 trillion in 2017, an increase of 120% since the end of 2008. Assets rose continuously between 2012 and 2017, thanks to the strong performance of the financial markets and net new money flowing into investment funds and discretionary mandates. In 2018, the sharp drop in stock markets in the fourth quarter led to a decline in AuM but assets rebounded in 2019 due to strong performance in the bond and stock markets. The Covid-19 pandemic in 2020 brutally reversed this. According to our calculations, AuM in Europe fell by 11% during the first quarter of 2020 and then picked up again by 8.3% in the second quarter.ii In relation to European GDP, European AuM rose from 81% at the end of 2008 to 149% at the end of 2019. In 2020, the AuM/GDP is estimated to have slightly fallen during the first quarter before increasing rather sharply during the second quarter thanks to the rebound of stock markets against the background of a severe decline in economic activity.
Asset management in Europe is mainly concentrated in six countries where almost 85% of the asset management activity takes place. The United Kingdom is the largest European asset management market, followed by France, Germany, Switzerland and Italy. The presence of large financial centres can explain the market concentration in these countries. The Netherlands follows in this ranking thanks to the size of Dutch occupational pension funds.iii Asset managers in Denmark, Spain, Belgium and Austria also manage sizeable amounts of assets. The share of the rest of Europe (10.5%) is attributable to other European countries for which no survey data is available, such as Sweden, Luxembourg and Ireland, where asset managers are also active.
EXHIBIT 2.1 European Assets under Management EUR trillions, percent

2. ROLE THIRD-PARTY ASSET MANAGERS
2. ASSETS UNDER MANAGEMENT IN EUROPE
10 Asset Management in Europe
2.2. AuM in investment funds and discretionary mandates Assets managed by professional asset managers can be divided in two broad categories: investment funds (IF) and discretionary mandates (DM).
• Investment funds are regulated funds that pool together savings of investors with similar investment goals. Each fund has its own particular investment objective with corresponding risk levels and asset allocation. Investors can buy or redeem shares of these funds. They offer investors significant advantages in terms of risk diversification, risk-adjusted return and investor protection.
• Discretionary mandates are explicit investment ‘mandates’ delegated to an asset manager by a specific investor. The asset manager receives the sole authority to buy and sell assets and execute transactions on behalf of that investor. The investment strategy in terms of risk profile and asset allocation is agreed beforehand with the client. Discretionary mandates are tailor-made to the precise investment goals of each individual investor. Discretionary mandates are usually only geared towards institutional clients.
Investment fund assets represented EUR 12,614 billion or 54.6% of total AuM at end 2018. The share of discretionary mandate assets in total AuM stood at 45.4% and amounted to EUR 10,482 billion. The share of investment funds in total AuM has steadily risen every year since 2011. The higher share of equity in the portfolio allocation of investment funds compared to discretionary mandates combined with the strong rise of the stock markets over the 2012-2017 period are the main reasons behind this evolution.
EXHIBIT 2.2 European Assets under Management at the End of 2018

2. ROLE THIRD-PARTY ASSET MANAGERS
2. ASSETS UNDER MANAGEMENT IN EUROPE
11 Asset Management in Europe
The split between investment funds and discretionary mandates varies significantly across European countries. Whereas discretionary mandates accounted for 13% of total AuM in Germany at end 2019, their share reached 45% on average in Europe and 60% in the UK. Several factors explain these differences: the role played by institutional investors in different countries, the degree of specialisation of the local asset management industry in the management of investment funds and discretionary portfolios, and the degree of use of investment funds or mandates by institutional investors. For instance, institutional investors in Germany and the Netherlands mainly use Alternative Investment Funds (AIFs) to manage their assets, whereas institutional investors tend to rely more on discretionary mandates in France and the UK.
EXHIBIT 2.3 Discretionary Mandates Vs Investment Funds
AuM at End of 2018 (EUR billions, percent)
Evolution of AuM (share in total AuM)
EXHIBIT 2.4 Discretionary Mandates and Investment Fund Assets at the End of 2018 share in total AuM

2. ROLE THIRD-PARTY ASSET MANAGERS
2. ASSETS UNDER MANAGEMENT IN EUROPE
12 Asset Management in Europe
At the end of 2018, more than 75% of European investment fund assets were managed in five countries: the UK (27%), France (18%), Germany (15%), Switzerland (9%) and the Netherlands (7%). iv v AuM of discretionary mandates are even more concentrated, with 67% of assets being managed in the UK and France at the end of 2018. The 50% market share of the UK is directly related to the high amount of pension fund assets that are being managed by asset managers located in the UK. The 17% market share held by asset managers located in France reflects the size of the French insurance industry and the high level of delegation by French and foreign institutional investors to asset managers.vi
EXHIBIT 2.5 IF and DM AuM by Geographical Breakdown at the End of 2018 EUR billion and share in total AuM
Investment Funds Discretionary Mandates

3. ROLE THIRD-PARTY ASSET MANAGERS
3. CLIENTS OF THE EUROPEAN ASSET MANAGEMENT INDUSTRY
13 Asset Management in Europe
3. Clients of the European Asset Management Industry 3.1. Clients at the European level The asset management industry has two main types of clients: retail clients, who are mainly household investors and high net worth individuals (HNWI), and institutional clients, who are the most important clients of the industry, as they control large amounts of financial assets and often outsource the management of all, or a large part, of their assets to external asset managers. The main types of institutional clients are pension funds and insurers, whereas other institutional clients include charities, holding companies and large corporations. At the end of 2018, pension funds became for the first time ever the largest category of clients of the industry, with a market share of 29%, ahead of retail clients and insurance companies.
Following the decline caused by the great financial crisis, the share of retail clients rebounded slightly between 2012 and 2017 as a result of two factors: the good performance of the stock and bond markets, which strengthened investor confidence in capital markets, and the ultra-low interest rates offered on bank deposits, which convinced a number of households to invest a higher portion of their assets in investment funds. The share of retail clients declined again in 2018 because the rise in market volatility eroded investor confidence. Also, the steep drop in stock markets at the end of 2018 had a greater impact on retail clients as they tend to be more heavily invested in equity than institutional clients. The shares of pension funds and insurance companies moved in opposite directions in recent years, with the share of pension funds rising and the share of insurance companies steadily declining. Pension funds have a greater exposure to equity than insurance companies, which are subject to Solvency II rules. As a result, pension funds have benefited far more from the good performance of stock markets in 2014-2017 than insurance companies. Furthermore, traditional life insurance contracts became less attractive because of the low interest rate environment, whereas the strengthening of economic activity and job creation following the sovereign debt crisis benefited occupational pension plans.
The increasing share of pension funds as clients of asset managers is also driven by the strong growth of the pension fund sector in the UK. This was a result of the government’s decision, to require all employers to automatically enrol certain staff into a pension scheme and make contributions towards it, starting from October 2012.
EXHIBIT 3.1 Breakdown of Clients by AuM Evolution of Breakdown between Clients
(share in total AuM)
Breakdown of Clients by AuM at End of 2018 (percent)

3. ROLE THIRD-PARTY ASSET MANAGERS
3. CLIENTS OF THE EUROPEAN ASSET MANAGEMENT INDUSTRY
14 Asset Management in Europe
3.2. Clients at country level Zooming in on the asset managers’ client base across Europe, we can again see wide variations among countries. These reflect differences in the role of insurance products in retirement savings, the structure of national pension systems, the role of banks in the distribution of retail investment products, and the cross-border activities of asset managers, including their capacity to attract capital from foreign investors.vii Whereas in most countries, asset managers tend to have a relatively balanced distribution of clients, the European average is heavily skewed towards institutional clients. This is mainly due to the very large institutional client base in the UK (80%) and France (74%), the two European countries with the largest AuM. Asset managers in these countries stand apart by their ability to attract large institutional mandates from pension funds (UK) and insurance companies (France).
Investment funds and discretionary mandates are typically geared towards different types of clients. In the investment fund market, retail clients tend to be the most important clients. However, some institutional clients, specifically pension funds and insurers also invest a significant share of their portfolios into investment funds. This is the case in particular in Germany and Austria, where “Spezialfonds” are very popular investment vehicles dedicated exclusively to insurance companies, pension funds and municipal agencies. Investment funds are also used extensively in French workplace pension schemes and money market funds play an important role in the cash management of many French corporations. In the discretionary mandate market, institutional clients are, so to speak, the only clients, because mandates are usually associated with a substantial minimum investment amount, rendering them unavailable to mainstream retail investors. Another reason is that mandates can offer very specific investment solutions according to the investors’ sophisticated needs, such as asset-liability management, liability driven investments and separation of alpha and beta investment strategies. In general, only large investors in terms of investable assets have such specific investment requirements.
EXHIBIT 3.2 AuM by Type of Client at the End of 2018 share in total AuM

3. ROLE THIRD-PARTY ASSET MANAGERS
3. CLIENTS OF THE EUROPEAN ASSET MANAGEMENT INDUSTRY
15 Asset Management in Europe
Domestic clients are by far the biggest clients of the European asset management industry. Whereas their share in total AuM reached 73% in 2018, in most countries, domestic clients represent an even higher share of AuM. The UK is the exception, with 40% of AuM being managed on behalf of foreign clients. This high percentage confirms the role of London as an international hub from where global asset management companies undertake the actual management of their assets. Also, foreign clients represent a relatively high percentage of AuM in Denmark (35%). Compared to 2017, the overall share of domestic clients in Europe has decreased by 0.6 pp in 2018. This development was driven by decreases in the shares of domestic clients in Germany (3 pp) and France (0.7 pp).
EXHIBIT 3.3 Investment Funds and Discretionary Mandates by Client Type at the End of 2018
Investment Funds by Client Type (share in total investment funds AuM)
Discretionary Mandates by Client Type (share in total discretionary mandates AuM)
EXHIBIT 3.4 Domestic and Foreign Clients at the End of 2018 share in total AuM

4. ROLE THIRD-PARTY ASSET MANAGERS
4. ASSET ALLOCATION IN EUROPE
16 Asset Management in Europe
4. Asset Allocation in Europe 4.1. Investment portfolios The asset allocation of investment portfolios reflects the investment guidelines given by the asset owners and the diverse investment objectives of different types of clients. At the end of 2018, bond assets accounted for 42% of investment portfolios managed by asset managers in Europe, compared to 28% for equity assets and 6% for money market and cash equivalents. The remainder of the portfolio (24%) was made up of other assets. The predominance of fixed-income instruments reflects the importance of institutional clients, who generally consider bonds as safe instruments for preserving capital and generating income. This was even reinforced by the implementation of Solvency II regulatory constraints. The share of bonds and cash/money market instruments in the overall asset allocation has been gradually declining in recent years, benefiting other assets such as real estate and infrastructure assets, hedge funds, structured products, private equity and liability driven investments. This shift was triggered by a search for yield in an environment of extremely low or negative interest rates on a range of sovereign bonds and bank deposits. The fall in stock markets at the end of 2018 led to a sharp fall in the share of equity, from 32% in 2017 to 28%, which benefited bonds (+ 2pp) and other assets (+ 2pp).
EXHIBIT 4.1 Asset Allocation at the End of 2018 share in total AuM
EXHIBIT 4.2 Other Assets: Breakdown
EXHIBIT 4.3 Evolution of Asset Allocation share in total AuM

4. ROLE THIRD-PARTY ASSET MANAGERS
4. ASSET ALLOCATION IN EUROPE
17 Asset Management in Europe
Another important trend is the growing share of passive asset management. Exhibit 4.4 shows that passive asset management has increased its share in long-term AuM by over 4pp since 2007.
4.2. Asset allocation of investment funds and discretionary mandates There are significant differences in the asset allocation of investment funds and discretionary mandates.viii At the end of 2018, equity represented 39% of investment fund assets and only 18% of mandate assets. Conversely, bonds accounted for 52% of mandate assets, compared to 32% in the portfolio holdings of investment funds. This difference is explained by the fact that mandates have an asset allocation much more biased towards bonds, as pension funds and insurance companies need to meet their anticipated liabilities. The share of equity in the portfolio held by investment funds has steadily increased from 2008 to 2017 as a result of the strong growth of the stock markets and the search for yield in an environment of falling interest rates. This trend reversed in 2018, and it is unclear how it will be impacted by the Covid-19 pandemic. This development contrasts with the evolution of the share of equity in the asset mix of mandates, which has been edging down since 2013. As mandates are usually only offered to institutional clients, in particular insurers and pension funds, and given the growth of stock markets, this evolution can be explained by the growing maturity of pension liabilities due to population ageing as well as more stringent regulatory and accounting rules which encouraged institutional investors to avoid volatile assets.
EXHIBIT 4.4 Western European AuM by Investment Style % of total AuM, excluding money market instruments
Source: McKinsey & Company Global Growth Cube

4. ROLE THIRD-PARTY ASSET MANAGERS
4. ASSET ALLOCATION IN EUROPE
18 Asset Management in Europe
EXHIBIT 4.5 Asset Allocation in Investment Funds
Asset Allocation at the End of 2018 (share in total investment funds AuM)
Evolution in Recent Years (share in total investment funds AuM)
EXHIBIT 4.6 Asset Allocation in Discretionary Mandates
Asset Allocation at the End of 2018 (share in total discretionary mandates AuM)
Evolution in Recent Years (share in total discretionary mandates AuM)

5. ROLE THIRD-PARTY ASSET MANAGERS
5. FINANCING OF THE EURO AREA BY EUROPEAN ASSET MANAGERS
19 Asset Management in Europe
5. Financing of the Euro Area by European Asset Managers As explained in Section 1, the asset management industry contributes to the growth of the economy by performing two vital functions in the financial markets: the channelling of savings into investment to help finance the economy and the provision of secondary market liquidity. In order to shed light on the importance of these functions, this section aims at estimating the contribution of European asset managers in the financing of the euro area economy. The first step consisted of collecting ECB data on debt securities and listed shares issued in the euro area and held by investment funds domiciled in the euro area. In a second step we have estimated the specific contribution of discretionary mandates and investment funds domiciled in Europe to the financing of the euro area economy.
5.1. Funding contribution of euro area investment funds Exhibit 5.1 shows that euro area investment funds owned EUR 2.5 trillion of debt securities issued by euro area residents at the end of 2018, which corresponded to 14.5% of the total amount of debt securities issued in the euro area.
In absolute terms, sovereign debt securities represented the most important type of debt securities held by euro area investment funds (EUR 915 billion). However, their most important relative holdings of debt securities relate to the financing of non-financial corporations and Monetary Financial Institutions (MFIs). Almost one third (31.5%) of the debt issued by these corporations was held by euro area investment funds at the end of 2018.
EXHIBIT 5.1 Debt Securities Issued in the Euro Area and Owned by Euro Area Investment Funds at End of 2018 EUR billions, percent
Euro area issuers Securities held by euro-area IF
Total securities issued
Share of euro area IF
General Government 915 7,446 12.3% MFIs 645 4,193 15.4% Non-Financial Corporations 415 1,319 31.5% Other 482 4,005 12.0% Total 2,457 16,962 14.5%
Source: EFAMA calculations based on ECB data
Next to debt markets, equity markets are also important providers of finance to the European economy. According to the ECB, the total market value of listed shares issued by euro area residents at the end of 2018 amounted to EUR 7 trillion. Out of this total, euro area investment funds owned EUR 1.2 trillion, or 16.5%, compared to 14.9% in 2013ix. It can also be seen that the bulk of shares owned by euro area investment funds (82%) were issued by non-financial corporations. Exhibit 5.2 and 5.3 below show that the share of euro area investment funds in the stock of debt securities and listed shares issued by euro area residents has risen since 2013.

5. ROLE THIRD-PARTY ASSET MANAGERS
5. FINANCING OF THE EURO AREA BY EUROPEAN ASSET MANAGERS
20 Asset Management in Europe
EXHIBIT 5.2 Listed Shares Issued in the Euro Area and Owned by Euro Area Investment Funds at End of 2018 EUR billions, percent
Euro area issuers Listed shares held by euro area IF
Total listed shares issued Share of euro area IF
General Government --- --- --- MFIs 86 465 17.8% Non-financial Corporations 949 5,459 17.4%
Other 128 1,109 11.5% Total 1,163 7,033 16.5%
EXHIBIT 5.3 IF ownership in Euro Area Debt Securities and Listed Shares EUR billions
EXHIBIT 5.4 Share of IF Ownership in Issued Securities in the Euro Area percent
Source: EFAMA calculations based on ECB data
End of year Securities held by euro area IF
Total securities issued
Listed shares held by euro area IF
Total listed shares issued
2013 2,063 16,412 848 5,694 2014 2,328 16,445 900 6,016 2015 2,371 16,512 1,084 6,819 2016 2,397 16,614 1,164 7,097 2017 2,464 16,593 1,332 7,963 2018 2,457 16,962 1,163 7,033

5. ROLE THIRD-PARTY ASSET MANAGERS
5. FINANCING OF THE EURO AREA BY EUROPEAN ASSET MANAGERS
21 Asset Management in Europe
Exhibit 5.5 gives an overview of the contribution of euro area investment funds in the financing of the different sectors of the euro area economy. The significant role of the industry in the debt financing of non-financial institutions is most noticeable. It is also apparent that all sectors are benefiting from the financing power of investment funds.
EXHIBIT 5.5 Share of Debt Securities and Listed Shares Owned by the Euro Area Investment Funds in the Total Amount Issued in the Euro Area at End of 2018 in % of total issuance in the euro area
Source: EFAMA calculations based on ECB data
5.2. Overall funding contribution of asset managers Estimating the overall contribution of asset managers to the financing of the euro area is difficult. The challenge is to estimate the holdings of debt and equity issued by euro area residents and held by discretionary mandates and investment funds domiciled in Europe outside the euro area. This information is not available in the ECB database. To address this issue, we have assumed that the share of debt securities and listed shares issued by euro area residents held in the total AuM managed in Europe, i.e. EUR 23.1 trillion, is the same as in the portfolio of euro area investment funds, i.e. 18.4% and 8.7%, respectively. We base this assumption on the fact that the universe of euro area investment funds is large and highly diversified in terms of investment strategies and investors and can therefore provide a proxy for estimating the asset allocation of the pool of assets managed in Europe. We intend to review this assumption in next year’s edition of this report. On this basis, the outstanding amount of debt and equity issued by euro area residents and held by European asset managers can be estimated to be EUR 4,259 billion and EUR 2,124 billion, respectively, at the end of 2018. Using these figures, it can be argued that European asset managers held 25% of the debt securities and 30% of the listed shares issued by euro area residents. Using the free-float market capitalization in the euro area equity universe, it can be estimated that European asset managers held 52.9% of the value of the listed shares issued by euro area companies that were readily available for trading in the market at the end of 2018.

5. ROLE THIRD-PARTY ASSET MANAGERS
5. FINANCING OF THE EURO AREA BY EUROPEAN ASSET MANAGERS
22 Asset Management in Europe
EXHIBIT 5.6 Debt Securities and Listed Shares Issued in the Euro Area and Held by European Asset Managers EUR billions, percent
Securities other than shares Listed shares
Euro area assets held by European asset managers 4,254 2,124
Securities/Listed shares issued by euro area residents 16,962 7,033
Share of European asset managers 25.1% 30.2%
Share in free-float market capitalisation 52.9%
Source: EFAMA calculations based on ECB data, and EURO STOXX Total Market Index for free market capitalisation
Exhibit 5.7 shows that the overall contribution of asset managers in the equity market has been rather stable in recent years, whereas their holdings of debt securities issued by euro area residents has fallen in both relative and absolute terms. The ECB commented this development by noting that “euro area investors significantly stepped up their purchases of foreign debt securities from mid-2014 – when the ECB embarked on comprehensive credit easing measures – to levels not seen since the outbreak of the global financial crisis. Since mid-2014, euro area residents have been persistent net buyers of foreign debt securities, largely in the form of long-term bonds. (…) The rebalancing towards foreign debt securities is in line with the euro area’s persistently negative interest rate differentials vis-à-vis other advanced economies.”x
EXHIBIT 5.7 Shares of European Asset Managers in the Universe of Debt Securities and Shares Issued in the Euro Area in percentage share of total issuance in the euro area
Source: EFAMA calculations based on ECB and in-house data

5. ROLE THIRD-PARTY ASSET MANAGERS
5. FINANCING OF THE EURO AREA BY EUROPEAN ASSET MANAGERS
23 Asset Management in Europe
5.3. Financing of the economy outside of the euro area European asset managers are not only funding the euro area economy, but also economic activity elsewhere in Europe and in the world. Exhibit 5.8 displays the recent trends in the market value of debt securities and listed shares held by euro area investment funds and issued within and outside of the euro area. It can be observed that the funds’ holding of debt securities and listed shares issued outside of the euro area is greater. This has been the case since 2016 in the case of debt securities and goes back to before 2013 for listed shares. This evolution suggests that the investment opportunities appear more promising outside the euro area than inside.
EXHIBIT 5.8 Debt Securities and Listed Shares Held by Investment Funds EUR billions Source: EFAMA calculations based on ECB data

6. ROLE THIRD-PARTY ASSET MANAGERS
6. INDUSTRY ORGANISATION
24 Asset Management in Europe
6. Industry Organisation 6.1. Asset management companies More than 4,500 asset management companies were active in Europe in 2018. The table below shows the number of firms in each country. The UK, France and Germany have the highest number of asset management companies, reflecting the relative importance of London, Paris and Frankfurt as asset management centres and the role played in those markets by independent and specialised asset managers, such as management companies of private equity funds. The relatively high number of asset management companies operating in Ireland and Luxembourg mirrors the role played by these two countries in the cross-border distribution of UCITS and AIFs and the fact that fund houses are required to have a management company in each country where they have funds domiciled. However, most global asset management groups with a fund range in Luxembourg or Ireland do operate under a ‘delegation model’, whereby the investment management functions are not carried out in those countries but in the groups’ asset management centres.
Exhibit 6.1 Number of Asset Management Companies1
Another dimension of the organisation of the European asset management industry is the extent to which asset management firms operate as stand-alone companies, or form part of financial services groups. This varies significantly from country to country. Exhibit 6.2 shows the relative importance of asset management companies belonging to a banking group or an insurance group. The companies that are independent or controlled by other types of financial firms are regrouped in the ‘Other’ category. It is important to note here that these figures relate to the number of firms, and not their AuM.
1 The table shows the number of management companies registered in the countries concerned, except for Austria, Czech Republic, Hungary and Romania where the figures refer to the members of the national trade association. For Ireland, the number refers to the number of UCITS Management Companies and AIF Managers. For Slovenia, the number includes subsidiaries of foreign asset management companies. For the United Kingdom, the number is an estimation.
Country 2018 Country 2018
Austria 22 Luxembourg 291Belgium 70 Malta 121Bulgaria 31 Netherlands 223Croatia 20 Norway 33Cyprus 154 Poland 41
Czech Republic 27 Portugal 65Denmark 58 Romania 23Finland 27 Slovakia 11France 633 Slovenia 6
Germany 372 Spain 119Greece 47 Sweden 101Hungary 26 Switzerland 217Ireland 374 Turkey 54
Italy 257 United Kingdom 1,100Liechtenstein 16 Europe 4,539
6. ROLE THIRD-PARTY ASSET MANAGERS
6. INDUSTRY ORGANISATION
25 Asset Management in Europe
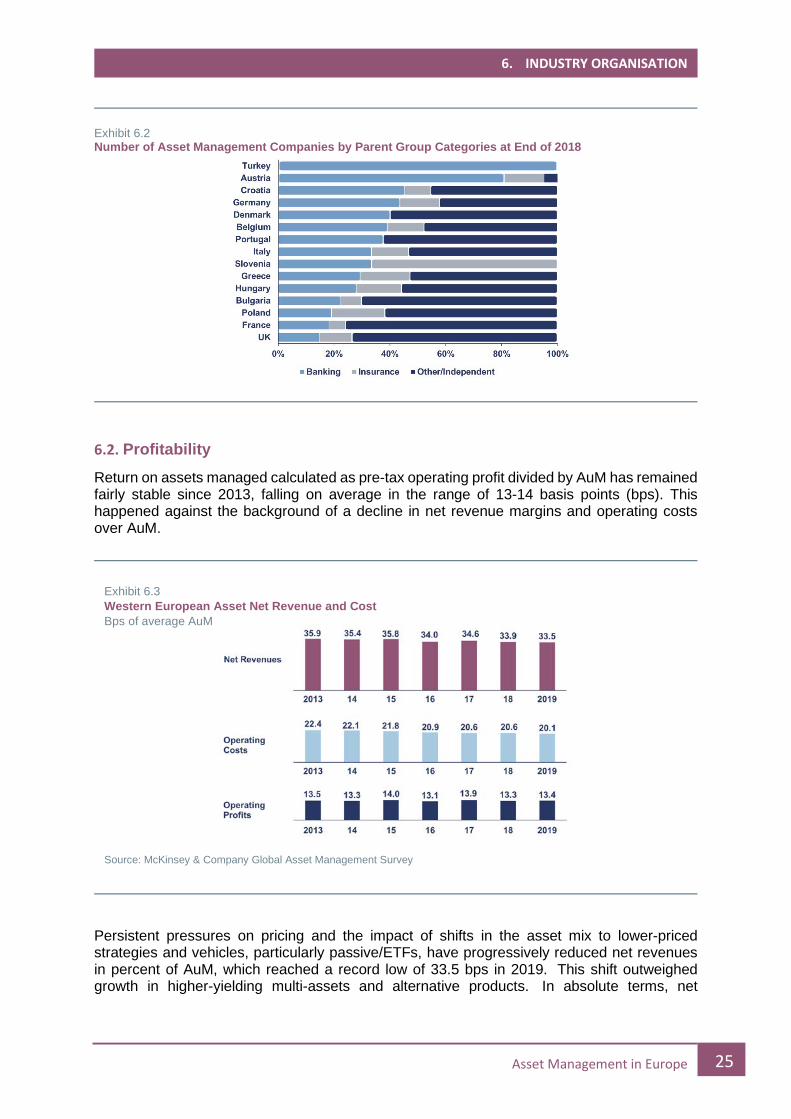
Exhibit 6.2 Number of Asset Management Companies by Parent Group Categories at End of 2018
6.2. Profitability Return on assets managed calculated as pre-tax operating profit divided by AuM has remained fairly stable since 2013, falling on average in the range of 13-14 basis points (bps). This happened against the background of a decline in net revenue margins and operating costs over AuM.
Persistent pressures on pricing and the impact of shifts in the asset mix to lower-priced strategies and vehicles, particularly passive/ETFs, have progressively reduced net revenues in percent of AuM, which reached a record low of 33.5 bps in 2019. This shift outweighed growth in higher-yielding multi-assets and alternative products. In absolute terms, net
Exhibit 6.3 Western European Asset Net Revenue and Cost Bps of average AuM
Source: McKinsey & Company Global Asset Management Survey
6. ROLE THIRD-PARTY ASSET MANAGERS
6. INDUSTRY ORGANISATION
26 Asset Management in Europe
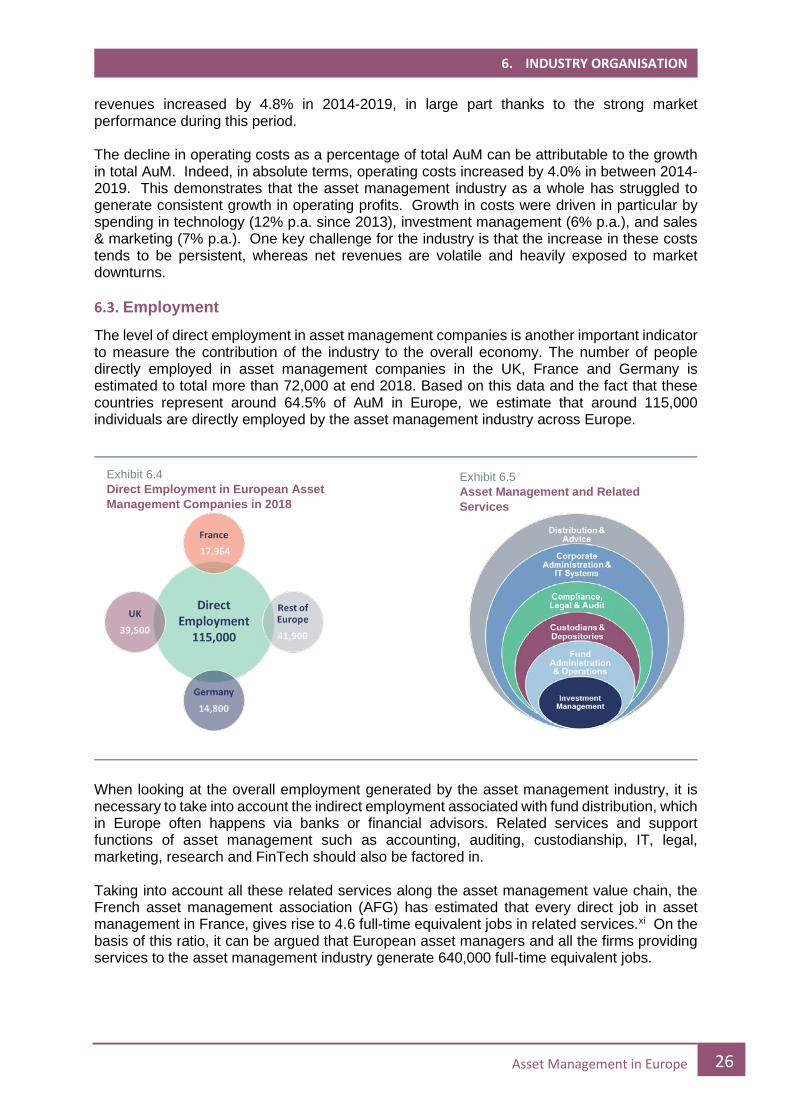
revenues increased by 4.8% in 2014-2019, in large part thanks to the strong market performance during this period. The decline in operating costs as a percentage of total AuM can be attributable to the growth in total AuM. Indeed, in absolute terms, operating costs increased by 4.0% in between 2014-2019. This demonstrates that the asset management industry as a whole has struggled to generate consistent growth in operating profits. Growth in costs were driven in particular by spending in technology (12% p.a. since 2013), investment management (6% p.a.), and sales & marketing (7% p.a.). One key challenge for the industry is that the increase in these costs tends to be persistent, whereas net revenues are volatile and heavily exposed to market downturns. 6.3. Employment The level of direct employment in asset management companies is another important indicator to measure the contribution of the industry to the overall economy. The number of people directly employed in asset management companies in the UK, France and Germany is estimated to total more than 72,000 at end 2018. Based on this data and the fact that these countries represent around 64.5% of AuM in Europe, we estimate that around 115,000 individuals are directly employed by the asset management industry across Europe.
When looking at the overall employment generated by the asset management industry, it is necessary to take into account the indirect employment associated with fund distribution, which in Europe often happens via banks or financial advisors. Related services and support functions of asset management such as accounting, auditing, custodianship, IT, legal, marketing, research and FinTech should also be factored in. Taking into account all these related services along the asset management value chain, the French asset management association (AFG) has estimated that every direct job in asset management in France, gives rise to 4.6 full-time equivalent jobs in related services.xi On the basis of this ratio, it can be argued that European asset managers and all the firms providing services to the asset management industry generate 640,000 full-time equivalent jobs.
Exhibit 6.4 Direct Employment in European Asset Management Companies in 2018
Exhibit 6.5 Asset Management and Related Services

6. ROLE THIRD-PARTY ASSET MANAGERS
6. INDUSTRY ORGANISATION
27 Asset Management in Europe
EXHIBIT 6.6 Total Employment in the European Asset Management Industry in 2018
1 Full-time equivalent jobs.

7. ROLE THIRD-PARTY ASSET MANAGERS
DATA ANNEX
28 Asset Management in Europe
Data Annex
1 End 2018 AuM compared to end 2017 AuM. 2 Spanish data for discretionary mandates is estimated by INVERCO. 3 Austrian data include investment fund assets only. 4 Polish data include investment fund assets only.
1 End 2018 AuM compared to end 2017 AuM.
Country AuM % Δ in 20181 Market Share AuM / GDP
UK 8,609 -1% 37.3% 355%France 4,072 -2% 17.6% 173%
Germany 2,190 1% 9.5% 65%Switzerland 1,912 1% 8.3% 320%
Italy 1,315 2% 5.7% 74%Netherlands 1,207 n.a. 5.2% 156%
Denmark 387 -9% 1.7% 128%
Spain 2 369 -10% 1.6% 31%Belgium 287 -14% 1.2% 62%
Austria 3 131 -7% 0.6% 34%Portugal 78 -5% 0.3% 38%
Poland 4 60 n.a. 0.3% 12%Hungary 29 -6% 0.1% 21%Turkey 22 -14% 0.1% 3%Greece 10 -3% <0.1% 5%Croatia 3 -16% <0.1% 6%
Slovenia 3 -4% <0.1% 6%Bulgaria 1 23% <0.1% 2%
Other 2,414 n.a. 10.5% n.a.Europe 23,096 -3% 100% 132%
A.1: European AuM by Geographical Breakdown at End 2018 (EUR billions and percent)
Country AuM % Δ in 20181 Market Share AuM / GDP
UK 3,401 1% 27.0% 140%France 2,316 -2% 18.4% 98%
Germany 1,911 1% 15.1% 57%Switzerland 1,100 2% 8.7% 184%Netherlands 828 -2% 6.6% 107%
Italy 444 -2% 3.5% 25%Spain 300 -3% 2.4% 25%
Denmark 232 -10% 1.8% 77%Belgium 142 -17% 1.1% 31%Austria 131 -7% 1.0% 34%Poland 60 n.a. 0.5% 12%Portugal 22 -5% 0.2% 11%Turkey 21 -10% 0.2% 3%
Hungary 19 -3% 0.2% 14%Greece 6 -8% <0.1% 3%Croatia 3 -1% <0.1% 6%
Slovenia 2 -5% <0.1% 4%Bulgaria 1 7% <0.1% 1%
Other 1,677 n.a. 13.3% n.a.Europe 12,614 -2% 100% 72%
A.2: Investment Fund Assets by Geographical Breakdown of AuM at End 2018(EUR billions and percent)

7. ROLE THIRD-PARTY ASSET MANAGERS
DATA ANNEX
29 Asset Management in Europe
1 End 2018 AuM compared to end 2017 AuM. 2 Belgian data include unit-linked insurance products and pension funds. 3 Spanish data for discretionary mandates is estimated by INVERCO.
Country AuM % Δ in 20181 Market Share AuM / GDP
UK 5,208 -2% 49.7% 215%France 1,756 -2% 16.8% 75%
Italy 871 4% 8.3% 49%Switzerland 812 0.4% 7.7% 136%Netherlands 379 n.a. 3.6% 49%
Germany 279 1% 2.7% 8%Denmark 155 -7% 1.5% 51%
Belgium 2 145 -10% 1.4% 32%
Spain 3 69 -31% 0.7% 6%Portugal 56 -5% 0.5% 27%Hungary 9 -12% 0.1% 7%Greece 4 3% <0.1% 2%Turkey 2 -40% <0.1% 0.3%
Slovenia 1 1% <0.1% 2%Croatia 0.2 -72% <0.1% 0.4%Bulgaria 0.2 270% <0.1% 0.3%
Other 736 n.a. 7.0% n.a.Europe 10,482 -3% 100% 60%
A.3: Discretionary Mandates by Geographical Breakdown of AuM at End 2018(EUR billions and percent)
Country Net Assets Market Share Net Assets Market Share
UK 3,401 27.0% 1,493 9.8%France 2,316 18.4% 1,822 12.0%
Germany 1,911 15.1% 2,037 13.4%Switzerland 1,100 8.7% 571 3.8%Netherlands 828 6.6% 828 5.4%
Italy 444 3.5% 314 2.1%Spain 300 2.4% 286 1.9%
Denmark 232 1.8% 273 1.8%Belgium 142 1.1% 147 1.0%Austria 131 1.0% 173 1.1%Poland 60 0.5% 60 0.4%
Portugal 22 0.2% 22 0.1%Turkey 21 0.2% 21 0.1%
Hungary 19 0.2% 19 0.1%Greece 6 <0.1% 8 0.1%Croatia 3 <0.1% 3 <0.1%Slovenia 2 <0.1% 3 <0.1%Bulgaria 1 <0.1% 1 <0.1%
Other 1,677 13.3% 7,132 46.9%Europe 12,614 100% 15,212 100%
A.4: Investment Fund Assets at End 2018 - Geographical Breakdown by Country of Management vs. Country of Domiciliation
Investment Funds by Country of Management Investment Funds by Country of Domiciliation
(EUR billions and percent)

7. ROLE THIRD-PARTY ASSET MANAGERS
DATA ANNEX
30 Asset Management in Europe
1 The UK Investment Funds figures includes substantial assets managed in the UK on behalf of overseas-domiciled funds for which an accurate asset allocation breakdown is not available. Estimates have therefore been made by EFAMA for the purposes of this table.
Retail Clients
Country Pension Funds Insurers Banks Other Inst. Total Institutional Total Retail
Austria 14% 12% 6% 22% 54% 46%Belgium 8% 8% 5% 20% 41% 59%Bulgaria 18% 2% 4% 21% 44% 56%Croatia 5% 10% 8% 6% 28% 72%
Denmark 27% 3% 16% 13% 59% 41%France 10% 51% 4% 10% 74% 26%
Germany 14% 25% 6% 14% 59% 41%Greece 30% 17% 1% 7% 54% 46%Hungary 17% 12% 1% 4% 34% 66%
Italy 4% 48% 0% 13% 65% 35%Poland 0% 8% 0% 31% 40% 60%Portugal 17% 41% 2% 22% 81% 19%Slovenia 2% 46% 0% 4% 52% 48%
Spain 4% 5% 1% 6% 16% 84%Turkey 55% 1% 6% 17% 80% 20%
UK 45% 14% 0% 21% 80% 20%Europe 29% 25% 2% 17% 72% 28%
A.5: AuM by Type of Client and Country at End 2018(share in total AuM)
Institutional Clients
Country Equity Bond Cash/MMI Other Equity Bond Cash/
MMI Other Equity Bond Cash/MMI Other
Austria 16% 51% 1% 32% n.a. n.a. n.a. n.a. 16% 51% 1% 32%
Belgium 49% 41% 5% 5% 22% 68% 5% 5% 35% 55% 5% 5%
Bulgaria 46% 24% 25% 4% 23% 75% 2% 0% 42% 34% 21% 3%
Croatia 13% 51% 34% 1% 32% 53% 15% 0% 14% 52% 33% 1%
Denmark 29% 34% 0% 37% 25% 28% 0% 47% 28% 31% 0% 41%
France 26% 18% 23% 32% 8% 85% 1% 5% 18% 50% 13% 19%
Germany 19% 46% 5% 30% 14% 64% 4% 17% 18% 49% 5% 29%
Greece 25% 47% 13% 15% 26% 52% 15% 6% 26% 49% 14% 11%
Hungary 14% 32% 31% 22% 22% 58% 11% 9% 17% 41% 25% 18%
Italy 29% 56% 3% 12% 20% 76% 4% 0% 23% 69% 4% 4%
Poland 10% 40% 0% 50% n.a. n.a. n.a. n.a. 10% 40% 0% 50%
Portugal 14% 21% 10% 55% 10% 77% 11% 1% 11% 65% 11% 13%
Slovenia 66% 21% 7% 5% 16% 73% 2% 9% 53% 35% 6% 6%
Spain 13% 23% 10% 55% 9% 33% 2% 56% 12% 25% 8% 55%
Turkey 13% 55% 24% 8% 2% 38% 34% 26% 12% 53% 25% 10%
UK 1 61% 26% 2% 11% 20% 38% 7% 34% 36% 33% 5% 25%
Europe 39% 32% 7% 23% 18% 52% 6% 25% 28% 42% 6% 24%
A.6: Asset Allocation by Country at End 2018(in percent)
Investment Funds Discretionary Mandates Funds and Mandates

8. ROLE THIRD-PARTY ASSET MANAGERS
CONTACTS AND ENDNOTES
31 Asset Management in Europe
Contacts Bernard Delbecque Senior Director for Economics and Research [email protected]
Vera Jotanovic Senior Economist [email protected]
Thomas Tilley Senior Economist [email protected]
Hailin Yang Statistician [email protected]
Endnotes
i For more information on the clients of the asset management industry, see Section 3. ii As explained in the introduction, the report is primarily based on end 2018 data received from EFAMA member associations. The AuM at end 2019 and end Q1, Q2 2020 have been estimated on the basis of the growth in investment fund assets over the corresponding periods. iii Table A.1 in the data annex contains more information on the AuM per country. iv Table A.2 in the data annex contains more data on the investment fund AuM per country. v Table A.4 in the data annex compares the investment funds managed in various European countries to the investment fund net assets domiciled in the same countries. vi Table A.3 in the data annex contains more information on discretionary mandate assets per country. vii Table A.5 in the data annex contains more data on the AuM by type of client and per country at end 2018. viii Table A.6 in the data annex contains data on the asset allocation of investment funds and discretionary mandates per country. ix The data series for listed shares is available only starting in 2013. x See ECB Economic Bulletin, Issue 3 (2016), Box 4.
xi See AFG publication: CAHIERS DE LA GESTION -2, published September 2011.

European Fund and Asset Management Association Address: Rue Marie-Thérèse 11, 1000 Brussels Tel. +32 2 513 39 69 Fax +32 2 513 26 43 Email : [email protected] Website : www.efama.org
About EFAMA EFAMA is the representative association for the European investment management industry, which represents 28 member associations and 60 corporate members and 24 Associate Members. At Q2 2020, total net assets of European investment funds reached EUR 17.1 trillion. These assets were managed by close to 34,200 UCITS (Undertakings for Collective Investments in Transferable Securities) and 29,100 AIFs (Alternative Investment Funds). Including discretionary mandates, third-party regulated asset managers managed EUR 24.9 trillion in Europe at end Q2 2020. More information available at www.efama.org or follow us on Twitter @EFAMANews or LinkedIn @EFAMA.


![Asset Management in Europe [INFOGRAPHIC]](https://img.pdfslide.us/doc/110x75/54c944834a79596d718b45c1/asset-management-in-europe-infographic.jpg)