Embed Size (px)
Citation preview
Asset Management Approaches to Maximize Effectiveness of Your Stormwater Program
Presenters:Mark VanAuken, PE, CMS4S, ENV SP – Stormwater/MS4 Discipline LeaderCeline Hyer, P.E. – Conveyance Market Sector Leader
Agenda
• Typical Stormwater Asset Work
• Need for Stormwater Asset Management
• Risk-Based Linear Asset Work
• Stormwater Risk-Based Asset Management
• Case Studies
• Questions?

SW Asset Work: Regulatory/Data Driven
• MS4 Permitting• Collection system/outfall
• Water quality focused
• Data/GIS• Stormwater infrastructure
• O&M focused
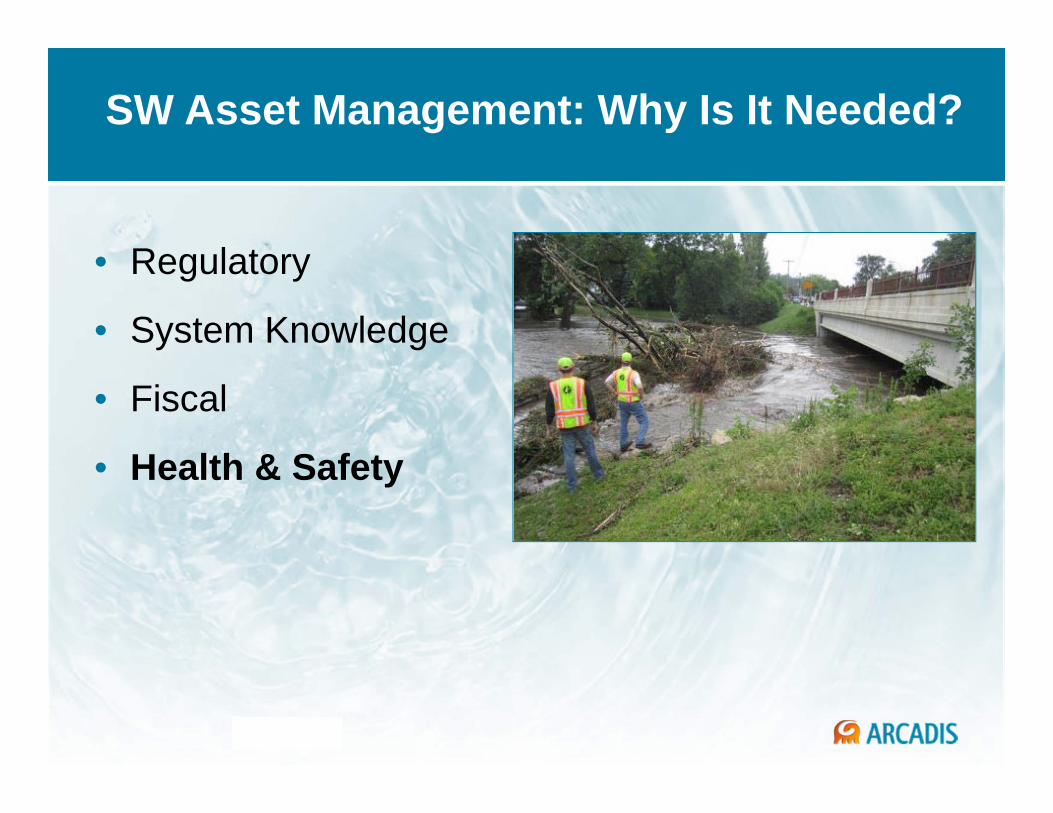
SW Asset Management: Why Is It Needed?
• Regulatory
• System Knowledge
• Fiscal
• Health & Safety

Overriding Issue: Flood Control
NOAA estimates an average of $8.2 Billion in damages from flooding each year in the U.S.
Move to A More Holistic Review
• Water Quality
• Asset Inventory
• Holistic Focus
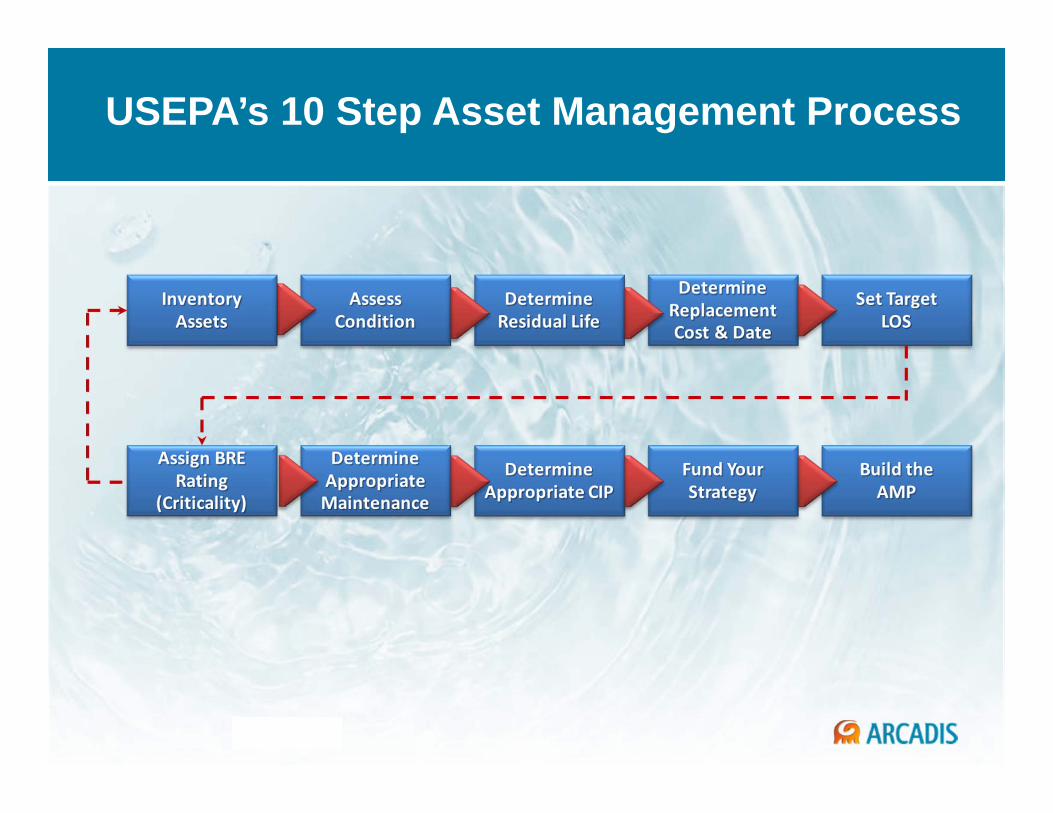
USEPA’s 10 Step Asset Management Process

Risk-Based Asset Management Process for Linear Assets based on EPA 10 Step Process
Inventory Assets
Assess Condition
Assess Criticality
Assign Risk
Determine Remaining Life and Replacement Cost
Set Targets for Service Levels
Determine Maintenance
Program
Determine CIP
Fund the Program
Water and sewer line assessment is well ahead of stormwater
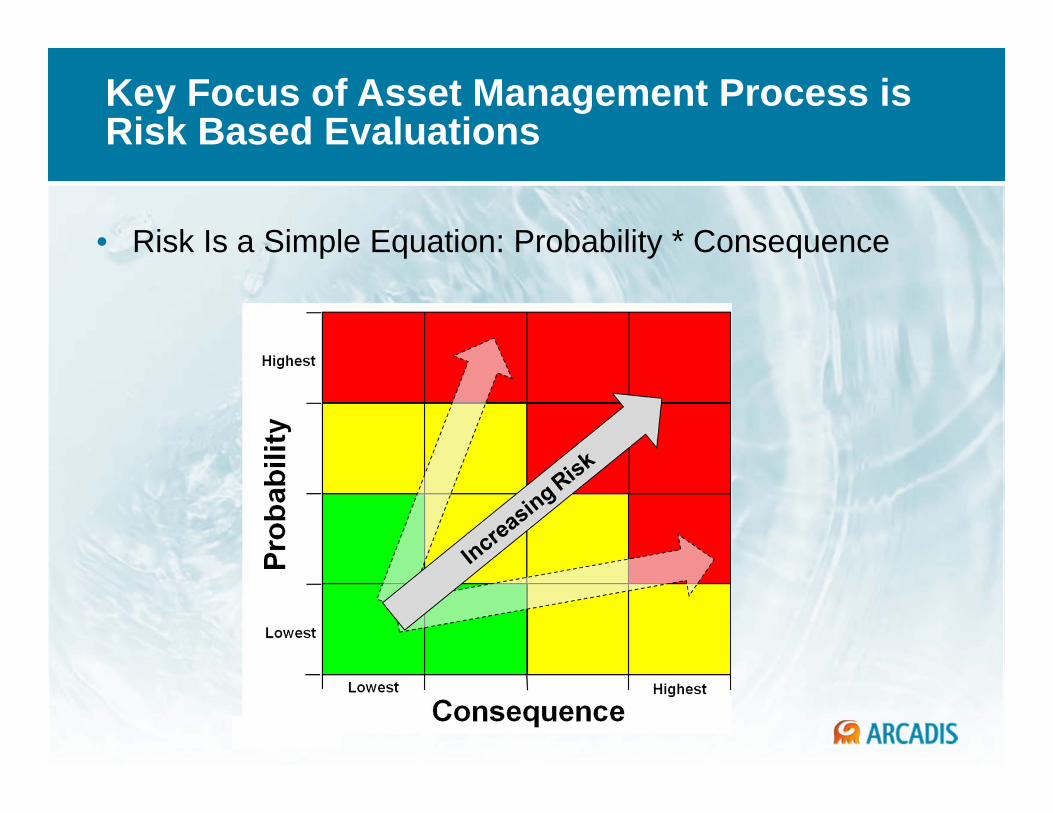
Key Focus of Asset Management Process is Risk Based Evaluations
• Risk Is a Simple Equation: Probability * Consequence

Probability of Failure: Evaluate By Condition Assessment (desktop, visual or testing)
10
Condition Type
Failure Mode Description Assessment
Method
Performance
Capacity Does not meet demand (flow, loading, storage volume, etc.) Test or Desktop
Level of Service
Does not meet functional needs (regulatory permits, customer commitments) Desktop
Efficiency Not lowest cost alternative (labor, maintenance, obsolescence) Desktop
Physical MortalityCurrent state of repair and operation as influenced by age, historical maintenance and operating environment
Test, Visual, Desktop, Modeling

Condition Assessment by Asset Type
• Define Condition Scoring Criteria for Physical and Performance• Pipe/Culvert/Outfall
• Structural, Erosion, Trash, Sedimentation, Odor, Algae, Etc…
11
Pipes / Culverts / Outfalls 1 2 3 4 5
Structural (PACP)
None (no/minor defects, failure is
unlikely)
Slight (minor defects, pipe is unlikely to fail
for 20+ years)
Moderate (has moderate defects
and will likely fail in the next 10 - 20
years)
Severe (has severe defects and will likely fail in the next 5 - 10
years )
Failure (has failed or will likely fail in the
next few years)
ErosionNone (No erosion
near barrel observed)
Slight (Slight erosion near barrel, no
imminent concern on condition of barrel)
Moderate (noticeable erosion
near barrel that could lead to future
collapse or pipe failure)
Severe (severe erosion/undercutting
around barrel, collapse or failure
could oocur) Failure
TrashNone (No trash or
debris present)Slight (Limited trash
and/or debris present)
Moderate (Trash and/or debris
present, but will not cause flooding or
inhibit O&M or emergency operations)
Severe (Trash and/or debris present that will likely cause
flooding or inhibit O&M or emergency
operations) Failure
Sedimentation
None (No sedimentation
present)Slight (Limited sedimentation)
Moderate (Sedimentation
present, but will not cause flooding or
inhibit O&M or emergency operations)
Severe (Sedimentatoin
present that will likely cause flooding or
inhibit O&M or emergency operations) Failure

Physical Condition Examples
Condition Score 1
Condition Score 5

Performance Examples
• Capacity• Regulatory• O&M/Availability• Obsolescence
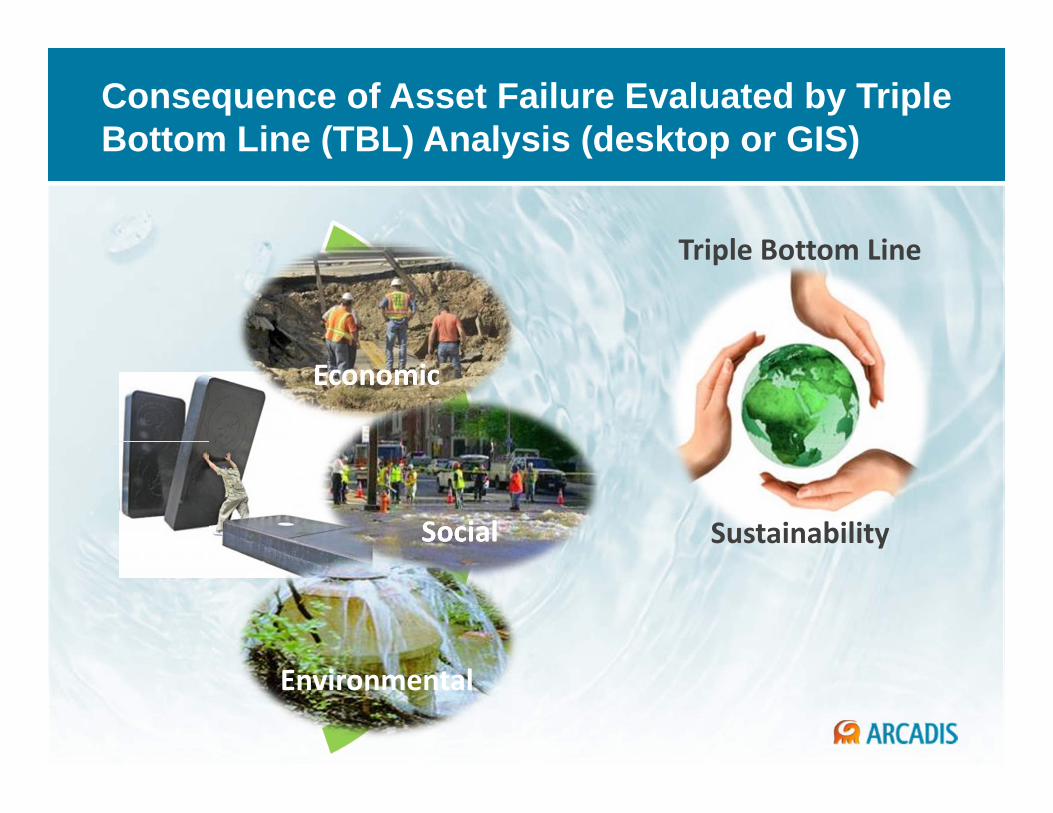
Consequence of Asset Failure Evaluated by Triple Bottom Line (TBL) Analysis (desktop or GIS)
Economic
Social
Environmental
Triple Bottom Line
Sustainability

Probabilityof Failure
Consequenceof Failurex Risk Score=
Failure Mode• Mortality
• Level of Service
• Capacity
• Efficiency
Risk Supports Optimization of Capital Improvement Programs
Consequence• Economic
• Social / Safety
• Environmental
TBL:Triple Bottom Line
“Right projects at the right time”
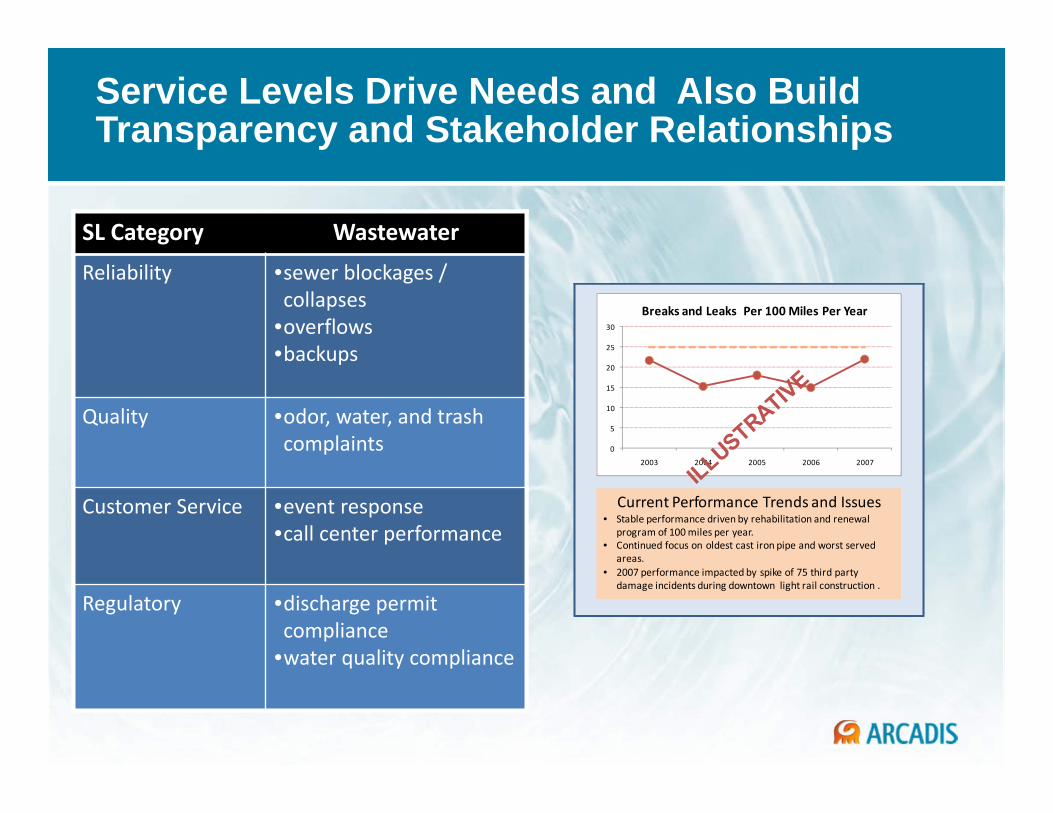
Service Levels Drive Needs and Also Build Transparency and Stakeholder Relationships
SL Category WastewaterReliability •sewer blockages /
collapses•overflows•backups
Quality •odor, water, and trash complaints
Customer Service •event response•call center performance
Regulatory •discharge permit compliance
•water quality compliance
0
5
10
15
20
25
30
2003 2004 2005 2006 2007
Breaks and Leaks Per 100 Miles Per Year
Current Performance Trends and Issues• Stable performance driven by rehabilitation and renewal
program of 100 miles per year.• Continued focus on oldest cast iron pipe and worst served
areas.• 2007 performance impacted by spike of 75 third party
damage incidents during downtown light rail construction .

Sample Service Level and Supporting Maintenance Performance Measures
Strategic Plan Elements LOS Category and Measures
1 Ensure system and asset reliability and minimize interruptions
Stormwater Collection• LOS X1 Collapses / Blockages Per 100 Miles• LOS X2 Property Flooding• LOS X3 Discharge Compliance• LOS X4 Event Response Time2 Provide high quality service and
effective response
Key Performance Indicators
Operations and Maintenance• Number of feet of sewer line cleaned• Number of times assets were inspected• Ratio of PM/CM work orders• Work order completion ratio

Risk Assessment Can SupportCapital and Maintenance Funding Decisions

Short and Long Term Financial Needs Developed and Compared to Current Rates
• Risk Driven and Optimized
• Cost (Replacement, Rehabilitation, and Maintenance)

Business Case Analysis Supports Project Prioritization
• Determine which projects or project alternatives have the highest net financial benefit to the utility
• Considers the most important and measurable project costs and benefits including financial, social, and environmental
• Considers Risk for existing assets and Risk of not acting
Economic
Sustainability

Business Case Templates Collect Information to Score/Prioritize Projects
Full Business Case Includes:1. Funding Sources2. Project Summary and
Description3. Strategic Plan Alignment 4. Service Level Impacts5. Project Alternatives
Evaluated6. Condition, Consequence of
Failure and Risk Analysis7. Project Cost Estimates8. Project Priority Scoring

Common Set of 10 Criteria Established to Prioritize All Projects Based on Risk and TBL
1. Asset Physical Condition2. Asset Performance Condition3. Strategic Alignment4. Financial Returns5. Economic / Financial
Considerations6. Public Image Impacts7. Service Level/Reliability Impacts8. Public/Employee Safety Impacts9. Environmental Impacts10. Efficiency/Energy Impacts
Criteria are weighted to calculate an overall score
0
5
10
15
20
25
1 2 3 4 5 6 7 8 9 10 11 12 13 14 15
Proj
ect P
riorit
y Sc
ore
Project Number
CIP Projects
High Priority Med
Priority LowPriority
0
5
10
15
20
25
1 2 3 4 5 6 7 8 9 10 11 12 13 14 15
Proj
ect P
riorit
y Sc
ore
Project Number
CIP Projects
High Priority Med
Priority LowPriority

Questions?

New York DEPBuried Infrastructure Asset Management Program

NYCDEP Pipeline Funding Needs Assessment: Scope and Objectives
• Evaluate useful life and condition for water, sewer (combined) gravity mains, and stormwater mains using existing information.
• Utilize and configure the KANEW Predictive Model to forecast the 50 year renewal and replacement needs.
• Create guide documents and tools for NYCDEP for the overall process
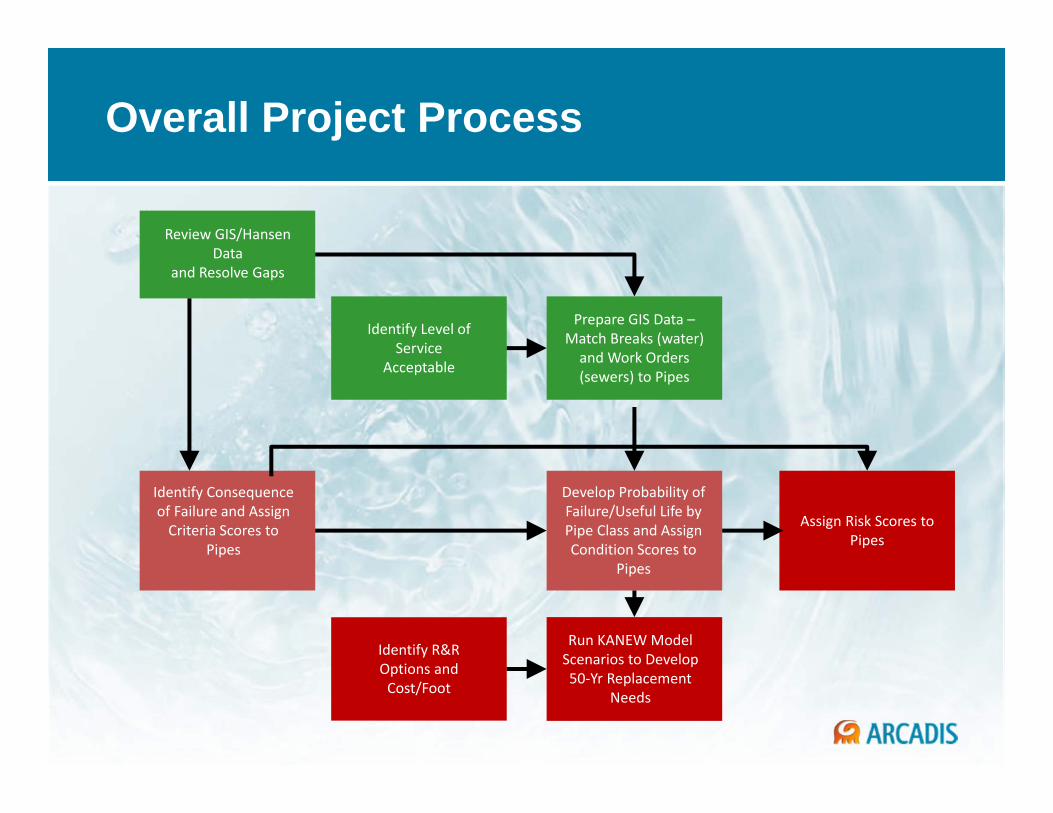
Overall Project Process
Identify Level of Service
Acceptable
Prepare GIS Data –Match Breaks (water)
and Work Orders (sewers) to Pipes
Review GIS/Hansen Data
and Resolve Gaps
Develop Probability of Failure/Useful Life by Pipe Class and Assign Condition Scores to
Pipes
Identify Consequence of Failure and Assign
Criteria Scores to Pipes
Identify R&R Options and
Cost/Foot
Run KANEW Model Scenarios to Develop 50-Yr Replacement
Needs
Assign Risk Scores to Pipes
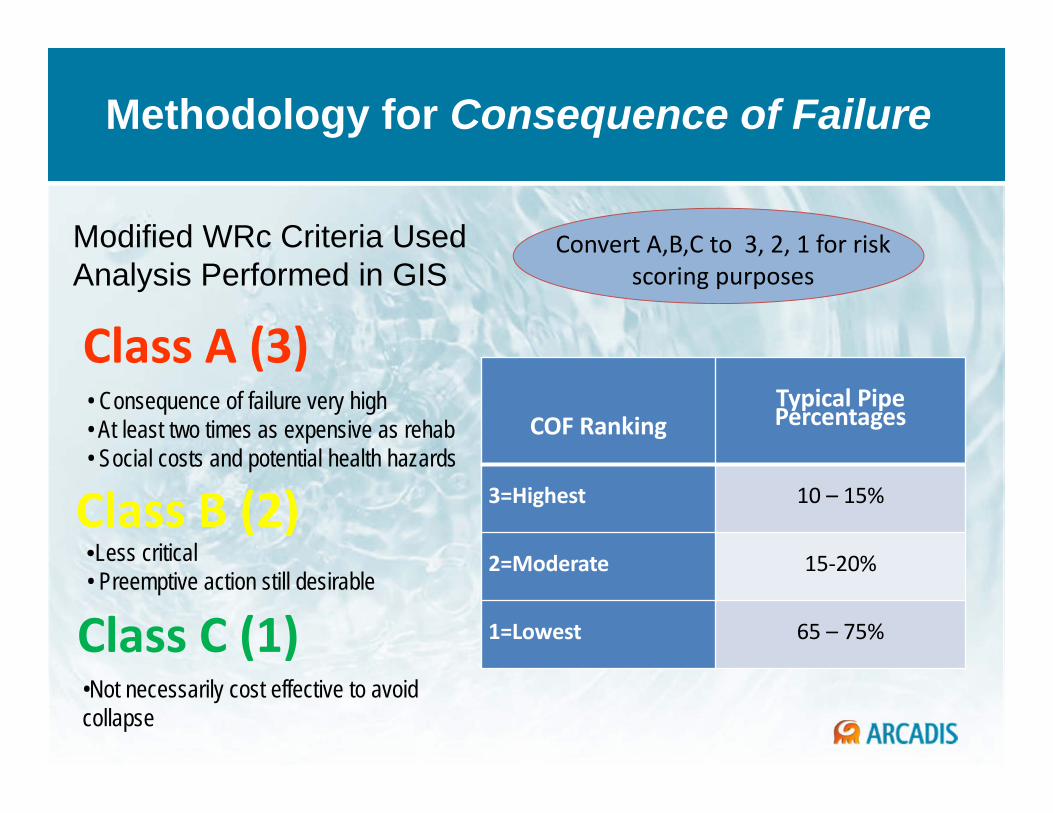
Methodology for Consequence of Failure
• Consequence of failure very high• At least two times as expensive as rehab• Social costs and potential health hazards
Class A (3)
Class B (2)•Less critical• Preemptive action still desirable
Class C (1)•Not necessarily cost effective to avoid collapse
Convert A,B,C to 3, 2, 1 for risk scoring purposes
Modified WRc Criteria Used Analysis Performed in GIS
COF RankingTypical Pipe Percentages
3=Highest 10 – 15%
2=Moderate 15-20%
1=Lowest 65 – 75%
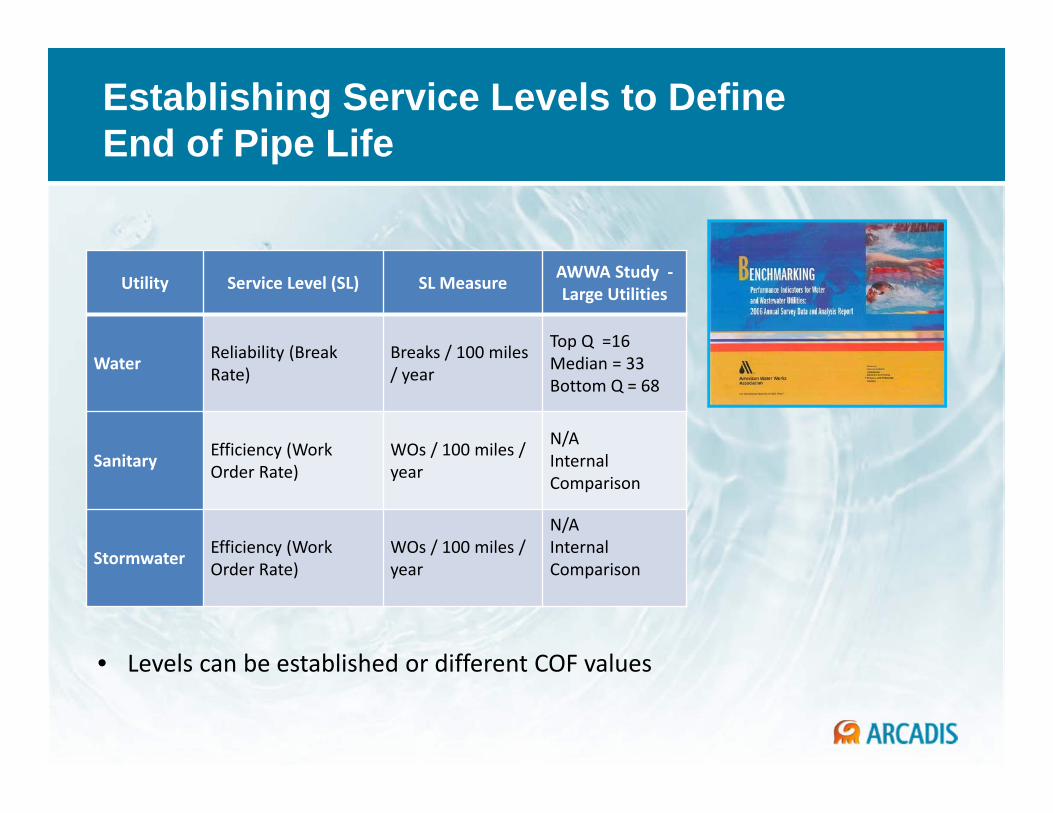
Establishing Service Levels to Define End of Pipe Life
Utility Service Level (SL) SL Measure AWWA Study -Large Utilities
Water Reliability (Break Rate)
Breaks / 100 miles / year
Top Q =16 Median = 33Bottom Q = 68
Sanitary Efficiency (Work Order Rate)
WOs / 100 miles / year
N/AInternal Comparison
Stormwater Efficiency (Work Order Rate)
WOs / 100 miles / year
N/AInternal Comparison
• Levels can be established or different COF values
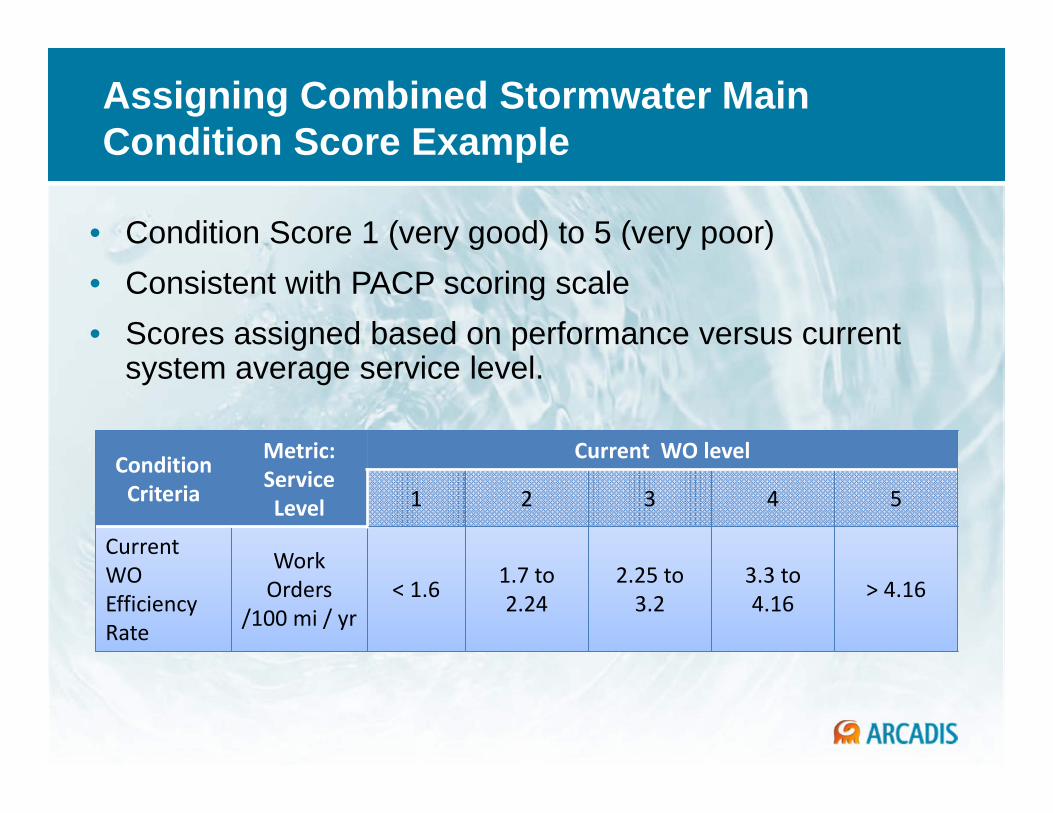
Assigning Combined Stormwater Main Condition Score Example
• Condition Score 1 (very good) to 5 (very poor)• Consistent with PACP scoring scale• Scores assigned based on performance versus current
system average service level.
Condition Criteria
Metric: Service Level
Current WO level
1 2 3 4 5
CurrentWO Efficiency Rate
Work Orders
/100 mi / yr< 1.6 1.7 to
2.242.25 to
3.23.3 to 4.16 > 4.16

Sample Risk Results
0%
10%
20%
30%
40%
50%
60%
70%
80%
90%
100%
Brooklyn Manhattan Queens Staten Island Bronx
% C
ondi
tion
Scor
e
Storm Risk Range
1) Low 1-7 2) Moderate 8-10 3) High 11-15

How does KANEW Modeling Work?
• Define EUL for each pipe group• Probabilistic ageing model embedded in the KANEW software• Spreads mains life over time based A certain %will reach it
earlier; a certain after, following a probability distribution similar to the familiar normal distribution; with adjustments.
% of L of cohort
Age
50% pipes survived
Resistance Time = 100% pipes survived
10% pipes survived
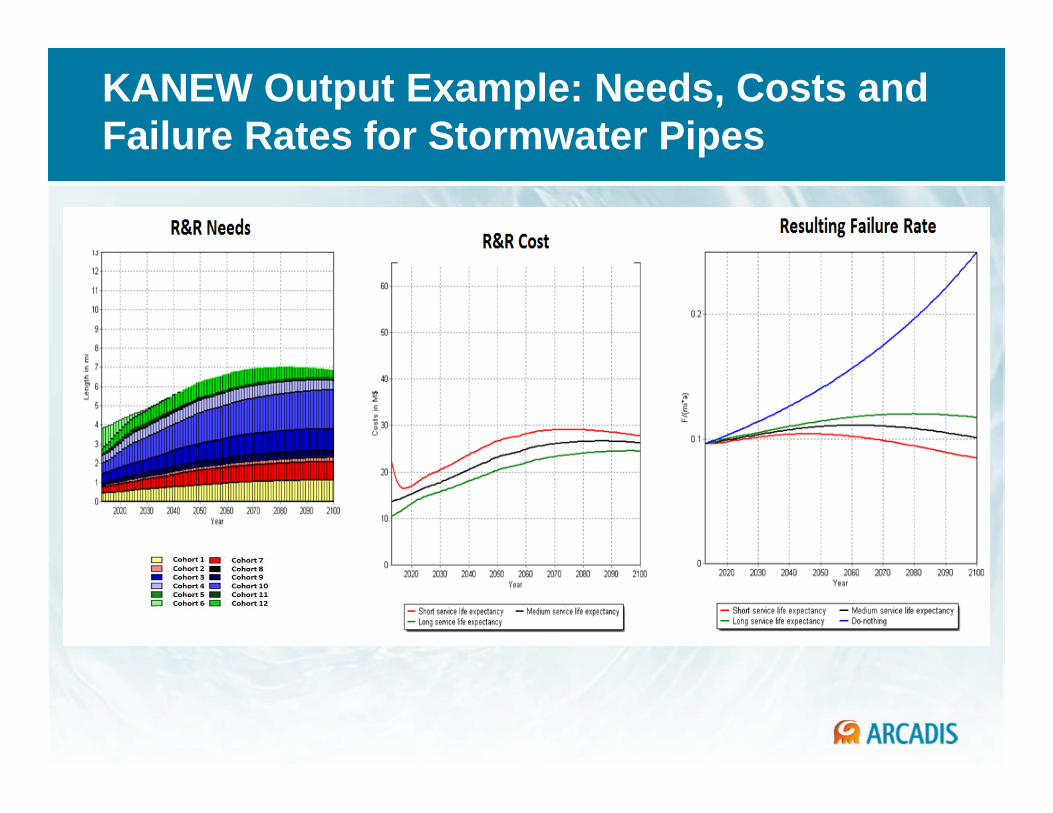
KANEW Output Example: Needs, Costs and Failure Rates for Stormwater Pipes
DC Water MS4 Outfall Inventory Program

MS4 Outfall Program Goals
• Develop and implement an Outfall Repair Schedule to ensure all outfalls are in good repair by 2022
• Total MS4 Outfalls = 587

Field Data Collection

Condition Assessment Criteria

Outfall Ranking Example #1
PresentersTBD
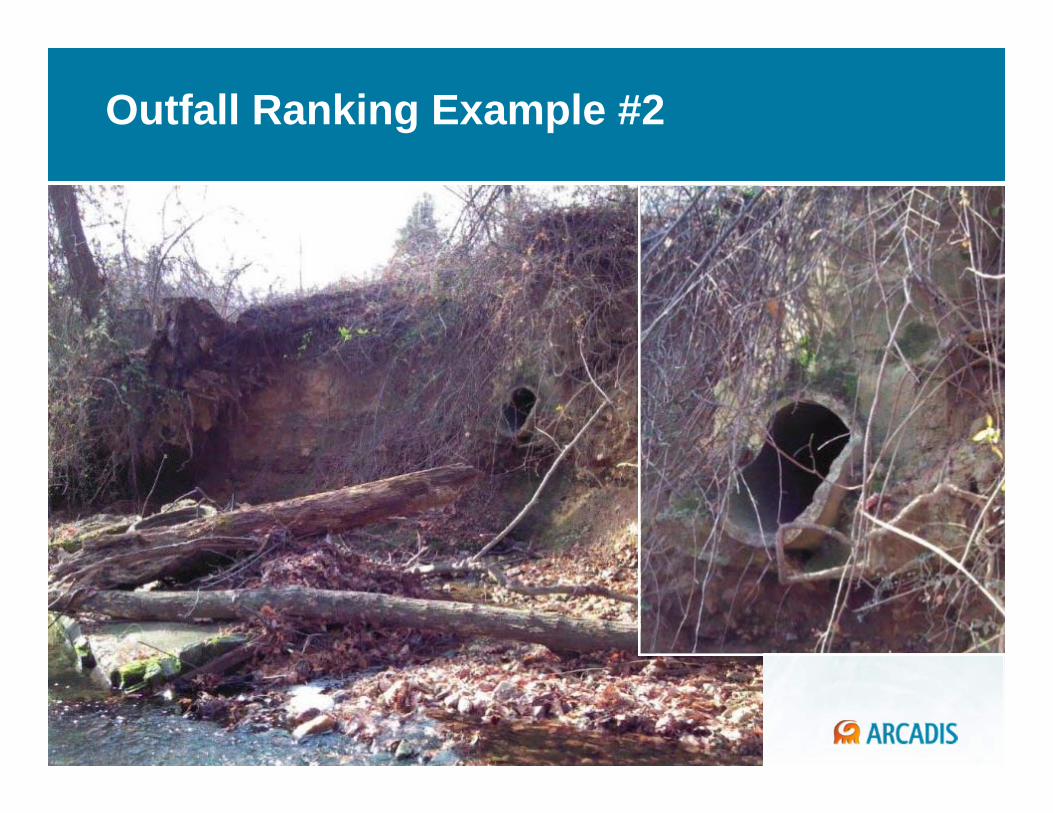
Outfall Ranking Example #2
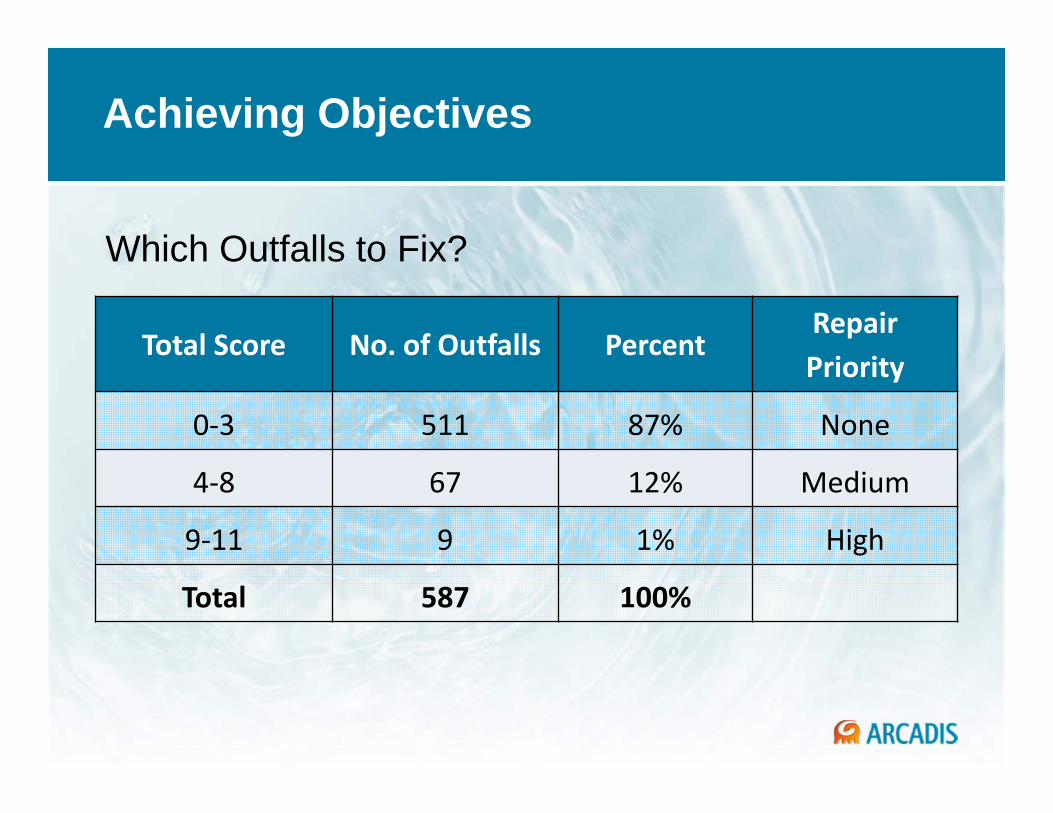
Achieving Objectives
Which Outfalls to Fix?
Total Score No. of Outfalls PercentRepair Priority
0-3 511 87% None
4-8 67 12% Medium
9-11 9 1% High
Total 587 100%
Schiphol Airport, AmsterdamStormwater Asset Management Program

Schiphol Baseline
| 13 November 2013 | © ARCADIS 2013Slide 41
Schiphol Strategy
Primary process Schiphol Airport
Primary process Schiphol Airport
Exploitation of the airportRisk based
maintenance management
Risk based maintenance management
Other activities
Other activities
Water managementStorm waterStorm water Open water
systemOpen water
system environmentenvironment
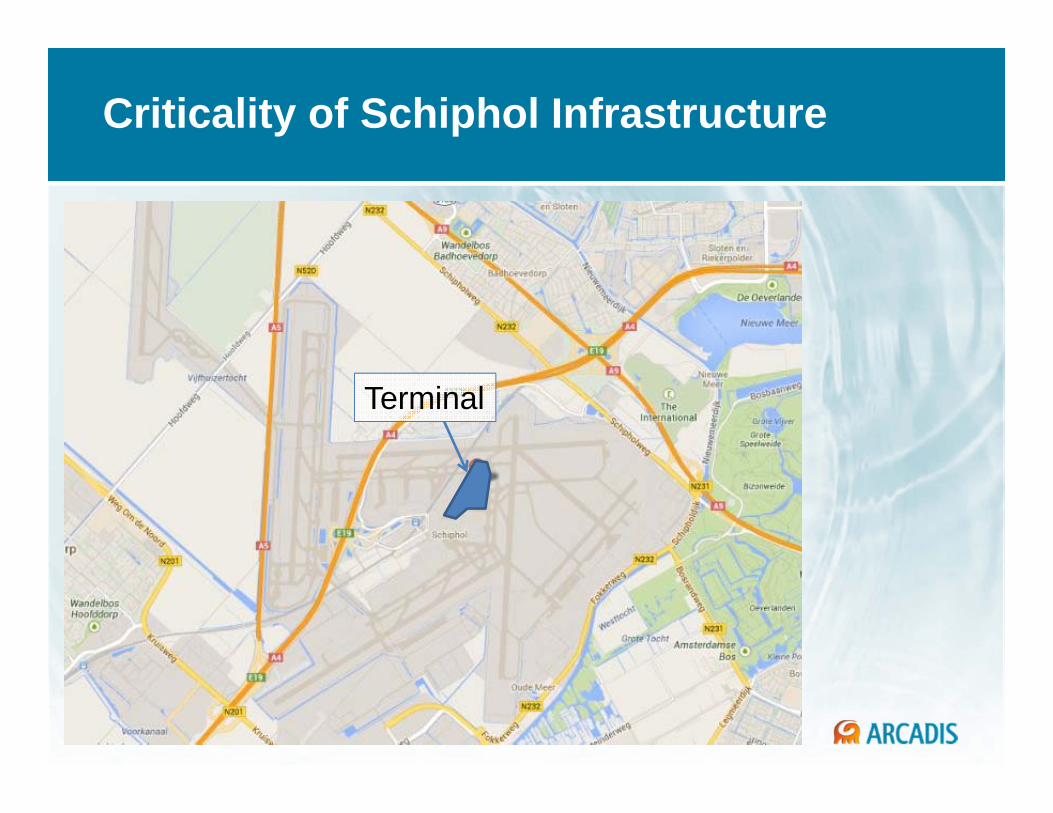
Criticality of Schiphol Infrastructure
Terminal

Schiphol Risk Analysis
Risk without preventative measures = €403,000 per year

Schiphol Risk Analysis
Cost of preventative measures (TV inspection) = €28,571 per yearRisk with preventative measures = €134,333 per year
Preventative Measures Reduce Risk Cost by 1/3

Chesterfield County, VAWatershed Management Program

Midlothian Drainage District
• Less than 2 square miles in area
• District contains 37 stormwater structures
• Risk-based SW asset assessment is “beta test” for rest of county

Stormwater Assets
Stormwater Assets:
• Detention basins – 6
• Retention basins – 4
• Storm filters – 3
• Underground pipe – 1
• Filterra – 23
• Streams/Channels – 2
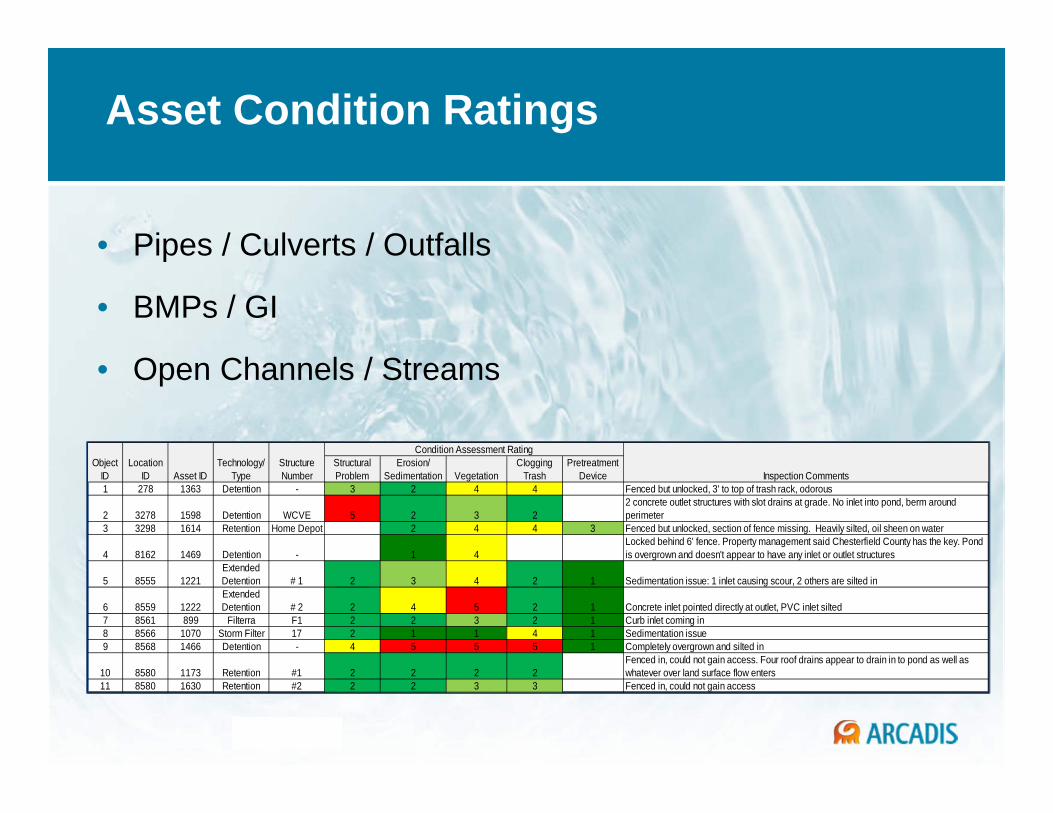
Asset Condition Ratings
• Pipes / Culverts / Outfalls
• BMPs / GI
• Open Channels / Streams
Structural Problem
Erosion/ Sedimentation Vegetation
Clogging Trash
Pretreatment Device
1 278 1363 Detention - 3 2 4 4 Fenced but unlocked, 3' to top of trash rack, odorous
2 3278 1598 Detention WCVE 5 2 3 22 concrete outlet structures with slot drains at grade. No inlet into pond, berm around perimeter
3 3298 1614 Retention Home Depot 2 4 4 3 Fenced but unlocked, section of fence missing. Heavily silted, oil sheen on water
4 8162 1469 Detention - 1 4Locked behind 6' fence. Property management said Chesterfield County has the key. Pond is overgrown and doesn't appear to have any inlet or outlet structures
5 8555 1221Extended Detention # 1 2 3 4 2 1 Sedimentation issue: 1 inlet causing scour, 2 others are silted in
6 8559 1222Extended Detention # 2 2 4 5 2 1 Concrete inlet pointed directly at outlet, PVC inlet silted
7 8561 899 Filterra F1 2 2 3 2 1 Curb inlet coming in8 8566 1070 Storm Filter 17 2 1 1 4 1 Sedimentation issue9 8568 1466 Detention - 4 5 5 5 1 Completely overgrown and silted in
10 8580 1173 Retention #1 2 2 2 2Fenced in, could not gain access. Four roof drains appear to drain in to pond as well as whatever over land surface flow enters
11 8580 1630 Retention #2 2 2 3 3 Fenced in, could not gain access
Structure Number
Condition Assessment Rating
Inspection CommentsTechnology/
TypeObject
IDLocation
ID Asset ID

WQ Improvement vs Risk-Based Need

Achieving Objectives
Which Assets to Repair/Retrofit?
Total Score No. of Assets PercentRepair Priority
1-6 39 74% None
7-9 12 23% Low
10-12 2 4% Medium
13-15 0 0% High
Total 53 100%
State DOTMS4 Asset Management Program

MS4 Program Compliance
• Asset inventory and inspection program
• SW Asset Management Guidelines document
• Guidelines for Stormwater Asset Condition, Consequence of Failure and Risk Assessment

Asset Management Components
1. Purpose and Overview
2. Asset Definition and Hierarchy
3. Asset Physical Condition Assessment
4. Asset Performance Condition Assessment
5. Asset Consequence of Failure and Redundancy
6. Asset Risk
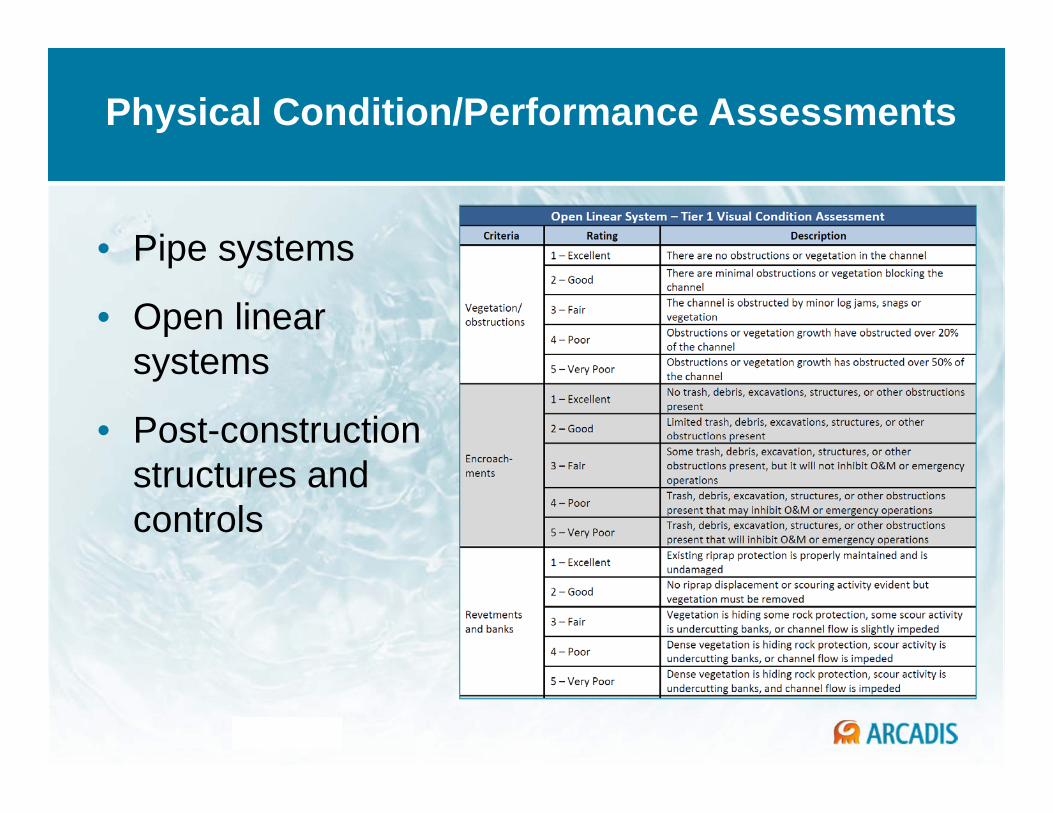
Physical Condition/Performance Assessments
• Pipe systems
• Open linear systems
• Post-construction structures and controls

Roadway Culvert Asset Example

Risk Assessment Example
District Location R-O-W Group TypePhysical
ScorePerformance
ScoreCondition
ScoreCOF
ScoreRisk
Score
2 City name
DOT Pipe Pipe 3 5 5 3 15
2 City name
DOT Pipe Outfall 1 5 5 3 15
2 City name
City Pipe Pipe 2 2 2 2 4
2 City name
DOT Open Linear
Ditch 4 5 5 4 20
2 City name
DOT Post-construct. Structure
Filter strip
2 3 3 2 6
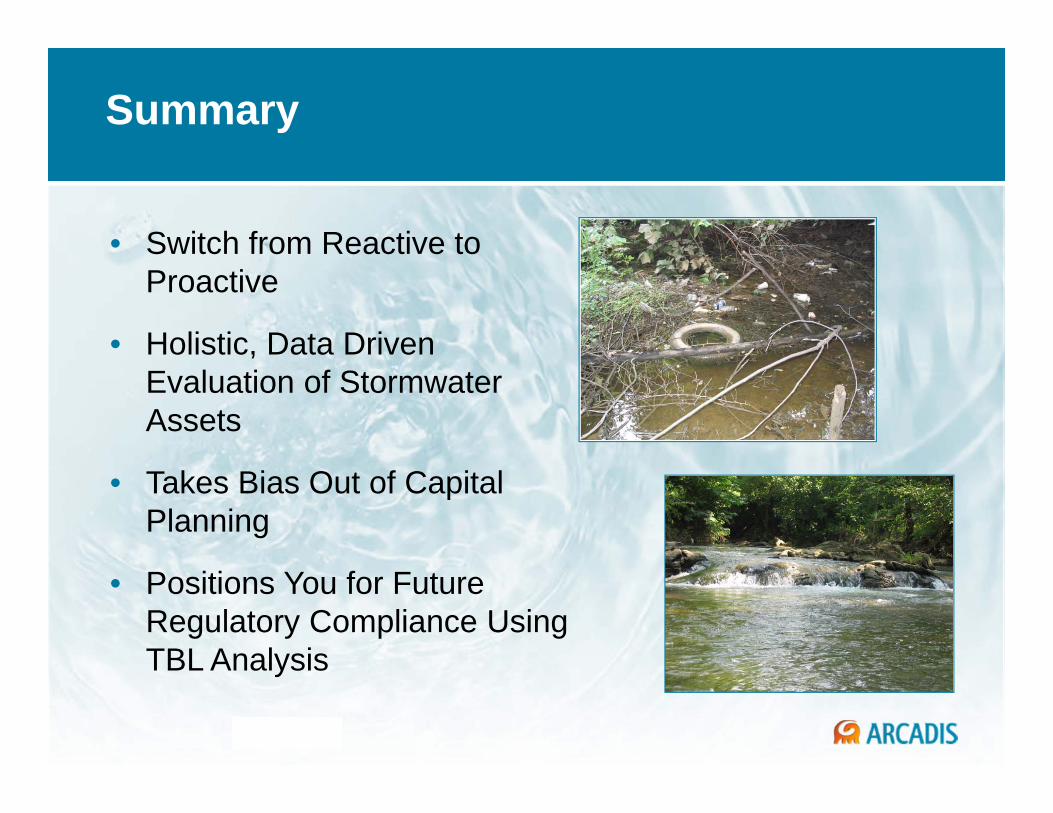
Summary
• Switch from Reactive to Proactive
• Holistic, Data Driven Evaluation of StormwaterAssets
• Takes Bias Out of Capital Planning
• Positions You for Future Regulatory Compliance Using TBL Analysis

Questions?