Embed Size (px)
Citation preview

For Local Agencies in IndianaJUNE 2017
A S S E T M A N A G E M E N T G U I D E

This Guide was developed for the Indiana LTAP by
Applied Pavement Technology, Inc.115 West Main Street Suite 400Urbana, Illinois 61801
(217) 398-3977
www. appliedpavement.com

1 Introduction
1 What Is Asset Management?
2 Key Asset Management Concepts
4 Why Is TAM Important?
5 Reasons to Use TAM
5 Purpose and Organization of the Guide
7 The TAM Process
8 Different Approaches to Implementation
9 Signs of a Successful Implementation
11 Introduction
12 Building a Pavement Inventory
14 Using the State Bridge Inventory
15 Building an Inventory for Other Assets
15 Storing and Managing Inventory Data
21 The Importance of Asset Condition Information
23 The Importance of Good Quality Asset Condition Data
24 Monitoring Pavement Conditions
32 Monitoring the Condition of Bridges
37 Estimating Funding Levels
40 Identifying Other Factors That Impact the Program
40 Using the Information to Set Targeted Levels of Service
C H A P T E R 1An Introduction to Asset Management
C H A P T E R 2Key Components of a tam Process
C H A P T E R 3Building an Asset Inventory
C H A P T E R 4Rating Asset Conditions
TA B L E O F C O N T E N T S
C H A P T E R 5Setting Targeted Levels of Services
45 Using Condition Data to Determine Repair Needs
48 Putting Together a Multi-Year Program
50 Getting the Most Out of Your Program
52 Moving Towards the Ability to Predict Future Conditions
59 Asset Management Plan Objectives
60 Developing a Pavement Asset Management Plan
63 Examples From Local Agency Pavement Asset Management Plans
70 Developing a Bridge Asset Management Plan
70 Examples from Local Agency Bridge Asset Management Plans
74 Other Information Presented in Asset Management Plans
74 Tips and Tricks from Local Agency Experiences in Indiana
A1
B1
C1
C H A P T E R 6Developing a Program with a Mix of Fixes
C H A P T E R 7Reporting Results and Developing the Plan
A P P E N D I X A Typical Pavement and Bridge Preservation Treatments
A P P E N D I X B Pavement Asset Management Plan Template
A P P E N D I X CBridge Asset Management Plan Template

An Introduction to Asset Management 1
C H A P T E R 1An Introduction to Asset Management
I N T R O D U C T I O N
1 Michigan Public Act 499 of 2002, Section 9(a)(1)(a)
City, town, and county agencies in Indiana are responsible for taking care of their roads and
bridges so people and goods travel safely within the community and across the state. This is not an easy job. There isn’t enough money to fix everything so it’s an ongoing struggle to keep up with the deterioration that takes place each year.
One way to tackle these challenges is to use as-set management for preserving the road and bridge network. While asset management won’t solve all your problems, it will help you establish a structured format for making decisions about which roads to fix and bet-ter prepare you for questions from stakeholders about how much money you need.
This Guide introduces you to asset management and outlines the five steps involved in developing an effective asset management plan. The Guide was de-veloped by the Indiana Local Technical Assistance
Program (ltap) as a resource to help you better man-age your pavements and bridges.
W H AT I S A S S E T M A N A G E M E N T ?Although there are a lot of definitions for asset man-agement, we like the definition used in Michigan, which defines it as:
An ongoing process of maintaining,
upgrading, and operating physical assets cost-
effectively, based on a continuous physical
inventory and condition assessment. 1
This definition captures several important points. First, it recognizes that taking care of assets is an
2 An Introduction to Asset Management
ongoing responsibility that must be managed. Second, it points out the importance of making the best choices possible when it comes to taking care of the network so resources are used as cost-effectively as possible. Finally, it stresses the importance of having current infor-mation about your assets—such as inventory and condi-tion information—to help you make good decisions.
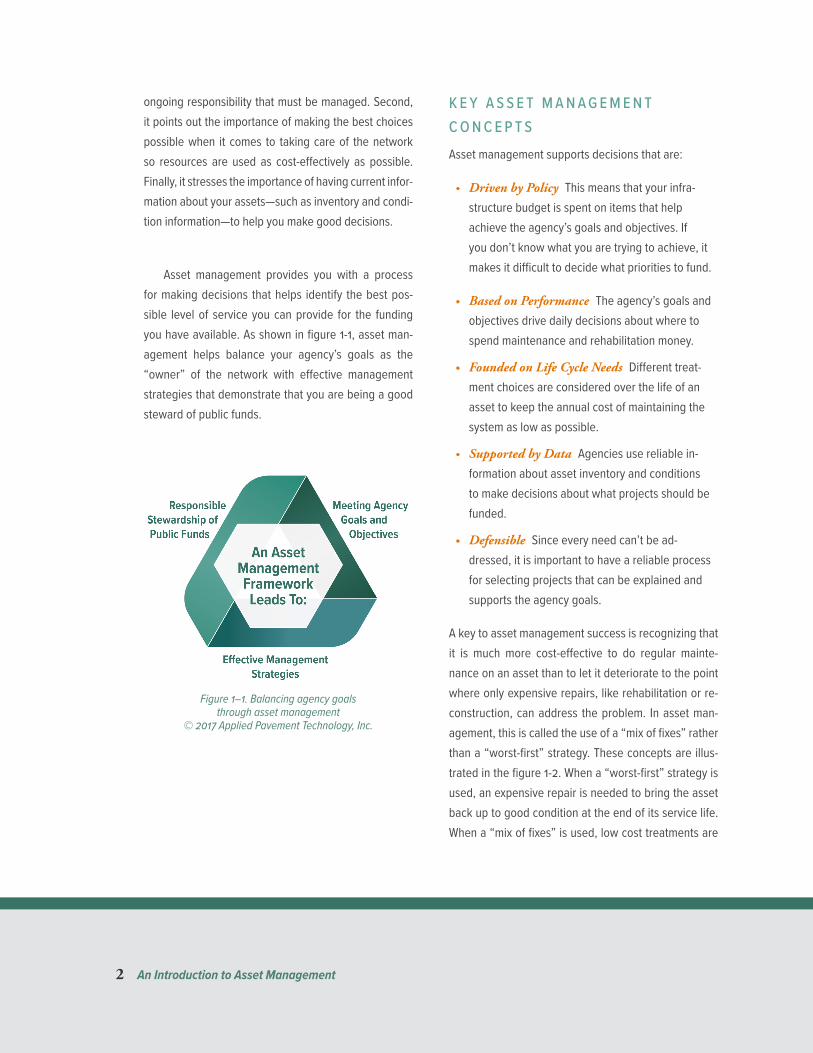
Asset management provides you with a process for making decisions that helps identify the best pos-sible level of service you can provide for the funding you have available. As shown in figure 1-1, asset man-agement helps balance your agency’s goals as the “owner” of the network with effective management strategies that demonstrate that you are being a good steward of public funds.
K E Y A S S E T M A N A G E M E N T C O N C E P T SAsset management supports decisions that are:
• Driven by Policy This means that your infra-structure budget is spent on items that help achieve the agency’s goals and objectives. If you don’t know what you are trying to achieve, it makes it difficult to decide what priorities to fund.
• Based on Performance The agency’s goals and objectives drive daily decisions about where to spend maintenance and rehabilitation money.
• Founded on Life Cycle Needs Different treat-ment choices are considered over the life of an asset to keep the annual cost of maintaining the system as low as possible.
• Supported by Data Agencies use reliable in-formation about asset inventory and conditions to make decisions about what projects should be funded.
• Defensible Since every need can’t be ad-dressed, it is important to have a reliable process for selecting projects that can be explained and supports the agency goals.
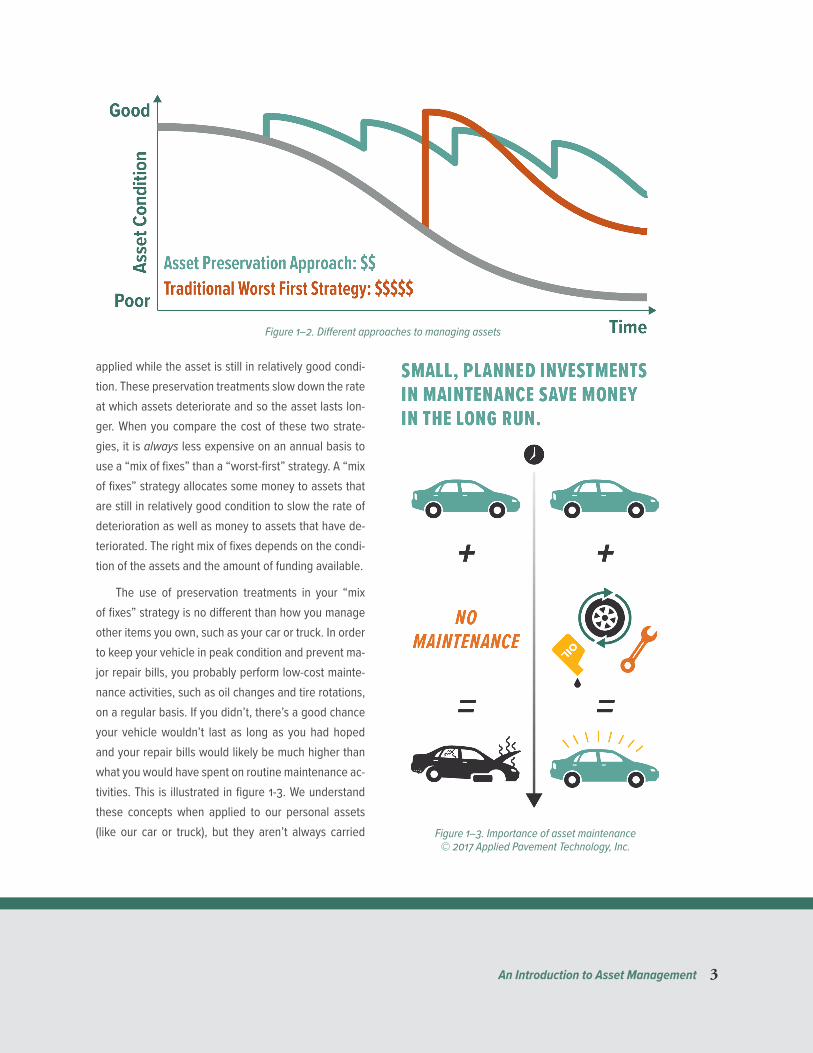
A key to asset management success is recognizing that it is much more cost-effective to do regular mainte-nance on an asset than to let it deteriorate to the point where only expensive repairs, like rehabilitation or re-construction, can address the problem. In asset man-agement, this is called the use of a “mix of fixes” rather than a “worst-first” strategy. These concepts are illus-trated in the figure 1-2. When a “worst-first” strategy is used, an expensive repair is needed to bring the asset back up to good condition at the end of its service life. When a “mix of fixes” is used, low cost treatments are
Figure 1–1. Balancing agency goals through asset management
© 2017 Applied Pavement Technology, Inc.
An Introduction to Asset Management 3
applied while the asset is still in relatively good condi-tion. These preservation treatments slow down the rate at which assets deteriorate and so the asset lasts lon-ger. When you compare the cost of these two strate-gies, it is always less expensive on an annual basis to use a “mix of fixes” than a “worst-first” strategy. A “mix of fixes” strategy allocates some money to assets that are still in relatively good condition to slow the rate of deterioration as well as money to assets that have de-teriorated. The right mix of fixes depends on the condi-tion of the assets and the amount of funding available.
The use of preservation treatments in your “mix of fixes” strategy is no different than how you manage other items you own, such as your car or truck. In order to keep your vehicle in peak condition and prevent ma-jor repair bills, you probably perform low-cost mainte-nance activities, such as oil changes and tire rotations, on a regular basis. If you didn’t, there’s a good chance your vehicle wouldn’t last as long as you had hoped and your repair bills would likely be much higher than what you would have spent on routine maintenance ac-tivities. This is illustrated in figure 1-3. We understand these concepts when applied to our personal assets (like our car or truck), but they aren’t always carried
Figure 1–2. Different approaches to managing assets
Figure 1–3. Importance of asset maintenance© 2017 Applied Pavement Technology, Inc.
4 An Introduction to Asset Management
over into the way we manage infrastructure assets. Asset management helps agencies understand these same concepts that are used to take care of our vehi-cles and homes should also be used to manage infra-structure assets.
There are many tools that help agencies decide what “mix of fixes” would best help them achieve their goals. For pavements, many transportation agencies have implemented pavement management systems to store pavement inventory and condition informa-tion, predict future conditions, and evaluate different combinations of projects and treatments to decide the best use of available funds. For bridges, bridge man-agement programs are available to perform many of the same types of analyses. Predicted budget and work needs from pavement and bridge management systems provide valuable input to the asset manage-ment process, allowing an agency to make informed decisions across asset classes based on agency goals and objectives. Simpler approaches to managing pave-ments and bridges can also be used, as described in this document.
The concepts of asset management are used worldwide for managing all kinds of infrastructure as-sets in the transportation, water/wastewater, and utility sectors. This Guide limits the discussion to transporta-tion assets, specifically pavements and bridges, but the same concepts could be used to manage sidewalks, signals, signs, culverts, and other infrastructure as-sets. Because of the focus on infrastructure assets, the Guide frequently uses the term Transportation Asset Management, or tam, to reflect the focus on a special-ized application of asset management.
W H Y I S TA M I M P O R TA N T ?There is no question that the roads and bridges you manage are important to the economic well-being of your community. For most local agencies, roads and bridges represent the most significant investment of all the transportation infrastructure you manage. Because of this level of investment, it is important that transpor-tation agencies do the best job they can to protect the value of its transportation assets through the use of sound asset management principles.
Although most people would agree that it is im-portant to manage roads and bridges effectively, it can be a challenge to do so because of funding pressures, increased demand on the system, and an aging infra-structure. There never seems to be enough money to do what needs to be done and deteriorating condi-tions are an unfortunate consequence of that situation. When operating in that type of environment, it can be hard to see the reason for considering tam as a worth-while investment of agency resources.
In reality, asset management provides the most benefit to agencies that are facing these challenges to help make sure you get the best possible return for each dollar you invest in you network. It makes finan-cial sense to manage your roads and bridges the same way you manage your vehicles and your home. Even agencies with a large part of its network in poor con-dition can take steps towards implementing an asset management strategy gradually. By investing a portion of each year’s budget in low-cost treatments that pre-serve the portion of the network currently in good con-dition, you can actually begin to slow their rate of dete-rioration. The rest of your budget can be used to attack the portion of the network that needs more substantial improvements. Your asset management plan is a way for you to educate your community about your strategy

An Introduction to Asset Management 5
for managing the network and the level of service they can expect. The plan also helps you communicate to your elected officials the additional funding needed to take care of the road and bridge repairs that aren’t be-ing addressed at current funding levels.
Because of the importance of taking care of the local roads and bridges, the Indiana Legislature pro-motes the development of asset management plans for pavements and bridges managed by the cities, coun-ties, towns, and townships within the state of Indiana. The plans are important for several reasons. For local agencies, the plans allow for additional funding for tak-ing care of your roads and bridges. The plan informa-tion is also important from a State perspective because it provides the Indiana Legislature with valuable data to better determine current conditions and determine fu-ture statewide needs for local road and bridge funding.
R E A S O N S T O U S E TA MAsset management enables your agency to improve the cost-effectiveness of your decisions and better communicate the impacts of available funding on road and bridge conditions. Because decisions are data driven, an asset management plan helps improve the agency’s credibility with the public and elected offi-cials and demonstrates an agency is accountable for its decisions.
Several specific benefits that an agency may realize are:
• Getting better value for each dollar invested in roads and bridges.
• Improving network conditions, even under con-strained funding, by taking care of assets before they fall into poor condition.
• Making more informed, strategic decisions about how to invest available funding that are based on data.
• Being better able to communicate funding needs with agency officials, the public, and elected officials.
P U R P O S E A N D O R G A N I Z AT I O N O F T H E G U I D EThis Guide is designed to serve as a resource to agen-cies adopting an asset management philosophy. It presents an asset management process that can be used by any local agency in Indiana. It also introduces common terminology and helpful hints to get you start-ed. The Guide promotes a statewide approach to gath-er and analyze the information you need to develop an asset management plan.
You can use this Guide to:
• Learn more about what asset management is.
• Identify the steps involved with implementing as-set management.
• Discover ways to use data to better communicate with elected officials.
• Develop an effective asset management plan.
The focus of this Guide is on Transportation Asset Management, but the same concepts can be applied to other assets that your agency manages, such as sew-ers and water treatment plants.
The Guide is organized into seven chapters, each of which addresses an important step in developing a robust asset management process. The information contained in the seven chapters is summarized below.
6 An Introduction to Asset Management
• Chapter 1: An Introduction to Asset
Management This chapter introduces asset management and why it is important.
• Chapter 2: Key Components of a tam
Process This chapter introduces the key com-ponents of a transportation asset management process and explains how agencies can fol-low the process without significant resource requirements.
• Chapter 3: Building an Asset Inventory The first step in the tam process involves developing an asset inventory. This chapter explains what information is needed and how the data can be managed.
• Chapter 4: Rating Asset Conditions Asset needs are based on objective assessments of condition, so this chapter introduces methods of rating pavement and bridge conditions.
• Chapter 5: Using Information to Manage
Assets This chapter illustrates how the inventory and condition information can be used to man-age roads and bridges.
• Chapter 6: Developing a Cost-Effective
Program This chapter introduces methods of selecting projects and cost-effective treatments.
• Chapter 7: Reporting Results and Developing
the Plan The final chapter provides examples of how pavement and bridge information can be presented and used to develop an asset man-agement plan.
The Guide also includes three appendices. Appendix A includes typical treatments for road and bridge needs. Appendix B includes the template for developing a pavement asset management plan, and Appendix C in-cludes the template for developing a bridge asset man-agement plan. ■

Key Components of a TAM Process 7
C H A P T E R 2 Key Components of a tam Process
T H E TA M P R O C E S S
the Guide introduCes a 5-step process to implementing tam and using the information ef-
fectively. Within each step, there are choices you can make regarding the complexity of the data you collect and the types of analyses that can be conducted. The Guide focuses primarily on the basic steps involved in
setting up an asset management program, but intro-duces additional steps you can take if you are interest-ed in building a more mature program over time.
The five steps to implementing a tam process are shown in figure 2-1.
Figure 2-1. The steps in the tam process. © 2017 Applied Pavement Technology, Inc.
The Guide explains each of these steps in more detail in chapters 3 through 7.

8 Key Components of a TAM Process
D I F F E R E N T A P P R O A C H E S T O I M P L E M E N TAT I O N
2 Illinois Center for Transportation. 2011. Implementing Pavement Management Systems for Local Agencies. https://apps.ict.illinois.edu/projects/getfile.asp?id=3059
Any agency can begin implementation of an asset management process with basic inventory and condi-tion information stored in a spreadsheet, database, or Geographic Information System (gis). There are also more sophisticated computer programs available that can be used to predict future conditions and analyze the cost-effectiveness of different treatment options over an analysis period. These programs are known as pavement and bridge management systems.
Pavement and bridge management systems can be either public domain or proprietary software programs. A public domain system is usually developed by a gov-ernmental or educational organization, and is provid-ed to local agencies at a very low cost. The software programs are fairly easy to use but there are limited opportunities to configure the program to your specif-ic needs. A proprietary system is typically developed by private industry. These systems are usually more ex-pensive than public domain programs, but the analysis capabilities and configurability of the software are bet-ter. Some characteristics associated with each of the common approaches to managing tam data are de-scribed in figure 2-2.2
The implementation of tam should not be entire-ly new since most agencies have some knowledge of the number of road miles or bridges they manage. The difference for most agencies is the development of a more formal process that helps ensure that data is kept current and a “mix of fixes” is used to get the best re-sults from available funding. Asset management of-ten involves a more strategic view of system needs to
help ensure that the agency is investing in projects that make sense from a long-term perspective.
Another change that often accompanies a tam im-plementation is a shift towards a “network” rather than a “project” perspective when selecting projects and
Figure 2-2. Characteristics of each approach to managing tam data. © 2017 Applied Pavement Technology, Inc.

Key Components of a TAM Process 9
treatments. Agencies with strong asset management processes recognize that the best investment for the entire network is different than making the best invest-ment for each individual project. For example, it might be better for the system to mill and overlay several miles of roads rather than reconstruct one road. This shift in perspectives is often one of the most difficult aspects of the implementation process.
For these reasons, it is important to recognize that the implementation of a tam process is more than just collecting information and putting it into a database. In most instances, the implementation of asset manage-ment leads to changes in existing practices and training of agency personnel to change the organizational cul-ture. Therefore, in addition to allocating resources for the data and systems needed to support asset manage-ment, agencies should also consider allocating resourc-es to align business processes with the new way of do-ing business and to build buy-in among agency staff.
S I G N S O F A S U C C E S S F U L I M P L E M E N TAT I O NRegardless of whether you are using a simple program or have access to a sophisticated pavement or bridge management program, there are several signs that in-dicate your program is successful. These signs include the following:
• Condition information is being used to select projects and treatments.
• Your program includes a mix of fixes, with a por-tion of the budget going to preserve pavements and bridges that are still in relatively good condi-tion to slow the rate of deterioration.
• You have confidence in your ability to share infor-mation on current and projected levels of service and funding needs.
• Your agency recognizes that pavements and assets are valuable assets that are worth preserving. ■
Building an Asset Inventory 11
C H A P T E R 3Building an Asset Inventory
I N T R O D U C T I O N
the first step in developing a tam process is to identify the assets you manage. The invento-
ry can include any or all of the assets you manage, but agencies usually begin by focusing on the assets that they spend the most on or are most important from a safety perspective. Because pavement and bridge re-pairs typically represent the most significant portion of an agency’s public works budget, most agencies build their pavement and bridge inventories first. Once those inventories are established, they may begin building other asset inventories for other assets, such as signs, signals, or culverts.
Deciding What Information to IncludeThis chapter describes the basic inventory information that should be collected to manage pavements and bridges separately. As you’re developing your invento-ry, keep in mind that you need to be able to keep your inventory current at all times, so try to avoid collect-ing information that is either difficult to maintain or not useful in making project and treatment decisions. It is
better to do a good job maintaining a small amount of useful information than having a comprehensive inven-tory that’s out of date within a year.
The following questions will help you identify the basic information that should be included in your inventory.
• What type of asset is it? For instance, is it a bridge, a pavement, or something else?
• How is this asset identified? It is important to track data by road segment or bridge, so each item needs its own unique identifier. For roads, the common name of the road may be used and the section limits may be defined by intersec-tions or distance from a reference point. For bridges, a location reference or bridge number is often used.
• Where is it located? It is important to be able to have some way of locating the asset in the field, whether it’s through a common refer-ence point (such as an intersection) or an exact

12 Building an Asset Inventory
location using Global Positioning System (Gps) coordinates.
• Who is responsible for it? In some cases, as-sets may be managed by another agency. For ex-ample, bridge inventory and condition informa-tion is managed at the state level rather than the local level.
• What are the asset’s dimensions? The dimen-sions provide you information that allows you to estimate the amount of repair work that is need-ed so you can calculate project costs.
• What is the asset made of? This will help you determine the rate of deterioration and the type of repairs that might be needed.
• When was the asset built or last repaired? This information will help you estimate the as-set’s age, which may be an important indication of when repairs might be needed.
• How is the asset used? This information can be useful for determining the rate of deterioration or for setting repair priorities. For example, a road that serves as a city bus route will probably de-teriorate faster than a road that is used primarily by cars.
More information about storing and managing inven-tory information is provided at the end of this chapter.
B U I L D I N G A PA V E M E N T I N V E N T O R YThe following list includes the basic information that should be added to your pavement inventory and your pavement asset management plan.
• The most commonly used road or street name.
• From and to identifiers that indicate the begin-ning and end of the road section being consid-ered. One road may have several sections over its entire length. Each section may represent a block in a city, or may represent the typical length of a resurfacing project on a county road.
• A unique identification number or name. For in-stance, the first block on Green Street might be referred to as GreenST01 and the second block might be GreenST02.
• The length and width of the pavement section. When measuring the road width, agencies gen-erally include shoulders in the calculation if they would repair the shoulders at the same time they would repair the driving surface. It may be im-portant to know how many drive lanes there are, especially if you might decide to repair one lane but not the other.
• The visible surface type. At the most basic level, it is important to distinguish paved roads as either asphalt or concrete pavements. If possible, it’s helpful to know if the asphalt is on top of a concrete road (in which case it would be called a composite pavement) or whether a chip seal has been applied. Brick, gravel, and unpaved surfaces should also be identified as separate surface types.
• The functional classification or Average Daily Traffic (Adt) counts. Traffic information is import-ant because it impacts the rate at which the road deteriorates and it might be used to determine which projects will be funded. For instance, if there are two roads with the exact same condi-tion, the one serving the higher traffic volumes would probably be repaired before the other
Building an Asset Inventory 13
one. However, since most agencies don’t have good traffic counts available, they use the road functional classification as a substitute for traffic data. The idea is that a primary road would have higher traffic volumes than a collector or resi-dential road. This doesn’t always hold true, but it works well enough to be an acceptable substitu-tion for traffic volumes.
The Fulton County Pavement Asset
Management Plan includes a summary
of centerline miles and length (in feet)
by functional class (Primary, Secondary,
and Residential) as well as by surface type
(asphalt, pug mix, chip seal, gravel, and
concrete).
Other Useful Pavement Inventory InformationAlthough not required for developing a pavement as-set management plan, there may be other useful pavement-related information that is included in your inventory. Some of the common types of additional in-formation that might be considered are discussed next.
In addition to the basic inventory
information previously discussed, Hendricks
County includes subdivision names and
Ripley County includes the district number in
its pavement inventory.
Age or Last Major Construction DateThe age of a pavement, or the last date that major work was performed, gives an idea of when the next repairs will be needed or when the road might need to be replaced. This information is more important if you are developing deterioration models to predict future conditions. Combining pavement age with pavement condition information can determine whether you are getting the level of service expected from each treat-ment. For instance, if an overlay was designed to last 10 years, but after 7 years there is little evidence of cracking, there is a good likelihood that you may get a few more years out of the pavement before repairs are needed.
It can be hard to obtain this information for an ex-isting pavement network, but there are a few “tricks of the trade” that might be helpful if digging through re-cords seems too difficult. You may be surprised at how much information you can get just by asking people who have worked for the agency for a long time. Their memory may be sufficient for a first cut. Your pavement condition ratings may also provide enough information to estimate pavement age. For purposes of setting up your inventory, in the absence of other information, you may estimate that roads in Excellent condition were last worked on in the past 1 to 3 years, those in Very Good condition are 3 to 5 years old, and so on. When you estimate pavement age in this manner, it’s a good idea to use a code to alert you that the date is estimat-ed. For instance, using a date that indicates a road was built on January 1st of any year could be code that in-dicates you are using an estimated date. Actual con-struction dates would show a more realistic construc-tion date, most likely between the months of March and November.

14 Building an Asset Inventory
As projects are constructed in the field, the inven-tory should be updated with a new construction date and surface type. Over time, the new information will replace the older records and you’ll have a good re-cord of when a road section was last addressed.
Shoulder InformationShoulder information may be important to an agency from a safety perspective. In many instances, especial-ly in rural locations, shoulders are not built to current design standards. Therefore, having this information in the inventory allows an agency to recognize when shoulder work will need to be added to the cost of a pavement rehabilitation project.
Very little information about shoulders needs to be included in the inventory. At the most basic level, an agency might include a) whether a shoulder is present, b) the width of the shoulder, and c) the material used to construct the shoulder, especially if it’s different from the road surface.
Drainage Features (Including Curb and Gutters)Drainage features play a significant role in removing water from a road and preventing it from damaging un-derlying layers. Roads with drainage features that are working as expected will typically last longer than a road that has poor drainage characteristics. The pres-ence of drainage features may limit your treatment options if you have to limit the treatment thickness to maintain curb reveal. Their presence may also impact the cost of an improvement if drainage features have to be addressed as part of the project. For these reasons an agency may want to add to its inventory a) informa-tion about whether drainage features are present, b) the type of drainage feature used, c) the material used,
d) the dimensions of the feature, and e) the condition of the drainage feature.
Special NotesThere may be other information that is important to in-clude in the inventory, such as notes about whether the road has been abandoned and is no longer maintained. This type of information is especially helpful to keep the road section from showing up in a list of projects eligible for funding.
U S I N G T H E S TAT E B R I D G E I N V E N T O R YBridges are often managed by components, or ele-ments, since each component behaves differently and is repaired differently. Examples of bridge components include the deck, the superstructure, and the substruc-ture. By definition, bridges include any structures that carry public roadways with a span length of 20 feet or more. For that reason, large culverts may be included in your bridge inventory.
A statewide bridge inventory, known as the Bridge Inspection Application System (Bias), is maintained by the Indiana Department of Transportation. The Bias database is accessible by local agencies for develop-ing their bridge asset management plan. It is also re-ported to the fhwa on a regular basis to be included in the National Bridge Inventory (nbi) inventory. The most relevant information from the Bias database will be used in developing your bridge asset management plan includes the State and nbi structure numbers, de-scriptive information about the type of structure (such as bridge type, number of spans, and so on), the year the structure was built, its dimensions, and the results of the bridge inspections.
Building an Asset Inventory 15
As with pavements, knowing the year the bridge was constructed or reconstructed can be useful for es-timating when repairs will be needed or determining the rate of deterioration. Other information, such as historic designations, traffic levels, or functional classi-fication of the inventory route, might also be extracted from the Bias database if that information will help you decide what type of repair is needed or whether the bridge is a high priority to your agency.
B U I L D I N G A N I N V E N T O R Y F O R O T H E R A S S E T SSince local agencies manage many transportation as-sets, there may be many other assets that are added to the inventory over time. Curbs and gutters, signs, street lights, small culverts, guardrail, and pavement markings are all types of assets that could be included in an asset inventory if resources are available to col-lect the information and keep it current over time.
Types of Inventory Information CollectedThe same guidance used to identify pavement and bridge inventory items can be applied to any asset. In general, it is important to add information that address-es the questions at the beginning of the chapter. This typically leads to inventory information that:
• Identifies the type of asset.
• Provides a unique identifier.
• Links the asset to a location in the field.
• Captures relevant dimensions.
• Indicates the type of material used for its construction.
Other information that might influence the way an asset is repaired, its priority for funding, or the project cost should also be included in the inventory.
S T O R I N G A N D M A N A G I N G I N V E N T O R Y D ATAAs you build your asset inventory, it is important that you consider how you will store and manage the data. There are several different options available to help you with these tasks, representing a range of costs and sophistication. Regardless of the approach used, it is important to establish protocols to ensure data integ-rity and security.
Some of the common approaches for storing and managing inventory data are discussed below.
Storing Inventory DataThere are several different approaches to storing in-ventory information, ranging from paper records to more sophisticated, computerized databases. For bridges, inventory and condition information is housed in an Indot database that is accessible by local agen-cies. Therefore, the following discussion focuses pri-marily on storing pavement inventory data.
PAPER METHODS
The most basic approach to managing a pavement inventory involves tracking information on paper re-cords. Some agencies use note cards for each pave-ment section in their network, making notations when work is completed or inspections are conducted. This approach is easy to put in place, but it requires manual intervention any time you want to analyze or summa-rize the results. For example, to determine the average condition of your network, you would have to manually

16 Building an Asset Inventory
perform the calculation from the paper files. It is also difficult to share paper records with others.
SPREADSHEETS
A slightly more sophisticated approach is to create a spreadsheet to store inventory information. A spread-sheet is an easy way to build an inventory since most computers contain spreadsheet programs and many people are familiar with their use.
When building a spreadsheet inventory, each row typically represents a pavement section and the col-umns are used for entering inventory data. Columns can also be used for storing pavement condition infor-mation from each historical condition survey.
There are several advantages to using a spread-sheet to store data. In addition to its ease of use and availability, it is relatively easy to perform calculations and generate graphs with the data. Using features built into the spreadsheet tools, data can be sorted, summa-rized, and compared without much difficulty or training.
There are also several disadvantages to the use of spreadsheets. One disadvantage is the ease with which data can be deleted or overwritten. To protect the data in a spreadsheet, it is especially important the information is backed up regularly. Version control is another disadvantage with using spreadsheets as a da-tabase. Using a clear file labeling approach and storing files on a server are two strategies to help overcome version control issues. There are several other disad-vantages, such as having limits on the number of users who can access the file concurrently and limits to the number of records that can be stored, but these may not be significant issues to a local agency.
DATABASES
A more sophisticated approach is to store the inventory data in a database created by the agency using stan-dard database tools or in a pavement management da-tabase that is part of a pavement management system. Today, many databases are relational, linking informa-tion in separate data tables using a unique identifier for each pavement section. Databases often provide stan-dard and customized reporting capabilities so it is easy to report and share data. They also provide better se-curity to protect the data from corruption and they can easily be linked to other agency files.
There are also several disadvantages to storing data in a database. For instance, fewer people are fa-miliar with setting up and using a database program, so the agency may have to rely on outside assistance to start and maintain the system. If the database is con-tained within a pavement management system, it may also require agency personnel to learn how to operate a new software program. If only one person is trained on the operation of the software, and that person leaves the agency, it’s possible that the entire invest-ment in the software could be lost. Therefore, agencies may have to invest more in training and cross-training to keep the system operational when a database is used to store data.
A database makes more sense than a spreadsheet when:
• Multiple spreadsheets are being created contain-ing similar types of data.
• Changes in one spreadsheet require changes in one or more additional spreadsheets.
• Data needs to be shared with other uses.
• More than one person needs to access the data at any one time.
Building an Asset Inventory 17
G I S
A gis is a computerized database management sys-tem that allows spatial data to be sorted, managed, re-trieved, analyzed, and presented in an interactive map display. Pavement inventory information can be man-aged in this way, with different layers used to store dif-ferent types of data. The primary advantage of gis is the accessibility of the information by other users. Its use allows you to make decisions that consider not just the pavement and bridge needs, but also other factors, such as the presence of accessibility ramps at an inter-section or areas where road geometry might contribute to the number of crashes.
One disadvantage to the use of gis as the prima-ry pavement database is ownership. A gis database is usually considered an agency database, so respon-sibility for database administration may reside out of the control of the asset manager. gis may also require specialized expertise that may not be readily available in all agencies. While most agencies have some form of gis layer showing their road network, they may not have staff with sufficient training in data management to be able to add, modify, or report information from a gis database.
One other important consideration is the chal-lenge that may arise if the gis doesn’t have the abili-ty to manage and present several integrated data sets in a single feature, like a pavement management sec-tion. If gis combines relevant data sets into a single table, this could result in data redundancy if new re-cords have to be created each time attributes change. This limitation can be overcome by establishing sep-arate attribute tables or by using a feature called dy-namic segmentation.3
3 Dynamic segmentation is the process of transforming data from multiple sets of attribute data to any portion of a linear feature.
Managing Inventory DataPavement and bridge inventories provide important in-formation needed in an asset management plan. You will also find the information is useful to help respond to questions about your network, such as:
• How many miles of asphalt roads do we have?
• What is the average age of our bridges?
• How many miles of residential streets do we maintain?
This section will provide suggestions for keeping your inventory current, maintaining data quality, and making data accessible.
KEEPING DATA CURRENT
Some types of inventory information change regularly and other information doesn’t. It is important to clas-sify each type of data and establish procedures for its maintenance. For example, information about a road’s functional classification does not change reg-ularly. Therefore, once it is established in the inven-tory, it does not need to be revisited unless a formal change is made. Other information, like the last time a bridge deck was replaced or a road was resurfaced, will change periodically. Complicating this issue further is that some of these periodic changes impact other in-formation in the database, so those links between data elements need to be understood. For instance, if a con-crete road is resurfaced with asphalt, the pavement type changes from concrete to asphalt. Defining these links is a key to keeping your inventory data current.
ADDRESSING ROAD SEGMENTATION CHANGES
One of the most challenging changes that impacts pavement inventories is deciding how to handle

18 Building an Asset Inventory
changes in road segments from year to year. This is es-pecially true on rural roads where pavement sections have been defined based on prior project boundaries. When those boundaries change with a new project, the agency has to decide how to handle the discrepancies in section limits and what to do with historical data.
For example, imagine a road segment that was es-tablished based on an old resurfacing project that went from point A to point B, as shown in the top portion of figure 3-1. For pavement management purposes, this section was defined as section 1. A portion of the sec-tion was resurfaced in 2016, but the project limits did not match the original section. Therefore, the condi-tion of the newly resurfaced section will be much bet-ter than the condition of the original section that was not resurfaced. For pavement management purposes, it makes sense to split this section into two sections, based on the limits of the new resurfacing project, as shown in the bottom portion of the figure. To retain the reference to the original section, note that the new sec-tion identifiers indicate that these are subsets of sec-tion 1 (i.e., Section 1.1 and Section 1.2). This is just one approach that can be used to label new sections; there are plenty of other viable approaches that can be used.
Whatever method is used, it is important that updates are done consistently and in a timely manner.
In the database, the agency should retain the his-torical records from the original section 1 for both of the new sections. However, new information will be added to the inventory for section 1.1 because of the new re-surfacing project.
It is not always as clear cut as to when a new sec-tion should be created. In general, you do not want to establish a new pavement management section unless each section is long enough to represent a reasonable project length.
IDENTIFYING AND ADDRESSING DATA GAPS
Few agencies are able to obtain all the data needed for managing their pavements and bridges. There are several different types of data gaps that may exist, as noted below.
• Incomplete records When populating the da-tabase with certain records, it is possible there will be some instances when it is too difficult to collect a specific data element for one or more sections in the network. The last time major work
Figure 3-1. Example road segmentation change.
Building an Asset Inventory 19
was performed on a bridge or road is an exam-ple of a situation where missing data may occur. The information may be known for a large part of the network, but not for every bridge or road segment. In these instances, it is important to dif-ferentiate between known work dates and “ed-ucated guesses” as to when the last work was conducted. As noted earlier, you may choose to use certain dates in your database as a code that the date is an estimate. For instance, always us-ing January 1st as the construction date is one way of indicating that it is an assumed construc-tion date. In general, it is better to make an at-tempt at populating the entire database rather than leaving anything blank. But, where possible, use codes that let you know the information has been estimated.
• Desired, but uncollected data Over time, as you become more comfortable with your data, you will probably identify additional information to add to your inventory, but haven’t collected. For instance, you may decide to have material properties or traffic data added to your inventory. When these data elements are being considered, you should think about whether your agency has the resources to collect data the first time, and whether you can keep the information current over time. You also need to think about whether there are other data elements that might be eas-ier to collect that could be used as a substitute for what you want. Traffic data is a great example of this. To keep traffic data current, traffic counts would have to be performed regularly. This can be expensive and resource-intensive. Many agencies find that using functional classification is an acceptable substitution for traffic, with pri-mary or arterial roads representing the highest
traffic volumes and tertiary or residential roads representing lower traffic volumes. If an agen-cy is worried about the impact of city buses on roads, it may be possible to work with the transit operator to overlay the bus routes on an agency map to identify principal routes with buses as a way to avoid regular traffic count requirements. If there are not substitutes for the data desired, first check to make sure no one else in your agency has the information you need. If not, you may have to develop procedures for obtaining the information you want to add.
Managing Data QualityThe quality of the data has a direct influence on project and treatment recommendations. If quality is suspect, an agency will have little confidence in the recommen-dations being made. There are two key data quality considerations, data consistency and reliability.
• Data Consistency Inventory information is usually collected by more than one person, so it is important that everyone uses the same rules for collecting and reporting data. For example, if one person identifies a street as 24th Street and another enters it as Twenty-Fourth Street, the information will likely be stored as two different streets.
• Data Reliability The more people can rely on the accuracy of the information in your inven-tory, the more the information will be used with confidence. However, as you begin building your inventory, it is likely that you will occasionally have to use educated guesses or estimates to fill in some data gaps. Suggestions for addressing these types of data gaps were discussed earlier. The more you can populate your inventory with real data that is kept current, the better off you

20 Building an Asset Inventory
will be. In addition, agencies should set up pro-cesses to check for routine data errors, such as missing data, data that doesn’t make sense (e.g., improvements in condition without work having been performed), or data outside normal data ranges (e.g., pavement width > 30 ft on a 2-lane rural road).
Making Data AccessibleOver time you may find that inventory information could be useful to other people within your agency. To help make your data as accessible as possible, consid-er the following factors:
• Who uses the data? If you regularly receive re-quests for information about bridges or pave-ments, it is possible that others would bene-fit from the data. Ask these users about their needs to determine whether they need a report, a spreadsheet, or access to the data itself to perform their duties. It is a good idea to docu-ment users of your data so they are alerted any time there are changes to data formats and are
protected should the data be deleted for any reason.
• Do you have geo-location data? Many local agencies have gis or mapping capabilities for displaying agency data. If asset inventory and condition information is collected using spatial data, the information can easily be overlaid onto a map for display purposes.
• Is your inventory computerized? Depending on the tools you are using to store your invento-ry, there may be ways for users to have rights to view data or run basic reports. If you are using a spreadsheet, it is more difficult to share data be-cause different versions of the spreadsheet may be accessed by different users. In these instanc-es, it is a good idea to identify the “owner” of the spreadsheet tool with responsibility for maintaining the current version on an agency server. Adding password protections help to en-sure the spreadsheet isn’t accidentally corrupted in some way. ■

Rating Asset Conditions 21
C H A P T E R 4Rating Asset Conditions
T H E I M P O R TA N C E O F A S S E T C O N D I T I O N I N F O R M AT I O N
one of the most important things you need to know about assets is their condition. This infor-
mation allows you to decide what repairs are needed now or estimate how long before those repairs will be needed. Asset condition information also lets you re-port your needs and accomplishments to agency lead-ership and elected officials. Condition information also supports agency accountability by allowing you to track what you were able to accomplish with the fund-ing that was provided.
Uses of Condition InformationAsset condition information can be used in many differ-ent ways. Some of the most common ways of using in-formation are introduced here. More details on how to use this information to manage your network are pro-vided in chapter 5.
• Reporting Network Conditions Once you have completed a survey of pavement or bridge conditions, you can develop graphs and reports
that summarize network conditions for sharing both internally and externally. When reporting as-set conditions, many agencies report an average network condition for each asset and may further report conditions based on a subset of the net-work, such as functional classification or bridge element. Figure 4-1 illustrates the type of report that might be used for pavement conditions.
Figure 4-1. Example of a report showing pavement conditions.
22 Rating Asset Conditions
• Setting Targets You can use your asset con-dition information to set targets for the level of service you want to provide to the public. You might refer to these targets as “desirable” or “aspirational” targets, since they are usually in-dependent of available funding. For instance, you might decide that you want the average condition of your principal and minor arterials to be higher than a Pavement Surface Evaluation Rating (Paser) of 8. Depending on the availabil-ity of funding, you may not be able to achieve that condition. For that reason, agencies often set “constrained” or “realistic” targets to explain to elected officials and the public the level of service that they can actually achieve with the funding provided. The difference between the “desirable” and the “constrained” targets rep-resent the “unfunded”, or “performance”, gap. Many agencies convert this gap to a dollar figure representing the additional funding needed to achieve desired conditions.
• Identifying Repairs Asset condition informa-tion is also used to identify the level of repair that is needed so you can select projects and treat-ments that match the available funding. As pre-sented later in this chapter, the overall rating as-signed to a pavement section or bridge gives you a good indication of what type of work is need-ed, as illustrated below.
For paved roads (Paser scores range from 1 to 10 with a 10 representing a pavement in Excellent condition):
» Paser ratings of 8, 9, or 10 indicate that little or no maintenance is needed.
» Paser ratings of 5, 6, or 7 indicate that some preventive maintenance and patching might be needed.
» Paser ratings of 4 or lower indicate that reha-bilitation or reconstruction might be needed.
For bridges (nbi ratings range from 0 to 9, with a 9 representing a bridge in Excellent condition):
» nbi ratings of 8 or 9 indicate that little or no maintenance is needed.
» nbi ratings of 5, 6, or 7 indicate that some routine or capital preventive maintenance work might be needed to restore the integrity and serviceability of the bridge.
» nbi ratings of 4 or lower indicate that structur-al improvements, such as rehabilitation or re-placement, are needed.
• Predicting Future Conditions After you have several years of asset condition information, you can begin to estimate rates of deterioration. These deterioration rates allow you to predict how conditions will change with time so you can plan future funding needs. The ability to predict conditions also improves the way you communi-cate your needs because it allows you to show what will happen in terms of your network con-ditions with different levels of funding. The abil-ity to predict future conditions is not required to develop an asset management plan, but it rep-resents a good practice to improve your asset management capabilities.

Rating Asset Conditions 23
T H E I M P O R TA N C E O F G O O D Q U A L I T Y A S S E T C O N D I T I O N D ATABecause of the many ways that asset condition data is used, it is especially important that steps be taken to ensure its quality. Suggestions for good practice in-clude the following:
• Train your raters Indot requires that Bridge Inspection Engineers and Consultants, as well as Inspection Team Leaders, are trained and qual-ified to perform these duties in the state.4 The fhwa’s National Highway Institute provides for-mal training that must be completed for these positions. For pavements, there is no formal re-quirement, but the Indiana ltap offers cours-es on pavement condition ratings each year throughout the state. Even though the Paser rat-ing method is fairly easy to use, it is a good idea
63% of the respondents to a recent survey
indicated they had attended Paser training
through ltaP in the past year.
for everyone who will be conducting the surveys to complete the training before inspecting any roads for the first time. This training is important to ensure that ratings across the state are con-sistent and comparable. For that reason, it is also important that raters complete refresher cours-es every year or two to make sure that they are
4 http://www.in.gov/dot/div/contracts/standards/bridge/inspector_manual/Part1.pdf
following the same instructions that others are being given.
• Check your raters One way to keep your raters motivated and assure yourself that you’re get-ting good data is to randomly select a portion of the network and have an independent, trained rater inspect the same samples. Compare any differences between the two ratings to deter-mine whether the rater needs additional training or whether other changes are needed to improve consistency with other raters. It is a good idea to perform these checks towards the beginning of each inspection cycle so that if adjustments are needed to the way the ratings are being conduct-ed, you can make the changes before too many surveys have been completed.
• Conduct reasonableness checks on the
data Once you receive the survey results, it is a good idea to check the reasonableness of the data using simple rules. For instance, if you have several years of data, you might check to see there are no increases in condition unless some type of work has been conducted. Changes in condition that exceed the normal rate of dete-rioration might be a flag for validation of sur-vey results. Another easy check is to verify that you have a rating for each bridge element and pavement section so you can see if anything was missed during the survey. These types of checks can be done very quickly in a spreadsheet to high-light possible data omissions or errors to resolve.

24 Rating Asset Conditions
M O N I T O R I N G PA V E M E N T C O N D I T I O N SIndiana ltap supports the use of the Paser system for determining the condition of the roads throughout the state. The Paser method was initially developed by the University of Wisconsin for use by local agencies with-in the State of Wisconsin. Local agencies in Michigan also use the Paser system for evaluating the condition of their roads on a statewide basis, as do other local agencies across the country. Rating manuals for using the Paser system are available at no cost through the University of Wisconsin.5
There are some agencies that use other methods of evaluating pavement conditions. There are many reasons why another method might be used, but most instances are due to the fact their pavement manage-ment software requires a particular method or they have been using the other approach for many years and would hate to lose their historical data. Regardless of what method is used to evaluate pavement condi-tions, it is important to keep the inspections current and to take whatever steps you can to ensure the qual-ity and completeness of the data.
Methods of Evaluating Pavement ConditionThere are two general approaches that are used to evaluate pavement conditions, as described below.
ORDERED STATE RATING SYSTEM
An Ordered State Rating System is a method of visu-al assessment that identifies distresses by type, se-verity, and location and assigns a prescribed condi-tion rating according to type of distress. The nbi bridge rating system is an example of this type of rating for
5 https://epd.wisc.edu/tic/publication/6 https://www.astm.org/Standards/D6433.htm
bridges. Paser is an example of this rating system for pavements. Paser is based on engineering princi-pals and allows for a quick and low cost assessment of pavement conditions that can be repeated over time to measure deterioration of pavements and effective-ness of treatments. This makes Paser popular among local agencies and widely used throughout Indiana, Michigan, and Wisconsin. This type of rating system re-quires standardized training, quality control (qc), and quality assurance (qa) measures to make sure the qual-ity of the data is in close compliance to the standards. There will be rating variations between inspectors, but this can be minimized with proper training, re-training, and a qa/qc program. Paser is a good rating system for local agencies for reasons mentioned here and can be used to analyze an agency network needs, but does not replace an engineering assessment in determining proper treatments.
MEASURED ASSESSMENT METHODS
Another approach to evaluate the condition of a pave-ment is to measure the amount of distress present and use the measurements to calculate a condition index. The Pavement Condition Index (Pci) method devel-oped by the U.S. Army Corps of Engineers and docu-mented in an Astm standard6 is a common measured assessment method for local agencies. Agencies using this methodology inspect samples that adhere to de-fined size requirements and record the type of distress present, the severity of each distress, and the quantity of distress. The sample results are combined to calcu-late a Pci for each section using a 0 to 100 scale, with 100 representing a new road. The advantages to mea-suring distress are that repair quantities can be esti-mated and the ratings are very consistent from rater to

Rating Asset Conditions 25
rater and year to year. The biggest disadvantage is that the ratings require more resources than a visual meth-od, which may be prohibitive for many local agencies.
Methods of Collecting DataPavement condition surveys can be conducted using either manual or automated processes. Manual sur-veys are conducted by individuals who walk along the road or drive slowly over a pavement. They do not re-quire any special equipment beyond traffic control de-vices for rater safety and can be conducted during day-light hours at the convenience of the crew. The survey results can be entered either on paper or in a handheld device, like a tablet computer. Manual surveys typically require a two or three person inspection team so one person can drive while keeping an eye on traffic and the others can conduct the rating. These surveys are fairly labor intensive and they require crews to interact with traffic, which can be a safety hazard. Paser sur-veys are usually conducted using manual surveys.
Figure 4–2. Illustration of automated data collection equipment © 2017 Applied Pavement Technology, Inc.
The other approach to collecting pavement condi-tion information is to use specialized equipment that uses lasers and high-resolution cameras to capture pavement rutting and roughness, pavement surface
images for distress, right-of-way images, grade and cross slope, and Gps coordinates. This type of equip-ment is illustrated in figure 4-2. These vehicles travel at traffic speeds, so they reduce the safety issues with traffic, but the equipment usually requires specialized contractors. The biggest advantage to the use of auto-mated equipment is that other asset data can be col-lected at the same time that pavement condition data is collected. For instance, the cameras can collect im-ages of signs, guardrails, and other assets that are visible from the travel lane. Data collected with these vans is processed in computers using automated and semi-automated techniques.
68% of the local agencies in Indiana that
responded to a survey collect their Paser
data themselves. 30% use a contractor
and 2% have data collected by another
government agency.
According to a recent survey of practice conduct-ed among local agencies in Indiana, 57 percent of the 65 agencies indicated that they record survey infor-mation on paper. Some agencies indicated that they use several methods of recording information, so the total number of responses is more than 100 percent. These additional responses indicate that agencies also use laptops (37 percent) and handheld devices (18 per-cent). Several local agencies also indicated that they are moving towards the use of tablets, are developing an editable form for entering data, or use a combina-tion of paper and Excel or Access.

26 Rating Asset Conditions
Overview of the Paser MethodologyThe Paser rating methodology was developed by the University of Wisconsin for use by local agencies so they could easily evaluate the condition of their pave-ments to better manage their road network. The Paser rating method focuses on evaluating the condition of
89% of the local agencies in Indiana that
responded to a recent survey are using Paser
the pavement surface, since the types of distress that are observed provide indications of whether the dete-rioration is due to structural, climatic, or material prop-erties. Understanding the differences in the types of
7 https://epd.wisc.edu/tic/publication/
distress that may be observed in a pavement surface is a key to using the Paser system effectively.
Paser manuals and rating methods are available for the following road surfaces7:
• Asphalt pavements.
• Concrete pavements.
• Sealcoat pavements (for gravel roads with a sealcoat surface).
• Gravel roads.
• Brick and block roads.
• Unimproved roads.
The rating system for asphalt and concrete pave-ments uses a 1 to 10 scale, with a 10 representing a road in Excellent condition and a 1 representing a Failed road. The sealcoat and gravel road rating meth-odologies each use a 5-point scale with 5 represent-ing a road in Excellent condition and 1 representing a Failed road. The brick and block road rating method and the unimproved road rating use a 1 to 4 scale, with 4 representing a road in Very Good condition and a 1 representing a road in Poor condition.
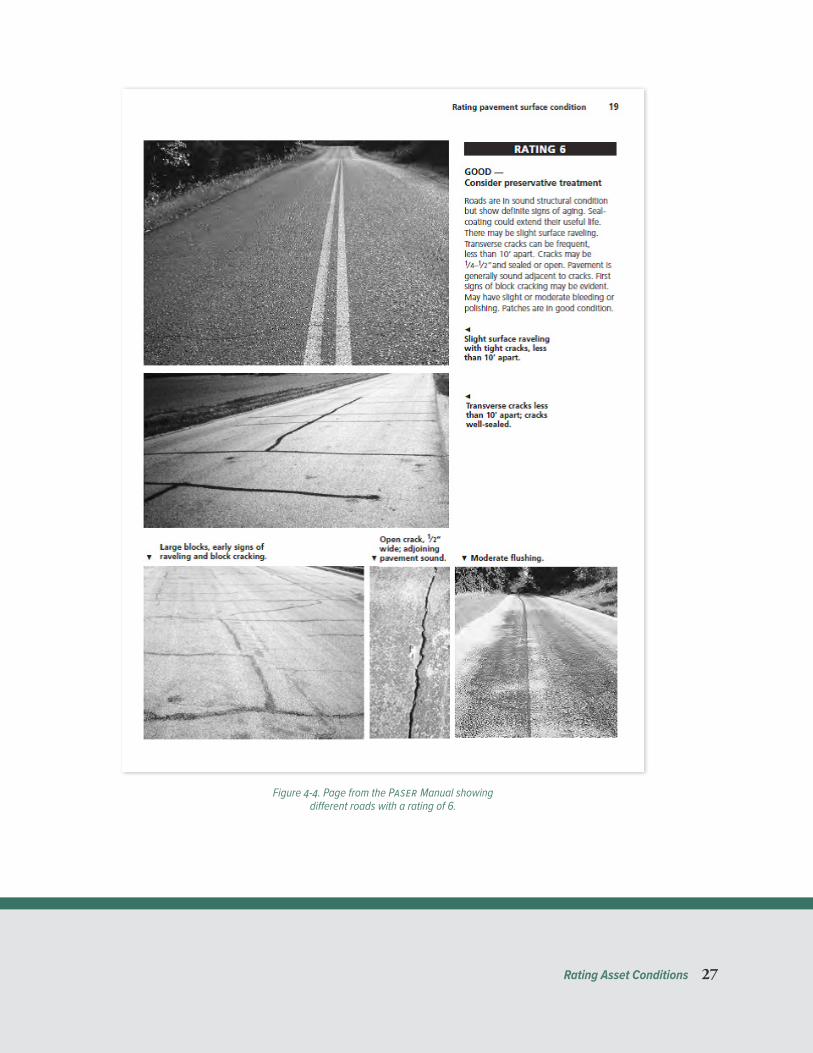
An example page from the Paser Manual for Asphalt Roads is shown in figure 4-4. The Paser Manual introduces each type of distress common to the particular pavement surface and provides photos showing distress at different severity levels. For each numerical rating, the Manual describes the character-istics that should be found and the limits on distress that should be considered when assigning this rating to a road.
Figure 4-3. Cover of the Paser Manual for asphalt roads.
Rating Asset Conditions 27
Figure 4-4. Page from the Paser Manual showing different roads with a rating of 6.
28 Rating Asset Conditions
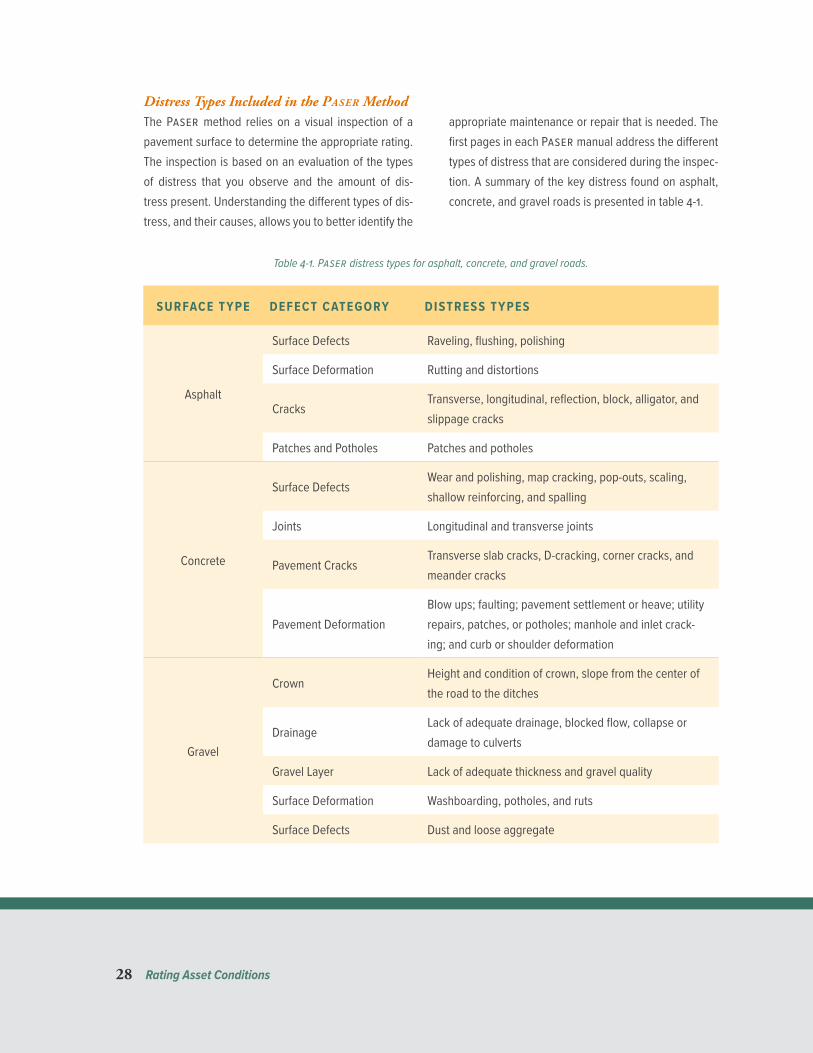
Distress Types Included in the Paser MethodThe Paser method relies on a visual inspection of a pavement surface to determine the appropriate rating. The inspection is based on an evaluation of the types of distress that you observe and the amount of dis-tress present. Understanding the different types of dis-tress, and their causes, allows you to better identify the
appropriate maintenance or repair that is needed. The first pages in each Paser manual address the different types of distress that are considered during the inspec-tion. A summary of the key distress found on asphalt, concrete, and gravel roads is presented in table 4-1.
Table 4-1. Paser distress types for asphalt, concrete, and gravel roads.
SURFACE TYPE DEFECT CATEGORY DISTRESS TYPES
Asphalt
Surface Defects Raveling, flushing, polishing
Surface Deformation Rutting and distortions
CracksTransverse, longitudinal, reflection, block, alligator, and slippage cracks
Patches and Potholes Patches and potholes
Concrete
Surface DefectsWear and polishing, map cracking, pop-outs, scaling, shallow reinforcing, and spalling
Joints Longitudinal and transverse joints
Pavement CracksTransverse slab cracks, D-cracking, corner cracks, and meander cracks
Pavement DeformationBlow ups; faulting; pavement settlement or heave; utility repairs, patches, or potholes; manhole and inlet crack-ing; and curb or shoulder deformation
Gravel
CrownHeight and condition of crown, slope from the center of the road to the ditches
DrainageLack of adequate drainage, blocked flow, collapse or damage to culverts
Gravel Layer Lack of adequate thickness and gravel quality
Surface Deformation Washboarding, potholes, and ruts
Surface Defects Dust and loose aggregate

Rating Asset Conditions 29
When conducting a Paser inspection, it is import-ant to evaluate the types of distress that you see on the road to assign the right rating. The manuals pro-vide you with guidance regarding the amount of dis-tress and distress severity that is common to each rat-ing. You do not have to have all of the distress listed in the description for a particular rating, but you should select the rating description that best matches what you are seeing in the field. Practical advice on conduct-ing inspections is provided in the Paser manual and is also an important part of the ltap training on Paser conducted each year.
According to a survey of local agencies in
Indiana, 62% of the respondents indicate
that they intend to collect Paser data every
year or every other year. 17% either hadn’t
determined the frequency of inspections yet or
used a less frequent interval for inspections.
Frequency of Paser InspectionsIt is a good idea to keep pavement condition ratings current so you know the condition of your roads at any point in time. However, it may not be practical to con-duct inspections each year. For that reason, Indiana ltap recommends that you inspect your roads ev-ery 2 years. If you don’t have the resources to inspect roads that frequently, you might consider inspecting your high-volume roads, or roads with higher function-al classifications, every 2 years and your lower volume
roads at least every 3 to 4 years. At a minimum, you should update your asset management plan annually with the improvements made in your network and rate all roads every two years.
Links Between Paser Ratings and Levels of RepairThe product of pavement inspection is a Paser rating that gives you a good idea of the amount of deteriora-tion present and the level of repair that is needed to remove the deterioration and improve the road condi-tion. The Paser rating is helpful for providing local offi-cials with general information about the level of repair that might be needed, but it doesn’t replace the need for a more detailed engineering analysis to design the appropriate repair. The information can also be used to help local officials understand why one road might be addressed before another road or why a certain treat-ment may, or may not, be a good choice for a particu-lar road.
Table 4-2 illustrates how Paser ratings can be used to estimate the type of repair that might be need-ed for developing your pavement asset management plan. The table links Paser ratings with the expect-ed level of repair for both asphalt and concrete roads. Using this table with local cost estimates for each level of repair, you can quickly put together an estimate of your funding needs to repair your pavement network. For example, if you have 20 miles of asphalt roads with a Paser score of 5, you need approximately $2M to address all of those roads (assuming a repair cost of $100,000 per mile).

30 Rating Asset Conditions
Advantages to the Paser MethodThe advantages to using the Paser method rather than another method are listed below.
• Cost The Paser method is a relatively quick method of collecting pavement condition infor-mation. Raters do not need a lot of training and the surveys can be conducted whenever the in-spectors are available.
• Repeatability Even though the Paser method is fast, the results are very consistent from rater
8 Michigan Asset Management Council. (2011) Asset Management Plan for Pavements: A Template for End Users https://www.ctt.mtu.edu/sites/default/files/resources/Paser/localamplantemp.pdf
9 Indiana ltap Paser Training Manuals
to rater and year to year, as long as the guide-lines provided in the manuals are followed.
• Statewide consistency In addition to having consistent ratings within your locale, the use of a single method of rating pavement conditions makes it much easier to determine local road funding needs on a statewide basis. It also al-lows local agencies in Indiana to share strategies for managing their roads as effectively as possible.
Table 4-2. Levels of repair for asphalt and concrete roads by Paser rating 8, 9
Paser RATING CONDITION LEVEL OF REPAIR SUGGESTED TYPICAL REPAIR COSTS
(PER LANE MILE)
Asphalt Roads
9 and 10 Excellent No maintenance required$0 to $3,000
8 Very Good Little to no maintenance
7 Good Preventive maintenance$5,000 to $100,000
5 and 6 Fair to Good Non-structural preservation treatment
3 and 4 Poor to Fair Structural repair (e.g., overlay)$130,000 to $500,000
1 and 2 Failed Reconstruction
Concrete Roads
9 and 10 Excellent No maintenance required $0
7 and 8 Very Good Routine maintenance$1,000 to $100,000
5 and 6 Fair to Good Preventive maintenance
3 and 4 Poor to Fair Rehabilitation$130,000 to $500,000
1 and 2 Failed Reconstruction

Rating Asset Conditions 31
Keys to a Successful Paser RatingGetting the most out of your Paser ratings requires that each rater makes a commitment to the success factors listed below.
• Raters should consider inspection sites to be a work zones so all agency rules for being in the right-of-way (row) should be followed. This usu-ally means having a working warning light bar or strobe lights on the inspection vehicle, a sign indicating it is a slow moving vehicle or a vehi-cle that can make sudden stops, and class 2 or 3 safety vests. If you are working in an area with high traffic speeds or high traffic volumes, you may also be required to have a shadow vehicle equipped with an arrow board or a sign following the inspection vehicle. Working during off-peak hours can be helpful for reducing the interac-tion of the inspection crews with traffic.
• Each inspection team should consist of at least three raters, with one individual responsible for driving and the other two individuals responsible for conducting the ratings. All individuals should be aware of traffic and avoid any unsafe condi-tions. When conducting the survey, it’s a good idea to drive over the entire segment at a low speed, looking at the types of distress that are present in the surface. The rating assigned to the section should represent the average condition of the segment, not the condition of small areas with more severe distress. It is a good idea to note on the rating form whether these isolated areas exist in a segment so your crews can be in-structed to patch these areas.
• There may be a tendency for some raters to as-sign lower ratings to their roads in the hope that the road will be fixed sooner. To ensure the con-sistency of the ratings on a statewide basis, it is important that all raters resist this temptation and rate the roads in accordance with the Paser Rating Manual. One way to help ensure this kind of thing doesn’t happen is to have inspectors from a neighboring agency conduct your ratings while your raters inspect their roads. This type of cooperation is a good way to improve objectivity of each agency’s inspections.
• Roads should be divided into individual seg-ments with similar construction and condition. On rural roads, the segments may be ½ mile to 1 mile in length. In urban areas, the segments will likely be 1 to 4 blocks in length. The length of each segment should be about the length of a typical rehabilitation project. Because of that, it doesn’t make sense to set up individual seg-ments that are too short. In general, changes in surface type or number of lanes are the types of factors that might prompt you start a new sec-tion. Try to avoid dividing sections based on iso-lated conditions, school zones, or traffic counts.
• Be sure raters know how to handle divided roads, turn lanes, or small medians so they are handled consistently.
• Other recommendations that might be helpful to your crews:
» The Paser rating method focuses on surface distress rather than on the road’s smoothness, or ride. For that reason, inspectors should also focus more on the types of distress they see than the overall ride.
32 Rating Asset Conditions
» Rate the worst lane.
» If you have a pavement segment with more than one pavement type, rate the pavement type as individual segments or split the segments.
» Ignore road ownership or importance when rating road conditions. These factors will in-fluence the priority for fixing the road, but not the condition of the road.
» If you have to rate a segment that is being con-structed, rate it when the construction is fin-ished. If a chip seal has been applied to a seg-ment, the highest score it can receive is an “8” since it is not the same as a new pavement.
» Lighting and shade can make it difficult to see surface distress. When the sun is at your back, it lights up the cracks and hides the contrast. When you’re driving into the sun, there’s usually more contrast so you can see more severe cracks.
» Rate only the main lane (edge line to edge line) and not the shoulder of the road.
M O N I T O R I N G T H E C O N D I T I O N O F B R I D G E SThe nbi has established standards for inspecting and evaluating highway bridges and each state Dot is required to conduct bridge inspections, at least ev-ery other year, in accordance with these standards. These standards are referred to as National Bridge Inspection Standards, or nbis. In Indiana, the Dot en-sures that bridge inspections are conducted on all of the bridges in the state, even those that are the re-sponsibility of a local agency. The current and histor-ical ratings are stored in the Bias database that is ac-cessible by local agencies.
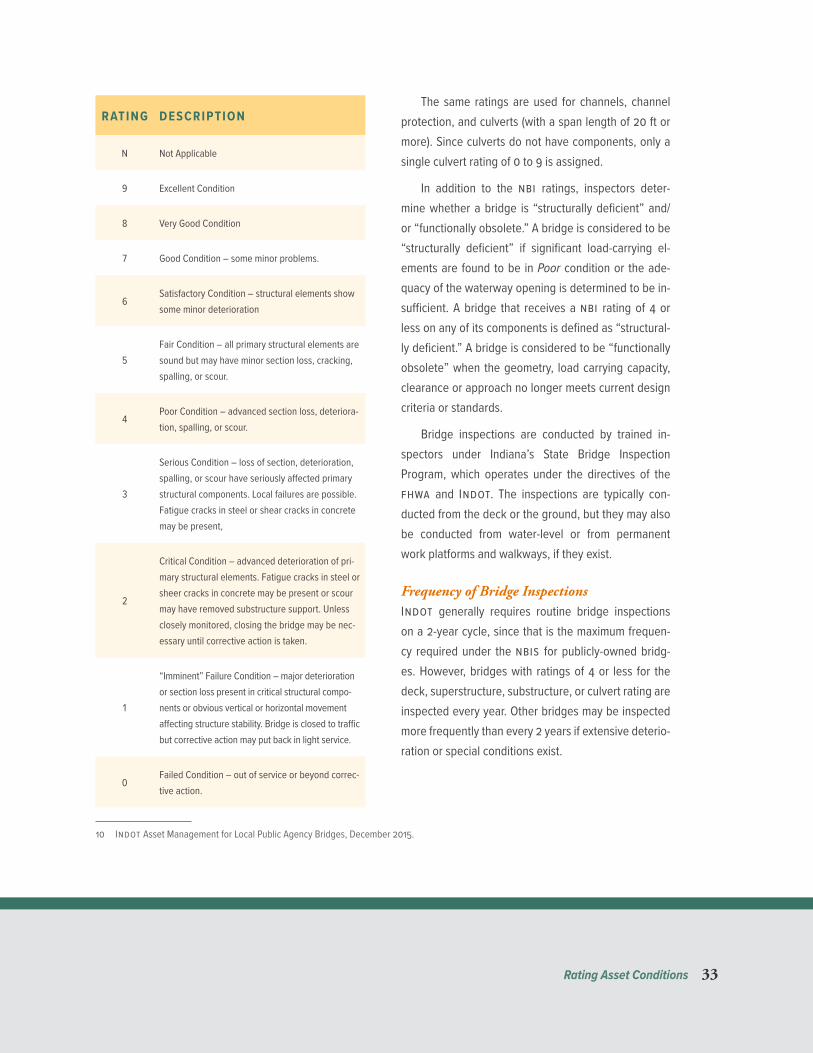
Overview of nbis InspectionsWhen inspecting a bridge, inspectors evaluate the en-tire structure and assign a numerical rating to each bridge component (e.g., deck, superstructure, and sub-structure) that represents the existing condition com-pared to its original as-built condition. The ratings range from 0 to 9, as shown in table 4-3.
Rating Asset Conditions 33
Table 4-3. nbi condition ratings 10.RATING DESCRIPTION
N Not Applicable
9 Excellent Condition
8 Very Good Condition
7 Good Condition – some minor problems.
6Satisfactory Condition – structural elements show some minor deterioration
5Fair Condition – all primary structural elements are sound but may have minor section loss, cracking, spalling, or scour.
4Poor Condition – advanced section loss, deteriora-tion, spalling, or scour.
3
Serious Condition – loss of section, deterioration, spalling, or scour have seriously affected primary structural components. Local failures are possible. Fatigue cracks in steel or shear cracks in concrete may be present,
2
Critical Condition – advanced deterioration of pri-mary structural elements. Fatigue cracks in steel or sheer cracks in concrete may be present or scour may have removed substructure support. Unless closely monitored, closing the bridge may be nec-essary until corrective action is taken.
1
“Imminent” Failure Condition – major deterioration or section loss present in critical structural compo-nents or obvious vertical or horizontal movement affecting structure stability. Bridge is closed to traffic but corrective action may put back in light service.
0Failed Condition – out of service or beyond correc-tive action.
10 Indot Asset Management for Local Public Agency Bridges, December 2015.
The same ratings are used for channels, channel protection, and culverts (with a span length of 20 ft or more). Since culverts do not have components, only a single culvert rating of 0 to 9 is assigned.
In addition to the nbi ratings, inspectors deter-mine whether a bridge is “structurally deficient” and/or “functionally obsolete.” A bridge is considered to be “structurally deficient” if significant load-carrying el-ements are found to be in Poor condition or the ade-quacy of the waterway opening is determined to be in-sufficient. A bridge that receives a nbi rating of 4 or less on any of its components is defined as “structural-ly deficient.” A bridge is considered to be “functionally obsolete” when the geometry, load carrying capacity, clearance or approach no longer meets current design criteria or standards.
Bridge inspections are conducted by trained in-spectors under Indiana’s State Bridge Inspection Program, which operates under the directives of the fhwa and Indot. The inspections are typically con-ducted from the deck or the ground, but they may also be conducted from water-level or from permanent work platforms and walkways, if they exist.
Frequency of Bridge InspectionsIndot generally requires routine bridge inspections on a 2-year cycle, since that is the maximum frequen-cy required under the nbis for publicly-owned bridg-es. However, bridges with ratings of 4 or less for the deck, superstructure, substructure, or culvert rating are inspected every year. Other bridges may be inspected more frequently than every 2 years if extensive deterio-ration or special conditions exist.
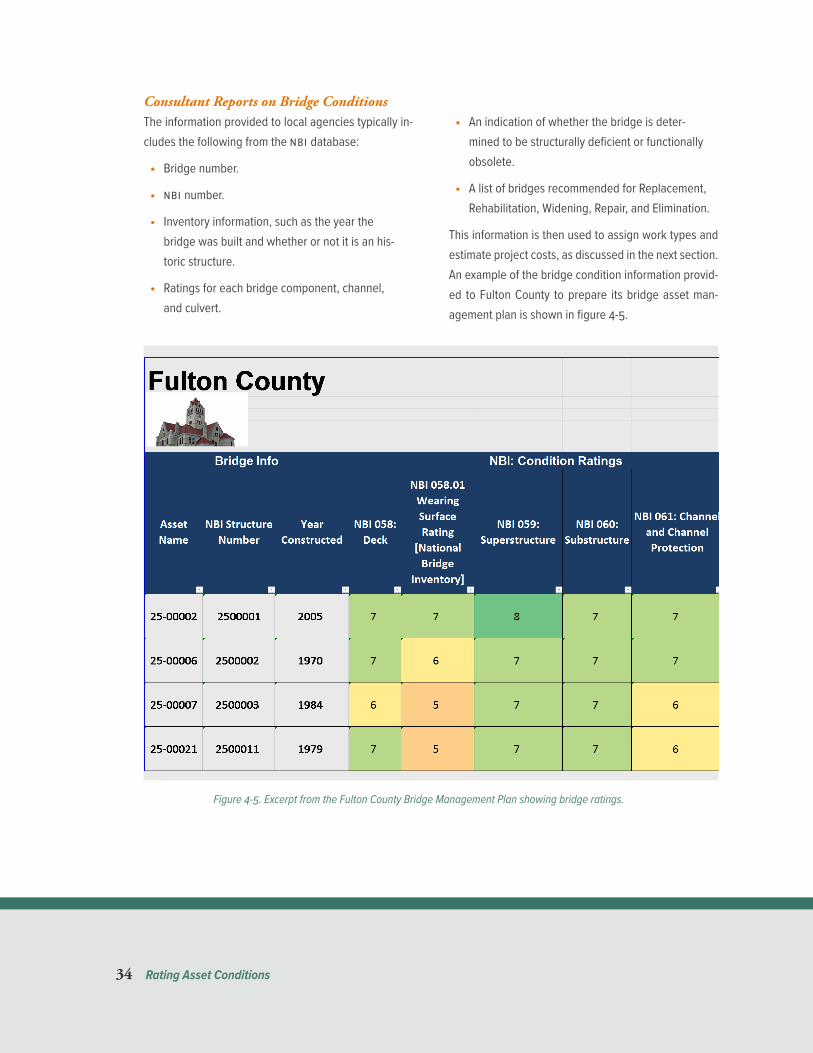
34 Rating Asset Conditions
Consultant Reports on Bridge ConditionsThe information provided to local agencies typically in-cludes the following from the nbi database:
• Bridge number.
• nbi number.
• Inventory information, such as the year the bridge was built and whether or not it is an his-toric structure.
• Ratings for each bridge component, channel, and culvert.
• An indication of whether the bridge is deter-mined to be structurally deficient or functionally obsolete.
• A list of bridges recommended for Replacement, Rehabilitation, Widening, Repair, and Elimination.
This information is then used to assign work types and estimate project costs, as discussed in the next section. An example of the bridge condition information provid-ed to Fulton County to prepare its bridge asset man-agement plan is shown in figure 4-5.
Figure 4-5. Excerpt from the Fulton County Bridge Management Plan showing bridge ratings.

Rating Asset Conditions 35
Links Between nbi Ratings and Levels of Repair
11 Lpa Bridge Program information can be found here: http://www.in.gov/indot/2390.htm.12 Indot Asset Management for Local Public Agency Bridges, December 2015.
The nbi rating for any component can be used to iden-tify the needed category of repair, as shown in ta-ble 4-4. Depending on the rating of each component, bridges are typically scheduled for preventive main-tenance, rehabilitation, or reconstruction work to ad-dress the deficiency.
Indot provides funding for bridges in each catego-ry according to criteria established for the Local Public Agency (lpa) Bridge Program11. A sufficiency rating,
which combines structural adequacy (55 percent), ser-viceability and functional obsolescence (30 percent), and essentiality for public use (15 percent), is used to determine eligibility for federal funding. A score of 100 represents a completely sufficient structure to remain in service and a 0 represents a completely insufficient structure. Bridges with a sufficiency rating below 80 qualify for rehabilitation funding. A sufficiency rating below 50 qualifies a bridge for replacement funds. ■
Table 4-4. Levels of bridge repair by nbi rating12.
nbi RATING CONDITION STRUCTURAL ADEQUACY LEVEL OF REPAIR SUGGESTED
N Not Applicable No maintenance required
9 Excellent
Scheduled preventive maintenance8 Very Good
7 Good
6 SatisfactoryPreventive maintenance or repair
5 Fair
4 Poor
Structurally Deficient Rehabilitation or Reconstruction
3 Serious
2 Critical
1“Imminent” Failure Condition
0 Failed


Setting Targeted Levels of Services 37
C H A P T E R 5Setting Targeted Levels of Service
onCe you have your inventory established and know the condition of your pavements and
bridges, you can set targets for the level of service you would like to provide. There are several steps to this process. First, you have to estimate the level of fund-ing you think will be available for pavement and bridge repairs and improvements. Second, you have to identi-fy any legislated requirements that will have to be ad-dressed before anything else. The final step in the pro-cess is establishing your targeted level of service. Each of these steps is discussed in more detail in this chapter.
E S T I M AT I N G F U N D I N G L E V E L S
Available FundingThe first step in setting a targeted level of service is to estimate the amount of money you expect to be able to put towards the maintenance and rehabilitation of your roads and bridges.
Funding SourcesLocal agencies typically fund their programs through a combination of federal, state, and local funds. The Federal Aid portion of the program is dictated by fed-eral statute and regulations. When federal funds are used, the public is provided an opportunity to provide comments on the projects that are selected. A local agency with federally-funded projects that fall with-in a Metropolitan Planning Organization (mpo) must work with the Mpo to include the project in region’s Transportation Improvement Program (tip). Federally-funded projects that do not fall within an Mpo are in-cluded on the Statewide Transportation Improvement Program (stip) developed by Indot.
Indot administers the State’s Local Road and Bridge Matching Grant Fund, known as Community Crossings, which provides funds through an application process. A local agency must have an approved asset manage-ment plan to receive funds through this program.
Additional funding is provided from various state and local sources, including the local portion of the tax on gasoline, wheel tax and excise surtax, cumulative bridge
38 Setting Targeted Levels of Services
funds, bond sales, and general funds. Each of these funding sources may have limitations on how the mon-ey can be used that has to be taken into consideration.
Estimating the Amount of Available FundingTo help prepare your estimate of available funding, think about the following types of questions.
• How much money has been available for road and bridge improvements over the last several years? Has that amount varied each year or has it been relatively constant?
• Are there any new sources of funding that might be available? If you are preparing an asset management plan for your pavements and bridges, you may be eligible for funds under Indiana’s Local Road and Bridge Matching Grant Fund that provides a match to your local dollars for eligible projects.
• Are there any factors that might decrease the level of funding available? For instance, has revenue from the local gas tax dropped in recent years?
The answers to these questions will help you prepare an estimate of the level of funding you expect over the next few years. For your roads, the pavement asset management plan asks you to identify projects for the next 5 years, so you need to estimate at least that far in advance. For bridges, the asset management plan asks for a 10-year plan, so you will need to forecast the fund-ing available for bridges for at least that long.
NEEDED FUNDING
In addition to estimating the amount of funding avail-able for your asset management plan, it’s also a good
idea to estimate how much funding it would take if you wanted to address all of your needs. No agency ex-pects to be able to get enough funding to address all of its needs at one time, but the difference between the funding level that’s available and the funding lev-el you need is an important number to share with your agency leadership and elected officials. It represents the “backlog” in work that is needed but isn’t funded. If your backlog is growing over time, it means that you are not putting enough money into the network and the value of your assets is probably dropping. This is sim-ilar to a vehicle owner who doesn’t do the necessary maintenance on a car or truck. After several years of neglected maintenance, the vehicle can be expected to have a growing number of problems and the value you would receive if you tried to sell the vehicle would be much less than if the vehicle had been maintained.
You can estimate the funding you need by multi-plying the number of miles in each Paser or nbi rating category with the average cost of repairs for the type of work needed at that condition level. An example for a small road network is shown in table 5-1. In this ex-ample, the agency has a total of $24,525,000 in needs on its road network. If we assume that the agency re-ceives $2m in funding each year, there is a $22,525,000 backlog of unfunded needs, showing that the agency is funding less than 10 percent of its needs each year. Unless something significant changes in terms of avail-able funding, this agency can expect to see its back-log continue to grow over time. Indiana ltap provides a Road Treatment Summary template that can be used to estimate pavement needs. The spreadsheet can be found on the ltap website (http://wpvecnltap01.itap.purdue.edu/ltap/main.php).
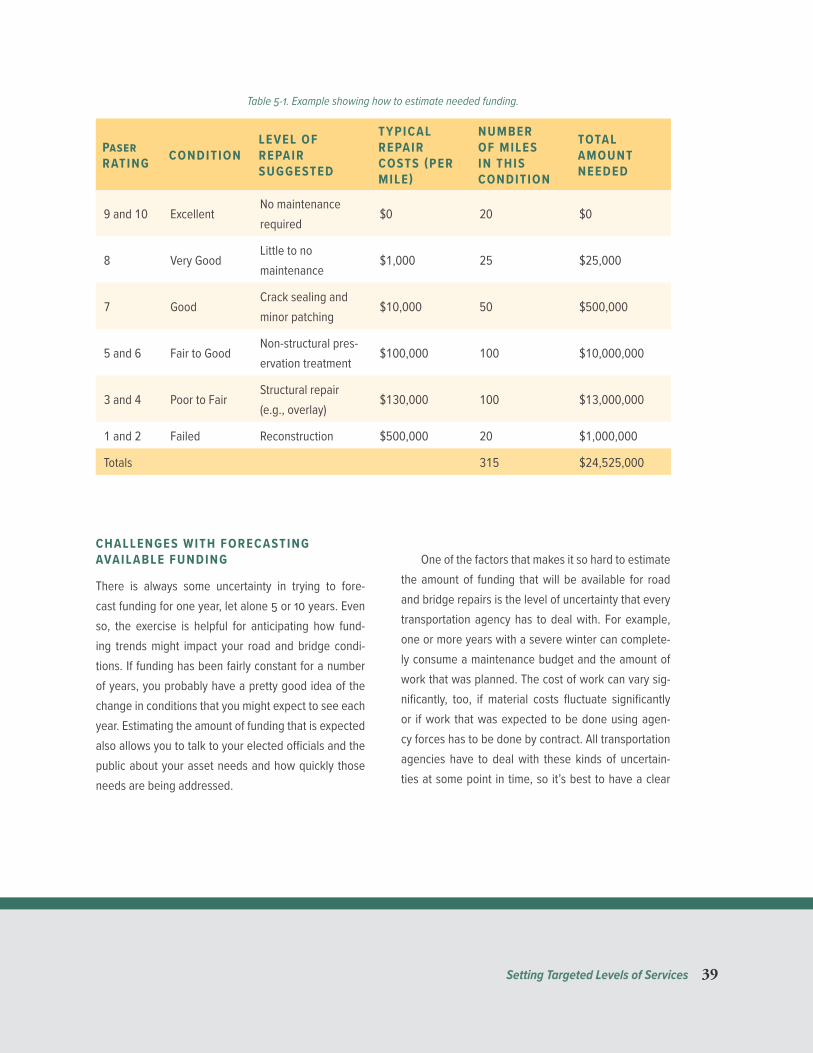
Setting Targeted Levels of Services 39
Table 5-1. Example showing how to estimate needed funding.
Paser RATING CONDITION
LEVEL OF REPAIR SUGGESTED
TYPICAL REPAIR COSTS (PER MILE)
NUMBER OF MILES IN THIS CONDITION
TOTAL AMOUNT NEEDED
9 and 10 ExcellentNo maintenance required
$0 20 $0
8 Very GoodLittle to no maintenance
$1,000 25 $25,000
7 GoodCrack sealing and minor patching
$10,000 50 $500,000
5 and 6 Fair to GoodNon-structural pres-ervation treatment
$100,000 100 $10,000,000
3 and 4 Poor to FairStructural repair (e.g., overlay)
$130,000 100 $13,000,000
1 and 2 Failed Reconstruction $500,000 20 $1,000,000
Totals 315 $24,525,000
CHALLENGES WITH FORECASTING AVAILABLE FUNDING
There is always some uncertainty in trying to fore-cast funding for one year, let alone 5 or 10 years. Even so, the exercise is helpful for anticipating how fund-ing trends might impact your road and bridge condi-tions. If funding has been fairly constant for a number of years, you probably have a pretty good idea of the change in conditions that you might expect to see each year. Estimating the amount of funding that is expected also allows you to talk to your elected officials and the public about your asset needs and how quickly those needs are being addressed.
One of the factors that makes it so hard to estimate the amount of funding that will be available for road and bridge repairs is the level of uncertainty that every transportation agency has to deal with. For example, one or more years with a severe winter can complete-ly consume a maintenance budget and the amount of work that was planned. The cost of work can vary sig-nificantly, too, if material costs fluctuate significantly or if work that was expected to be done using agen-cy forces has to be done by contract. All transportation agencies have to deal with these kinds of uncertain-ties at some point in time, so it’s best to have a clear

40 Setting Targeted Levels of Services
understanding of how to take them into account when putting together your asset management plan. One approach is to build in a contingency of about 10 per-cent of your budget for unexpected events. That way, you have money available should the need arise. If it doesn’t, you can use the money to get ahead on reduc-ing your backlog.
I D E N T I F Y I N G O T H E R F A C T O R S T H AT I M PA C T T H E P R O G R A MIn addition to having an estimate of how much fund-ing will be available over the next 5 to 10 years, you also have to identify any legislated or other require-ments that have to be funded before anything else. For example, recent federal legislation (i.e., Moving Ahead for Progress in the 21st Century [map-21] or the Fixing America’s Surface Transportation [fast] Acts) included requirements that no more than 5 per-cent of Interstates and 10 percent of bridge decks on the National Highway System can be in Poor condition. Although state Dots are tasked with making sure these minimum conditions aren’t exceeded, they illustrate the way legislation can impact your program. At the lo-cal level, requirements such as the federal mandate for sign retro-reflectivity, the expected requirements for pavement markings, and existing requirements for ad-dressing American Disability Act (ada) requirements, are all factors that have to be considered when putting together an improvement plan.
There may also be agency priorities that have to be considered when putting together your program. For instance, if your community made commitments to a lo-cal business as part of an economic development pro-gram, a portion of your budget may have to be used to fund that project. Or, if your agency is working on
a program to address deteriorated culverts in a flood zone, it’s possible that some money that would have gone toward road or bridge repairs is diverted for a couple of years while that initiative is in place. When putting together your asset management plan, do the best job you can of finding out whether or not there are any of these kinds of requirements in place that will have to be addressed during the plan period.
U S I N G T H E I N F O R M AT I O N T O S E T TA R G E T E D L E V E L S O F S E R V I C EArmed with your estimates of available funding and your knowledge of any requirements that have to be addressed, you are ready to estimate the level of ser-vice you expect to be able to provide.
Setting a performance target allows you to estab-lish a goal for the level of service you expect to achieve when your asset management plan is implemented. It is useful for communicating with agency leadership, elected officials, and the public so they know what to expect in the coming years. It is also a good way to es-tablish accountability within your organization. It shows that you are a good steward of the assets you man-age and that there is a strategic, thought-out process in place.
The process of developing a targeted level of ser-vice requires a balance between the amount of fund-ing you expect to receive, the treatments you intend to fund, and the conditions you hope to achieve. This balance is reflected in figure 5-1. As you might expect, if you set too high a target, you will need more mon-ey than you have available. If you set too low a tar-get, your community may express their unhappiness

Setting Targeted Levels of Services 41
through their elected officials. The challenge is to be realistic without setting expectations that are too high.
Figure 5-1. Balance required to set a level of service target. © 2017 Applied Pavement Technology, Inc.
What Should We Use As a Target?There are many different types of performance mea-sures that can be used to set a target and each has ad-vantages and disadvantages. The most commonly used performance measures used in asset management are related to the method used to rate asset conditions. However, sometimes those measures are simplified so that elected officials and the public understand their message. For example, most people wouldn’t under-stand the difference between an nbi rating of 6 ver-sus 7 as a target. Similarly, most people wouldn’t know whether a Paser rating of 6 is okay to use as a level of service target for the network. These ratings don’t often work because they aren’t commonly understood outside the transportation community.
Even so, many agencies choose to use an average rat-ing or a weighted13 average rating as their target. A
13 A weighted average is calculated by summing up the product of the rating for each section times its area. The sum is then divided by the total area of the network to determine the weighted average.
weighted average is considered to be a better repre-sentation of conditions than a straight average since it takes into account the amount of area at each rating. Think about a network with one really large bridge with a bridge deck in Poor condition (nbi rating of 4) and one small bridge with its bride deck in Very Good condi-tion (nbi rating of 8). The average nbi rating for bridge decks is 6, which could be used as the target. However, if a weighted average was used, the target would be 5 (assuming the large bridge deck area is 100,000 sq.ft. and the small bridge deck area is 40,000 sq.ft.).
To address the concern that people don’t under-stand Paser or nbi ratings, many agencies choose to set a target related to the percent of the pavements or bridges in Good or Fair condition. This may be sup-plemented with an additional target for the maximum on the percent of the network in Poor condition. Even though you use your Paser or nbi ratings to determine the percentage of the network at these condition lev-els, it’s easier for elected officials and the public to un-derstand terms such as Good, Fair, or Poor. Using this approach, an agency may set a level of service target so that 70 percent of its pavement network is in Good or Fair condition and no more than 5 percent can be in Poor condition.
Some examples of performance targets are listed below:
• Weighted average network Paser rating > 70.
• At least 70 percent of the network area with a Good or Fair rating.
• Reduce the percentage of roads in Poor condi-tion from 40% to 25% within 5 years.

42 Setting Targeted Levels of Services
• Average weighted Pavement Condition Index (Pci) > 70 (out of 100).
• All streets with Paser rating ≥ 5.
• Weighted average Paser rating of 8 on arterial roads within 5 years.
A good target should include both the condition you want to achieve as well as the timeframe for achieving it. If you are developing a 5-year pavement asset man-agement plan or a 10-year bridge asset management plan, it makes sense that your targets will be tied to the dates covered in your plans.
Setting One or More Targeted Levels of ServiceOne of the easiest ways to set a targeted level of ser-vice is to look at past trends in the level of service that has been provided. Assuming that funding levels have been relatively constant, and material cost increases have been fairly constant each year, you can expect that future trends will be fairly similar to those from the past.
For example, figure 5-2 shows two different scenari-os. On the left side is an example in which asset con-ditions have remained relatively constant over time, so
the targeted level of service is set at that level (Paser rating of 7). The example on the right shows a network that is deteriorating a little each year. Expecting the same amount of deterioration over the next several years, the level of service target for this network is set at a Paser rating of 6.
Figure 5-3. Example of predicted conditions in 5 years.
If you have a pavement or bridge management sys-tem with models that predict conditions over time, you can use the software to help you set a reasonable tar-get. An example of the type of output you might get from a pavement management system is shown in fig-ure 5-3. In this example, a 5-year target might be set
Figure 5-2. Examples showing how historical data can be used to set performance targets.

Setting Targeted Levels of Services 43
at an average Paser rating of 7, but a 10-year target would have to be set at a lower condition. The predict-ed conditions allow you to quickly examine the way asset conditions will change. You can use these types of tools to compare conditions with different levels of funding or different projects and treatments.
Rather than set just one performance target, an agency may choose to set different targets for differ-ent parts of their network. For instance, different tar-gets could be set for each bridge component or for each road functional classification. This allows you to place a higher priority on certain parts of your network so it is easier to prioritize the projects that are fund-ed. These priorities are usually linked to the number of people who are using that asset. For instance, an agen-cy might set the targeted condition for its arterial roads at a Paser rating of 8, but set the target for the collec-tors and residential roads at a Paser rating of 6.
You should review your targets annually to see whether you are making progress towards meeting
your objectives. If there are major changes to the fund-ing that’s available, or there are other factors that im-pact your ability to reach your targets, you should ad-just the targets appropriately and inform your elected officials of the changes.
Realistic and Aspirational TargetsWhen a target is matched to the level of funding, it is referred to as a “realistic” or “constrained” tar-get because it represents the conditions you expect to achieve. However, in most agencies the realistic target does not represent the level of service they think they should be providing. For that reason, some agencies set an “aspirational” target that represents the level of service they think they should be provid-ing in addition to the realistic target. When an aspi-rational target is used, it is most commonly used as a way of showing elected officials that funding levels are not sufficient to provide the level of service that the community is expecting. ■

Developing a Program With a Mix of Fixes 45
C H A P T E R 6 Developing a Program With a Mix of Fixes
the next step in the tam process is to develop a multi-year program that lists the projects and
treatments that should be funded over a 5-year win-dow for pavements and a 10-year window for bridg-es. Candidate projects should be selected to help you meet your targeted levels of service.
There are many different approaches that an agen-cy can take to develop its program and some lead to better conditions than others. One of the objectives of a tam approach is to help you find the combination of treatments and strategies that makes the best use of the available funding and leads to the best possi-ble performance. For that reason, this Guide promotes a “mix of fixes” that puts some funding towards pave-ments and bridges in need of major rehabilitation or re-construction, but also puts money towards roads and bridges in Good and Fair condition to slow down their rate of deterioration and keep them in operational con-dition as long as possible. A “mix of fixes” will always be a more cost-effective use of funding than the more traditional worst-first strategy that doesn’t address as-sets until they are in Poor condition.
This chapter will help you use your condition data to decide what treatments are needed and to develop
a multi-year program that is made up of a “mix of fixes.” It also shows you how one local agency has gotten more out of each dollar that it puts into its road system by following this strategy.
U S I N G C O N D I T I O N D ATA T O D E T E R M I N E R E PA I R N E E D SIn chapter 3 we introduced two tables showing how Paser and nbi ratings can be used to determine the level of repair that is needed for your pavements and assets. Those tables are reproduced here for your con-venience as tables 6-1 for roads and 6-2 for bridges. In addition, we have expanded the tables in Appendix A to include more information on the types of treatments that might be used in each category and the expected life if the treatment is applied at the right time. If you have pavement or bridge management software, you can incorporate the treatments from these tables into your software program so it can generate the treat-ment recommendations automatically.
Each of these levels of repair is intended to address different types of asset deterioration. The Paser and

46 Developing a Program With a Mix of Fixes
nbi scores help you decide which of the treatments is right for a specific road or bridge. General guidance on each category of repair is provided below.
• Preventive maintenance These treatments are applied to pavements and bridges that are in rel-atively good condition. They are usually low-cost treatments that are applied to slow the rate of deterioration or restore certain properties, such as a road’s skid-resistance properties. Preventive maintenance treatments can be applied regularly as part of a scheduled program (such as bridge washing) or the treatments can be triggered based on an asset condition rating. The value of preventive maintenance treatments lies in their ability to preserve asset conditions and avoid fur-ther deterioration for a very low cost.
Preventive maintenance and non-structural
preservation treatments represent “the best
bang for the buck.”
There are times that agencies use these types of treatments on roads that are not good can-didates as a way to keep the asset operational before funding is available for rehabilitation or reconstruction. These applications should not be classified as a preventive maintenance treatment and the life expectancy under these types of con-ditions will be much shorter than those shown in Appendix A.
• Non-structural preservation treatment Preservation is a broad category of treatments that can include preventive maintenance activ-ities as well as minor rehabilitation activities, such as thin overlays or micro-surfacing. Non-structural preservation treatments are usual-ly less than 2 inches in depth and are designed to address age-related problems (such as block cracking) or distress caused by exposure to the elements (such as transverse cracking). When these treatments are applied to assets with-out much structural deterioration, they can be very cost-effective. Preventive maintenance and non-structural preservation treatments often rep-resent “the best bang for the buck” in a transpor-tation agency.
• Rehabilitation or structural repairs When assets have deteriorated significantly, more sub-stantial repairs are necessary. Rehabilitation treatments include structural enhancements that extend the service life and improve the ability to carry traffic loads.
• Reconstruction or replacement When assets are considered to have failed, they are candi-dates for reconstruction or replacement. For a road, reconstruction usually requires the com-plete removal and replacement of the existing pavement structure using either new or recy-cled materials. For bridges, various components of the bridge may be replaced when they are in failed condition and considered to be structurally and/or functionally obsolete.
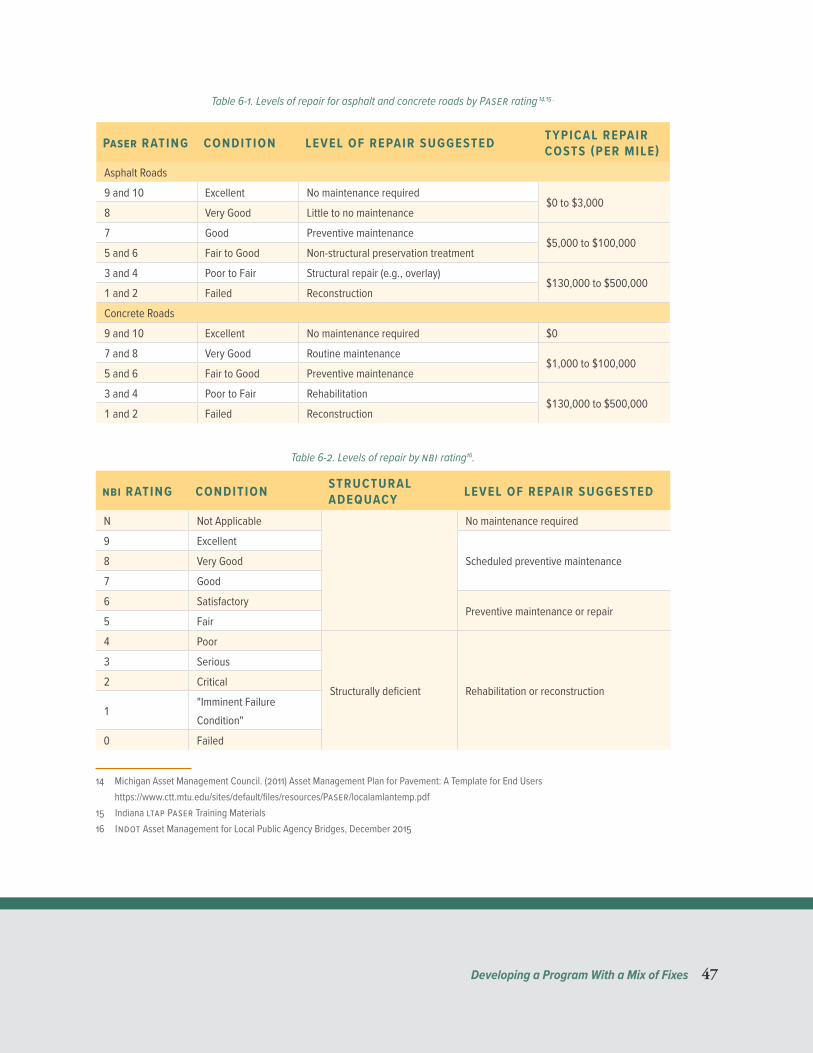
Developing a Program With a Mix of Fixes 47
Table 6-1. Levels of repair for asphalt and concrete roads by Paser rating 14,15 .
Paser RATING CONDITION LEVEL OF REPAIR SUGGESTED TYPICAL REPAIR COSTS (PER MILE)
Asphalt Roads
9 and 10 Excellent No maintenance required$0 to $3,000
8 Very Good Little to no maintenance
7 Good Preventive maintenance$5,000 to $100,000
5 and 6 Fair to Good Non-structural preservation treatment
3 and 4 Poor to Fair Structural repair (e.g., overlay)$130,000 to $500,000
1 and 2 Failed Reconstruction
Concrete Roads
9 and 10 Excellent No maintenance required $0
7 and 8 Very Good Routine maintenance$1,000 to $100,000
5 and 6 Fair to Good Preventive maintenance
3 and 4 Poor to Fair Rehabilitation$130,000 to $500,000
1 and 2 Failed Reconstruction
Table 6-2. Levels of repair by nbi rating16.
nbi RATING CONDITION STRUCTURAL ADEQUACY LEVEL OF REPAIR SUGGESTED
N Not Applicable No maintenance required
9 Excellent
Scheduled preventive maintenance8 Very Good
7 Good
6 SatisfactoryPreventive maintenance or repair
5 Fair
4 Poor
Structurally deficient Rehabilitation or reconstruction
3 Serious
2 Critical
1"Imminent Failure Condition"
0 Failed
14 Michigan Asset Management Council. (2011) Asset Management Plan for Pavement: A Template for End Users https://www.ctt.mtu.edu/sites/default/files/resources/Paser/localamlantemp.pdf
15 Indiana ltap Paser Training Materials16 Indot Asset Management for Local Public Agency Bridges, December 2015
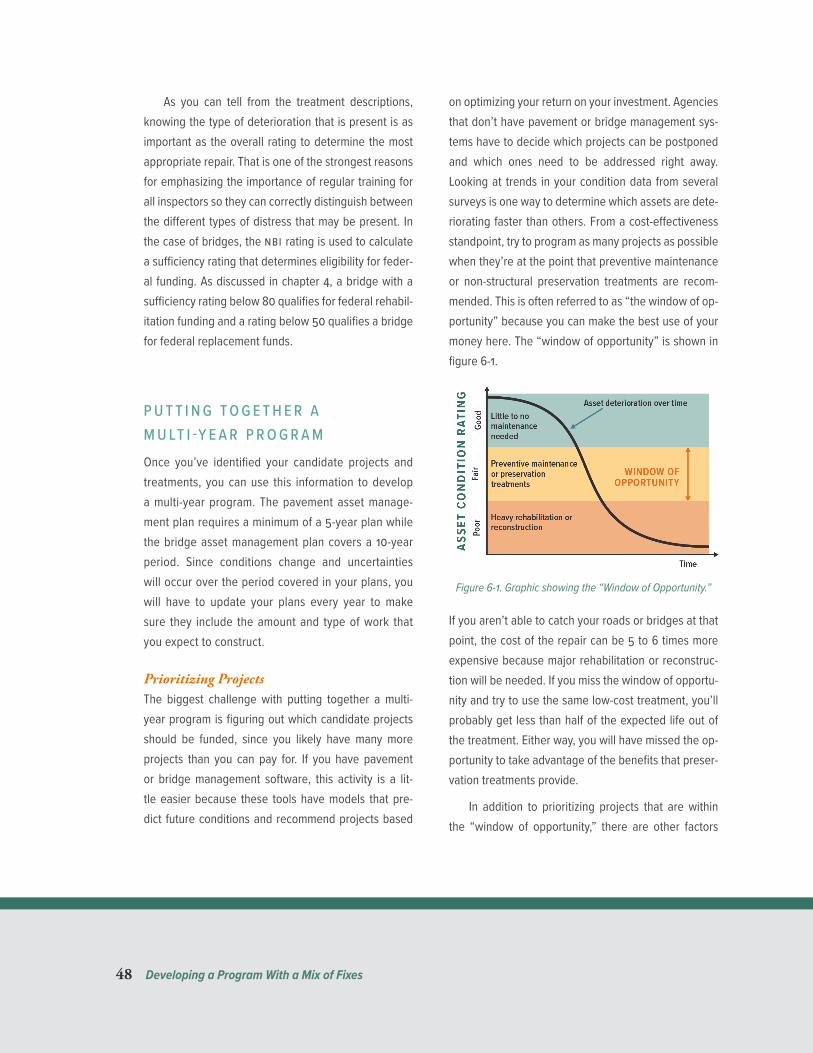
48 Developing a Program With a Mix of Fixes
As you can tell from the treatment descriptions, knowing the type of deterioration that is present is as important as the overall rating to determine the most appropriate repair. That is one of the strongest reasons for emphasizing the importance of regular training for all inspectors so they can correctly distinguish between the different types of distress that may be present. In the case of bridges, the nbi rating is used to calculate a sufficiency rating that determines eligibility for feder-al funding. As discussed in chapter 4, a bridge with a sufficiency rating below 80 qualifies for federal rehabil-itation funding and a rating below 50 qualifies a bridge for federal replacement funds.
P U T T I N G T O G E T H E R A M U LT I -Y E A R P R O G R A MOnce you’ve identified your candidate projects and treatments, you can use this information to develop a multi-year program. The pavement asset manage-ment plan requires a minimum of a 5-year plan while the bridge asset management plan covers a 10-year period. Since conditions change and uncertainties will occur over the period covered in your plans, you will have to update your plans every year to make sure they include the amount and type of work that you expect to construct.
Prioritizing ProjectsThe biggest challenge with putting together a multi-year program is figuring out which candidate projects should be funded, since you likely have many more projects than you can pay for. If you have pavement or bridge management software, this activity is a lit-tle easier because these tools have models that pre-dict future conditions and recommend projects based
on optimizing your return on your investment. Agencies that don’t have pavement or bridge management sys-tems have to decide which projects can be postponed and which ones need to be addressed right away. Looking at trends in your condition data from several surveys is one way to determine which assets are dete-riorating faster than others. From a cost-effectiveness standpoint, try to program as many projects as possible when they’re at the point that preventive maintenance or non-structural preservation treatments are recom-mended. This is often referred to as “the window of op-portunity” because you can make the best use of your money here. The “window of opportunity” is shown in figure 6-1.
Figure 6-1. Graphic showing the “Window of Opportunity.”
If you aren’t able to catch your roads or bridges at that point, the cost of the repair can be 5 to 6 times more expensive because major rehabilitation or reconstruc-tion will be needed. If you miss the window of opportu-nity and try to use the same low-cost treatment, you’ll probably get less than half of the expected life out of the treatment. Either way, you will have missed the op-portunity to take advantage of the benefits that preser-vation treatments provide.
In addition to prioritizing projects that are within the “window of opportunity,” there are other factors
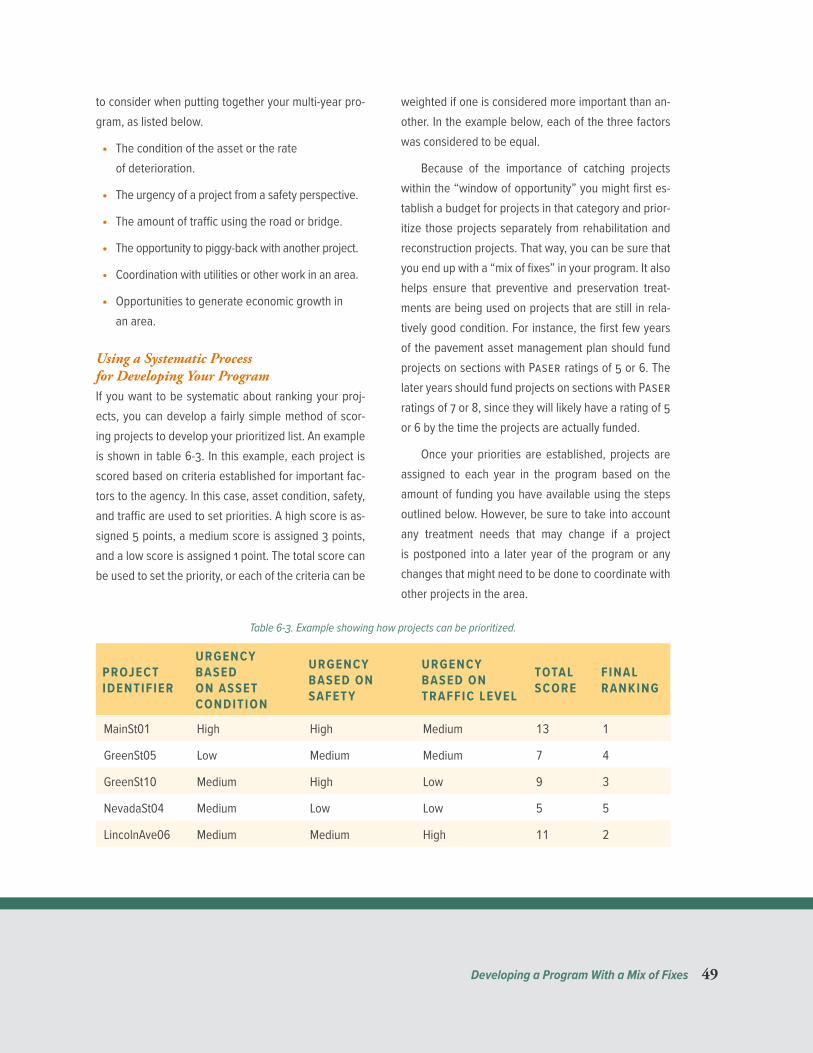
Developing a Program With a Mix of Fixes 49
to consider when putting together your multi-year pro-gram, as listed below.
• The condition of the asset or the rate of deterioration.
• The urgency of a project from a safety perspective.
• The amount of traffic using the road or bridge.
• The opportunity to piggy-back with another project.
• Coordination with utilities or other work in an area.
• Opportunities to generate economic growth in an area.
Using a Systematic Process for Developing Your ProgramIf you want to be systematic about ranking your proj-ects, you can develop a fairly simple method of scor-ing projects to develop your prioritized list. An example is shown in table 6-3. In this example, each project is scored based on criteria established for important fac-tors to the agency. In this case, asset condition, safety, and traffic are used to set priorities. A high score is as-signed 5 points, a medium score is assigned 3 points, and a low score is assigned 1 point. The total score can be used to set the priority, or each of the criteria can be
weighted if one is considered more important than an-other. In the example below, each of the three factors was considered to be equal.
Because of the importance of catching projects within the “window of opportunity” you might first es-tablish a budget for projects in that category and prior-itize those projects separately from rehabilitation and reconstruction projects. That way, you can be sure that you end up with a “mix of fixes” in your program. It also helps ensure that preventive and preservation treat-ments are being used on projects that are still in rela-tively good condition. For instance, the first few years of the pavement asset management plan should fund projects on sections with Paser ratings of 5 or 6. The later years should fund projects on sections with Paser ratings of 7 or 8, since they will likely have a rating of 5 or 6 by the time the projects are actually funded.
Once your priorities are established, projects are assigned to each year in the program based on the amount of funding you have available using the steps outlined below. However, be sure to take into account any treatment needs that may change if a project is postponed into a later year of the program or any changes that might need to be done to coordinate with other projects in the area.
Table 6-3. Example showing how projects can be prioritized.
PROJECT IDENTIFIER
URGENCY BASED ON ASSET CONDITION
URGENCY BASED ON SAFETY
URGENCY BASED ON TRAFFIC LEVEL
TOTAL SCORE
FINAL RANKING
MainSt01 High High Medium 13 1
GreenSt05 Low Medium Medium 7 4
GreenSt10 Medium High Low 9 3
NevadaSt04 Medium Low Low 5 5
LincolnAve06 Medium Medium High 11 2

50 Developing a Program With a Mix of Fixes
• Step 1: Subtract the cost of the highest ranking project from your budget.
• Step 2: If there is money left over, select the next highest ranking project and subtract the project cost from your budget. Repeat this process until you have exhausted your budget for the year.
• Step 3: Using the remaining projects, begin the process again for the next year’s budget. Choose the highest ranking project from the remaining list of candidate projects and subtract its cost from your budget. Continue this process until the second year’s budget is exhausted.
• Step 4: Repeat the process for each year in your program.
This process is illustrated using the same network presented in table 6-3. In table 6-4, the projects have been sorted by the final ranking and costs for each treatment have been added. An agency with a budget of $2,750,000 would fund the top 3 ranking projects and the remaining projects would be considered again in the next years’ program.
Table 6-3. Example of the prioritized project selection process.
PROJECT IDENTIFIER
FINAL RANKING
PROJECT COST FUNDED?
MainSt01 1 $800,000 Yes
LincolnAve06 2 $1,200,000 Yes
GreenSt10 3 $750,000 Yes
GreenSt05 4 $1,500,000 No
NevadaSt04 5 $900,000 No
17 https://www.fhwa.dot.gov/pavement/preservation/if07006.pdf
The objective of the prioritization process is to develop a reasonable and defensible multi-year program that allows you to explain to elected officials or the public why one project was selected over another. Having a systematic approach to prioritizing your projects en-ables you to defend your program against outside pressures to fund certain projects over others.
G E T T I N G T H E M O S T O U T O F Y O U R P R O G R A MThe National Center for Pavement Preservation pub-lished a method of evaluating your program to see whether you are investing in the right mix of fixes. The fhwa publication documenting this process is called A Quick Check of Your Highway Network Health17. Very simply, the document explains how you can compare the number of miles you are funding in your program to the amount of deterioration that is taking place to see whether you are getting as much life as possible from your planned projects and treatments.
Taking some liberty to simplify the process, imag-ine a network with 500 lane miles. Assuming that each year a lane mile loses one year of life, it can be as-sumed that in any given year, at least 500 lane mile years need to be replaced.
Continuing the simplified process, assume that you have three choices for repairing your network:
• Preservation work: Each project costs $20,000 per lane mile and gives you 5 years of life.
• Rehabilitation work: Each project costs $100,000 per lane mile and gives you 10 years of life.

Developing a Program With a Mix of Fixes 51
• Reconstruction: Each project costs $500,000 per lane mile and gives you 20 years of life.
In the traditional program that focuses on rehabili-tation and reconstruction work, an agency with a bud-get of $3,000,000 might put together a program that includes the work shown in table 6-4. This program puts 240 lane mile years back into the system. This is much less than the 500 lane miles lost each year, so it can be assumed that network conditions are deteriorating.
Having heard about the benefits of tam, you de-cide to see if you can improve the cost-effectiveness of your program by including a “mix of fixes.” Under this scenario, you invest a significant portion of your bud-get on preservation projects to keep them from dete-riorating to the point that rehabilitation is needed. But, you also have to invest some money on projects that are in a deteriorated condition. The resulting program
is reflected in table 6-5. Under this scenario, your pro-gram puts 420 lane mile years back into the system, which is significantly more than the traditional program but still slightly less than the system is losing each year. Of course, this scenario assumes that you have 50 lane miles of good candidates for preservation treatments to work. Over time, an ongoing commitment to a “mix of fixes” will have a significant impact on your network conditions, with a growing percentage of your assets in the Good and Fair categories. Agencies that currently have a large percentage of their assets in Poor condi-tion will have to put more of their budget into rehabil-itation and reconstruction projects each year, but the only way to improve system conditions is to begin in-vesting a portion of the budget in preservation pro-grams to keep your newly-improved roads in good con-dition as long as possible.
Table 6-4. Traditional program containing only rehabilitation and reconstruction.
COLUMN A COLUMN B COLUMN C COLUMN D COLUMN E COLUMN F
Treatment Cost Per Mile Years of Life Provided
Number of Lane Miles in the Program
Total CostTotal Number of Lane Mile Years Gained(Column C times Column D)
Preservation $20,000 5 50 $1,000,000 250
Rehabilitation $100,000 10 15 $1,500,000 150
Reconstruction $500,000 20 1 $500,000 20
Totals 22 $3,000,000 420
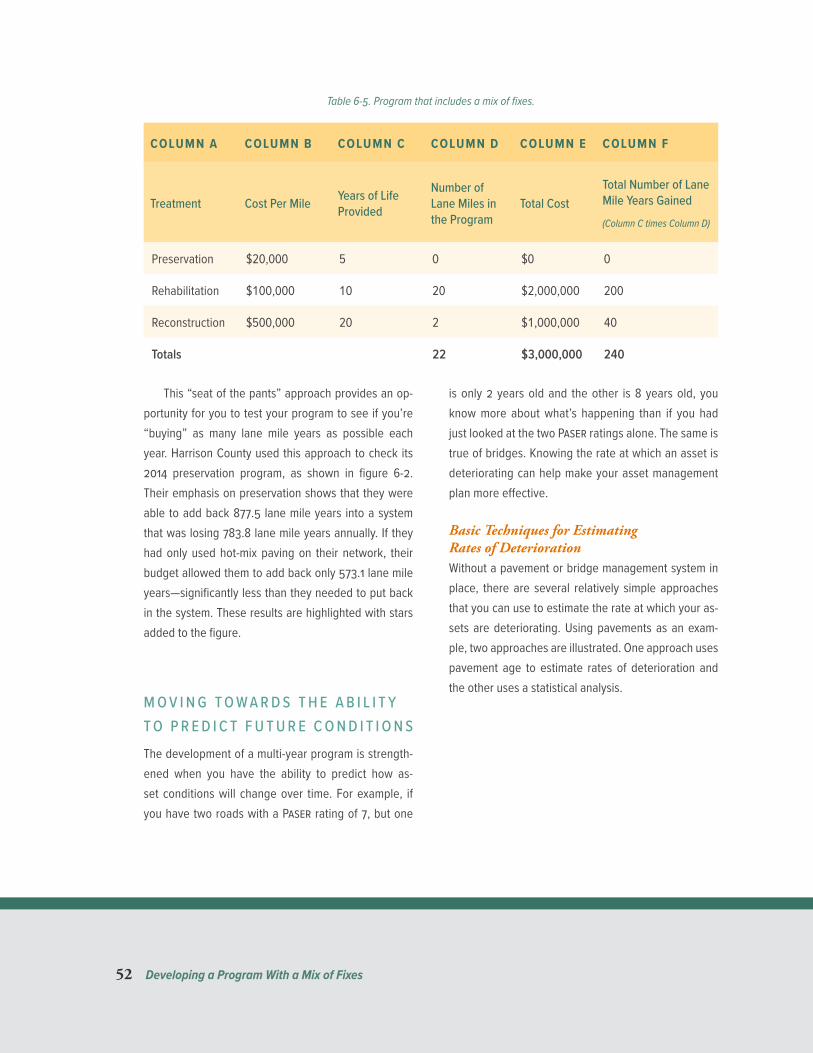
52 Developing a Program With a Mix of Fixes
Table 6-5. Program that includes a mix of fixes.
COLUMN A COLUMN B COLUMN C COLUMN D COLUMN E COLUMN F
Treatment Cost Per Mile Years of Life Provided
Number of Lane Miles in the Program
Total CostTotal Number of Lane Mile Years Gained(Column C times Column D)
Preservation $20,000 5 0 $0 0
Rehabilitation $100,000 10 20 $2,000,000 200
Reconstruction $500,000 20 2 $1,000,000 40
Totals 22 $3,000,000 240
This “seat of the pants” approach provides an op-portunity for you to test your program to see if you’re “buying” as many lane mile years as possible each year. Harrison County used this approach to check its 2014 preservation program, as shown in figure 6-2. Their emphasis on preservation shows that they were able to add back 877.5 lane mile years into a system that was losing 783.8 lane mile years annually. If they had only used hot-mix paving on their network, their budget allowed them to add back only 573.1 lane mile years—significantly less than they needed to put back in the system. These results are highlighted with stars added to the figure.
M O V I N G T O W A R D S T H E A B I L I T Y T O P R E D I C T F U T U R E C O N D I T I O N SThe development of a multi-year program is strength-ened when you have the ability to predict how as-set conditions will change over time. For example, if you have two roads with a Paser rating of 7, but one
is only 2 years old and the other is 8 years old, you know more about what’s happening than if you had just looked at the two Paser ratings alone. The same is true of bridges. Knowing the rate at which an asset is deteriorating can help make your asset management plan more effective.
Basic Techniques for Estimating Rates of DeteriorationWithout a pavement or bridge management system in place, there are several relatively simple approaches that you can use to estimate the rate at which your as-sets are deteriorating. Using pavements as an exam-ple, two approaches are illustrated. One approach uses pavement age to estimate rates of deterioration and the other uses a statistical analysis.
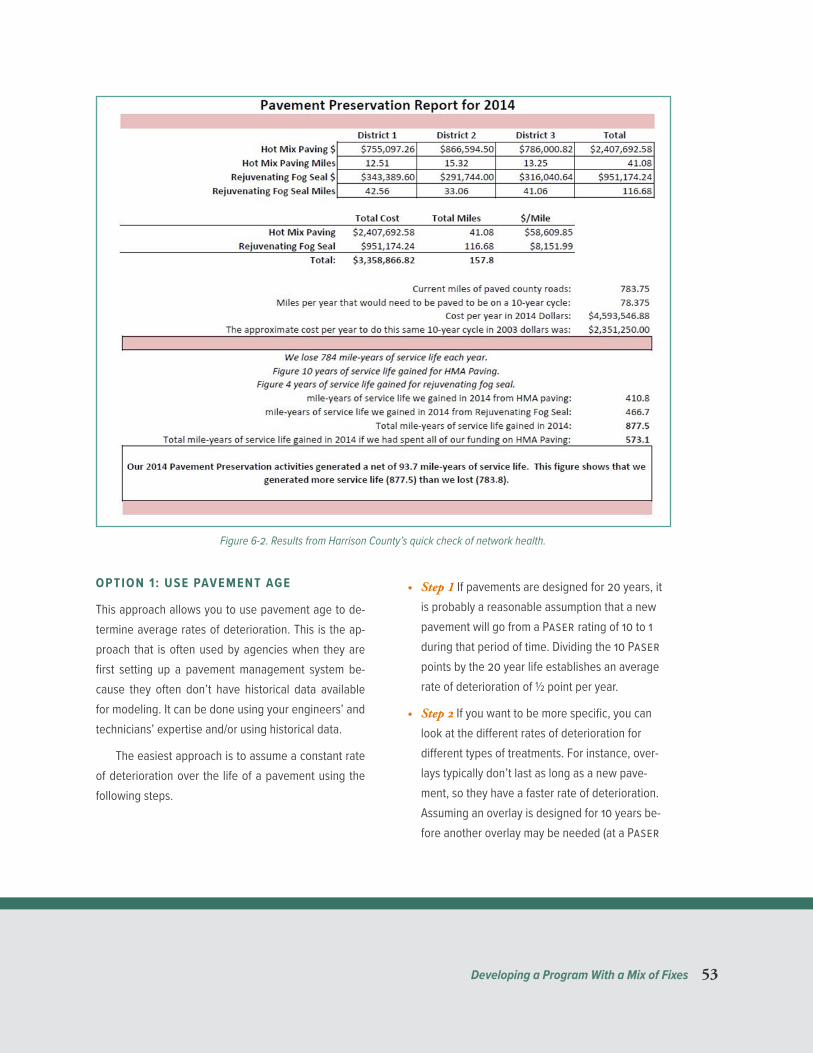
Developing a Program With a Mix of Fixes 53
Figure 6-2. Results from Harrison County’s quick check of network health.
OPTION 1 : USE PAVEMENT AGE
This approach allows you to use pavement age to de-termine average rates of deterioration. This is the ap-proach that is often used by agencies when they are first setting up a pavement management system be-cause they often don’t have historical data available for modeling. It can be done using your engineers’ and technicians’ expertise and/or using historical data.
The easiest approach is to assume a constant rate of deterioration over the life of a pavement using the following steps.
• Step 1 If pavements are designed for 20 years, it is probably a reasonable assumption that a new pavement will go from a Paser rating of 10 to 1 during that period of time. Dividing the 10 Paser points by the 20 year life establishes an average rate of deterioration of ½ point per year.
• Step 2 If you want to be more specific, you can look at the different rates of deterioration for different types of treatments. For instance, over-lays typically don’t last as long as a new pave-ment, so they have a faster rate of deterioration. Assuming an overlay is designed for 10 years be-fore another overlay may be needed (at a Paser
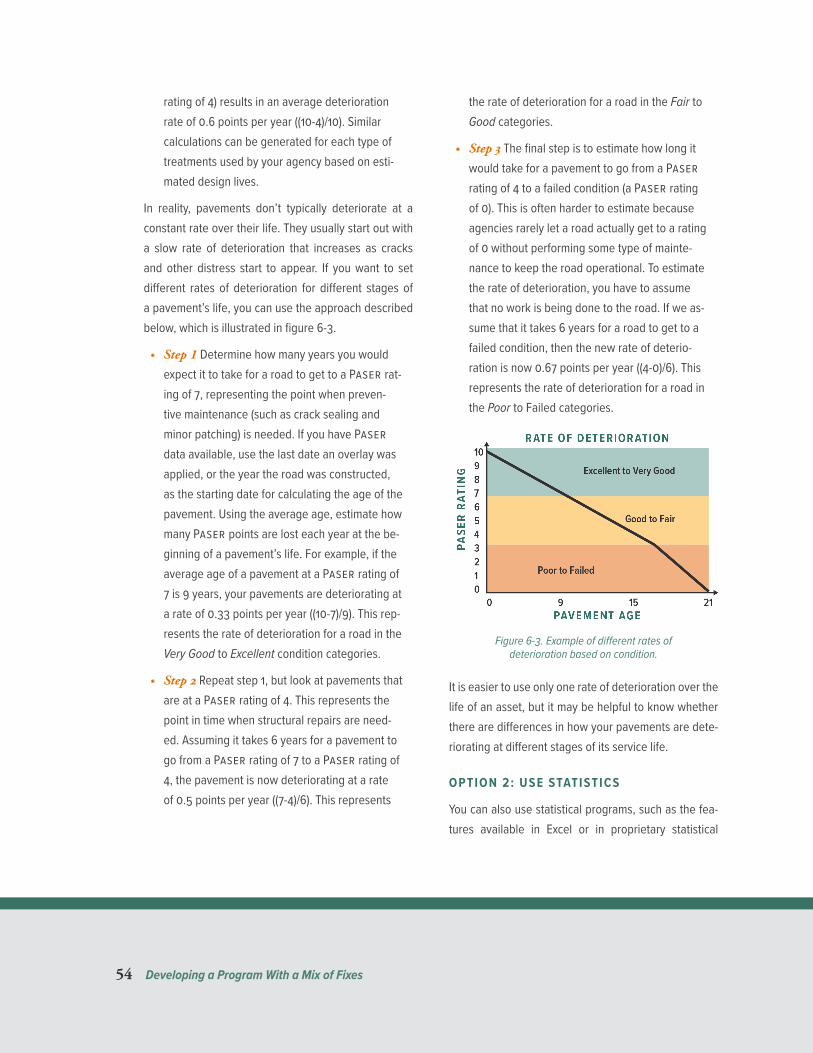
54 Developing a Program With a Mix of Fixes
rating of 4) results in an average deterioration rate of 0.6 points per year ((10-4)/10). Similar calculations can be generated for each type of treatments used by your agency based on esti-mated design lives.
In reality, pavements don’t typically deteriorate at a constant rate over their life. They usually start out with a slow rate of deterioration that increases as cracks and other distress start to appear. If you want to set different rates of deterioration for different stages of a pavement’s life, you can use the approach described below, which is illustrated in figure 6-3.
• Step 1 Determine how many years you would expect it to take for a road to get to a Paser rat-ing of 7, representing the point when preven-tive maintenance (such as crack sealing and minor patching) is needed. If you have Paser data available, use the last date an overlay was applied, or the year the road was constructed, as the starting date for calculating the age of the pavement. Using the average age, estimate how many Paser points are lost each year at the be-ginning of a pavement’s life. For example, if the average age of a pavement at a Paser rating of 7 is 9 years, your pavements are deteriorating at a rate of 0.33 points per year ((10-7)/9). This rep-resents the rate of deterioration for a road in the Very Good to Excellent condition categories.
• Step 2 Repeat step 1, but look at pavements that are at a Paser rating of 4. This represents the point in time when structural repairs are need-ed. Assuming it takes 6 years for a pavement to go from a Paser rating of 7 to a Paser rating of 4, the pavement is now deteriorating at a rate of 0.5 points per year ((7-4)/6). This represents
the rate of deterioration for a road in the Fair to Good categories.
• Step 3 The final step is to estimate how long it would take for a pavement to go from a Paser rating of 4 to a failed condition (a Paser rating of 0). This is often harder to estimate because agencies rarely let a road actually get to a rating of 0 without performing some type of mainte-nance to keep the road operational. To estimate the rate of deterioration, you have to assume that no work is being done to the road. If we as-sume that it takes 6 years for a road to get to a failed condition, then the new rate of deterio-ration is now 0.67 points per year ((4-0)/6). This represents the rate of deterioration for a road in the Poor to Failed categories.
Figure 6-3. Example of different rates of deterioration based on condition.
It is easier to use only one rate of deterioration over the life of an asset, but it may be helpful to know whether there are differences in how your pavements are dete-riorating at different stages of its service life.
OPTION 2: USE STATISTICS
You can also use statistical programs, such as the fea-tures available in Excel or in proprietary statistical
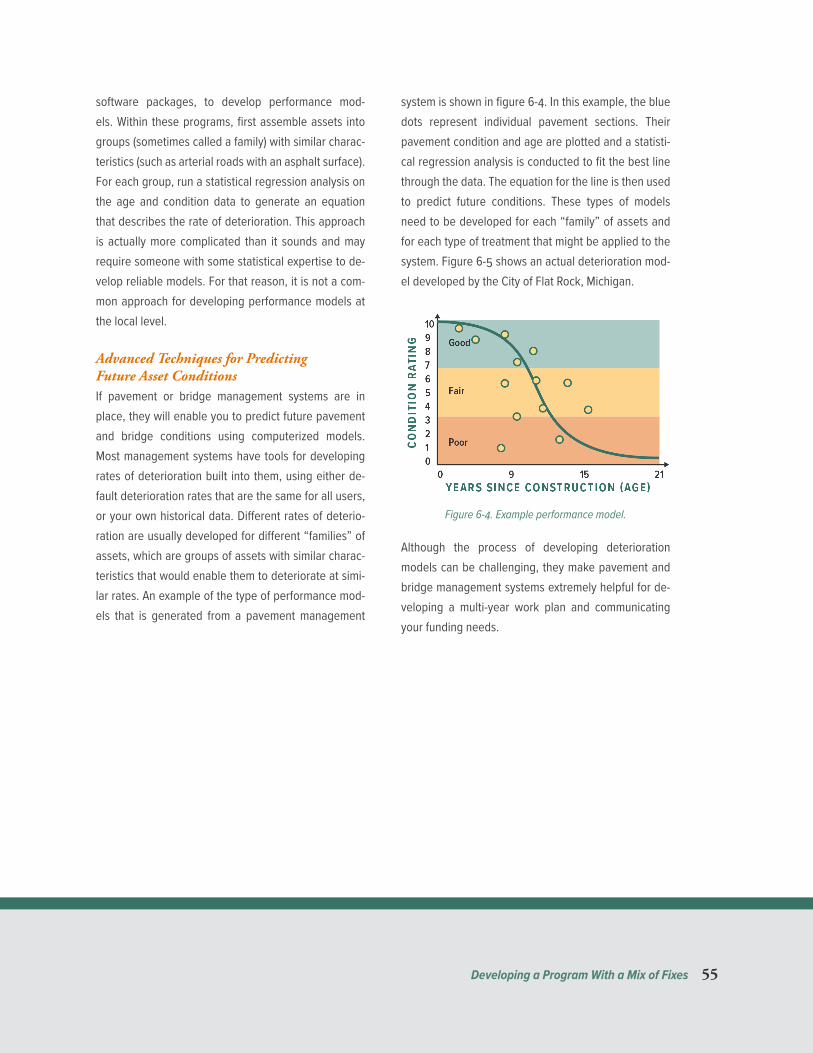
Developing a Program With a Mix of Fixes 55
software packages, to develop performance mod-els. Within these programs, first assemble assets into groups (sometimes called a family) with similar charac-teristics (such as arterial roads with an asphalt surface). For each group, run a statistical regression analysis on the age and condition data to generate an equation that describes the rate of deterioration. This approach is actually more complicated than it sounds and may require someone with some statistical expertise to de-velop reliable models. For that reason, it is not a com-mon approach for developing performance models at the local level.
Advanced Techniques for Predicting Future Asset ConditionsIf pavement or bridge management systems are in place, they will enable you to predict future pavement and bridge conditions using computerized models. Most management systems have tools for developing rates of deterioration built into them, using either de-fault deterioration rates that are the same for all users, or your own historical data. Different rates of deterio-ration are usually developed for different “families” of assets, which are groups of assets with similar charac-teristics that would enable them to deteriorate at simi-lar rates. An example of the type of performance mod-els that is generated from a pavement management
system is shown in figure 6-4. In this example, the blue dots represent individual pavement sections. Their pavement condition and age are plotted and a statisti-cal regression analysis is conducted to fit the best line through the data. The equation for the line is then used to predict future conditions. These types of models need to be developed for each “family” of assets and for each type of treatment that might be applied to the system. Figure 6-5 shows an actual deterioration mod-el developed by the City of Flat Rock, Michigan.
Figure 6-4. Example performance model.
Although the process of developing deterioration models can be challenging, they make pavement and bridge management systems extremely helpful for de-veloping a multi-year work plan and communicating your funding needs.
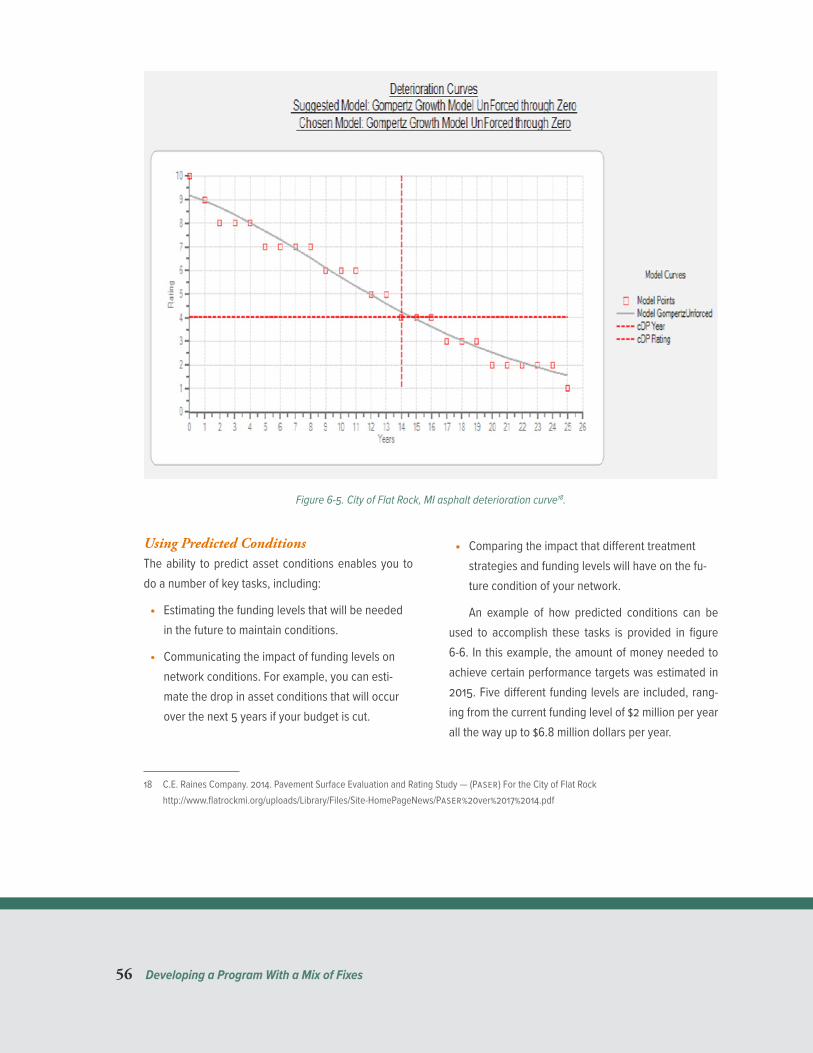
56 Developing a Program With a Mix of Fixes
18 C.E. Raines Company. 2014. Pavement Surface Evaluation and Rating Study — (Paser) For the City of Flat Rock http://www.flatrockmi.org/uploads/Library/Files/Site-HomePageNews/Paser%20ver%2017%2014.pdf
Figure 6-5. City of Flat Rock, MI asphalt deterioration curve18.
Using Predicted ConditionsThe ability to predict asset conditions enables you to do a number of key tasks, including:
• Estimating the funding levels that will be needed in the future to maintain conditions.
• Communicating the impact of funding levels on network conditions. For example, you can esti-mate the drop in asset conditions that will occur over the next 5 years if your budget is cut.
• Comparing the impact that different treatment strategies and funding levels will have on the fu-ture condition of your network.
An example of how predicted conditions can be used to accomplish these tasks is provided in figure 6-6. In this example, the amount of money needed to achieve certain performance targets was estimated in 2015. Five different funding levels are included, rang-ing from the current funding level of $2 million per year all the way up to $6.8 million dollars per year.
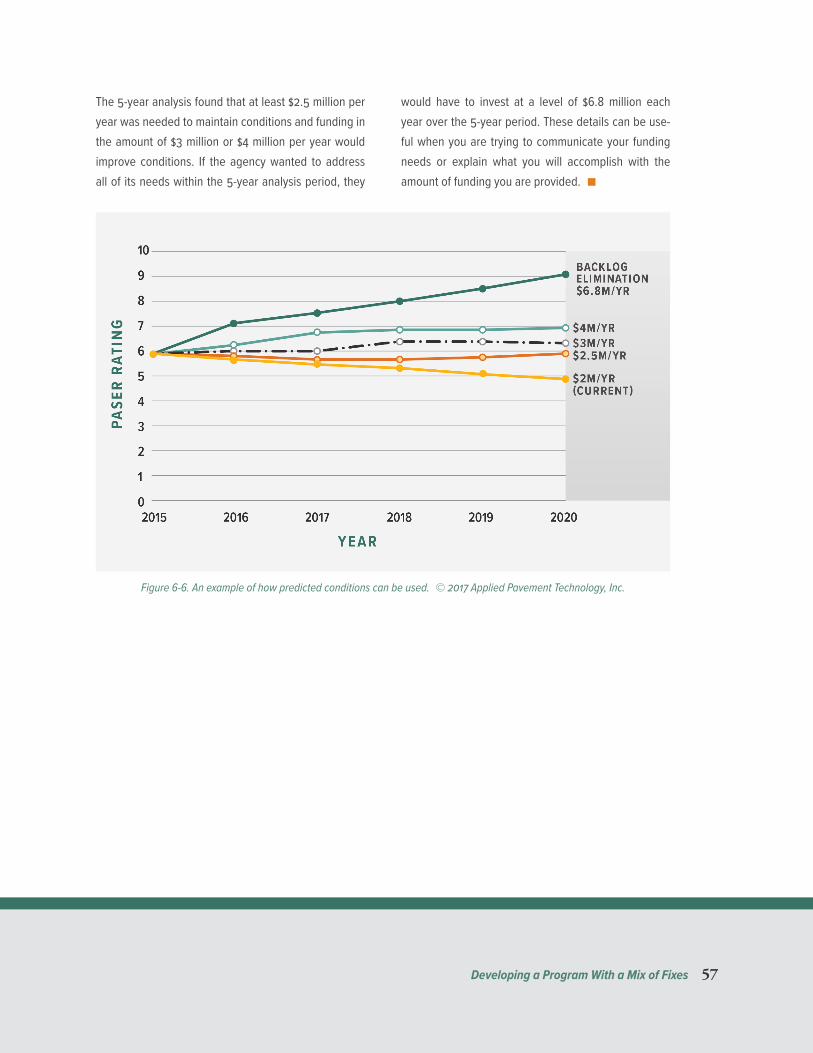
Developing a Program With a Mix of Fixes 57
The 5-year analysis found that at least $2.5 million per year was needed to maintain conditions and funding in the amount of $3 million or $4 million per year would improve conditions. If the agency wanted to address all of its needs within the 5-year analysis period, they
would have to invest at a level of $6.8 million each year over the 5-year period. These details can be use-ful when you are trying to communicate your funding needs or explain what you will accomplish with the amount of funding you are provided. ■
Figure 6-6. An example of how predicted conditions can be used. © 2017 Applied Pavement Technology, Inc.


Reporting Results and Developing the Plan 59
C H A P T E R 7Reporting Results and Developing the Plan
the last step in the tam process is sharing your results with others through the development
of an asset management plan. This chapter introduc-es the pavement and bridge asset management plans that are required of local agencies in Indiana for eligi-bility under the Local Road and Bridge Matching Grant Fund (known as Community Crossing). In addition to satisfying eligibility requirements for the CC grant pro-gram, these asset management plans are also useful for planning work activities and for reporting condi-tions to elected officials and other interested parties. In addition to providing information on these asset man-agement plans, the chapter also includes examples of different types of reports that have been used by local agencies in Indiana to present the results of their asset management efforts.
A S S E T M A N A G E M E N T P L A N O B J E C T I V E SThe State of Indiana recognizes that funding for local roads and bridges has not been sufficient to address all of the local needs. During the 2016 legislative session, the State Legislature passed legislation to address
these funding needs. However, to help ensure that the funding was being used cost-effectively, the legisla-tion required that planned investments in pavements and bridges are detailed in an asset management plan that is approved by Indot. The Indiana ltap center at Purdue University was charged with assisting lo-cal governments with the development of these plans through training, the development of this Guide, and other initiatives. The ltap Advisory Board also worked with Indot to develop the pavement asset manage-ment plan template that is provided in appendix B. Indot developed the bridge asset management plan template that is provided in appendix C.
There were several key objectives considered in developing the minimum plan requirements, including those listed below.
• The plan development should not be so difficult that it places a large burden on local agencies.
• The plan should summarize information about the size and condition of the pavement and bridge inventory and the planned treatments over a multi-year period.

60 Reporting Results and Developing the Plan
• The plan should encourage local agencies to apply tam principles so available funding is used as cost-effectively as possible.
• The plan should indicate the agency’s perfor-mance goals and the expected level of service that will be attained at the end of the reporting period.
Those objectives turned into minimum requirements that are included in the asset management plan tem-plates and explained later in this chapter.
D E V E L O P I N G A PA V E M E N T A S S E T M A N A G E M E N T P L A N
Information Required For the PlanThe material contained in the pavement asset man-agement plan is divided into three sections, as de-scribed below.
Pavement Asset InventoryThis section of the plan includes an inventory of pave-ments in the network. This information can be present-ed in a table format (as shown in the template) or in a different format if that is more convenient. The invento-ry should include information that identifies each road, its length and width, functional classification, and the type of pavement surface. In addition, the inventory should include the most recent Paser rating and the year in which the rating was conducted.
This information may be obtained from paper re-cords, a spreadsheet, or a database.
Road Treatment SummaryThe second section of the pavement asset manage-ment plan includes a summary of the road repairs that
are planned for the next 5 years. The plan does NOT have to list every road section that is planned for re-pair. Instead, agencies should summarize, by year, how many miles of each type of treatment will be ad-dressed, the estimated cost per mile, and the total cost for the work. The average Paser rating for the roads receiving each type of repair should also be provided.
The total amount spent on road repairs each year should not exceed the funding levels available for these types of repairs. As you prepare the summary, keep in mind that the Paser ratings provide a good idea of the level of repair that’s needed (as discussed in chapters 4 and 5). Since most agencies have more road needs than they do funding, it’s important to prioritize which projects should be funded first. One cost-effective strategy is to avoid putting your entire budget towards roads that are in Poor condition, even if it’s tempting to do so. It’s much better to invest in a “mix of fixes” that addresses some of the roads in Poor condition, but also addresses some roads in Fair condition that don’t have too much deterioration present. You can keep the road in Fair condition from dropping to Poor condition by applying some low-cost treatments like seal coats or chip seals. In the long run, the mix of fixes will lead to better road conditions over time than a strategy that just focuses on roads in Poor condition.
Performance Objectives and MeasuresThe last section of the pavement asset management plan asks the agency to set level of service goals (or tar-gets) for the road network and to describe the process-es used to develop the work plan and monitor the work plan over time. It also asks each agency to describe the drainage and right-of-way (row) conditions for the road network. Guidance for rating drainage and row condi-tions is provided in the next part of this chapter.
Reporting Results and Developing the Plan 61
Your current Paser ratings can be used to set a level of service target for your road network, but if you have historical trends showing how the conditions are changing over time, it will be even easier. Methods of developing a level of service target are discussed in chapter 5. One way to set a level of service target is to calculate a weighted average condition for your road network. The number calculated could be used as the target if you think you can maintain that condition over time. If road conditions are getting better with time, you might set a higher target and if they are getting worse, you may set a lower target. You might also consider re-porting your target in terms of the number of miles that will be in Good or Fair condition, since Paser ratings might not be well understood by the decision makers.
Some agencies set level of service targets that are higher than what their budget will allow them to achieve. These types of targets are called aspiration-al targets. These targets are used to show elected offi-cials the amount of money that is needed to bring roads up to the desired condition. For example, if an agency set a target so that all of its roads are in Good condition, you could calculate the estimated cost to reach that condition using the results of your Paser survey and average cost information for the types of treatments you use on your network. The costs shown earlier in figure 2-3 give you a range of typical treatment costs that can be used for roads at different condition levels.
Addressing Drainage and Right-of-Way ConditionsGood drainage is an important part of pavement per-formance. Without it, roads can flood or potholes can result. For that reason, it is important to assess the con-dition of existing drainage systems so the information can be used to help estimate maintenance and reha-bilitation strategies. Typical signs that drainage work is
needed include clogged ditches, vegetation and brush obstructing water flow, sediment in culverts, or pond-ing behind curbs in urban areas.
A good drainage system prevents water from standing on the road or saturating the base layers. There are many different types of drainage systems in-cluding shoulders, ditches and culverts, curb and gut-ter systems, and storm sewers. An evaluation of drain-age conditions should include the following checks:
• Crown the center of the road should be higher than the shoulders so water will run off the road onto the shoulders. The crown is especially im-portant with gravel roads since they are more susceptible to rain damage.
• Shoulders the shoulders should help direct the water flow to the ditches, so they should have enough of a slope to keep rain from getting trapped against the pavement. A common distress on rural road in Indiana is edge distress, primarily caused by poor drainage at the edge of the pavement and traffic loads cause edge failure. Edge distress is identified as a Paser 3 rating.
• Ditches the ditches help carry water away from the road so they should be properly shaped and clear of vegetation or growth.
• Culverts culverts help control water flow by car-rying water under the road to the ditch. The cul-vert has to have a thick enough wall and enough reinforcement to be able to carry the weight of the road and traffic. Culverts should have enough cover to protect the culvert, it should be sized adequately to carry the typical flow capacity, should have an end treatment, and should be clear of debris.

62 Reporting Results and Developing the Plan
• Curb and gutter curbs and gutters are often used in urban areas where there is not enough room for ditches. The gutters should not be filled with overlays, there should be no evidence of set-tlement and the gutters should be free of debris.
• Storm sewers and inlets these drainage devic-es collect water from the streets and carry it to streams or other bodies of water. These typically require a more sophisticated visual inspection,
19 Walker, D., L. Entine, S. Kummer. 2000. Local Road Assessment and Improvement Drainage Manual. University of Wisconsin-Madison Transportation Information Center. (http://epdfiles.engr.wisc.edu/pdf_web_files/tic/other/Drainageconent.pdf).
which may include cameras that can be snaked through the pipes.
The Transportation Information Center at the University of Wisconsin-Madison has developed the Local Road Assessment and Improvement Drainage Manual (http://epdfiles.engr.wisc.edu/pdf_web_files/tic/other/Drainagecontent.pdf) that includes a simple method of assessing drainage conditions while conducting a Paser survey, as shown in table 7-1.
Table 7-1. Drainage assessment ratings19.
RATING DESCRIPTION IMPROVEMENT NEEDED
ExcellentWith adequate ditches or like-new curb, gutter, and storm sewer system. All culverts clean and sound
No improvement necessary.
Good
Overall, pavement and shoulder have adequate crown, ditching, or storm sewer on the majority of the section. May need localized cleaning of ditches, storm sewers and culverts; minor repairs to curbs, inlets, and culverts. No drainage-related pavement damage.
Minor or localized repairs.
Fair
Minimal crown on pavement. Some areas need shoulder slope im-provement. Ditching improvement or cleaning needed on up to 50% of ditches. Pavement distress from localized flooding or ponding indicates improvements are needed in some storm sewer, inlets, or ditching. Some culverts need cleaning or minor repairs.
Several improvements necessary.
Poor
No pavement crown. Shoulders create secondary ditch. Frequent ponding. Significant ditching improvements needed on more than 50% of roadway. Frequent localized flooding or erosion with pave-ment distress or failure. Significant improvement in storm sewer, curb or inlets, and/or major culvert replacement or improvement needed.
Major improvement in drainage required.
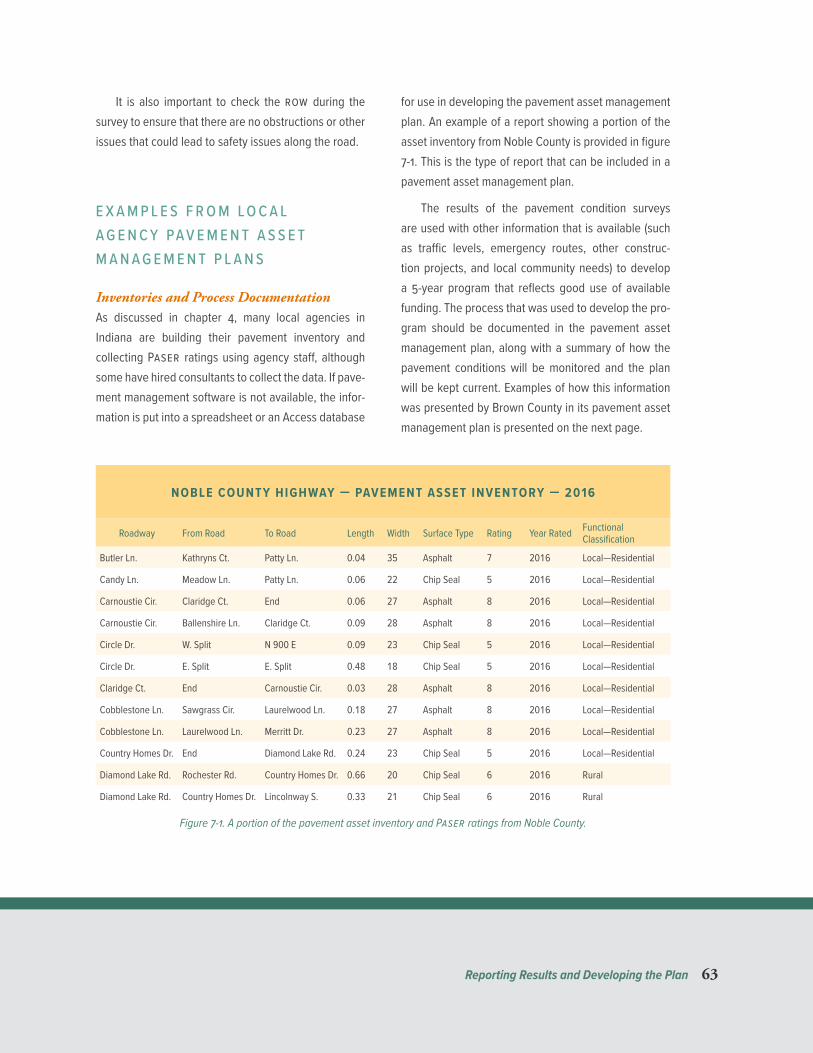
Reporting Results and Developing the Plan 63
It is also important to check the row during the survey to ensure that there are no obstructions or other issues that could lead to safety issues along the road.
E X A M P L E S F R O M L O C A L A G E N C Y PA V E M E N T A S S E T M A N A G E M E N T P L A N S
Inventories and Process DocumentationAs discussed in chapter 4, many local agencies in Indiana are building their pavement inventory and collecting Paser ratings using agency staff, although some have hired consultants to collect the data. If pave-ment management software is not available, the infor-mation is put into a spreadsheet or an Access database
for use in developing the pavement asset management plan. An example of a report showing a portion of the asset inventory from Noble County is provided in figure 7-1. This is the type of report that can be included in a pavement asset management plan.
The results of the pavement condition surveys are used with other information that is available (such as traffic levels, emergency routes, other construc-tion projects, and local community needs) to develop a 5-year program that reflects good use of available funding. The process that was used to develop the pro-gram should be documented in the pavement asset management plan, along with a summary of how the pavement conditions will be monitored and the plan will be kept current. Examples of how this information was presented by Brown County in its pavement asset management plan is presented on the next page.
NOBLE COUNTY HIGHWAY — PAVEMENT ASSET INVENTORY — 2016
Roadway From Road To Road Length Width Surface Type Rating Year Rated Functional Classification
Butler Ln. Kathryns Ct. Patty Ln. 0.04 35 Asphalt 7 2016 Local—Residential
Candy Ln. Meadow Ln. Patty Ln. 0.06 22 Chip Seal 5 2016 Local—Residential
Carnoustie Cir. Claridge Ct. End 0.06 27 Asphalt 8 2016 Local—Residential
Carnoustie Cir. Ballenshire Ln. Claridge Ct. 0.09 28 Asphalt 8 2016 Local—Residential
Circle Dr. W. Split N 900 E 0.09 23 Chip Seal 5 2016 Local—Residential
Circle Dr. E. Split E. Split 0.48 18 Chip Seal 5 2016 Local—Residential
Claridge Ct. End Carnoustie Cir. 0.03 28 Asphalt 8 2016 Local—Residential
Cobblestone Ln. Sawgrass Cir. Laurelwood Ln. 0.18 27 Asphalt 8 2016 Local—Residential
Cobblestone Ln. Laurelwood Ln. Merritt Dr. 0.23 27 Asphalt 8 2016 Local—Residential
Country Homes Dr. End Diamond Lake Rd. 0.24 23 Chip Seal 5 2016 Local—Residential
Diamond Lake Rd. Rochester Rd. Country Homes Dr. 0.66 20 Chip Seal 6 2016 Rural
Diamond Lake Rd. Country Homes Dr. Lincolnway S. 0.33 21 Chip Seal 6 2016 Rural
Figure 7-1. A portion of the pavement asset inventory and Paser ratings from Noble County.

64 Reporting Results and Developing the Plan
Excerpts from the Brown County Pavement Asset Management Plan:
DESCRIBE THE PROCESS USED TO DEVELOP A WORK PLAN:
We develop the work plan (paving plan) based on Paser condition ratings, traffic volumes, emergency routes, community needs, and our local knowledge of history of existing pave-ment. We select roads that will provide a good long term life-cycle service. We also evaluate the other construction activity planned in the area - such as closure of State Roads which force extra traffic onto local county roads. We will wait until after their construction is com-pleted, if possible, and then do our roadway improvements in order to increase the service life of the new county roadway pavement.
DESCRIBE THE MONITORING PROGRAM AND PLAN FOR MAKING UPDATES AND ADJUSTMENTS:
We believe the Asset Management Plan is a “living” document to be updated and im-proved as often as necessary to incorporate changes in the roadway system. Changes will occur due to natural aging of the system, flood and storm damages, freeze/thaw dam-age, vandalism, etc. Positive changes will oc-cur with new construction, reconstruction, and maintenance of the roadway system.
As a Standard Operating Procedure, we will review and modify the program each spring as the major damages normally appear after
the winter season. Any revisions to the con-dition ratings and road improvement priori-ties will be incorporated into the Annual Plan at such time. The Brown County Highway is currently setting paving priorities based on the Roadway Improvement Plan 2015-2017 prepared by Superintendent Magner. This Plan identified 138.7 miles of roads in need of paving within the three year window. Due to lack of funding to accomplish this paving, it will take at least seven years to complete this work. Our goal with the new 2016 GRANT Funding is to improve as many miles of road-way as possible and be able to use the addi-tional funding to help close the funding gap and save the roadways from falling into the distress category and requiring full recon-struction at a much higher cost.
Roadways in Brown County are monitored on a daily basis by the Highway Management, Highway crews, Sheriff Department, and the general public - who are happy to call to in-form us of road conditions in their area, town-ship, or just where they may happen to be driving. People are quick to call about a pot-hole, dusty road, muddy road, or weeds that need mowed.
Summaries of Pavement ConditionsThe graphic shown in figure 7-2 was provided by Ripley County. Note that in addition to showing the number of miles at each Paser rating, the color coding provides a way of illustrating which Paser ratings correspond to Good, Fair, and Poor conditions.
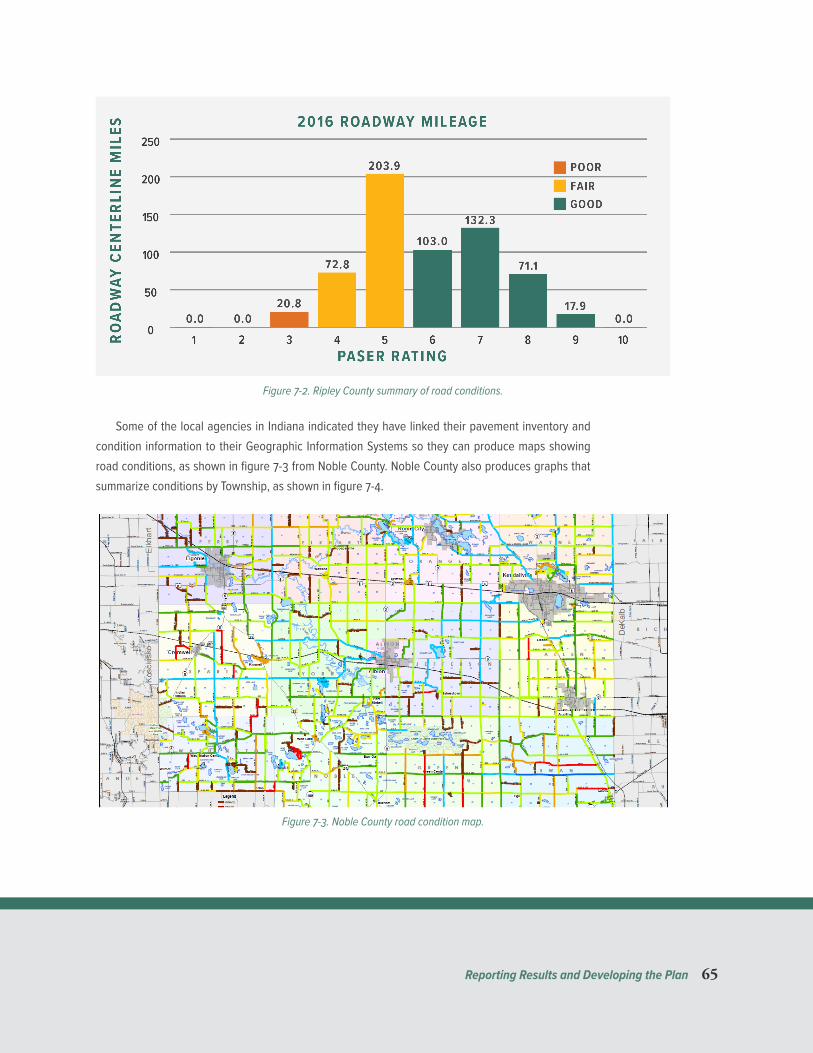
Reporting Results and Developing the Plan 65
Figure 7-2. Ripley County summary of road conditions.
Some of the local agencies in Indiana indicated they have linked their pavement inventory and condition information to their Geographic Information Systems so they can produce maps showing road conditions, as shown in figure 7-3 from Noble County. Noble County also produces graphs that summarize conditions by Township, as shown in figure 7-4.
Figure 7-3. Noble County road condition map.

66 Reporting Results and Developing the Plan
ALLEN TOWNSHIP
Rating Mileage Percentage Weight Rating
9—Excellent 0.00 0.0% 0.00
8–Very Good 4.50 7.1% 0.58
7–Good 13.14 20.8% 1.48
6–Good 29.90 47.4% 2.89
5–Fair 11.23 17.8% 0.90
4–Fair / Poor 2.15 3.4% 0.14
3–Poor 1.20 1.9% 0.06
2–Very Poor 0.00 0.0% 0.00
1–Failed 0.00 0.0% 0.00
0–Gravel 1.01 1.6% n/a
Total: 63.13 100.0% 6.05
Figure 7-4. Noble County road conditions by township.
The last example presented as figure 7-5 shows how Ripley County summarized pavement conditions by roadway classification. Since roadway classifica-tions are usually closely linked to traffic levels, this for-mat allows the County to show the roads with the most traffic are in Good condition, but the local roads are more deteriorated.
ROADWAY CLASSIFICATION SURVEY
Classification Mileage Avg. Paser Rating
Local Road 590.6 *5.6
Minor Collector 1.0 7.0
Major Collector 1.8 7.0
Rural Minor Collector 60.2 7.1
Rural Major Collector 60.7 6.8
* Local Roads include Stone, not all Stone roads were rated, this average is only for the asphalt roads.
Figure 7-5. Ripley County average condition rating by functional classification.
Presenting Road NeedsLocal agencies use several different methods of pre-senting their road needs in the pavement asset man-agement plans. The plans are not required to include a detailed list of all of the projects that will be funded, but many plans include that information in the docu-ment or in an appendix.
Figure 7-6. A portion of the Noble County list of planned projects
2016 — ROADWAY ASSET MANAGEMENT — 5 YEAR PROJECTION
Road name Start Point End Point Miles Work performed Cost Year Cumulative Cost
Angling Rd. Kendallville 800N 1 1.5" HMA Surface $55,746 2016 $55,746600S SR9 Bridge 82 2.45 1.5 HMA Surface $136,578 2016 $192, 324Appleman Rd. 1000E Riley Rd. 1.25 Crack Seal $6,875 2016 $199,199900N 1050W SR.5 2.5 Crack Seal $13,750 2016 $212,949550S 1100E Old SR.3 1 Crack Seal $5,500 2016 $218,449900N 125W 100E 2.25 Crack Seal $12,375 2016 $230,824400N 150E 415N 1 Crack Seal $5,500 2016 $236,324415N 400N 500E 2.5 Crack Seal $13,750 2016 $250,074
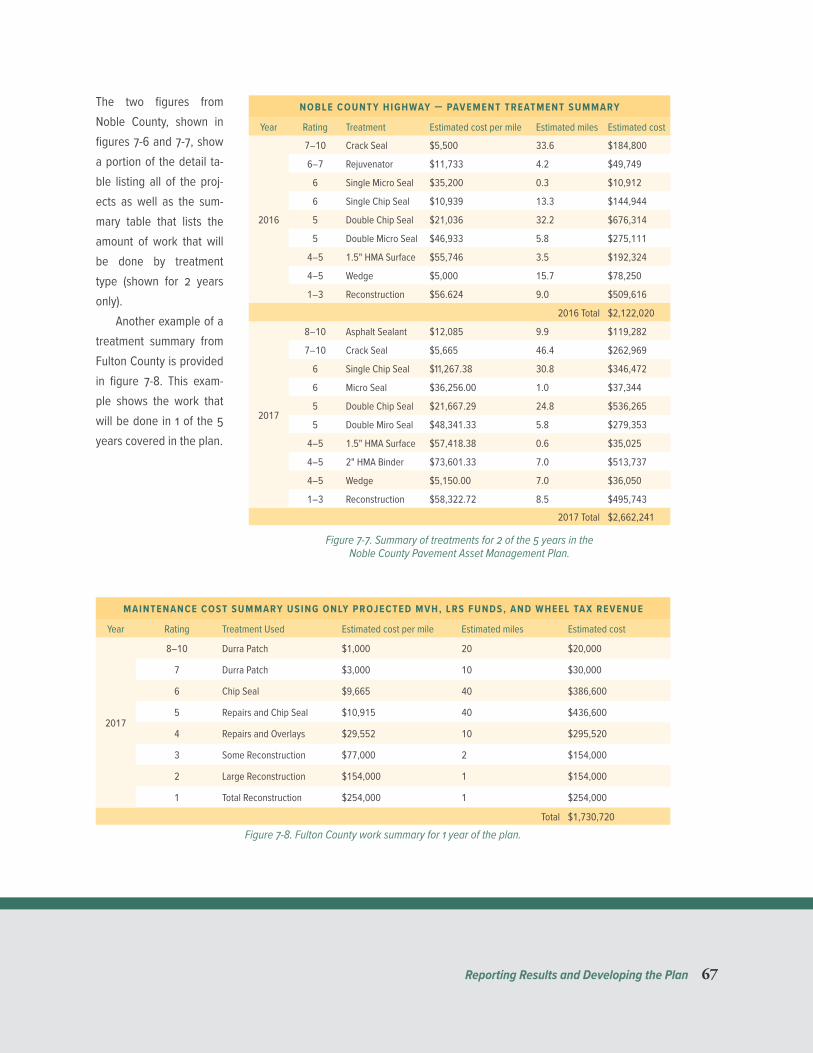
Reporting Results and Developing the Plan 67
The two figures from Noble County, shown in figures 7-6 and 7-7, show a portion of the detail ta-ble listing all of the proj-ects as well as the sum-mary table that lists the amount of work that will be done by treatment type (shown for 2 years only).
Another example of a treatment summary from Fulton County is provided in figure 7-8. This exam-ple shows the work that will be done in 1 of the 5 years covered in the plan.
NOBLE COUNTY HIGHWAY — PAVEMENT TREATMENT SUMMARY
Year Rating Treatment Estimated cost per mile Estimated miles Estimated cost
2016
7–10 Crack Seal $5,500 33.6 $184,800
6–7 Rejuvenator $11,733 4.2 $49,749
6 Single Micro Seal $35,200 0.3 $10,912
6 Single Chip Seal $10,939 13.3 $144,944
5 Double Chip Seal $21,036 32.2 $676,314
5 Double Micro Seal $46,933 5.8 $275,111
4–5 1.5" HMA Surface $55,746 3.5 $192,324
4–5 Wedge $5,000 15.7 $78,250
1–3 Reconstruction $56.624 9.0 $509,616
2016 Total $2,122,020
2017
8–10 Asphalt Sealant $12,085 9.9 $119,282
7–10 Crack Seal $5,665 46.4 $262,969
6 Single Chip Seal $11,267.38 30.8 $346,472
6 Micro Seal $36,256.00 1.0 $37,344
5 Double Chip Seal $21,667.29 24.8 $536,265
5 Double Miro Seal $48,341.33 5.8 $279,353
4–5 1.5" HMA Surface $57,418.38 0.6 $35,025
4–5 2" HMA Binder $73,601.33 7.0 $513,737
4–5 Wedge $5,150.00 7.0 $36,050
1–3 Reconstruction $58,322.72 8.5 $495,743
2017 Total $2,662,241
Figure 7-7. Summary of treatments for 2 of the 5 years in the Noble County Pavement Asset Management Plan.
MAINTENANCE COST SUMMARY USING ONLY PROJECTED MVH, LRS FUNDS, AND WHEEL TAX REVENUE
Year Rating Treatment Used Estimated cost per mile Estimated miles Estimated cost
2017
8–10 Durra Patch $1,000 20 $20,000
7 Durra Patch $3,000 10 $30,000
6 Chip Seal $9,665 40 $386,600
5 Repairs and Chip Seal $10,915 40 $436,600
4 Repairs and Overlays $29,552 10 $295,520
3 Some Reconstruction $77,000 2 $154,000
2 Large Reconstruction $154,000 1 $154,000
1 Total Reconstruction $254,000 1 $254,000
Total $1,730,720
Figure 7-8. Fulton County work summary for 1 year of the plan.

68 Reporting Results and Developing the Plan
Floyd County’s Pavement Asset Management Plan includes a summary of all the work that will be conducted over the 5-year pe-riod covered in the Plan, as shown in figure 7-9.
Ripley County’s Pavement Asset Management Plan includes a summary of what it would cost to address all of the current road network improvement needs. Its plan lists about $6.5 m in project for the 5 years in the plan, show-ing that they will be addressing most of their needs within the 5-year window. The table is pre-sented in figure 7-10.
PASER RATING PAVEMENT TREATMENT LANE MILES
(11 ' LANES)ESTIMATED COST PER LANE MILE
ESTIMATED COST TO IMPROVE
1 Reconstruction 0.00 $352,029.33 $0.00
2 Reconstruction 0.00 $352,029.33 $0.00
3 Resurface, 10% Full Depth Patch 31.07 $92,702.13 $2,880,423.83
4 Chip Seal 102.08 $7,000.00 $714,589.21
5 Chip Seal 301.64 $7,000.00 $2,111,501.72
6 Crack Seal 157.96 $2,000.00 $315,918.90
7 Crack Seal 211.34 $2,000.00 $422,681.37
8 None 103.04 $0.00 $0.00
9 None 27.45 $0.00 $0.00
10 None 0.00 $0.00 $0.00
Totals 934.59 $6,445,115.04
Figure 7-10. Total estimate of all paved road needs (based on 11 ft width) in the Ripley County Pavement Asset Management Plan.
Figure 7-9. Floyd County summary of work to be conducted over the 5-year period.
RATING TREATMENT USED
ESTIMATED COST PER MILE
ESTIMATED MILES
ESTIMATED COST
9–10 Crack Sealant $5,000 53 $265,000
7–8 Crack Sealant $5,000 64 $320,000
6 Crack Sealant $5,000 93 $465,000
6 1" Overlay $50,000 30 $1,500,000
4–5 2" Overlay $70,000 33 $2,310,000
1–3 Reconstruction $115,000 11 $1,265,000
Total $6,125,000

Reporting Results and Developing the Plan 69
Performance GoalsLocal agencies in Indiana have also used various meth-ods of presenting their pavement goals as illustrated in the following excerpts. The first one is taken from the Ripley County Pavement Asset Management Plan. It ex-plains that its road network will be maintained above a Paser rating of 4.0.
The expected level of service (los) rating
for the roads maintained by Ripley County
is based upon the functional classification.
The County desires the Local Roads be
maintained to a los rating of 4 or higher
Rural Minor and Rural Major Collectors
will be maintained to a los rating of 4 or
higher. Minor and Major Collectors will also
be maintained to a los rating of 4 or higher.
A Paser rating of 4 is the lowest rating for a
road to be consider in fair condition. With
Ripley County's current ability to chip seal
up to 150 miles of roadway each year they
are able to stay ahead of the roadway's sever
deterioration.
The second example from the Floyd County Pavement Asset Management Plan20 shows that different per-formance measures are used based on the roadway classification.
20 Floyd County. 2016. Pavement Asset Management Plan.
BENCHMARK PERFORMANCE GOALS
1. All Minor Arterial Roads will have a benchmark rating of 8 within 2 years.
2. All Major Collector Roads with a rating of 4–5 will be slated for resurfacing within the next 3 years.
3. All Major Collector Roads with a rating of 6–9 will be slated for preventive mainte-nance within 1 year.
4. All Minor Collector roads with a rating of 4–5 will be slated for resurfacing within the next 3 years.
5. All Minor Collector roads with a rating of 6–9 will be slated for preventive mainte-nance within 1 year.
6. All local roads with a rating of 0–3 or less will be slated for resurfacing within the next five years.
7. All local roads with a rating of 6–9 will be slated for preventive maintenance within the next five years.
8. A quarter of the roads with a rating of 5 will be slated for preventive maintenance and selected resurfacing.

70 Reporting Results and Developing the Plan
D E V E L O P I N G A B R I D G E A S S E T M A N A G E M E N T P L A NThe minimum requirements for the bridge asset man-agement plan are presented in Appendix C, along with an example of the format that may be used for present-ing the information. The biggest difference between the development of the bridge asset management plan and the pavement asset management plan is that the inventory and condition information that is included in the plan comes from the Indot bridge database. Indot also provides guidance to local agencies in develop-ing work plans in a document, Asset Management for Local Public Agency Bridges, published by the Indot Local Public Agency Program in April 2016.
In 2017, a new template for the Bridge Asset Management Plan was developed. It is described in Appendix C.
E X A M P L E S F R O M L O C A L A G E N C Y B R I D G E A S S E T M A N A G E M E N T P L A N SThe information extracted from the Indot database is used to produce the summary of bridge inventory, condition assessment results, and treatment needs. Several examples of different formats that are used for presenting the information, from local agencies in Indiana, are provided below. The first example provid-ed in figure 7-11 is from Henry County.
Fulton County produces a report that uses col-or coding to provide a visual representation of bridge conditions in addition to the nbi ratings. The example provided in figure 7-12 is an extract from the full table that is provided in the Plan. It was modified to better fit within the pages of this document. A second exam-ple from Fulton County, presented as figure 7-13, ex-pands on the information in the first table, showing the sufficiency rating, work needs, and treatment costs for each bridge shown in figure 7-12.
HENRY COUNTY — BRIDGE ASSET MANAGEMENT PLAN — 2016
Brid
ge N
umbe
r
NBI #
Deck
Rat
ing
058
Supe
rstru
ctur
e Ra
ting-
059
Gen.
Pain
t Co
nditi
on-5
9.01
Subs
truct
ure
Ratin
g-06
0
Chan
nel
Ratin
g-06
1
Culve
rt Ra
ting-
062
Suffi
cienc
y Ra
ting
Stru
ctur
ally
Defic
ient
Func
tiona
lly
Obso
lete
Wor
k Typ
e
Plan
ned
Repa
ir Ye
ar
Estim
ated
Cos
t33-00003 3300002 3 4 0 5 5 N 15.0 ≤ Replacement 2017 $1,291,000
33-00004 3300187 N N N N 6 5 59.7 ≤ Replacement 2024 $487,500
33-00005 3300004 7 7 N 7 7 N 95.1
33-00006 3300005 7 7 N 7 8 N 89.0
33-00007 3300006 6 6 N 6 5 N 91.5 Preventive Maintenance 2021 $7,000
Figure 7-11. A portion of the summary table included in the Henry County Bridge Asset Management Plan.

Reporting Results and Developing the Plan 71
Figure 7-12. A portion of the nbi condition rating summary from the Fulton County Bridge Asset Management Plan.

72 Reporting Results and Developing the Plan
Figure 7-13. Sufficiency ratings and work plan activities included in the Fulton County Bridge Asset Management Plan for the bridges shown in figure 7-12.
A portion of a table showing the planned projects Noble County included in its asset management plan is included as figure 7-14, illustrating both funding sources and planned treatment years.
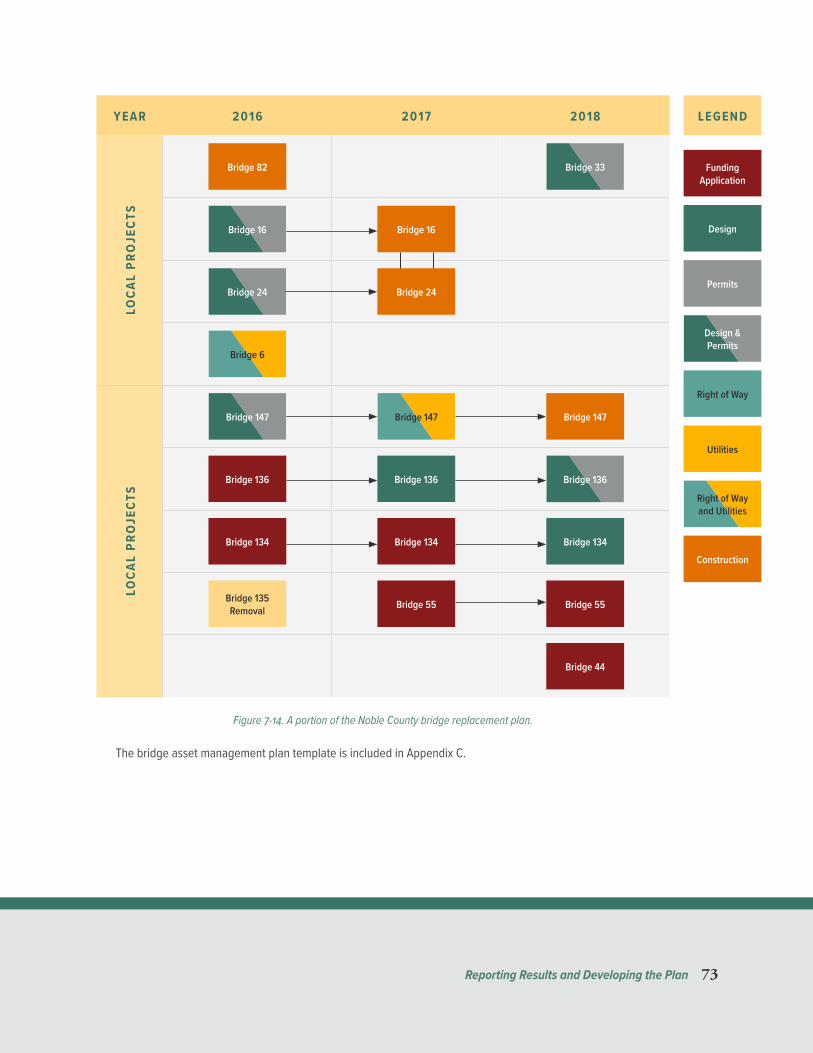
Reporting Results and Developing the Plan 73
YEAR 2016 2017 2018LO
CAL
PRO
JECT
S
Bridge 82 Bridge 33
Bridge 16 Bridge 16
Bridge 24 Bridge 24
Bridge 6
LOCA
L PR
OJE
CTS
Bridge 147 Bridge 147 Bridge 147
Bridge 136 Bridge 136 Bridge 136
Bridge 134 Bridge 134 Bridge 134
Bridge 135 Removal Bridge 55 Bridge 55
Bridge 44
Figure 7-14. A portion of the Noble County bridge replacement plan.
The bridge asset management plan template is included in Appendix C.
Funding Application
Design
LEGEND
Utilities
Permits
Right of Way
Construction
Right of Way and Utilities
Design & Permits
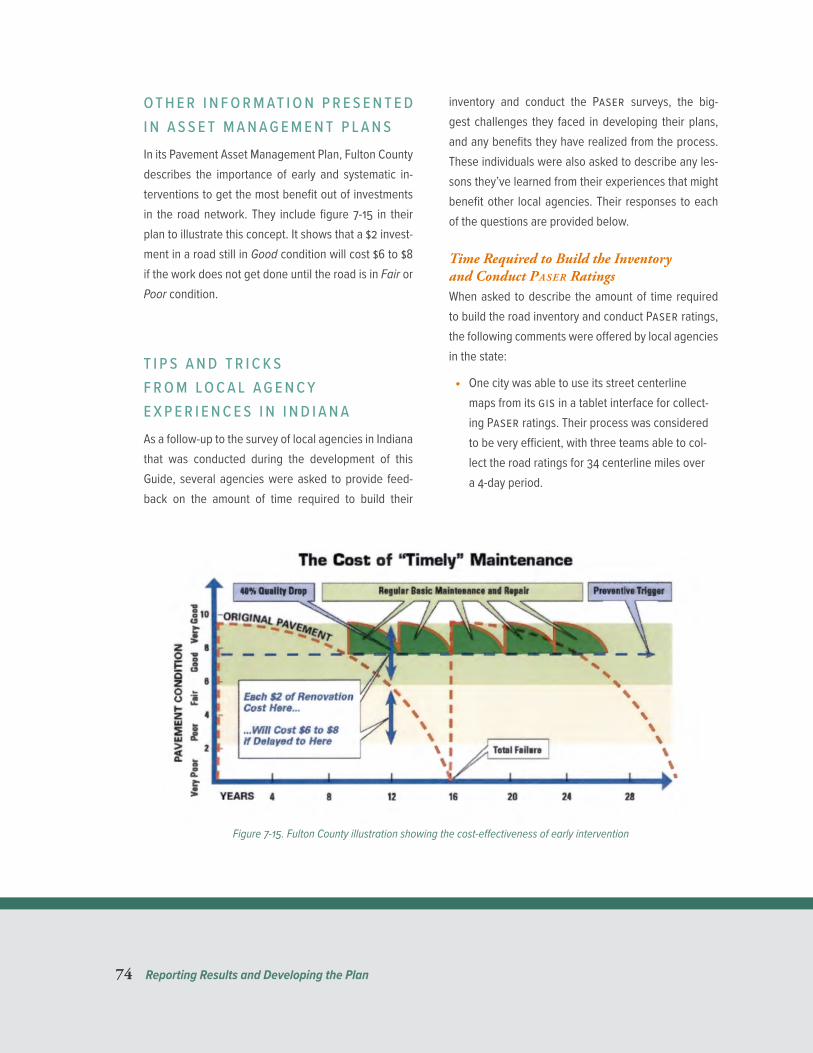
74 Reporting Results and Developing the Plan
O T H E R I N F O R M AT I O N P R E S E N T E D I N A S S E T M A N A G E M E N T P L A N SIn its Pavement Asset Management Plan, Fulton County describes the importance of early and systematic in-terventions to get the most benefit out of investments in the road network. They include figure 7-15 in their plan to illustrate this concept. It shows that a $2 invest-ment in a road still in Good condition will cost $6 to $8 if the work does not get done until the road is in Fair or Poor condition.
T I P S A N D T R I C K S F R O M L O C A L A G E N C Y E X P E R I E N C E S I N I N D I A N AAs a follow-up to the survey of local agencies in Indiana that was conducted during the development of this Guide, several agencies were asked to provide feed-back on the amount of time required to build their
inventory and conduct the Paser surveys, the big-gest challenges they faced in developing their plans, and any benefits they have realized from the process. These individuals were also asked to describe any les-sons they’ve learned from their experiences that might benefit other local agencies. Their responses to each of the questions are provided below.
Time Required to Build the Inventory and Conduct Paser RatingsWhen asked to describe the amount of time required to build the road inventory and conduct Paser ratings, the following comments were offered by local agencies in the state:
• One city was able to use its street centerline maps from its gis in a tablet interface for collect-ing Paser ratings. Their process was considered to be very efficient, with three teams able to col-lect the road ratings for 34 centerline miles over a 4-day period.
Figure 7-15. Fulton County illustration showing the cost-effectiveness of early intervention
Reporting Results and Developing the Plan 75
• A city with just over 100 miles in its network was able to collect the data at a rate of about 2 to 3 miles per hour in the field.
• One county with approximately 780 centerline miles was able to collect Paser ratings for all roads, except the subdivision roads, in about 2 to 3 weeks. The subdivision roads usually take approximately 2 more weeks to complete. All of the data is loaded into a spreadsheet in one morning and it takes about one day to put to-gether the priorities.
Biggest Challenges in Developing Pavement and Bridge Asset Management PlansAsset management relies on good, quality data for managing the pavement and bridge networks. For many agencies, this represents a change in the way work plans had been developed in the past. Several local agencies were asked to identify the challenges they realized in developing their plans. Their responses identified the challenges listed below.
• Coordinating the training, people, and equip-ment for this effort.
• Building consistency among raters. It involved getting everything set up and going through the training.
• Maintaining consistency in ratings from one year to the next.
• Assigning costs to maintenance activities be-cause of the variability in costs from one year to the next.
• Starting with nothing and having to build all the data sets needed to create the inventory and the plan.
Benefits Realized From Collecting Inventory and Condition Data or Putting Together a PlanAlthough there were challenges in putting together the plans, all of the agencies questioned recognized that they had already realized some important bene-fits from the availability of the data. The benefits these agencies identified are listed below.
• In the past, county records were incomplete or did not exist. This process allowed the agency to improve their records. They now have a better understanding of road conditions, which is help-ing them set priorities and develop work plans.
• The process was considered a good first step in asset management and it motivated one city to begin a citywide asset management plan.
• Comparisons of road conditions from one year to the next have been helpful for monitoring deterioration.
• One city has used its asset management plan to identify the projects for the past 2 years.
• The results allowed one agency to describe actual needs to maintain operability at prescribed levels.
• One streets department was very happy to have the road ratings to justify their paving program.
• The information helped one agency identify its backlog so resources could be allocated to ad-dress this unfunded need.
• It was a lot of work, but one county was able to get $1 m in funding for 2 years because of the data.

76 Reporting Results and Developing the Plan
Lessons LearnedRepresentatives from these agencies were also asked to list any lessons learned from the experience that might help other local agencies in Indiana. Their suggestions are listed below.
Don’t be afraid to jump right in and get started. You’ll find that the process goes quickly once you take the first steps.
Maintain a system that is simple, manageable, and not too data intensive or the quality of the information will be lost.
Work on the accuracy of the ratings and build consistency from one year to the next.
Don’t worry about being perfect. Get a plan together so your municipality can start using it as a planning tool. ■

Typical Pavement and Bridge Preservation Treatments A1
A P P E N D I X A Typical Pavement and Bridge Preservation Treatments
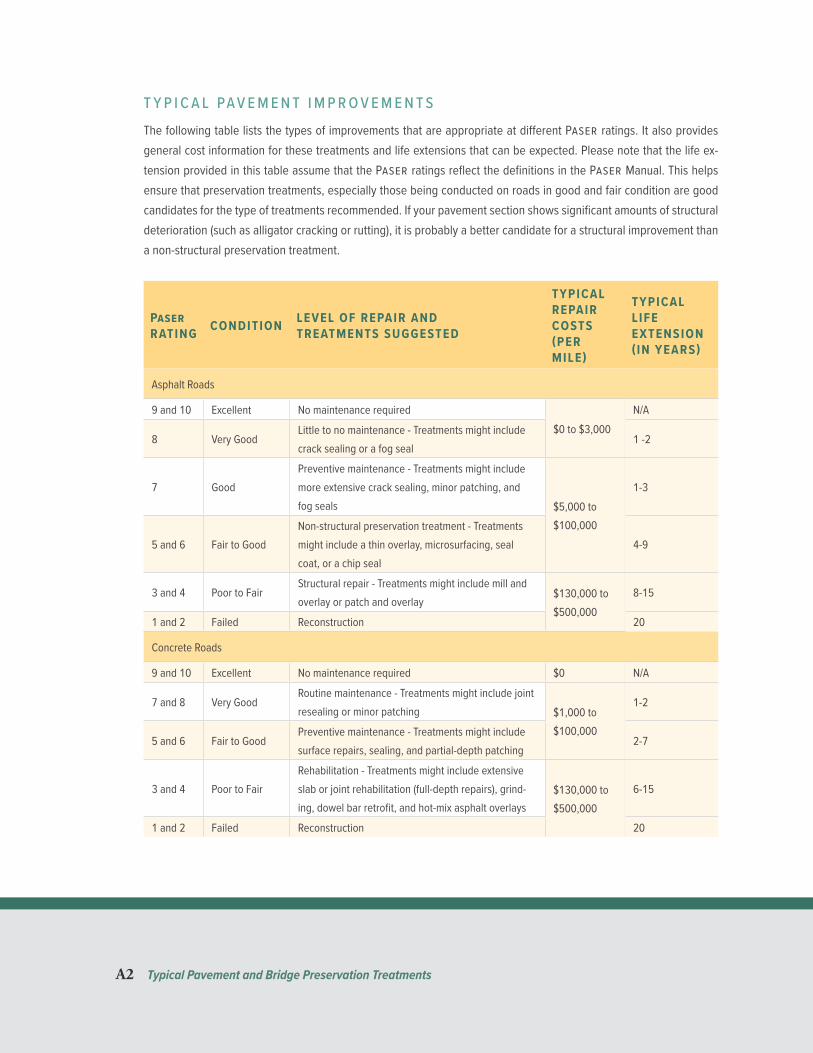
A2 Typical Pavement and Bridge Preservation Treatments
T Y P I C A L PA V E M E N T I M P R O V E M E N T SThe following table lists the types of improvements that are appropriate at different Paser ratings. It also provides general cost information for these treatments and life extensions that can be expected. Please note that the life ex-tension provided in this table assume that the Paser ratings reflect the definitions in the Paser Manual. This helps ensure that preservation treatments, especially those being conducted on roads in good and fair condition are good candidates for the type of treatments recommended. If your pavement section shows significant amounts of structural deterioration (such as alligator cracking or rutting), it is probably a better candidate for a structural improvement than a non-structural preservation treatment.
Paser RATING CONDITION LEVEL OF REPAIR AND
TREATMENTS SUGGESTED
TYPICAL REPAIR COSTS (PER MILE)
TYPICAL L IFE EXTENSION ( IN YEARS)
Asphalt Roads
9 and 10 Excellent No maintenance required$0 to $3,000
N/A
8 Very GoodLittle to no maintenance - Treatments might include crack sealing or a fog seal
1 -2
7 GoodPreventive maintenance - Treatments might include more extensive crack sealing, minor patching, and fog seals $5,000 to
$100,000
1-3
5 and 6 Fair to GoodNon-structural preservation treatment - Treatments might include a thin overlay, microsurfacing, seal coat, or a chip seal
4-9
3 and 4 Poor to FairStructural repair - Treatments might include mill and overlay or patch and overlay
$130,000 to $500,000
8-15
1 and 2 Failed Reconstruction 20
Concrete Roads
9 and 10 Excellent No maintenance required $0 N/A
7 and 8 Very GoodRoutine maintenance - Treatments might include joint resealing or minor patching $1,000 to
$100,000
1-2
5 and 6 Fair to GoodPreventive maintenance - Treatments might include surface repairs, sealing, and partial-depth patching
2-7
3 and 4 Poor to FairRehabilitation - Treatments might include extensive slab or joint rehabilitation (full-depth repairs), grind-ing, dowel bar retrofit, and hot-mix asphalt overlays
$130,000 to $500,000
6-15
1 and 2 Failed Reconstruction 20

Typical Pavement and Bridge Preservation Treatments A3
T Y P I C A L B R I D G E I M P R O V E M E N T SThe following table lists the types of improvements that are appropriate at different nbi ratings. It also provides gen-eral cost information for these treatments and life extensions that can be expected. Note that repair costs are not provided for bridge improvements because they vary significantly depending on the type of bridges being repaired.
nbi RATING CONDITION STRUCTURAL
ADEQUACY LEVEL OF REPAIR SUGGESTED
TYPICAL L IFE EXTENSION ( IN YEARS)
N Not Applicable No maintenance required N/A
9 ExcellentScheduled preventive maintenance – Treatments might include bridge washing, de-bris and vegetation removal, drainage clean-out, joint and crack sealing
1-58 Very Good
7 Good
6 Satisfactory Preventive maintenance or repair – Treatments might include zone painting, deck patching, repair/replace steel bearing
3-105 Fair
4 Poor
Structurally Deficient
Rehabilitation – Treatments might include complete painting, concrete deck over-lays (deep, shallow and hot-mix asphalt with membrane)
Replacement – Treatments might include deck replacement, superstructure replacement, substructure replacement (full or partial), total replacement
8-253 Serious
2 Critical
1“Imminent” Failure Condition
40-70
0 Failed
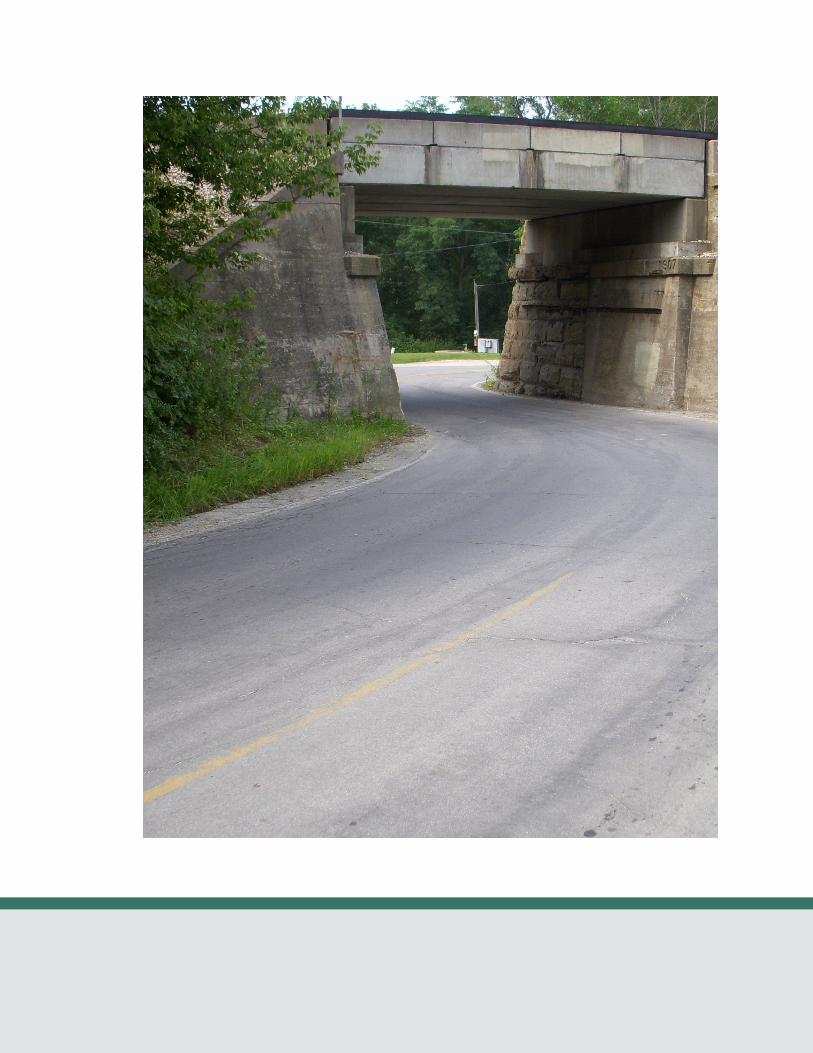

Pavement Asset Management Plan Template B1
A P P E N D I X BPavement Asset Management Plan Template

B2 Pavement Asset Management Plan Template
PA V E M E N T A S S E T M A N A G E M E N T P L A NThis Pavement Asset Management Plan satisfies State Funding Requirements. This plan must include the complete pavement inventory of the local agency.
Agency Name:
Contact Name:
Address:
Email:
Phone:
(If applicable)
Consultant Agency:
Consultant Contact Name:
Consultant Address:
Consultant Email:
Consultant Phone:

Pavement Asset Management Plan Template B3
Pavement Asset InventoryProvide the information below for the complete road inventory.
• Designation
• Roadway – Name and suffix (such as Street or Avenue)
• From – Name and suffix
• To – Name and suffix
• Length – Miles
• Width – Feet
• Number of Lanes
• Surface Type – Asphalt (no other substitutions), concrete, chip seal, gravel, brick, unimproved (e.g., dirt).
• Rating
• Year Rated
• Functional Classification
An example table is included on the next page.
Develop a list of proposed treatments by ratings by year for the next 5 years. Provide the information listed below.
• Rating
• Treatment Used
• Estimated Cost per Mile
• Estimated Miles
• Estimated Cost
An example table is included on the next page.
Objectives and Measures• Define the agency performance goals and ex-
pected level of service for pavements.
• Define the rating system used (Paser or Pci or another).
• Describe the process used to develop a work plan.
• Describe the monitoring program and plan for making updates and adjustments.
• Describe drainage and Row conditions.
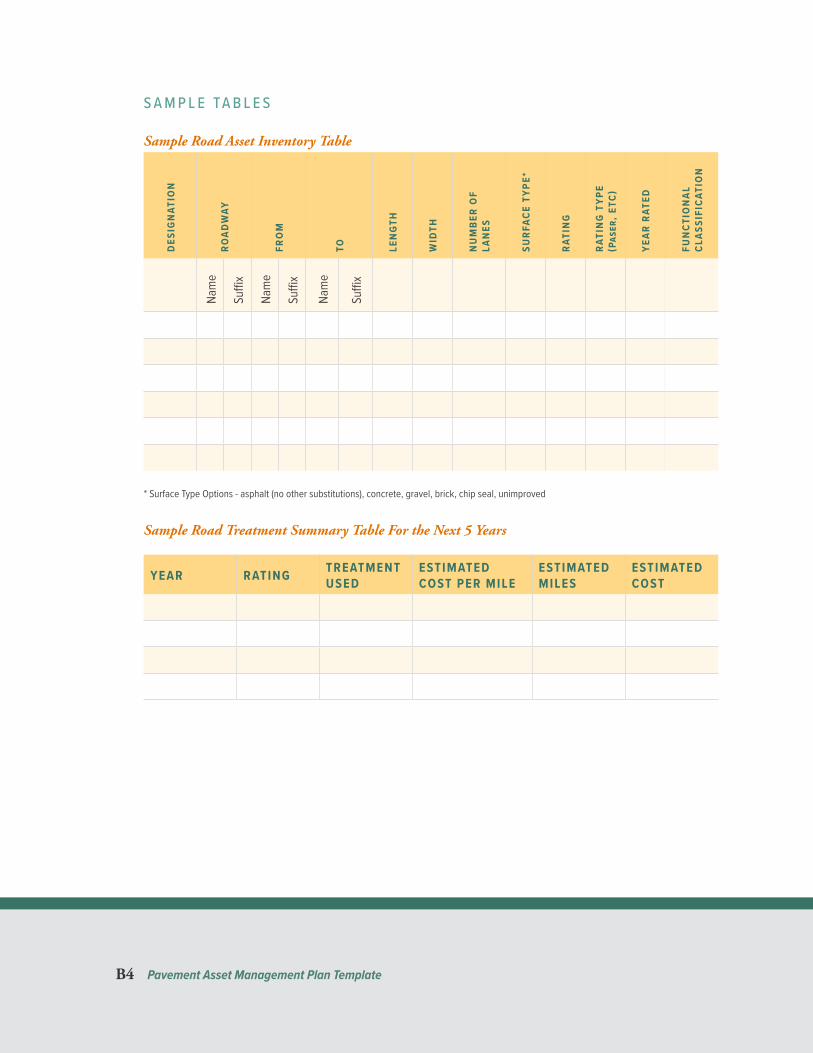
B4 Pavement Asset Management Plan Template
S A M P L E TA B L E S
Sample Road Asset Inventory Table
DES
IGN
ATIO
N
ROAD
WAY
FRO
M
TO LEN
GTH
WID
TH
NU
MBE
R O
F LA
NES
SURF
ACE
TYPE
*
RATI
NG
RATI
NG
TYP
E (P
aser
, ETC
)
YEAR
RAT
ED
FUN
CTIO
NAL
CL
ASSI
FICA
TIO
N
Nam
e
Suffi
x
Nam
e
Suffi
x
Nam
e
Suffi
x
* Surface Type Options - asphalt (no other substitutions), concrete, gravel, brick, chip seal, unimproved
Sample Road Treatment Summary Table For the Next 5 Years
YEAR RATING TREATMENT USED
ESTIMATED COST PER MILE
ESTIMATED MILES
ESTIMATED COST
Bridge Asset Management Plan Template C1
A P P E N D I X C Bridge Asset Management Plan Template

C2 Bridge Asset Management Plan Template
The submitted Bridge Asset Management Plan should at a minimum contain the “Priority Schedule for Bridges” that is located near the beginning of the bridge inspection reports. This table includes 5 categories: 1) Replacement, 2) Rehabilitation, 3) Widening, 4) Repair, 5) Elimination.
This table can be copied from the bridge inspection report or it can be modified based on your current schedule of priorities. If the table is modified, this should be coordinated with your bridge inspector so they can update the table during the next round of bridge inspections.
Examples of the inventory and condition table, as well as the Priority Schedule for Bridges, are provided on the next two pages in tables C-1 and C-2, respectively.

Bridge Asset Management Plan Template C3
Table C-1. Sample inventory and rating table.
Brid
ge N
umbe
r
NBI #
Deck
Rat
ing
Supe
rstru
ctur
e Ra
ting
Pain
t Sys
tem
Rat
ing
Subs
truct
ure
Ratin
g
Chan
nel R
atin
g
Culve
rt Ra
ting
Suffi
cienc
y Rat
ing
Stru
ctur
ally D
eficie
nt
Func
tiona
lly O
bsol
ete
BR 1 140 7 7 8 8 7 N 90.2
BR 2 26005 6 6 N 6 6 N 90.1
BR 3 24260 4 6 6 6 7 N 71.2 X
BR 4 7798 N N N N N N 96.7
BR 5 11120 4 4 N 6 5 N 65.1 X
BR 6 7780 4 4 6 6 4 3 83.1
BR 7 980 6 6 6 6 6 3 99.3
BR 8 990 5 5 6 4 7 3 35.1 X
BR 9 1070 6 6 5 5 6 3 80.9
BR 10 1080 6 6 5 5 6 3 78.9
BR 11 1110 7 7 8 8 7 N 90.2
BR 12 1120 6 6 N 6 6 N 90.3
BR 13 1170 4 6 6 6 7 N 71.2 X
BR 14 1180 7 7 6 6 7 6 96.3
BR 15 1000 7 7 5 5 7 5 67.5
BR 16 1010 7 7 8 8 7 6 99.3
BR 17 1020 4 4 N 6 5 N 65.1 X
BR 18 1030 7 7 6 6 7 4 98.1
BR 19 1040 7 7 6 6 7 4 98.1
BR 20 1090 5 4 5 5 7 4 22.1 X
BR 21 1100 6 6 5 5 6 4 96.0
BR 22 1130 7 7 8 8 7 N 90.2
BR 23 1140 6 6 N 6 6 N 90.2
BR 24 1150 4 6 6 6 7 N 71.2
BR 25 1160 6 6 5 5 6 4 93.6
BR 26 1050 5 5 N N 5 3 85.3
BR 27 1060 6 6 N N 6 3 86.3
BR 28 24130 4 4 N 6 5 N 65.1 X
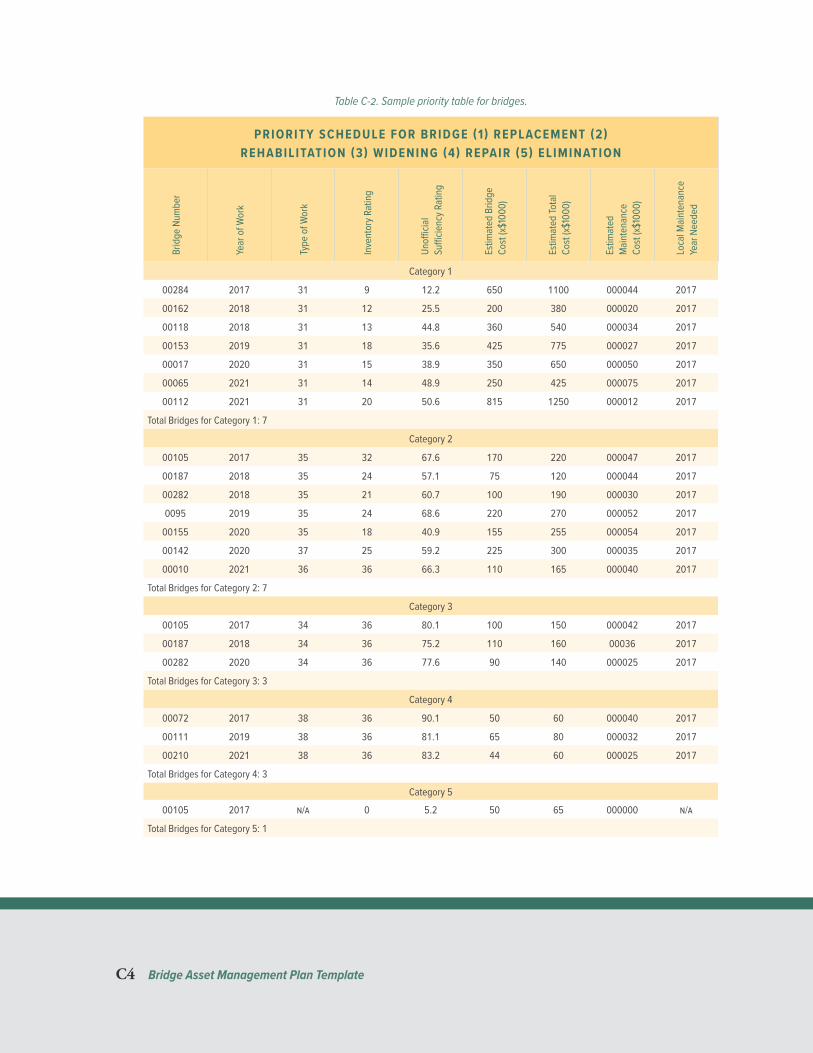
C4 Bridge Asset Management Plan Template
Table C-2. Sample priority table for bridges.
PRIORITY SCHEDULE FOR BRIDGE (1 ) REPLACEMENT (2) REHABILITATION (3) WIDENING (4) REPAIR (5) EL IMINATION
Brid
ge N
umbe
r
Year
of W
ork
Type
of W
ork
Inve
ntor
y Rat
ing
Unoffi
cial
Suffi
cienc
y Rat
ing
Estim
ated
Brid
ge
Cost
(x$10
00)
Estim
ated
Tota
l Co
st (x$
1000
)
Estim
ated
M
ainte
nanc
e Co
st (x$
1000
)
Loca
l Main
tena
nce
Year
Nee
ded
Category 1
00284 2017 31 9 12.2 650 1100 000044 2017
00162 2018 31 12 25.5 200 380 000020 2017
00118 2018 31 13 44.8 360 540 000034 2017
00153 2019 31 18 35.6 425 775 000027 2017
00017 2020 31 15 38.9 350 650 000050 2017
00065 2021 31 14 48.9 250 425 000075 2017
00112 2021 31 20 50.6 815 1250 000012 2017
Total Bridges for Category 1: 7
Category 2
00105 2017 35 32 67.6 170 220 000047 2017
00187 2018 35 24 57.1 75 120 000044 2017
00282 2018 35 21 60.7 100 190 000030 2017
0095 2019 35 24 68.6 220 270 000052 2017
00155 2020 35 18 40.9 155 255 000054 2017
00142 2020 37 25 59.2 225 300 000035 2017
00010 2021 36 36 66.3 110 165 000040 2017
Total Bridges for Category 2: 7
Category 3
00105 2017 34 36 80.1 100 150 000042 2017
00187 2018 34 36 75.2 110 160 00036 2017
00282 2020 34 36 77.6 90 140 000025 2017
Total Bridges for Category 3: 3
Category 4
00072 2017 38 36 90.1 50 60 000040 2017
00111 2019 38 36 81.1 65 80 000032 2017
00210 2021 38 36 83.2 44 60 000025 2017
Total Bridges for Category 4: 3
Category 5
00105 2017 n/a 0 5.2 50 65 000000 n/a
Total Bridges for Category 5: 1

Bridge Asset Management Plan Template C5
N O T E S