Embed Size (px)
Citation preview
- 1 -
Assessment Survey of Injection Safety and Safety of Phlebotomies, Lancet Procedures, Intravenous Injections and Infusions in
Government Health Facilities in the Philippines
EXECUTIVE SUMMARY Rationale: Safety of injections is an important health issue affecting millions
of individuals worldwide. Injections are the most common health care procedure
worldwide. It is estimated that as many as 16 thousand million injections are
administered annually in developing band transitional countries alone. The
assessment of the safety of injections was started by the World Health
Organization (WHO) in 2000. Using a standardized survey tool, countrywide
assessments on critical aspects of the injection procedure in over 90 nations
became possible. With the findings using this standardized tool, an increase in
awareness on the importance of safer injection procedures as well as comparisons
between countries became possible.
Objectives: This study was done 1) to make an initial assessment survey of the
injection safety practices in the government health facilities in the Philippines; and
2) to provide immediate feedback and recommendations for improvement on
injection safety practices of the participating government health facilities.
Specifically, the study was intended to a) to determine whether government health
facilities wherein injection and related procedures are performed meet the
necessary requirements for safe injection practices with adequate equipment,
supplies and waste disposal mechanisms; b) to determine whether critical steps in
performing procedures are executed according to recommended best practices; c)
to identify the unsafe practices which may be improved; and d) to determine the
- 2 -
proportion of government health facilities observed to perform safe injection
procedures.
Methodology: The assessment survey of eighty government health facilities using
the WHO standardized tool C-revised was performed using a cross-sectional
observational study design. Two-stage sampling was done to determine the 80
government health facilities needed to achieve a representative sample of
government health facilities for accurate country assessment. The Injection Safety
Study Team was formed and underwent training to standardize use of the pilot-
tested WHO assessment tool C-revised. Data collection of the 80 health facilities
was completed over a period of five weeks. Additional barangay health centers
with close geographic proximity were also observed and paired with the 36 health
facilities which did not routinely administer vaccinations and delegated
immunization activities to their respective barangay centers. Information from the
health facilities were obtained by structured observations of the facility, by
observations of injections procedures, by interview of health providers and their
supervisors and actual counting and observations of supplies.
Collected data was entered into the Epi Info data base and analyzed. Proportions
and rates were computed as outlined in the Tool C-Revised protocol with the 95%
confidence intervals also computed accordingly. All of the proportions and rates
were tabulated according to standard tables previously developed by the WHO.
Results and Conclusions: A total of 80 facilities in seven (7) randomly selected
regions in the Philippines were observed from November 15, 2007 to December
19, 2007. A total of 125 injections were observed in the 80 facilities. These
- 3 -
injections included: 60 vaccinations, 48 therapeutic injections, 2 family planning
and 15 dental injections. Vaccination injections observed in this study included all
the childhood immunization (DPT, MMR), pediatric and adult hepatitis
immunization, and tetanus. Therapeutic injections included intramuscular
antibiotic injections such as streptomycin, penicillin and intramuscular injections
for immunoglobulin such as for tetanus. On the other related procedures, a total of
35 phlebotomies, 30 lancet procedures, 32 intravenous injections and 40
intravenous infusions were observed, Phlebotomy procedures were mostly
observed at the facility laboratories. The intravenous injections and infusions were
documented mainly in the emergency rooms and the ward areas. Overall, 262
procedures were observed using the structured WHO assessment tool- C revised.
The most important findings were: 1) the frequency of re-use of needles and
evidence for attempts to sterilize used needles was low (less than 16%). This is
also supported by the actual observations that injection devices were obtained by
opening new sterile packets of new syringes and needles during the various
procedures observed, seen in 80% or more of the procedures; 2) High frequency
of noncompliance to best injection safety practices are widespread in the
government facilities including hand hygiene before injection procedure,
appropriate preparation the injection medication, vaccine or fluid in an adequately
clean place, proper disinfection of skin site, use of gloves in procedures that
invade the vascular system, palpation of the skin site after disinfection, and use of
multidose vials with needles left neglected onto the diaphragms; 3) High
frequency of high risk practices prone to needle stick injuries such as removing
the uncapped needle from the adapter widely used in almost two-thirds of the
- 4 -
facilities, two handed recapping was observed in almost three-fourths of the
facilities, and the transferring of blood from the syringe to a vacuum tube using
two hands was seen in more than 80% of facilities; 4) Many facilities lacked
adequate sharp disposal systems with only 49%, 45%, 69% and 66% of health
facilities surveyed were documented to have at least one acceptable puncture-
resistant container in designated areas where vaccinations, therapeutic injections,
phlebotomies and intravenous procedures respectively were routinely performed
for prompt and safe disposal immediately after each procedure. Only 17.5% (95%
CI, 9.0, and 26.0) of the facilities had additional puncture resistant containers in
stock when asked. In more than half of the facilities (56.2%) were overflowing or
pierced sharps containers seen; 5) Incomplete protection for hepatitis B through
vaccination of health care providers with only 61.2% admitting to having had
received three or more doses of the Hepatitis B vaccine, and 77.5% at least one
dose of the vaccine; 50% of health providers admitting to high frequency of
needle stick injuries that not all needle stick injuries were reported with only 10
out of the 38 providers reporting; and only in about one-fourth of the facilities did
the providers recall having attended an injection safety training lecture or
workshop in the last two years; 6) Almost all facilities were unable to show a
manual of injection safety or a manual of waste management.
The health provider staff of the participating health facilities expressed gratitude
for being part of the study. Those who were able to attend the feedback workshops
appreciated the information on injection safety and health waste management. By
the end of the workshops, concrete plans to improve injection safety in their
respective facilities have been identified.
- 5 -
Recommendations:
Based on the study findings, it is recommended that the Philippine national
program for injection safety be strengthened with the strategies addressing the
areas that were identified in this study as areas of concern:
• Training on infection control on safer injections including hand hygiene,
single use devices, proper use of multi-dose vials, preparation of injection
medication, use of gloves as needed and proper disposal of sharps and non
sharps waste after injection procedure
• Increase awareness through training on risk reduction of needle stick injury
by not recapping
• Availability of supplies of injection devices particularly recent advances in
technology of syringes allowing auto-disable and other safety devices.
• Reducing retail cost of injection devices on a country level
• Availability of supplies for puncture-resistant disposal containers in all areas
within all facilities performing injection procedures
• Increase coverage of protection of health providers by hepatitis B
immunization
• Strengthening implementing rules and regulations on proper waste
management and injection safety at local and national level to comply with
international standards.
- 6 -
Assessment Survey of Injection Safety and Safety of Phlebotomies, Lancet Procedures, Intravenous Injections and Infusions in
Government Health Facilities in the Philippines
I. INTRODUCTION:
Safety of injections is an important health issue affecting millions of individuals
worldwide. It is estimated that as many as 16 thousand million injections are
administered annually in developing and transitional countries alone.1 On a daily
basis, millions of people undergo some kind of injection procedure across the
world. The most common reason for injection procedures is for a therapeutic
purpose which comprise up to 90% of all injections. The rest of the injections
(10%) are for preventive purposes such as immunization and family planning.
Regardless of the purpose or situation in which injections are administered,
whether these injections are for vaccination, therapeutic injections or phlebotomy
for a diagnostic work-up, every injection must be a safe injection.
The principles of a safe injection are basic and universal. A safe injection,
phlebotomy, lancet or intravenous insertion procedure must consist of the
following: 1) it should not harm the recipient; 2) it should not expose the health
provider to any avoidable risk; and 3) it should not result in waste that is
dangerous to other people. 2 Through the years, more and more health facilities,
professional organizations and governments of countries have become
increasingly aware of the need for safe injection practices.
- 7 -
Unsafe injections can lead to morbidity and even to death. It may lead to
avoidable risks to patients, to health care providers and to the community. Each
year, hundreds of thousands of health care workers are estimated to be at risk for
infections like Hepatitis B and C and the human immunodeficiency virus (HIV)
due to unnecessary and avoidable accidents from needle stick injuries and
mucosal exposures.3 Whether these injections are for vaccination, therapeutic
injections or phlebotomy for diagnostic testing, patients must not be exposed to
similar risks of unsafe injection and other needle stick practices. Similarly, the
community where such injection procedures are performed should not be unduly
exposed to any risks related to improper waste disposal practices of the needles
and other sharp materials.
The assessment of the safety of injections was started by the World Health
Organization in 2000. Using a standardized survey tool, countrywide assessments
on critical aspects of the injection procedure in over 90 nations became possible.
With the findings using this standardized tool, an increase in awareness on the
importance of safer injection procedures as well as comparisons between countries
became possible.
In the Philippines, the safety of injection practices as well as other related
procedures like phlebotomy, use of lancet and intravenous infusions and injections
has not yet been formally evaluated.
- 8 -
II. OBJECTIVES:
This study was done 1) to make an initial assessment survey of the injection safety
practices in the government health facilities in the Philippines; and 2) to provide
immediate feedback and recommendations for improvement on injection safety
practices to the participating government health facilities.
Specifically, the study was intended a) to determine whether government health
facilities wherein injection and related procedures are performed meet the
necessary requirements for safe injection practices with adequate equipment,
supplies and waste disposal mechanisms; b) to determine whether critical steps in
performing procedures are executed according to recommended best practices; c)
to identify the unsafe practices which may be improved; and d) to determine the
proportion of government health facilities observed to perform safe injection
procedures.
III. METHODOLOGY
1. Study Design:
The assessment survey using the WHO tool C-revised was performed using a
cross-sectional observational study design.
2. Description of Country
The Philippines is an archipelago comprise by over 7,100 islands. Geographically,
there are three main island groups: Luzon, Visayas and Mindanao.
Administratively, the country is divided into 17 regions from Region I to Region
- 9 -
XIII and the National Capital Region (NCR), the Autonomous Region of Muslim
Mindanao (ARMM) and the Cordillera Administrative Region (CAR). Each
region is further comprised by several provinces; each province by several
municipalities and cities. Each municipality is comprised of several barangays.
The population of the Philippines in 2007 was reported to be 87.6 million people.
The state of health in the Philippines has greatly improved over the past 20
years. This was attributed mainly through mass immunization plans, health
education, vector control, and the provision of potable water. The government of
the Philippines allocates 3% of its budget for the health sector or an expenditure
that would allow US$4.10 for each Filipino each year.4
Important health indicators of the country include the following: Infant mortality
rates (IMR) declined to 29 per 1000 live births in 2003, from 32 per 1000 live
births in 1998, and down from 52/1000 in 1980.5 Maternal morality ratio (MMR)
likewise improved from 209 per 100,000 live births in 1993 down to 172 per
100,000 live births in 1997.5 The leading cause of mortality is heart disease,
causing 79 deaths/100,000 people in 2000. The most common 10 leading causes
of morbidity are still the communicable diseases and from 1995 to 2000 included
diarrhea, bronchitis, pneumonia, influenza, tuberculosis, malaria, chickenpox and
measles. In 2001, an estimated 0.07% of the population was living with
HIV/AIDS. Measles and DPT immunization rates have improved in past five
years, yet they are still lower than rates in 1980. As of 2001, 79% of the
population was immunized against DPT, and 71% against measles. In 2000,
- 10 -
65.3% of total births were attended by trained personnel5 and an estimated 86% of
pregnant women receive ante-natal care.
3. Government Health Facilities Included
Government-run or public health facilities in the Philippines are of several types.
The Department of Health (DOH) through the Regional Health Offices [i.e.
Centers of Health Development (CHD)] provided the study team with the master
list of all the licensed government health facilities in the country indicating their
level of care offered, service capability and authorized number of beds. In this list
there are 703 listed facilities: with 331 Level 1 facilities or infirmary level; 282
Level 2 or primary care level; 36 Level 3 or secondary care level; and Level 4 or
tertiary care level facilities. Administratively, these facilities could be either a
national facility (i.e. by the Department of Health or the Department of Defense)
or run by the local government (either at the provincial, city or municipal level).
This assessment survey included 80 representatives of government health facilities
from regions across the country randomly taken from this master list of licensed
facilities obtained from the DOH.
In addition to the licensed facilities listed in the above master list of the
Department of Health, several hundred small barangay health centers exist
throughout the country. Administratively these smallest health centers are run
mainly by the municipal government units. Many of the programs of the
Department of Health are trickled down to these centers for implementation. For
instance, the expanded immunization program of the DOH is fully implemented
- 11 -
through their involvement, making vaccines available and accessible to the
smallest barangays. For these health centers, licensing and quality assurance
procedures are accomplished through agencies such as the Philippine Health
Insurance Corporation (PHIC) and the Sentrong Sigla certification... A master list
of all these barangay health centers is not readily available but may be obtained
mainly by putting together reports of all the listings of municipalities across the
country.
In this study, when the randomly selected health facility does not routinely
perform vaccination at their facility sites and instead delegates the responsibility
of immunization of the community to their partner barangay centers, the closest
barangay health center were identified and were included as observation sites for
vaccination procedures.
A letter of introduction was prepared by the Department of Health inviting the
government health facilities to participate in the study. The final consent to visit
the facility was given by the highest official of the facility, usually the medical
director. Proper introduction, courtesy calls and expression of gratitude were
observed before and after the assessment survey was made.
4. Description of the Assessment Survey Tool:
The Tool-C-Revised of the World Health Organization was used in a standardized
manner across all the 80 government health facilities surveyed. This assessment
tool has been developed by the WHO and has been successfully used in over 90
countries. The initial version of this tool looked mainly into vaccination and
- 12 -
therapeutic injections. The revised version now includes other related procedures
such as phlebotomy, lancet procedures, intravenous injections and infusions.
The Tool-C Revised has been pilot-tested previously in the Philippines and
suggestions on how the tool could be modified to adjust to the needs of the local
implementing team of assessors have been submitted (Appendix A).
The Tool-C Revised underwent minor revisions before its actual final form to be
used in the survey. The final format used for this study in the Philippines is seen
in Appendix B.
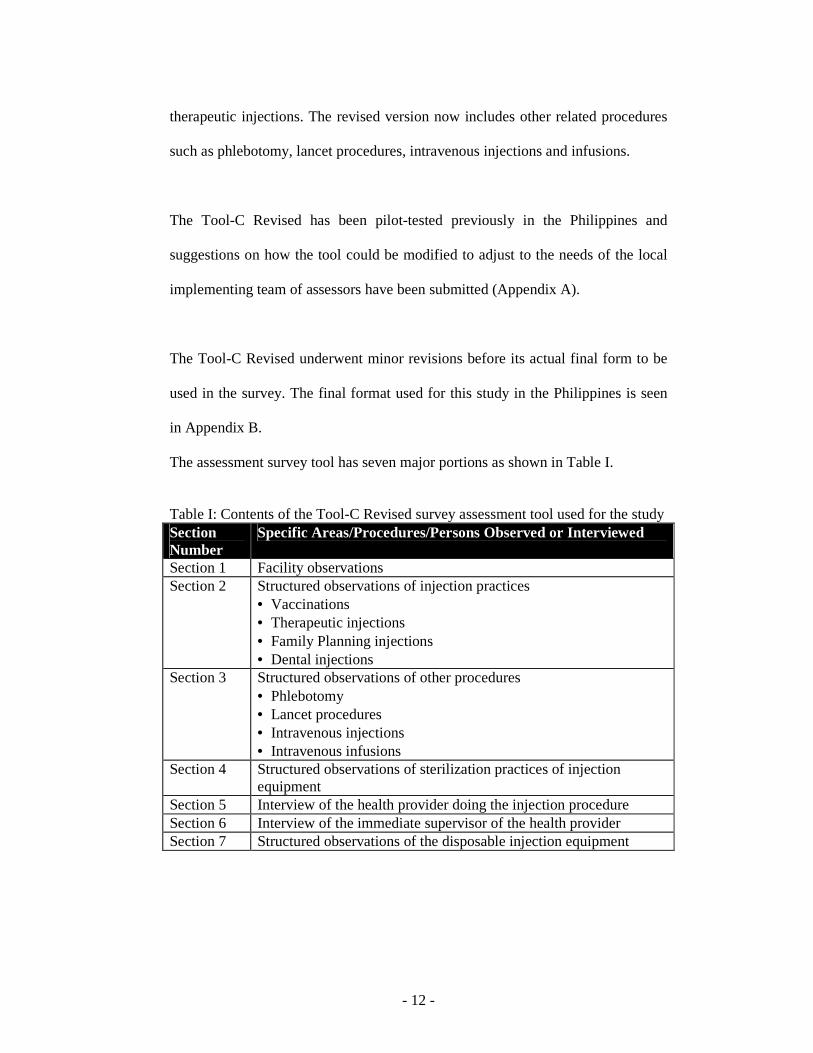
The assessment survey tool has seven major portions as shown in Table I.
Table I: Contents of the Tool-C Revised survey assessment tool used for the study Section Number
Specific Areas/Procedures/Persons Observed or Interviewed
Section 1 Facility observations Section 2 Structured observations of injection practices
• Vaccinations • Therapeutic injections • Family Planning injections • Dental injections
Section 3 Structured observations of other procedures • Phlebotomy • Lancet procedures • Intravenous injections • Intravenous infusions
Section 4 Structured observations of sterilization practices of injection equipment
Section 5 Interview of the health provider doing the injection procedure Section 6 Interview of the immediate supervisor of the health provider Section 7 Structured observations of the disposable injection equipment
- 13 -
5. Types of Providers and Services Included: Within the identified government health facilities, the areas providing the
following services will be included in the survey to asses injection practices
within the area: Outpatient Dental Clinic, Outpatient Minor Surgical Clinic,
Immunization Clinic, Emergency Room, Laboratory, Blood Bank,
As described above, when the health facility delegated its immunization functions
to the barangay health centers, these procedures were observed at the nearest
available health centers.
Doctors, nurses and midwives and their immediate supervisors providing direct
patient care in these areas were invited to participate in the survey for interview.
6. Procedures for Sampling: Two-stage sampling was done to determine the 80 government facilities needed to
achieve accurate data from a representative sample of government health facilities.
In this sampling method, the sampling unit is the health facility.
Strictly following the steps on the sampling procedures provided by the WHO
Tool-C Revised protocol, the first stage was determined by cluster sampling to
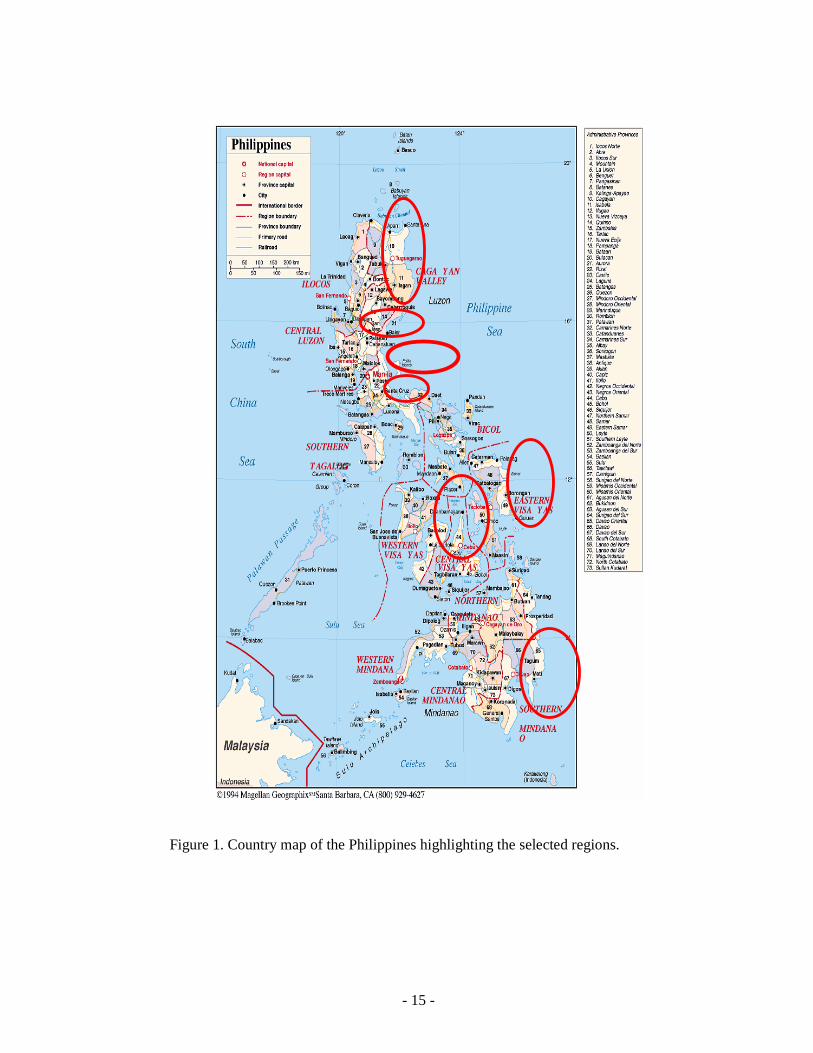
select the regions in the Philippines to be included in the study. Figure 1
highlights in a country map the seven regions in the Philippines which were
randomly selected from the thirteen regions to be the sites of the study. Table II
summarizes seven regions and the corresponding number of government health
facilities per region. In the sampling method used, the probability of selection was
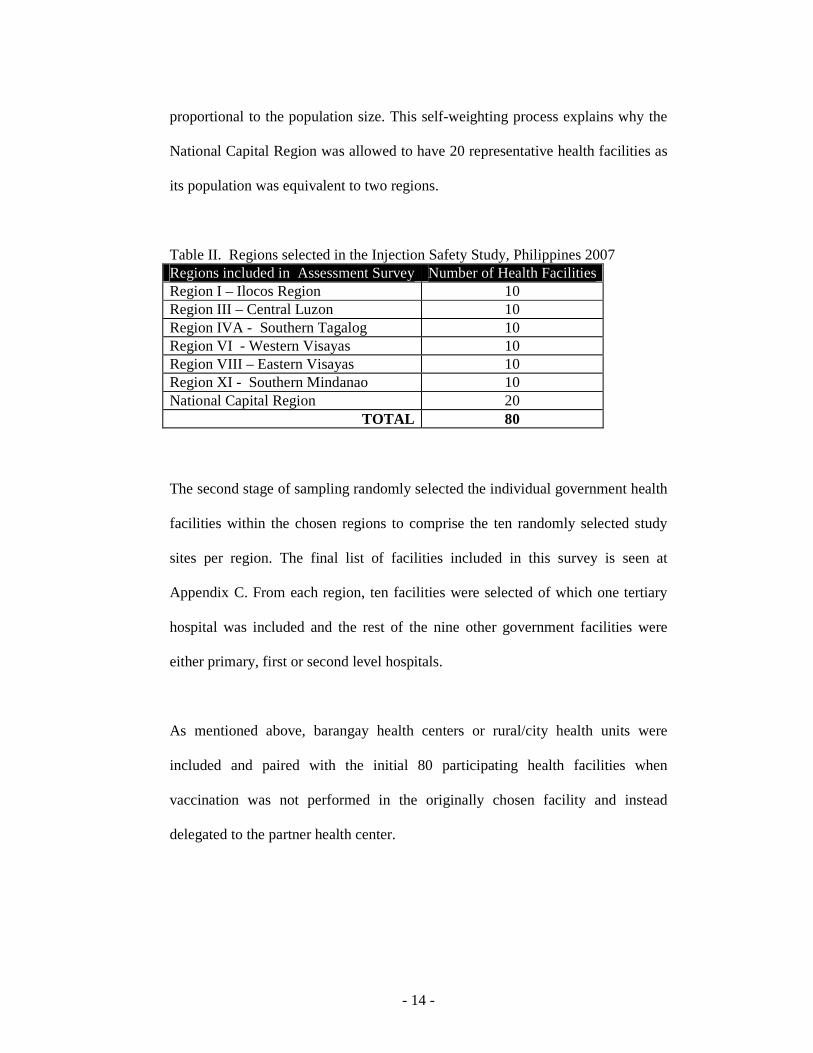
- 14 -
proportional to the population size. This self-weighting process explains why the
National Capital Region was allowed to have 20 representative health facilities as
its population was equivalent to two regions.
Table II. Regions selected in the Injection Safety Study, Philippines 2007 Regions included in Assessment Survey Number of Health Facilities Region I – Ilocos Region 10 Region III – Central Luzon 10 Region IVA - Southern Tagalog 10 Region VI - Western Visayas 10 Region VIII – Eastern Visayas 10 Region XI - Southern Mindanao 10 National Capital Region 20
TOTAL 80
The second stage of sampling randomly selected the individual government health
facilities within the chosen regions to comprise the ten randomly selected study
sites per region. The final list of facilities included in this survey is seen at
Appendix C. From each region, ten facilities were selected of which one tertiary
hospital was included and the rest of the nine other government facilities were
either primary, first or second level hospitals.
As mentioned above, barangay health centers or rural/city health units were
included and paired with the initial 80 participating health facilities when
vaccination was not performed in the originally chosen facility and instead
delegated to the partner health center.
- 15 -
Figure 1. Country map of the Philippines highlighting the selected regions.
- 16 -
7. Data Collection:
The schedule followed by the project team can be found in Table III. The actual
period for data collection took longer than originally planned by almost three
weeks because of the following major reasons: 1) The approval process of the
health facility officials for the team to visit their respective facilities took longer
than anticipated for some of the areas specially in the urban areas; 2) Bad weather
conditions which included two strong typhoons that the country, particularly
Regions VI and VIII, experienced during the study period; The period of study
unfortunately coincided with extremely unexpected weather disturbance not very
typical for that time of the year. 3) Many facilities which were randomized to be
included in the study in most of the regions were in geographically separate and
very distant locations from one another. These entailed long travel times involving
land, air and sea travel between facilities and thus did not allow at least two
facilities to be visited on the same day as was originally planned; 4) The modified
schedule also accommodated the additional 35 barangay health units that data
collectors had to return to so that more vaccination procedures could be included
in the survey. The barangay health centers, in general, perform immunization
activities on Wednesdays
Training of Data Collectors:
The training and orientation workshop of the Injection Safety Team composed of
16 assessors, 5 field supervisors and 1 encoder was held on November 13-14,
2007. The names, educational background and work experience of the Injection
Safety Study Team can be found in Appendix D.
- 17 -
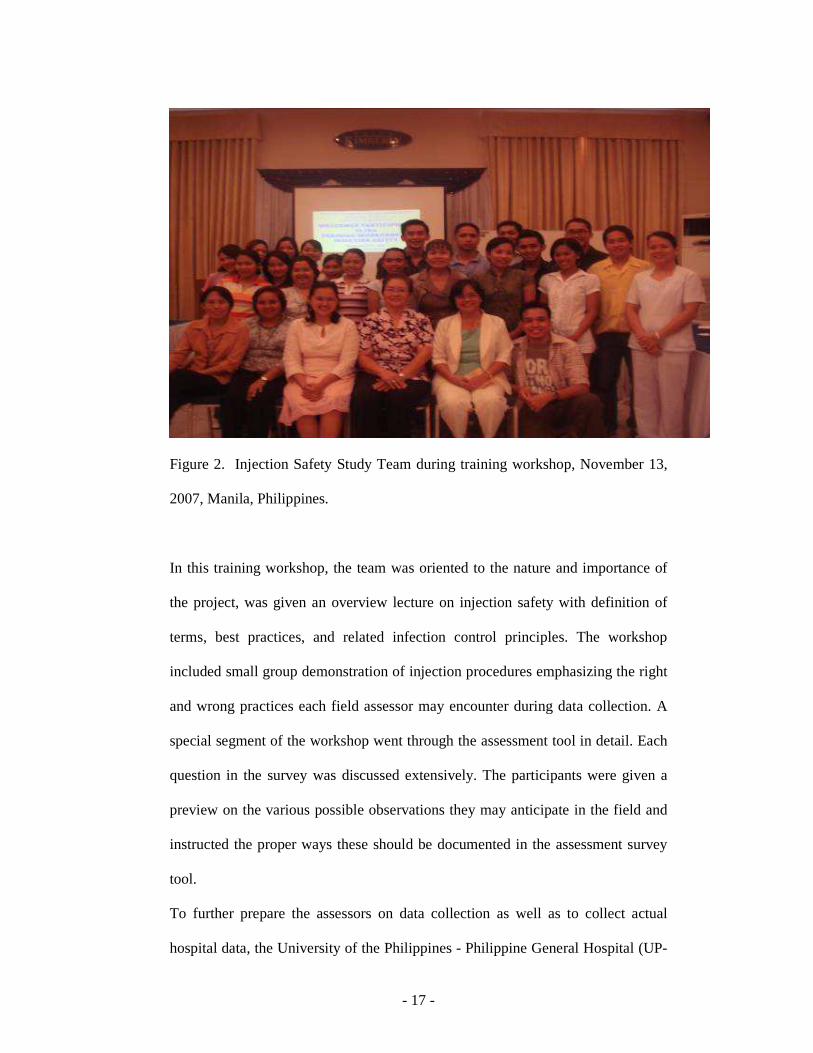
Figure 2. Injection Safety Study Team during training workshop, November 13,
2007, Manila, Philippines.
In this training workshop, the team was oriented to the nature and importance of
the project, was given an overview lecture on injection safety with definition of
terms, best practices, and related infection control principles. The workshop
included small group demonstration of injection procedures emphasizing the right
and wrong practices each field assessor may encounter during data collection. A
special segment of the workshop went through the assessment tool in detail. Each
question in the survey was discussed extensively. The participants were given a
preview on the various possible observations they may anticipate in the field and
instructed the proper ways these should be documented in the assessment survey
tool.
To further prepare the assessors on data collection as well as to collect actual
hospital data, the University of the Philippines - Philippine General Hospital (UP-
- 18 -
PGH) was purposively chosen to be the site for initial facility assessment survey
and this was done on November 14, 2007. This activity was done to give the
assessors actual experience in making observations in actual injection procedures
and documenting these observations by using the assessment tool correctly. The
data collected for this facility was however not included in the nationwide survey.
Instead the collected information was encoded separately and analyzed
accordingly.
After spending the morning of November 14, 2007 in various sites of the UP-PGH,
the 16 assessors regrouped and discussed experiences, questions and other
relevant issues.
Data collection at the National Capital Region commenced on November 15, 2007.
Subsequent data collection of all other regions started on November 19, 2007. All
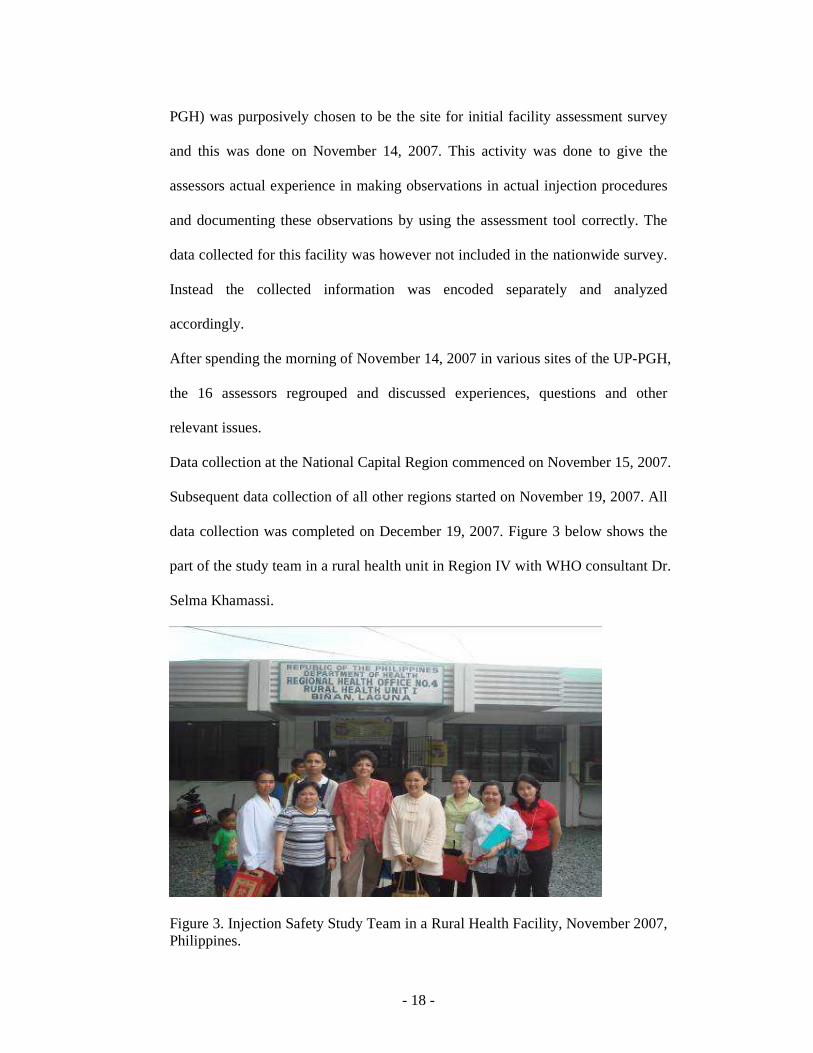
data collection was completed on December 19, 2007. Figure 3 below shows the
part of the study team in a rural health unit in Region IV with WHO consultant Dr.
Selma Khamassi.
Figure 3. Injection Safety Study Team in a Rural Health Facility, November 2007, Philippines.
19
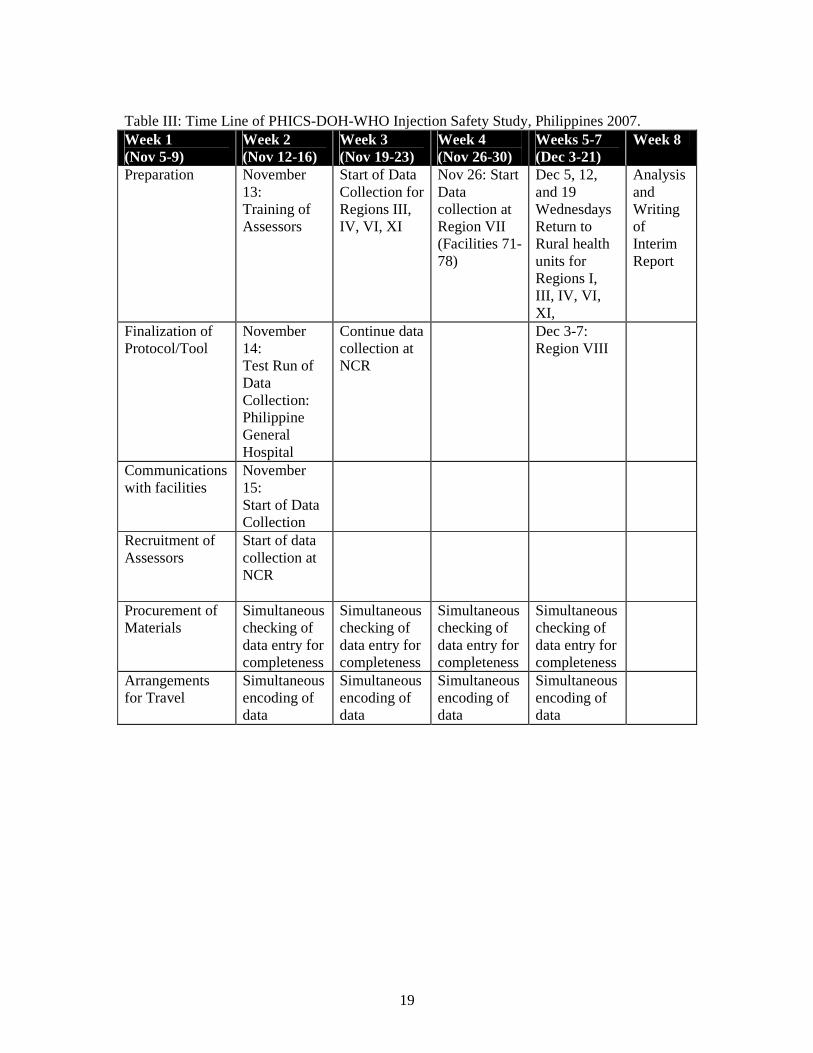
Table III: Time Line of PHICS-DOH-WHO Injection Safety Study, Philippines 2007. Week 1 (Nov 5-9)
Week 2 (Nov 12-16)
Week 3 (Nov 19-23)
Week 4 (Nov 26-30)
Weeks 5-7 (Dec 3-21)
Week 8
Preparation November 13: Training of Assessors
Start of Data Collection for Regions III, IV, VI, XI
Nov 26: Start Data collection at Region VII (Facilities 71-78)
Dec 5, 12, and 19 Wednesdays Return to Rural health units for Regions I, III, IV, VI, XI,
Analysis and Writing of Interim Report
Finalization of Protocol/Tool
November 14: Test Run of Data Collection: Philippine General Hospital
Continue data collection at NCR
Dec 3-7: Region VIII
Communications with facilities
November 15: Start of Data Collection
Recruitment of Assessors
Start of data collection at NCR
Procurement of Materials
Simultaneous checking of data entry for completeness
Simultaneous checking of data entry for completeness
Simultaneous checking of data entry for completeness
Simultaneous checking of data entry for completeness
Arrangements for Travel
Simultaneous encoding of data
Simultaneous encoding of data
Simultaneous encoding of data
Simultaneous encoding of data
20
8. Data Management:
The following important aspect of data management needs to be emphasized. Despite
numerous observation areas within each facility, multiple observations of various
procedures and several interviewed providers, each facility was only represented by
one response for each item in the data collection forms. This entailed a process in
which two or more of the data collectors would sit together and summarize the
various observations and responses to interviews such that only one answer represents
the facility of that particular question. The chosen answer would be the “worst”
practice or “worst” response having as reference standard what was considered “best
practices in injection safety” as taught during the training of data collectors.
This aspect of data management is a very critical step in data management and
analysis of this study. The consequences in the summary performance of each facility
need to be understood not only by the readers of the results of this study but by the
officials and other staff of the participating facilities as well. For instance, one facility
may have several sinks for hand washing in most areas where injection procedures
were performed. However during the visit, the phlebotomy area was noted not to have
a sink for hand washing. In the summary data collection form, the single entry for the
facility will record “NO” as the response to the query of having sinks for hand
washing even if there may be ten other sinks in that facility. Similarly, if there were
two observations made on intravenous insertion and infusion. One provider wore
gloves and the other did not wear gloves during the procedure, the recorded response
into the summary form will be the “worse“ observation. There were only a maximum
of eighty (80) responses for each assessment tool item, each health facility
represented only once per item.
21
Data collection forms were checked rigorously by field supervisors for completeness
before leaving regions and study sites.
Data were encoded and entered into the Epi Info database. The accuracy of data entry
into the Epi Info program was cross checked by comparing the frequency of responses
tabulated by the Epi Info against a manual tabulation of data. This checking step was
repeated with five randomly selected items. No errors were detected and data entry
was assumed to have been performed with adequate accuracy.
Proportions and rates were computed as outlined in the Tool C-Revised protocol.
Percentage and standard errors are reported in three (3) decimal places. The 95%
confidence intervals were computed accordingly. Some 95% confidence interval
estimates of percentages contain implausible values (i.e. <0 and >100; these are noted.
Some items do not have interval estimates because of small sample size.
All of the proportions and rates were tabulated according to standard tables previously
developed by the WHO and reported below.
9. Improvement Workshops:
Three training workshops on injection safety were held on November 29, 2007 for the
first 10 facilities of the National Capital Region, March 25, 2008 for the other
government participating facilities; and on March 26, 2008 for the Philippine General
Hospital.
22
Each workshop was an eight-hour (8am-5pm) activity and involved key hospital
officials who played important roles in the procurement of supplies and
implementation of policy related to injection safety. These may include: Hospital
Director, Chief of Health Operations, Chief of Nursing, nursing supervisors, infection
control officers, laboratory managers, purchasing officer and pharmacy as well as
training officers.
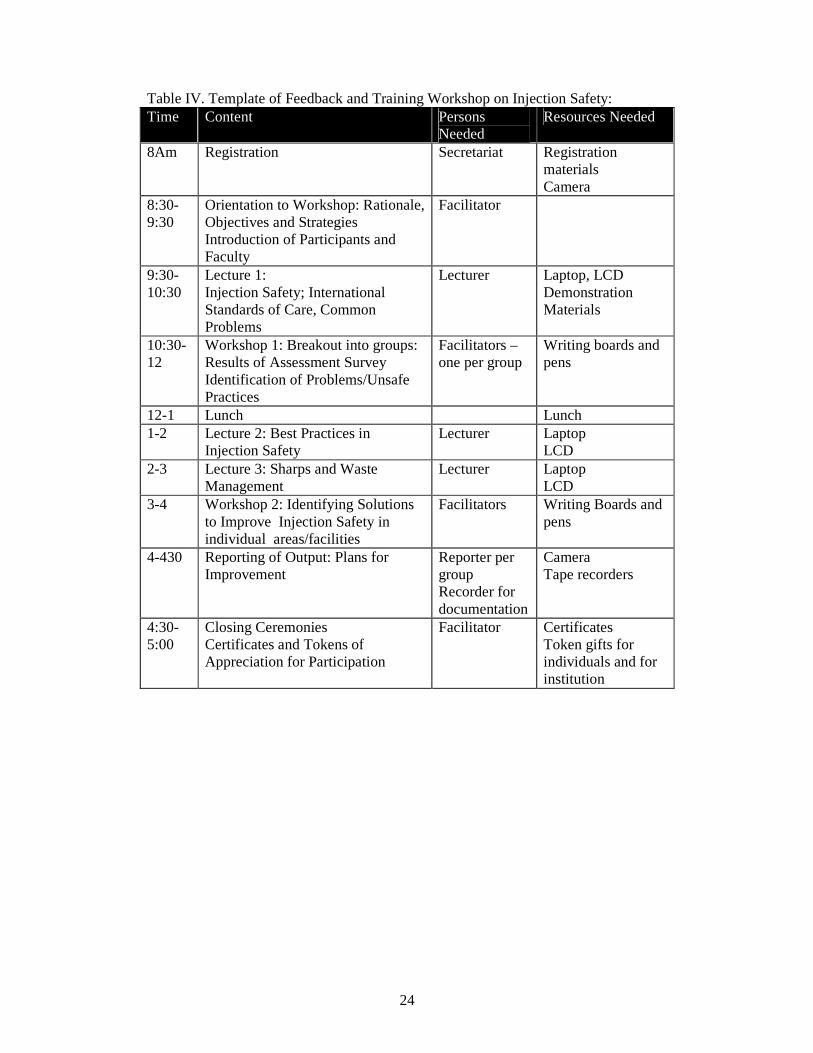
Content and final format of workshop was developed according to the results of the
assessment survey. In general, all workshops followed a template as seen in Table IV.
In general, the responses of the representatives of the health facilities were very
positive. They expressed gratitude in having been part of the study and for the
initiative of being told of the results of the study. The workshop participants found the
lectures very informative. Break-out sessions allowed them to work out the problems
in their respective sites and identify feasible solutions which could be immediately be
implemented to improve injection safety in their institutions. Figures 4, 5 and 6
documents the participants in the various workshops held.
23
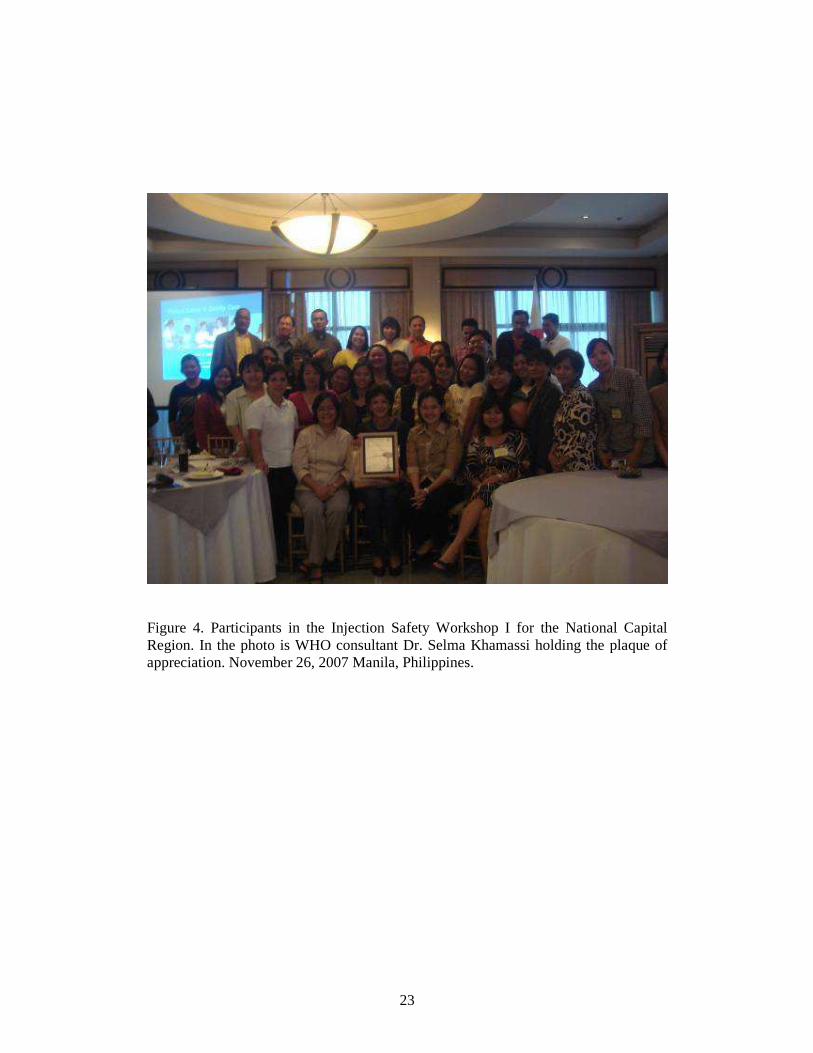
Figure 4. Participants in the Injection Safety Workshop I for the National Capital Region. In the photo is WHO consultant Dr. Selma Khamassi holding the plaque of appreciation. November 26, 2007 Manila, Philippines.
24
Table IV. Template of Feedback and Training Workshop on Injection Safety: Time Content Persons
Needed Resources Needed
8Am Registration Secretariat Registration materials Camera
8:30-9:30
Orientation to Workshop: Rationale, Objectives and Strategies Introduction of Participants and Faculty
Facilitator
9:30-10:30
Lecture 1: Injection Safety; International Standards of Care, Common Problems
Lecturer Laptop, LCD Demonstration Materials
10:30-12
Workshop 1: Breakout into groups: Results of Assessment Survey Identification of Problems/Unsafe Practices
Facilitators – one per group
Writing boards and pens
12-1 Lunch Lunch 1-2 Lecture 2: Best Practices in
Injection Safety Lecturer Laptop
LCD 2-3 Lecture 3: Sharps and Waste
Management Lecturer Laptop
LCD 3-4 Workshop 2: Identifying Solutions
to Improve Injection Safety in individual areas/facilities
Facilitators Writing Boards and pens
4-430 Reporting of Output: Plans for Improvement
Reporter per group Recorder for documentation
Camera Tape recorders
4:30-5:00
Closing Ceremonies Certificates and Tokens of Appreciation for Participation
Facilitator Certificates Token gifts for individuals and for institution
25
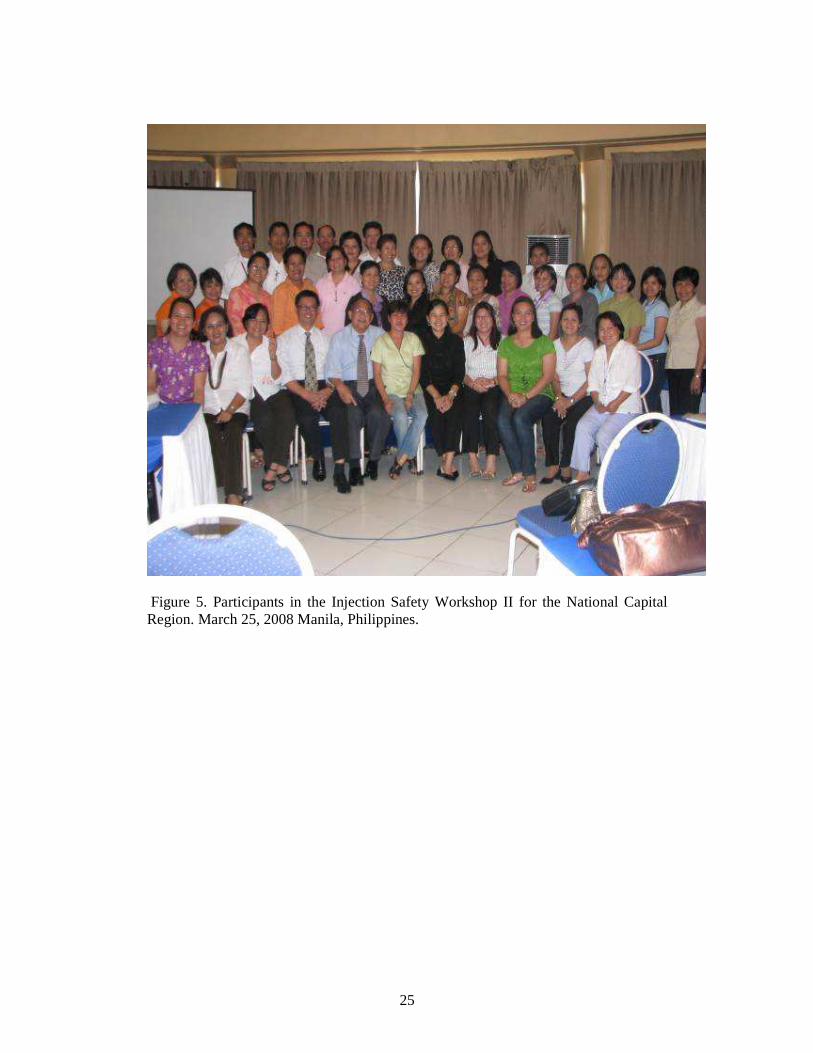
Figure 5. Participants in the Injection Safety Workshop II for the National Capital Region. March 25, 2008 Manila, Philippines.
26
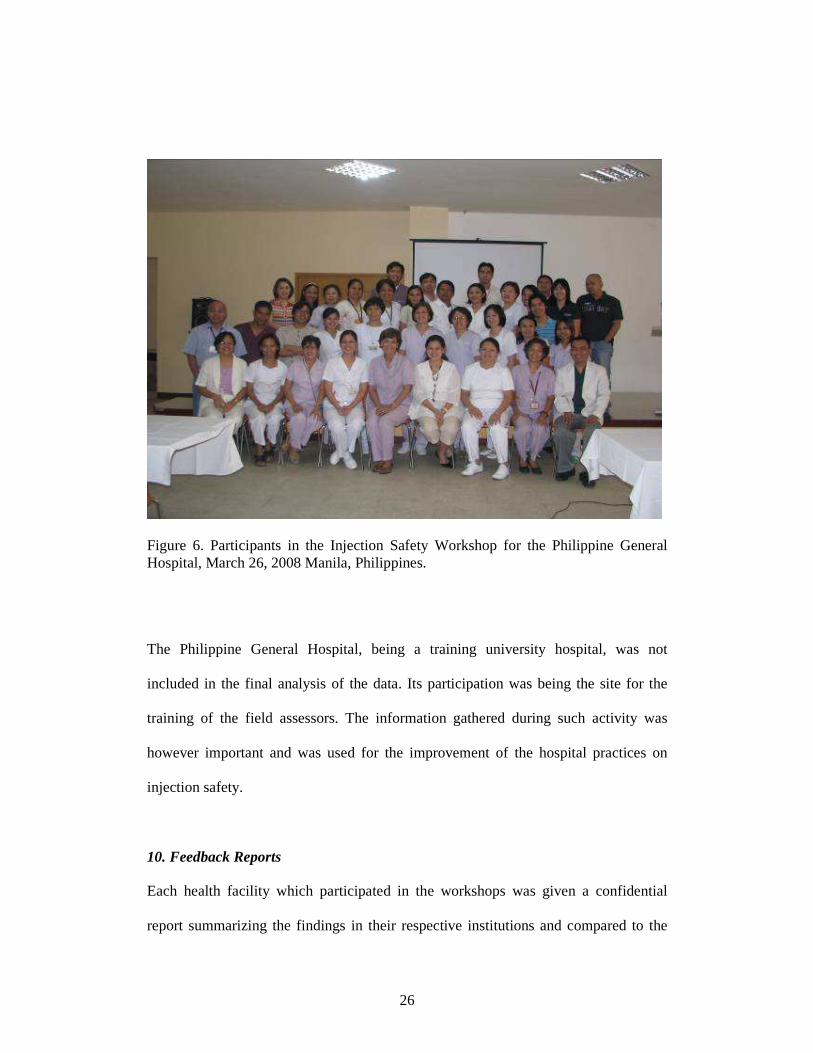
Figure 6. Participants in the Injection Safety Workshop for the Philippine General Hospital, March 26, 2008 Manila, Philippines.
The Philippine General Hospital, being a training university hospital, was not
included in the final analysis of the data. Its participation was being the site for the
training of the field assessors. The information gathered during such activity was
however important and was used for the improvement of the hospital practices on
injection safety.
10. Feedback Reports
Each health facility which participated in the workshops was given a confidential
report summarizing the findings in their respective institutions and compared to the
27
accepted “best practices” in injection safety. The compilation of these individual
facility summary reports is found in a separate document. A sample of this individual
facility report is seen in Appendix D.
IV. RESULTS:
A total of 80 facilities in seven (7) randomly selected regions in the Philippines were
observed from November 15, 2007 to December 19, 2007. Table V shows the
distribution of the facilities according to region.
Table V: Distribution of facilities according to region
Location Frequency Percent NCR 20 25.0% REGION I 10 12.5% REGION III 10 12.5% REGION IV 10 12.5% REGION VI 10 12.5% REGION VIII 10 12.5% REGION XI 10 12.5%
Total 80 100.0% Great care was observed in completing data collection from all the 80 government
health facilities in the original base random sample without replacement. However,
from the original list of 80 facilities, eighteen were replaced by the alternate facilities
because of any one of the following reasons: 1) the health facility had recently
privatized and thus not run by government anymore; 2) the head of the facility was
not available on the requested date of the visit by the study team; 3) the facility was in
a high risk area such as where there were reported guerilla war groups or in an island
during the typhoon, thus posed potential security risks to the assessors; or 4) the
facility could not be physically accessed such as in a remote mountainous area and
28
transportation was difficult. The alternate facilities were chosen also by random
sampling.
1. Inclusion of Rural Health Units:
During the course of data collection, it was observed that the number of injection
procedures for immunization actually performed in the participating government
health facilities was limited. Regardless of the level of health facilities, whether Level
1, 2, 3 or 4, many institutions apparently delegated most of its vaccination activities to
local centers called rural health units or the city health units. Thus, as described in the
methodology, when a health facility did not have a vaccination procedure on the day
the visit was made, the nearest rural or city health unit was identified as well as the
next available scheduled immunization day. These paired RHUs were visited and
observed for injection practices for vaccination. The data on observations for
vaccination was incorporated into the data of its partner health facility in the original
list of 80 government facilities.
Table VI tabulates the pairing of the RHUs with licensed government health facility.
A total of 35 rural or city health offices were included. Despite efforts to go back to
the RHUs particularly in the Visayas and some areas of Luzon, vaccination practices
were still not documented for Region VI, VIII and some parts of Luzon because of the
destruction of rural health units during the recent typhoons. For some areas, the RHUs
performed vaccination in situations or schedules that could not be accommodated in
the time frame and the scope of this study. For instance, some RHUs gave vaccination
to its community by doing home visits and may involve hours of walking to remote
villages. Others developed a once a month schedule such as anti-measles campaign.
29
Table VI. Pairing of RHUs and Govt Health Facility Regions No. of govt facilities paired to a Rural or City Health Unit I 6 III 5 IVA 6 VI 6 VIII 0 XI 5 NCR 7
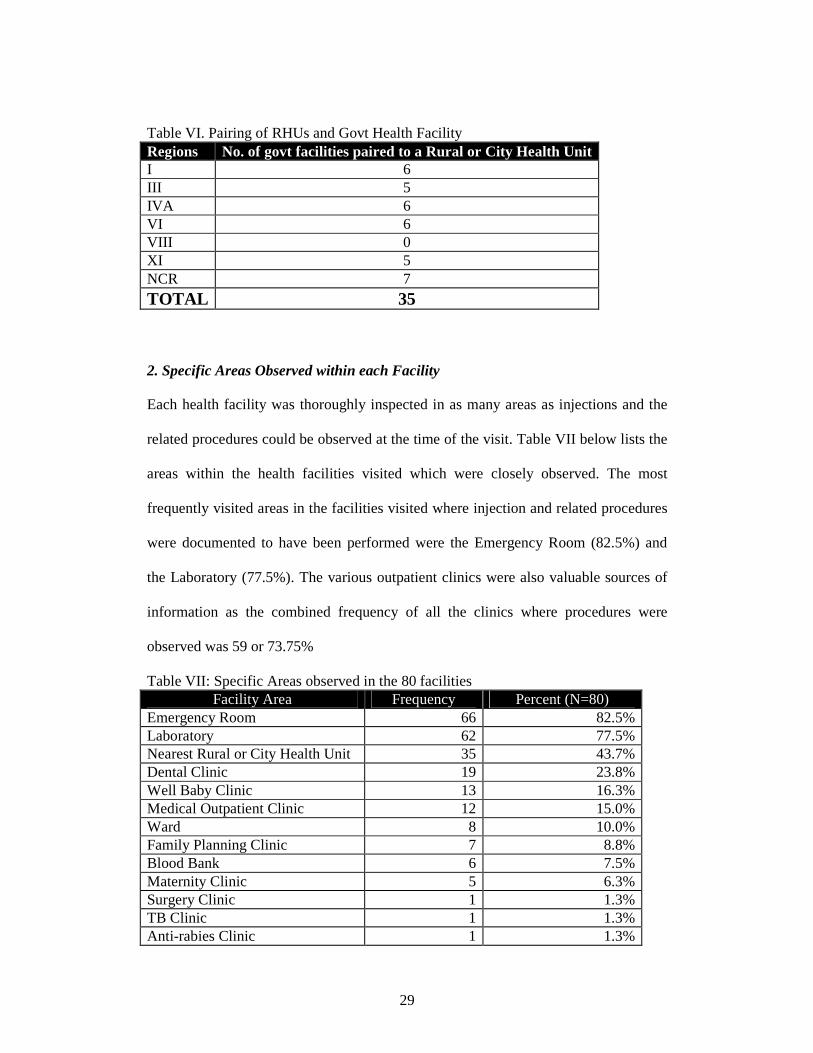
TOTAL 35 2. Specific Areas Observed within each Facility Each health facility was thoroughly inspected in as many areas as injections and the
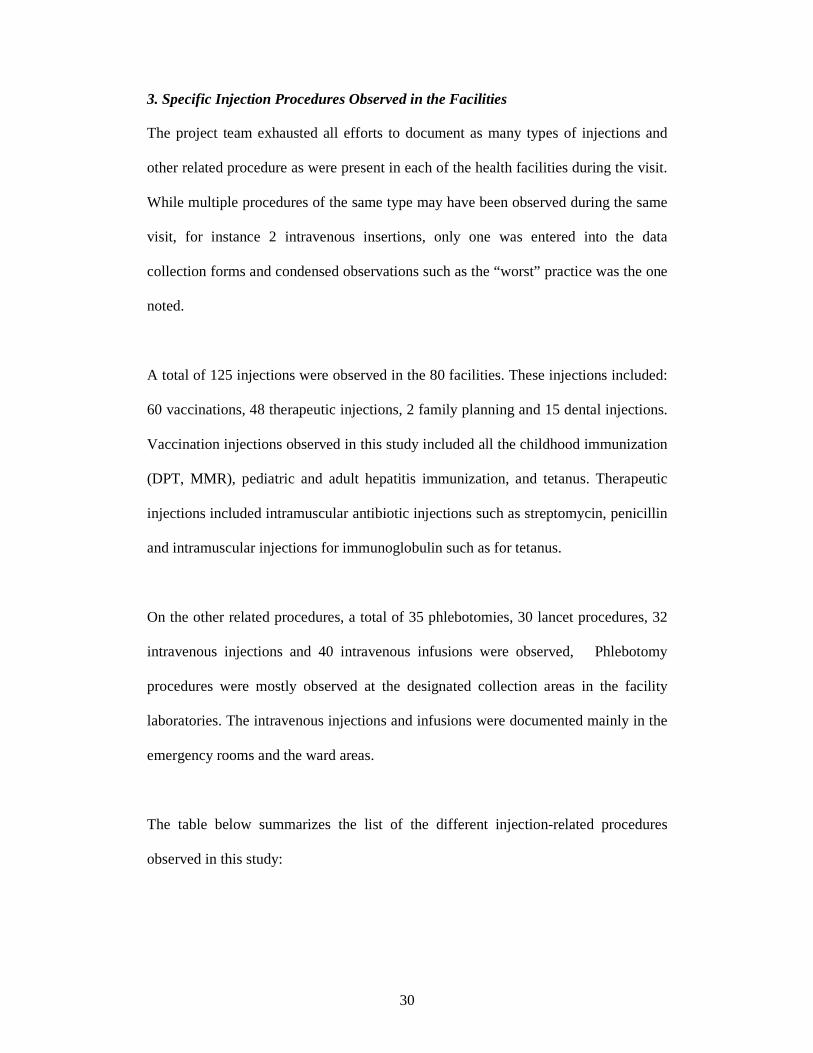
related procedures could be observed at the time of the visit. Table VII below lists the
areas within the health facilities visited which were closely observed. The most
frequently visited areas in the facilities visited where injection and related procedures
were documented to have been performed were the Emergency Room (82.5%) and
the Laboratory (77.5%). The various outpatient clinics were also valuable sources of
information as the combined frequency of all the clinics where procedures were
observed was 59 or 73.75%
Table VII: Specific Areas observed in the 80 facilities Facility Area Frequency Percent (N=80)
Emergency Room 66 82.5% Laboratory 62 77.5% Nearest Rural or City Health Unit 35 43.7% Dental Clinic 19 23.8% Well Baby Clinic 13 16.3% Medical Outpatient Clinic 12 15.0% Ward 8 10.0% Family Planning Clinic 7 8.8% Blood Bank 6 7.5% Maternity Clinic 5 6.3% Surgery Clinic 1 1.3% TB Clinic 1 1.3% Anti-rabies Clinic 1 1.3%
30
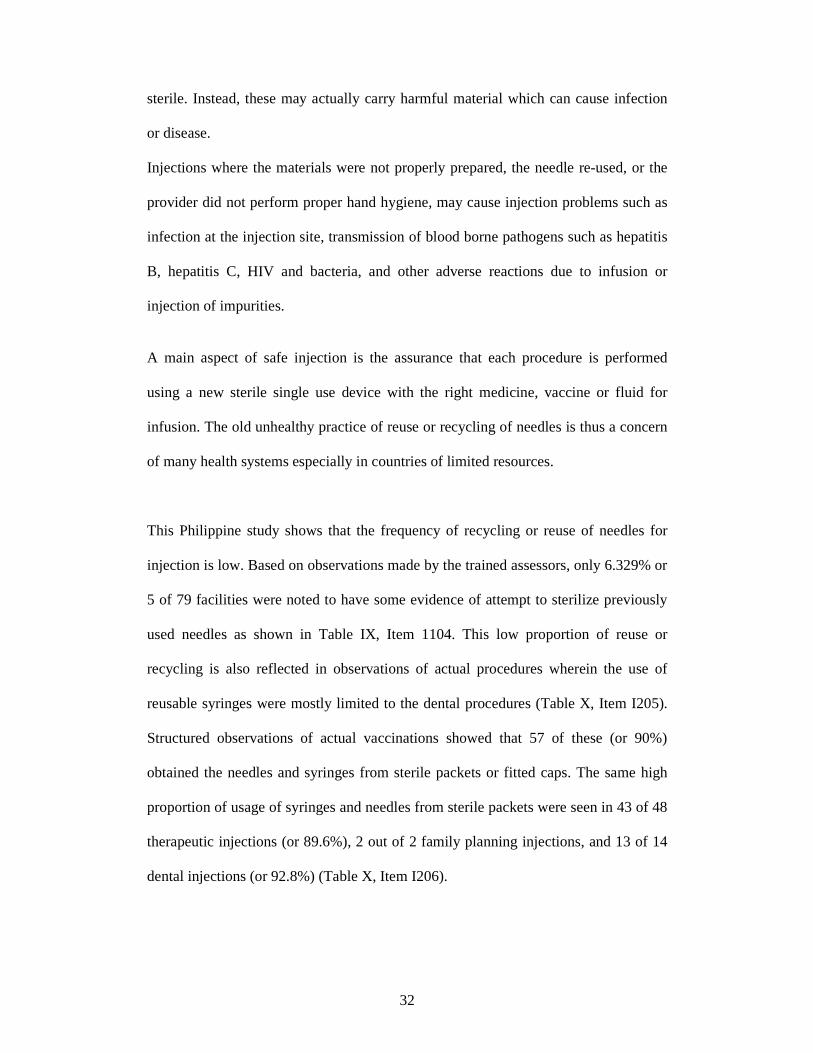
3. Specific Injection Procedures Observed in the Facilities
The project team exhausted all efforts to document as many types of injections and
other related procedure as were present in each of the health facilities during the visit.
While multiple procedures of the same type may have been observed during the same
visit, for instance 2 intravenous insertions, only one was entered into the data
collection forms and condensed observations such as the “worst” practice was the one
noted.
A total of 125 injections were observed in the 80 facilities. These injections included:
60 vaccinations, 48 therapeutic injections, 2 family planning and 15 dental injections.
Vaccination injections observed in this study included all the childhood immunization
(DPT, MMR), pediatric and adult hepatitis immunization, and tetanus. Therapeutic
injections included intramuscular antibiotic injections such as streptomycin, penicillin
and intramuscular injections for immunoglobulin such as for tetanus.
On the other related procedures, a total of 35 phlebotomies, 30 lancet procedures, 32
intravenous injections and 40 intravenous infusions were observed, Phlebotomy
procedures were mostly observed at the designated collection areas in the facility
laboratories. The intravenous injections and infusions were documented mainly in the
emergency rooms and the ward areas.
The table below summarizes the list of the different injection-related procedures
observed in this study:
31
Table VIII. Distribution of injection and injection related procedures observed. Procedure Number Injection Vaccination Therapeutic injection Dental injections Family planning
125 60 48 15 2
Phlebotomy 35 Lancet procedure 30 Intravenous injection 32 Intravenous infusion 40 TOTAL PROCEDURES OBSERVED
262
4. Indicators: From the data collected from various observations and interviews of the 80 health
facilities, indicators reflecting risks of unsafe injection practices can be categorized
into three groups: 1) indicators reflecting risks to patients; 2) indicators reflecting
risks to the health provider; and 3) indicators reflecting risks to the community.
Each indicator for a certain risk posed to the patient, the health provider or the
community is based on at least one item in the assessment survey. Some very
important indicators are based on multiple items and collected by both interview and
observation.
These indicators have been calculated based on the responses during the assessment
survey and summarized in Tables VIII to XXI found in the subsequent paragraphs.
A. Indicators reflecting risks to patients
The greatest risk of unsafe injections may occur to the customer: the patients. Because
of certain unclean and unsafe practices, injections which should be sterile may not be
32
sterile. Instead, these may actually carry harmful material which can cause infection
or disease.
Injections where the materials were not properly prepared, the needle re-used, or the
provider did not perform proper hand hygiene, may cause injection problems such as
infection at the injection site, transmission of blood borne pathogens such as hepatitis
B, hepatitis C, HIV and bacteria, and other adverse reactions due to infusion or
injection of impurities.
A main aspect of safe injection is the assurance that each procedure is performed
using a new sterile single use device with the right medicine, vaccine or fluid for
infusion. The old unhealthy practice of reuse or recycling of needles is thus a concern
of many health systems especially in countries of limited resources.
This Philippine study shows that the frequency of recycling or reuse of needles for
injection is low. Based on observations made by the trained assessors, only 6.329% or
5 of 79 facilities were noted to have some evidence of attempt to sterilize previously
used needles as shown in Table IX, Item 1104. This low proportion of reuse or
recycling is also reflected in observations of actual procedures wherein the use of
reusable syringes were mostly limited to the dental procedures (Table X, Item I205).
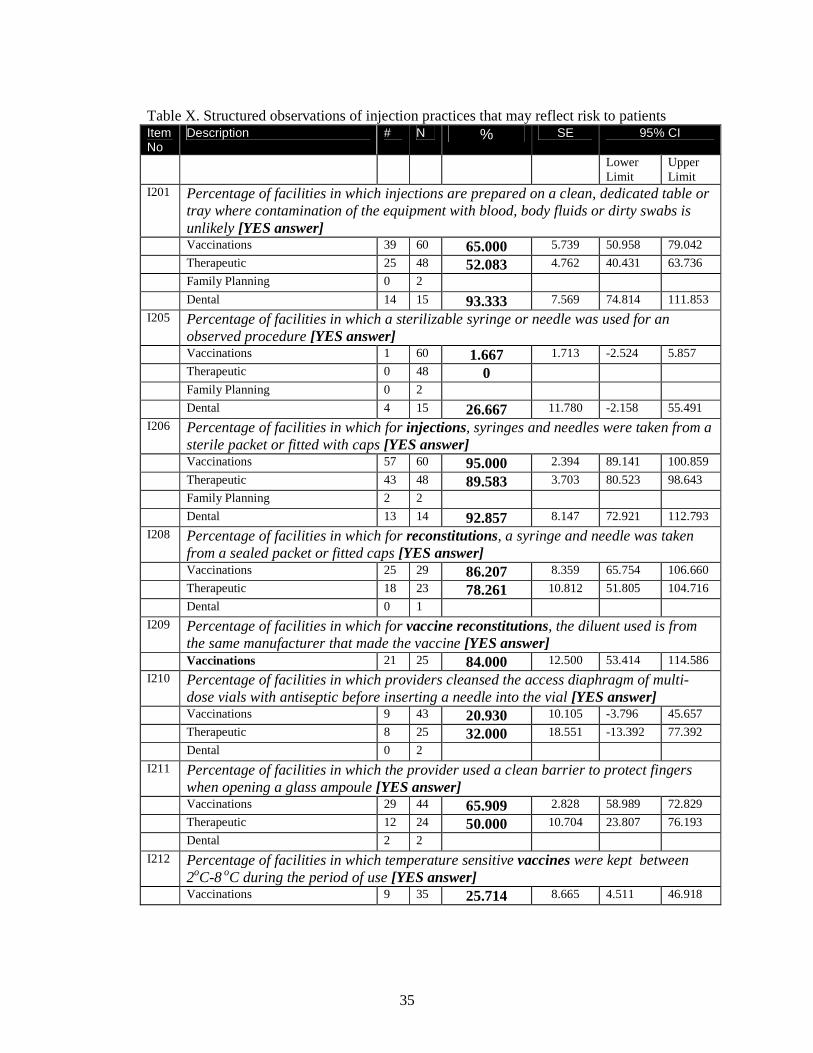
Structured observations of actual vaccinations showed that 57 of these (or 90%)
obtained the needles and syringes from sterile packets or fitted caps. The same high
proportion of usage of syringes and needles from sterile packets were seen in 43 of 48
therapeutic injections (or 89.6%), 2 out of 2 family planning injections, and 13 of 14
dental injections (or 92.8%) (Table X, Item I206).
33
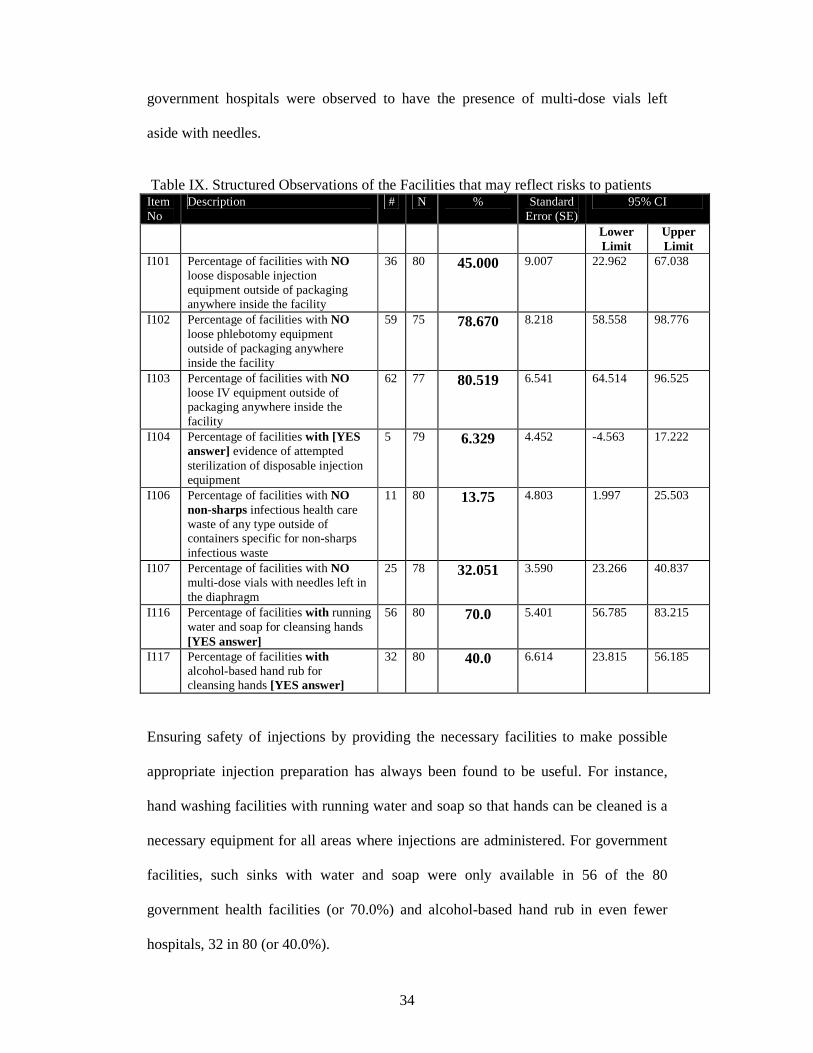
Sterilization of used needles and sterilizable syringes were infrequently encountered
among the facilities visited (Table XII) with steam sterilization seen in 5.1% (95%CI -
2.9, 13.0) of facilities and boiling observed in 16.2% (95%CI 1.51, 30.99). These
were used mostly for dental injection devices.
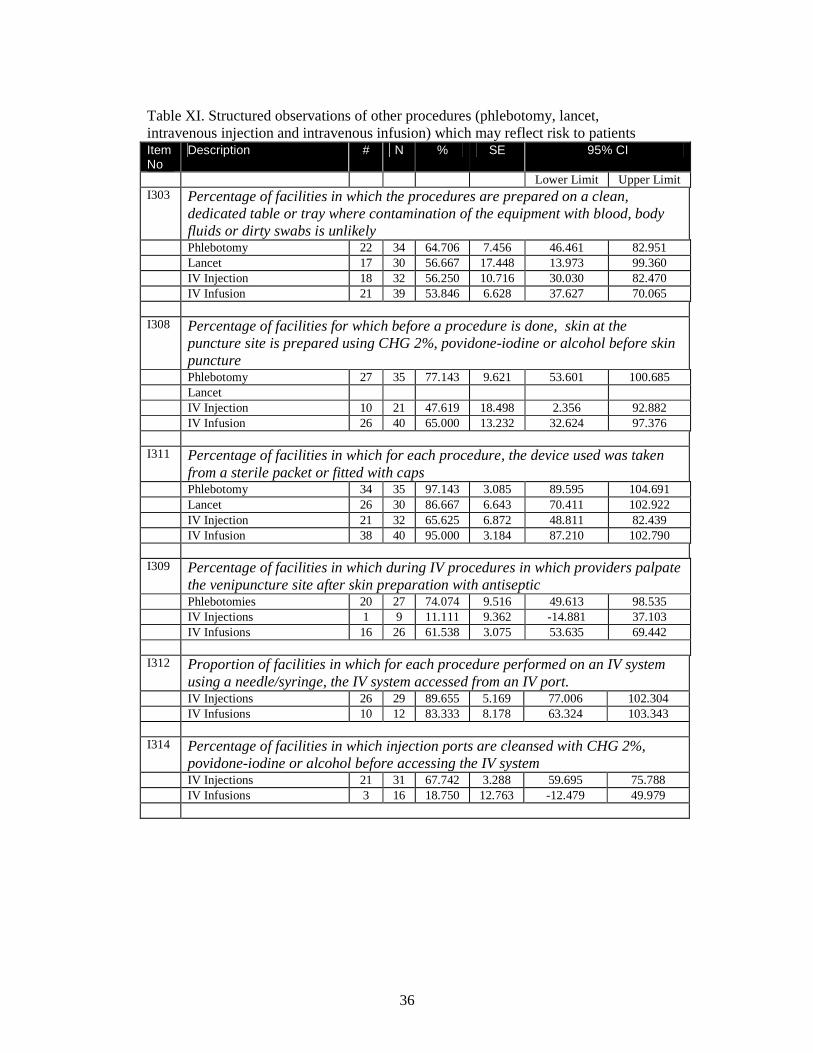
On actual observations of other procedures documented in Table XI, item I311, 34 of
the 35 phlebotomies (or 97.1%). used new needles and syringes which came from
sterile packets or fitted caps, and 38 of 40 intravenous infusions (or 95%). On the
other hand, only 26 of 30 lancet procedures (or 86.7%) made use of new sterile
lancets. And surprisingly, only 21 of 32 intravenous injections (or 65.7%) made use of
syringes and needles from new sterile packets.
When health providers each from their respective institutions were asked, their
responses to the questions related to reuse of needles for injections, phlebotomies and
intravenous infusions affirm the observations made as seen in Table XIII. The
interviewed providers claim to exclusively using single use sterile needle and syringe
for injections (83.7%), for phlebotomies (80%) and for intravenous infusions (80%).
Overall the re-use of needles was low, with over 80% of procedures noted to use new
sterile syringes and needles, lancets and other devices taken from sterile packets or
fitted caps.
What may be more concerning is the continued use of multi-dose vials with needles
left in diaphragms of the vials and reused to aspirate the next dose of medicine for the
next injection. These were mostly seen in the emergency rooms and noted for
medicines such as anesthesia or heparin. In this study, more than two-thirds of the
34
government hospitals were observed to have the presence of multi-dose vials left
aside with needles.
Table IX. Structured Observations of the Facilities that may reflect risks to patients Item No
Description # N % Standard Error (SE)
95% CI
Lower Limit
Upper Limit
I101 Percentage of facilities with NO loose disposable injection equipment outside of packaging anywhere inside the facility
36 80 45.000 9.007 22.962 67.038
I102 Percentage of facilities with NO loose phlebotomy equipment outside of packaging anywhere inside the facility
59 75
78.670 8.218 58.558 98.776
I103
Percentage of facilities with NO loose IV equipment outside of packaging anywhere inside the facility
62 77 80.519 6.541 64.514 96.525
I104 Percentage of facilities with [YES answer] evidence of attempted sterilization of disposable injection equipment
5 79 6.329
4.452 -4.563 17.222
I106 Percentage of facilities with NO non-sharps infectious health care waste of any type outside of containers specific for non-sharps infectious waste
11 80 13.75 4.803 1.997 25.503
I107 Percentage of facilities with NO multi-dose vials with needles left in the diaphragm
25 78 32.051 3.590 23.266 40.837
I116 Percentage of facilities with running water and soap for cleansing hands [YES answer]
56 80 70.0 5.401 56.785 83.215
I117 Percentage of facilities with alcohol-based hand rub for cleansing hands [YES answer]
32 80 40.0 6.614 23.815 56.185
Ensuring safety of injections by providing the necessary facilities to make possible
appropriate injection preparation has always been found to be useful. For instance,
hand washing facilities with running water and soap so that hands can be cleaned is a
necessary equipment for all areas where injections are administered. For government
facilities, such sinks with water and soap were only available in 56 of the 80
government health facilities (or 70.0%) and alcohol-based hand rub in even fewer
hospitals, 32 in 80 (or 40.0%).
35
Table X. Structured observations of injection practices that may reflect risk to patients Item No
Description # N % SE 95% CI
Lower Limit
Upper Limit
I201 Percentage of facilities in which injections are prepared on a clean, dedicated table or tray where contamination of the equipment with blood, body fluids or dirty swabs is unlikely [YES answer]
Vaccinations 39 60 65.000 5.739 50.958 79.042
Therapeutic 25 48 52.083 4.762 40.431 63.736
Family Planning 0 2
Dental 14 15 93.333 7.569 74.814 111.853
I205 Percentage of facilities in which a sterilizable syringe or needle was used for an observed procedure [YES answer]
Vaccinations 1 60 1.667 1.713 -2.524 5.857
Therapeutic 0 48 0
Family Planning 0 2
Dental 4 15 26.667 11.780 -2.158 55.491
I206 Percentage of facilities in which for injections, syringes and needles were taken from a sterile packet or fitted with caps [YES answer]
Vaccinations 57 60 95.000 2.394 89.141 100.859
Therapeutic 43 48 89.583 3.703 80.523 98.643
Family Planning 2 2
Dental 13 14 92.857 8.147 72.921 112.793
I208 Percentage of facilities in which for reconstitutions, a syringe and needle was taken from a sealed packet or fitted caps [YES answer]
Vaccinations 25 29 86.207 8.359 65.754 106.660
Therapeutic 18 23 78.261 10.812 51.805 104.716
Dental 0 1
I209 Percentage of facilities in which for vaccine reconstitutions, the diluent used is from the same manufacturer that made the vaccine [YES answer]
Vaccinations 21 25 84.000 12.500 53.414 114.586
I210 Percentage of facilities in which providers cleansed the access diaphragm of multi-dose vials with antiseptic before inserting a needle into the vial [YES answer]
Vaccinations 9 43 20.930 10.105 -3.796 45.657
Therapeutic 8 25 32.000 18.551 -13.392 77.392
Dental 0 2
I211 Percentage of facilities in which the provider used a clean barrier to protect fingers when opening a glass ampoule [YES answer]
Vaccinations 29 44 65.909 2.828 58.989 72.829
Therapeutic 12 24 50.000 10.704 23.807 76.193
Dental 2 2
I212 Percentage of facilities in which temperature sensitive vaccines were kept between 2oC-8 oC during the period of use [YES answer]
Vaccinations 9 35 25.714 8.665 4.511 46.918
36
Table XI. Structured observations of other procedures (phlebotomy, lancet, intravenous injection and intravenous infusion) which may reflect risk to patients Item No
Description # N % SE 95% CI
Lower Limit Upper Limit I303 Percentage of facilities in which the procedures are prepared on a clean,
dedicated table or tray where contamination of the equipment with blood, body fluids or dirty swabs is unlikely
Phlebotomy 22 34 64.706 7.456 46.461 82.951 Lancet 17 30 56.667 17.448 13.973 99.360 IV Injection 18 32 56.250 10.716 30.030 82.470 IV Infusion 21 39 53.846 6.628 37.627 70.065 I308 Percentage of facilities for which before a procedure is done, skin at the
puncture site is prepared using CHG 2%, povidone-iodine or alcohol before skin puncture
Phlebotomy 27 35 77.143 9.621 53.601 100.685 Lancet IV Injection 10 21 47.619 18.498 2.356 92.882 IV Infusion 26 40 65.000 13.232 32.624 97.376 I311 Percentage of facilities in which for each procedure, the device used was taken
from a sterile packet or fitted with caps Phlebotomy 34 35 97.143 3.085 89.595 104.691 Lancet 26 30 86.667 6.643 70.411 102.922 IV Injection 21 32 65.625 6.872 48.811 82.439 IV Infusion 38 40 95.000 3.184 87.210 102.790 I309 Percentage of facilities in which during IV procedures in which providers palpate
the venipuncture site after skin preparation with antiseptic Phlebotomies 20 27 74.074 9.516 49.613 98.535 IV Injections 1 9 11.111 9.362 -14.881 37.103 IV Infusions 16 26 61.538 3.075 53.635 69.442 I312 Proportion of facilities in which for each procedure performed on an IV system
using a needle/syringe, the IV system accessed from an IV port. IV Injections 26 29 89.655 5.169 77.006 102.304 IV Infusions 10 12 83.333 8.178 63.324 103.343 I314 Percentage of facilities in which injection ports are cleansed with CHG 2%,
povidone-iodine or alcohol before accessing the IV system IV Injections 21 31 67.742 3.288 59.695 75.788 IV Infusions 3 16 18.750 12.763 -12.479 49.979
37
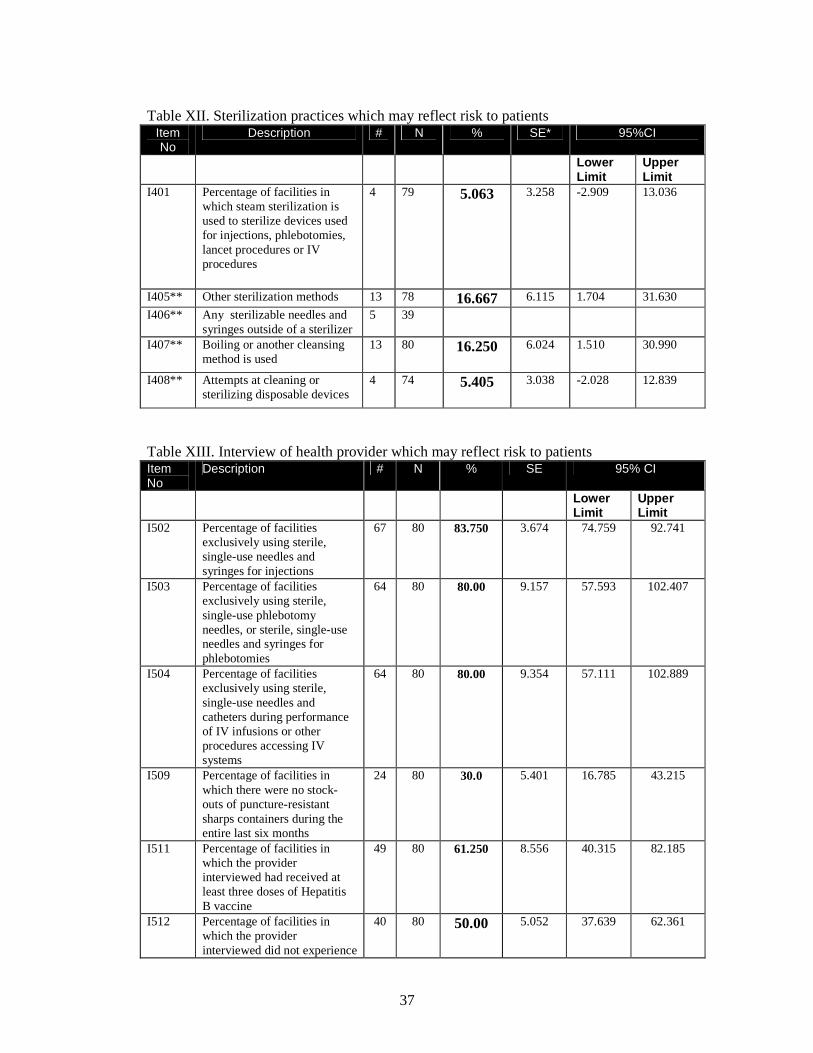
Table XII. Sterilization practices which may reflect risk to patients
Item No
Description # N % SE* 95%CI
Lower Limit
Upper Limit
I401 Percentage of facilities in which steam sterilization is used to sterilize devices used for injections, phlebotomies, lancet procedures or IV procedures
4 79 5.063
3.258 -2.909 13.036
I405** Other sterilization methods 13 78 16.667 6.115 1.704 31.630
I406** Any sterilizable needles and syringes outside of a sterilizer
5 39
I407** Boiling or another cleansing method is used
13 80 16.250
6.024 1.510 30.990
I408** Attempts at cleaning or sterilizing disposable devices
4 74 5.405
3.038 -2.028 12.839
Table XIII. Interview of health provider which may reflect risk to patients Item No
Description # N % SE 95% CI
Lower Limit
Upper Limit
I502 Percentage of facilities exclusively using sterile, single-use needles and syringes for injections
67 80 83.750 3.674 74.759 92.741
I503 Percentage of facilities exclusively using sterile, single-use phlebotomy needles, or sterile, single-use needles and syringes for phlebotomies
64 80 80.00 9.157 57.593 102.407
I504 Percentage of facilities exclusively using sterile, single-use needles and catheters during performance of IV infusions or other procedures accessing IV systems
64 80 80.00 9.354 57.111 102.889
I509 Percentage of facilities in which there were no stock-outs of puncture-resistant sharps containers during the entire last six months
24 80 30.0 5.401 16.785 43.215
I511 Percentage of facilities in which the provider interviewed had received at least three doses of Hepatitis B vaccine
49 80 61.250 8.556 40.315 82.185
I512 Percentage of facilities in which the provider interviewed did not experience
40 80 50.00 5.052 37.639 62.361
38
any needle stick injury in the last six months
I515 Percentage of facilities in which the provider interviewed had injection safety training available to them within the last two years in a lecture or workshop [yes]
21 80 26.250 7.196 8.642 43.858
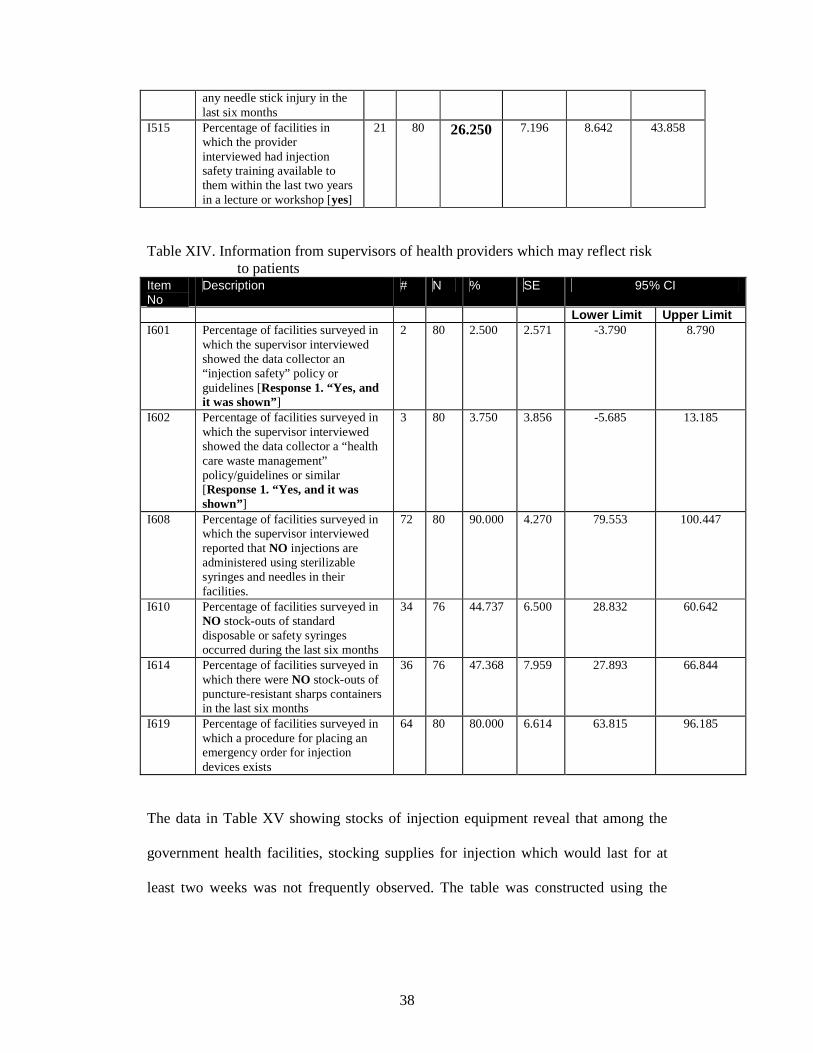
Table XIV. Information from supervisors of health providers which may reflect risk to patients Item No
Description # N % SE 95% CI
Lower Limit Upper Limit I601 Percentage of facilities surveyed in
which the supervisor interviewed showed the data collector an “injection safety” policy or guidelines [Response 1. “Yes, and it was shown”]
2 80 2.500 2.571 -3.790 8.790
I602 Percentage of facilities surveyed in which the supervisor interviewed showed the data collector a “health care waste management” policy/guidelines or similar [Response 1. “Yes, and it was shown”]
3 80 3.750 3.856 -5.685 13.185
I608 Percentage of facilities surveyed in which the supervisor interviewed reported that NO injections are administered using sterilizable syringes and needles in their facilities.
72 80 90.000 4.270 79.553 100.447
I610 Percentage of facilities surveyed in NO stock-outs of standard disposable or safety syringes occurred during the last six months
34 76 44.737 6.500 28.832 60.642
I614 Percentage of facilities surveyed in which there were NO stock-outs of puncture-resistant sharps containers in the last six months
36 76 47.368 7.959 27.893 66.844
I619 Percentage of facilities surveyed in which a procedure for placing an emergency order for injection devices exists
64 80 80.000 6.614 63.815 96.185
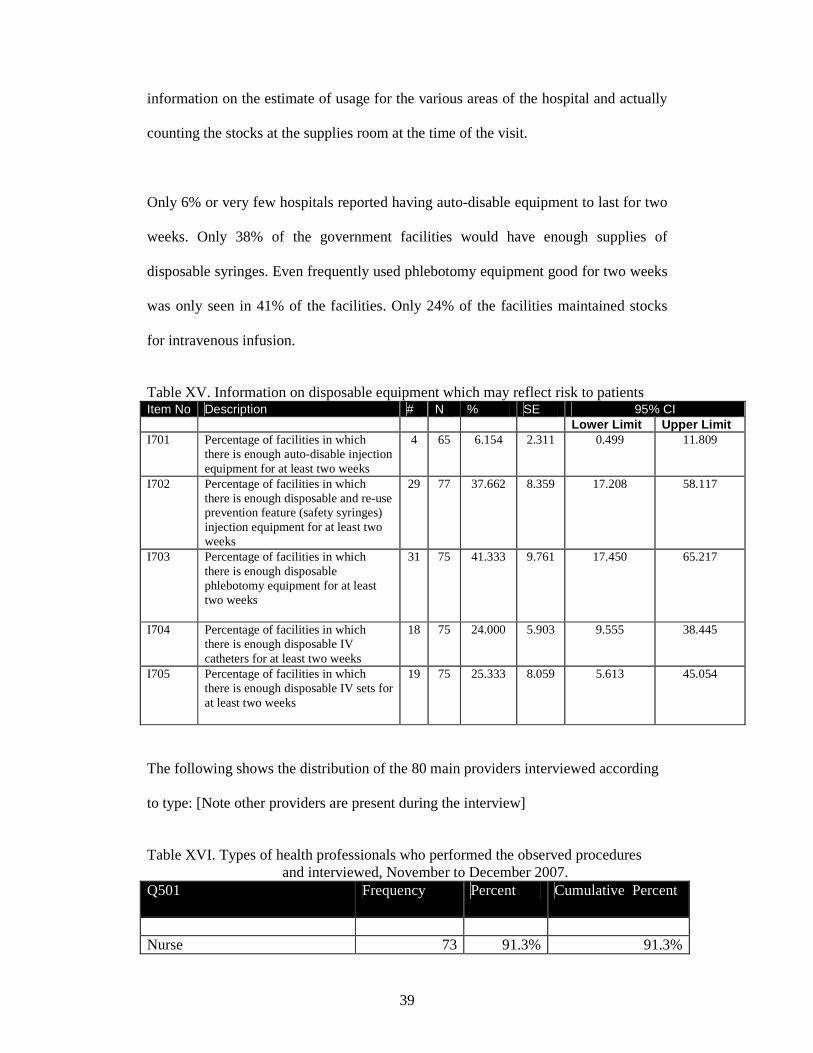
The data in Table XV showing stocks of injection equipment reveal that among the
government health facilities, stocking supplies for injection which would last for at
least two weeks was not frequently observed. The table was constructed using the
39
information on the estimate of usage for the various areas of the hospital and actually
counting the stocks at the supplies room at the time of the visit.
Only 6% or very few hospitals reported having auto-disable equipment to last for two
weeks. Only 38% of the government facilities would have enough supplies of
disposable syringes. Even frequently used phlebotomy equipment good for two weeks
was only seen in 41% of the facilities. Only 24% of the facilities maintained stocks
for intravenous infusion.
Table XV. Information on disposable equipment which may reflect risk to patients Item No Description # N % SE 95% CI Lower Limit Upper Limit I701 Percentage of facilities in which
there is enough auto-disable injection equipment for at least two weeks
4 65 6.154 2.311 0.499 11.809
I702 Percentage of facilities in which there is enough disposable and re-use prevention feature (safety syringes) injection equipment for at least two weeks
29 77 37.662 8.359 17.208 58.117
I703 Percentage of facilities in which there is enough disposable phlebotomy equipment for at least two weeks
31 75 41.333
9.761 17.450
65.217
I704 Percentage of facilities in which there is enough disposable IV catheters for at least two weeks
18 75 24.000 5.903 9.555 38.445
I705 Percentage of facilities in which there is enough disposable IV sets for at least two weeks
19 75 25.333
8.059 5.613 45.054
The following shows the distribution of the 80 main providers interviewed according
to type: [Note other providers are present during the interview]
Table XVI. Types of health professionals who performed the observed procedures and interviewed, November to December 2007. Q501 Frequency Percent Cumulative Percent
Nurse 73 91.3% 91.3%
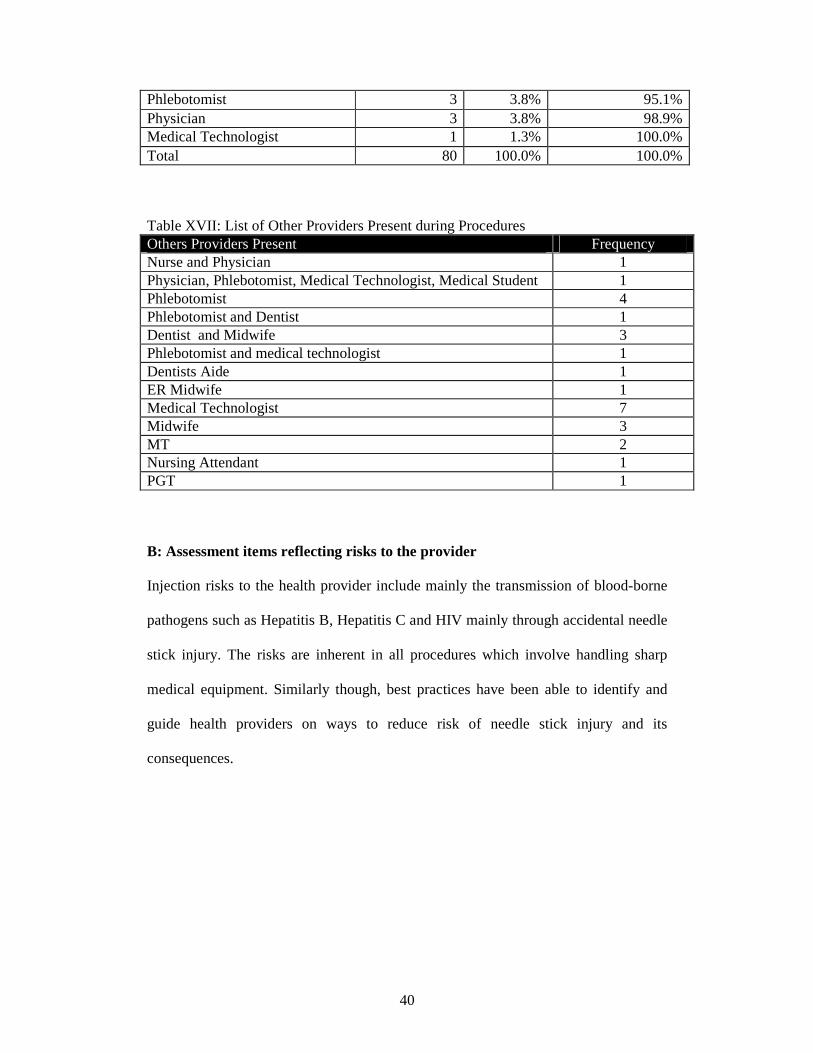
40
Phlebotomist 3 3.8% 95.1% Physician 3 3.8% 98.9% Medical Technologist 1 1.3% 100.0% Total 80 100.0% 100.0% Table XVII: List of Other Providers Present during Procedures Others Providers Present Frequency Nurse and Physician 1 Physician, Phlebotomist, Medical Technologist, Medical Student 1 Phlebotomist 4 Phlebotomist and Dentist 1 Dentist and Midwife 3 Phlebotomist and medical technologist 1 Dentists Aide 1 ER Midwife 1 Medical Technologist 7 Midwife 3 MT 2 Nursing Attendant 1 PGT 1 B: Assessment items reflecting risks to the provider Injection risks to the health provider include mainly the transmission of blood-borne
pathogens such as Hepatitis B, Hepatitis C and HIV mainly through accidental needle
stick injury. The risks are inherent in all procedures which involve handling sharp
medical equipment. Similarly though, best practices have been able to identify and
guide health providers on ways to reduce risk of needle stick injury and its
consequences.
41
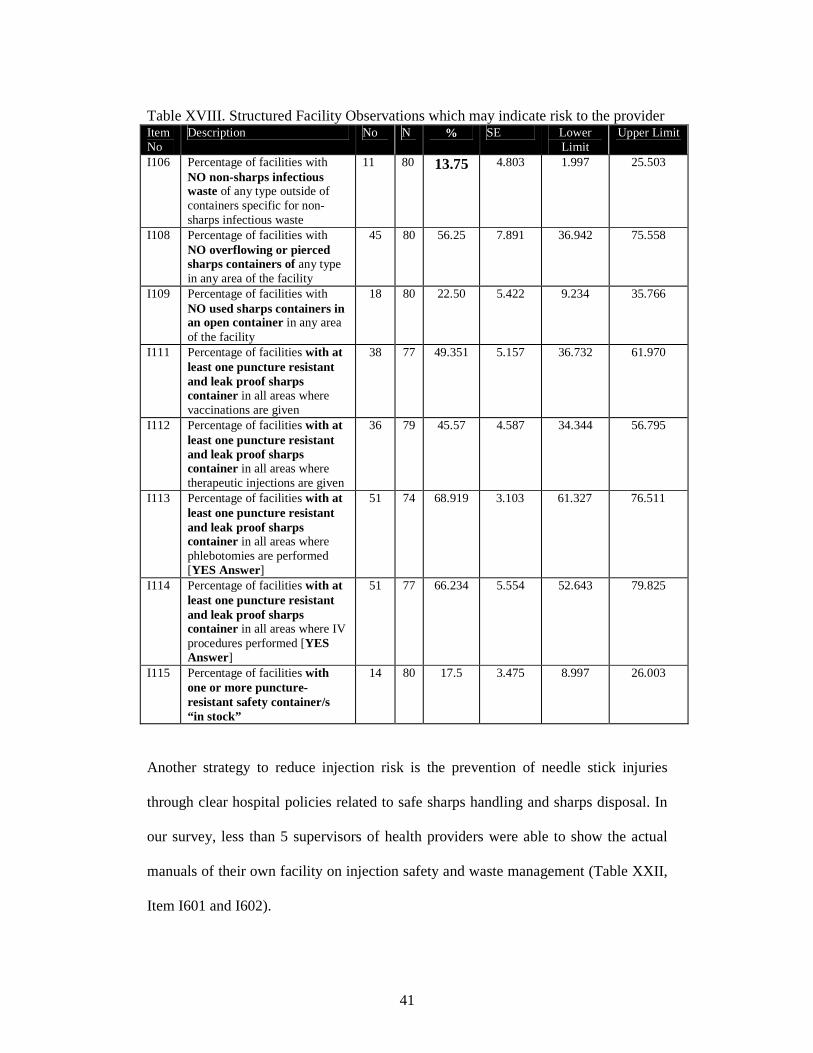
Table XVIII. Structured Facility Observations which may indicate risk to the provider Item No
Description No N % SE Lower Limit
Upper Limit
I106 Percentage of facilities with NO non-sharps infectious waste of any type outside of containers specific for non-sharps infectious waste
11 80 13.75 4.803 1.997 25.503
I108 Percentage of facilities with NO overflowing or pierced sharps containers of any type in any area of the facility
45 80 56.25 7.891 36.942 75.558
I109 Percentage of facilities with NO used sharps containers in an open container in any area of the facility
18 80 22.50 5.422 9.234 35.766
I111 Percentage of facilities with at least one puncture resistant and leak proof sharps container in all areas where vaccinations are given
38 77 49.351 5.157 36.732 61.970
I112 Percentage of facilities with at least one puncture resistant and leak proof sharps container in all areas where therapeutic injections are given
36 79 45.57 4.587 34.344 56.795
I113 Percentage of facilities with at least one puncture resistant and leak proof sharps container in all areas where phlebotomies are performed [YES Answer]
51 74 68.919 3.103 61.327 76.511
I114 Percentage of facilities with at least one puncture resistant and leak proof sharps container in all areas where IV procedures performed [YES Answer]
51 77 66.234 5.554 52.643 79.825
I115 Percentage of facilities with one or more puncture-resistant safety container/s “in stock”
14 80 17.5 3.475 8.997 26.003
Another strategy to reduce injection risk is the prevention of needle stick injuries
through clear hospital policies related to safe sharps handling and sharps disposal. In
our survey, less than 5 supervisors of health providers were able to show the actual
manuals of their own facility on injection safety and waste management (Table XXII,
Item I601 and I602).
42
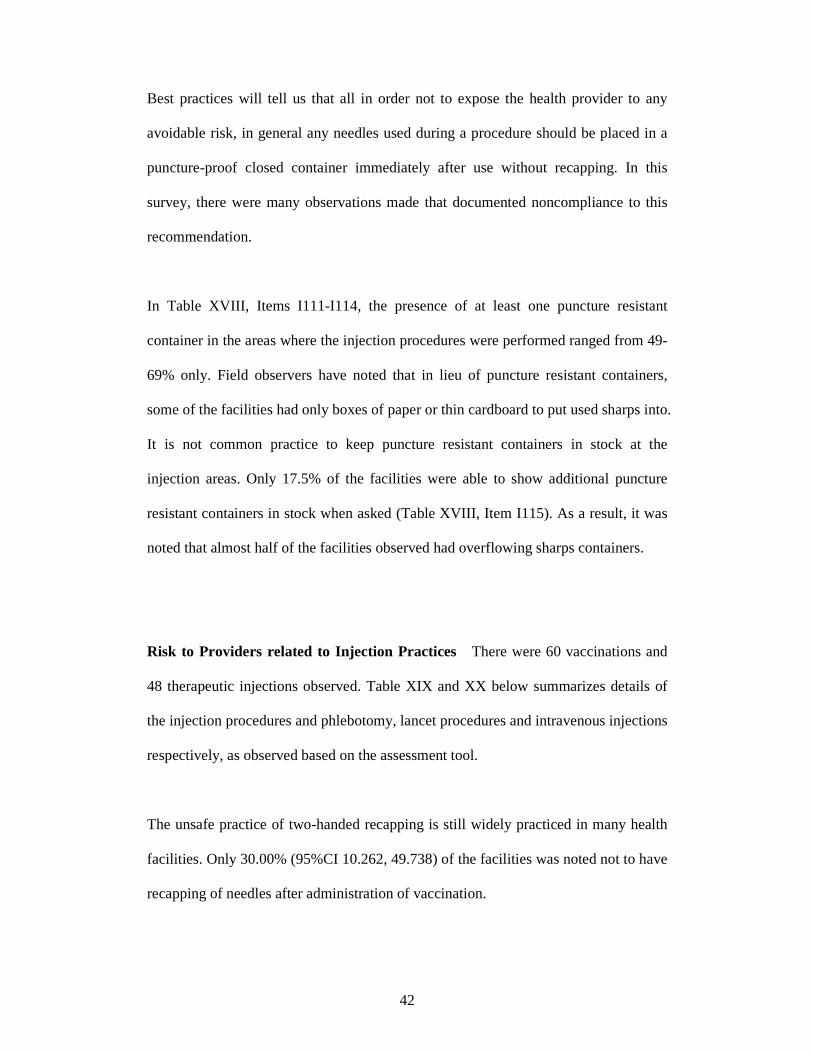
Best practices will tell us that all in order not to expose the health provider to any
avoidable risk, in general any needles used during a procedure should be placed in a
puncture-proof closed container immediately after use without recapping. In this
survey, there were many observations made that documented noncompliance to this
recommendation.
In Table XVIII, Items I111-I114, the presence of at least one puncture resistant
container in the areas where the injection procedures were performed ranged from 49-
69% only. Field observers have noted that in lieu of puncture resistant containers,
some of the facilities had only boxes of paper or thin cardboard to put used sharps into.
It is not common practice to keep puncture resistant containers in stock at the
injection areas. Only 17.5% of the facilities were able to show additional puncture
resistant containers in stock when asked (Table XVIII, Item I115). As a result, it was
noted that almost half of the facilities observed had overflowing sharps containers.
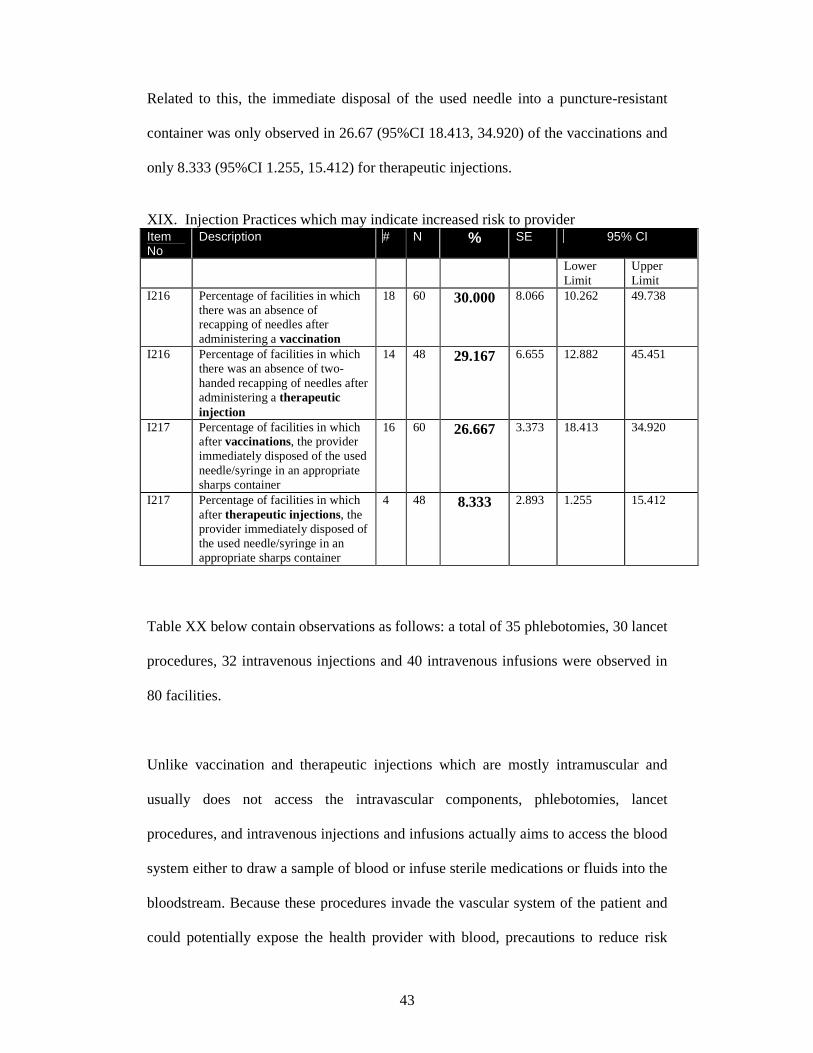
Risk to Providers related to Injection Practices There were 60 vaccinations and
48 therapeutic injections observed. Table XIX and XX below summarizes details of
the injection procedures and phlebotomy, lancet procedures and intravenous injections
respectively, as observed based on the assessment tool.
The unsafe practice of two-handed recapping is still widely practiced in many health
facilities. Only 30.00% (95%CI 10.262, 49.738) of the facilities was noted not to have
recapping of needles after administration of vaccination.
43
Related to this, the immediate disposal of the used needle into a puncture-resistant
container was only observed in 26.67 (95%CI 18.413, 34.920) of the vaccinations and
only 8.333 (95%CI 1.255, 15.412) for therapeutic injections.
XIX. Injection Practices which may indicate increased risk to provider Item No
Description # N % SE 95% CI
Lower Limit
Upper Limit
I216 Percentage of facilities in which there was an absence of recapping of needles after administering a vaccination
18 60 30.000 8.066 10.262 49.738
I216 Percentage of facilities in which there was an absence of two-handed recapping of needles after administering a therapeutic injection
14 48 29.167 6.655 12.882 45.451
I217 Percentage of facilities in which after vaccinations, the provider immediately disposed of the used needle/syringe in an appropriate sharps container
16 60 26.667 3.373 18.413 34.920
I217 Percentage of facilities in which after therapeutic injections, the provider immediately disposed of the used needle/syringe in an appropriate sharps container
4 48 8.333 2.893 1.255 15.412
Table XX below contain observations as follows: a total of 35 phlebotomies, 30 lancet
procedures, 32 intravenous injections and 40 intravenous infusions were observed in
80 facilities.
Unlike vaccination and therapeutic injections which are mostly intramuscular and
usually does not access the intravascular components, phlebotomies, lancet
procedures, and intravenous injections and infusions actually aims to access the blood
system either to draw a sample of blood or infuse sterile medications or fluids into the
bloodstream. Because these procedures invade the vascular system of the patient and
could potentially expose the health provider with blood, precautions to reduce risk
44
from such anticipated exposures should be in place. These include use of clean gloves
during the procedure, properly securing the arm of the patient to reduce risk for
injury, not recapping nor removing uncapped needles as well as transferring blood
from one container to another, and prompt and proper disposal of the sharp and non
sharp infectious waste soon after the procedure.
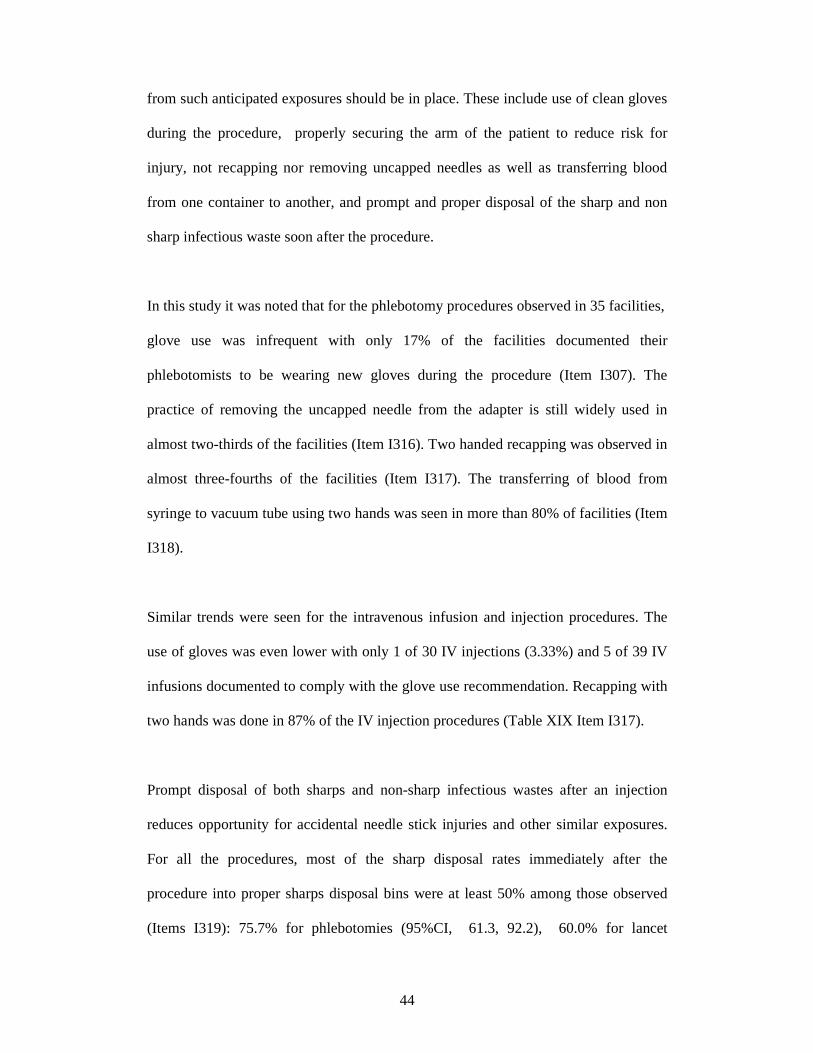
In this study it was noted that for the phlebotomy procedures observed in 35 facilities,
glove use was infrequent with only 17% of the facilities documented their
phlebotomists to be wearing new gloves during the procedure (Item I307). The
practice of removing the uncapped needle from the adapter is still widely used in
almost two-thirds of the facilities (Item I316). Two handed recapping was observed in
almost three-fourths of the facilities (Item I317). The transferring of blood from
syringe to vacuum tube using two hands was seen in more than 80% of facilities (Item
I318).
Similar trends were seen for the intravenous infusion and injection procedures. The
use of gloves was even lower with only 1 of 30 IV injections (3.33%) and 5 of 39 IV
infusions documented to comply with the glove use recommendation. Recapping with
two hands was done in 87% of the IV injection procedures (Table XIX Item I317).
Prompt disposal of both sharps and non-sharp infectious wastes after an injection
reduces opportunity for accidental needle stick injuries and other similar exposures.
For all the procedures, most of the sharp disposal rates immediately after the
procedure into proper sharps disposal bins were at least 50% among those observed
(Items I319): 75.7% for phlebotomies (95%CI, 61.3, 92.2), 60.0% for lancet
45
procedures (95%CI 45.7, 74.3), 50.0% for IV injections (95%CI 25.2, 74.8), and
82.1% for IV infusions (95%CI 66.8, 97.3).
Table XX. Structured observations of other procedures which may reflect risk to provider Item No
Description # N % SE 95% CI
Lower Limit
Upper Limit
Phlebotomies I306
Percentage of facilities surveyed in which providers appropriately secured the patient and the intended puncture site so that the patient could not move during the procedure
34 35 97.143 3.085 89.595 104.691
I307 Percentage of facilities surveyed which phlebotomists wear a new pair of gloves for a phlebotomy
6 35 17.143 5.642 3.338 30.948
I316 Did the provider remove an uncapped needle from any device using only her/his hands? Percentage of facilities in which uncapped needles were NOT removed from phlebotomy holder/adapters using only hands
12 32 37.500 11.131 10.263 64.737
I317 Percentage of facilities surveyed in which NO two-handed recapping of any needles after performing phlebotomies occurred
9 34 26.471 5.414 13.222 39.719
I318 Percentage of facilities in which blood was NOT transferred from a syringe/needle directly into a vacuum tube using a two-handed techniques
5 27 18.519 7.811 -0.594 37.631
I319 Percentage of facilities surveyed in which, immediately after the procedure, the provider disposed of sharps in an appropriate sharps container
25 33 75.758 6.320 60.293 91.222
I320 Percentage of facilities in which immediately after the procedure, the provider disposed of non-sharps infectious waste in a container specific for non-sharps infectious waste
17 34 50.00 7.450 31.770 68.230
Lancet Procedures I306 Percentage of facilities surveyed
in which providers appropriately secured the patient and the intended puncture site so that the patient could not move during
26 30 86.667 8.473 65.935 107.399
46
the procedure I319 Percentage of facilities surveyed
in which, immediately after the procedure, the provider disposed of sharps in an appropriate sharps container
18 30 60.00 5.850 45.686 74.314
I320 Percentage of facilities in which immediately after the procedure, the provider disposed of non-sharps infectious waste in a container specific for non-sharps infectious waste
16 30 53.333 8.161 33.364 73.302
Intravenous Injections and Infusions 1306 Percentage of facilities surveyed
in which providers appropriately secured the patient and the intended puncture site so that the patient could not move during the IV injection
29 32 90.625 4.943 78.530 102.720
1306 Percentage of facilities surveyed in which providers appropriately secured the patient and the intended puncture site so that the patient could not move during the IV infusion
36 40 90.00 7.522 71.594 108.406
1307 Percentage of facilities surveyed which provider wore a new pair of gloves for an IV injection
1 30 3.333 3.317 -4.784 11.450
1307 Percentage of facilities surveyed which the provider wore a new pair of gloves for an IV infusion
5 39 12.821 5.976 -1.803 27.444
I317 Percentage of facilities surveyed in which NO two-handed recapping of any needles after performing IV injections occurred
4 32 12.500 7.780 -6.537 31.537
I319 Percentage of facilities surveyed in which, immediately after the IV injection , the provider disposed of sharps in an appropriate sharps container
16 32 50.00 10.126 25.222 74.778
I319 Percentage of facilities surveyed in which, immediately after the IV infusion , the provider disposed of sharps in an appropriate sharps container
32 39 82.051 6.224 66.821 97.281
I320 Percentage of facilities in which immediately after the IV Injection procedure, the provider disposed of non-sharps infectious waste in a container specific for non-sharps infectious waste
14 32 43.750 8.061 24.026 63.474
I320 Percentage of facilities in which immediately after the IV infusion procedure, the provider disposed of non-sharps infectious waste in a container specific for non-sharps infectious waste
20 38 52.632 9.390 29.654 75.609
47
Immunization of health care workers against Hepatitis B is an excellent way to
prevent acquiring the infection. Hepatitis B should be given for three doses. For
healthcare workers, it is recommended to antibody levels of the anti-Hepatitis B s
antibody at least 28 days after the third dose of the vaccine series to have the
assurance of protection.
In the Philippines, several training institutions have made it mandatory to have
Hepatitis B immunization during medical or nursing school and prior to employment.
There are no existing national policies related to this.
The data in Table XXI shows that among the interviewed health providers giving the
injections, only 61.2% had received three or more doses of the Hepatitis B vaccine
(Item I510). Only 77.5 % of the interviewed has received at least one dose of the
vaccine (Item I511).
Other important information from this table is the high frequency of needle stick
injury that 50% of the interviewed providers admitted to (Item I512). It is also
important to take note that not all needle stick injuries were reported (Item I513) with
only 10 out of the 38 providers. Only in about one-fourth of the facilities did the
providers recall having attended an injection safety training lecture or workshop in the
last two years (Item I515).
The presence of manuals for waste management and injection safety program is not
immediately available in the facilities visited. Only 2 of the 80 facilities were able to
present written copy of the injection safety guideline when the supervisor was asked
48
(Item I601). Only 2 of the 80 facilities (Item I602) were able to show a waste
management guideline.
Table XXI. Information from health providers and their supervisors which may reflect risk to providers Interview with Providers Item No
Description # N % SE 95% CI
Lower Limit
Upper Limit
I509 Percentage of facilities surveyed in which NO stock-outs of puncture resistant sharps containers during the entire last six months
24 80 30.0 5.401 16.785 43.215
I510 Percentage of facilities surveyed in which providers have had at least one Hepatitis B vaccination
62 80 77.500 3.849 68.083 86.917
I511 Percentage of facilities surveyed in which providers have had 3 or more doses of Hepatitis B vaccination
49 80 61.250 8.556 40.315 82.185
I512 Percentage of facilities surveyed in which providers have had NO needle stick or sharps injuries in the last six months
40 80 50.00 5.052 37.639 62.361
I513 No. of Providers who reported the sustained needle stick injury
10 38 10 in 38 injuries reported the injury
I514 Percentage of facilities surveyed in which providers that reported sharps were asked whether they already had had three Hepatitis B vaccinations
7 10 7 in 10 reports of injuries, Hep B vaccination was asked
I515
Percentage of facilities in which the provider interviewed had injection safety training available to them within the last two years in a lecture or workshop [yes]
21 80 26.250 7.196 8.642 43.858
Interview of Supervisors of Providers
I601 Percentage of facilities surveyed in which the supervisor interviewed showed the data collector an “injection safety” policy or guidelines
2 80 2.500 2.571 -3.790 8.790
I602 Percentage of facilities surveyed in which the supervisor interviewed showed the data collector a “health care waste management” policy/guidelines or similar
3 80 3.750 3.856 -5.685 13.185
49
I614 Percentage of facilities surveyed in which there were NO stock-outs of puncture-resistant sharps containers in the last six months
36 76 47.368 7.959 27.893 66.844
I618 Percentage of facilities surveyed in which staff that handle health care waste have access to ‘heavy gloves
31 80 38.750 10.793 12.340 65.160
I618 Percentage of facilities surveyed in which there were NO needle stick/sharps injuries in the previous 6 months for staff that handle health care waste
41 80 51.250 9.148 28.866 73.634
C. Assessment items reflecting risk to the community
Some of the items in the questionnaire reflect risk to the general public. These mainly
involve the assurance that sharps and all other non-sharp but infectious wastes from
injection procedures are managed appropriately and should not become an
unnecessary hazard any person inside and outside the health facilities. These wastes
must be managed according to local and international health and environmental
standards.
Table XXII summarizes these indicators suggesting risk to the community.
Table XXII. Structured facility observations which suggest risk to the community Section 1. Facility Observations Item No Description N N % SE 95% CI Lower
Limit Upper Limit
I106 Percentage of facilities with NO non-sharps infectious waste of any type outside of containers specific for non-sharps infectious waste
11 80 13.75 4.803 1.997 25.503
I108 Percentage of facilities with NO overflowing or pierced sharps containers of any type in any area of the facility
45 80 56.25 7.891 36.942 75.558
I109 Percentage of facilities with NO used sharps containers in an open container in any area of the facility
18 80 22.50 5.422 9.234 35.766
I110 Percentage of facilities in 21 80 26.25 5.673 12.368 40.132
50
which there were separate waste containers for infectious non-sharps waste in each injection area
I120 Percentage of facilities in which all sharps containers awaiting final destruction were completely closed
42 80 52.50 8.337 32.101 72.899
I121 Percentage of facilities in which all sharps containers awaiting final destruction are stored in a locked area or otherwise stored safely away from public access
46 80 57.500 4.797 45.761 69.239
I122 Percentage of facilities in which there were NO used sharps on the ground or immediately outside the health facility and/or around the disposal site
72 80 90.00 3.819 80.656 99.344
I115 Percentage of facilities in which there was one or more puncture-resistant safety containers “in stock”
14 80 17.5 3.475 8.997 26.003
I123 Percentage of facilities in which the final disposal for sharps waste generated by the facility was by closed burning in a medium or high temperature incinerator/furnace, dumping in a secure pit or transport off-site for treatment
57 80 71.25 15.12 34.253 108.247
3-Medium or HighTemp Incinerator/Furnace
0 80
6-Dumping in a protected (secure) pit (including needle pit)
28 80
9-Transportation for off site treatment
36 80
Other Types Type Number 2-Open burning in a hole or in enclosure
6
5-Burial 34 7-Dumping;unprotected 3 Others Collected (Infectious Waste Management)
4
Landfill Collected 1 Interview of the provider I515 Percentage of facilities in
which the provider interviewed had injection safety training available to them within the last two years in a lecture
21 80 26.250 7.196 8.642 43.858
51
V. ANALYSIS AND DISCUSSION: This is the first formal assessment to determine the country situation of the safety of
injections, phlebotomies, lancet procedures and intravenous procedures among
government health facilities. The results reported above reflect many areas of
compliance to the international best injection practices as defined by the World Health
Organization. On the other hand, this assessment report has likewise documented
various practices in the Philippines which do not meet standard and require necessary
action and improvement from individual practitioners, facilities and the national
government to reduce risks of unsafe injections not only to patients but also to the
health providers and the community in general.
Best practices in injection safety specifically tell us that in order not to harm the
patients, each procedure should be administered with a new sterile single-use device,
using the right medication, vaccine or fluid for infusion.2 Similarly a new sterile
single use device must be used for each reconstitution of each unit of medication. In
many countries, this has become easily implementable because of the low
international retail cost of the needle-syringe set available. A disposable hypodermic
2ml syringe with needle cost only 3 US cents each while 0.5ml auto-disable syringes
cost 6 US cents.3
Unfortunately the low cost of injection equipment has been applicable in the
Philippines. Until about two decades ago the practice of sterilizing for re-use both
sterilizable and disposable needles and syringes was widely done in almost all
government facilities in the Philippines to save on public hospital resources. Over the
years, re-use of needles and syringes has been slowly but steadily being phased out.
52
Surprisingly, current day practice reflected in the results of the survey undertaken
show that re-use of needles and syringes is actually low. It suggests that despite the
relatively high unit cost of injection equipment, the understanding of the need for new
sterile single use devices and perhaps the awareness of the risk of re-using needles is
already widespread, and thus supply of new syringes and needles has become a
priority.
Sterile single use injection devices available in the international market include:
sterile hypodermic syringes with needles, auto-disable syringes for immunization,
syringes with a reuse prevention feature, and syringes with needle stick prevention
features. In this study, we have documented the availability only of sterile disposable
hypodermic syringes with needles in the government facilities. Auto-disable syringes
were seen only in rural health units giving immunization and the study team was told
that these auto-disable syringes were supplied by the UNICEF. Other types of
syringes with safety and needle stick prevention features are not yet available in the
government facilities.
Assistance from a global health agency such as the World Health Organization in
bringing down the cost of injection devices will allow facilities to be able to have
enough supplies and stock for needs over a longer period of time.
While reuse of needles and syringes does not seem to be a major problem in the
Philippine government health facilities, the availability and accessibility to safety,
puncture resistant containers for prompt disposal of sharps after the procedure is the
more pressing area of concern, posing definite risks to health providers and the
53
community. The data shows that many facilities across the country are lacking with
supplies of a puncture-resistant container to allow prompt disposal of the sharp
injection device after use. While innovations and resourcefulness are allowed even by
the WHO, these safety disposal devices must still comply with the general
requirements of being puncture resistant. Paper, cardboard, light plastic bottles used
for drinking water do not suffice. Visit to barangay health centers would show that
through the UNICEF, these centers are also supplied with the disposal boxes which
are manufactured by a local distributor.
Other areas to improve the level of injection safety are clearly possible and feasible.
One main area is improvement of infection control practices during performance of
injection procedures including hand hygiene, preparation of medications or vaccine,
use of gloves, disinfection of the site of injection, phlebotomy or intravenous insertion.
The study shows low compliance to best practices of procedures. Avoidable risks for
needle stick injury are easily observed in many facilities such as recapping, holding
needles with bare hands, transferring blood. The widespread use of multidose vials
with needles sticking onto the diaphragms for unknown periods of time can be easily
be changed with training.
Based on the answers of providers and their supervisors, as well as during the
feedback workshops, training on injection safety to increase awareness and improve
injection practices have been infrequent in the past. Information dissemination
through training workshops on an institutional level, provincial, regional or even
national level could be planned and coordinated between the WHO, the DOH and the
PHICS. The value of occupational health and feasible arrangements for 100%
54
coverage of hepatitis B immunization of health providers are immediate pressing
concerns that could be also addressed.
The difficulty of almost all the facilities to show a manual on existing policies for
injection safety and waste management is also revealing. It suggests a revisit of the
national policies, implementing rules and regulations on injection safety and waste
management and how the government can assist its public health facilities be aware
and comply with the national and local standards and regulations. It may also herald
an invitation for the development of guidelines and local “best practices” from the
professional societies of infectious diseases and infection control to guide practicing
health professionals to observe safer injection practices.
VI . CONCLUSIONS
The nationwide assessment of the safety of injections, phlebotomies, lancet
procedures and intravenous injections and infusions using 80 randomly selected
government health facilities by two-stage sampling to represent the government
facilities of the Philippines has been completed. The most important findings are as
follows:
1) The frequency of re-use of needles and evidence for attempts to sterilize used
needles was low (less than 16%). This is also supported by the actual observations
that injection devices were obtained by opening new sterile packets of new syringes
and needles during the various procedures observed, seen in 80% or more of the
procedures;
55
2) High frequency of noncompliance to best injection safety practices are widespread
in the government facilities including hand hygiene before injection procedure,
preparing the injection medication, vaccine or fluid in an adequately clean place,
proper disinfection of skin site, use of gloves in procedures that invade the vascular
system, palpation of the skin site after disinfection, and use of multidose vials with
needles left neglected onto the diaphragms;
3) High frequency of high risk practices prone to needle stick injuries such as
removing the uncapped needle from the adapter widely used in almost two-thirds of
the facilities, two handed recapping was observed in almost three-fourths of the
facilities, and the transferring of blood from syringe to vacuum tube using two hands
was seen in more than 80% of facilities;
4) Many facilities lacked adequate sharp disposal systems with only 49-69% of health
facilities documented to have at least one through a puncture-resistant container in
designated areas where procedures were routinely performed for prompt and safe
disposal immediately after each procedure. Only 17.5% of the facilities had additional
puncture resistant containers in stock when asked and in more than half of the
facilities were overflowing sharps containers seen;
5) Incomplete protection for hepatitis B through vaccination of health care providers
with only 61.2% admitting to having had received three or more doses of the Hepatitis
B vaccine, and 77.5% at least one dose of the vaccine; 50% of health providers
admitting to high frequency of needle stick injuries that not all needle stick injuries
were reported with only 10 out of the 38 providers reporting; and only in about one-
fourth of the facilities did the providers recall having attended an injection safety
training lecture or workshop in the last two years;
56
6) Almost all facilities were unable to show a manual of injection safety or a manual
of waste management.
Other important information derived from the study beyond the scope of the WHO
assessment tool C-revised are the following:1) The cost of injection devices in
Philippines is higher than that reported in international retail and this cost is
transferred to the patients whenever the health facilities are unable to meet the supply-
demand requirements; 2) Health facilities welcome training and information related to
injection safety and health waste management.; 3) Introduction of technology-driven
advances in injection devices with safety features is an area that should be explored.
The critical components that would greatly improve the current situation of injection
safety in the Philippine government health facilities would include: 1) Leadership and
guidance from the Department of Health to define national standards and set and
implement applicable regulations; 2) Access to affordable safe injection devices,
preferably with safety features; 3) Continuing training and information dissemination
on best practices; 3) Support of the healthcare workforce through Hepatitis B
immunization and provision of protective equipment (gloves, hand hygiene facilities).
VII. RECOMMENDATIONS .
Based on the study findings, it is recommended that the Philippine national program
for injection safety be strengthened with the strategies addressing the areas that were
identified in this study as areas of concern:
57
• Training on infection control on safer injections including hand hygiene, single use
devices, proper use of multidose vials, preparation of injection medication, use of
gloves as needed and proper disposal of sharps and non sharps waste after injection
procedure
• Increase awareness through training on risk reduction of needle stick injury by not
recapping
• Availability of supplies of injection devices particularly recent advances in
technology of syringes allowing auto-disable and other safety devices.
• Reducing retail cost of injection devices on a country level
• Availability of supplies for puncture-resistant disposal containers in all areas within
all facilities performing injection procedures
• Increase coverage of protection of health providers by hepatitis B immunization
• Strengthening implementing rules and regulations on proper waste management and
injection safety at local and national level to comply with international standards
58
VIII. REFERENCES: 1. Hutin YFJ, Hauri AM, Armstrong GL. Use of injections in the healthcare setting worldwide 2000. Literature review and regional estimates. BMJ 2003; 327: 1075-8. 2. Best infection control practices for skin-piercing, intradermal, subcutaneous and intramuscular needle injections. WHO/BCT/DCT 01.02 3. Guiding Principles to Ensure Injection Device Security. WHO/BCT/ 03.12 4. http://www.census.gov/ipc/www/idbpyr.html 5. Department of Health, National Objectives for Health: Philippines 2005-2010. DOH Manila 2005.
6. http://www.cia.gov/cia/publications/factbook/index.html
7. http://www.measuredhs.com/data/indicators
8. http://www. WHO Safe syringes for injection safety.htm