Embed Size (px)
Citation preview
ASSESSMENT ON THE PERFORMANCE OF THE ENHANCED
DISPLACEMENT VENTILATION SYSTEM IN THE TROPICS
BY
LI QIAOYAN
(B.Eng, USTB)
A THESIS SUBMITTED
FOR THE DEGREE OF MASTER OF SCIENCE (BUILDING)
DEPARTMENT OF BUILDING
NATIONAL UNIVERSITY OF SINGAPORE
2010
i
ACKNOWLEDGEMENTS
I wish to express my deepest gratitude to the following persons without whom, this
dissertation would not be possible.
Associate Professor Cheong Kok Wai David, my supervisor for his support,
invaluable advice, supervision and guidance throughout the course of the study.
The generous financial support from National University of Singapore (NUS) for the
Research Project, R-296-000-107-112.
Mr. Sun Weimeng, the research graduate for the research project, for his willingness
in providing guidance, assistance ad advice throughout the dissertation period.
Xiangjing, and Xuchao, for sharing their own research experience, giving invaluable
advices, offering their support and encouragement.
Lab technician Mr. Tan Cheow Beng for his help to provide the necessary equipment
and instruments needed to make this dissertation possible.
Hui Ting and Ronald, for their assistance in the subjective study.
And to those who have helped and contributed in one way or another towards the
completion of this dissertation.
ii
TABLE OF CONTENTS
ACKNOWLEDGEMENT............................................................................................i
TABLE OF CONTENTS.............................................................................................ii
SUMMARY..................................................................................................................iv
LIST OF TABLES........................................................................................................vi
LIST OF FIGURES................................................................................................ ...vii
ABBREVIATIONS..................................................................................................... .x
CHAPTER 1 INTRODUCTION ................................................................................. 1
1.1 Background ..................................................................................................... 1
1.2 Research objectives ......................................................................................... 4
1.3 Scope of the study ........................................................................................... 5
1.4 Organization of thesis ...................................................................................... 5
CHAPTER 2 LITERATURE REVIEW ...................................................................... 7
2.1 Introduction ..................................................................................................... 7
2.2 Gradients in occupied space ............................................................................ 8
2.3 Thermal comfort ............................................................................................ 14
2.4 Human perception study on draught risk ....................................................... 22
2.5 Thermal sensation versus draught perception ................................................ 25
2.6 Implication of personal control ...................................................................... 27
2.7 Identification of knowledge gap .................................................................... 28
CHAPTER 3 RESEARCH METHODOLOGY ........................................................ 31
3.1 Enhanced displacement ventilation system ................................................... 31
3.2 Research hypothesis ...................................................................................... 32
3.3 Research design ............................................................................................. 33
3.4 Experimental set-up ....................................................................................... 34
3.5 Questionnaire................................................................................................. 47
3.6 Subjects ......................................................................................................... 50
3.7 Method of data collection .............................................................................. 52
iii
3.8 Method of data analysis ................................................................................. 54
CHAPTER 4 DATA ANALYSIS AND DISCUSSION ........................................... 55
4.1 4-fan system study ......................................................................................... 55
4.2 2-fan system study ......................................................................................... 61
4.3 Pollutant transportation study ........................................................................ 73
CHAPTER 5 CONCLUSIONS.................................................................................. 76
5.1 Review and achievement of research objectives ........................................... 76
5.2 Verification of the hypotheses ....................................................................... 79
5.3 Limitations..................................................................................................... 80
5.4 Recommendations for future work ................................................................ 81
BIBLIOGRAPHY ...................................................................................................... 83
APPENDICES .......................................................................................................... A-1
APPENDIX A Regression equations of Teq of body segments of thermal
manikin ...................................................................................................................... A-1
APPENDIX B Questionnaire ............................................................................ B-1
APPENDIX C List of publications.................................................................... C-1
iv
SUMMARY
Displacement Ventilation (DV) system is used to improve the thermal comfort and
Indoor Air Quality (IAQ) in buildings in an energy-efficient manner. However, in an
office environment served by DV system with low floor to ceiling height and heat
load, the temperature stratification is found to be less significant as compared to
large spaces with high floor to ceiling height and heat load. The thermal comfort of
occupants in small spaces served by DV system is also less acceptable. In view of
these limitations of the conventional DV system, an enhanced 4-fan DV system was
developed and evaluated by Sun (2010). It is found that the 4-fan system has
significantly improved the thermal microenvironment around occupants as compared
to the conventional DV system. However, the draught risk and energy consumption
issues have become a problem with the 4-fan system. Hence, a 2-fan enhanced DV
system is developed in this study to overcome these problems.
Experiments were carried out in a mock-up office at the National University of
Singapore. Both objective measurements and subjective assessments were conducted
to investigate the vertical temperature profiles, thermal comfort, thermal
acceptability and contaminant transportation by varying the supply air temperature
of 22±0.5, 24±0.5 and 26±0.5°C. Objective measurements included air velocity, air
temperature, relative humidity (RH), etc. Subjective assessment was performed by
means of questionnaire using thirty-two tropically acclimatized students. A breathing
thermal manikin was also used to simulate human subjects in this study.
v
Results of the 2-fan study are similar to the 4-fan system with an improved
temperature distribution. The air flow around human body is significantly improved
by the 2-fan system. The vertical temperature profiles became steeper between 0.6 m
and 1.7 m height when the fans were applied. It demonstrates that the fans are
effective in bringing the cooler air to the subjects.
Results of the thermal sensation and thermal comfort are quite different from the
4-fan system. The fans in the 2-fan system are placed in more appropriate locations
to provide cooling and reduce draught around the human body as compared to the
4-fan system, especially at higher ambient temperature of 26°C. Hence, it is more
effective for the 2-fan system to improve the microenvironment of the occupants.
The 2-fan system also helps to save more energy as it consumes less electricity than
the 4-fan system. This promotes energy-efficiency by reducing the carbon emission.
However, the pollutant transportation study shows that, if there are polluting source in
front of the occupant, the concentration of pollutant in the inhaled air is higher for the
2-fan enhanced system as compared to the conventional DV system. A more
comprehensive study is needed for the pollutant study.
vi
LIST OF TABLES
Table 2.1 7-point thermal sensation scale
Table 2.2 Criteria stipulated by different standards
Table 3.1 Cooling load of each experiment
Table 3.2 Instruments employed in the experiments
Table 3.3 Experimental conditions (4-fan system)
Table 3.4 Experimental conditions (2-fan system)
Table 3.5 Experimental conditions for pollutant transportation study
Table 3.6 ASHRAE‟s 7-point scale
Table 3.7 Bedford‟s seven point of scale
Table 3.8 Anthropometric data of subjects
Table 3.9 Sequence of the experiments
Table 4.1 Perceived Air Quality with 2-fan system
vii
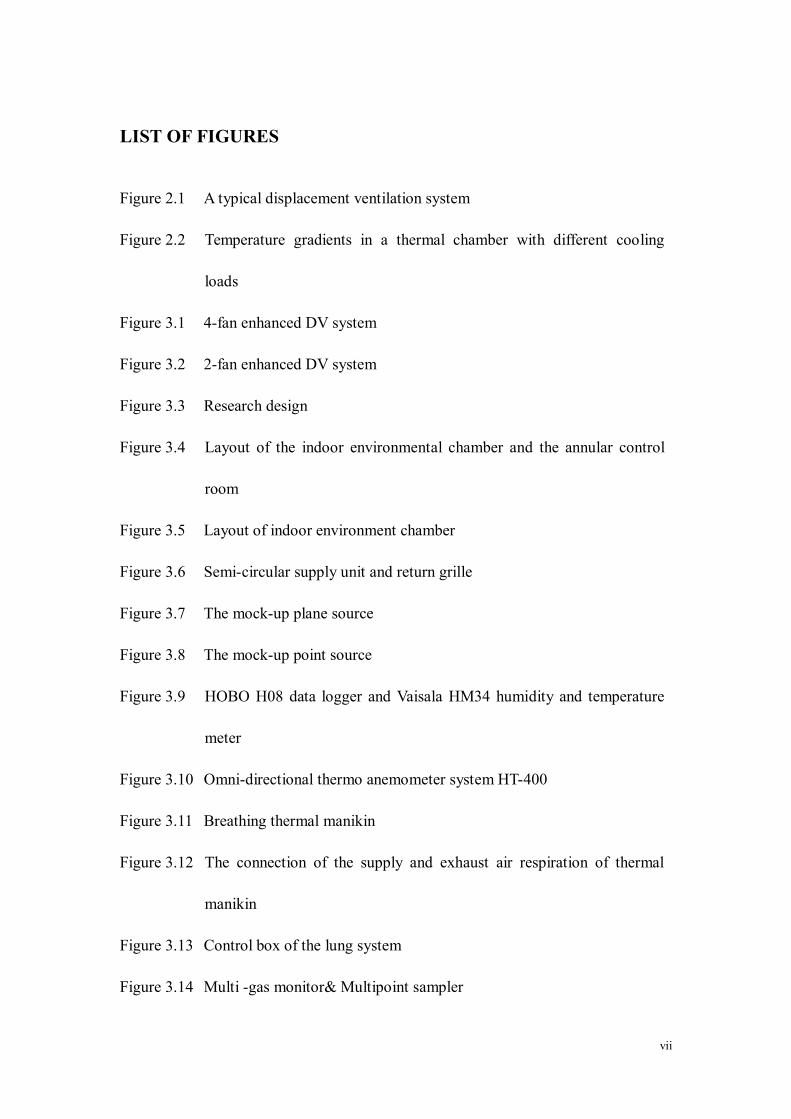
LIST OF FIGURES
Figure 2.1 A typical displacement ventilation system
Figure 2.2 Temperature gradients in a thermal chamber with different cooling
loads
Figure 3.1 4-fan enhanced DV system
Figure 3.2 2-fan enhanced DV system
Figure 3.3 Research design
Figure 3.4 Layout of the indoor environmental chamber and the annular control
room
Figure 3.5 Layout of indoor environment chamber
Figure 3.6 Semi-circular supply unit and return grille
Figure 3.7 The mock-up plane source
Figure 3.8 The mock-up point source
Figure 3.9 HOBO H08 data logger and Vaisala HM34 humidity and temperature
meter
Figure 3.10 Omni-directional thermo anemometer system HT-400
Figure 3.11 Breathing thermal manikin
Figure 3.12 The connection of the supply and exhaust air respiration of thermal
manikin
Figure 3.13 Control box of the lung system
Figure 3.14 Multi -gas monitor& Multipoint sampler
viii
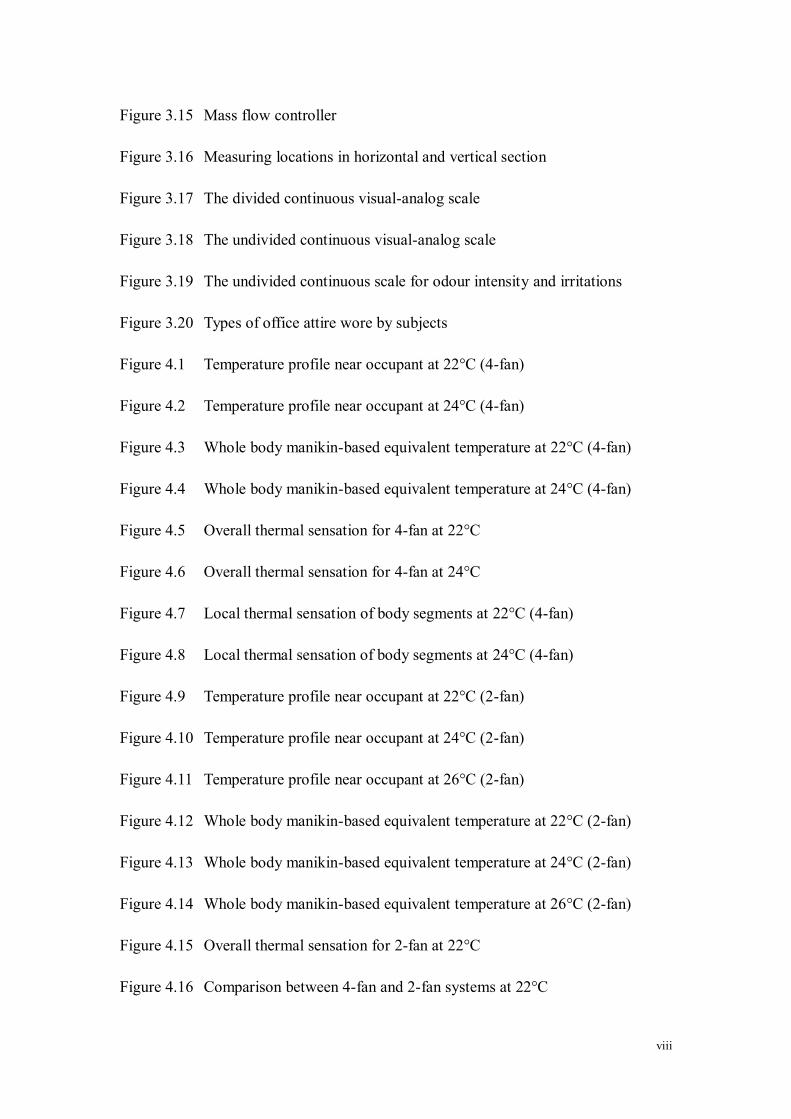
Figure 3.15 Mass flow controller
Figure 3.16 Measuring locations in horizontal and vertical section
Figure 3.17 The divided continuous visual-analog scale
Figure 3.18 The undivided continuous visual-analog scale
Figure 3.19 The undivided continuous scale for odour intensity and irritations
Figure 3.20 Types of office attire wore by subjects
Figure 4.1 Temperature profile near occupant at 22°C (4-fan)
Figure 4.2 Temperature profile near occupant at 24°C (4-fan)
Figure 4.3 Whole body manikin-based equivalent temperature at 22°C (4-fan)
Figure 4.4 Whole body manikin-based equivalent temperature at 24°C (4-fan)
Figure 4.5 Overall thermal sensation for 4-fan at 22°C
Figure 4.6 Overall thermal sensation for 4-fan at 24°C
Figure 4.7 Local thermal sensation of body segments at 22°C (4-fan)
Figure 4.8 Local thermal sensation of body segments at 24°C (4-fan)
Figure 4.9 Temperature profile near occupant at 22°C (2-fan)
Figure 4.10 Temperature profile near occupant at 24°C (2-fan)
Figure 4.11 Temperature profile near occupant at 26°C (2-fan)
Figure 4.12 Whole body manikin-based equivalent temperature at 22°C (2-fan)
Figure 4.13 Whole body manikin-based equivalent temperature at 24°C (2-fan)
Figure 4.14 Whole body manikin-based equivalent temperature at 26°C (2-fan)
Figure 4.15 Overall thermal sensation for 2-fan at 22°C
Figure 4.16 Comparison between 4-fan and 2-fan systems at 22°C
ix
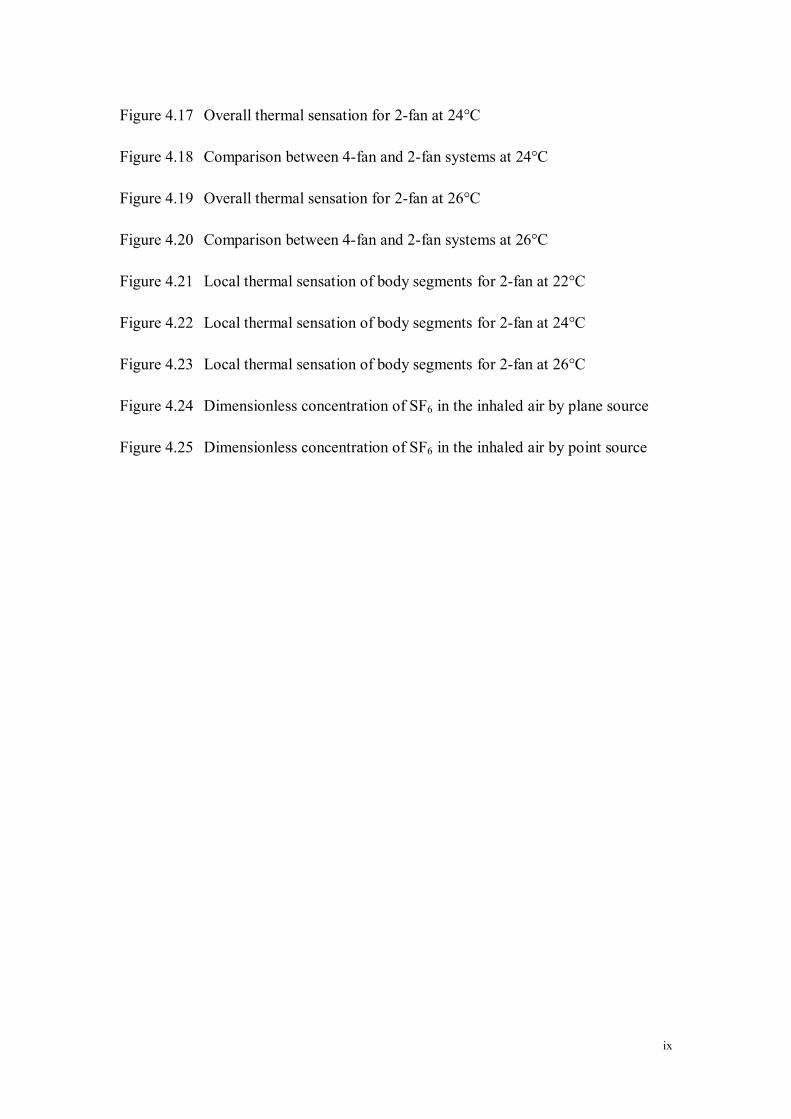
Figure 4.17 Overall thermal sensation for 2-fan at 24°C
Figure 4.18 Comparison between 4-fan and 2-fan systems at 24°C
Figure 4.19 Overall thermal sensation for 2-fan at 26°C
Figure 4.20 Comparison between 4-fan and 2-fan systems at 26°C
Figure 4.21 Local thermal sensation of body segments for 2-fan at 22°C
Figure 4.22 Local thermal sensation of body segments for 2-fan at 24°C
Figure 4.23 Local thermal sensation of body segments for 2-fan at 26°C
Figure 4.24 Dimensionless concentration of SF6 in the inhaled air by plane source
Figure 4.25 Dimensionless concentration of SF6 in the inhaled air by point source
x
ABBREVIATIONS
CFD = Computational Fluid Dynamics
CAV = Constant Air Volume System
DR = Draught Risk
DV = Displacement Ventilation
EHT = Equivalent Homogeneous Temperature
IAQ = Indoor Air Quality
HVAC = Heating, Ventilation and Air-Conditioning
LTS = Local Thermal Sensation
MV = Mixing Ventilation
ODR = Overall Draught Risk
OTC = Overall Thermal Comfort
OTS = Overall Thermal Sensation
PAQ = Perceived Air Quality
PD = Percentage Dissatisfied
PPD = Predicted Percentage of Dissatisfied
PV = Personalized Ventilation
RH = Relative Humidity
SBS = Sick Building Syndrome
VOC =Volatile Organic Compounds
WS = Work Station
CHAPTER 1 INTRODUCTION
1
CHAPTER 1 INTRODUCTION
1.1 Background
Nowadays people spend approximately 90% of their time indoors, which makes
indoor spaces important microenvironments when addressing health risks from
indoor pollutants. A person‟s daily exposure to air pollutants mainly comes through
the inhalation of indoor air (Guidelines for air quality, WHO, Geneva, 1999). Hence,
indoor climate pertaining to thermal comfort and indoor air quality (IAQ), is
increasingly recognized as an essential factor in the prevention of human diseases
and promotion of people‟s comfort, health and productivity (Seppänen and Fisk,
2005; Tham, 2004; Wargocki et al, 2004a; 2004b; 2005).
In an effort to conserve energy, modern building design has favored tighter structures
with lower rates of ventilation (Guidelines for air quality, WHO, Geneva, 1999).
Meanwhile, more and more complex synthetic materials are being used in buildings.
These materials emit pollutants such as formaldehyde, Volatile Organic Compounds
(VOC), etc. Hence, the inadequate ventilation rates lead to an accumulation of
pollutants and eventually exceed the threshold limit and affect occupants‟ health.
Therefore, the ultimate goal of air-conditioning system in buildings is to strive to
achieve thermally comfortable and healthy indoor environments for occupants in an
energy-efficient way (Yu, 2006).
Displacement Ventilation (DV) can be one of the solutions due to its characteristic of
CHAPTER 1 INTRODUCTION
2
providing good IAQ while saving energy (Riffat et al, 2004). DV system has been
commonly used in industrial buildings in Scandinavian countries since the 1970‟s as
a ventilation strategy (Breum and Orhehde, 1994; Niemelä et al, 2001). In the past
30 years, its use has been extended to ventilation in small spaces such as classrooms,
offices and other commercial spaces where, in addition to IAQ, comfort is an
important consideration (Nishioka et al, 2000; John et al, 2001). Recently, there is a
growing interest of combining the DV system with other air conditioning systems,
such as chilled ceiling and Personalized Ventilation (PV) systems, to achieve better
performance (Cermak et al, 2004; Melikov et al, 2003; Riffat et al, 2004).
However, Mixing Ventilation (MV) is still one of the most common air distribution
systems used in buildings. In MV systems, conditioned air is supplied from the air
diffusers mounted near the floor at a relatively high velocity into the room. The
conditioned air mixes with the ambient room air and dilutes the concentration of
indoor contaminants. In the most effective scenario, mixing ventilation creates a
relatively uniform thermal and air quality environment. Every occupant in the space
is exposed to a similar level of pollutants even though one may be far from the
polluting source. On the contrary, the principle of DV system is buoyancy driven.
The conditioned air is supplied from a low sidewall or floor diffuser at a very low
velocity. When it comes into contact with a heat source such as people, lighting,
computers, electrical equipments, etc, the cool air will rise and carry contaminants
and heat up to the upper zone, away from the occupants. The air quality in the
occupied zone will generally be much better than with the uniform mixed room air.
CHAPTER 1 INTRODUCTION
3
However, cooling or heating capacity of air is limited by the nature of the need for
careful thermal control of the supply air temperature. DV system has to supply a
large quality of air from floor area which may cause draught. Cold discomfort at the
feet, ankles and legs due to draught and vertical air temperature difference was often
reported with DV system (Melikov and Nielsen, 1989).
There are numerous researches on DV system. However, most of such studies
focused on the temperate climatic conditions area. The performance of the DV
system in the hot and humid climate such as Singapore may be, different from that in
a temperate climate. Tropically acclimatized occupants may also have different
thermal and Perceived Air Quality (PAQ) perception from the people living in the
temperate climatic condition. Hence, there is a need to investigate the performance
of the DV system in the tropics.
Moreover, displacement ventilation systems supply air directly to the occupied zone
at low velocities to have minimal induction and mixing. It is usually used for
ventilation and cooling of large spaces with high floor to ceiling height and heat load,
such as auditorium and atrium, where the thermal plume is more significant with
greater energy-saving as it only serves the occupied zone rather than the entire space.
By extending the application of DV system to small spaces, this disadvantage has
been taken into consideration.
Hence, it is necessary to investigate how to improve the thermal comfort and indoor
air quality of a DV system in small spaces with lower floor to ceiling height and
CHAPTER 1 INTRODUCTION
4
lower heat load as compared to large spaces in the tropics.
Some students in the National University of Singapore have conducted a series of
experiments using the 4-fan enhanced DV system to enhance the performance of the
conventional DV system in the tropics. The main objective of those studies was to
bring cooler air from the floor level to the occupants, in order to improve the thermal
comfort and indoor air quality around human bodies in small spaces with low heat
load and low floor-to-ceiling height.
However, it is argued that the 2-fan system might be a better option to achieve the
same effort. The draught risk might be reduced with the 2-fan system and therefore
better thermal sensation could be perceived. In addition, the energy-saving potential
of 2-fan system is also greater.
Hence, the primary motivation of this study is to investigate if the 2-fan system would
receive a more positive response in terms of thermal comfort as compared to the 4-fan
system.
1.2 Research objectives
In view of the points discussed earlier, the performance of the enhanced DV system
in terms of occupants‟ thermal and sensation acceptability and indoor air quality,
will be investigated in this study. This study will mainly focus on thermal comfort
and Perceived Air Quality (PAQ). The draught risk of the enhanced DV system will
also been studied. The objectives of this study are as follow:
CHAPTER 1 INTRODUCTION
5
1. To investigate the impact of the 2-fan enhanced DV system on the airflow
around human body;
2. To assess occupants‟ thermal comfort with the 2-fan enhanced DV system;
3. To determine the effect of the 2-fan enhanced DV system to reduce draught
risk and improve thermal sensation with comparison to the 4-fan system;
4. To assess the impact of the 2-fan enhanced DV system on the pollutant
transportation when there is a polluting source in the room; and
5. To explore the energy-saving potential of the 2-fan system and compare to
the conventional DV system and 4-fan system.
1.3 Scope of the study
The scope of this research project includes objective measurement and subjective
assessment to determine the performance of the 2-fan enhanced DV system with
respect to thermal comfort, indoor air quality and its energy-saving potential in the
tropics.
1.4 Organization of thesis
The outline of this thesis is briefly described as follow:
Chapter One outlines the background, objectives, scope of this study and
organization of this thesis.
Chapter Two presents the performance of the conventional DV system and reviews
CHAPTER 1 INTRODUCTION
6
past work related to thermal comfort, IAQ, energy efficiency and draught risk in a
DV environment.
Chapter Three presents the research methodology adopted in this study. A new 2-fan
enhanced DV system is introduced to improve the performance of the 4-fan system.
Based on the literature review, the research hypothesis is developed for this study,
followed by the description of the research design, experimental conditions, methods
of data collection and methods of data analysis.
Chapter Four focuses on the results and discussion of both the objective and
subjective studies done in the research. Vertical temperature profiles of various
experiments under different conditions and the equivalent temperature of the thermal
manikin are presented. Subjective responses to the various experimental conditions
are analyzed and the impact of the enhanced DV system on the pollutant
transmission is also discussed.
Chapter Five highlights the concluding remarks of the research, the limitations of the
study and some recommendations for future research.
CHAPTER 2 LITERATURE REVIEW
7
CHAPTER 2 LITERATURE REVIEW
2.1 Introduction
Displacement ventilation was first applied to industrial buildings in 1938. Since then,
the system has been increasingly used in Scandinavian countries and eventually
spread worldwide as a means of ventilation in industrial facilities to provide good
indoor air quality while saving energy (Breum and Orhede, 1994; Niemelä et al,
2001; John et al, 2001). Its application has been extended from large scale spaces
with high floor to ceiling height, such as theatres and auditoriums, to small spaces
such as classrooms, offices and other commercial spaces where, in addition to IAQ,
comfort is an important consideration (Nishioka et al, 2000; John et al, 2001).
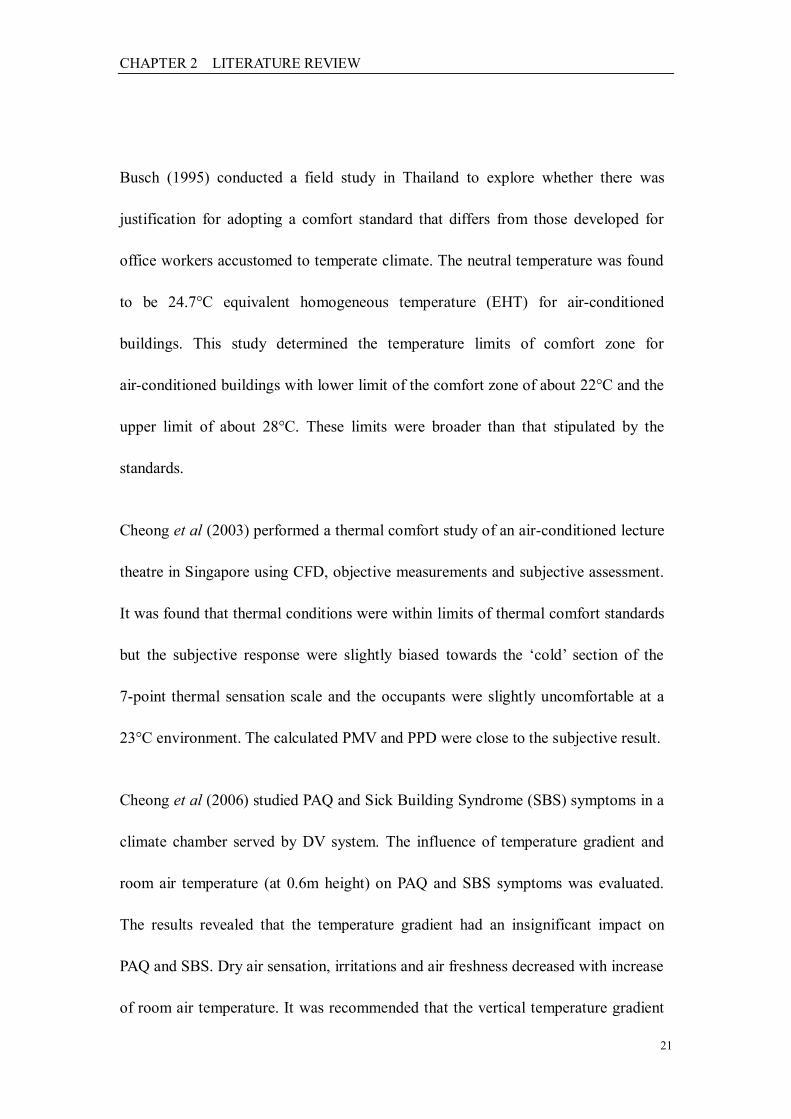
A typical displacement ventilation system, as shown in Figure 2.1, supplies
conditioned air at a very low velocity (less than 0.5 m/s) from a low sidewall or floor
diffuser and exhausts the air at the ceiling level. The supply air temperature is
slightly lower than the designed room air temperature. Since it is cooler than the
room air, the supply air is spread over the floor and then rises as it comes into
contact with heat sources, such as peoples, computers, etc in the occupied space.
These heat sources create upward convective flows in the form of thermal plumes
(Cheong et al, 2004). The air laden with heat and contaminants rises to the upper
zone of the room space (John et al, 2001).Thus, the air is stratified with a lower zone
of fresh cool air and an upper zone of mixed and contaminated warm air.
CHAPTER 2 LITERATURE REVIEW
8
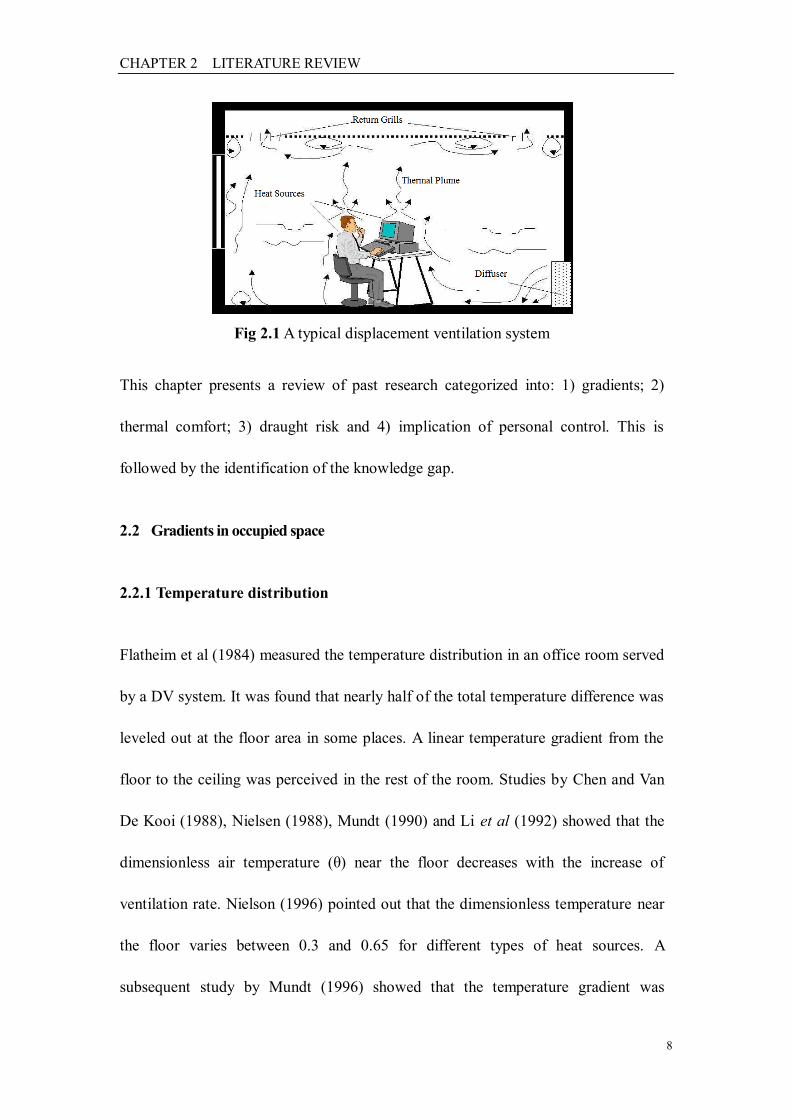
Fig 2.1 A typical displacement ventilation system
This chapter presents a review of past research categorized into: 1) gradients; 2)
thermal comfort; 3) draught risk and 4) implication of personal control. This is
followed by the identification of the knowledge gap.
2.2 Gradients in occupied space
2.2.1 Temperature distribution
Flatheim et al (1984) measured the temperature distribution in an office room served
by a DV system. It was found that nearly half of the total temperature difference was
leveled out at the floor area in some places. A linear temperature gradient from the
floor to the ceiling was perceived in the rest of the room. Studies by Chen and Van
De Kooi (1988), Nielsen (1988), Mundt (1990) and Li et al (1992) showed that the
dimensionless air temperature (θ) near the floor decreases with the increase of
ventilation rate. Nielson (1996) pointed out that the dimensionless temperature near
the floor varies between 0.3 and 0.65 for different types of heat sources. A
subsequent study by Mundt (1996) showed that the temperature gradient was
CHAPTER 2 LITERATURE REVIEW
9
substantially linear in the room and strongly dependent on the ventilation rate.
Hashimoto et al (2005) concluded that vertical temperature profiles shifted
horizontally with the change of supply air temperature. This means that room air
temperature at any height is controlled by the regulation of supply air temperature
when the set point room air temperature changes.
Yuan et al (1999a) conducted both experimental measurements and computational
fluid dynamics (CFD) modeling and found that the temperature gradient at the lower
part would be larger than at the upper part when most of the heat sources were in the
lower part of the room. Murakami et al (1998) analyzed both flow and temperature
fields around a modeled standing human body using CFD program and found that
the gradient became very steep between the feet and waist levels.
Yuan et al (1999b) measured and calculated airflow served by DV system for 3
typical room configurations: a small office, a large office with partitions and a
classroom. It was shown that DV system created significant temperature
stratification. Temperature gradients were steeper in the occupied zone. Since
occupants occupy the lower zone of a room, this temperature stratification represents
a potential risk of draught and thus it is critical to ensure that the temperature
difference is sufficiently small between the head and feet levels. Hence, thermal
comfort considerations imposed an upper limit to the allowable vertical temperature
gradients in office spaces. ISO 7730 (2005) presents moderate thermal environments
and recommends that vertical temperature difference between 0.1m and 1.1m above
CHAPTER 2 LITERATURE REVIEW
10
floor shall be less than 3˚C for optimal thermal comfort.
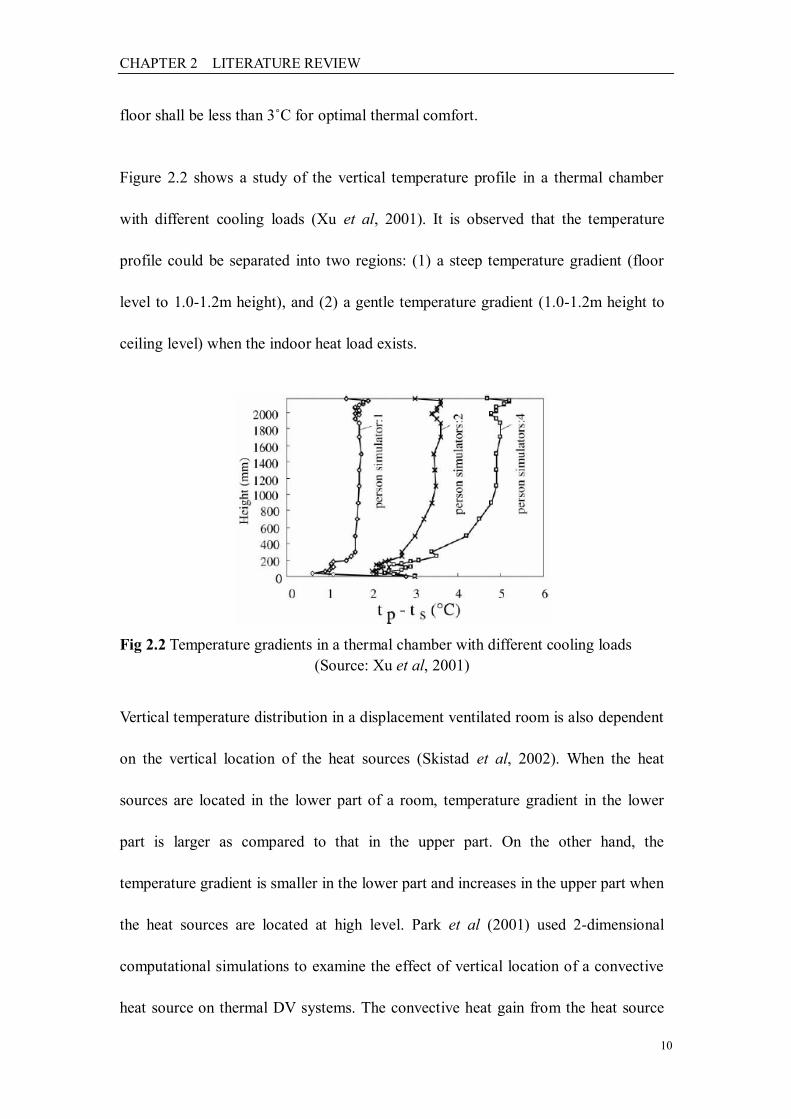
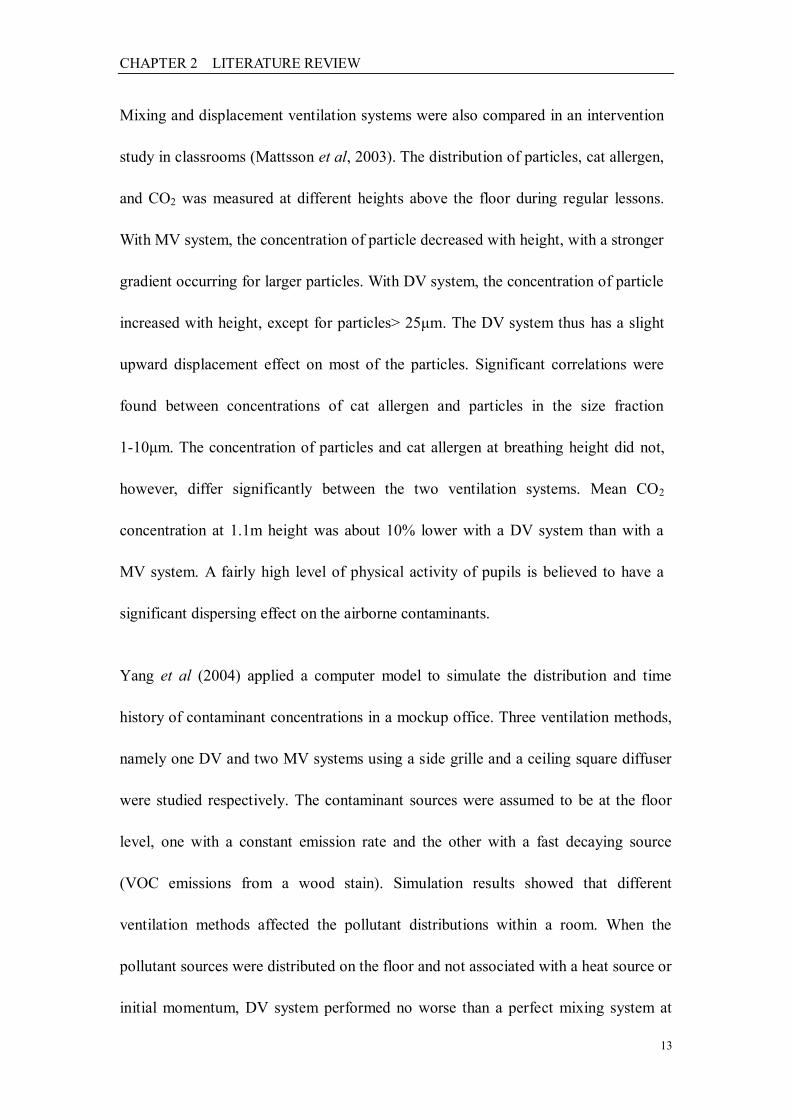
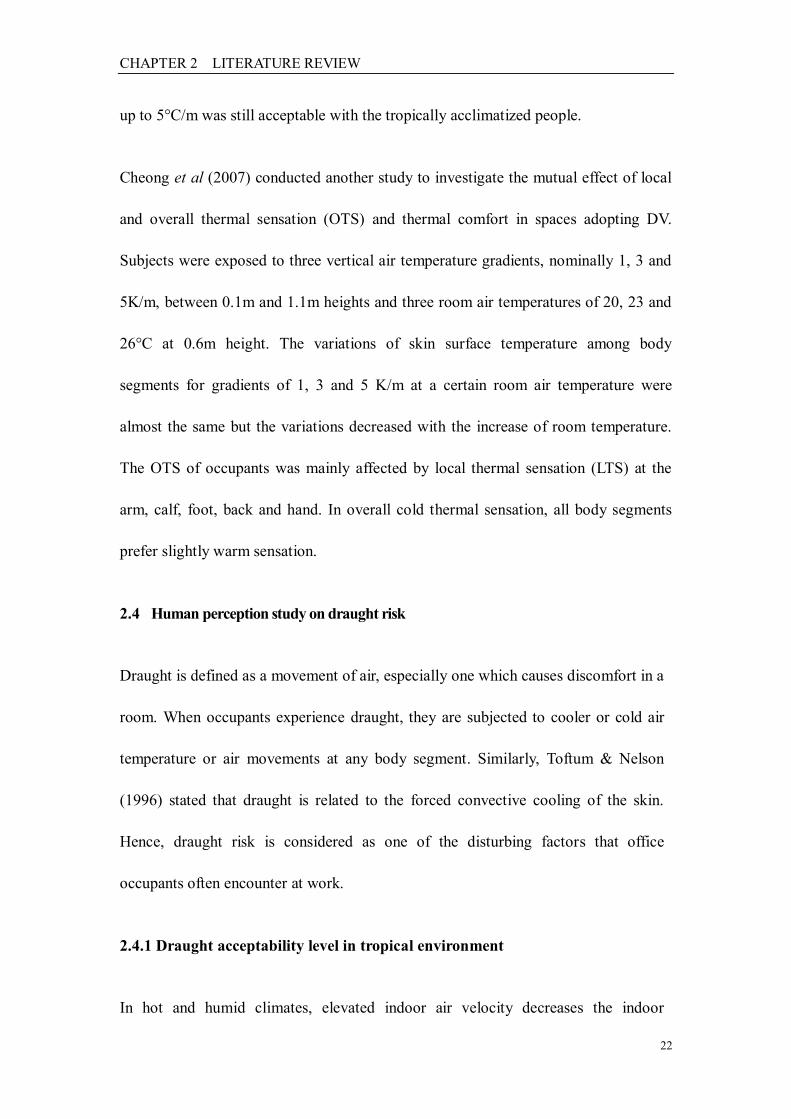
Figure 2.2 shows a study of the vertical temperature profile in a thermal chamber
with different cooling loads (Xu et al, 2001). It is observed that the temperature
profile could be separated into two regions: (1) a steep temperature gradient (floor
level to 1.0-1.2m height), and (2) a gentle temperature gradient (1.0-1.2m height to
ceiling level) when the indoor heat load exists.
Fig 2.2 Temperature gradients in a thermal chamber with different cooling loads
(Source: Xu et al, 2001)
Vertical temperature distribution in a displacement ventilated room is also dependent
on the vertical location of the heat sources (Skistad et al, 2002). When the heat
sources are located in the lower part of a room, temperature gradient in the lower
part is larger as compared to that in the upper part. On the other hand, the
temperature gradient is smaller in the lower part and increases in the upper part when
the heat sources are located at high level. Park et al (2001) used 2-dimensional
computational simulations to examine the effect of vertical location of a convective
heat source on thermal DV systems. The convective heat gain from the heat source
CHAPTER 2 LITERATURE REVIEW
11
to an occupied zone became less significant when the location of the heat source
above the floor increased. This effect changed the temperature field and resulted in
the reduction of the cooling load in the occupied zone. The stratification level was
also affected by the heat source location at a given flow rate. Li et al (2005)
confirmed the findings by CFD simulation.
2.2.2 Concentration distribution
The advantage of DV system as compared to MV system is that it can bring about
better air quality in the occupant zone. However, when the contaminant source is
combined with the heat source, the upward thermal plume will carry the
contaminants over the heat source to the upper zone of the room. This resulted in
more polluted air in the upper zone while the air in the lower zone is as clean as the
supply air.
By using the tracer gas technique, Mundt (1994) found that in a room with DV
system, a person can experience good air quality in the breathing zone, even if this
zone was located in a polluted layer. The convective plume around human body may
break through the polluted layers and increase local ventilation effectiveness. The
DV system served as a demand controlled system for clean air from the lower part of
the room. Brohus (1997) also found that the entrainment of air around human body
was usually an advantage of DV system when there were no passive contaminant
sources. Murakami et al (1998) conducted a CFD study of concentration distribution
for different locations of contaminant generation. It is found that the rising plume
CHAPTER 2 LITERATURE REVIEW
12
around the body was not broken by the surrounding airflow. The air quality at the
breathing zone was dependant on the location of the contaminant generation. When
the contaminant is generated in the upper part of the room, above the breathing
height, and the air in the lower part of the room was relatively clean, the rising
stream of air had a positive influence on the quality of inhaled air. Conversely, the
rising stream of air had a negative effect on the quality of inhaled air if contaminants
were generated in the lower part of the room, below the breathing height.
In the study by Yuan et al (1999c) where CFD was applied and Yuan et al (1999a)
where both measurement and CFD modeling were employed, it is found that the
concentration of CO2 in the lower zone was less than that in the upper zone. It was
also demonstrated that as convective flow around a human body brought air from a
lower zone to the breathing zone, the inhaled contaminant concentration was lower
than that at the nose level in the middle of the room.
In another study, Mundt (2001) evaluated particle transportation and ventilation
efficiency with non-buoyant contaminant sources in a DV room. A re-suspension of
floor deposited particles caused by influence of supply air or people moving around
may increase the number of particles in convection flows. Concentration of particles
at different positions under a steady state and transit conditions was measured. The
results showed that there seemed to be a lower risk of re-suspension of particles, in
the measured size interval, by the influence of the supply air. The contaminant
removal effectiveness depended on the position of the pollutant sources.
CHAPTER 2 LITERATURE REVIEW
13
Mixing and displacement ventilation systems were also compared in an intervention
study in classrooms (Mattsson et al, 2003). The distribution of particles, cat allergen,
and CO2 was measured at different heights above the floor during regular lessons.
With MV system, the concentration of particle decreased with height, with a stronger
gradient occurring for larger particles. With DV system, the concentration of particle
increased with height, except for particles> 25μm. The DV system thus has a slight
upward displacement effect on most of the particles. Significant correlations were
found between concentrations of cat allergen and particles in the size fraction
1-10μm. The concentration of particles and cat allergen at breathing height did not,
however, differ significantly between the two ventilation systems. Mean CO2
concentration at 1.1m height was about 10% lower with a DV system than with a
MV system. A fairly high level of physical activity of pupils is believed to have a
significant dispersing effect on the airborne contaminants.
Yang et al (2004) applied a computer model to simulate the distribution and time
history of contaminant concentrations in a mockup office. Three ventilation methods,
namely one DV and two MV systems using a side grille and a ceiling square diffuser
were studied respectively. The contaminant sources were assumed to be at the floor
level, one with a constant emission rate and the other with a fast decaying source
(VOC emissions from a wood stain). Simulation results showed that different
ventilation methods affected the pollutant distributions within a room. When the
pollutant sources were distributed on the floor and not associated with a heat source or
initial momentum, DV system performed no worse than a perfect mixing system at
CHAPTER 2 LITERATURE REVIEW
14
the breathing zone. The effects of source type and location on contaminant dispersion
were studied by He et al (2005) in a displacement ventilated room by both
experimental and numerical methods. The results showed that the source type and
location affected the contaminant distributions for both point and area source cases.
Even when the contaminant source was at the floor level, a DV system can still
generate slightly lower concentration at or below the breathing zone, as compared to a
MV system. Zhang L. et al (2005) used a validated CFD program to investigate and
compare the performances of DV and MV system under different boundary
conditions. This comparison showed that, with proper design, installation,
maintenance and operation, the DV system can maintain a better IAQ, especially at
the breathing zone. The numerical results showed that the air was younger at
breathing zone for the DV system than that of the MV system. CO2 generated by the
occupants was also easier to be expelled in the DV cases. The TVOC concentration in
the occupied zone was well below the limits for both mixing and DV modes while the
pollutant levels showed a very small difference between the two ventilation modes.
2.3 Thermal comfort
Thermal comfort is the condition of mind that expresses satisfaction with a thermal
environment (ISO Standard 7730, 2005). In general, thermal comfort occurs when
body temperatures are within narrow ranges, skin moisture is low, and the physical
effort of regulation is minimized (ASHRAE Standard 55, 2004). Numerous
researchers such as Berglund (1995), Gagge (1937), Hardt (1997) and Hensel (1973,
CHAPTER 2 LITERATURE REVIEW
15
1981) have found that the conscious mind appears to reach conclusions about
thermal comfort or discomfort from direct temperature and moisture sensations from
the skin, deep body temperatures, and efforts necessary to regulate temperature.
The reference to “condition of mind” emphasizes that comfort is a psychological
phenomenon. As such, it is often “measured” using subjective assessment. People‟s
thermal sensation is mainly related to the thermal balance of their body as a whole.
This balance is influenced by their physical activity and clothing, as well as the
environment parameters: air temperature, mean radiant temperature, air velocity and
air humidity (Cheong et al, 2004). Moreover, man‟s thermal sensation can also be
influenced by factors such as age, sex, body build, etc (Fanger, 1970).
The following section will first present the indices for analytical determination and
interpretation of thermal comfort and local thermal comfort criteria (ISO 7730, 2005)
and then follow by outlining findings from previous studies.
2.3.1 Indices and criteria
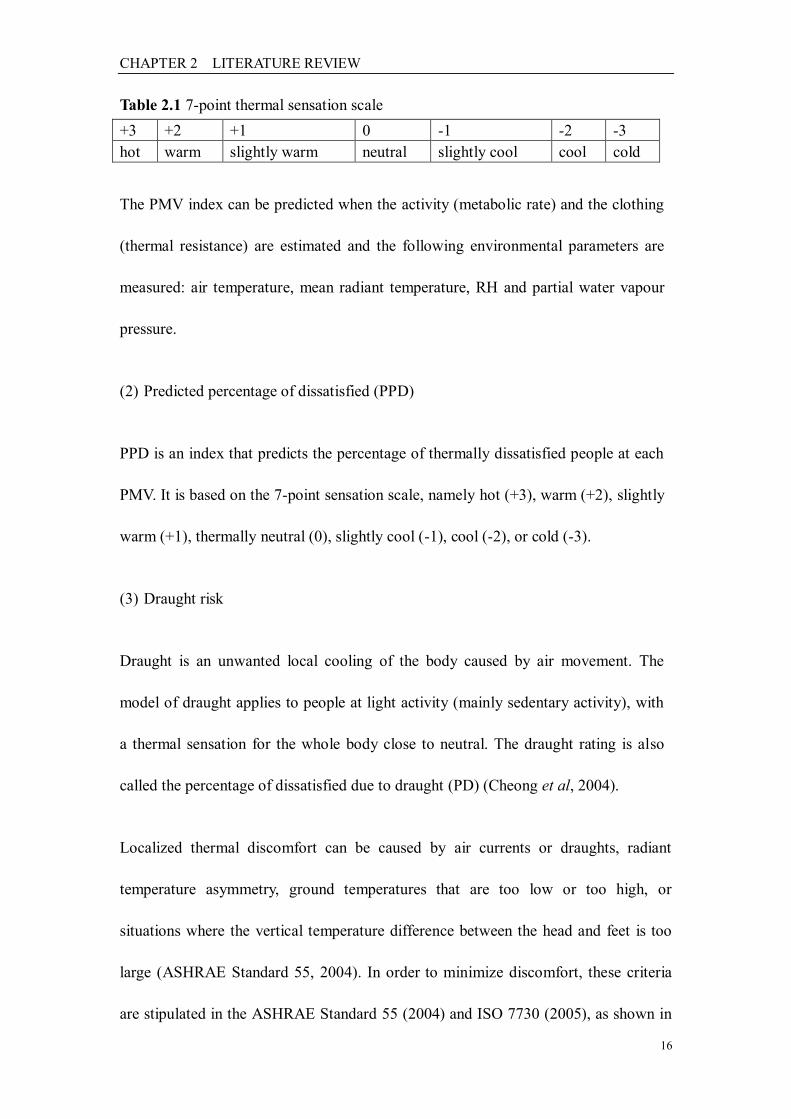
(1) Predicted mean vote (PMV)
The PMV is an index for predicting the mean vote of thermal comfort of a large
population of peoples based on a 7-point thermal sensation scale as shown in Table
2.1:
CHAPTER 2 LITERATURE REVIEW
16
Table 2.1 7-point thermal sensation scale
+3 +2 +1 0 -1 -2 -3
hot warm slightly warm neutral slightly cool cool cold
The PMV index can be predicted when the activity (metabolic rate) and the clothing
(thermal resistance) are estimated and the following environmental parameters are
measured: air temperature, mean radiant temperature, RH and partial water vapour
pressure.
(2) Predicted percentage of dissatisfied (PPD)
PPD is an index that predicts the percentage of thermally dissatisfied people at each
PMV. It is based on the 7-point sensation scale, namely hot (+3), warm (+2), slightly
warm (+1), thermally neutral (0), slightly cool (-1), cool (-2), or cold (-3).
(3) Draught risk
Draught is an unwanted local cooling of the body caused by air movement. The
model of draught applies to people at light activity (mainly sedentary activity), with
a thermal sensation for the whole body close to neutral. The draught rating is also
called the percentage of dissatisfied due to draught (PD) (Cheong et al, 2004).
Localized thermal discomfort can be caused by air currents or draughts, radiant
temperature asymmetry, ground temperatures that are too low or too high, or
situations where the vertical temperature difference between the head and feet is too
large (ASHRAE Standard 55, 2004). In order to minimize discomfort, these criteria
are stipulated in the ASHRAE Standard 55 (2004) and ISO 7730 (2005), as shown in
CHAPTER 2 LITERATURE REVIEW
17
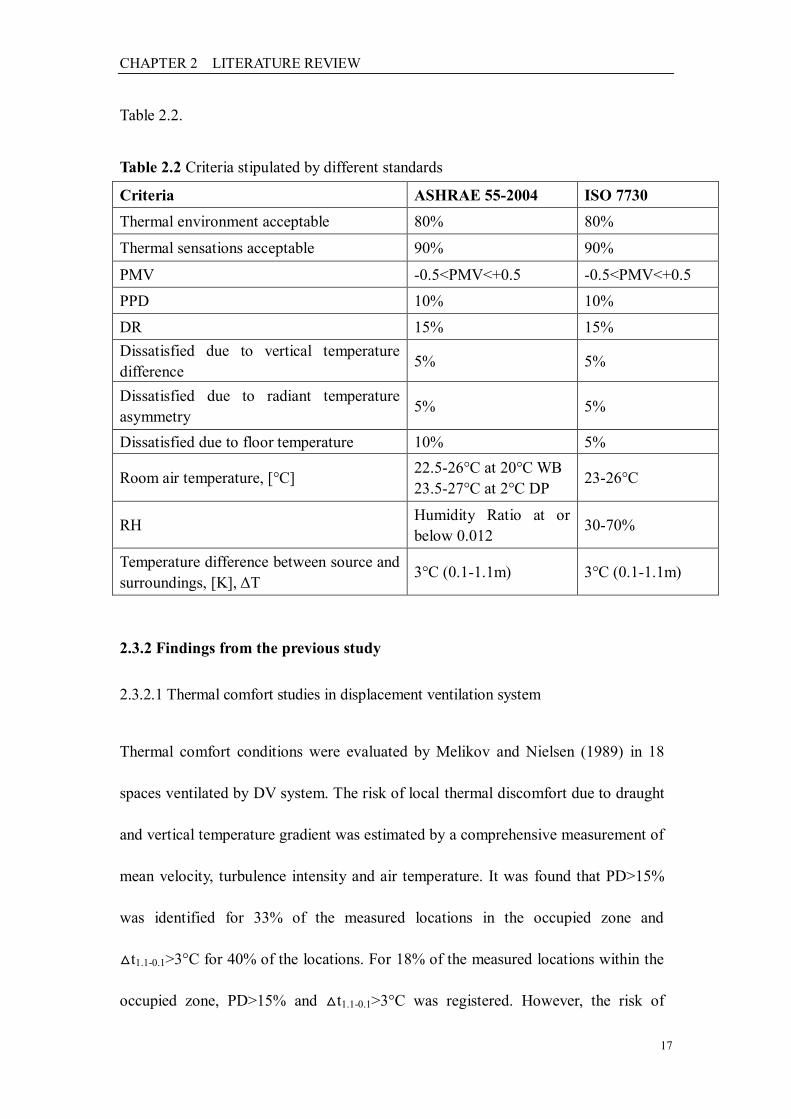
Table 2.2.
Table 2.2 Criteria stipulated by different standards
Criteria ASHRAE 55-2004 ISO 7730
Thermal environment acceptable 80% 80%
Thermal sensations acceptable 90% 90%
PMV -0.5<PMV<+0.5 -0.5<PMV<+0.5
PPD 10% 10%
DR 15% 15%
Dissatisfied due to vertical temperature
difference 5% 5%
Dissatisfied due to radiant temperature
asymmetry 5% 5%
Dissatisfied due to floor temperature 10% 5%
Room air temperature, [°C] 22.5-26°C at 20°C WB
23.5-27°C at 2°C DP 23-26°C
RH Humidity Ratio at or
below 0.012 30-70%
Temperature difference between source and
surroundings, [K], ΔT 3°C (0.1-1.1m) 3°C (0.1-1.1m)
2.3.2 Findings from the previous study
2.3.2.1 Thermal comfort studies in displacement ventilation system
Thermal comfort conditions were evaluated by Melikov and Nielsen (1989) in 18
spaces ventilated by DV system. The risk of local thermal discomfort due to draught
and vertical temperature gradient was estimated by a comprehensive measurement of
mean velocity, turbulence intensity and air temperature. It was found that PD>15%
was identified for 33% of the measured locations in the occupied zone and
△t1.1-0.1>3°C for 40% of the locations. For 18% of the measured locations within the
occupied zone, PD>15% and △t1.1-0.1>3°C was registered. However, the risk of
CHAPTER 2 LITERATURE REVIEW
18
discomfort due to draught and vertical temperature difference was low in some of the
investigated rooms. Hence, it was concluded that although there was a significant
risk of local discomfort due to draught or vertical temperature difference, when
displacement ventilation system is well designed, it is feasible to create good thermal
comfort in rooms.
Local thermal discomfort was studied by Gan (1995) in offices served by DV system
using CFD modeling. Thermal comfort level and draught risk were predicted by
employing Fanger‟s comfort equation into the airflow model. It is found that for
sedentary occupants with summer clothing, common complaints come more often
from unsatisfactory thermal sensation than from draught alone. The results also
showed that thermal discomfort can be avoided by optimizing the supply air velocity
and temperature. The effect of an under-floor air-conditioning system on thermal
comfort was investigated by Lian (2002). The four factors evaluated were the type of
outlet, the distance between the outlet and the occupant, and the velocity and
temperature of supply air. It was found that the distance between an occupant and
outlet has a significant influence on thermal comfort. The velocity and temperature
of the supply air has a moderate influence and the type of outlet has little influence.
Draught rating was evaluated by Yuan et al (1999c) in conventional DV systems for
small office, large offices with partitions, classrooms, and industrial workshops
under U.S thermal and flow boundary conditions using CFD program. It was found
that in general, the air velocity was less than 0.2m/s, the temperature difference
CHAPTER 2 LITERATURE REVIEW
19
between the head and foot level of a sedentary occupant was less than 2°C, and
draught rating (PD) predicted percentage of dissatisfaction (PPD) were less than 15%
in the occupied zone, if the design used the guidelines shown in their paper. Hence, it
was concluded that displacement ventilation could maintain a thermally comfortable
environment. Wyon and Sandberg (1990) used thermal manikin to predict discomfort
due to DV system. Serious local discomfort was identified, usually “too cold”, and
most of it was due to cold legs, ankles and feet. The results indicated Equivalent
Homogeneous Temperature (EHT) (WB) =25.1°C for preferred whole body
condition. An optimum sectional air temperature of 24.4°C was suggested for mean
thermal sensation to be “neutral” and a range of 20.9°C < T < 28.0°C based on 80%
acceptability criterion was proposed. Melikov et al (2005) conducted large amount
of surveys in buildings with DV system and found that the draught is the major
thermal discomfort factor attributed significantly to the local discomfort in rooms.
The ankles which are exposed to relatively high air velocity and low temperature are
most sensitive to draught, especially during summer when they are not protected by
clothing. Velocities ranging from 0.15 m/s to 0.25m/s have been identified as a
comfortable range in rooms served by DV system.
The performance of DV and MV system in terms of thermal comfort was also
compared by several studies. Nielsen et al (2003) compared MV and DV systems
based on a maximum velocity assumption and a restricted vertical temperature
gradient in the room. The results showed that an office room can be designed to the
same comfort level with respect to maximum velocity and maximum temperature
CHAPTER 2 LITERATURE REVIEW
20
gradient independent of the air distribution system. Zhang et al (2005) conducted a
CFD modeling and found that when properly designed, DV system can maintain a
thermally comfortable environment that has a low air velocity, a small temperature
difference between the head and ankle level and a low percentage of people
dissatisfied as compared to MV system.
Impact of room height on thermal comfort in DV system was investigated by Zhang
et al (2006) using CFD. The study was conducted in an office environment by
varying the ceiling height from 2.3m to 2.7m. It is found that the increase in building
height resulted in a decrease in PPD levels.
2.3.2.2 Thermal comfort studies in the tropics
Human perception of air movement and thermal sensation may be affected by
different climatic zones due to differences in physiological acclimatization, clothing,
behavior, habituation and expectation. It is believed that tropically acclimatized
people have a wider comfort zone and higher tolerance to the thermal environment
than those from a temperate climate.
De Dear et al (1991) performed thermal comfort field study experiments in
Singapore. Results of the air-conditioned sample indicated that office buildings were
overcooled. One third of their occupants experienced cool thermal comfort sensation.
PMV model‟s predicted neutralities were all slightly warmer than the empirically
observed neutralities by approximately 1degK.
CHAPTER 2 LITERATURE REVIEW
21
Busch (1995) conducted a field study in Thailand to explore whether there was
justification for adopting a comfort standard that differs from those developed for
office workers accustomed to temperate climate. The neutral temperature was found
to be 24.7°C equivalent homogeneous temperature (EHT) for air-conditioned
buildings. This study determined the temperature limits of comfort zone for
air-conditioned buildings with lower limit of the comfort zone of about 22°C and the
upper limit of about 28°C. These limits were broader than that stipulated by the
standards.
Cheong et al (2003) performed a thermal comfort study of an air-conditioned lecture
theatre in Singapore using CFD, objective measurements and subjective assessment.
It was found that thermal conditions were within limits of thermal comfort standards
but the subjective response were slightly biased towards the „cold‟ section of the
7-point thermal sensation scale and the occupants were slightly uncomfortable at a
23°C environment. The calculated PMV and PPD were close to the subjective result.
Cheong et al (2006) studied PAQ and Sick Building Syndrome (SBS) symptoms in a
climate chamber served by DV system. The influence of temperature gradient and
room air temperature (at 0.6m height) on PAQ and SBS symptoms was evaluated.
The results revealed that the temperature gradient had an insignificant impact on
PAQ and SBS. Dry air sensation, irritations and air freshness decreased with increase
of room air temperature. It was recommended that the vertical temperature gradient
CHAPTER 2 LITERATURE REVIEW
22
up to 5°C/m was still acceptable with the tropically acclimatized people.
Cheong et al (2007) conducted another study to investigate the mutual effect of local
and overall thermal sensation (OTS) and thermal comfort in spaces adopting DV.
Subjects were exposed to three vertical air temperature gradients, nominally 1, 3 and
5K/m, between 0.1m and 1.1m heights and three room air temperatures of 20, 23 and
26°C at 0.6m height. The variations of skin surface temperature among body
segments for gradients of 1, 3 and 5 K/m at a certain room air temperature were
almost the same but the variations decreased with the increase of room temperature.
The OTS of occupants was mainly affected by local thermal sensation (LTS) at the
arm, calf, foot, back and hand. In overall cold thermal sensation, all body segments
prefer slightly warm sensation.
2.4 Human perception study on draught risk
Draught is defined as a movement of air, especially one which causes discomfort in a
room. When occupants experience draught, they are subjected to cooler or cold air
temperature or air movements at any body segment. Similarly, Toftum & Nelson
(1996) stated that draught is related to the forced convective cooling of the skin.
Hence, draught risk is considered as one of the disturbing factors that office
occupants often encounter at work.
2.4.1 Draught acceptability level in tropical environment
In hot and humid climates, elevated indoor air velocity decreases the indoor
CHAPTER 2 LITERATURE REVIEW
23
temperature that occupants find most comfortable. However, the distribution of air
velocities measured during these field studies was skewed towards rather low values.
Many previous studies have attempted to define when and where air movement is
either desirable or not (Mallick, 1996; Santamouris, 2003).
Griefahn and Kunemund (2001) studied that gender affected the draught acceptability
level where women felt significantly more often uncomfortable by draughts and
preferred a higher temperature than men. This finding is in contrast with Fanger and
Christensen (1986) where they found no significant differences between men and
women on draught sensitivity level. Toftum (2004) indicated that indoor air speed in
hot climates should be between 0.2 and 1.5m/s, yet 0.2 m/s has been deemed in
ASHRAE Standard 55 to be the threshold upper limit of draught perception allowed
in air-conditioned buildings where occupants have no personal control over their
environment. The new standard 55 is based on Fanger‟s (1988) draught risk formula,
which has an even lower limit in practice than 0.2 m/s. None of the previous research
explicitly addressed air movement acceptability, instead focusing mostly on overall
thermal sensation and comfort.
2.4.2 Air movement and draught sensation
Fanger and Pedersen (1977) identified that the frequency of the speed fluctuation is
important for the sensation of air movement. Fanger and Christensen (1986) pointed
out that the subjects could sense air movement even at low velocities in a DV system,
regardless of which temperature they were exposed to. The study suggested that air
CHAPTER 2 LITERATURE REVIEW
24
flow with higher turbulence intensity may result in higher discomfort level. Fanger
et al (1988) found that draught discomfort increases when the air temperature
decreases and the mean speed and turbulence intensity increases. The same air flow
from the back causes more draught discomfort than that from the front (Toftum et al,
1997). Room airflow is felt most uncomfortable when the equivalent frequency of
the speed fluctuation is around 0.5HZ (Zhou and Melikov 2002; Zhou et al, 2002).
Olesen (2005) stated that though air velocity within a space can lead to draught
sensation, it can improve thermal comfort under warm condition.
The impact of turbulence intensity on sensation of draught was investigated by
Fanger et al (1988). Based on the experiments, turbulence intensity is found to be
dependable on mean air velocity where velocity increased under high and low
turbulence scenarios but decreased under medium turbulence. The study also showed
that women are slightly more draught sensitive compared to men at lower velocities
but not at higher velocities. It was concluded that air flow with high turbulence
caused more complaints of draught than air flow with low turbulence at the same
mean velocity and air temperature. Furthermore, it aligned with the previous findings
by Fanger and Pedersen (1977) that occupants felt more uncomfortable under
fluctuating velocities than constant velocity. It is identified that the uncomfortable
nature of turbulence is caused by periodically fluctuating air flow.
Xia et al (2000) found that air movement can provide desirable cooling in "warm"
conditions, but it can also cause discomfort. This study focuses on the effects of
CHAPTER 2 LITERATURE REVIEW
25
turbulent air movement on human thermal sensation by investigating the preferred air
velocity within the temperature range of 26 and 30.5oC at two RH levels of 35% and
65%. Subjects in an environmental chamber were allowed to adjust air movement as
they liked while answering a series of questions about their thermal comfort and
draught sensation. The results show that operative temperature, turbulent intensity and
relative humidity has significant effects on preferred velocities, and that there is a
wide variation among subjects in their thermal comfort votes. Most subjects can
achieve thermal comfort under the experimental conditions after adjusting to the
preferred air velocity, except at the relative high temperature of 30.5oC. The results
also indicate that turbulence may reduce draught risk in neutral-to-warm conditions.
The annoying effect caused by the air pressure and its drying effect at higher
velocities should not be ignored.
2.5 Thermal sensation versus draught perception
In a study by Fanger and Christensen (1986) on how the percentage of persons
feeling dissatisfied due to draught may affect thermal sensation, the results showed
that when subjected to cool thermal sensation, occupants tend to have more draught
complaints at low air velocities and less draught complaints at high air velocities.
Toftum and Nielson (1996) stated that thermal sensation will affect draught
sensitivity where subjects will feel less satisfied due to draught (i.e. increased local
discomfort) at slightly cool thermal sensation than at a warmer thermal sensation.
CHAPTER 2 LITERATURE REVIEW
26
A study in office buildings by Palonen and Seppänen (1990) showed that most
draught complaints by office occupants were caused not only by the thermal
conditions in the space alone but also subjected to their thermal sensation. Occupants
often felt cool or cold thermal sensation at work. Feeling of discomfort due to
draught often lowered occupants‟ comfort level.
Toftum (2004) stated that perception of air movement depends not only on the air
velocity and other thermal parameters, but also on personal factors such as activity
level, overall thermal sensation and clothing. This implied that rate of air movement
will affect occupants‟ overall thermal sensation.
In the study of Yu et al (2006) to understand the impact of thermal sensation on
draught perception, the OTS of subjects was cold at a room air temperature of 20°C
while slightly warm at 26°C. In both cases, adjustment of clothing was restricted.
The findings reported that OTS had great impact on overall draught rating (ODR) as
the ODR will be higher for colder sensation as compared to neutral or slightly warm
sensations. Similarly, local thermal sensation will affect the draught rating at each of
the body segments.
Cheong et al (2006) demonstrated that higher values of draught rating (DR) were
obtained when subjects experienced higher variations of skin surface temperature
among body segments which led to more subjects feeling uncomfortable. The
variations of skin surface temperature are especially greater at overall cold and cool
thermal sensations than at overall neutral sensation. This implied that the difference
CHAPTER 2 LITERATURE REVIEW
27
in skin surface temperature among each body part was wide where some body
segments experienced much lower temperature than other segments. Thus, subjects
were more prone to draught risk at cold and cool thermal sensation. The study
concluded that subjects‟ local discomfort level will be lower under overall thermal
neutral state than at cold or cool thermal sensation which indicated that the subjects
will feel more locally comfortable at higher and constant room temperature.
2.6 Implication of personal control
In a joint survey by Building Owners and Managers Association (BOMA) and Urban
Land Institute (ULI) (1999), office tenants feedback that having personal control
over room conditions was an important feature to satisfy good local thermal
environment. In conventional DV systems, occupants have no individual control
over the room conditions such as air velocity, air volume. This may lead to a higher
level of occupants‟ dissatisfaction on thermal sensation.
The Regents of University of California (2000) reported in today‟s work
environment, significant variations in room conditions are required to accommodate
individual comfort level because of individual differences in clothing, activity level
and individual comfort preferences. Their laboratory tests showed that commercially
available fan-powered supply outlets provide personal cooling control of equivalent
whole-body temperature that are more than enough to accommodate individual
thermal preferences.
CHAPTER 2 LITERATURE REVIEW
28
Olesen and Brager (2004) concluded that ASHRAE standard specifies conditions
that are still unable to satisfy 100% of the occupants. The suggested improvement to
meet the acceptability of the 20% dissatisfied occupants will be to permit occupants
with personal control of their thermal environment. The personal control
compensates occupants for their inter- and intra-individual differences in preferences
when subjected to the same thermal conditions within the office room.
2.7 Identification of knowledge gap
With reference to the review of past literatures, it can be seen that compared to the
MV systems, DV can provide better thermal sensation and IAQ while saving energy.
However, DV has its own limitations. One limitation is that DV system has to supply
a large quantity of air from floor area which may cause cold draught. Cold discomfort
at the feet, ankle and leg due to draught and vertical air temperature difference was
often reported with DV systems (Melikov and Nielsen, 1989; Pitchurov et al, 2002).
Findings from Pitchurov et al (2002) and Toftum& Nelson (1996) also indicated that
draught risk will bring about discomfort to occupants in small office environment
which may result in poor concentration or sick syndromes (e.g. dry eye) and affect
work productivity. However, draught sensation is very subjective as everyone has
different threshold levels towards cool or cold sensation from air movement. This is
reflective of the fact that occupants within the same space with room conditions that is
controlled by a central system have varied thermal responses.
CHAPTER 2 LITERATURE REVIEW
29
Meanwhile, the better performance of DV system are more likely to be realized in
large spaces with higher floor to ceiling height and higher heating load, therefore, it
may not be appropriate in spaces with low floor to ceiling height. Akimoto et al (1995)
demonstrated that the temperature stratification is relatively small in small spaces
with low ceiling compared with that in large spaces. Jin (1992) stated that the
temperature difference between the convection current above a human and the
ambient air decreases with height. Waters et al (1999) conducted CFD modeling to
investigate the air distribution and IAQ of an office space with a low floor to ceiling
height of 2.3m, served by DV system. The results indicated that the presence of
floor-level diffusers led to bad IAQ due to the old mean air age in the occupied zone.
The past researches and studies on DV system were mainly done in temperate regions
such as Nordic countries and North American. However, these findings may not be
applicable to buildings in the tropics like Singapore. Yu (2006) pointed out that, for
the tropically acclimatized subjects in the hot and humid region like Singapore, their
acceptable vertical temperature gradient is up to 5°C/m, which is higher than the
3°C/m limit proposed by ASHRAE standard. Tropically acclimatized occupants may,
therefore, have different thermal and PAQ perception as compared to people living in
other areas due to physiological adaptation. Tropically acclimatized subjects might
also tolerate higher air movement in comparison to those in temperate regions (Gong
et al, 2004).
In summary, very few studies on the performance of DV system in small spaces with
CHAPTER 2 LITERATURE REVIEW
30
low floor to ceiling height and heat load in the tropics have been reported.
Occupant‟s personal control of micro environment is important to maintain the
thermal neutral based on their preference. Hence, this study will focus on how to
improve the performance of DV system and increase its energy-saving potential in
the tropics.
CHAPTER 3 RESEARCH METHODOLOGY
31
CHAPTER 3 RESEARCH METHODOLOGY
3.1 Enhanced displacement ventilation system
3.1.1 4-fan system
It has been found that in an office environment with low heat load and floor to ceiling
height, the temperature stratification is less obvious and thermal comfort is less
acceptable as compared to large spaces with higher heat load and higher floor to
ceiling height (Akimoto et al, 1995; Lin et al, 2006). The thermal plume induced by
lower heat sources is too weak to bring the conditioned air from the floor area to the
occupied zone. To resolve this problem, cooler air near the floor is brought upwards
via the fans attached to the chair.
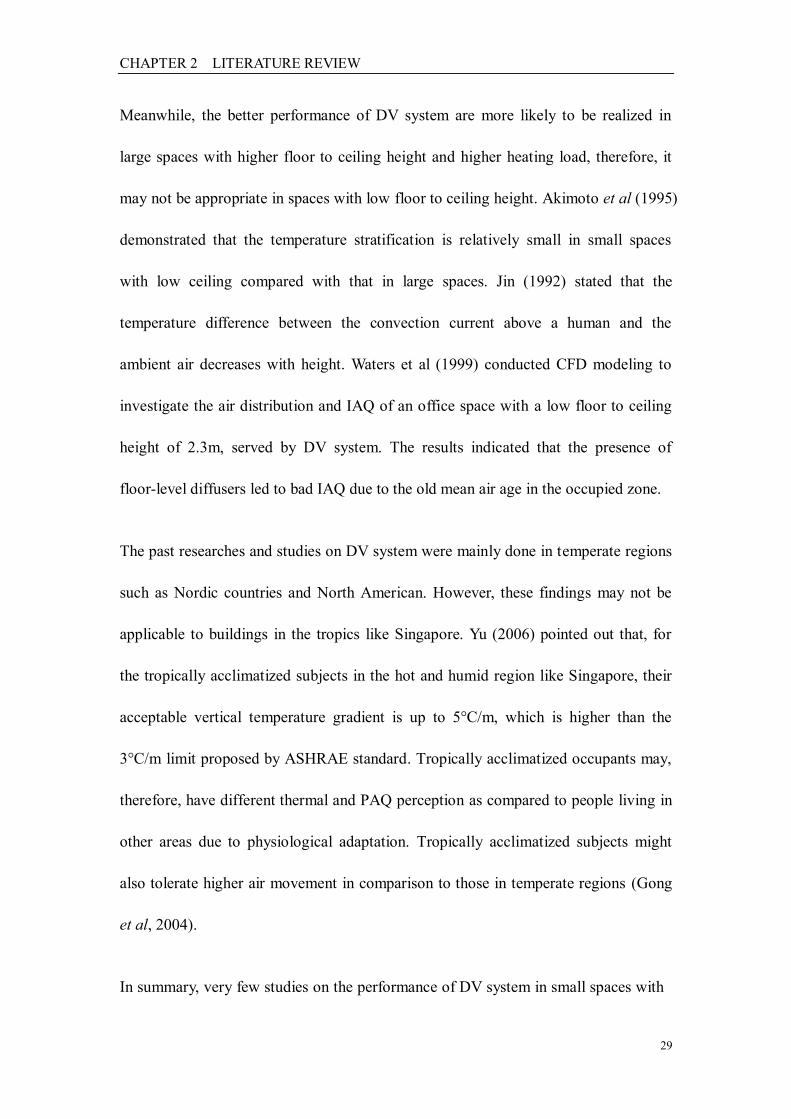
Fig 3.1 4-fan enhanced DV system (Source: Sun, 2010)
A 4-fan system, as shown in Figure 3.1, has been developed and researched in a series
of experiments conducted in the past (Sun, 2010). In this enhanced DV system, 4 fans
are mounted at the 4 corners of the chair with the fan speed and fan discharged angle
adjustable. The first part of this thesis will be a follow-up study of Sun‟s work on the
4-fan DV system. It is expected that the airflow provided by the fans can strengthen
the thermal plume around the occupant and make the vertical temperature gradient in
CHAPTER 3 RESEARCH METHODOLOGY
32
the occupied zone more significant and achieve better IAQ.
3.1.2 2-fan system
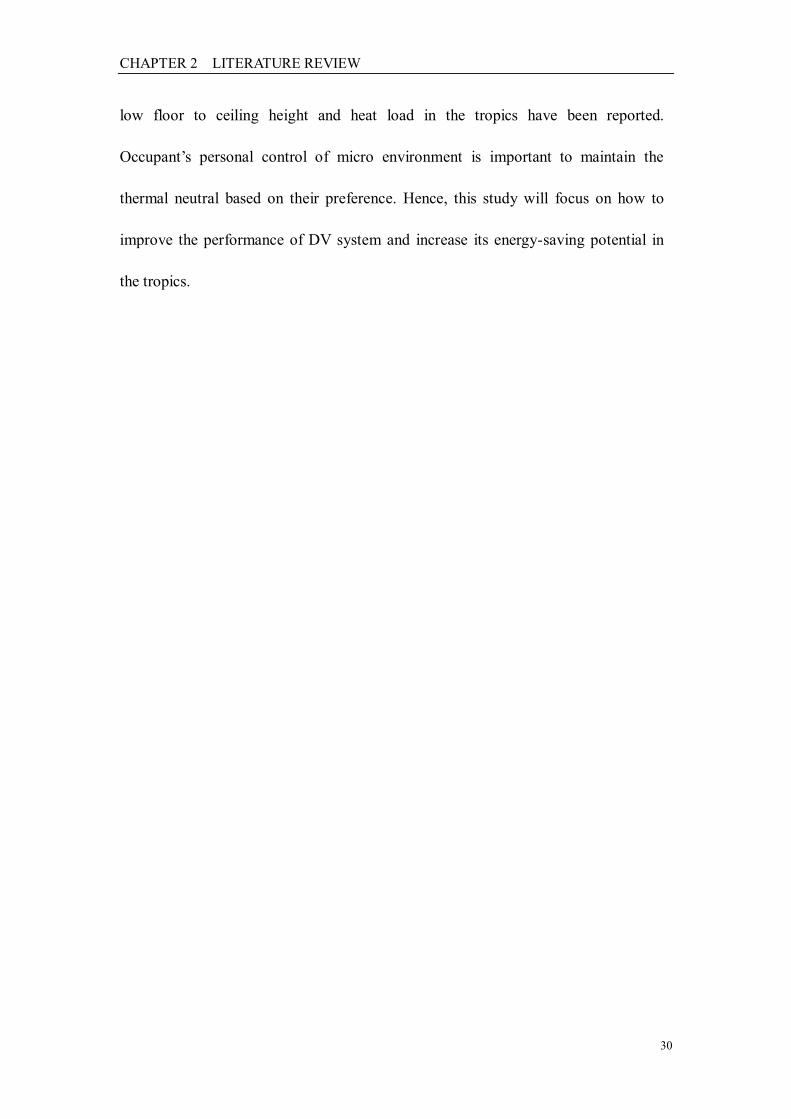
To reduce the draught risk and energy consumption of the 4-fans system, a 2-fan
system as shown in Figure 3.2 is developed to improve the performance of the 4-fan
DV system. 2 fans are mounted at the two sides of the chair. Similar to the
experiments using the 4-fan system, the angles of the fans can be adjusted to 0o, 30
o
and 60o and the fan speed can be adjusted to low, middle and high to improve the
overall thermal comfort and draught sensation of the subjects.
Fig 3.2 2-fan enhanced DV system
3.2 Research hypothesis
Based on the literature review in Chapter 2, the research hypotheses of this study are
formulated as follow:
1) The 2-fan system is more acceptable among occupants as compared to the 4-fan
system as it would not produce draught;
CHAPTER 3 RESEARCH METHODOLOGY
33
2) The fans mounted on two sides of the chair encourage mixing of air and increase
the pollutant concentration in the breathing zone; and
3) The 2-fan system has the potential to save more energy while achieving good
thermal comfort level at higher ambient temperature.
3.3 Research design
Considering the research objectives and scope of this study, objective measurements
and subjective assessments were employed in this research to investigate the thermal
comfort and IAQ performance of DV system without fans (conventional type); and
enhanced DV system-with 4 fans; and enhanced DV system-with 2 fans. The
detailed experiments assess the thermal acceptability of the enhanced DV system
with different air flow rates and discharge fan angles by the tropically acclimatized
subjects, and evaluate the transmission of pollutant with the presence of polluting
source in the room. Finally, the results of the 2-fan system on draught reduction,
thermal comfort and energy saving is compared with the 4-fan system.
Figure 3.3 shows the research method adopted in this study. At the data collection
stage, physical parameters such as air temperature, air velocity, RH, concentration of
Sulfur Hexafluoride (SF6), etc, was measured continuously by accurate measuring
instruments and thermal manikin while subjective data was collected simultaneously
by means of questionnaire surveys completed by the subjects during the experiments
to determine their thermal sensations and thermal comfort level under different
experimental conditions. For data analysis, data from the objective measurements
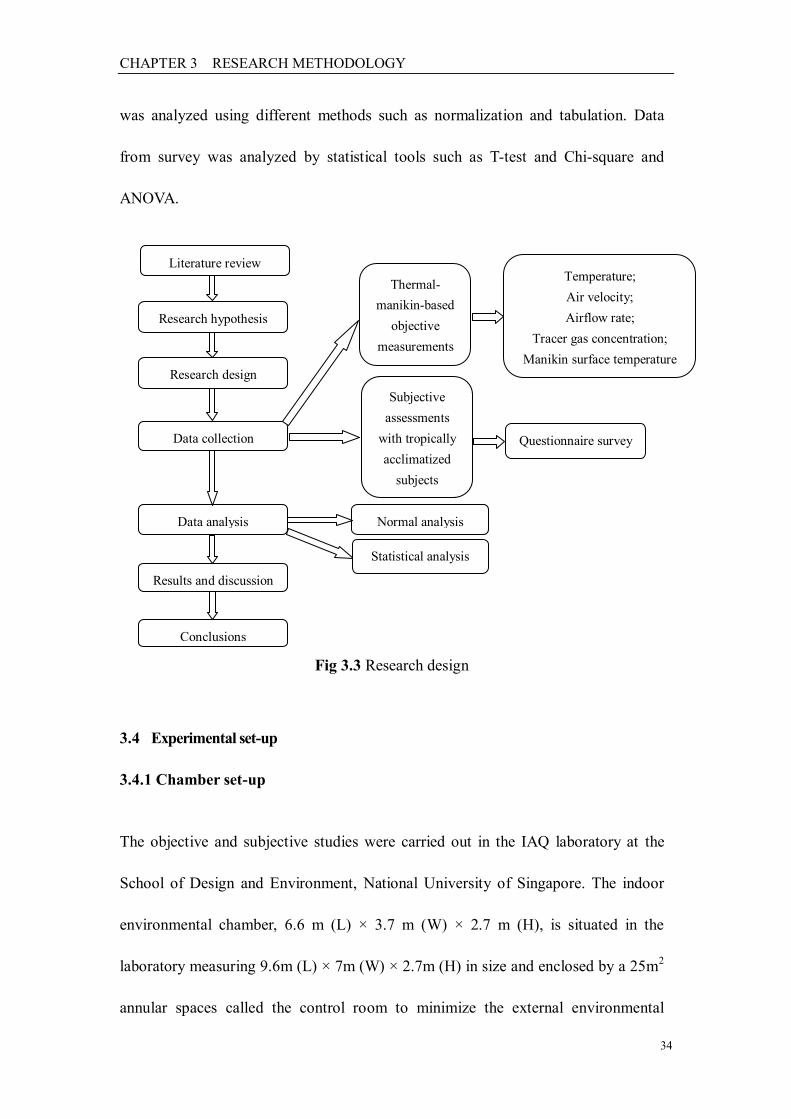
CHAPTER 3 RESEARCH METHODOLOGY
34
was analyzed using different methods such as normalization and tabulation. Data
from survey was analyzed by statistical tools such as T-test and Chi-square and
ANOVA.
Fig 3.3 Research design
3.4 Experimental set-up
3.4.1 Chamber set-up
The objective and subjective studies were carried out in the IAQ laboratory at the
School of Design and Environment, National University of Singapore. The indoor
environmental chamber, 6.6 m (L) × 3.7 m (W) × 2.7 m (H), is situated in the
laboratory measuring 9.6m (L) × 7m (W) × 2.7m (H) in size and enclosed by a 25m2
annular spaces called the control room to minimize the external environmental
Literature review
Research hypothesis
Research design
Results and discussion
Conclusions
Data collection
Data analysis
Thermal-
manikin-based
objective
measurements
(DTU)
Subjective
assessments
with tropically
acclimatized
subjects
Questionnaire survey
Temperature;
Air velocity;
Airflow rate;
Tracer gas concentration;
Manikin surface temperature
Normal analysis
Statistical analysis
CHAPTER 3 RESEARCH METHODOLOGY
35
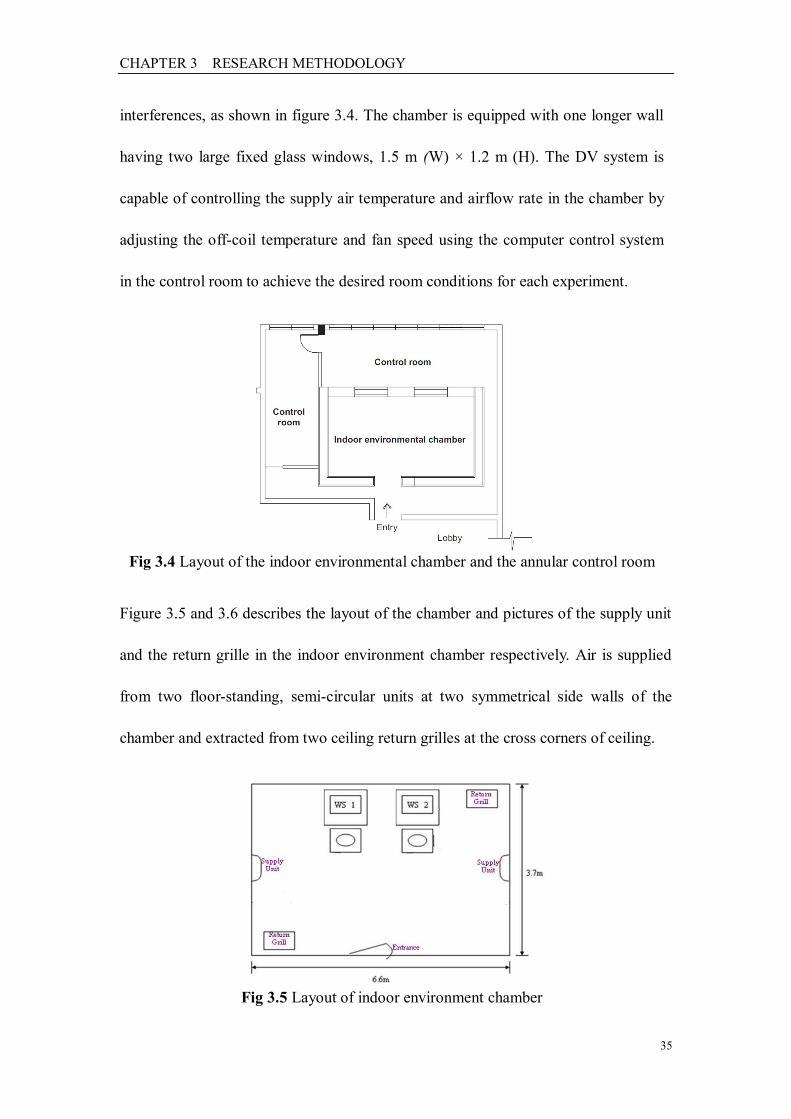
interferences, as shown in figure 3.4. The chamber is equipped with one longer wall
having two large fixed glass windows, 1.5 m (W) × 1.2 m (H). The DV system is
capable of controlling the supply air temperature and airflow rate in the chamber by
adjusting the off-coil temperature and fan speed using the computer control system
in the control room to achieve the desired room conditions for each experiment.
Fig 3.4 Layout of the indoor environmental chamber and the annular control room
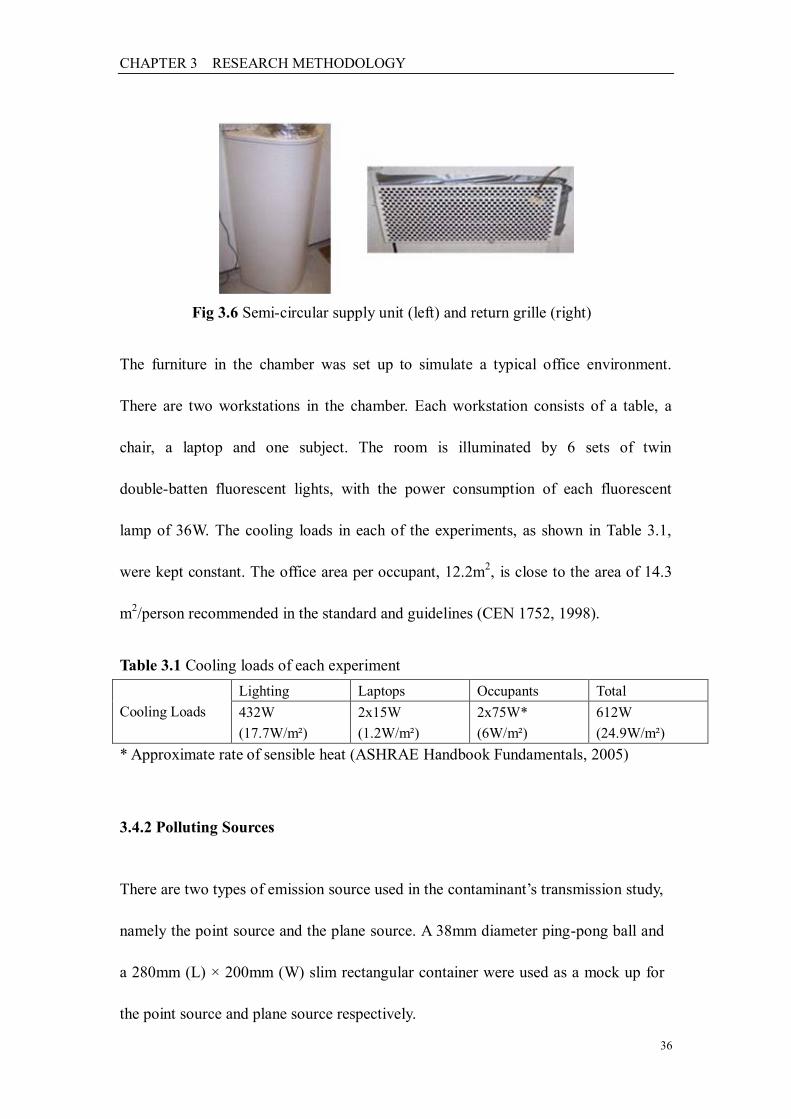
Figure 3.5 and 3.6 describes the layout of the chamber and pictures of the supply unit
and the return grille in the indoor environment chamber respectively. Air is supplied
from two floor-standing, semi-circular units at two symmetrical side walls of the
chamber and extracted from two ceiling return grilles at the cross corners of ceiling.
Fig 3.5 Layout of indoor environment chamber
CHAPTER 3 RESEARCH METHODOLOGY
36
Fig 3.6 Semi-circular supply unit (left) and return grille (right)
The furniture in the chamber was set up to simulate a typical office environment.
There are two workstations in the chamber. Each workstation consists of a table, a
chair, a laptop and one subject. The room is illuminated by 6 sets of twin
double-batten fluorescent lights, with the power consumption of each fluorescent
lamp of 36W. The cooling loads in each of the experiments, as shown in Table 3.1,
were kept constant. The office area per occupant, 12.2m2, is close to the area of 14.3
m2/person recommended in the standard and guidelines (CEN 1752, 1998).
Table 3.1 Cooling loads of each experiment
Cooling Loads
Lighting Laptops Occupants Total
432W
(17.7W/m²)
2x15W
(1.2W/m²)
2x75W*
(6W/m²)
612W
(24.9W/m²)
* Approximate rate of sensible heat (ASHRAE Handbook Fundamentals, 2005)
3.4.2 Polluting Sources
There are two types of emission source used in the contaminant‟s transmission study,
namely the point source and the plane source. A 38mm diameter ping-pong ball and
a 280mm (L) × 200mm (W) slim rectangular container were used as a mock up for
the point source and plane source respectively.
CHAPTER 3 RESEARCH METHODOLOGY
37
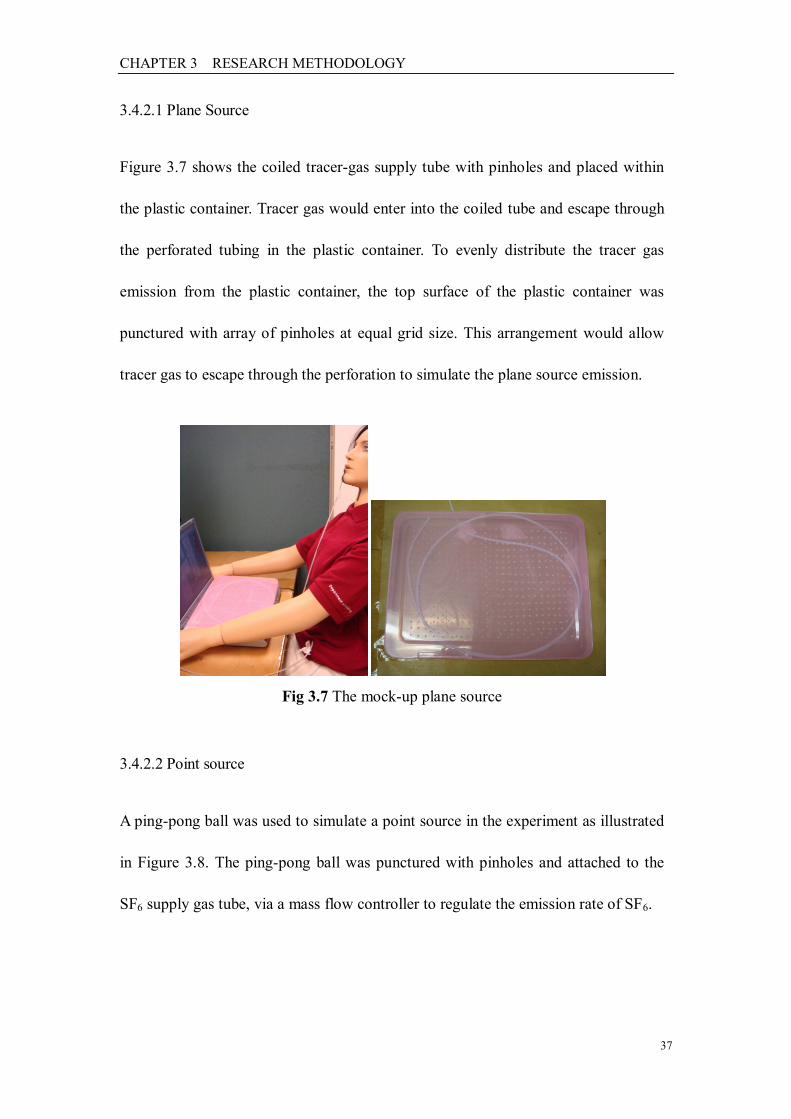
3.4.2.1 Plane Source
Figure 3.7 shows the coiled tracer-gas supply tube with pinholes and placed within
the plastic container. Tracer gas would enter into the coiled tube and escape through
the perforated tubing in the plastic container. To evenly distribute the tracer gas
emission from the plastic container, the top surface of the plastic container was
punctured with array of pinholes at equal grid size. This arrangement would allow
tracer gas to escape through the perforation to simulate the plane source emission.
Fig 3.7 The mock-up plane source
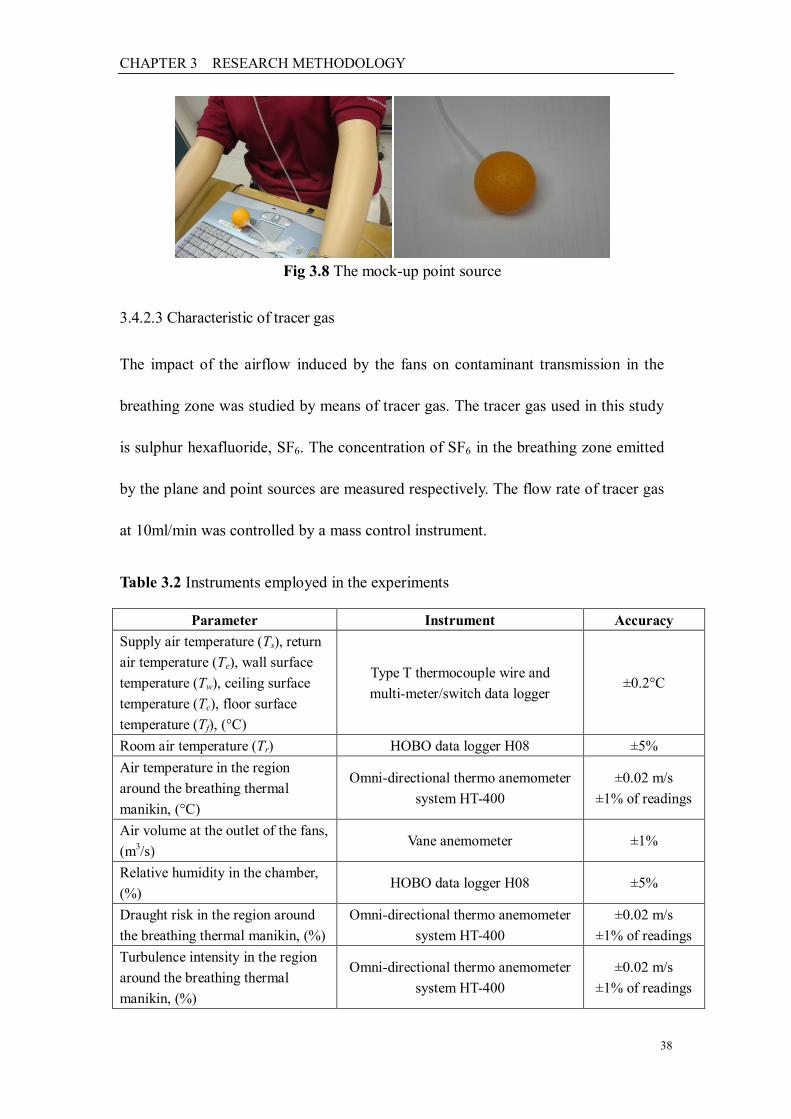
3.4.2.2 Point source
A ping-pong ball was used to simulate a point source in the experiment as illustrated
in Figure 3.8. The ping-pong ball was punctured with pinholes and attached to the
SF6 supply gas tube, via a mass flow controller to regulate the emission rate of SF6.
CHAPTER 3 RESEARCH METHODOLOGY
38
Fig 3.8 The mock-up point source
3.4.2.3 Characteristic of tracer gas
The impact of the airflow induced by the fans on contaminant transmission in the
breathing zone was studied by means of tracer gas. The tracer gas used in this study
is sulphur hexafluoride, SF6. The concentration of SF6 in the breathing zone emitted
by the plane and point sources are measured respectively. The flow rate of tracer gas
at 10ml/min was controlled by a mass control instrument.
Table 3.2 Instruments employed in the experiments
Parameter Instrument Accuracy
Supply air temperature (Ts), return
air temperature (Te), wall surface
temperature (Tw), ceiling surface
temperature (Tc), floor surface
temperature (Tf), (°C)
Type T thermocouple wire and
multi-meter/switch data logger ±0.2°C
Room air temperature (Tr) HOBO data logger H08 ±5%
Air temperature in the region
around the breathing thermal
manikin, (°C)
Omni-directional thermo anemometer
system HT-400
±0.02 m/s
±1% of readings
Air volume at the outlet of the fans,
(m3/s)
Vane anemometer ±1%
Relative humidity in the chamber,
(%) HOBO data logger H08 ±5%
Draught risk in the region around
the breathing thermal manikin, (%)
Omni-directional thermo anemometer
system HT-400
±0.02 m/s
±1% of readings
Turbulence intensity in the region
around the breathing thermal
manikin, (%)
Omni-directional thermo anemometer
system HT-400
±0.02 m/s
±1% of readings
CHAPTER 3 RESEARCH METHODOLOGY
39
3.4.3 Instrumentations
The instruments used for the experiments are listed in Table 3.2.
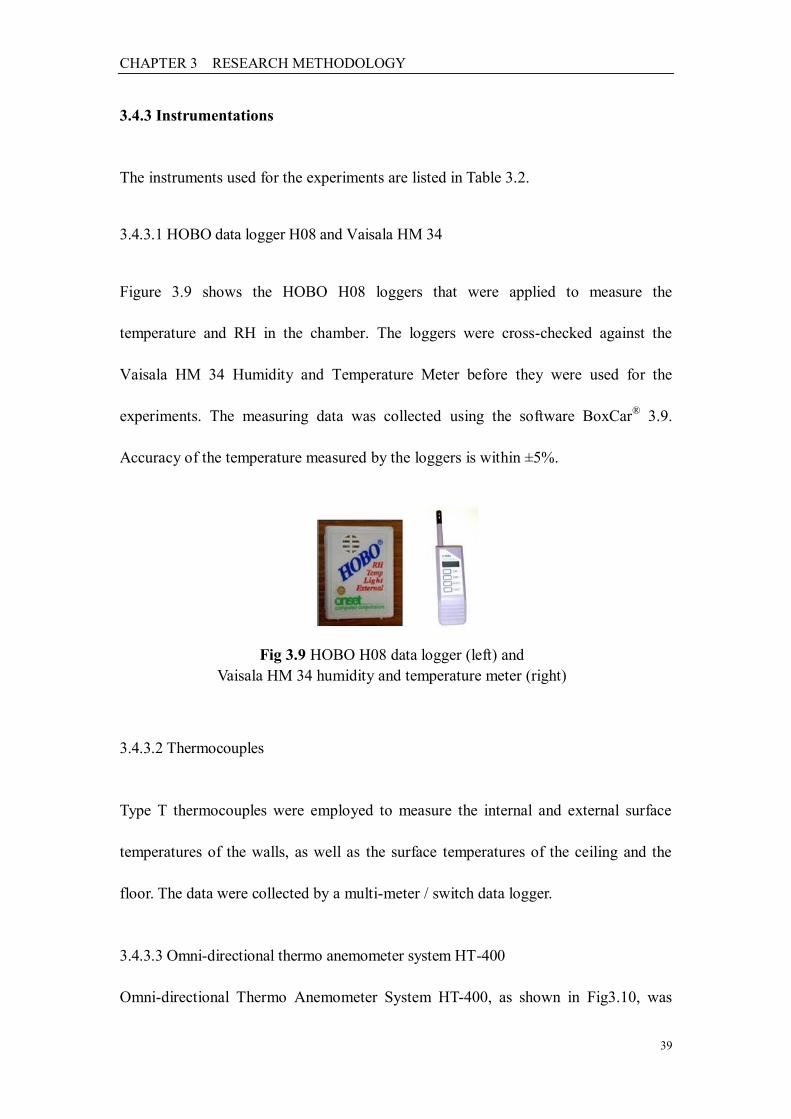
3.4.3.1 HOBO data logger H08 and Vaisala HM 34
Figure 3.9 shows the HOBO H08 loggers that were applied to measure the
temperature and RH in the chamber. The loggers were cross-checked against the
Vaisala HM 34 Humidity and Temperature Meter before they were used for the
experiments. The measuring data was collected using the software BoxCar® 3.9.
Accuracy of the temperature measured by the loggers is within ±5%.
Fig 3.9 HOBO H08 data logger (left) and
Vaisala HM 34 humidity and temperature meter (right)
3.4.3.2 Thermocouples
Type T thermocouples were employed to measure the internal and external surface
temperatures of the walls, as well as the surface temperatures of the ceiling and the
floor. The data were collected by a multi-meter / switch data logger.
3.4.3.3 Omni-directional thermo anemometer system HT-400
Omni-directional Thermo Anemometer System HT-400, as shown in Fig3.10, was
CHAPTER 3 RESEARCH METHODOLOGY
40
used to measure the air temperature around the thermal manikin. They were
cross-checked against the Vaisala Humidity and Temperature Meter before the
experiments as well. The data was logged and stored in the computer. The accuracy of
temperature measured by Omni-directional Thermo Anemometers is within ±1%.
Fig 3.10 Omni-directional thermo anemometer system HT-400
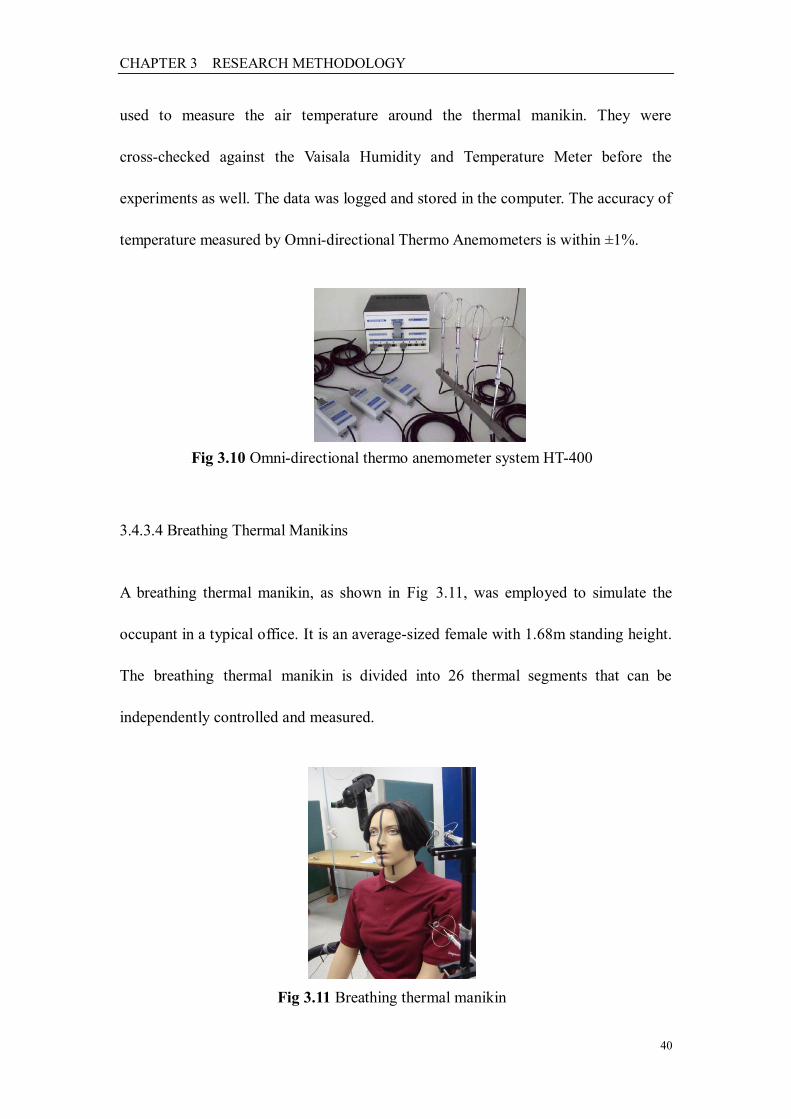
3.4.3.4 Breathing Thermal Manikins
A breathing thermal manikin, as shown in Fig 3.11, was employed to simulate the
occupant in a typical office. It is an average-sized female with 1.68m standing height.
The breathing thermal manikin is divided into 26 thermal segments that can be
independently controlled and measured.
Fig 3.11 Breathing thermal manikin
CHAPTER 3 RESEARCH METHODOLOGY
41
The manikin is controlled by software that has four control modes, namely only
measuring the surface temperature of the body segments-no heat, constant fixed
surface temperature, constant heat flux from each body segment and the comfort
mode that heat loss from manikin‟s body following Fanger‟s comfort equation
(Fanger 1972). The comfort mode is adopted in this study. In this mode, the surface
temperatures of different body segments of the thermal manikin can be adjusted to
adapt to the environment according to Equation 3-1. Thus the manikin is always in a
thermally neutral state.
Teq = 36.4 – C × Qt
(3-1)
Where,
eqT - Manikin-based equivalent temperature [°C];
Qt - Rate of heat loss [W/m2];
36.4 - Deep body temperature [°C]; and
C - A constant depending on clothing, posture, chamber characteristics, etc
[m2∙°C/W].
The calibration of Teq was performed in the indoor environment chamber where the
manikin was dressed and positioned as it was during the experiments. The manikin
was exposed to several equivalent temperatures with no obvious vertical temperature
difference (Yu, 2004). Air temperatures and velocities were measured at 0.1, 0.6, 0.8
and 1.1 m height. Air movement was almost still during the calibrations with the
mean air velocities at the four heights was less than 0.1 m/s. Homogeneous conditions
CHAPTER 3 RESEARCH METHODOLOGY
42
was achieved when the air temperature was equal to the mean radiant temperature, air
temperature gradients and radiant temperature asymmetry in all three directions were
negligible, air was still (natural convection only) and the air humidity was constant.
Under this condition, Teq was equal to the air temperature. After steady conditions had
been reached at the equivalent temperatures, the heat loss from each body segment
was recorded and the values obtained were used to derive a linear function for each
body segment:
Teq = A – B × Qt (3-2)
Where, A, B are constants, with the dimensions ºC and K∙m2/W, respectively. The
coefficients A and B that were obtained for each body segment are shown in
Appendix A.
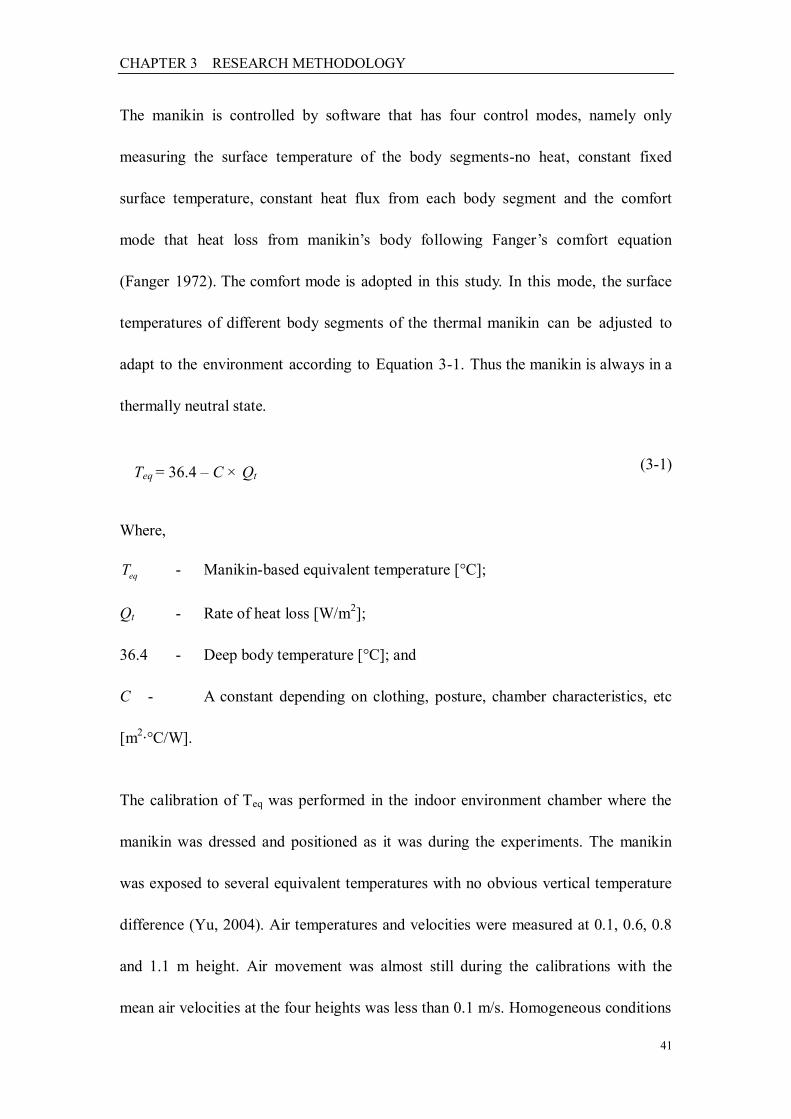
In the pollutant transportation study, the breathing mode was switched on. Thus the
artificial lung equipped for the manikin was used to simulate the breathing of
occupies. The supply and exhaust of respiration air were connected through the right
side of its waist, as shown in Figure 3.12.
Fig 3.12 The connection of the supply and exhaust air respiration of thermal manikin
CHAPTER 3 RESEARCH METHODOLOGY
43
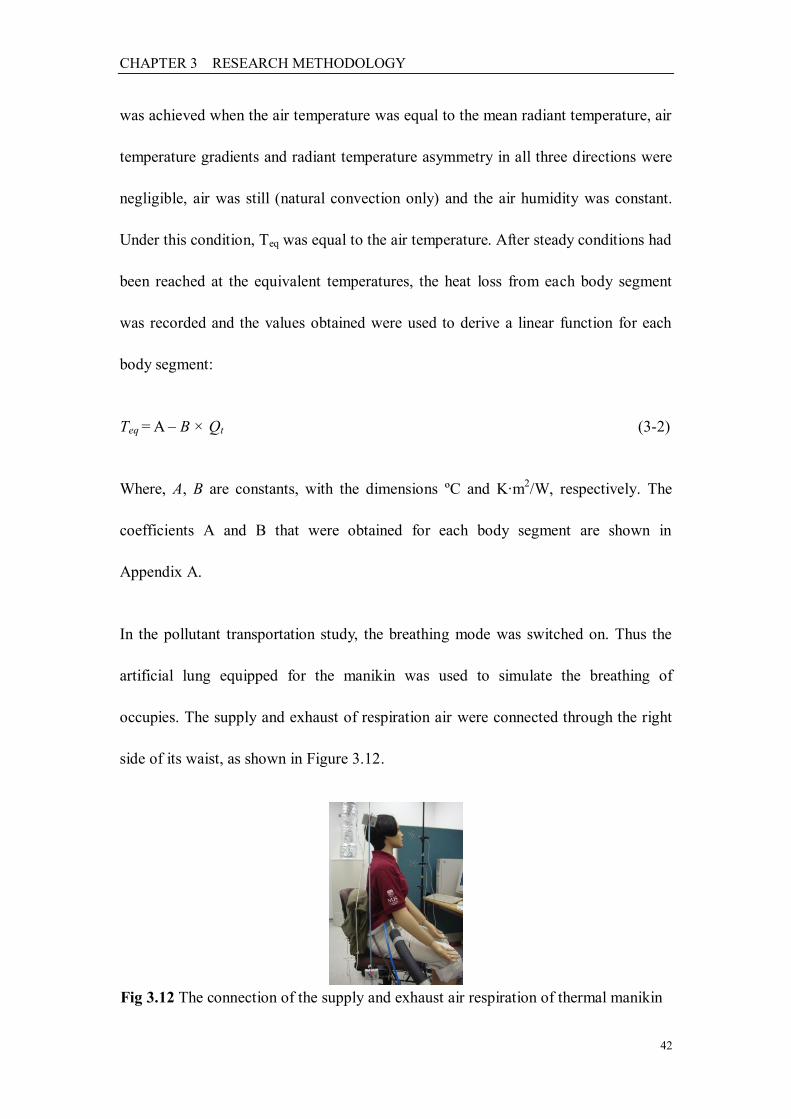
The lung system which was placed outside the body of manikin was connected via
flexible tubing to deliver and retrieve the respiration air in a closed circuit. The
breathing cycle (inhalation, exhalation and pause) and the amount of respiration air as
well as the temperature and humidity of the exhaled air could be controlled.
In this study, the lung was adjusted to simulate the breathing of an average sedentary
person performing light physical activities. The breathing cycle during the
experiments consisted of 2.5s inhalation, 2.5s exhalation and 1s pause. The breathing
frequency was approximately 10 breaths per minute and the pulmonary ventilation
was 6 L/min, or 0.6 L per breath. The instantaneous was calculated at 0.6 L / 2.5 s =
0.24 L/s = 14.4 L/min.
The exhaled air was not humidified in this study, but was heated to a density close to
1.144 kg/m3 which is believed to be similar to the exhaled air from a human subject
based on the assumption on the exhaled air properties. Höpp (1981) assumed that the
exhaled air consisted of 78.1 vol.% N2O, 17.3 vol.% O2, 3.6 vol.% CO2 and 0.9 vol.%
of Air, provided the exhaled air temperature was approximately 34 °C when the room
air temperature was between 20 °C and 26 °C, and the relative humidity was close to
95%. The control box of the manikin‟s lung system is shown in Figure 3. 13.
Figure 3.13 Control box of the lung system
CHAPTER 3 RESEARCH METHODOLOGY
44
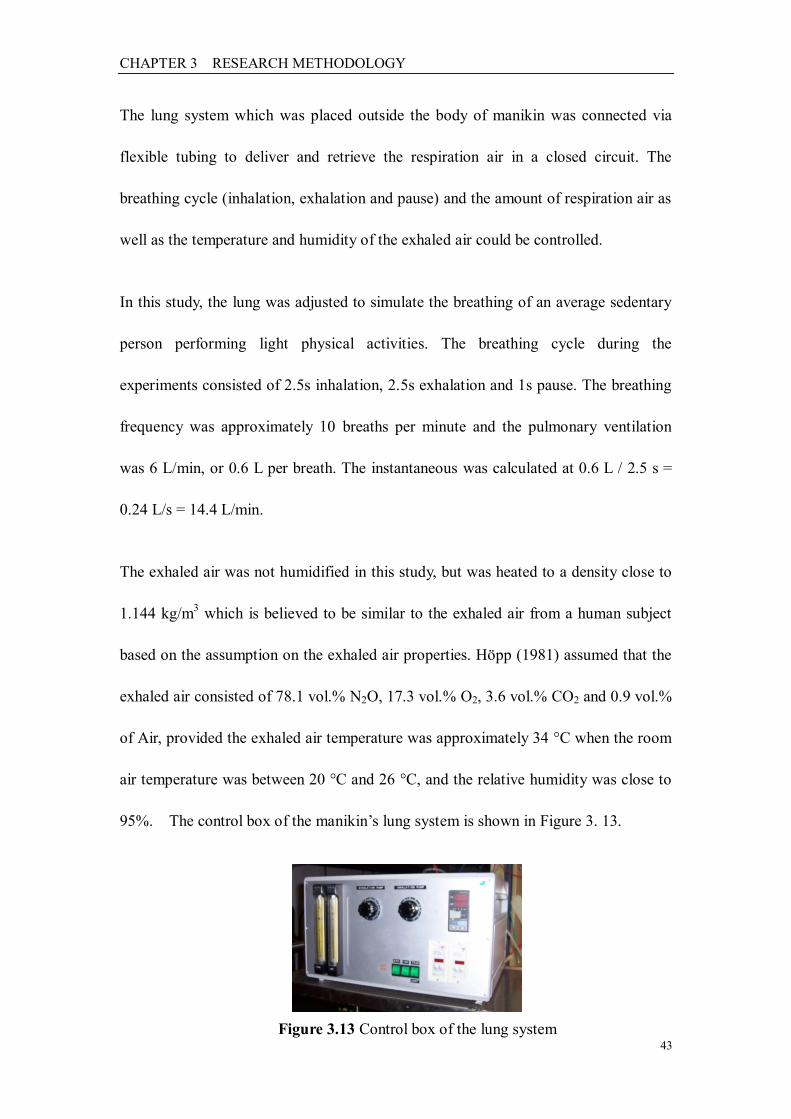
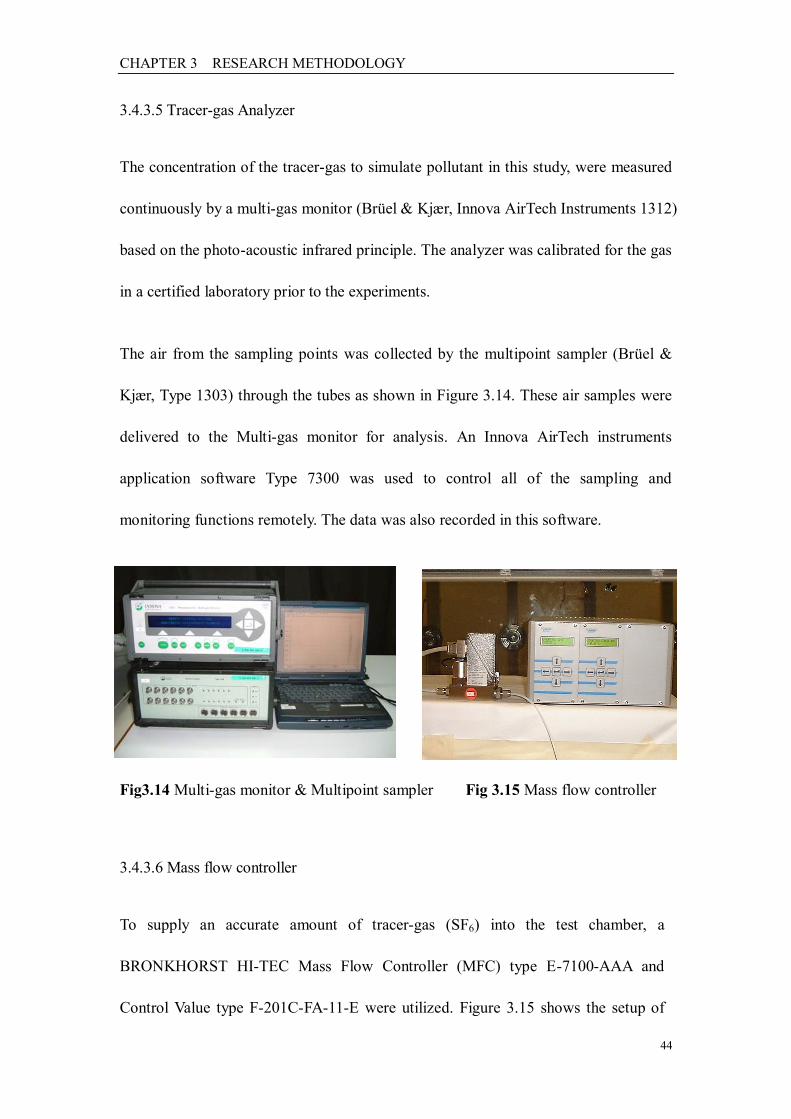
3.4.3.5 Tracer-gas Analyzer
The concentration of the tracer-gas to simulate pollutant in this study, were measured
continuously by a multi-gas monitor (Brüel & Kjær, Innova AirTech Instruments 1312)
based on the photo-acoustic infrared principle. The analyzer was calibrated for the gas
in a certified laboratory prior to the experiments.
The air from the sampling points was collected by the multipoint sampler (Brüel &
Kjær, Type 1303) through the tubes as shown in Figure 3.14. These air samples were
delivered to the Multi-gas monitor for analysis. An Innova AirTech instruments
application software Type 7300 was used to control all of the sampling and
monitoring functions remotely. The data was also recorded in this software.
Fig3.14 Multi-gas monitor & Multipoint sampler Fig 3.15 Mass flow controller
3.4.3.6 Mass flow controller
To supply an accurate amount of tracer-gas (SF6) into the test chamber, a
BRONKHORST HI-TEC Mass Flow Controller (MFC) type E-7100-AAA and
Control Value type F-201C-FA-11-E were utilized. Figure 3.15 shows the setup of
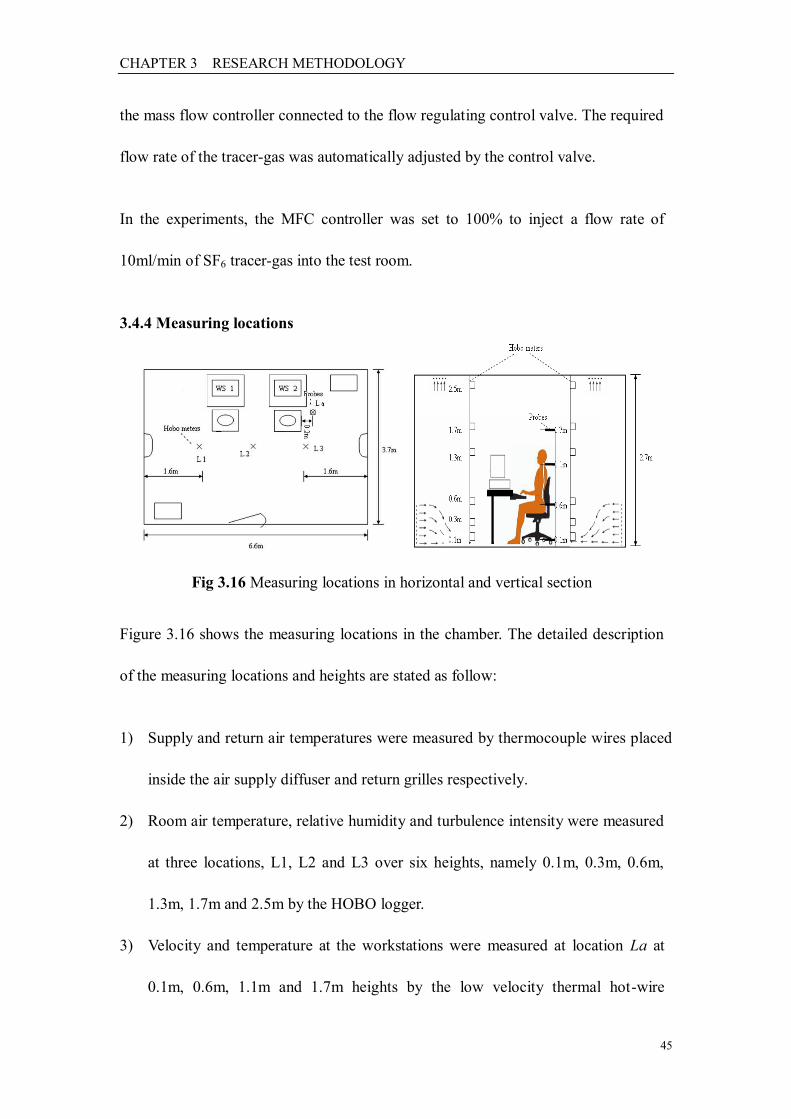
CHAPTER 3 RESEARCH METHODOLOGY
45
the mass flow controller connected to the flow regulating control valve. The required
flow rate of the tracer-gas was automatically adjusted by the control valve.
In the experiments, the MFC controller was set to 100% to inject a flow rate of
10ml/min of SF6 tracer-gas into the test room.
3.4.4 Measuring locations
Fig 3.16 Measuring locations in horizontal and vertical section
Figure 3.16 shows the measuring locations in the chamber. The detailed description
of the measuring locations and heights are stated as follow:
1) Supply and return air temperatures were measured by thermocouple wires placed
inside the air supply diffuser and return grilles respectively.
2) Room air temperature, relative humidity and turbulence intensity were measured
at three locations, L1, L2 and L3 over six heights, namely 0.1m, 0.3m, 0.6m,
1.3m, 1.7m and 2.5m by the HOBO logger.
3) Velocity and temperature at the workstations were measured at location La at
0.1m, 0.6m, 1.1m and 1.7m heights by the low velocity thermal hot-wire
CHAPTER 3 RESEARCH METHODOLOGY
46
anemometer.
In addition, for the final set of pollutant‟s transportation experiment, additional
measuring locations are set as follow:
4) The breathing thermal manikin was seated at workstation 2.
5) The plane and point source was placed on the laptop in front of manikin.
6) Concentration of SF6 was measured at the inhaled zone of breathing thermal
manikin at 20mm to her nose, the supply air diffuser and return grill.
3.4.5 Experimental conditions
There are three sets of experiments in this study. The first set of experiments, as
shown in Table 3.3, is a continuation of the experiments where Sun (2010) stops with
the 4-fan system. Both objective measurement and subjective assessment was
conducted to investigate the vertical temperature profiles and thermal acceptability
by varying the supply air temperature of 22±0.5 and 24±0.5°C in two experiments: (i)
base case is without fans; and (ii) with fans - air speed is low, middle and high and
angles at 0°, 30°, and 60°. The results will be compared with the study by Sun (2010)
at 26±0.5°C. The second set of the experiments, as shown in Table 3.4, consists of
both the objective measurement using thermal manikin and subjective study for the
2-fan system. The vertical temperature profiles and thermal acceptability was
investigated by varying the supply air temperature of 22±0.5, 24±0.5 and 26±0.5°C
in two experiments: (i) base case is without fans; and (ii) with fans - air speed can be
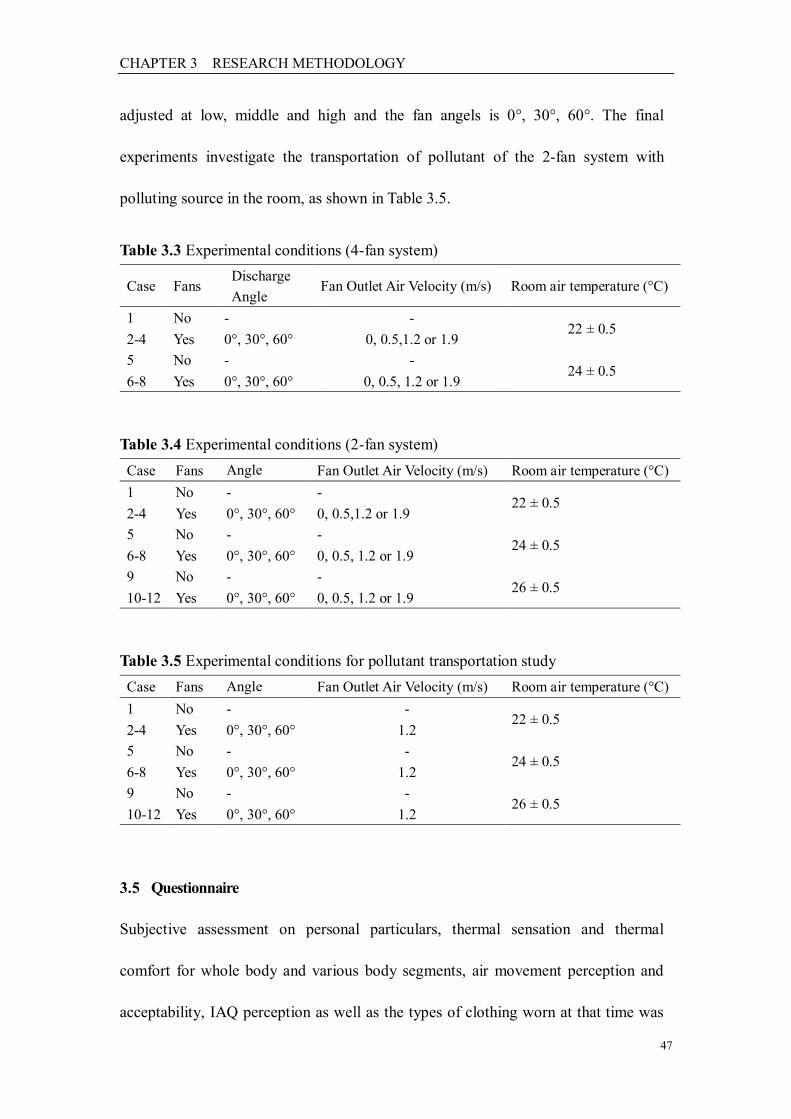
CHAPTER 3 RESEARCH METHODOLOGY
47
adjusted at low, middle and high and the fan angels is 0°, 30°, 60°. The final
experiments investigate the transportation of pollutant of the 2-fan system with
polluting source in the room, as shown in Table 3.5.
Table 3.3 Experimental conditions (4-fan system)
Case Fans Discharge
Angle Fan Outlet Air Velocity (m/s) Room air temperature (°C)
1 No - - 22 ± 0.5
2-4 Yes 0°, 30°, 60° 0, 0.5,1.2 or 1.9
5 No - - 24 ± 0.5
6-8 Yes 0°, 30°, 60° 0, 0.5, 1.2 or 1.9
Table 3.4 Experimental conditions (2-fan system)
Case Fans Angle Fan Outlet Air Velocity (m/s) Room air temperature (°C)
1 No - - 22 ± 0.5
2-4 Yes 0°, 30°, 60° 0, 0.5,1.2 or 1.9
5 No - - 24 ± 0.5
6-8 Yes 0°, 30°, 60° 0, 0.5, 1.2 or 1.9
9 No - - 26 ± 0.5
10-12 Yes 0°, 30°, 60° 0, 0.5, 1.2 or 1.9
Table 3.5 Experimental conditions for pollutant transportation study
Case Fans Angle Fan Outlet Air Velocity (m/s) Room air temperature (°C)
1 No - - 22 ± 0.5
2-4 Yes 0°, 30°, 60° 1.2
5 No - - 24 ± 0.5
6-8 Yes 0°, 30°, 60° 1.2
9 No - - 26 ± 0.5
10-12 Yes 0°, 30°, 60° 1.2
3.5 Questionnaire
Subjective assessment on personal particulars, thermal sensation and thermal
comfort for whole body and various body segments, air movement perception and
acceptability, IAQ perception as well as the types of clothing worn at that time was
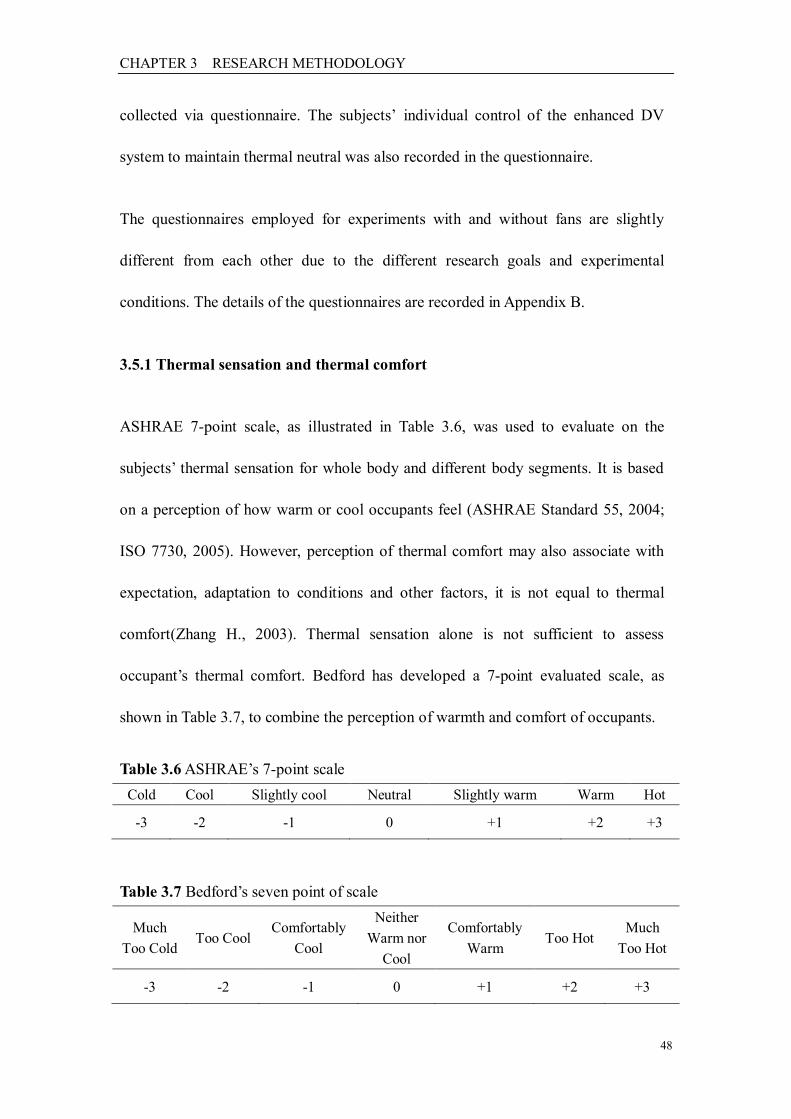
CHAPTER 3 RESEARCH METHODOLOGY
48
collected via questionnaire. The subjects‟ individual control of the enhanced DV
system to maintain thermal neutral was also recorded in the questionnaire.
The questionnaires employed for experiments with and without fans are slightly
different from each other due to the different research goals and experimental
conditions. The details of the questionnaires are recorded in Appendix B.
3.5.1 Thermal sensation and thermal comfort
ASHRAE 7-point scale, as illustrated in Table 3.6, was used to evaluate on the
subjects‟ thermal sensation for whole body and different body segments. It is based
on a perception of how warm or cool occupants feel (ASHRAE Standard 55, 2004;
ISO 7730, 2005). However, perception of thermal comfort may also associate with
expectation, adaptation to conditions and other factors, it is not equal to thermal
comfort(Zhang H., 2003). Thermal sensation alone is not sufficient to assess
occupant‟s thermal comfort. Bedford has developed a 7-point evaluated scale, as
shown in Table 3.7, to combine the perception of warmth and comfort of occupants.
Table 3.6 ASHRAE‟s 7-point scale
Cold Cool Slightly cool Neutral Slightly warm Warm Hot
-3 -2 -1 0 +1 +2 +3
Table 3.7 Bedford‟s seven point of scale
Much
Too Cold Too Cool
Comfortably
Cool
Neither
Warm nor
Cool
Comfortably
Warm Too Hot
Much
Too Hot
-3 -2 -1 0 +1 +2 +3
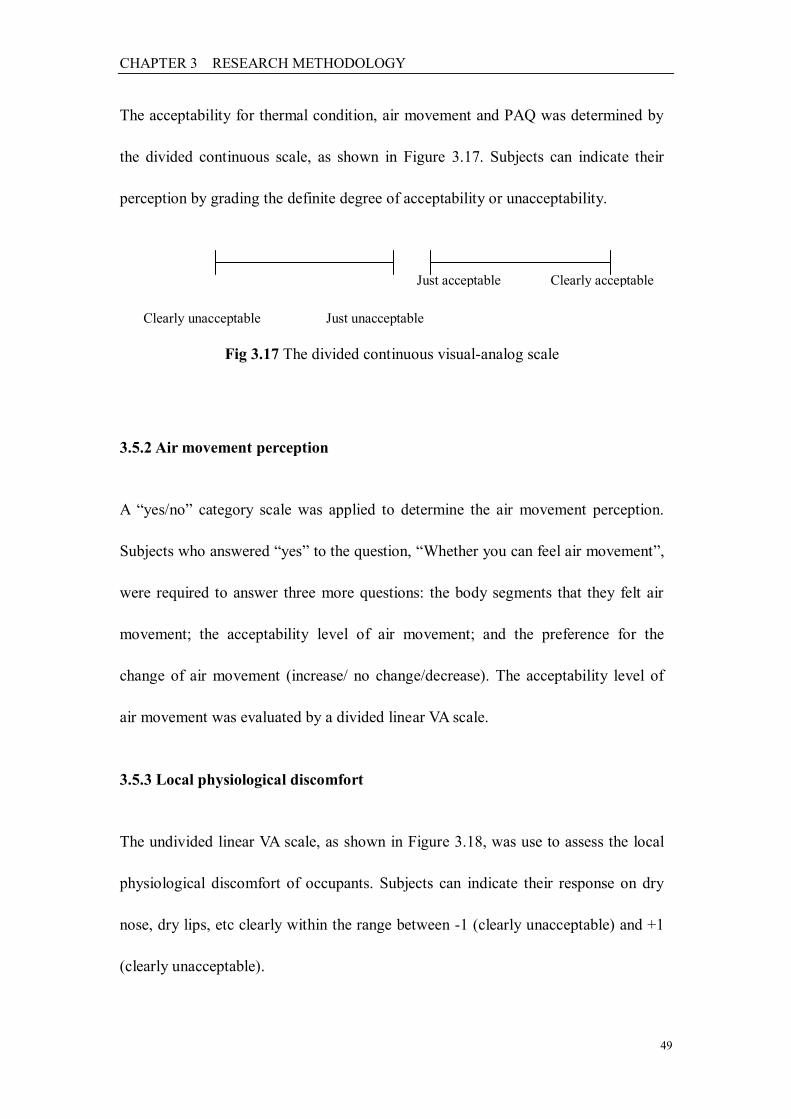
CHAPTER 3 RESEARCH METHODOLOGY
49
The acceptability for thermal condition, air movement and PAQ was determined by
the divided continuous scale, as shown in Figure 3.17. Subjects can indicate their
perception by grading the definite degree of acceptability or unacceptability.
Fig 3.17 The divided continuous visual-analog scale
3.5.2 Air movement perception
A “yes/no” category scale was applied to determine the air movement perception.
Subjects who answered “yes” to the question, “Whether you can feel air movement”,
were required to answer three more questions: the body segments that they felt air
movement; the acceptability level of air movement; and the preference for the
change of air movement (increase/ no change/decrease). The acceptability level of
air movement was evaluated by a divided linear VA scale.
3.5.3 Local physiological discomfort
The undivided linear VA scale, as shown in Figure 3.18, was use to assess the local
physiological discomfort of occupants. Subjects can indicate their response on dry
nose, dry lips, etc clearly within the range between -1 (clearly unacceptable) and +1
(clearly unacceptable).
Clearly unacceptable Just unacceptable
Clearly acceptable Just acceptable
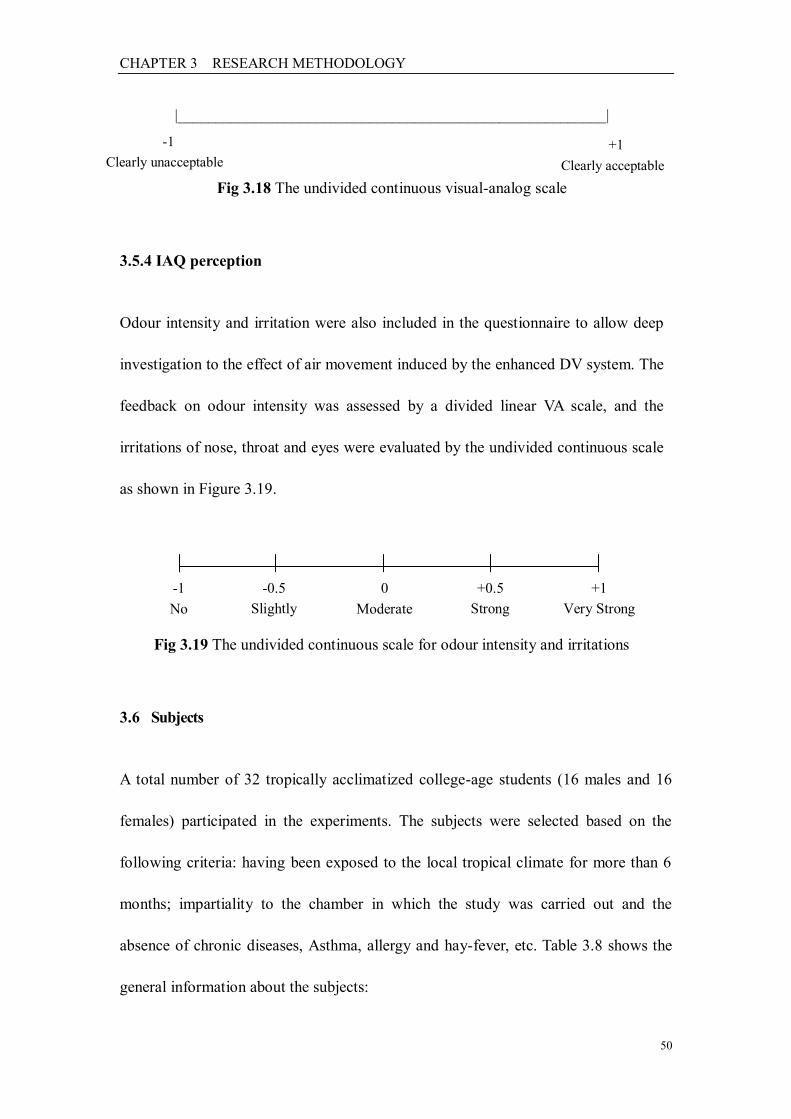
CHAPTER 3 RESEARCH METHODOLOGY
50
|________________________________________________________|
Fig 3.18 The undivided continuous visual-analog scale
3.5.4 IAQ perception
Odour intensity and irritation were also included in the questionnaire to allow deep
investigation to the effect of air movement induced by the enhanced DV system. The
feedback on odour intensity was assessed by a divided linear VA scale, and the
irritations of nose, throat and eyes were evaluated by the undivided continuous scale
as shown in Figure 3.19.
Fig 3.19 The undivided continuous scale for odour intensity and irritations
3.6 Subjects
A total number of 32 tropically acclimatized college-age students (16 males and 16
females) participated in the experiments. The subjects were selected based on the
following criteria: having been exposed to the local tropical climate for more than 6
months; impartiality to the chamber in which the study was carried out and the
absence of chronic diseases, Asthma, allergy and hay-fever, etc. Table 3.8 shows the
general information about the subjects:
-1
Clearly unacceptable
+1
Clearly acceptable
-1
No
-0.5
Slightly
0
Moderate
+0.5
Strong
+1
Very Strong
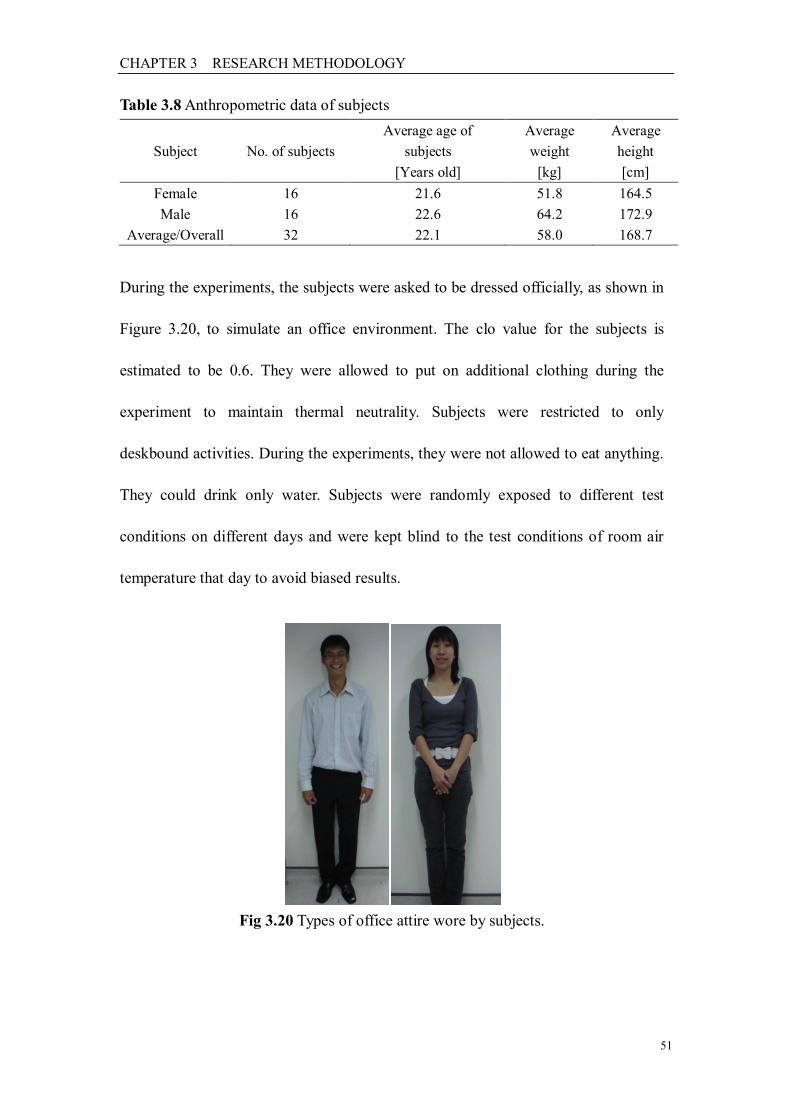
CHAPTER 3 RESEARCH METHODOLOGY
51
Table 3.8 Anthropometric data of subjects
Subject No. of subjects
Average age of
subjects
[Years old]
Average
weight
[kg]
Average
height
[cm]
Female 16 21.6 51.8 164.5
Male 16 22.6 64.2 172.9
Average/Overall 32 22.1 58.0 168.7
During the experiments, the subjects were asked to be dressed officially, as shown in
Figure 3.20, to simulate an office environment. The clo value for the subjects is
estimated to be 0.6. They were allowed to put on additional clothing during the
experiment to maintain thermal neutrality. Subjects were restricted to only
deskbound activities. During the experiments, they were not allowed to eat anything.
They could drink only water. Subjects were randomly exposed to different test
conditions on different days and were kept blind to the test conditions of room air
temperature that day to avoid biased results.
Fig 3.20 Types of office attire wore by subjects.
CHAPTER 3 RESEARCH METHODOLOGY
52
3.7 Method of data collection
3.7.1 Objective measurement
Objective measurements started 10 minutes prior to each experiment and ended 10
minutes after the experiment. The data of the objective measurements were logged
simultaneously during each experiment. The logging intervals of various parameters
are stated as follow:
1) Temperature:
a. Hobometers: 5 minutes
b. Omni-directional thermo anemometer system HT-400: 10 seconds
2) Relative humidity: 5 minutes
3) Air velocity: 10 seconds
The following parameters were kept constant during each experiment:
a) Position of the temperature and relative humidity measuring points
b) Location of the air diffusers and return grilles
c) Supply air flow rate, 30L/s
d) Cooling loads in the chamber
3.7.2 Subjective assessment
The duration of each experiment was 1.5 hours. During the experiments, the subjects
were allowed to put on additional clothing and free to adjust speed of the fan to
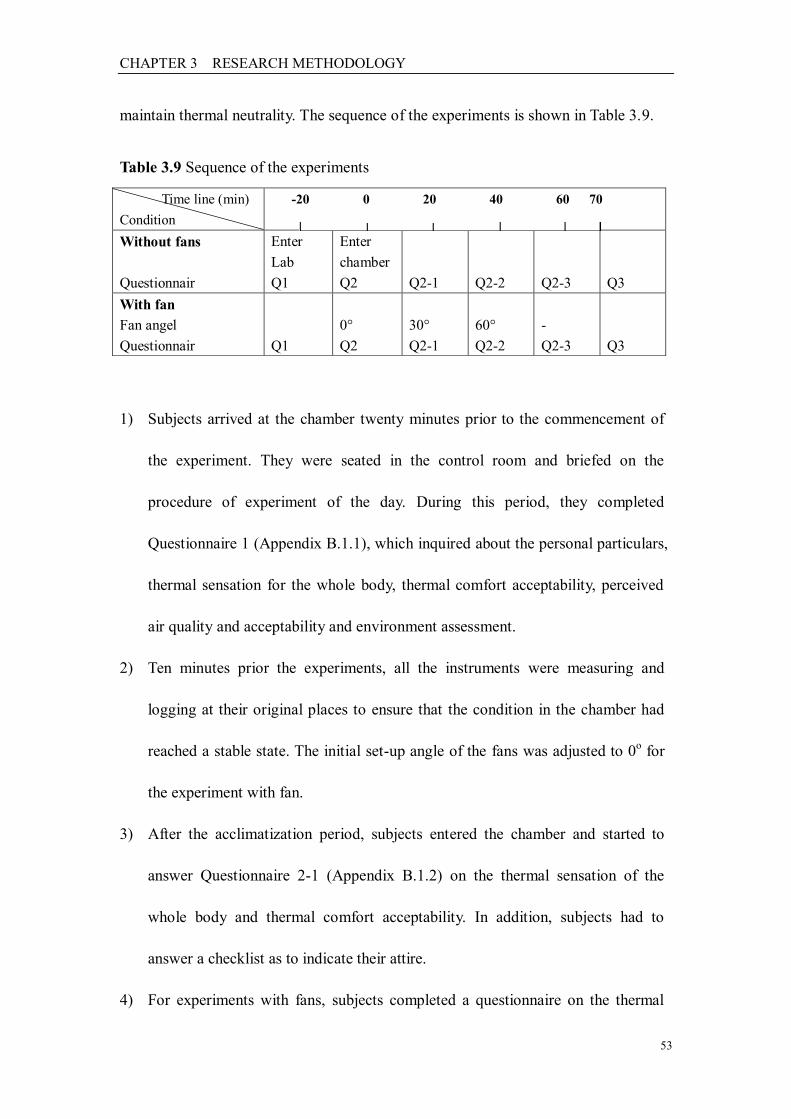
CHAPTER 3 RESEARCH METHODOLOGY
53
maintain thermal neutrality. The sequence of the experiments is shown in Table 3.9.
Table 3.9 Sequence of the experiments
1) Subjects arrived at the chamber twenty minutes prior to the commencement of
the experiment. They were seated in the control room and briefed on the
procedure of experiment of the day. During this period, they completed
Questionnaire 1 (Appendix B.1.1), which inquired about the personal particulars,
thermal sensation for the whole body, thermal comfort acceptability, perceived
air quality and acceptability and environment assessment.
2) Ten minutes prior the experiments, all the instruments were measuring and
logging at their original places to ensure that the condition in the chamber had
reached a stable state. The initial set-up angle of the fans was adjusted to 0o for
the experiment with fan.
3) After the acclimatization period, subjects entered the chamber and started to
answer Questionnaire 2-1 (Appendix B.1.2) on the thermal sensation of the
whole body and thermal comfort acceptability. In addition, subjects had to
answer a checklist as to indicate their attire.
4) For experiments with fans, subjects completed a questionnaire on the thermal
Time line (min)
Condition
-20 0 20 40 60 70
Without fans
Questionnair
Enter
Lab
Q1
Enter
chamber
Q2
Q2-1
Q2-2
Q2-3
Q3
With fan
Fan angel
Questionnair
Q1
0°
Q2
30°
Q2-1
60°
Q2-2
-
Q2-3
Q3
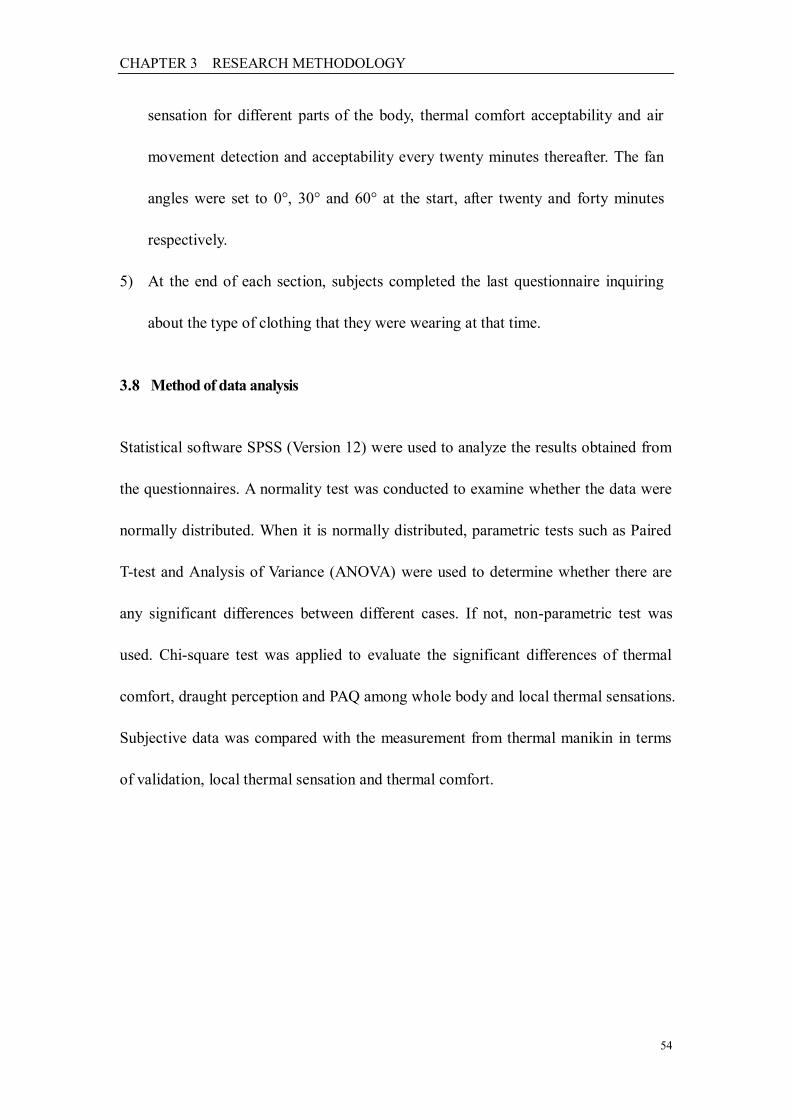
CHAPTER 3 RESEARCH METHODOLOGY
54
sensation for different parts of the body, thermal comfort acceptability and air
movement detection and acceptability every twenty minutes thereafter. The fan
angles were set to 0°, 30° and 60° at the start, after twenty and forty minutes
respectively.
5) At the end of each section, subjects completed the last questionnaire inquiring
about the type of clothing that they were wearing at that time.
3.8 Method of data analysis
Statistical software SPSS (Version 12) were used to analyze the results obtained from
the questionnaires. A normality test was conducted to examine whether the data were
normally distributed. When it is normally distributed, parametric tests such as Paired
T-test and Analysis of Variance (ANOVA) were used to determine whether there are
any significant differences between different cases. If not, non-parametric test was
used. Chi-square test was applied to evaluate the significant differences of thermal
comfort, draught perception and PAQ among whole body and local thermal sensations.
Subjective data was compared with the measurement from thermal manikin in terms
of validation, local thermal sensation and thermal comfort.
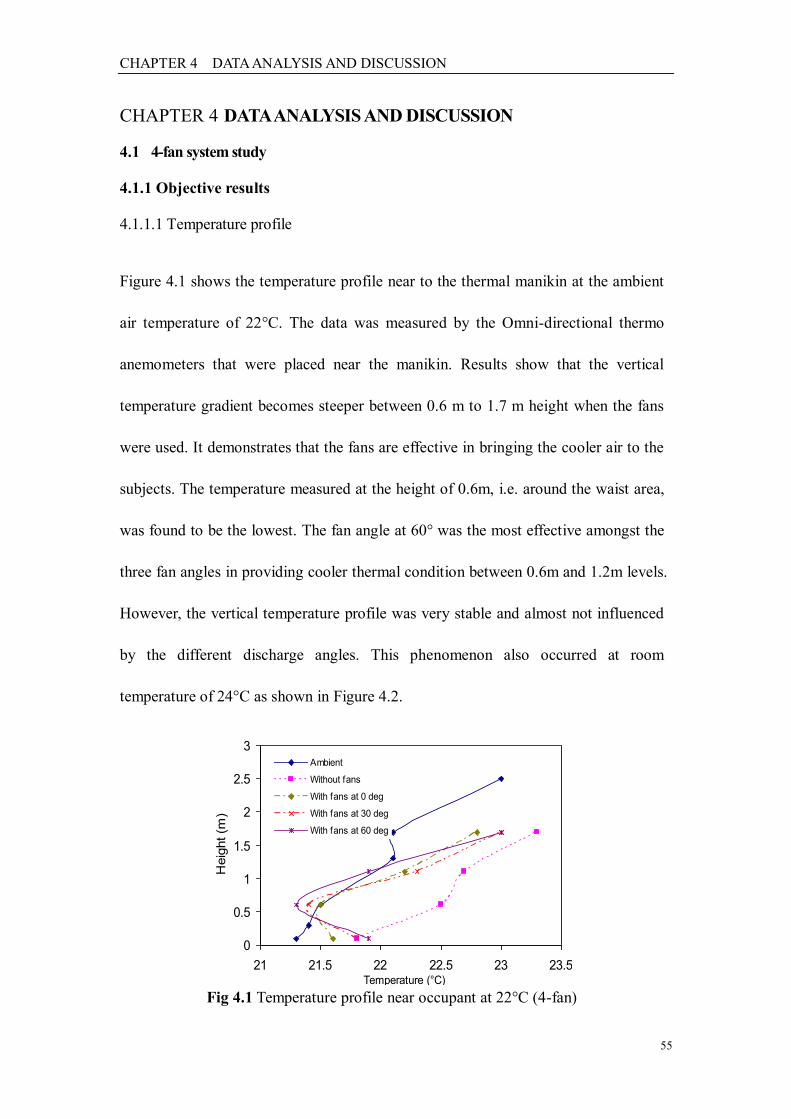
CHAPTER 4 DATA ANALYSIS AND DISCUSSION
55
CHAPTER 4 DATA ANALYSIS AND DISCUSSION
4.1 4-fan system study
4.1.1 Objective results
4.1.1.1 Temperature profile
Figure 4.1 shows the temperature profile near to the thermal manikin at the ambient
air temperature of 22°C. The data was measured by the Omni-directional thermo
anemometers that were placed near the manikin. Results show that the vertical
temperature gradient becomes steeper between 0.6 m to 1.7 m height when the fans
were used. It demonstrates that the fans are effective in bringing the cooler air to the
subjects. The temperature measured at the height of 0.6m, i.e. around the waist area,
was found to be the lowest. The fan angle at 60° was the most effective amongst the
three fan angles in providing cooler thermal condition between 0.6m and 1.2m levels.
However, the vertical temperature profile was very stable and almost not influenced
by the different discharge angles. This phenomenon also occurred at room
temperature of 24°C as shown in Figure 4.2.
Fig 4.1 Temperature profile near occupant at 22°C (4-fan)
0
0.5
1
1.5
2
2.5
3
21 21.5 22 22.5 23 23.5Temperature (°C)
Heig
ht (m
)
Ambient
Without fans
With fans at 0 deg
With fans at 30 deg
With fans at 60 deg
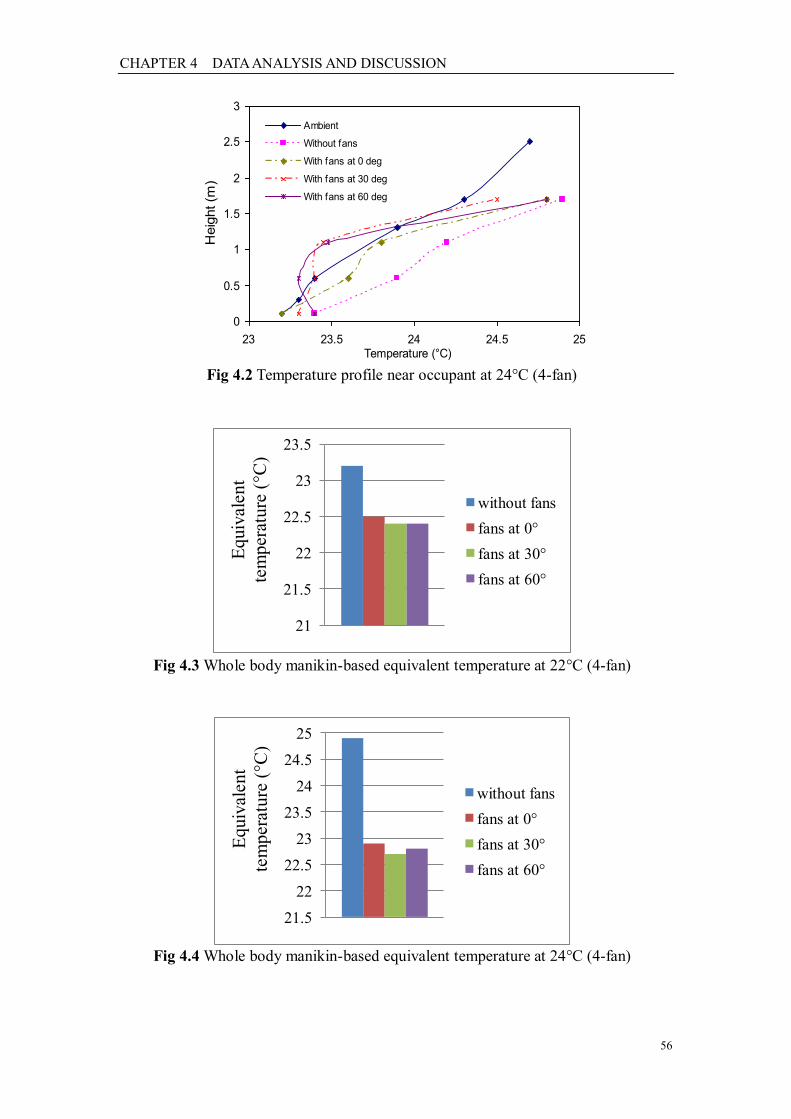
CHAPTER 4 DATA ANALYSIS AND DISCUSSION
56
Fig 4.2 Temperature profile near occupant at 24°C (4-fan)
Fig 4.3 Whole body manikin-based equivalent temperature at 22°C (4-fan)
Fig 4.4 Whole body manikin-based equivalent temperature at 24°C (4-fan)
0
0.5
1
1.5
2
2.5
3
23 23.5 24 24.5 25Temperature (°C)
Heig
ht (m
)
Ambient
Without fans
With fans at 0 deg
With fans at 30 deg
With fans at 60 deg
21
21.5
22
22.5
23
23.5
Equiv
alent
tem
per
ature
(°C
)
without fans
fans at 0°
fans at 30°
fans at 60°
21.5
22
22.5
23
23.5
24
24.5
25
Eq
uiv
alen
t
tem
per
ature
(°C
)
without fans
fans at 0°
fans at 30°
fans at 60°
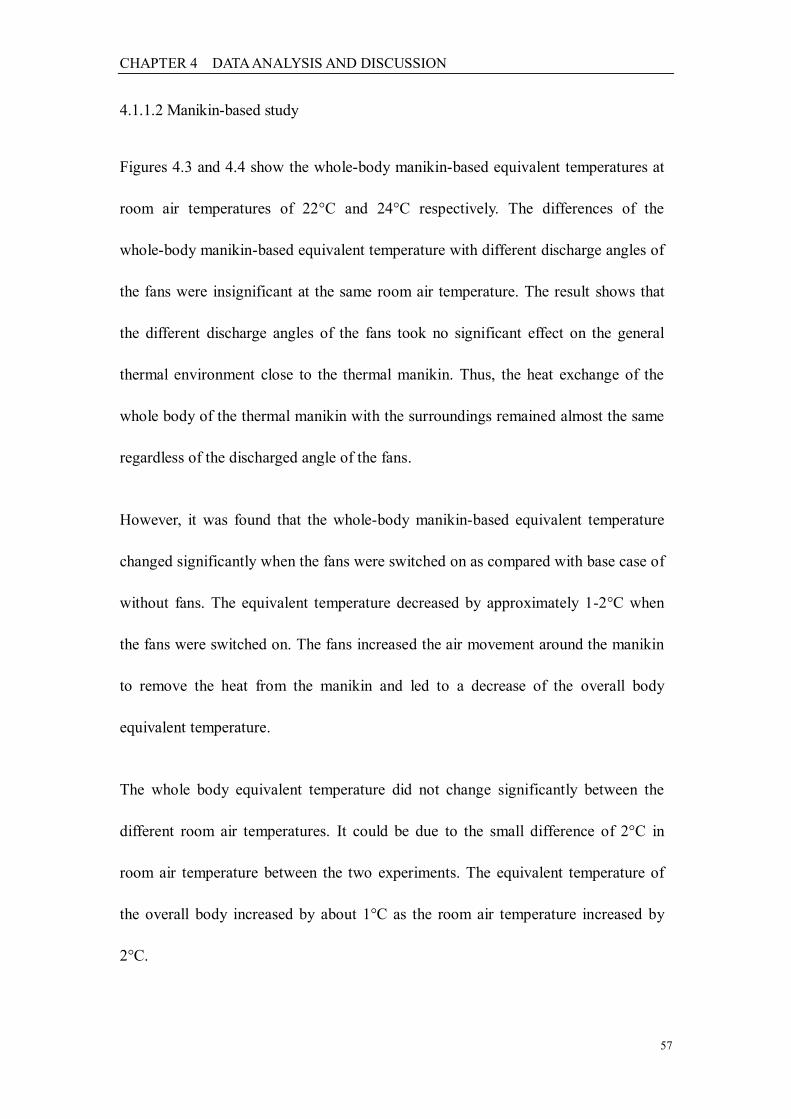
CHAPTER 4 DATA ANALYSIS AND DISCUSSION
57
4.1.1.2 Manikin-based study
Figures 4.3 and 4.4 show the whole-body manikin-based equivalent temperatures at
room air temperatures of 22°C and 24°C respectively. The differences of the
whole-body manikin-based equivalent temperature with different discharge angles of
the fans were insignificant at the same room air temperature. The result shows that
the different discharge angles of the fans took no significant effect on the general
thermal environment close to the thermal manikin. Thus, the heat exchange of the
whole body of the thermal manikin with the surroundings remained almost the same
regardless of the discharged angle of the fans.
However, it was found that the whole-body manikin-based equivalent temperature
changed significantly when the fans were switched on as compared with base case of
without fans. The equivalent temperature decreased by approximately 1-2°C when
the fans were switched on. The fans increased the air movement around the manikin
to remove the heat from the manikin and led to a decrease of the overall body
equivalent temperature.
The whole body equivalent temperature did not change significantly between the
different room air temperatures. It could be due to the small difference of 2°C in
room air temperature between the two experiments. The equivalent temperature of
the overall body increased by about 1°C as the room air temperature increased by
2°C.
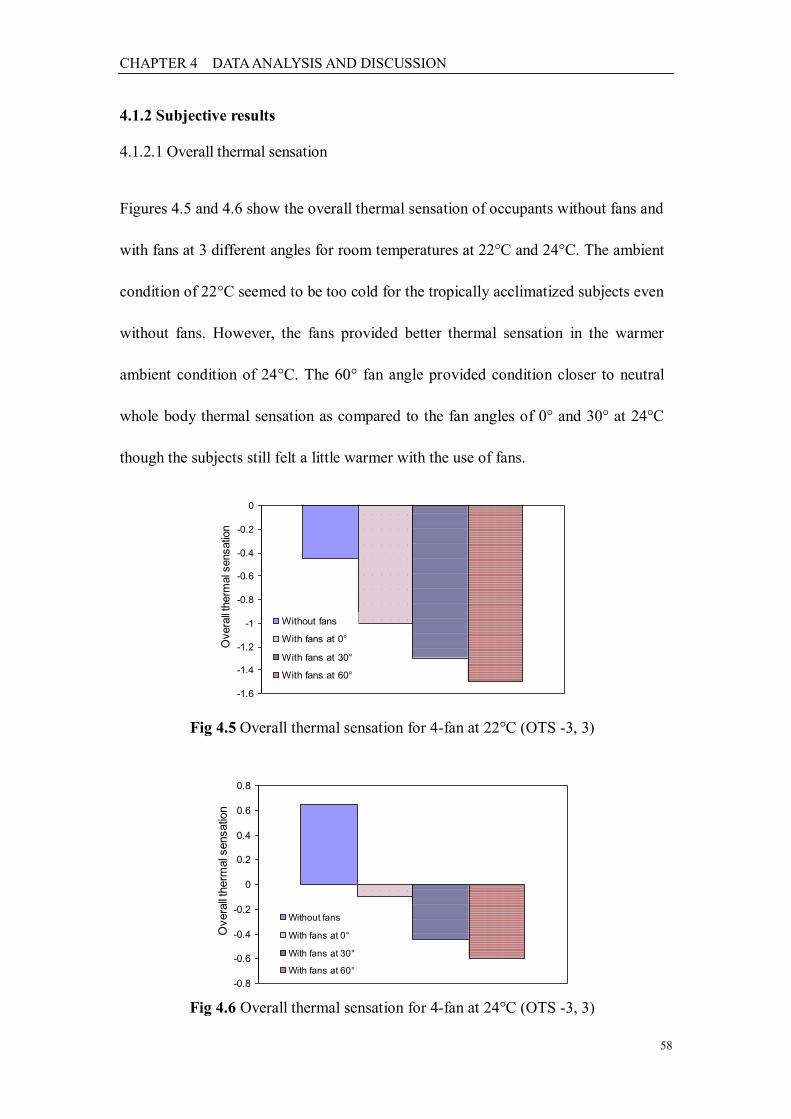
CHAPTER 4 DATA ANALYSIS AND DISCUSSION
58
4.1.2 Subjective results
4.1.2.1 Overall thermal sensation
Figures 4.5 and 4.6 show the overall thermal sensation of occupants without fans and
with fans at 3 different angles for room temperatures at 22°C and 24°C. The ambient
condition of 22°C seemed to be too cold for the tropically acclimatized subjects even
without fans. However, the fans provided better thermal sensation in the warmer
ambient condition of 24°C. The 60° fan angle provided condition closer to neutral
whole body thermal sensation as compared to the fan angles of 0° and 30° at 24°C
though the subjects still felt a little warmer with the use of fans.
Fig 4.5 Overall thermal sensation for 4-fan at 22°C (OTS -3, 3)
Fig 4.6 Overall thermal sensation for 4-fan at 24°C (OTS -3, 3)
-1.6
-1.4
-1.2
-1
-0.8
-0.6
-0.4
-0.2
0
Overa
ll th
erm
al s
ensatio
n
Without fans
With fans at 0°
With fans at 30°
With fans at 60°
-0.8
-0.6
-0.4
-0.2
0
0.2
0.4
0.6
0.8
Overa
ll th
erm
al s
ensatio
n
Without fans
With fans at 0°
With fans at 30°
With fans at 60°
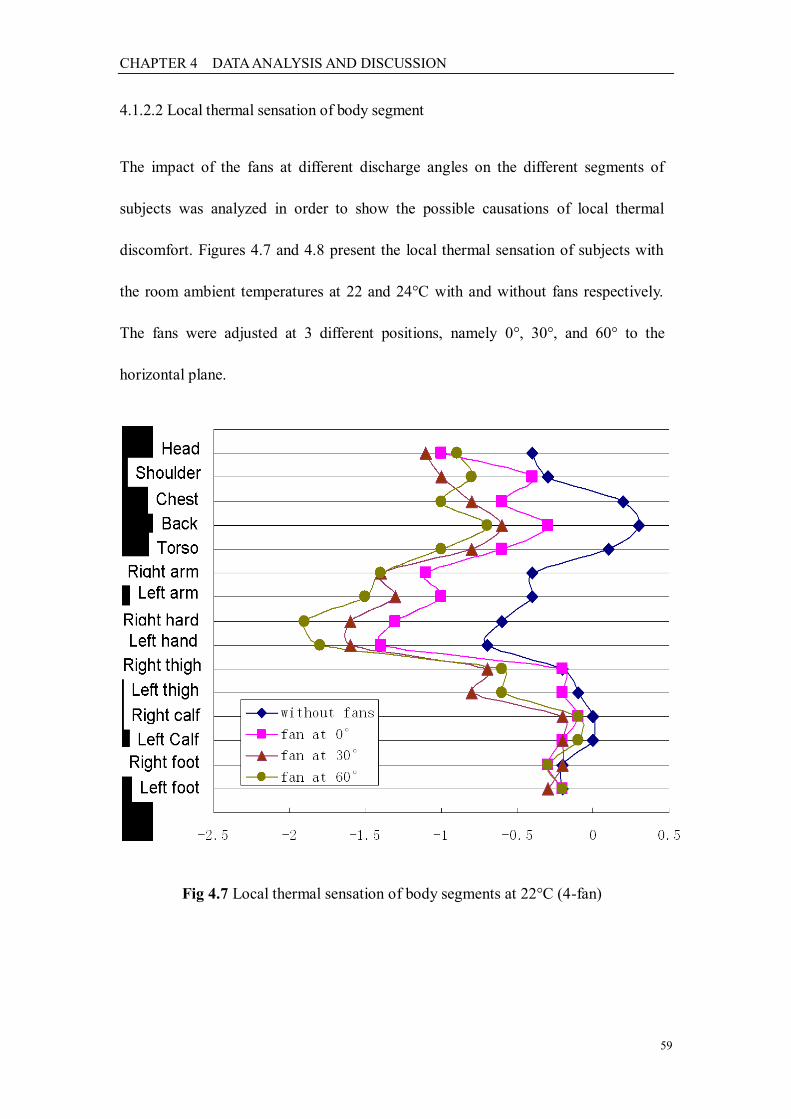
CHAPTER 4 DATA ANALYSIS AND DISCUSSION
59
4.1.2.2 Local thermal sensation of body segment
The impact of the fans at different discharge angles on the different segments of
subjects was analyzed in order to show the possible causations of local thermal
discomfort. Figures 4.7 and 4.8 present the local thermal sensation of subjects with
the room ambient temperatures at 22 and 24°C with and without fans respectively.
The fans were adjusted at 3 different positions, namely 0°, 30°, and 60° to the
horizontal plane.
Fig 4.7 Local thermal sensation of body segments at 22°C (4-fan)
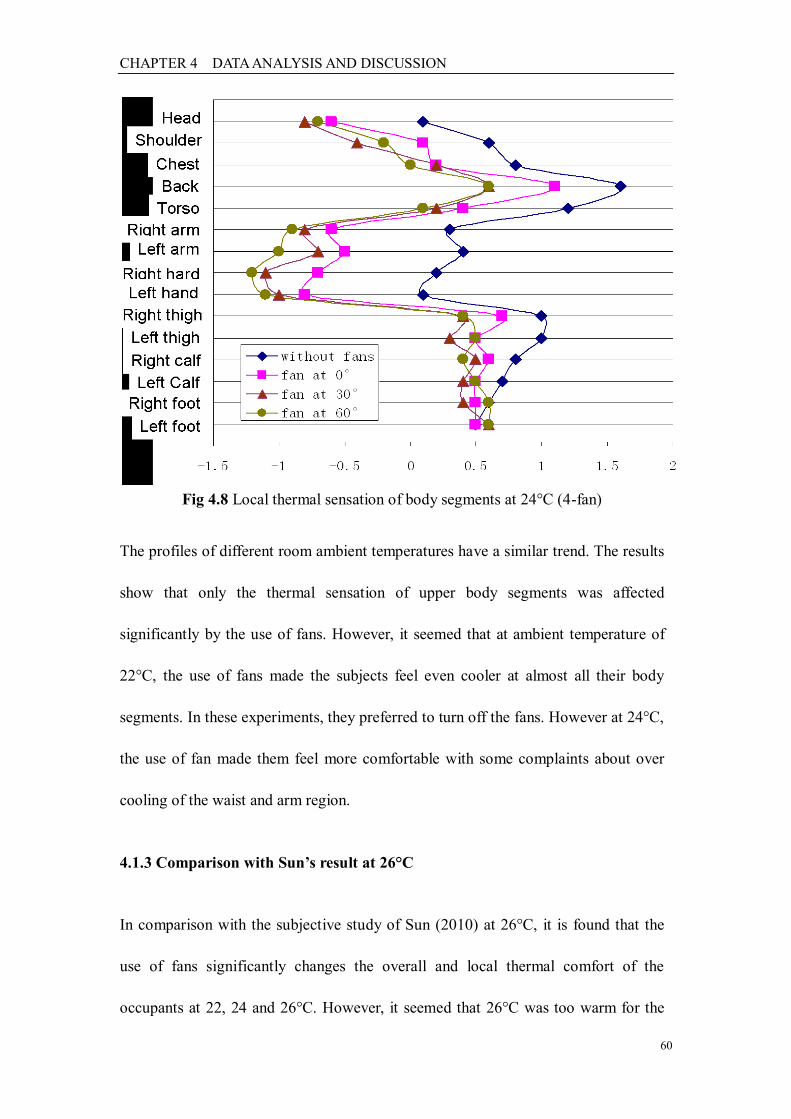
CHAPTER 4 DATA ANALYSIS AND DISCUSSION
60
Fig 4.8 Local thermal sensation of body segments at 24°C (4-fan)
The profiles of different room ambient temperatures have a similar trend. The results
show that only the thermal sensation of upper body segments was affected
significantly by the use of fans. However, it seemed that at ambient temperature of
22°C, the use of fans made the subjects feel even cooler at almost all their body
segments. In these experiments, they preferred to turn off the fans. However at 24°C,
the use of fan made them feel more comfortable with some complaints about over
cooling of the waist and arm region.
4.1.3 Comparison with Sun’s result at 26°C
In comparison with the subjective study of Sun (2010) at 26°C, it is found that the
use of fans significantly changes the overall and local thermal comfort of the
occupants at 22, 24 and 26°C. However, it seemed that 26°C was too warm for the
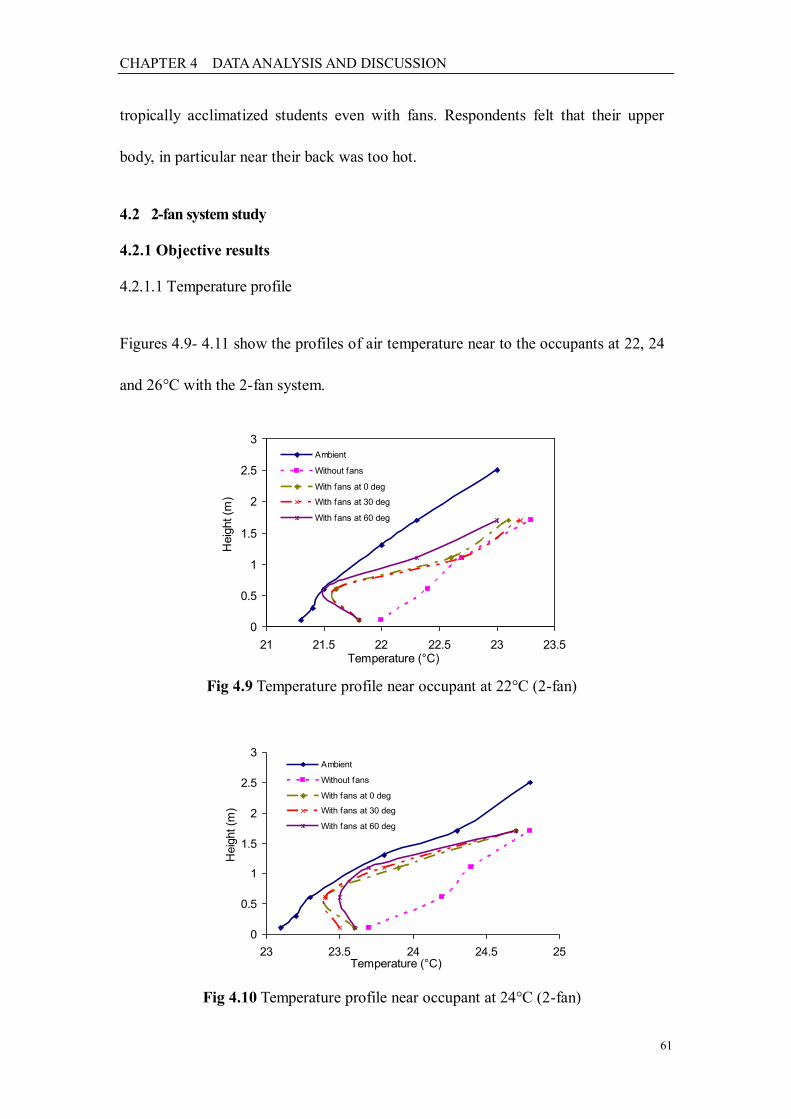
CHAPTER 4 DATA ANALYSIS AND DISCUSSION
61
tropically acclimatized students even with fans. Respondents felt that their upper
body, in particular near their back was too hot.
4.2 2-fan system study
4.2.1 Objective results
4.2.1.1 Temperature profile
Figures 4.9- 4.11 show the profiles of air temperature near to the occupants at 22, 24
and 26°C with the 2-fan system.
Fig 4.9 Temperature profile near occupant at 22°C (2-fan)
Fig 4.10 Temperature profile near occupant at 24°C (2-fan)
0
0.5
1
1.5
2
2.5
3
21 21.5 22 22.5 23 23.5Temperature (°C)
Heig
ht (m
)
Ambient
Without fans
With fans at 0 deg
With fans at 30 deg
With fans at 60 deg
0
0.5
1
1.5
2
2.5
3
23 23.5 24 24.5 25Temperature (°C)
Heig
ht (m
)
Ambient
Without fans
With fans at 0 deg
With fans at 30 deg
With fans at 60 deg
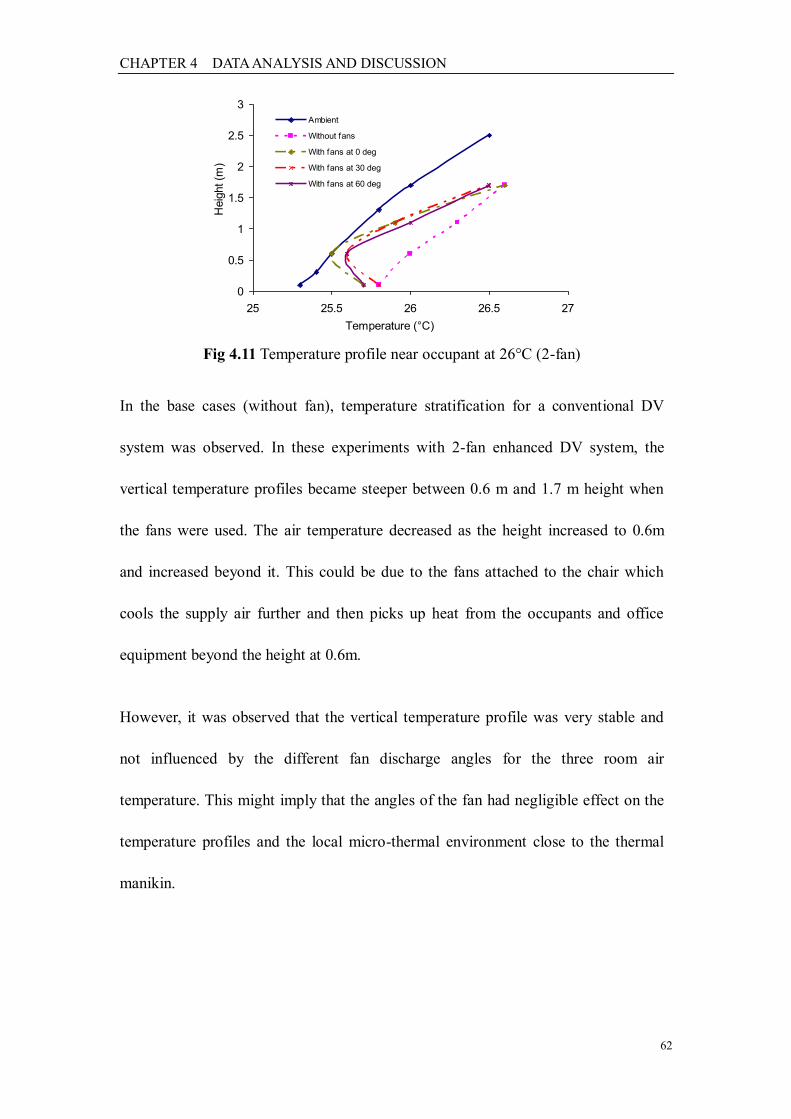
CHAPTER 4 DATA ANALYSIS AND DISCUSSION
62
Fig 4.11 Temperature profile near occupant at 26°C (2-fan)
In the base cases (without fan), temperature stratification for a conventional DV
system was observed. In these experiments with 2-fan enhanced DV system, the
vertical temperature profiles became steeper between 0.6 m and 1.7 m height when
the fans were used. The air temperature decreased as the height increased to 0.6m
and increased beyond it. This could be due to the fans attached to the chair which
cools the supply air further and then picks up heat from the occupants and office
equipment beyond the height at 0.6m.
However, it was observed that the vertical temperature profile was very stable and
not influenced by the different fan discharge angles for the three room air
temperature. This might imply that the angles of the fan had negligible effect on the
temperature profiles and the local micro-thermal environment close to the thermal
manikin.
0
0.5
1
1.5
2
2.5
3
25 25.5 26 26.5 27
Temperature (°C)
Heig
ht (m
)
Ambient
Without fans
With fans at 0 deg
With fans at 30 deg
With fans at 60 deg
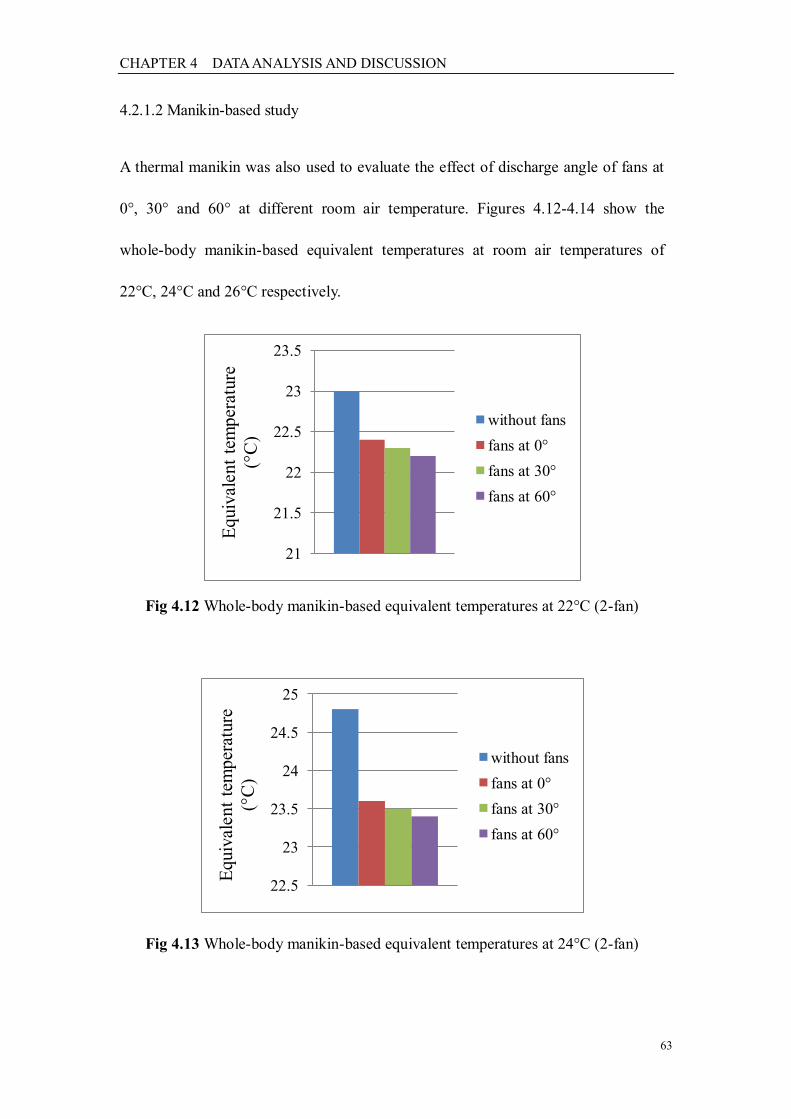
CHAPTER 4 DATA ANALYSIS AND DISCUSSION
63
4.2.1.2 Manikin-based study
A thermal manikin was also used to evaluate the effect of discharge angle of fans at
0°, 30° and 60° at different room air temperature. Figures 4.12-4.14 show the
whole-body manikin-based equivalent temperatures at room air temperatures of
22°C, 24°C and 26°C respectively.
Fig 4.12 Whole-body manikin-based equivalent temperatures at 22°C (2-fan)
Fig 4.13 Whole-body manikin-based equivalent temperatures at 24°C (2-fan)
21
21.5
22
22.5
23
23.5
Eq
uiv
alen
t te
mper
ature
(°C
)
without fans
fans at 0°
fans at 30°
fans at 60°
22.5
23
23.5
24
24.5
25
Eq
uiv
alen
t te
mper
ature
(°C
)
without fans
fans at 0°
fans at 30°
fans at 60°
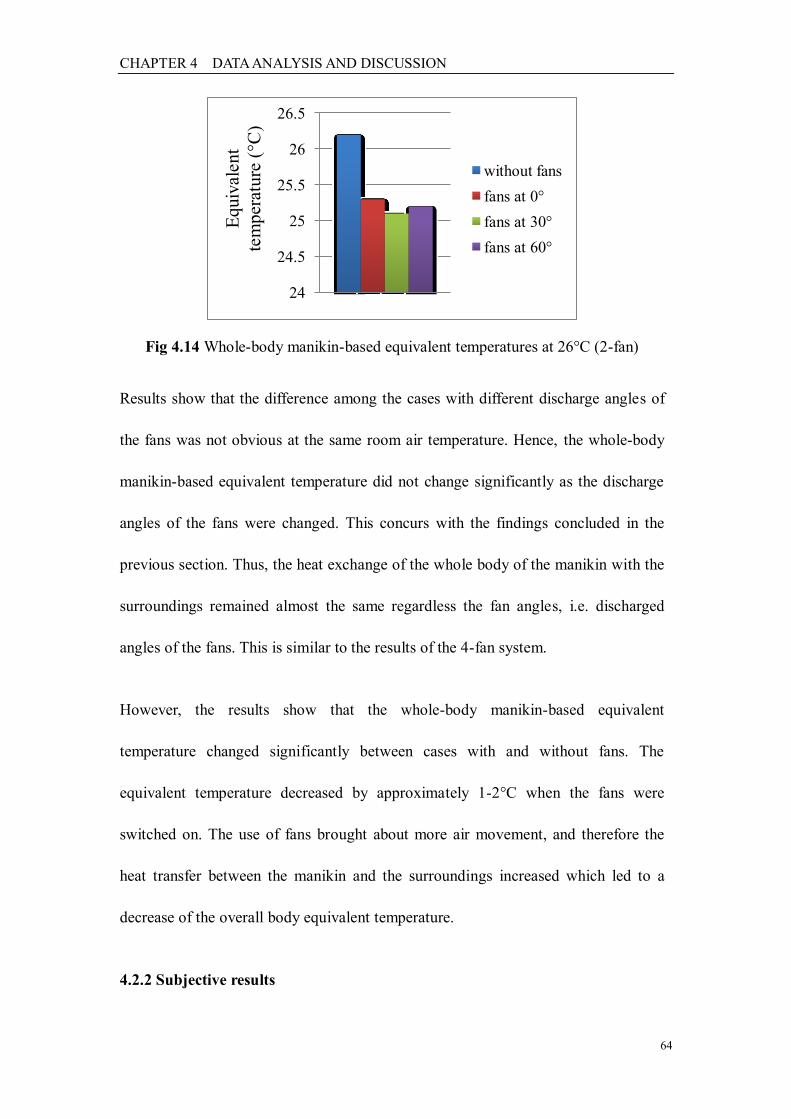
CHAPTER 4 DATA ANALYSIS AND DISCUSSION
64
Fig 4.14 Whole-body manikin-based equivalent temperatures at 26°C (2-fan)
Results show that the difference among the cases with different discharge angles of
the fans was not obvious at the same room air temperature. Hence, the whole-body
manikin-based equivalent temperature did not change significantly as the discharge
angles of the fans were changed. This concurs with the findings concluded in the
previous section. Thus, the heat exchange of the whole body of the manikin with the
surroundings remained almost the same regardless the fan angles, i.e. discharged
angles of the fans. This is similar to the results of the 4-fan system.
However, the results show that the whole-body manikin-based equivalent
temperature changed significantly between cases with and without fans. The
equivalent temperature decreased by approximately 1-2°C when the fans were
switched on. The use of fans brought about more air movement, and therefore the
heat transfer between the manikin and the surroundings increased which led to a
decrease of the overall body equivalent temperature.
4.2.2 Subjective results
24
24.5
25
25.5
26
26.5
Eq
uiv
alen
t
tem
per
atu
re (
°C)
without fans
fans at 0°
fans at 30°
fans at 60°
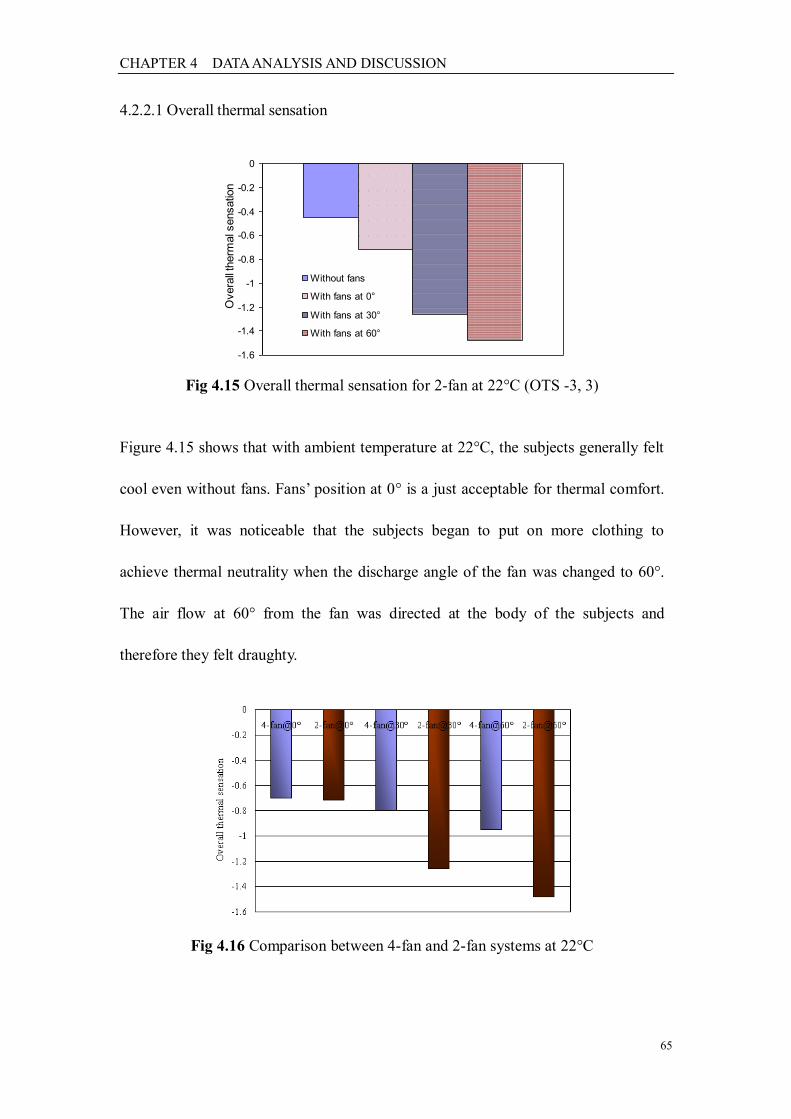
CHAPTER 4 DATA ANALYSIS AND DISCUSSION
65
4.2.2.1 Overall thermal sensation
Fig 4.15 Overall thermal sensation for 2-fan at 22°C (OTS -3, 3)
Figure 4.15 shows that with ambient temperature at 22°C, the subjects generally felt
cool even without fans. Fans‟ position at 0° is a just acceptable for thermal comfort.
However, it was noticeable that the subjects began to put on more clothing to
achieve thermal neutrality when the discharge angle of the fan was changed to 60°.
The air flow at 60° from the fan was directed at the body of the subjects and
therefore they felt draughty.
Fig 4.16 Comparison between 4-fan and 2-fan systems at 22°C
-1.6
-1.4
-1.2
-1
-0.8
-0.6
-0.4
-0.2
0
Overa
ll th
erm
al s
ensatio
n
Without fans
With fans at 0°
With fans at 30°
With fans at 60°
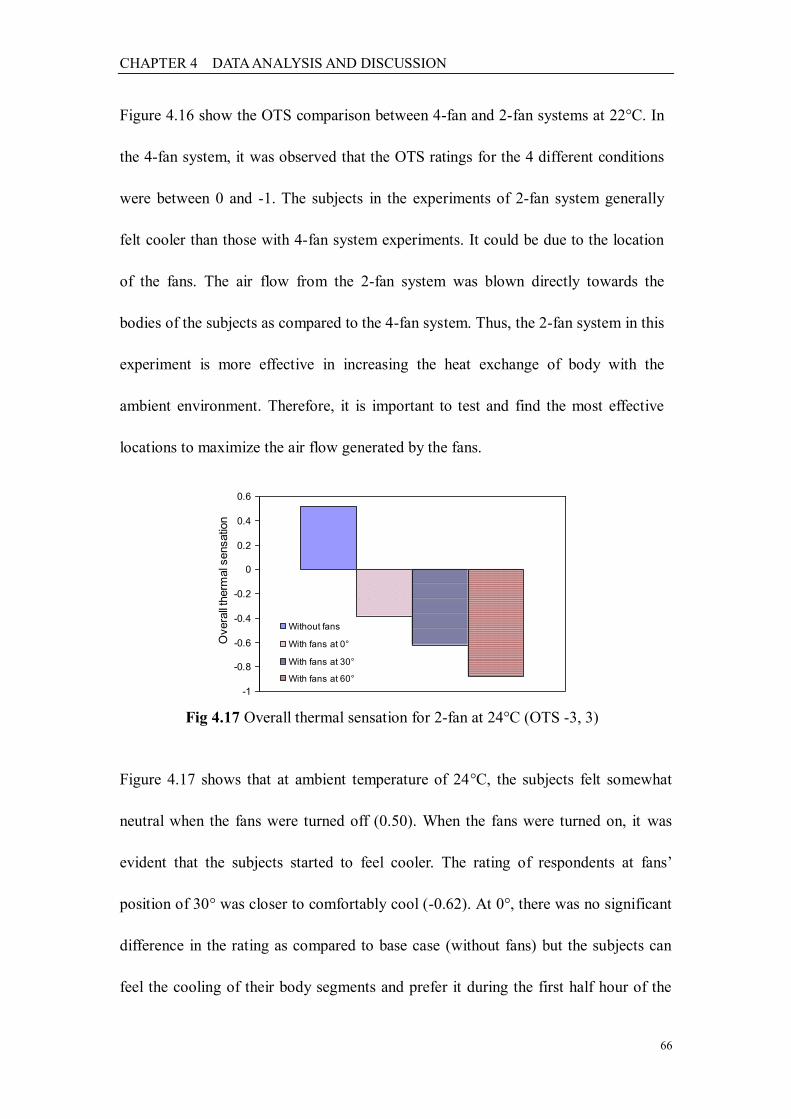
CHAPTER 4 DATA ANALYSIS AND DISCUSSION
66
Figure 4.16 show the OTS comparison between 4-fan and 2-fan systems at 22°C. In
the 4-fan system, it was observed that the OTS ratings for the 4 different conditions
were between 0 and -1. The subjects in the experiments of 2-fan system generally
felt cooler than those with 4-fan system experiments. It could be due to the location
of the fans. The air flow from the 2-fan system was blown directly towards the
bodies of the subjects as compared to the 4-fan system. Thus, the 2-fan system in this
experiment is more effective in increasing the heat exchange of body with the
ambient environment. Therefore, it is important to test and find the most effective
locations to maximize the air flow generated by the fans.
Fig 4.17 Overall thermal sensation for 2-fan at 24°C (OTS -3, 3)
Figure 4.17 shows that at ambient temperature of 24°C, the subjects felt somewhat
neutral when the fans were turned off (0.50). When the fans were turned on, it was
evident that the subjects started to feel cooler. The rating of respondents at fans‟
position of 30° was closer to comfortably cool (-0.62). At 0°, there was no significant
difference in the rating as compared to base case (without fans) but the subjects can
feel the cooling of their body segments and prefer it during the first half hour of the
-1
-0.8
-0.6
-0.4
-0.2
0
0.2
0.4
0.6
Overa
ll th
erm
al s
ensatio
n
Without fans
With fans at 0°
With fans at 30°
With fans at 60°
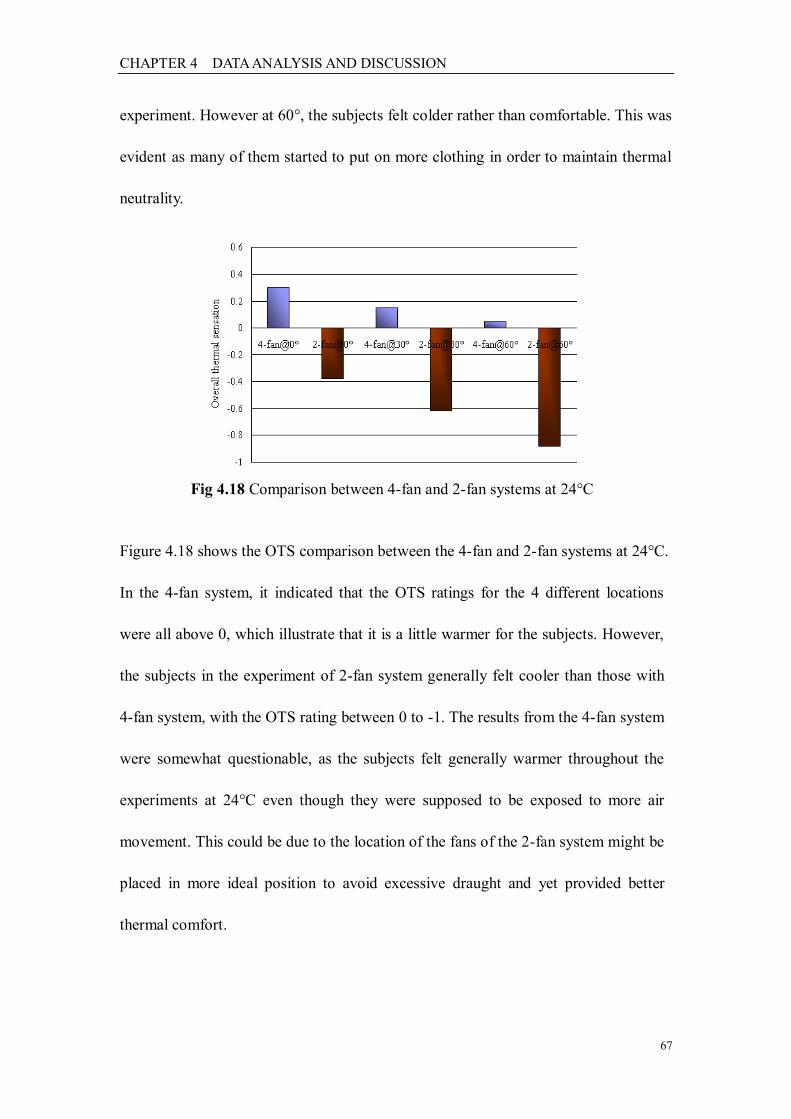
CHAPTER 4 DATA ANALYSIS AND DISCUSSION
67
experiment. However at 60°, the subjects felt colder rather than comfortable. This was
evident as many of them started to put on more clothing in order to maintain thermal
neutrality.
Fig 4.18 Comparison between 4-fan and 2-fan systems at 24°C
Figure 4.18 shows the OTS comparison between the 4-fan and 2-fan systems at 24°C.
In the 4-fan system, it indicated that the OTS ratings for the 4 different locations
were all above 0, which illustrate that it is a little warmer for the subjects. However,
the subjects in the experiment of 2-fan system generally felt cooler than those with
4-fan system, with the OTS rating between 0 to -1. The results from the 4-fan system
were somewhat questionable, as the subjects felt generally warmer throughout the
experiments at 24°C even though they were supposed to be exposed to more air
movement. This could be due to the location of the fans of the 2-fan system might be
placed in more ideal position to avoid excessive draught and yet provided better
thermal comfort.
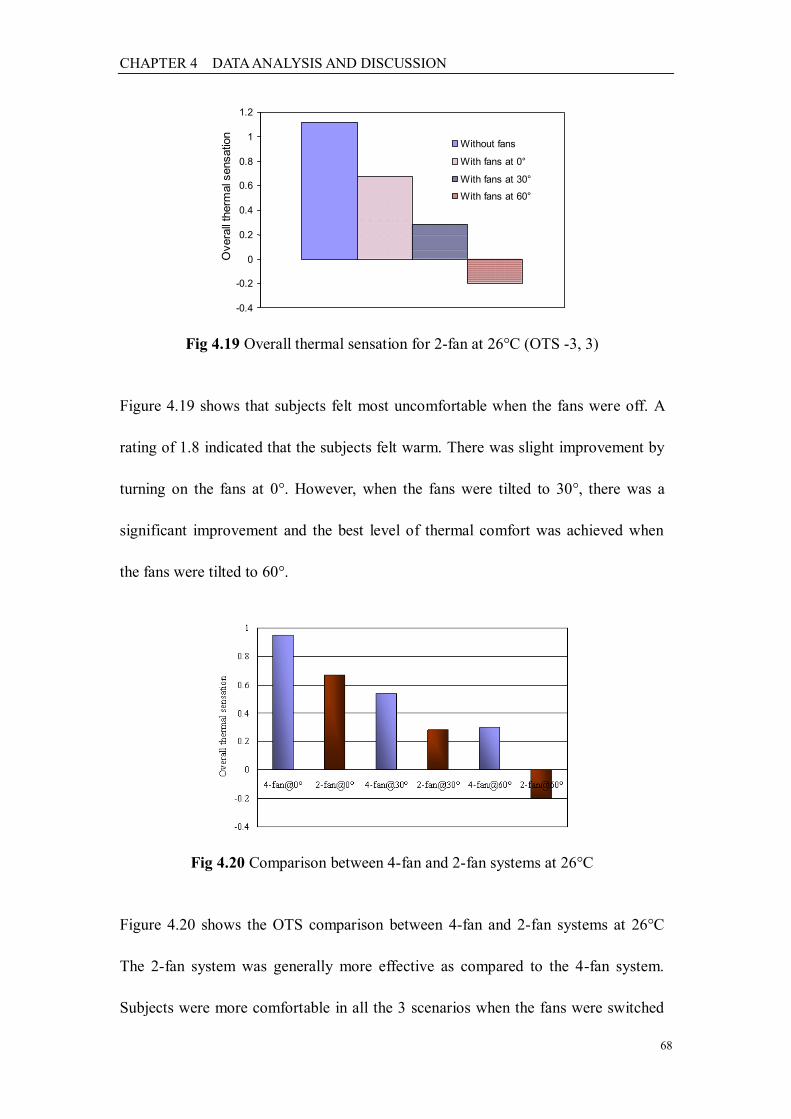
CHAPTER 4 DATA ANALYSIS AND DISCUSSION
68
Fig 4.19 Overall thermal sensation for 2-fan at 26°C (OTS -3, 3)
Figure 4.19 shows that subjects felt most uncomfortable when the fans were off. A
rating of 1.8 indicated that the subjects felt warm. There was slight improvement by
turning on the fans at 0°. However, when the fans were tilted to 30°, there was a
significant improvement and the best level of thermal comfort was achieved when
the fans were tilted to 60°.
Fig 4.20 Comparison between 4-fan and 2-fan systems at 26°C
Figure 4.20 shows the OTS comparison between 4-fan and 2-fan systems at 26°C
The 2-fan system was generally more effective as compared to the 4-fan system.
Subjects were more comfortable in all the 3 scenarios when the fans were switched
-0.4
-0.2
0
0.2
0.4
0.6
0.8
1
1.2
Overa
ll th
erm
al sensation
Without fans
With fans at 0°
With fans at 30°
With fans at 60°
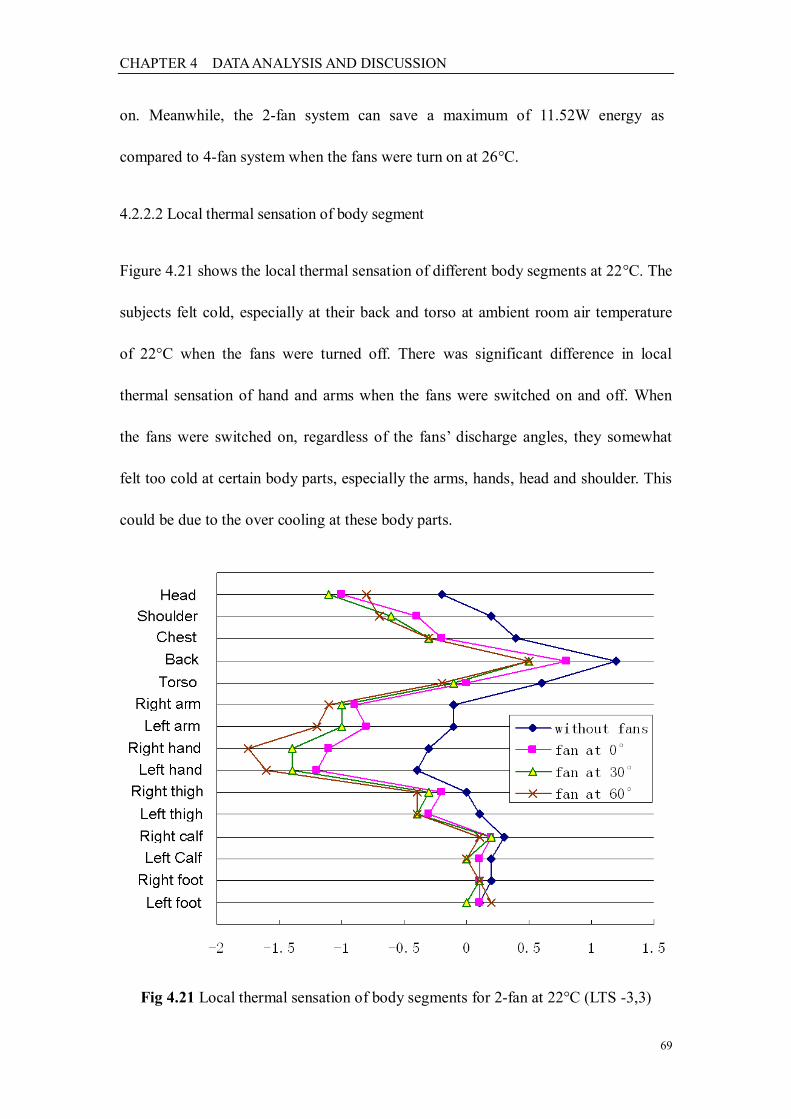
CHAPTER 4 DATA ANALYSIS AND DISCUSSION
69
on. Meanwhile, the 2-fan system can save a maximum of 11.52W energy as
compared to 4-fan system when the fans were turn on at 26°C.
4.2.2.2 Local thermal sensation of body segment
Figure 4.21 shows the local thermal sensation of different body segments at 22°C. The
subjects felt cold, especially at their back and torso at ambient room air temperature
of 22°C when the fans were turned off. There was significant difference in local
thermal sensation of hand and arms when the fans were switched on and off. When
the fans were switched on, regardless of the fans‟ discharge angles, they somewhat
felt too cold at certain body parts, especially the arms, hands, head and shoulder. This
could be due to the over cooling at these body parts.
Fig 4.21 Local thermal sensation of body segments for 2-fan at 22°C (LTS -3,3)
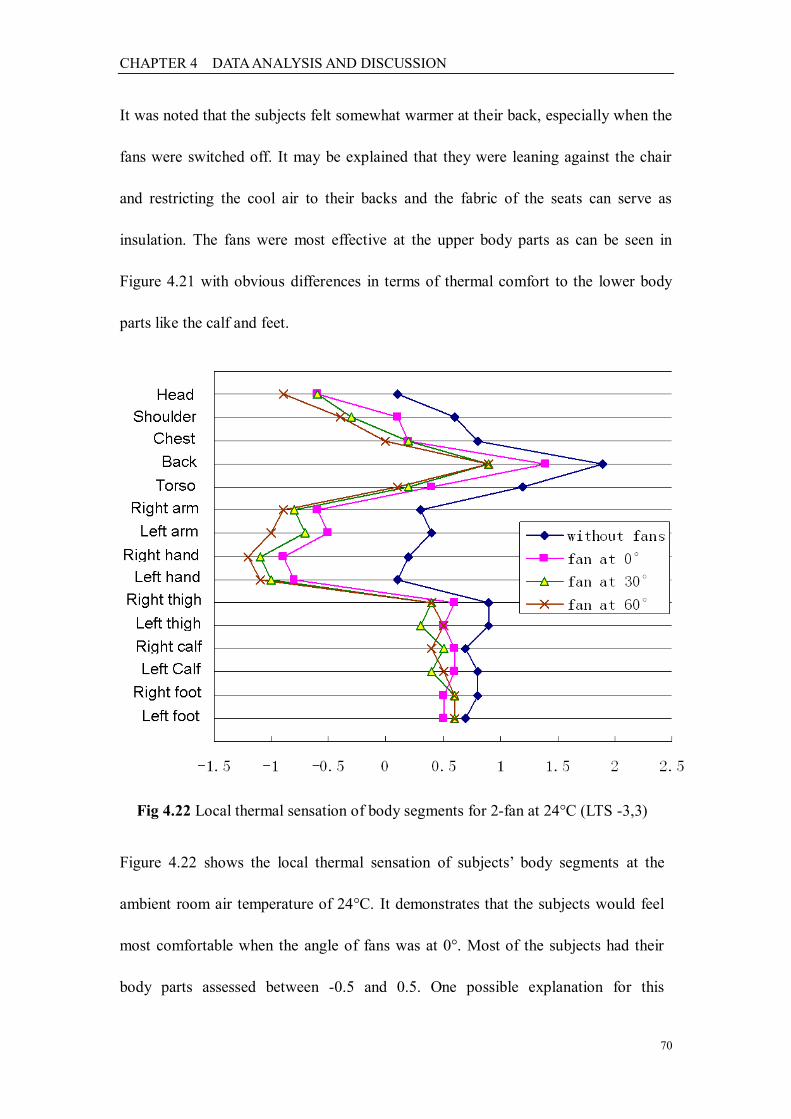
CHAPTER 4 DATA ANALYSIS AND DISCUSSION
70
It was noted that the subjects felt somewhat warmer at their back, especially when the
fans were switched off. It may be explained that they were leaning against the chair
and restricting the cool air to their backs and the fabric of the seats can serve as
insulation. The fans were most effective at the upper body parts as can be seen in
Figure 4.21 with obvious differences in terms of thermal comfort to the lower body
parts like the calf and feet.
Fig 4.22 Local thermal sensation of body segments for 2-fan at 24°C (LTS -3,3)
Figure 4.22 shows the local thermal sensation of subjects‟ body segments at the
ambient room air temperature of 24°C. It demonstrates that the subjects would feel
most comfortable when the angle of fans was at 0°. Most of the subjects had their
body parts assessed between -0.5 and 0.5. One possible explanation for this
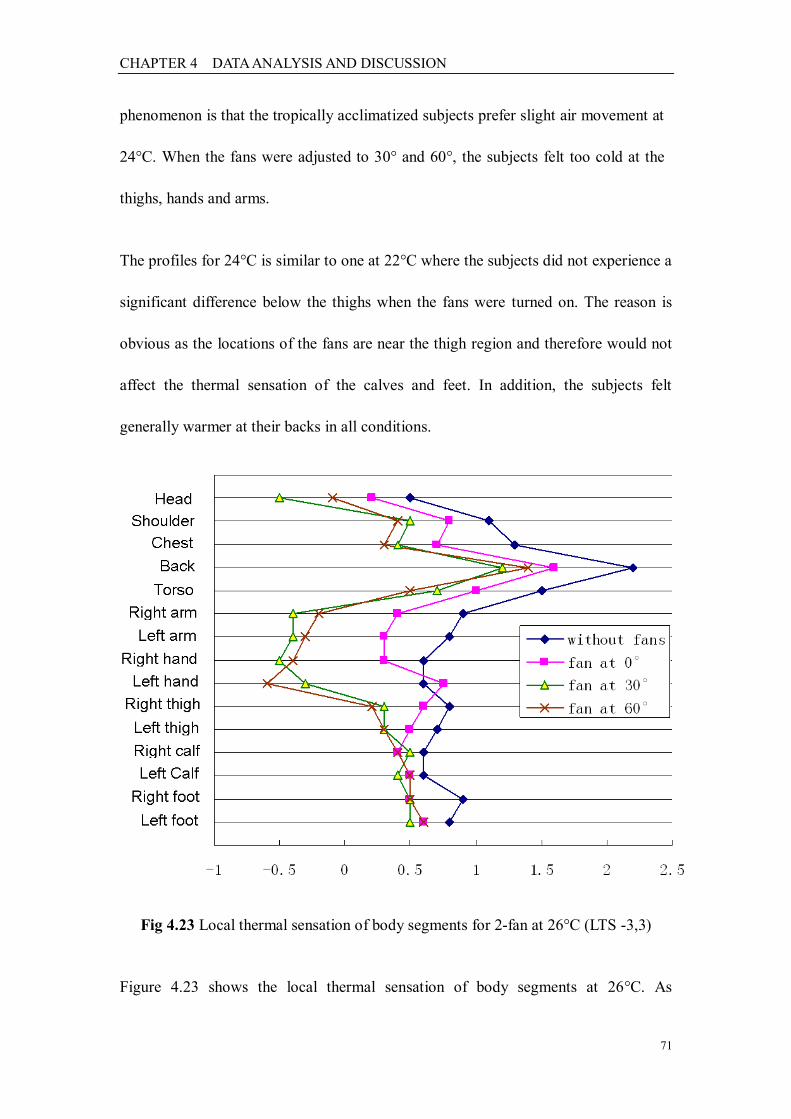
CHAPTER 4 DATA ANALYSIS AND DISCUSSION
71
phenomenon is that the tropically acclimatized subjects prefer slight air movement at
24°C. When the fans were adjusted to 30° and 60°, the subjects felt too cold at the
thighs, hands and arms.
The profiles for 24°C is similar to one at 22°C where the subjects did not experience a
significant difference below the thighs when the fans were turned on. The reason is
obvious as the locations of the fans are near the thigh region and therefore would not
affect the thermal sensation of the calves and feet. In addition, the subjects felt
generally warmer at their backs in all conditions.
Fig 4.23 Local thermal sensation of body segments for 2-fan at 26°C (LTS -3,3)
Figure 4.23 shows the local thermal sensation of body segments at 26°C. As
CHAPTER 4 DATA ANALYSIS AND DISCUSSION
72
compared to the profiles at 22 and 24°C, there was a gradual horizontal shift from the
left to the right at 26°C. 26°C seems to be too warm for the tropically acclimatized
subjects when the fans were turned off. The use of fan had significantly improved the
thermal sensation of subjects‟ hands and arms, especially at 30° and 60° fan discharge
angle. However, some of the subjects reported that their upper bodies were still too
warm when the fans were adjusted to 0° since the airflow generated by fans cannot
penetrate the flow field of upper body region. The air movement was still insufficient
at their upper body like back and torso.
4.2.2.3 Comparison of LTS between 2-fan and 4-fan system
As compared to Sun (2010)‟ findings about local thermal sensation of the 4-fan
system, it is found that the rating of thermal sensation of different body segments for
2-fan system is lower than that in 4-fan system at room air temperature of 22, 24 and
26°C. The upper body segments are measured cooler for the 2-fan system than 4-fan
system which shows that 2-fan system is more effective to bring the cool air to the
upper part of the body. This finding also supports the OTS difference between 2-fan
and 4-fan system which is discussed in last section.
4.2.2.4 Perceived Air Quality (PAQ)
Table 4.1 shows the survey results of perceived air quality (PAQ) at room air
temperature of 22, 24 and 26°C. For cases without fans, subjects experienced less
acceptable air quality and higher level of odor intensity as compared to cases with
fans, particularly at 26°C. This finding is similar with the study of Fang (2000),
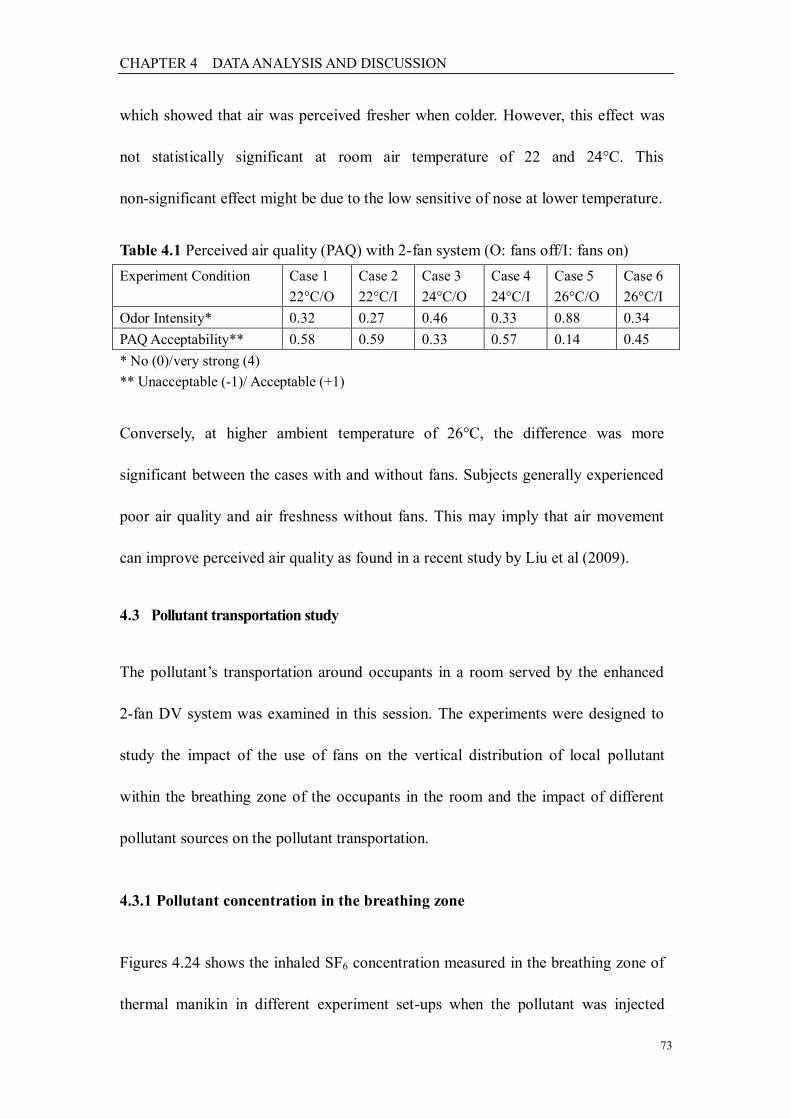
CHAPTER 4 DATA ANALYSIS AND DISCUSSION
73
which showed that air was perceived fresher when colder. However, this effect was
not statistically significant at room air temperature of 22 and 24°C. This
non-significant effect might be due to the low sensitive of nose at lower temperature.
Table 4.1 Perceived air quality (PAQ) with 2-fan system (O: fans off/I: fans on)
Experiment Condition Case 1
22°C/O
Case 2
22°C/I
Case 3
24°C/O
Case 4
24°C/I
Case 5
26°C/O
Case 6
26°C/I
Odor Intensity* 0.32 0.27 0.46 0.33 0.88 0.34
PAQ Acceptability** 0.58 0.59 0.33 0.57 0.14 0.45
* No (0)/very strong (4)
** Unacceptable (-1)/ Acceptable (+1)
Conversely, at higher ambient temperature of 26°C, the difference was more
significant between the cases with and without fans. Subjects generally experienced
poor air quality and air freshness without fans. This may imply that air movement
can improve perceived air quality as found in a recent study by Liu et al (2009).
4.3 Pollutant transportation study
The pollutant‟s transportation around occupants in a room served by the enhanced
2-fan DV system was examined in this session. The experiments were designed to
study the impact of the use of fans on the vertical distribution of local pollutant
within the breathing zone of the occupants in the room and the impact of different
pollutant sources on the pollutant transportation.
4.3.1 Pollutant concentration in the breathing zone
Figures 4.24 shows the inhaled SF6 concentration measured in the breathing zone of
thermal manikin in different experiment set-ups when the pollutant was injected
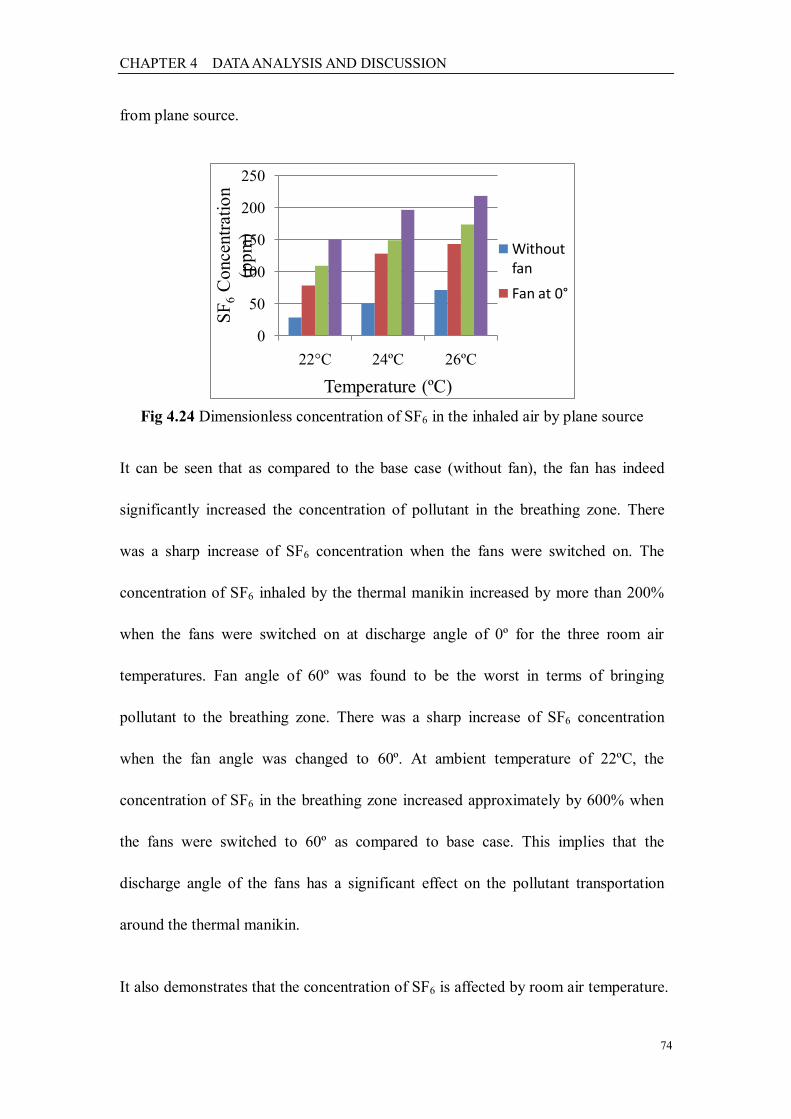
CHAPTER 4 DATA ANALYSIS AND DISCUSSION
74
from plane source.
Fig 4.24 Dimensionless concentration of SF6 in the inhaled air by plane source
It can be seen that as compared to the base case (without fan), the fan has indeed
significantly increased the concentration of pollutant in the breathing zone. There
was a sharp increase of SF6 concentration when the fans were switched on. The
concentration of SF6 inhaled by the thermal manikin increased by more than 200%
when the fans were switched on at discharge angle of 0º for the three room air
temperatures. Fan angle of 60º was found to be the worst in terms of bringing
pollutant to the breathing zone. There was a sharp increase of SF6 concentration
when the fan angle was changed to 60º. At ambient temperature of 22ºC, the
concentration of SF6 in the breathing zone increased approximately by 600% when
the fans were switched to 60º as compared to base case. This implies that the
discharge angle of the fans has a significant effect on the pollutant transportation
around the thermal manikin.
It also demonstrates that the concentration of SF6 is affected by room air temperature.
0
50
100
150
200
250
22°C 24ºC 26ºC
SF
6C
once
ntr
atio
n
(pp
m)
Temperature (ºC)
Without fan
Fan at 0°
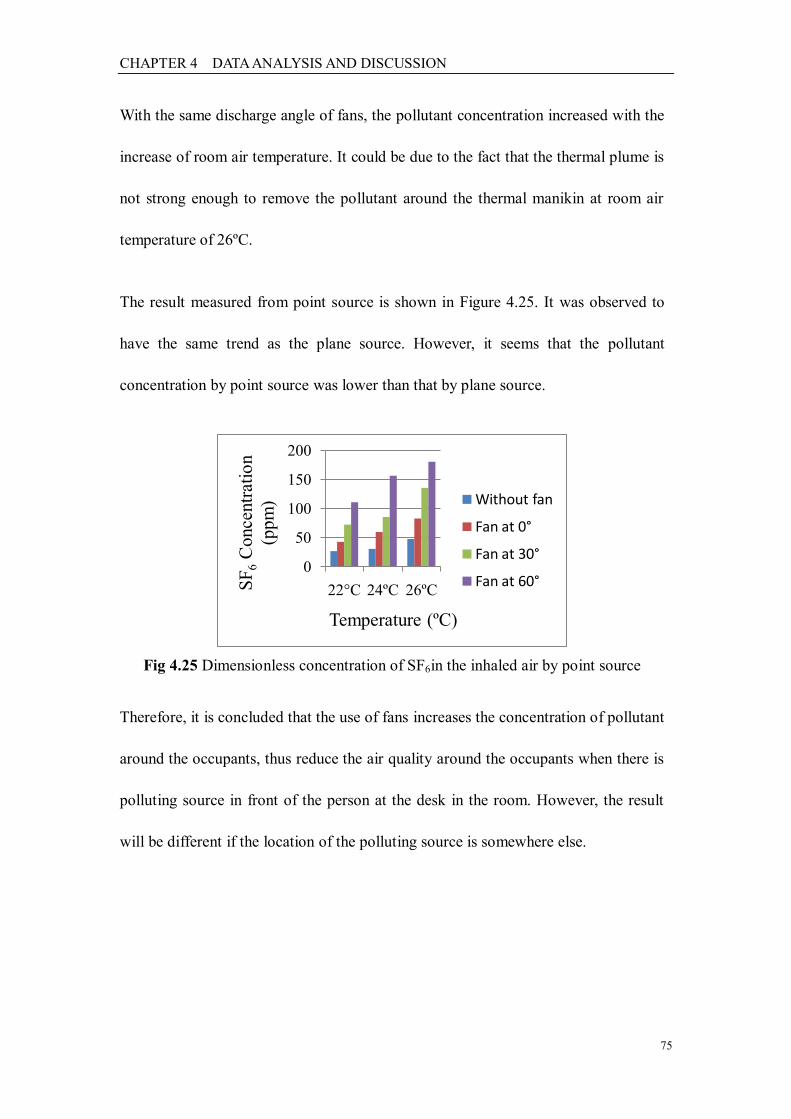
CHAPTER 4 DATA ANALYSIS AND DISCUSSION
75
With the same discharge angle of fans, the pollutant concentration increased with the
increase of room air temperature. It could be due to the fact that the thermal plume is
not strong enough to remove the pollutant around the thermal manikin at room air
temperature of 26ºC.
The result measured from point source is shown in Figure 4.25. It was observed to
have the same trend as the plane source. However, it seems that the pollutant
concentration by point source was lower than that by plane source.
Fig 4.25 Dimensionless concentration of SF6in the inhaled air by point source
Therefore, it is concluded that the use of fans increases the concentration of pollutant
around the occupants, thus reduce the air quality around the occupants when there is
polluting source in front of the person at the desk in the room. However, the result
will be different if the location of the polluting source is somewhere else.
0
50
100
150
200
22°C 24ºC 26ºCSF
6C
once
ntr
atio
n
(ppm
)
Temperature (ºC)
Without fan
Fan at 0°
Fan at 30°
Fan at 60°
CHAPTER 5 CONCLUSIONS
76
CHAPTER 5 CONCLUSIONS
5.1 Review and achievement of research objectives
First Objective
To investigate the impact of the 2-fan enhanced DV system on the airflow around human
body.
The temperature gradient profiles of the 2-fan system are similar to the 4-fan system.
The vertical temperature gradients became steeper between 0.6m and 1.7m height
when the fans were used. This implies that the natural convection flow around the
human body is significantly enhanced even with the 2-fan system.In the study using
the thermal manikin, the results show that the equivalent temperature of upper body
of thermal manikin was significantly reduced when the fans were turned on. It shows
that the use of fans increased the cooling effect around human body.
Second Objective
To assess occupants’ thermal comfort with the 2-fan enhanced DV system.
Subjective study indicates that the use of fan has significantly improved the overall
thermal sensation of occupants at higher temperature of 24±0.5 and 26±0.5°C.
However, with ambient temperature at 22±0.5°C, the subjects generally felt cold
even without fans as they were irritated by the draught generated by the fans.
The research of local thermal sensation shows that the subjects felt discomfort at
certain body segments as the cool air from the fans brought excessive spot cooling.
CHAPTER 5 CONCLUSIONS
77
At 22±0.5 and 24±0.5°C, some of them turned the fans down or off or put on extra
clothing to maintain the thermal neutrality. The discharge angle of the fans affects
the local thermal comfort of different body segments.
Third Objective
To determine the effect of the 2-fan enhanced DV system to reduce draught risk and
improve thermal sensation with comparison to the 4-fan system.
In comparison with the 4-fan system, it was found that the 2-fan system was more
effective in bringing the cool air to the human body without too much draught.
Better thermal sensation was achieved with 2-fan system at 24 and 26°C. Meanwhile,
the local thermal sensation study shows that subjects felt more comfortable on their
body segments with the 2-fan system. This could be due to the location of the fans of
the 2-fan system might be placed in more ideal position to avoid excessive draught
and yet provided better thermal comfort as compared to the 4-fan system.
Fourth Objective
To assess the impact of the 2-fan enhanced DV system on the pollutant
transportation when there is polluting source in the room.
The use of the fan in the enhanced DV system indeed significantly increases the
concentration of pollutant in the breathing zone with either a point or plane polluting
source in the room. The concentration of SF6 was found to be the highest at the
breathing zone when the fans are titled at angle of 60°. At an ambient temperature of
CHAPTER 5 CONCLUSIONS
78
22±0.5°C, the concentration of SF6 in the breathing zone increased by approximately
600% when the fans were switched to 60° as compared to the base case, i.e. without
fan. This implies that the discharge angle of the fans has significant effect on the
pollutant transportation around the thermal manikin.
It also demonstrates that the concentration of SF6 is affected by room air temperature.
With the same fan discharge angle, the pollutant concentration increased with the
increase of room air temperature. It could be due to the fact that the thermal plume is
not strong enough to remove the pollutant around the thermal manikin at higher
room air temperature. It was also observed that the pollutant concentration by point
source is lower than that by plane source.
Fifth Objective
To explore the energy saving potential of the 2-fan system and compare to the
conventional DV system and 4-fan system.
The results show that the cooling effect of human body was enhanced by 2-fan
system and subjects reported better thermal comfort by 2-fan system as compared to
the conventional DV system. Meanwhile, the better thermal sensation could be
achieved at higher temperature with the assistance of fans. Therefore, the supply air
temperature can be raised to a relatively higher temperature while the same thermal
comfort of occupants can be obtained with the 2-fan enhanced system. This can help
to reduce the total energy consumption of the DV system.
CHAPTER 5 CONCLUSIONS
79
It is obvious that the 2-fan system is capable of saving more energy than 4-fan
system as there are fewer fans used. Maintenance cost will also be lower given fewer
components with the 2-fan system.
5.2 Verification of the hypotheses
The hypotheses are verified as follow:
The 2-fan system is more acceptable among occupants as compared to the 4-fan
system as it would not produce draught.
It was found that at 22±0.5°C, most of the subjects felt that the base case i.e., without
fans was the most comfortable. They did not like the cold air blowing at them as they
felt the ambient temperature of 22±0.5°C was already quite cold.
However, the subjects preferred to have the fans turned on when the ambient
temperature was relatively higher at 24±0.5°C and 26±0.5°C. The enhanced air flow
by the fan cools the human body and therefore compensate for the warmer air in the
room. However, it was found that the subjects felt more draught at certain body
segment like waists, hands and arms when the fan was at 30° and 60°. In comparison
to the 4-fan system, the subjects felt more thermally comfortable by the 2-fan system
as there was also less draught. This hypothesis is not rejected.
Hypothesis 2
CHAPTER 5 CONCLUSIONS
80
The fans mounted on two sides of the chair encourage mixing of air and increase the
pollutant concentration in the breathing zone.
It was found that the concentration of pollutant in the inhaled air increased
significantly when the fans were turned on. Hence, this hypothesis is not rejected as
the use of the fans increased the concentration of pollutant around the occupants as
the air flow generated by the fans induced the emission of pollutant on the desk. This
reduces the air quality around the occupants.
Hypothesis 3
The 2-fan system has the potential to save more energy while achieving good thermal
comfort level at higher ambient temperature.
At higher ambient temperature of 26±0.5°C, subjects felt quite thermally comfortable
when the fans were turned on and adjusted to either 30° or 60° by the 2-fan system.
Hence, by using the 2-fan enhanced DV system instead of the 4-fan system, the
ambient temperature setting can be relatively higher at 26±0.5°C. Hence, energy can
be saved and will be more sustainable. This hypothesis is not rejected.
5.3 Limitations
The first limitation was the fact that the subjects involved in this study were
undergraduates with an average age of 22 ranging from 20 to 25. However, the
occupants in a real office may have a wider range of age and they might have
different preference when using the 2-fan system. Therefore, the study would be more
CHAPTER 5 CONCLUSIONS
81
value-added if more people from a variety of backgrounds and ages can participate in
the subjective study.
In addition, there were only two kinds of polluting source, namely point and plane
source in the pollutant transportation study. Meanwhile, polluting source was placed
in front of thermal manikin on the desk in the room. The results may be different
with the location and emitting type of polluting source.
5.4 Recommendations for future work
With the conclusions drawn from this study, future research can be pursued in the
following directions:
1) The fans can be integrated to the armrest or displaced by a well-proportioned air
flow generated machine to the whole body of the chair to allow the mild and
uniform air flow around occupants. The angle and speed of the fans can be
adjusted continuously to allow for more refine control by the occupants.
2) With the better understanding of the application of enhanced DV system in this
study, it can be expanded to a larger and more complex study in an office with
more occupants. The background and age of the subjects can be expanded to a
wide range to simulate the realistic constitute of office occupants. The realistic
disturbances of occupants can be generated, such as by walking occupants and
changes in occupants‟ activities.
3) A more in depth study on the effect of locations of polluting source (line and
CHAPTER 5 CONCLUSIONS
82
point types) on the exposure level at the breathing zone is necessary. It is
believed the contaminant distribution by various locations of source might be
different. The future work should verify this.
4) Future work can also extend the research of 2-fan enhanced DV system from
tropical regions to temperate regions. It will be meaningful to investigate if there
are any differences in the acceptance of the enhanced DV system among
tropically-acclimatized subjects and temperate subjects.
BIBLIOGRAPHY
83
BIBLIOGRAPHY
Akimoto, T., et al. (1995). Experimental Study on the Floor-supply Displacement
Ventilation System, ASHRAE Transactions, 101(2), 912-925.
Akimoto, T., Nobe, T., Tanabe, S. and Kimura, K. (1999). Floor-supply displacement
airconditioning: Laboratory experiments. ASHRAE Transactions, 105, 739-748.
ASHRAE. 2005. ASHRAE Handbook, Fundamentals, SI Edition. Atlanta: American
Society of Heating, Refrigeration and Air Conditioning Engineers, Inc.
ASHRAE Standard 55. (2004). Thermal environmental conditions for human
occupancy. Atlanta, Ga: American Society of Heating, Refrigerating and
Air-Conditioning Engineers.
Berglund, L.G. (1995). Comfort criteria: Humidity and standards. In: Proceedings of
Pan Pacific Symposium on Building and Urban Environmental Condition in Asia,
2, pp. 369-82. Architecture Department, University of Nagoya, Japan.
Breum, N.O. and Orhede, E. (1994). Dilution versus displacement ventilation-
environment conditions in a garment sewing plant. Am Ind Hyg Assoc J, 55,
140-148.
Brohus, H. (1997). Personal exposure to contaminant sources in ventilated room.
Ph.D. Thesis. Department of Building Technology and Structure Engineering,
Aalborg University.
CEN, CR 1752. (1998). CEN/CR Standard 1752-1998, Ventilation for buildings-
design criteria for the indoor environment. European Committee for
Standardization, Geneva.
Cermak, R., Melikov, A.K., Forejt, L. and Kovar, O. (2004). Distribution of
contaminants in the occupied zone of a room with personalized and displacement
ventilation. In: Proceedings of the 9th International Conference on Air
Distribution in rooms-Room Vent‟2004, pp. 78-79. Portugal.
Chen, Q.Y. and Van De Kooi, J. (1988). Accuracy- a program for combined problems
of energy analysis, indoor airflow, and air quality. ASHRAE Transactions, 94(2),
196-214.
Cheong, K. W. D., Djunaedy, E., Chua, Y. L., Tham, K. W., Sekhar, S. C., Wong, N.
H., and Ullah, M. B., (2003) Thermal Comfort Study of An Air-conditioned
Lecture Theatre in the Tropics. Building and Environment, 38, 63-73.
Cheong K.W.David. (2004). Evaluation of displacement ventilation system in the
tropics. Department of Building, National University of Singapore.
Cheong, K. W. D., Yu, W. J., Kosonen, R., Tham, K. W., and Sekhar, S. C. (2006)
Assessment of Thermal Environment Using A Thermal Manikin in A Field
Environment Chamber Served by Displacement Ventilation System. Building and
BIBLIOGRAPHY
84
Environment, 41, 1661-1670.
Cheong, K. W. D., Yu, W. J., Sekhar, S. C., Tham, K. W., and Kosonen, R. (2007)
Local Thermal Sensation and Comfort Study in A Field Environment Chamber
Served by Displacement Ventilation System in the Tropics. Building and
Environment, 42, 525-533.
De Dear, R.J.,Leow, K.G. and Foo, S.C. (1991). Thermal comfort in the humid tropics:
Field experiments in air conditioned and naturally ventilated buildings in
Singapore. International Journal of Biometeorology, 34, 259-265.
Fang, L. (2000). Temperature and humidity: Important factors for perception of air
quality and for ventilation requirement. ASHRAE Transactions, 106(2), 503-510.
Fanger, P.O. (1972). Thermal comfort – analysis and application in environmental
engineering. McGraw-Hill Book Company.
Fanger, P.O. (1977). Local discomfort to the human body caused by non-uniform
thermal environments. The Annals of Occupational Hygiene, 20(3): 285-291.
Fanger. P.O. and Pedersen, C.J.K. (1977). Discomfort due to air velocities in spaces.
In proceedings of the meeting of Commission B1, B2, E1 of the internation
institute refrigeration, Paris, pp289-296.
Fanger, P.O. and Christensen, N.K. (1986). Perception of draft in ventilated spaces.
Ergonomics, 29(2), 215-235.
Fanger, P.O., Melikov, A.K., Hanzawa, H. and Ring, J. (1988). Air turbulence and
sensation of draft. Energy and Building, 12, 21-39.
Flatheim, G. (1984). Air-conditioning without draft and noise. In: Proceedings of
Indoor Air‟84. Stockholm.
Gagge, A.P. (1937). A new physiological variable associated with sensible and
insensible perspiration. American Journal of Physiology, 23, 248.
Gan, G. (1995). Numerical investigation of local thermal discomfort in offices with
displacement ventilation. Energy and Buildings, 23, 73-81.
Gong, N., Tham, K.W., Melikov, D. P., Wyon, S. C. Sekhar and Cheong, K. W.
(2006). The acceptable air velocity range for local air movement in the tropics.
HVAC & R Research, International Journal of Heating, Ventilating and
Air-Conditioning Engineers (ASHRAE), 12(4), 1065-1076.
Hashimoto, Y. (2005, August). Numerical study on airflow in an office room with a
displacement ventilation system. In: Proceedings of IBPSA‟2005, Montreal.
He, G., Yang, X. and Srebric, J. (2005). Effects of source type and location on
contaminant dispersion in a displacement ventilated room. ASHRAE Transactions,
111(1), 646-652.
Hensel, H. (1973). Temperature reception and thermal comfort. Archives des Science
BIBLIOGRAPHY
85
Physiologiques, 27, A359-A 370.
Hensel, H. (1981). Thermoreception and temperature regulation. Academic Press,
London.
ISO 7730. (1994). Ergonomics of the thermal environments – Analytical
determination and interpretation of the thermal comfort using calculation of the
PMV and PPD indices and local thermal criteria. International Organization for
Standardization, Geneva.
John, D.S.. Jonathan, M.S.. and John, F. M. (2001). Indoor air quality handbook.
McGraw-Hill Professional.
Li, Y., Sandberg, M. and Fuchs, L. (1992). Vertical temperature profiles in rooms
ventilated by displacement: Full-scale measurement and nodal modeling. Indoor
Air, 2, 225-243.
Lin, Z., Chow, T.T, Tsang, C.F., Fong K.F., and Chan, L.S. (2006). Effects of
Headroom on the Performance of the Displacement Ventilation System. Indoor
and Built Environment, 15(4), 333 - 346.
Liu, C., Higuchi, H., Arens, E. and Zhang, H. (2009). Control of the microclimate
around the head with opposing jet local ventilation. In: Proceedings of Healthy
Buildings‟ 2009, Syracuse.
Mattsson, M., Smedje, G., Holmquist, L., Vesterberg, O. and Wålinder, R. (2003).
Mixing and displacement ventilation compared in classroom; distribution of
particles, cat allergen and CO2. In: Proceedings of Healthy Buildings‟2003, 2, pp.
458-464. Singapore.
Melikov, A. and Nielsen, J. (1989). Local thermal discomfort due to draft and vertical
temperature difference in rooms with displacement ventilation. ASHRAE
Transactions, 95(2), 1050-1057.
Melikov, A., Cermak, R., Kovar, O. and Forejt, L. (2003). Impact of airflow
interaction on inhaled air quality and transport of contaminants in rooms with
personalized and total volume ventilation. In: Proceedings of Healthy
Buildings‟2003, 2, pp. 592-597. Singapore.
Melikov, A., Pitchurov, G., Naydenov, K. and Langkilde, G. (2005). Field study on
occupant comfort and the office thermal environment in rooms with displacement
ventilation. Indoor Air, 15, 205-214.
Mundt, E. (1990). Convection flows above common heat sources in rooms with
displacement ventilation. In: Proceedings of Roomvent‟90, Oslo.
Mundt, E. (1994). Contamination distribution in displacement ventilation-influence of
disturbances. Building and Environment, 29, 311-317.
Mundt, E. (2001). Non-buoyant pollutant sources and particles in displacement
ventilation. Building and Environment, 36, 829-836.
BIBLIOGRAPHY
86
Murakami, S., Kato, S. and Zeng, J. (1998). Numerical simulation of contaminant
distribution around a modelled human body: CFD study on computational thermal
manikin - Part II. ASHRAE Transactions, 104(2), 226-233.
Nielsen, P.V. (1988). Displacement ventilation in a room with low-level diffusers.
Kaelte-Klima-Tagung, Deutscher Kaelte- und Klimatechnischer Vereine. V.,
Munich.
Nielsen, P.V., Larsen, T.S. and Topp, C. (2003). Design methods for air distribution
systems and comparison between mixing ventilation and displacement ventilation.
In: Proceedings of Healthy Buildings‟2003, 2, pp. 492-497. Singapore.
Niemelä, R., Koskela, H. and Engström, K. (2001). Stratification of welding fumes
and grinding particles in a large factory hall equipped with displacement
ventilation. Ann. Occup. Hyg. 45 (6), 467-471.
Nishioka, T., Ohtaka, K., Hashimoto, N. and Onojima, H. (2000). Measurement and
evaluation of the indoor thermal environment in a large domed stadium. Energy
and Buildings, 32, 217-223.
Olesen, B.W. (2004). The role of indoor climate in the European energy performance
of buildings directive (EPBD). In: Proceedings of Roomvent‟2004. Portugal.
Pitchurov, G., Naidenov, K., Melikov, A. and Langkilde, G. (2002). Field survey of
occupants thermal comfort in rooms with displacement ventilation. In:
Proceedings of Roomvent‟2002, pp. 479-482, Copenhagen.
Riffat, S.B., Zhao, X. and Doherty, P.S. (2004). Review of research into and
application of chilled ceilings and displacement ventilation systems in Europe.
International Journal of Energy Research, l28, 257-286.
Seppänen, O. and Fisk, W.J. (2005). Some quantitative relations between indoor
environmental quality and work performance of health. In: Proceedings of Indoor
Air‟2005, pp. 40-53. Beijing.
Skistad, H., Mundt, E., Nielsen, P.V., Hagström,K. and Railio, J. (2002).
Displacement ventilation in non-industrial premises. Guidebook No 1, REHVA.
Sun, W.M. (2010). Study of enhanced displacement ventilation in office environment
in the tropics. Ph.D. Thesis. Department of Building, National University of
Singapore.
Tham K.W. (2004). Effects of temperature and outdoor air supply rate on the
performance of call centre operators in the tropics. Indoor Air, 14, Suppl. 7,
119-125.
Toftum, J. and Nielsen, R. (1996). Draft sensitivity is influenced by general thermal
sensation. Industrial Ergonomics, 18, 205-305.
Toftum, J., Zhou, G., Melikov, A. (1997). Airflow direction and human sensitivity to
draught. In: Proceeding of CLIMA‟ 2000, Brussels.
BIBLIOGRAPHY
87
Wargocki, P., Fanger, P.O., Krupicz, P. and Szczecinski, A. (2004a). Sensory
pollution loads in six office buildings and a department store. Energy and
Buildings, 36, 995-1001.
Wargocki, P., Wyon, D.P. and Fanger, P.O. (2004b). The performance and subjective
responses of call-centre operators with new and used supply air filters at two
outdoor air supply rates. Indoor Air, 14, Suppl. 8, 7-16.
Wargocki, P., Wyon, D., Matysiak, B. and Irgens, S. (2005). The effects of classroom
air temperature and outdoor air supply rate on performance of school work by
children. In: Proceedings of Indoor Air‟2005, pp. 368-372. Beijing.
WHO. (1999). Guidelines for Air Quality, pp. 67-76. Geneva.
Wyon, D.P. and Sandberg, M. (1990). Thermal manikin prediction of discomfort due
to displacement ventilation. ASHRAE Transactions. 96, (1), 67–75.
Wyon, D. P. and Sandberg, M. (1996) Discomfort Due to Vertical Thermal Gradients.
In: Proceedings of Indoor Air ‟1996, pp 48-54. Nagoya.
Xia, Y.Z., Niu, J. L., Zhao, R. Y. and Burnett, J. (2000). Effects of turbulent air on
human thermal sensations in a warm isothermal environment. Indoor Air, 10(4),
289-296.
Xu, M., Yamanaka, T. and Kotani, H. (2001). Vertical profiles of temperature and
contaminant concentration in rooms ventilated by displacement with heat loss
through room envelopes. Indoor Air, 11(2), 111-119.
Yang, X., Srebric, J., Li, X. and He, G. (2004). Performance of three air distribution
systems in VOC removal from an area source. Building and Environment, 39,
1289-1299.
Yu, W.J. (2006). Indoor environmental effects of vertical air temperature gradients in
displacement ventilated spaces in the tropics. Ph.D. Thesis. Department of
Building, National University of Singapore.
Yuan, X., Chen, Q. and Glicksman, L.R. (1999a). Performance evaluation and design
guidelines for displacement ventilation. ASHRAE Transactions, 105(1), 298-309.
Yuan, X., Chen, Q., Glicksman, L.R., Hu, Y. and Yang, X. (1999b). Measurements
and computations of room airflow with displacement ventilation. ASHRAE
Transactions, 105(1), 340-352.
Yuan, X., Chen, Q. and Glicksman, L.R. (1999c). Models for prediction of
temperature difference and ventilation effectiveness with displacement ventilation.
ASHRAE Transactions, 105 (1), 353-367.
Zhang, H. (2003). Human thermal sensation and comfort in transient and non-uniform
thermal environment. PhD Thesis. University of California, Berkeley.
Zhang, L., Chow, T.T., Fong, K.F., Tsang, C.F and Wang, Q. (2005). Comparison of
BIBLIOGRAPHY
88
performances of displacement and mixing ventilations. Part II: Indoor air quality.
International Journal of Refrigeration, 28, 288-305.
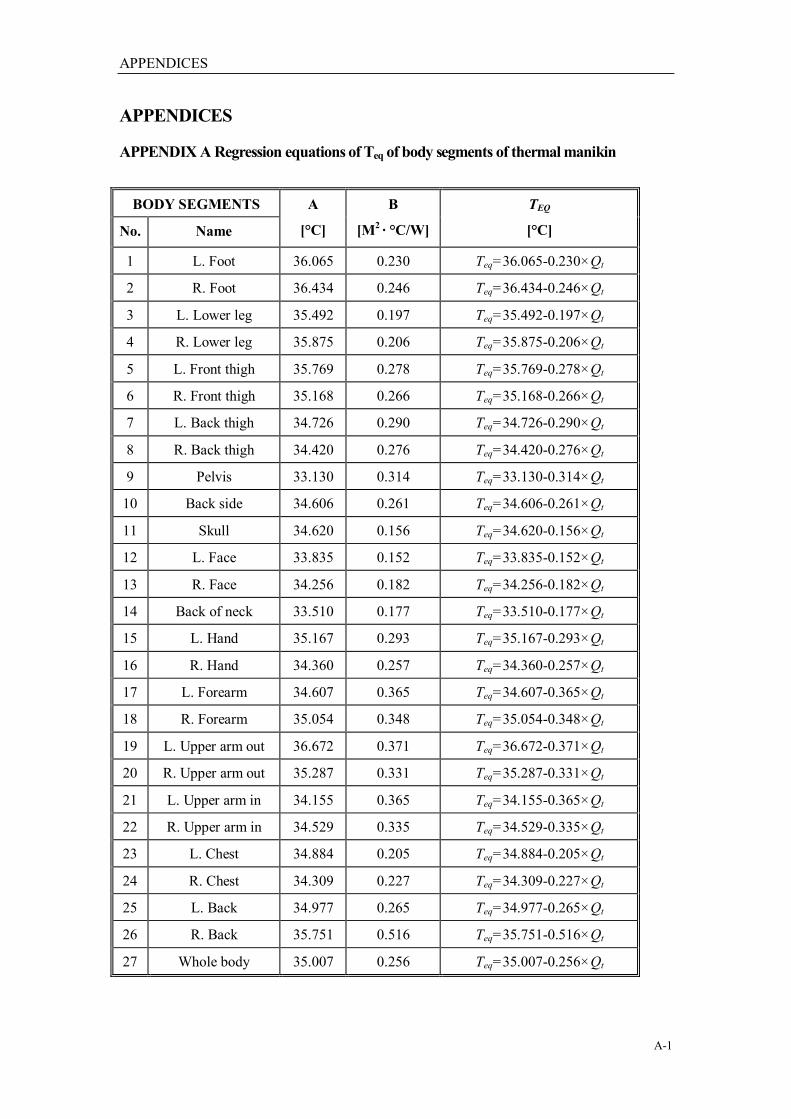
APPENDICES
A-1
APPENDICES
APPENDIX A Regression equations of Teq of body segments of thermal manikin
BODY SEGMENTS A
[°C]
B
[M2 ∙ °C/W]
TEQ
[°C] No. Name
1 L. Foot 36.065 0.230 Teq=36.065-0.230×Qt
2 R. Foot 36.434 0.246 Teq=36.434-0.246×Qt
3 L. Lower leg 35.492 0.197 Teq=35.492-0.197×Qt
4 R. Lower leg 35.875 0.206 Teq=35.875-0.206×Qt
5 L. Front thigh 35.769 0.278 Teq=35.769-0.278×Qt
6 R. Front thigh 35.168 0.266 Teq=35.168-0.266×Qt
7 L. Back thigh 34.726 0.290 Teq=34.726-0.290×Qt
8 R. Back thigh 34.420 0.276 Teq=34.420-0.276×Qt
9 Pelvis 33.130 0.314 Teq=33.130-0.314×Qt
10 Back side 34.606 0.261 Teq=34.606-0.261×Qt
11 Skull 34.620 0.156 Teq=34.620-0.156×Qt
12 L. Face 33.835 0.152 Teq=33.835-0.152×Qt
13 R. Face 34.256 0.182 Teq=34.256-0.182×Qt
14 Back of neck 33.510 0.177 Teq=33.510-0.177×Qt
15 L. Hand 35.167 0.293 Teq=35.167-0.293×Qt
16 R. Hand 34.360 0.257 Teq=34.360-0.257×Qt
17 L. Forearm 34.607 0.365 Teq=34.607-0.365×Qt
18 R. Forearm 35.054 0.348 Teq=35.054-0.348×Qt
19 L. Upper arm out 36.672 0.371 Teq=36.672-0.371×Qt
20 R. Upper arm out 35.287 0.331 Teq=35.287-0.331×Qt
21 L. Upper arm in 34.155 0.365 Teq=34.155-0.365×Qt
22 R. Upper arm in 34.529 0.335 Teq=34.529-0.335×Qt
23 L. Chest 34.884 0.205 Teq=34.884-0.205×Qt
24 R. Chest 34.309 0.227 Teq=34.309-0.227×Qt
25 L. Back 34.977 0.265 Teq=34.977-0.265×Qt
26 R. Back 35.751 0.516 Teq=35.751-0.516×Qt
27 Whole body 35.007 0.256 Teq=35.007-0.256×Qt
APPENDICES
B-1
APPENDIX B Questionnaire
Appendix B.1: Questionnaire for condition with fan
Questionnaire 1 Before entering chamber
Name: ______________ Sex: ________ Age: ________ Height: _______
Weight: ________ Date: __________ Time: __________ Workstation No: ________
1. Please assess your thermal sensation for the whole body:
Cold Cool Slightly cool Neutral Slightly warm Warm Hot
-3 -2 -1 0 +1 +2 +3
2. Please assess your thermal comfort level for the whole body:
Much too
cold
Too
cold
Comfortably
cool
Neither warm nor
cool
Comfortably
warm
Too
hot
Much too
hot
-3 -2 -1 0 +1 +2 +3
3. Please assess the acceptability of the thermal condition:
4. Please assess the odor intensity:
No
Very
strong
Slight
Moderate
Strong
+1
-1
0
Very
Unacceptable
Just
Unacceptable
-1
+1
Very
Acceptable
Just
Acceptable
APPENDICES
B-2
5. Please assess the perceived air quality:
6. Please assess the environment:
a. Too humid |_____________________|_____________________| Too dry
b. Air stuffy |_____________________|_____________________| Air fresh
c. Too bright |_____________________|_____________________| Too dark
d. Too noisy |_____________________|_____________________| Too quiet
Very
Unacceptable
Just
Unacceptable
Just
Acceptable
Very
Acceptable
+1
-1
+1
+1
+1
+1
-1
-1
-1
-1
0
0
0
0
APPENDICES
B-3
Questionnaire 2-1 Right after entering chamber
1. Please enter a number in each box in the diagram below to indicate the thermal sensation
of each body section and the whole body at this moment. The 7-value numerical scale to be
used appears in the table below:
Cold Cool Slightly
cool
Neutral Slightly
warm
Warm Hot
-3 -2 -1 0 +1 +2 +3
Assess the thermal
sensation of your
whole body
H
C
LA
LH
LT
LC
LF
RF
WB
RC
RT
RH
RA
T
S
B
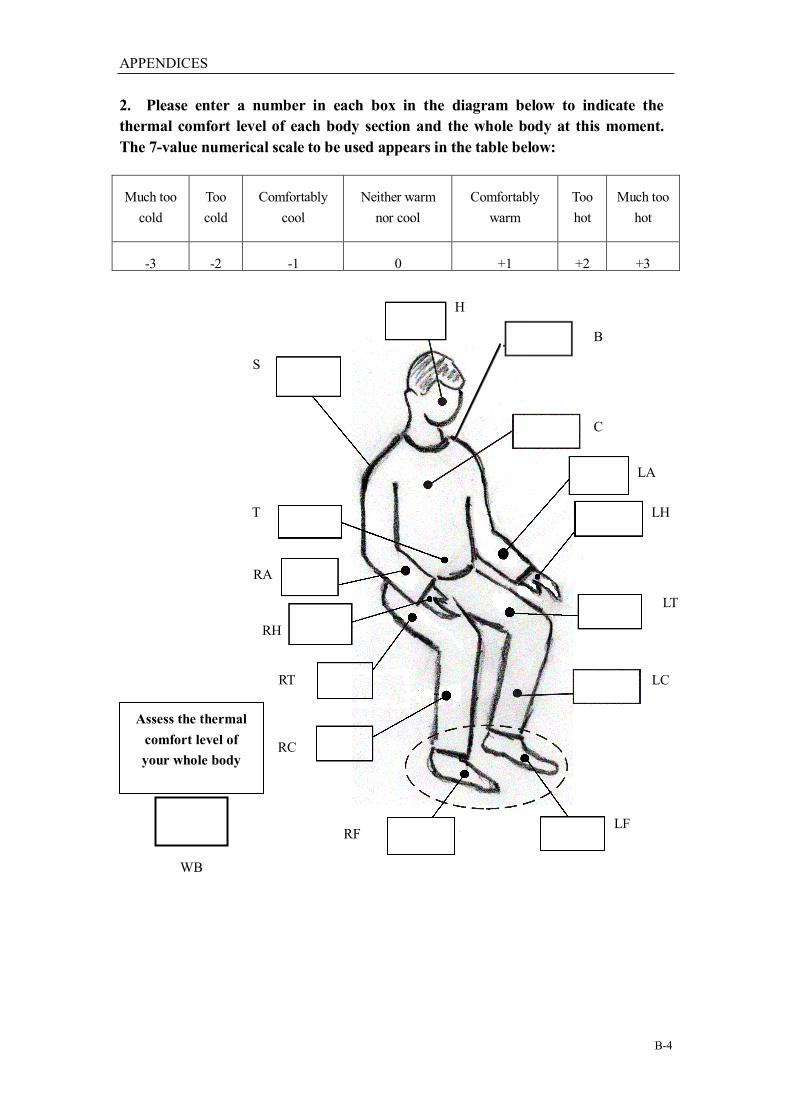
APPENDICES
B-4
2. Please enter a number in each box in the diagram below to indicate the
thermal comfort level of each body section and the whole body at this moment.
The 7-value numerical scale to be used appears in the table below:
Much too
cold
Too
cold
Comfortably
cool
Neither warm
nor cool
Comfortably
warm
Too
hot
Much too
hot
-3 -2 -1 0 +1 +2 +3
Assess the thermal
comfort level of
your whole body
H
C
LA
LH
LT
LC
LF
RF
WB
RC
RT
RH
RA
T
S
B
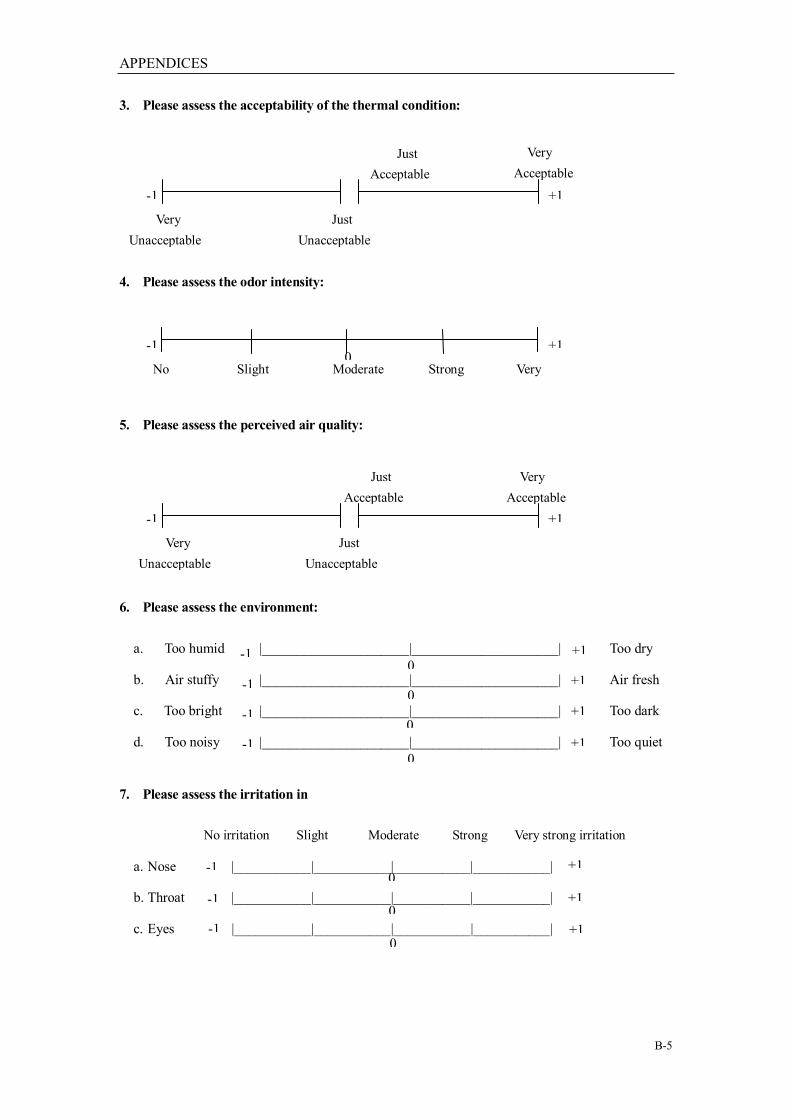
APPENDICES
B-5
3. Please assess the acceptability of the thermal condition:
4. Please assess the odor intensity:
5. Please assess the perceived air quality:
6. Please assess the environment:
a. Too humid |_____________________|_____________________| Too dry
b. Air stuffy |_____________________|_____________________| Air fresh
c. Too bright |_____________________|_____________________| Too dark
d. Too noisy |_____________________|_____________________| Too quiet
7. Please assess the irritation in
No irritation Slight Moderate Strong Very strong irritation
a. Nose |___________|___________|___________|___________|
b. Throat |___________|___________|___________|___________|
c. Eyes |___________|___________|___________|___________|
Very
Unacceptable
Just
Unacceptable
Just
Acceptable
Very
Acceptable
+1
-1
No
Very
strong
Slight
Moderate
Strong
+1
-1
0
Very
Unacceptable
Just
Unacceptable
-1
+1
-1
-1
-1
+1
+1
+1
0
0
0
Very
Acceptable
Just
Acceptable
+1
+1
+1
-1
-1
-1
-1
0
0
0
0
+1
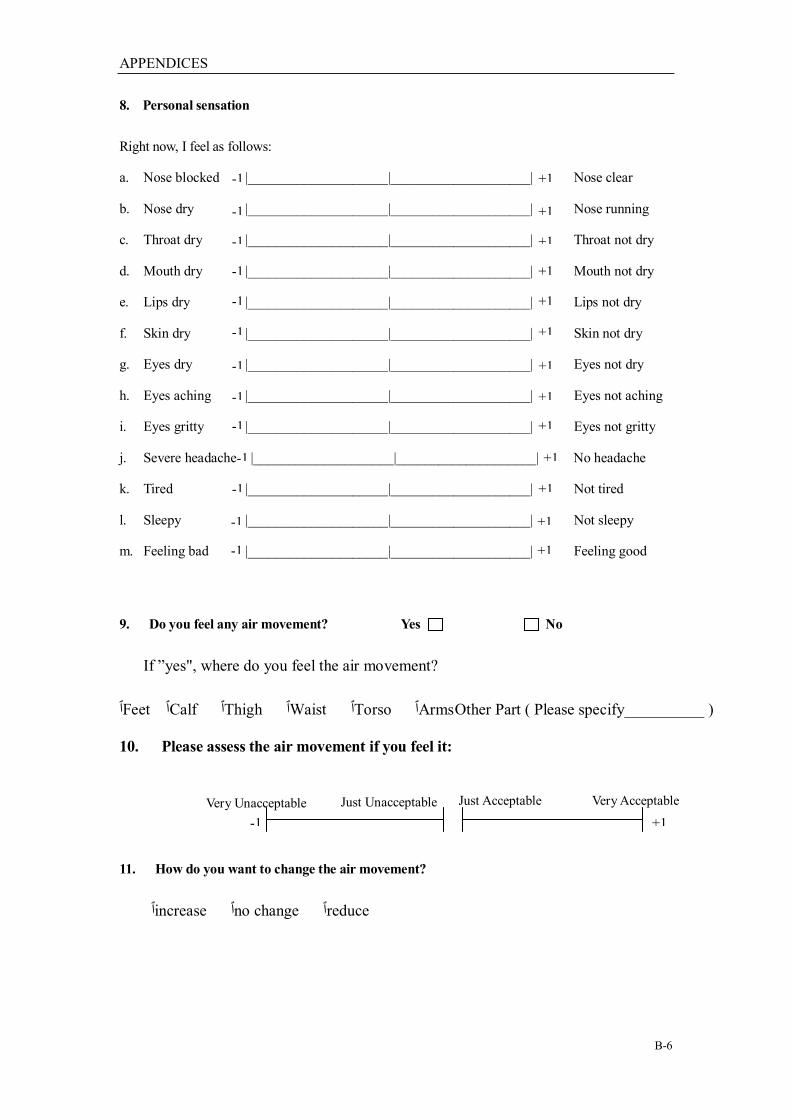
APPENDICES
B-6
8. Personal sensation
Right now, I feel as follows:
a. Nose blocked |____________________|____________________| Nose clear
b. Nose dry |____________________|____________________| Nose running
c. Throat dry |____________________|____________________| Throat not dry
d. Mouth dry |____________________|____________________| Mouth not dry
e. Lips dry |____________________|____________________| Lips not dry
f. Skin dry |____________________|____________________| Skin not dry
g. Eyes dry |____________________|____________________| Eyes not dry
h. Eyes aching |____________________|____________________| Eyes not aching
i. Eyes gritty |____________________|____________________| Eyes not gritty
j. Severe headache |____________________|____________________| No headache
k. Tired |____________________|____________________| Not tired
l. Sleepy |____________________|____________________| Not sleepy
m. Feeling bad |____________________|____________________| Feeling good
9. Do you feel any air movement? Yes No
If ”yes", where do you feel the air movement?
Arms Other Part ( Please specify__________ )ٱ Torsoٱ Waistٱ Thighٱ Calfٱ Feetٱ
10. Please assess the air movement if you feel it:
11. How do you want to change the air movement?
reduceٱ no changeٱ increaseٱ
-1
+1
Just Acceptable
+1
-1
0
+1
-1
0
+1
-1
0
+1
-1
0
+1
-1
0
+1
-1
0
+1
-1
0
+1
-1
0
+1
-1
0
+1
-1
0
+1
-1
0
+1
-1
0
+1
-1
0
Very Unacceptable Just Unacceptable Very Acceptable

APPENDICES
B-7
Questionnaire 2-2 When time = 20 minutes
1. Please enter a number in each box in the diagram below to indicate the thermal sensation
of each body section and the whole body at this moment. The 7-value numerical scale to be
used appears in the table below:
Cold Cool Slightly
cool
Neutral Slightly
warm
Warm Hot
-3 -2 -1 0 +1 +2 +3
Assess the thermal
sensation of your
whole body
H
C
LA
LH
LT
LC
LF
RF
WB
RC
RT
RH
RA
T
S
B

APPENDICES
B-8
2. Please enter a number in each box in the diagram below to indicate the
thermal comfort level of each body section and the whole body at this moment.
The 7-value numerical scale to be used appears in the table below:
Much too
cold
Too
cold
Comfortably
cool
Neither warm
nor cool
Comfortably
warm
Too
hot
Much too
hot
-3 -2 -1 0 +1 +2 +3
Assess the thermal
comfort level of
your whole body
H
C
LA
LH
LT
LC
LF
RF
WB
RC
RT
RH
RA
T
S
B
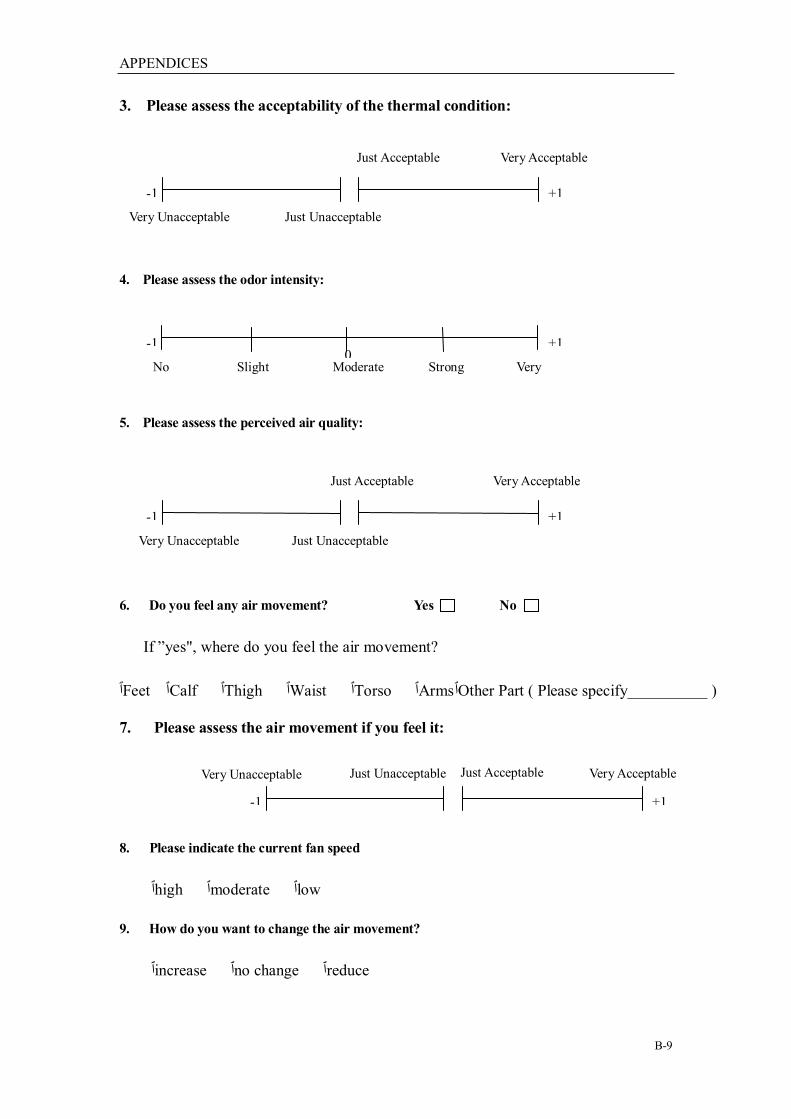
APPENDICES
B-9
3. Please assess the acceptability of the thermal condition:
4. Please assess the odor intensity:
5. Please assess the perceived air quality:
6. Do you feel any air movement? Yes No
If ”yes", where do you feel the air movement?
Other Part ( Please specify__________ )ٱ Armsٱ Torsoٱ Waistٱ Thighٱ Calfٱ Feetٱ
7. Please assess the air movement if you feel it:
8. Please indicate the current fan speed
lowٱ moderateٱ highٱ
9. How do you want to change the air movement?
reduceٱ no changeٱ increaseٱ
-1
+1
Very Unacceptable Just Unacceptable
Just Acceptable Very Acceptable
+1
-1
No
Very
strong
Slight
Moderate
Strong
+1
-1
0
Very Unacceptable Just Unacceptable
Just Acceptable Very Acceptable
-1
+1
Just Acceptable Just Unacceptable Very Unacceptable Very Acceptable

APPENDICES
B-10
Questionnaire 2-3 When time = 40 minutes
1. Please enter a number in each box in the diagram below to indicate the thermal sensation
of each body section and the whole body at this moment. The 7-value numerical scale to be
used appears in the table below:
Cold Cool Slightly
cool
Neutral Slightly
warm
Warm Hot
-3 -2 -1 0 +1 +2 +3
Assess the thermal
sensation of your
whole body
H
C
LA
LH
LT
LC
LF
RF
WB
RC
RT
RH
RA
T
S
B
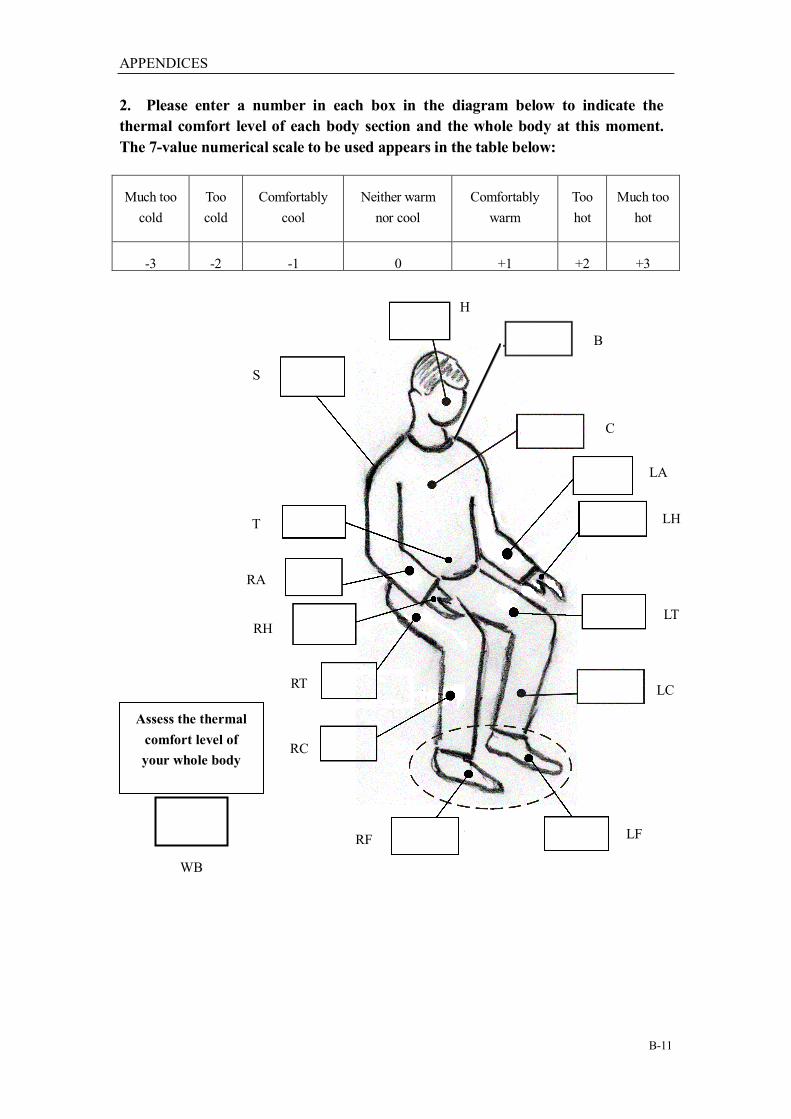
APPENDICES
B-11
2. Please enter a number in each box in the diagram below to indicate the
thermal comfort level of each body section and the whole body at this moment.
The 7-value numerical scale to be used appears in the table below:
Much too
cold
Too
cold
Comfortably
cool
Neither warm
nor cool
Comfortably
warm
Too
hot
Much too
hot
-3 -2 -1 0 +1 +2 +3
Assess the thermal
comfort level of
your whole body
H
C
LA
LH
LT
LC
LF
RF
WB
RC
RT
RH
RA
T
S
B
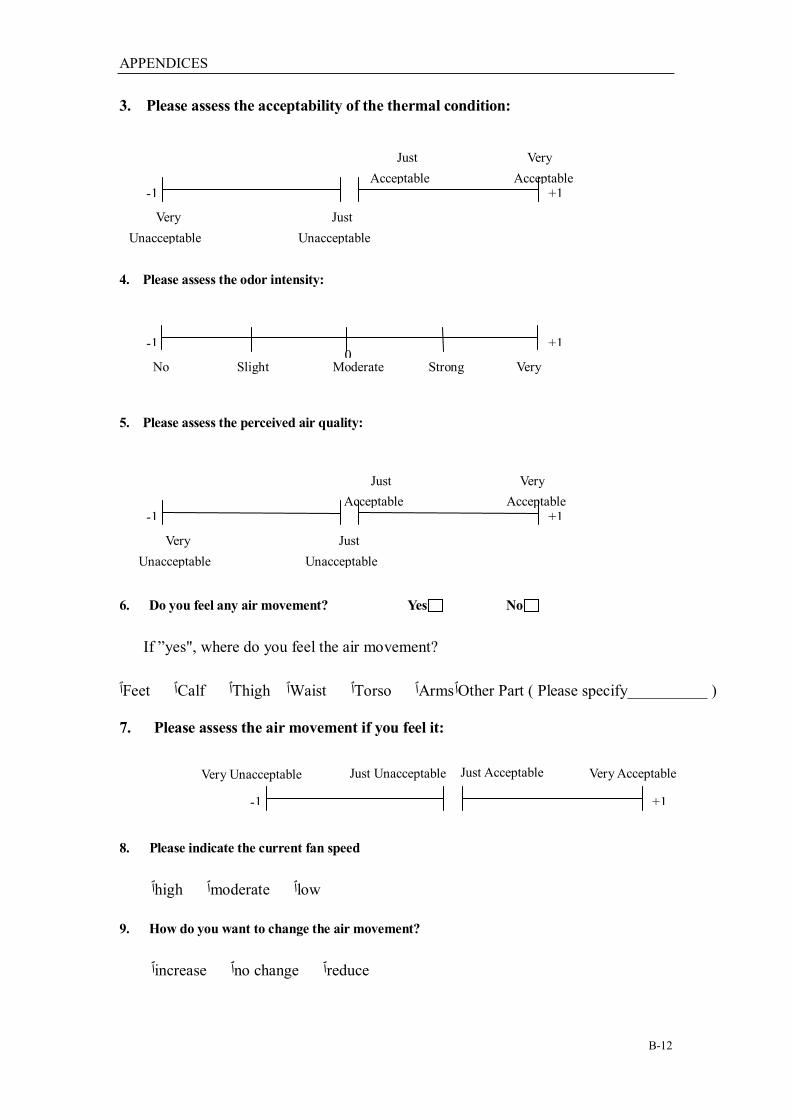
APPENDICES
B-12
3. Please assess the acceptability of the thermal condition:
4. Please assess the odor intensity:
5. Please assess the perceived air quality:
6. Do you feel any air movement? Yes No
If ”yes", where do you feel the air movement?
Other Part ( Please specify__________ )ٱ Armsٱ Torsoٱ Waistٱ Thighٱ Calfٱ Feetٱ
7. Please assess the air movement if you feel it:
8. Please indicate the current fan speed
lowٱ moderateٱ highٱ
9. How do you want to change the air movement?
reduceٱ no changeٱ increaseٱ
-1
+1
Very
Unacceptable
Just
Unacceptable
Just
Acceptable
Very
Acceptable
+1
-1
No
Very
strong
Slight
Moderate
Strong
+1
-1
0
Very
Unacceptable
Just
Unacceptable
Just
Acceptable
Very
Acceptable
-1
+1
Just Acceptable Just Unacceptable Very Unacceptable Very Acceptable

APPENDICES
B-13
Questionnaire 2-4 When time = 60 minutes
1. Please enter a number in each box in the diagram below to indicate the thermal sensation
of each body section and the whole body at this moment. The 7-value numerical scale to be
used appears in the table below:
Cold Cool Slightly
cool
Neutral Slightly
warm
Warm Hot
-3 -2 -1 0 +1 +2 +3
Assess the thermal
sensation of your
whole body
H
C
LA
LH
LT
LC
LF
RF
WB
RC
RT
RH
RA
T
S
B
APPENDICES
B-14
2. Please enter a number in each box in the diagram below to indicate the
thermal comfort level of each body section and the whole body at this moment.
The 7-value numerical scale to be used appears in the table below:
Much too
cold
Too
cold
Comfortably
cool
Neither warm
nor cool
Comfortably
warm
Too
hot
Much too
hot
-3 -2 -1 0 +1 +2 +3
Assess the thermal
comfort level of
your whole body
H
C
LA
LH
LT
LC
LF
RF
WB
RC
RT
RH
RA
T
S
B

APPENDICES
B-15
3. Please assess the acceptability of the thermal condition:
4. Please assess the odor intensity:
5. Please assess the perceived air quality:
6. Do you feel any air movement? Yes No
If ”yes", where do you feel the air movement?
Other Part ( Please specify__________ )ٱ Armsٱ Torsoٱ Waistٱ Thighٱ Calfٱ Feetٱ
7. Please assess the air movement if you feel it:
8. Please indicate the current fan speed
lowٱ moderateٱ highٱ
9. How do you want to change the air movement?
reduceٱ no changeٱ increaseٱ
-1
+1
Very Unacceptable Just Unacceptable
Just Acceptable Very Acceptable
+1
-1
No
Very
strong
Slight
Moderate
Strong
+1
-1
0
Very Unacceptable Just Unacceptable
Just Acceptable Very Acceptable
-1
+1
Just Acceptable Just Unacceptable Very Unacceptable Very Acceptable
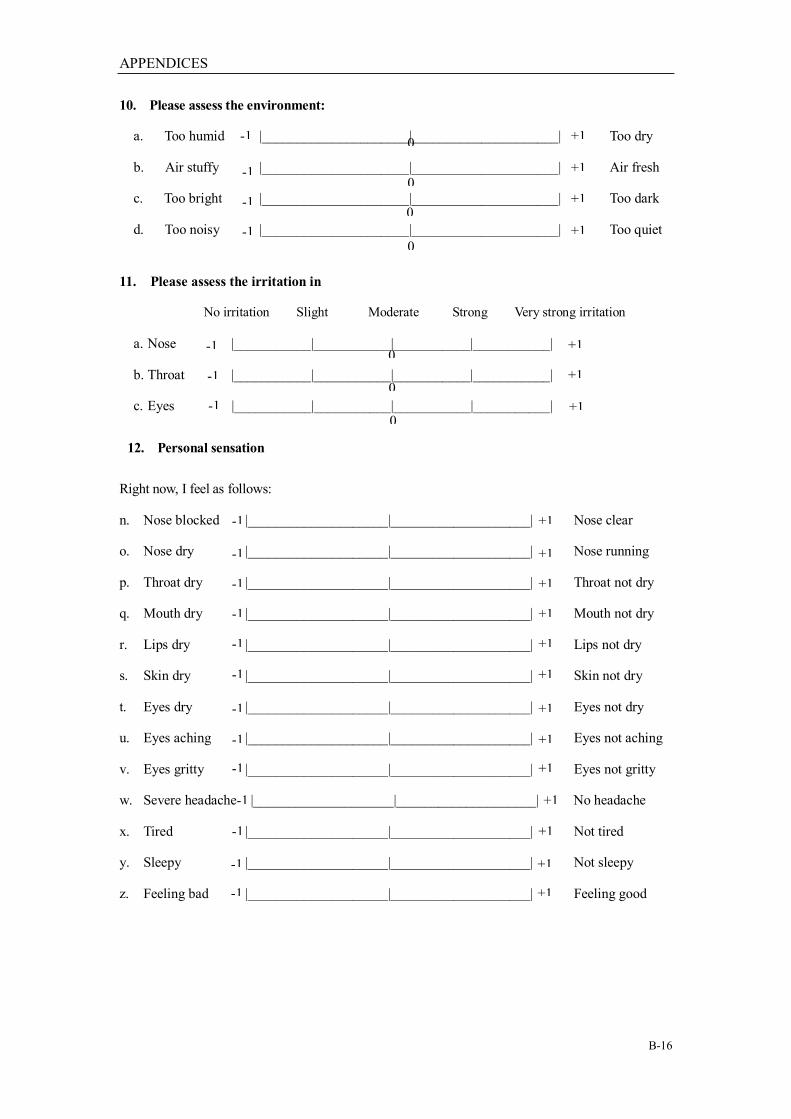
APPENDICES
B-16
10. Please assess the environment:
a. Too humid |_____________________|_____________________| Too dry
b. Air stuffy |_____________________|_____________________| Air fresh
c. Too bright |_____________________|_____________________| Too dark
d. Too noisy |_____________________|_____________________| Too quiet
11. Please assess the irritation in
No irritation Slight Moderate Strong Very strong irritation
a. Nose |___________|___________|___________|___________|
b. Throat |___________|___________|___________|___________|
c. Eyes |___________|___________|___________|___________|
12. Personal sensation
Right now, I feel as follows:
n. Nose blocked |____________________|____________________| Nose clear
o. Nose dry |____________________|____________________| Nose running
p. Throat dry |____________________|____________________| Throat not dry
q. Mouth dry |____________________|____________________| Mouth not dry
r. Lips dry |____________________|____________________| Lips not dry
s. Skin dry |____________________|____________________| Skin not dry
t. Eyes dry |____________________|____________________| Eyes not dry
u. Eyes aching |____________________|____________________| Eyes not aching
v. Eyes gritty |____________________|____________________| Eyes not gritty
w. Severe headache |____________________|____________________| No headache
x. Tired |____________________|____________________| Not tired
y. Sleepy |____________________|____________________| Not sleepy
z. Feeling bad |____________________|____________________| Feeling good
+1
+1
+1
-1
-1
-1
-1
0
0
0
0
-1
-1
-1
+1
+1
+1
0
0
0
+1
-1
0
+1
-1
0
+1
-1
0
+1
-1
0
+1
-1
0
+1
-1
0
+1
-1
0
+1
-1
0
+1
-1
0
+1
-1
0
+1
-1
0
+1
-1
0
+1
-1
0
+1
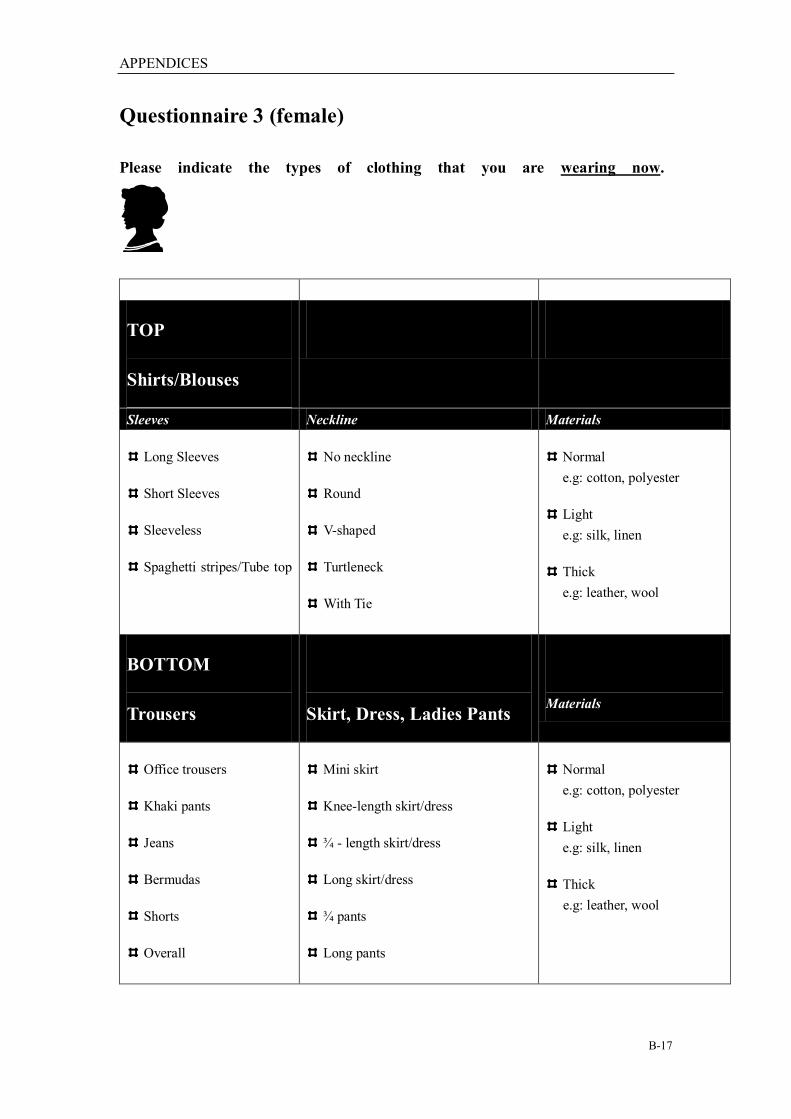
APPENDICES
B-17
Questionnaire 3 (female)
Please indicate the types of clothing that you are wearing now.
TOP
Shirts/Blouses
Sleeves Neckline Materials
Long Sleeves
Short Sleeves
Sleeveless
Spaghetti stripes/Tube top
No neckline
Round
V-shaped
Turtleneck
With Tie
Normal
e.g: cotton, polyester
Light
e.g: silk, linen
Thick
e.g: leather, wool
BOTTOM
Trousers
Skirt, Dress, Ladies Pants
Materials
Office trousers
Khaki pants
Jeans
Bermudas
Shorts
Overall
Mini skirt
Knee-length skirt/dress
¾ - length skirt/dress
Long skirt/dress
¾ pants
Long pants
Normal
e.g: cotton, polyester
Light
e.g: silk, linen
Thick
e.g: leather, wool
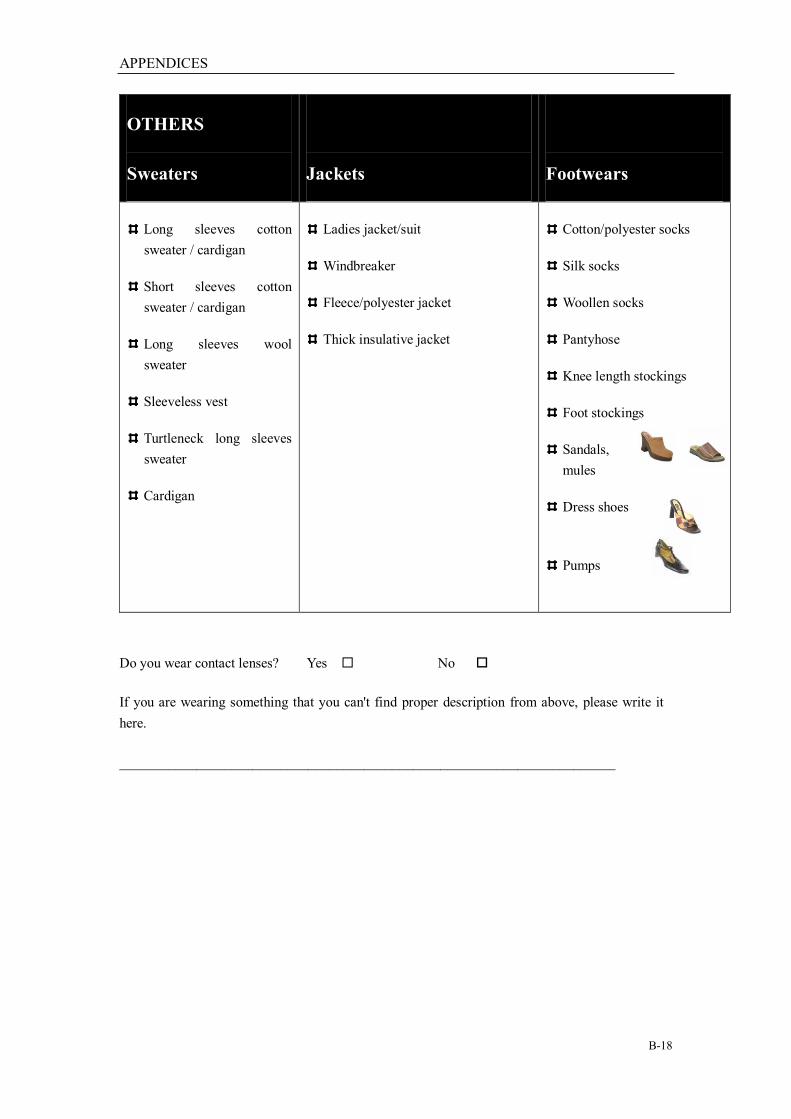
APPENDICES
B-18
OTHERS
Sweaters
Jackets
Footwears
Long sleeves cotton
sweater / cardigan
Short sleeves cotton
sweater / cardigan
Long sleeves wool
sweater
Sleeveless vest
Turtleneck long sleeves
sweater
Cardigan
Ladies jacket/suit
Windbreaker
Fleece/polyester jacket
Thick insulative jacket
Cotton/polyester socks
Silk socks
Woollen socks
Pantyhose
Knee length stockings
Foot stockings
Sandals,
mules
Dress shoes
Pumps
Do you wear contact lenses? Yes No
If you are wearing something that you can't find proper description from above, please write it
here.
_______________________________________________________________________

APPENDICES
B-19
Questionnaire 3 (male)
Please indicate the types of clothing that you are wearing now.
TOP
Shirts
Sleeves Materials
Long Sleeves
Short Sleeves
Normal
e.g: cotton, polyester
Light
e.g: silk, linen
Thick
e.g: leather, wool
Undergarment
Long sleeves T-shirt
Sleeveless Singlet
Short sleeves T-shirt
Others. Please specify
____________________________
BOTTOM
Trousers
Materials
Office trousers
Khaki pants
Jeans
Bermudas
Shorts
Overall
Normal
e.g: cotton, polyester
Light
e.g: silk, linen
Thick
e.g: leather, wool

APPENDICES
B-20
OTHERS
Sweaters
Jackets
Footwears
Long sleeves cotton
sweater / cardigan
Short sleeves cotton
sweater / cardigan
Long sleeves wool
sweater
Sleeveless vest
Turtleneck long sleeves
sweater
Cardigan
Windbreaker
Fleece/polyester jacket
Thick insulative jacket
Cotton/polyester socks
Silk socks
Woollen socks
Pantyhose
Foot stockings
Leather Shoes
Sports Shoes
Open toes
shoes
Do you wear contact lenses? Yes No
If you are wearing something that you can't find proper description from above, please write it
here.
_______________________________________________________________________
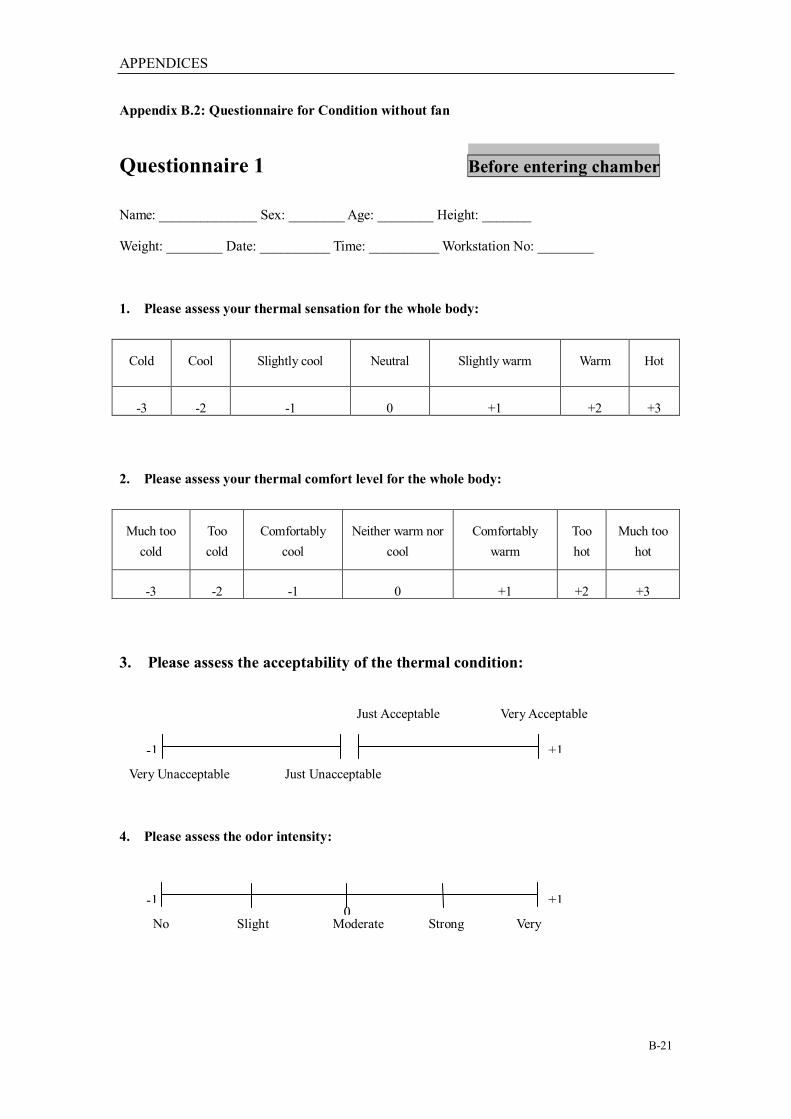
APPENDICES
B-21
Appendix B.2: Questionnaire for Condition without fan
Questionnaire 1 Before entering chamber
Name: ______________ Sex: ________ Age: ________ Height: _______
Weight: ________ Date: __________ Time: __________ Workstation No: ________
1. Please assess your thermal sensation for the whole body:
Cold Cool Slightly cool Neutral Slightly warm Warm Hot
-3 -2 -1 0 +1 +2 +3
2. Please assess your thermal comfort level for the whole body:
Much too
cold
Too
cold
Comfortably
cool
Neither warm nor
cool
Comfortably
warm
Too
hot
Much too
hot
-3 -2 -1 0 +1 +2 +3
3. Please assess the acceptability of the thermal condition:
4. Please assess the odor intensity:
No
Very
strong
Slight
Moderate
Strong
+1
-1
0
Very Unacceptable Just Unacceptable
Just Acceptable Very Acceptable
-1
+1
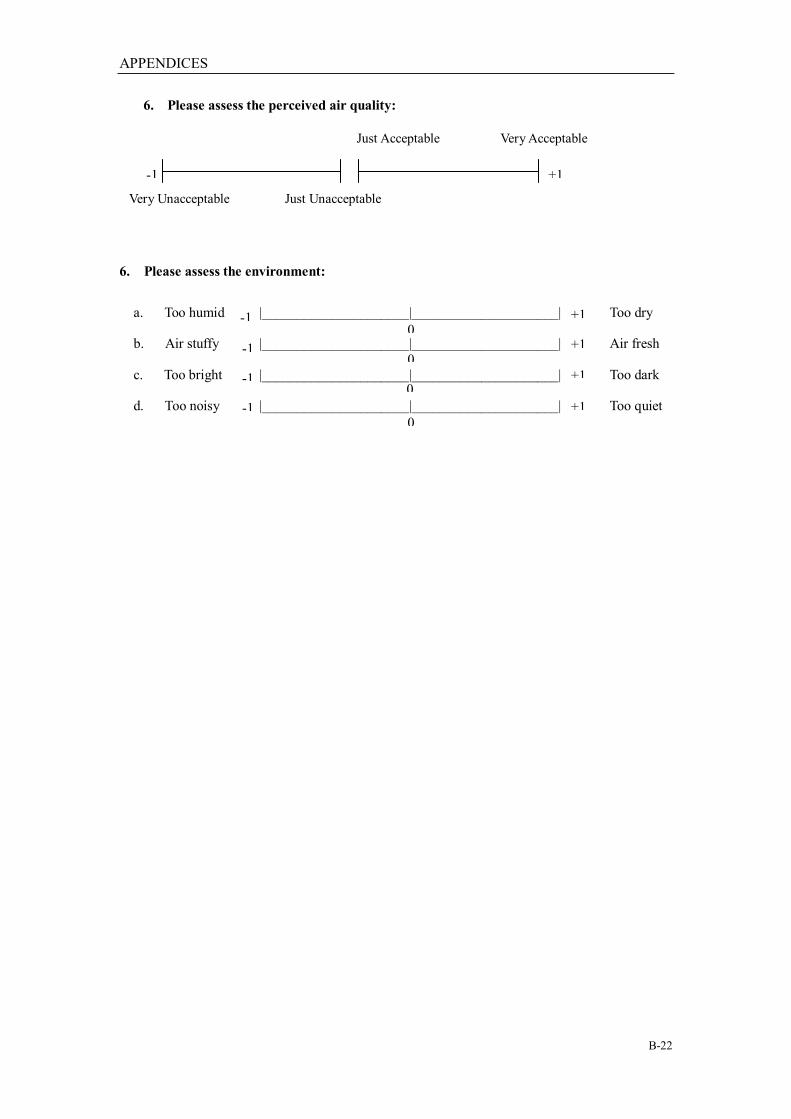
APPENDICES
B-22
6. Please assess the perceived air quality:
6. Please assess the environment:
a. Too humid |_____________________|_____________________| Too dry
b. Air stuffy |_____________________|_____________________| Air fresh
c. Too bright |_____________________|_____________________| Too dark
d. Too noisy |_____________________|_____________________| Too quiet
Very Unacceptable Just Unacceptable
Just Acceptable Very Acceptable
-1
+1
+1
+1
+1
-1
-1
-1
-1
0
0
0
0
+1
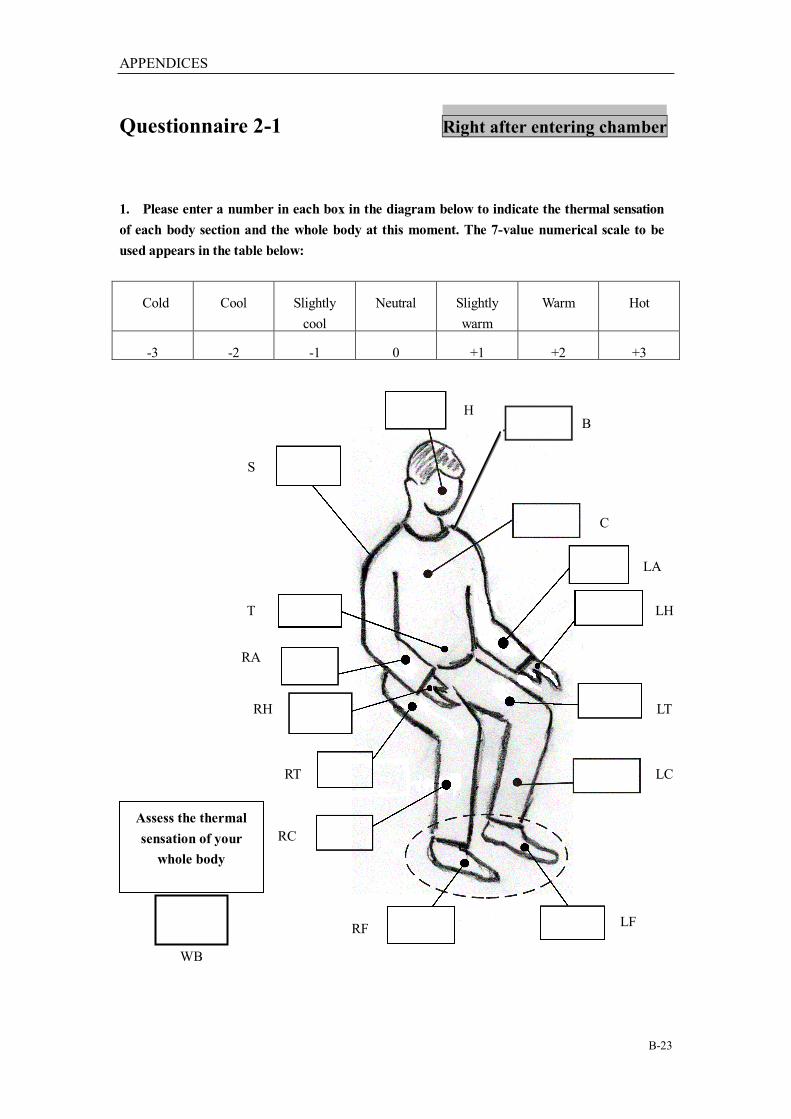
APPENDICES
B-23
Questionnaire 2-1 Right after entering chamber
1. Please enter a number in each box in the diagram below to indicate the thermal sensation
of each body section and the whole body at this moment. The 7-value numerical scale to be
used appears in the table below:
Cold Cool Slightly
cool
Neutral Slightly
warm
Warm Hot
-3 -2 -1 0 +1 +2 +3
Assess the thermal
sensation of your
whole body
H
C
LA
LH
LT
LC
LF
RF
WB
RC
RT
RH
RA
T
S
B
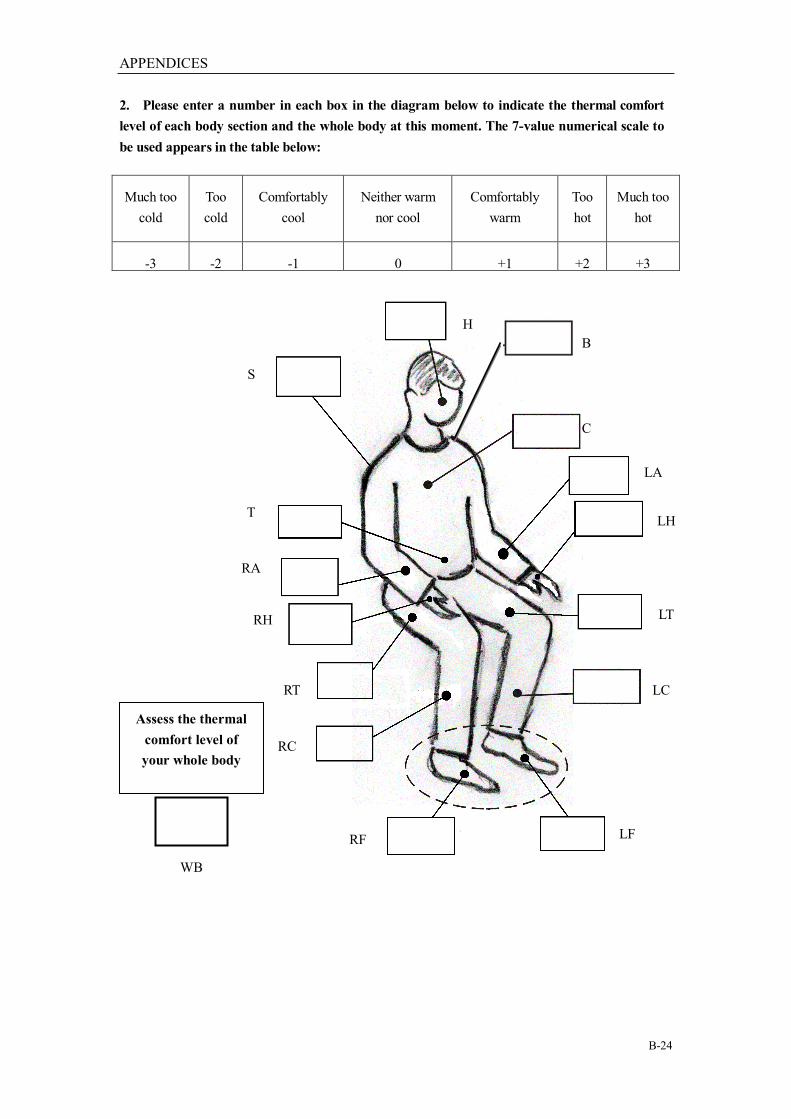
APPENDICES
B-24
2. Please enter a number in each box in the diagram below to indicate the thermal comfort
level of each body section and the whole body at this moment. The 7-value numerical scale to
be used appears in the table below:
Much too
cold
Too
cold
Comfortably
cool
Neither warm
nor cool
Comfortably
warm
Too
hot
Much too
hot
-3 -2 -1 0 +1 +2 +3
Assess the thermal
comfort level of
your whole body
H
C
LA
LH
LT
LC
LF
RF
WB
RC
RT
RH
RA
T
S
B
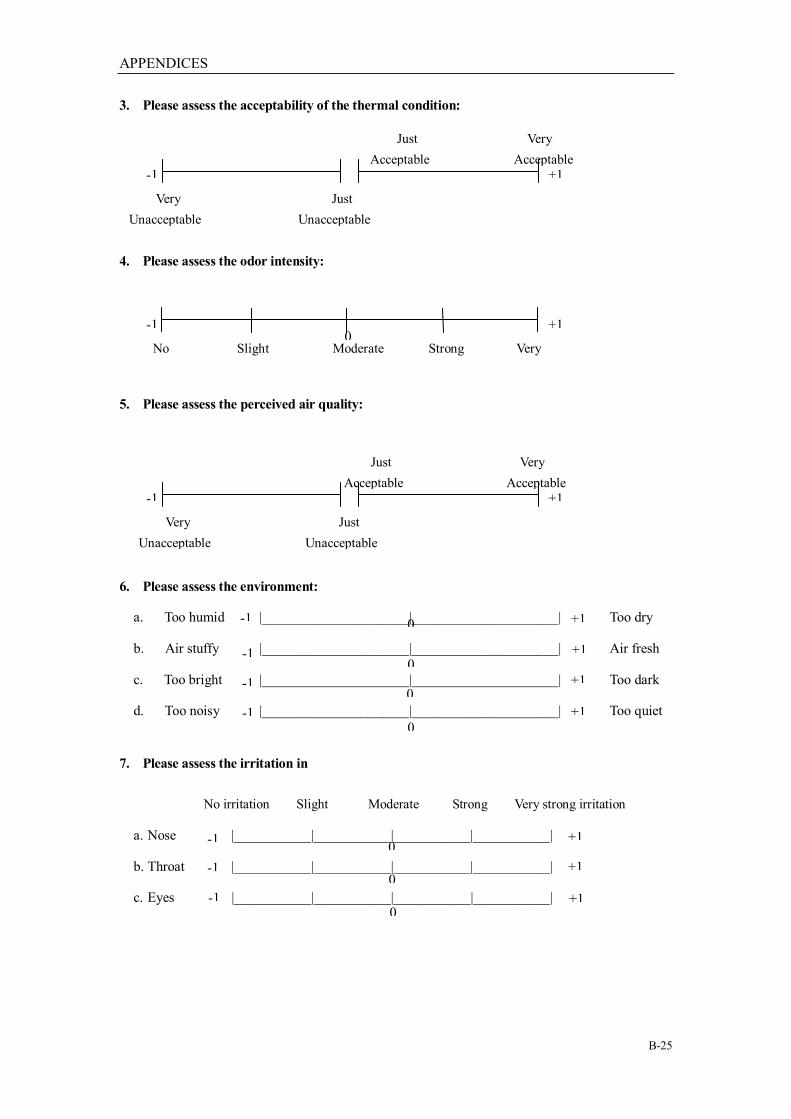
APPENDICES
B-25
3. Please assess the acceptability of the thermal condition:
4. Please assess the odor intensity:
5. Please assess the perceived air quality:
6. Please assess the environment:
a. Too humid |_____________________|_____________________| Too dry
b. Air stuffy |_____________________|_____________________| Air fresh
c. Too bright |_____________________|_____________________| Too dark
d. Too noisy |_____________________|_____________________| Too quiet
7. Please assess the irritation in
No irritation Slight Moderate Strong Very strong irritation
a. Nose |___________|___________|___________|___________|
b. Throat |___________|___________|___________|___________|
c. Eyes |___________|___________|___________|___________|
Very
Unacceptable
Just
Unacceptable
Just
Acceptable
Very
Acceptable
+1
-1
No
Very
strong
Slight
Moderate
Strong
+1
-1
0
Very
Unacceptable
Just
Unacceptable
Just
Acceptable
Very
Acceptable
-1
+1
+1
+1
+1
-1
-1
-1
-1
0
0
0
0
+1
-1
-1
-1
+1
+1
+1
0
0
0
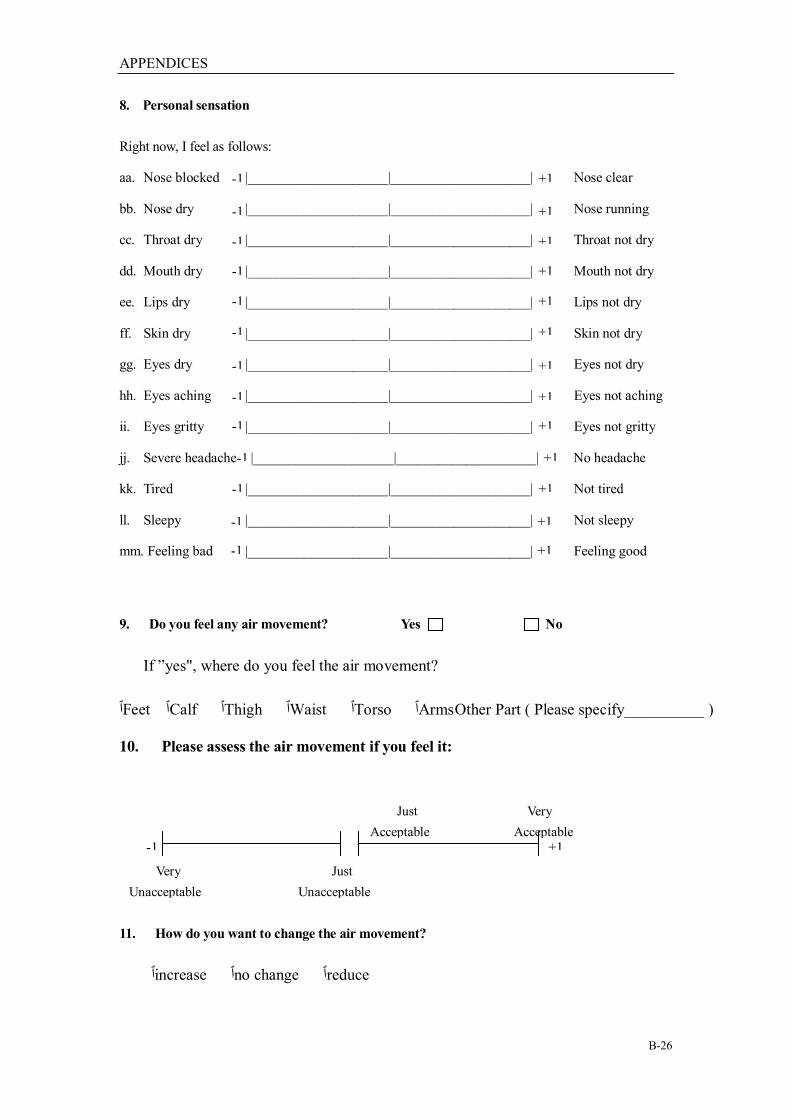
APPENDICES
B-26
8. Personal sensation
Right now, I feel as follows:
aa. Nose blocked |____________________|____________________| Nose clear
bb. Nose dry |____________________|____________________| Nose running
cc. Throat dry |____________________|____________________| Throat not dry
dd. Mouth dry |____________________|____________________| Mouth not dry
ee. Lips dry |____________________|____________________| Lips not dry
ff. Skin dry |____________________|____________________| Skin not dry
gg. Eyes dry |____________________|____________________| Eyes not dry
hh. Eyes aching |____________________|____________________| Eyes not aching
ii. Eyes gritty |____________________|____________________| Eyes not gritty
jj. Severe headache |____________________|____________________| No headache
kk. Tired |____________________|____________________| Not tired
ll. Sleepy |____________________|____________________| Not sleepy
mm. Feeling bad |____________________|____________________| Feeling good
9. Do you feel any air movement? Yes No
If ”yes", where do you feel the air movement?
Arms Other Part ( Please specify__________ )ٱ Torsoٱ Waistٱ Thighٱ Calfٱ Feetٱ
10. Please assess the air movement if you feel it:
11. How do you want to change the air movement?
reduceٱ no changeٱ increaseٱ
Very
Unacceptable
Just
Unacceptable
Just
Acceptable
Very
Acceptable
-1
+1
+1
-1
0
+1
-1
0
+1
-1
0
+1
-1
0
+1
-1
0
+1
-1
0
+1
-1
0
+1
-1
0
+1
-1
0
+1
-1
0
+1
-1
0
+1
-1
0
+1
-1
0

APPENDICES
B-27
Questionnaire 2-2 When time = 20 minutes
1. Please enter a number in each box in the diagram below to indicate the thermal sensation
of each body section and the whole body at this moment. The 7-value numerical scale to be
used appears in the table below:
Cold Cool Slightly
cool
Neutral Slightly
warm
Warm Hot
-3 -2 -1 0 +1 +2 +3
Assess the thermal
sensation of your
whole body
H
C
LA
LH
LT
LC
LF
RF
WB
RC
RT
RH
RA
T
S
B

APPENDICES
B-28
2. Please enter a number in each box in the diagram below to indicate the thermal comfort
level of each body section and the whole body at this moment. The 7-value numerical scale to
be used appears in the table below:
Much too
cold
Too
cold
Comfortably
cool
Neither warm
nor cool
Comfortably
warm
Too
hot
Much too
hot
-3 -2 -1 0 +1 +2 +3
Assess the thermal
comfort level of
your whole body
H
C
LA
LH
LT
LC
LF
RF
WB
RC
RT
RH
RA
T
S
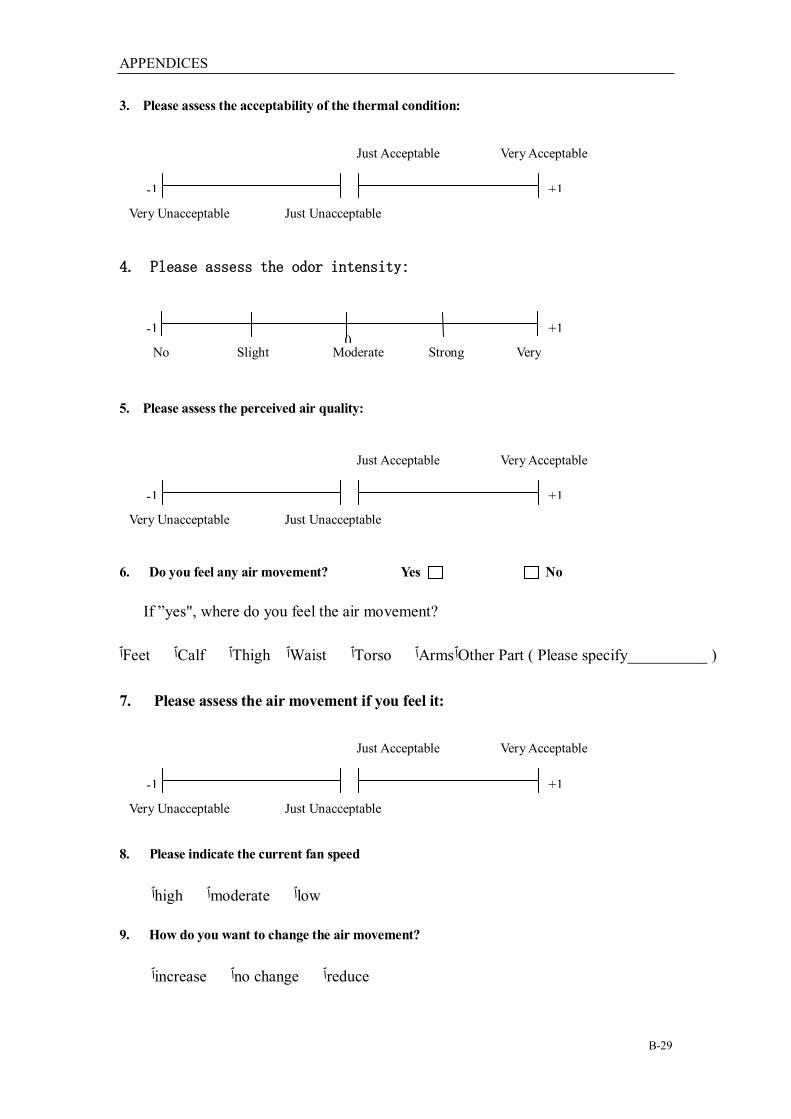
APPENDICES
B-29
3. Please assess the acceptability of the thermal condition:
4. Please assess the odor intensity:
5. Please assess the perceived air quality:
6. Do you feel any air movement? Yes No
If ”yes", where do you feel the air movement?
Other Part ( Please specify__________ )ٱ Armsٱ Torsoٱ Waistٱ Thighٱ Calfٱ Feetٱ
7. Please assess the air movement if you feel it:
8. Please indicate the current fan speed
lowٱ moderateٱ highٱ
9. How do you want to change the air movement?
reduceٱ no changeٱ increaseٱ
Very Unacceptable Just Unacceptable
Just Acceptable Very Acceptable
-1
+1
Very Unacceptable Just Unacceptable
Just Acceptable Very Acceptable
-1
+1
No
Very
strong
Slight
Moderate
Strong
+1
-1
0
Very Unacceptable Just Unacceptable
Just Acceptable Very Acceptable
-1
+1
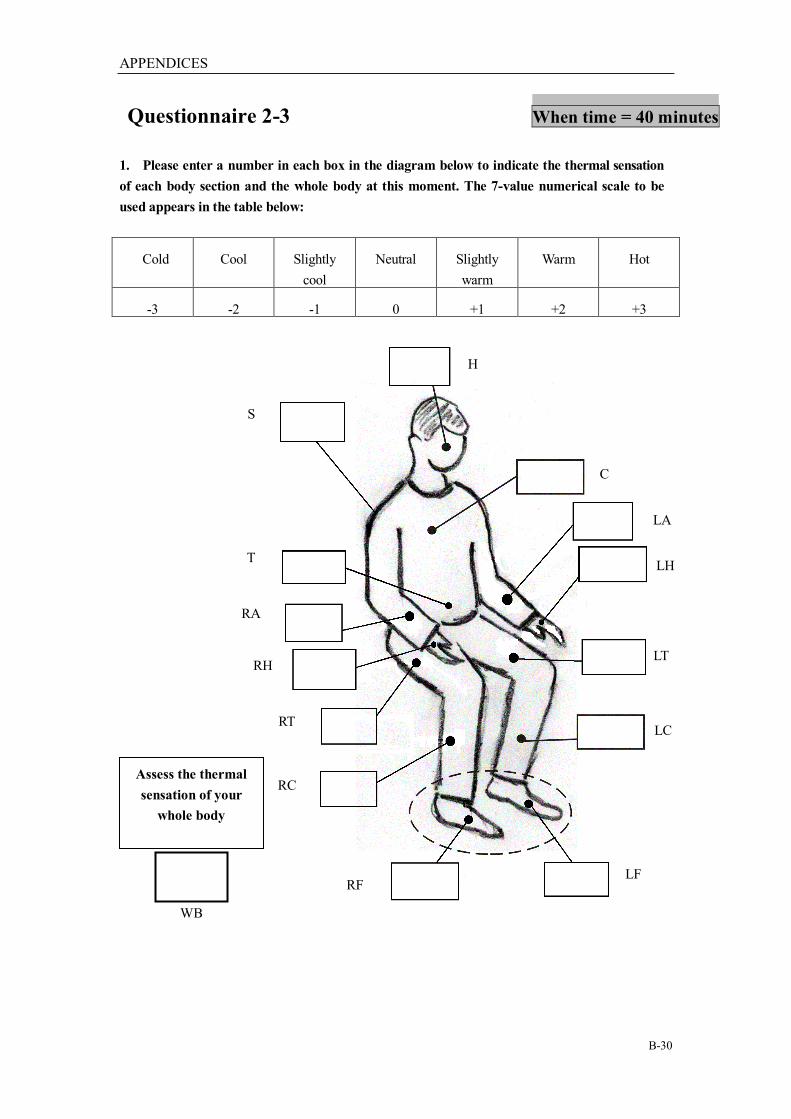
APPENDICES
B-30
Questionnaire 2-3 When time = 40 minutes
1. Please enter a number in each box in the diagram below to indicate the thermal sensation
of each body section and the whole body at this moment. The 7-value numerical scale to be
used appears in the table below:
Cold Cool Slightly
cool
Neutral Slightly
warm
Warm Hot
-3 -2 -1 0 +1 +2 +3
Assess the thermal
sensation of your
whole body
H
C
LA
LH
LT
LC
LF
RF
WB
RC
RT
RH
RA
T
S
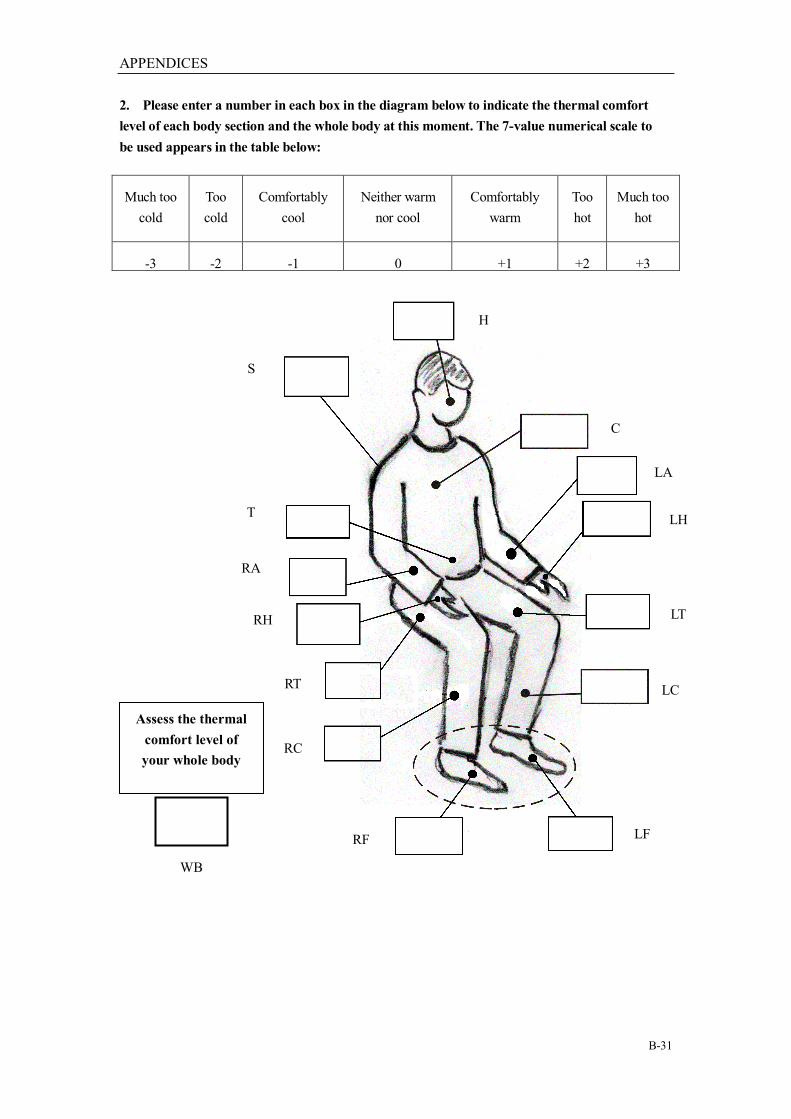
APPENDICES
B-31
2. Please enter a number in each box in the diagram below to indicate the thermal comfort
level of each body section and the whole body at this moment. The 7-value numerical scale to
be used appears in the table below:
Much too
cold
Too
cold
Comfortably
cool
Neither warm
nor cool
Comfortably
warm
Too
hot
Much too
hot
-3 -2 -1 0 +1 +2 +3
Assess the thermal
comfort level of
your whole body
H
C
LA
LH
LT
LC
LF
RF
WB
RC
RT
RH
RA
T
S
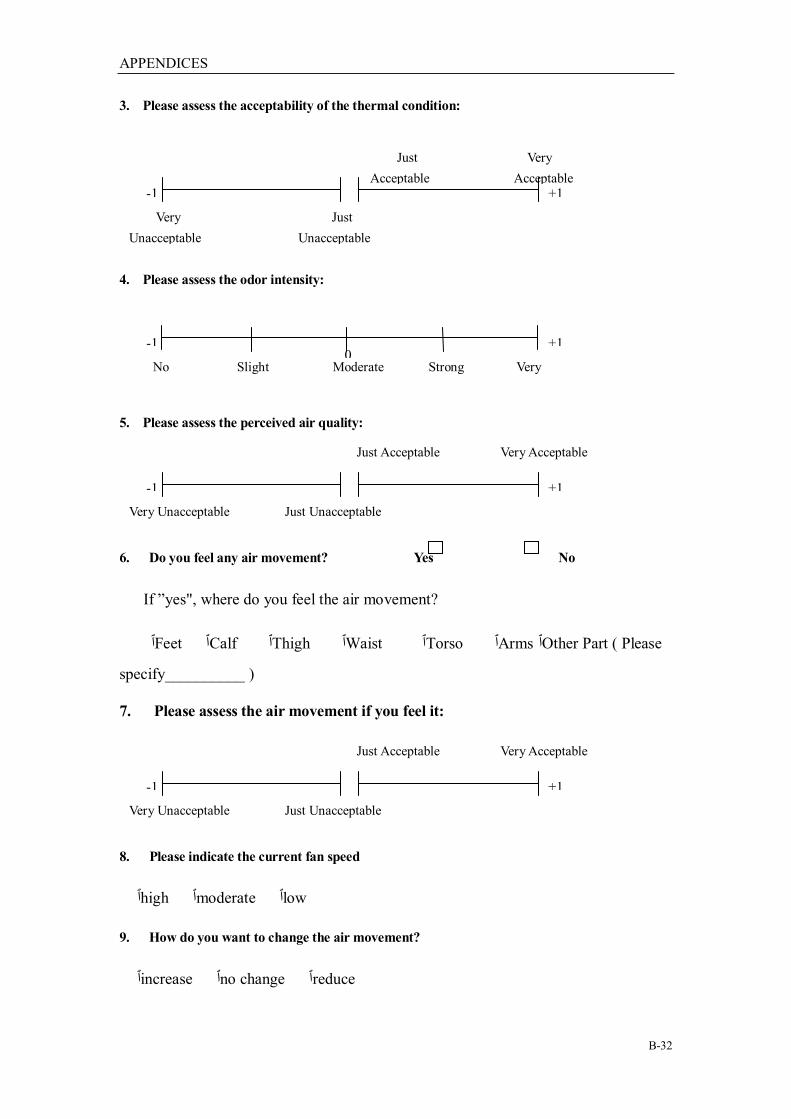
APPENDICES
B-32
3. Please assess the acceptability of the thermal condition:
4. Please assess the odor intensity:
5. Please assess the perceived air quality:
6. Do you feel any air movement? Yes No
If ”yes", where do you feel the air movement?
Other Part ( Pleaseٱ Armsٱ Torsoٱ Waistٱ Thighٱ Calfٱ Feetٱ
specify__________ )
7. Please assess the air movement if you feel it:
8. Please indicate the current fan speed
lowٱ moderateٱ highٱ
9. How do you want to change the air movement?
reduceٱ no changeٱ increaseٱ
Very Unacceptable Just Unacceptable
Just Acceptable Very Acceptable
-1
+1
Very Unacceptable Just Unacceptable
Just Acceptable Very Acceptable
-1
+1
No
Very
strong
Slight
Moderate
Strong
+1
-1
0
Very
Unacceptable
Just
Unacceptable
Just
Acceptable
Very
Acceptable
-1
+1

APPENDICES
B-33
10. Please assess the environment:
a. Too humid |_____________________|_____________________| Too dry
b. Air stuffy |_____________________|_____________________| Air fresh
c. Too bright |_____________________|_____________________| Too dark
d. Too noisy |_____________________|_____________________| Too quiet
11. Please assess the irritation in
No irritation Slight Moderate Strong Very strong irritation
a. Nose |___________|___________|___________|___________|
b. Throat |___________|___________|___________|___________|
c. Eyes |___________|___________|___________|___________|
12. Personal sensation
Right now, I feel as follows:
nn. Nose blocked |____________________|____________________| Nose clear
oo. Nose dry |____________________|____________________| Nose running
pp. Throat dry |____________________|____________________| Throat not dry
qq. Mouth dry |____________________|____________________| Mouth not dry
rr. Lips dry |____________________|____________________| Lips not dry
ss. Skin dry |____________________|____________________| Skin not dry
tt. Eyes dry |____________________|____________________| Eyes not dry
uu. Eyes aching |____________________|____________________| Eyes not aching
vv. Eyes gritty |____________________|____________________| Eyes not gritty
ww. Severe headache |____________________|____________________| No headache
xx. Tired |____________________|____________________| Not tired
yy. Sleepy |____________________|____________________| Not sleepy
zz. Feeling bad |____________________|____________________| Feeling good
+1
+1
+1
-1
-1
-1
-1
0
0
0
0
-1
-1
-1
+1
+1
+1
0
0
0
+1
-1
0
+1
-1
0
+1
-1
0
+1
-1
0
+1
-1
0
+1
-1
0
+1
-1
0
+1
-1
0
+1
-1
0
+1
-1
0
+1
-1
0
+1
-1
0
+1
-1
0
+1
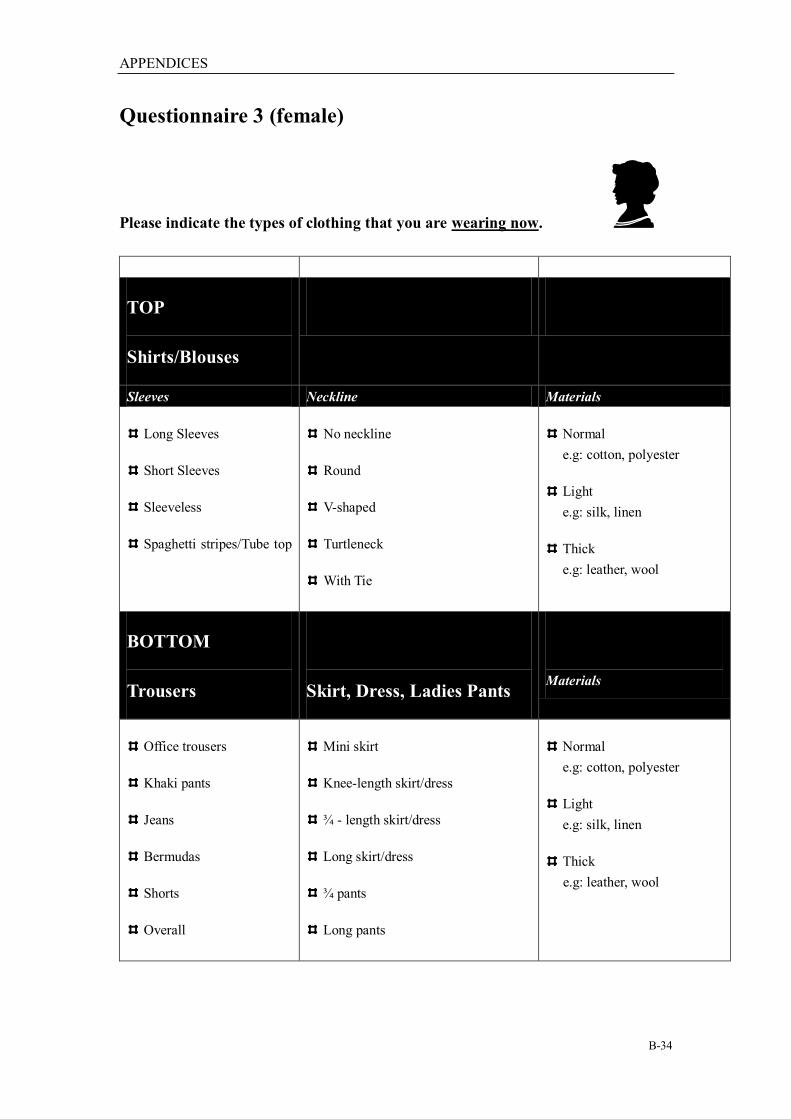
APPENDICES
B-34
Questionnaire 3 (female)
Please indicate the types of clothing that you are wearing now.
TOP
Shirts/Blouses
Sleeves Neckline Materials
Long Sleeves
Short Sleeves
Sleeveless
Spaghetti stripes/Tube top
No neckline
Round
V-shaped
Turtleneck
With Tie
Normal
e.g: cotton, polyester
Light
e.g: silk, linen
Thick
e.g: leather, wool
BOTTOM
Trousers
Skirt, Dress, Ladies Pants
Materials
Office trousers
Khaki pants
Jeans
Bermudas
Shorts
Overall
Mini skirt
Knee-length skirt/dress
¾ - length skirt/dress
Long skirt/dress
¾ pants
Long pants
Normal
e.g: cotton, polyester
Light
e.g: silk, linen
Thick
e.g: leather, wool

APPENDICES
B-35
OTHERS
Sweaters
Jackets
Footwears
Long sleeves cotton
sweater / cardigan
Short sleeves cotton
sweater / cardigan
Long sleeves wool
sweater
Sleeveless vest
Turtleneck long sleeves
sweater
Cardigan
Ladies jacket/suit
Windbreaker
Fleece/polyester jacket
Thick insulative jacket
Cotton/polyester socks
Silk socks
Woollen socks
Pantyhose
Knee length stockings
Foot stockings
Sandals,
mules
Dress shoes
Pumps
Do you wear contact lenses? Yes No
If you are wearing something that you can't find proper description from above, please write it
here.
_______________________________________________________________________
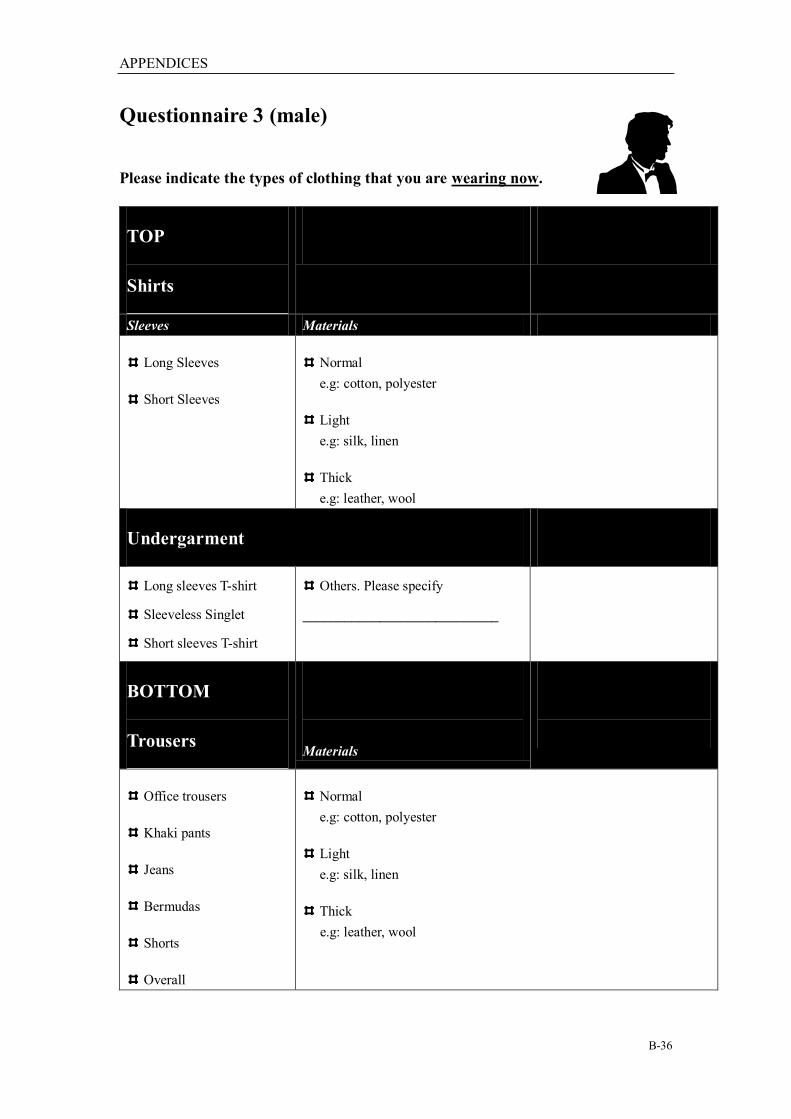
APPENDICES
B-36
Questionnaire 3 (male)
Please indicate the types of clothing that you are wearing now.
TOP
Shirts
Sleeves Materials
Long Sleeves
Short Sleeves
Normal
e.g: cotton, polyester
Light
e.g: silk, linen
Thick
e.g: leather, wool
Undergarment
Long sleeves T-shirt
Sleeveless Singlet
Short sleeves T-shirt
Others. Please specify
____________________________
BOTTOM
Trousers
Materials
Office trousers
Khaki pants
Jeans
Bermudas
Shorts
Overall
Normal
e.g: cotton, polyester
Light
e.g: silk, linen
Thick
e.g: leather, wool
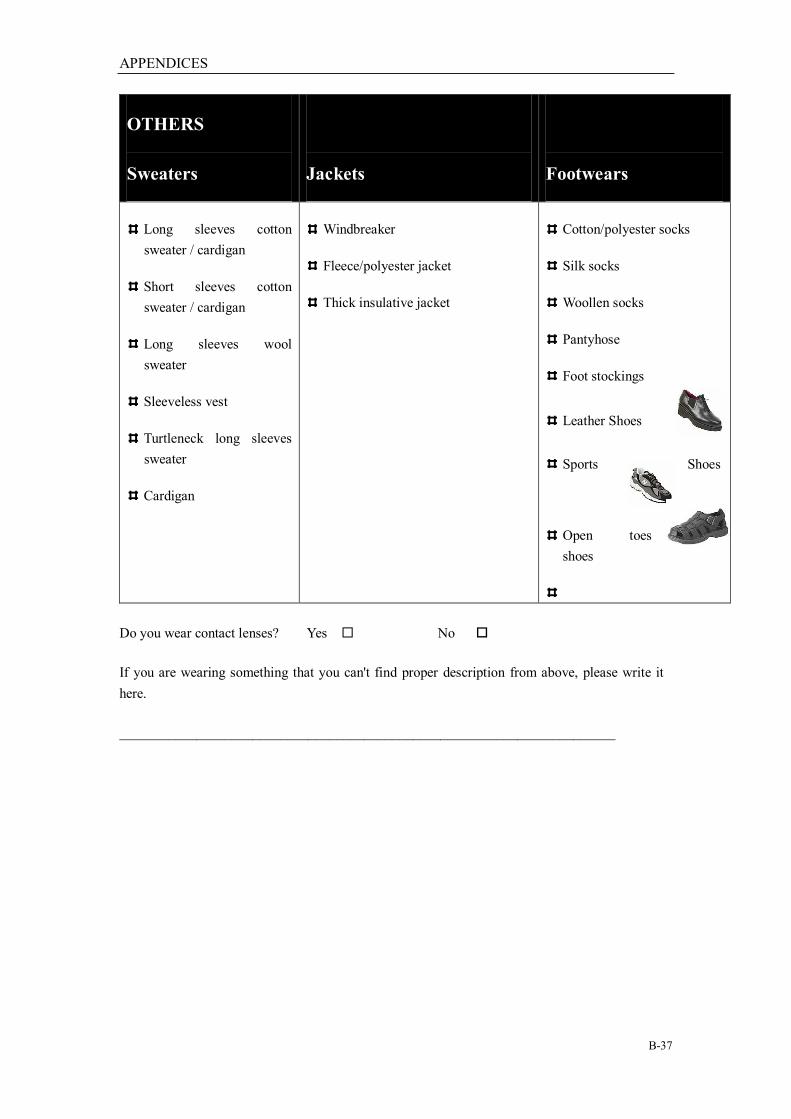
APPENDICES
B-37
OTHERS
Sweaters
Jackets
Footwears
Long sleeves cotton
sweater / cardigan
Short sleeves cotton
sweater / cardigan
Long sleeves wool
sweater
Sleeveless vest
Turtleneck long sleeves
sweater
Cardigan
Windbreaker
Fleece/polyester jacket
Thick insulative jacket
Cotton/polyester socks
Silk socks
Woollen socks
Pantyhose
Foot stockings
Leather Shoes
Sports Shoes
Open toes
shoes
Do you wear contact lenses? Yes No
If you are wearing something that you can't find proper description from above, please write it
here.
_______________________________________________________________________
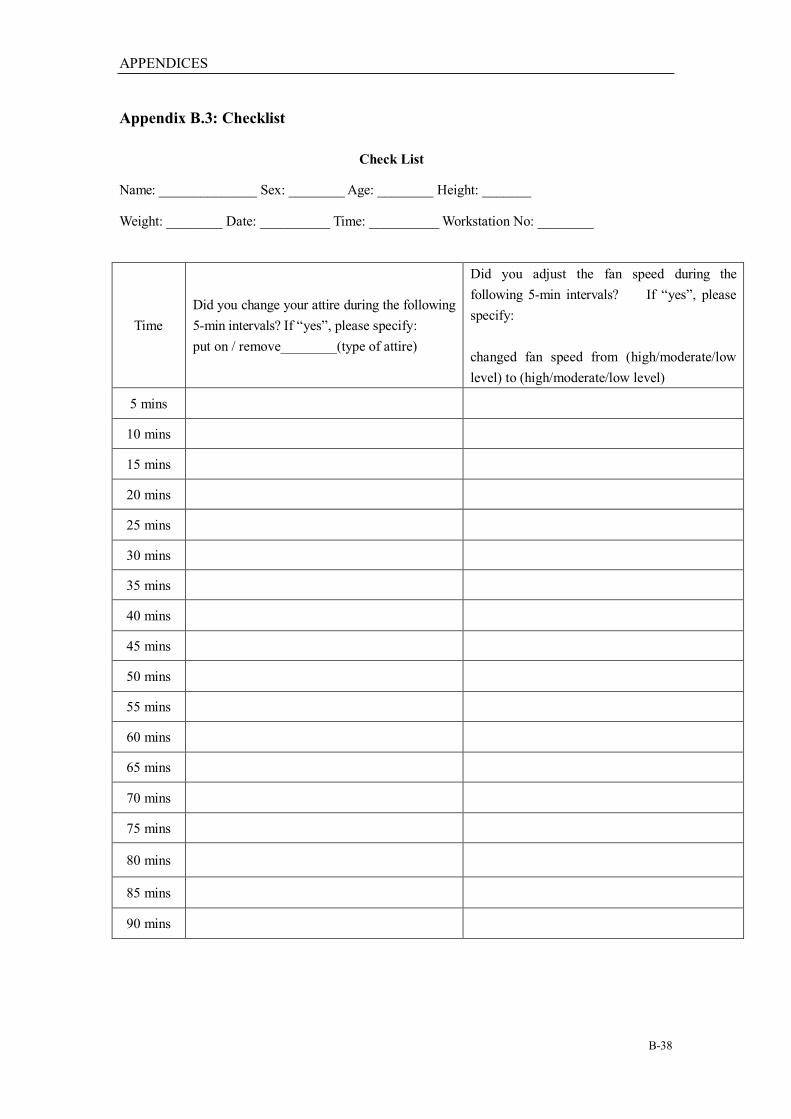
APPENDICES
B-38
Appendix B.3: Checklist
Check List
Name: ______________ Sex: ________ Age: ________ Height: _______
Weight: ________ Date: __________ Time: __________ Workstation No: ________
Time
Did you change your attire during the following
5-min intervals? If “yes”, please specify:
put on / remove________(type of attire)
Did you adjust the fan speed during the
following 5-min intervals? If “yes”, please
specify:
changed fan speed from (high/moderate/low
level) to (high/moderate/low level)
5 mins
10 mins
15 mins
20 mins
25 mins
30 mins
35 mins
40 mins
45 mins
50 mins
55 mins
60 mins
65 mins
70 mins
75 mins
80 mins
85 mins
90 mins
APPENDICES
C-1
APPENDIX C List of publications
Li, Q.Y., Cheong, K.W., Sun, W.M. and Melikov, A. (2009). Assessment of thermal
comfort with the novel enhanced displacement ventilation system in the tropics. In:
Proceedings of Healthy Buildings 2009, paper No. 61. Syracuse, NY.
Li, Q.Y., Cheong, K.W., Sun, W.M., Melikov, A. and Lesmana, R. (2010). Thermal
comfort evaluation of the 2-fan enhanced displacement ventilation system in the
tropics. In: Proceedings of 10th REHVA world congress-CLIMA 2010, Absref: 0369.
Antalya, Turkey.