Embed Size (px)
Citation preview
Assessment of Urban Solid Waste Logistics Systems: The Case of
Kampala, Uganda
Joel Robert Kinobe Faculty of Natural Resources and Agricultural Sciences
Department of Energy and Technology
Uppsala
Doctoral Thesis
Swedish University of Agricultural Sciences
Uppsala 2015
Acta Universitatis Agriculturae Sueciae
2015:94
ISSN 1652-6880
ISBN (print version) 978-91-576-8386-1
ISBN (electronic version) 978-91-576-8387-8
© 2015 Joel Robert Kinobe, Uppsala
Print: SLU Service/Repro, Uppsala 2015
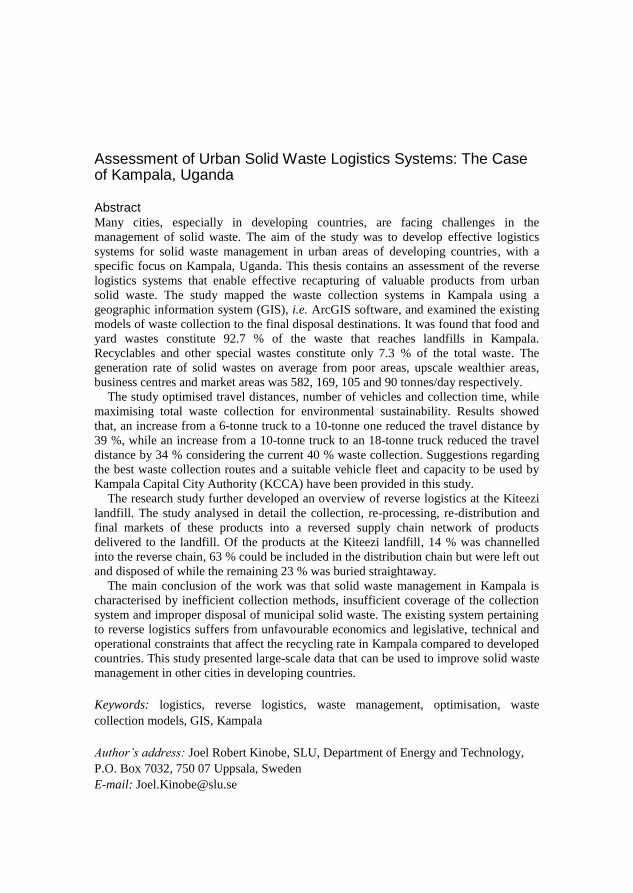
Assessment of Urban Solid Waste Logistics Systems: The Case of Kampala, Uganda
Abstract Many cities, especially in developing countries, are facing challenges in the
management of solid waste. The aim of the study was to develop effective logistics
systems for solid waste management in urban areas of developing countries, with a
specific focus on Kampala, Uganda. This thesis contains an assessment of the reverse
logistics systems that enable effective recapturing of valuable products from urban
solid waste. The study mapped the waste collection systems in Kampala using a
geographic information system (GIS), i.e. ArcGIS software, and examined the existing
models of waste collection to the final disposal destinations. It was found that food and
yard wastes constitute 92.7 % of the waste that reaches landfills in Kampala.
Recyclables and other special wastes constitute only 7.3 % of the total waste. The
generation rate of solid wastes on average from poor areas, upscale wealthier areas,
business centres and market areas was 582, 169, 105 and 90 tonnes/day respectively.
The study optimised travel distances, number of vehicles and collection time, while
maximising total waste collection for environmental sustainability. Results showed
that, an increase from a 6-tonne truck to a 10-tonne one reduced the travel distance by
39 %, while an increase from a 10-tonne truck to an 18-tonne truck reduced the travel
distance by 34 % considering the current 40 % waste collection. Suggestions regarding
the best waste collection routes and a suitable vehicle fleet and capacity to be used by
Kampala Capital City Authority (KCCA) have been provided in this study.
The research study further developed an overview of reverse logistics at the Kiteezi
landfill. The study analysed in detail the collection, re-processing, re-distribution and
final markets of these products into a reversed supply chain network of products
delivered to the landfill. Of the products at the Kiteezi landfill, 14 % was channelled
into the reverse chain, 63 % could be included in the distribution chain but were left out
and disposed of while the remaining 23 % was buried straightaway.
The main conclusion of the work was that solid waste management in Kampala is
characterised by inefficient collection methods, insufficient coverage of the collection
system and improper disposal of municipal solid waste. The existing system pertaining
to reverse logistics suffers from unfavourable economics and legislative, technical and
operational constraints that affect the recycling rate in Kampala compared to developed
countries. This study presented large-scale data that can be used to improve solid waste
management in other cities in developing countries.
Keywords: logistics, reverse logistics, waste management, optimisation, waste
collection models, GIS, Kampala
Author’s address: Joel Robert Kinobe, SLU, Department of Energy and Technology,
P.O. Box 7032, 750 07 Uppsala, Sweden
E-mail: [email protected]

Dedication
To my mother Mrs Christine Najjuma and my late father Mr Samuel
Ssewagudde.
With God everything is possible.
Matthew 19:26
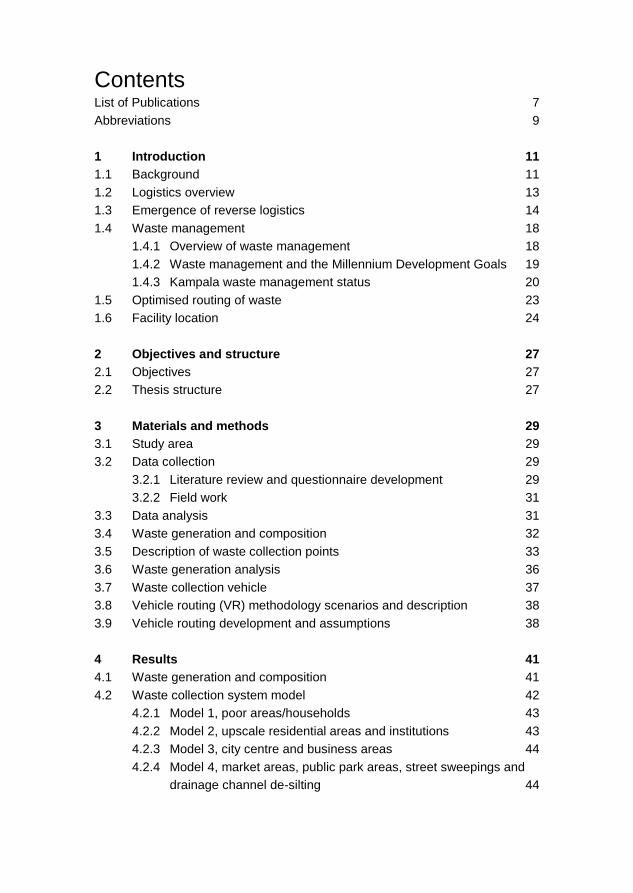
Contents List of Publications 7 Abbreviations 9
1 Introduction 11 1.1 Background 11 1.2 Logistics overview 13 1.3 Emergence of reverse logistics 14 1.4 Waste management 18
1.4.1 Overview of waste management 18 1.4.2 Waste management and the Millennium Development Goals 19 1.4.3 Kampala waste management status 20
1.5 Optimised routing of waste 23 1.6 Facility location 24
2 Objectives and structure 27 2.1 Objectives 27 2.2 Thesis structure 27
3 Materials and methods 29 3.1 Study area 29 3.2 Data collection 29
3.2.1 Literature review and questionnaire development 29 3.2.2 Field work 31
3.3 Data analysis 31 3.4 Waste generation and composition 32 3.5 Description of waste collection points 33 3.6 Waste generation analysis 36 3.7 Waste collection vehicle 37 3.8 Vehicle routing (VR) methodology scenarios and description 38 3.9 Vehicle routing development and assumptions 38
4 Results 41 4.1 Waste generation and composition 41 4.2 Waste collection system model 42
4.2.1 Model 1, poor areas/households 43 4.2.2 Model 2, upscale residential areas and institutions 43 4.2.3 Model 3, city centre and business areas 44 4.2.4 Model 4, market areas, public park areas, street sweepings and
drainage channel de-silting 44
4.3 Waste dumping types and locations 44 4.4 Route optimisation scenarios 45
4.4.1 Application of recorded routes 45 4.4.2 Optimisation route scenarios at 40 % and 100 % waste collection46 4.4.3 Optimised routes to proposed new landfills 47 4.4.4 Optimised routes by outsourced private operator routes to
proposed new landfills 48 4.4.5 Fuel analysis of trucks 49
4.5 Reverse logistics network chain 50 4.6 Reverse logistics integration 51
4.6.1 Distribution network 51 4.6.2 Characteristics of reversed products 52 4.6.3 Reverse logistics product recovery 53
5 General discussion 57 5.1 Current solid waste management status 57 5.2 Comparing model collection system 61 5.3 Optimised route impacts 63 5.4 Reverse logistics and recycling at the landfill 66 5.5 Efficient reverse logistics operations in waste management 69
5.5.1 Integrated solid waste management (ISWM) 69 5.5.2 Policy, legal framework and institutional arrangement 71 5.5.3 Operational management 71 5.5.4 Financial and economic management 72 5.5.5 Public-private participation and awareness 72
6 Conclusions and future research 75 6.1 Conclusions 75 6.2 Future research 77
References 79
Acknowledgments 88
7
List of Publications
This thesis is based on the work contained in the following papers, referred to
by Roman numerals in the text:
I Kinobe, J. R., Gebresenbet, G. & Vinnerås, B. (2012). Reverse logistics
related to waste management with an emphasis on developing countries -
A review paper. Journal of Environmental Science and Engineering B, 1,
1104-1118.
II Kinobe, Joel R, Charles B Niwagaba, Girma Gebresenbet, Allan J
Komakech, and Björn Vinnerås. (2015). Mapping out the solid waste
generation and collection models: The case of Kampala City. Journal of
the Air & Waste Management Association no. 65 (2),197-205, doi
10.1080/10962247.2014.984818.
III Kinobe, J. R., Bosona, T., Gebresenbet, G., Niwagaba, C. B., & Vinnerås,
B. (2015). Optimization of waste collection and disposal in Kampala City.
Habitat International, 49, 126-137. doi:
http://dx.doi.org/10.1016/j.habitatint.2015.05.025.
IV Kinobe, J. R., Gebresenbet, G., Niwagaba, C. B., & Vinnerås, B. (2015).
Reverse logistics system and recycling potential at a landfill: A case study
from Kampala City. Waste Management, 42, 82-92. doi:
http://dx.doi.org/10.1016/j.wasman.2015.04.012.
All papers are reproduced with the permission of the publishers.
8
The contribution of Joel R. Kinobe to the papers included in this thesis was as
follows:
I Paper I: Planned the study, carried out literature review and wrote the
paper with revision by co-authors
II Paper II: Participated in planning the study, conducted data collection,
analysed and interpreted the data. Had the main responsibility of writing
the manuscript with revisions from the co-authors
III Paper III: Participated in planning the study and collected, analysed and
interpreted the data. Had the main responsibility of writing the manuscript
with revisions from the co-authors
IV Paper IV: Participated in planning the study, analysed and interpreted the
data. Had the main responsibility of writing the manuscript with revisions
from the co-authors.
9
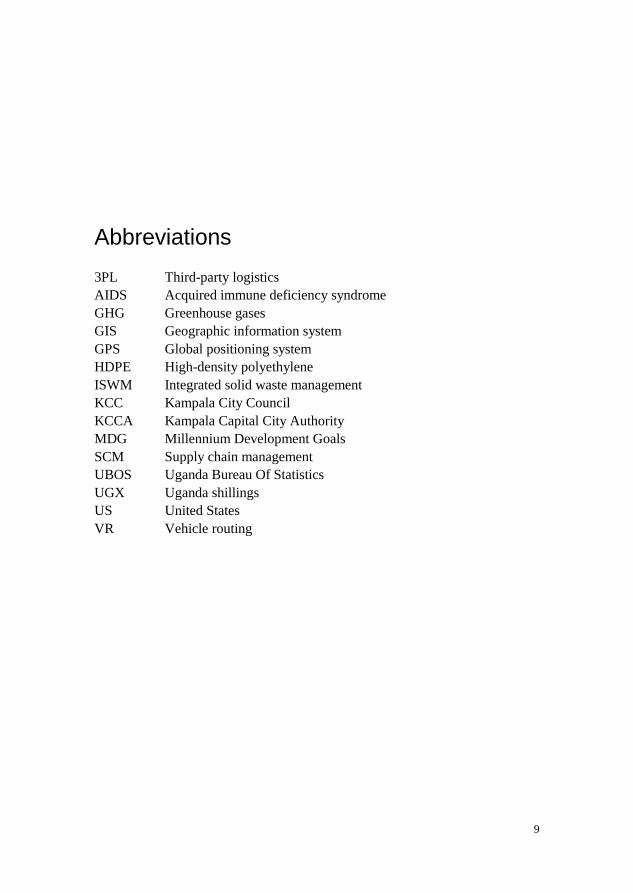
Abbreviations
3PL Third-party logistics
AIDS Acquired immune deficiency syndrome
GHG Greenhouse gases
GIS Geographic information system
GPS Global positioning system
HDPE High-density polyethylene
ISWM Integrated solid waste management
KCC Kampala City Council
KCCA Kampala Capital City Authority
MDG Millennium Development Goals
SCM Supply chain management
UBOS Uganda Bureau Of Statistics
UGX Uganda shillings
US United States
VR Vehicle routing

10
11
1 Introduction
1.1 Background
The ever-increasing world population has increased resource consumption that
has manifested itself in increased waste generation, placing excessive pressure
on cities’ municipal authorities to provide the services efficiently and
effectively (Jin et al., 2006, Zhen-shan et al., 2009, Imam et al., 2008). This is
due to the lack of resources and organisation and the complexity of the systems
(Zurbrugg, 2003, Al-Khatib et al., 2010, Zhang et al., 2010). Most municipal
authorities are unable to provide efficient waste collection. Waste management
budgets are normally less than other municipal services because the service is
not perceived as deserving a high priority. As a result, unsatisfactory
management means public complaints are the order of the day.
The management of waste comes with environmental and financial costs.
Solid waste contains toxic and hazardous materials and these substances are
difficult to treat if generated in the typical waste context of developing
countries (Diaz et al., 2005). Apparently, most Sub-Saharan African (SSA)
countries do not have the technical expertise required for solid waste
management and frequently this is not included in the planning of many
municipal strategic plans (Al-Khatib et al., 2010). Research and development
activities in solid waste management are often given low priority. This is
because there are other pressing issues that need to be tackled by governments,
such as poverty eradication, war and AIDS. This is compounded by the limited
budgets directed to the solid waste management sector. Limited available
resources provided by developing countries have made it impossible to hire
highly skilled labour for employment in the waste management sector. The
solution is to hire an unskilled labour force that will demand low wages and
deliver unprofessional work. The limited funds are further affected by the
12
corruption rates among many officials in developing countries (Kinobe et al.,
2015c).
An increase in the economic development in developing countries means
better income levels for most urban people, leading to higher purchasing
power. This in turn has increased the waste being generated in the cities of
developing countries. Per capita waste generation in developing countries is
currently estimated to be 0.3 to 0.6 kg/day (Ojok et al., 2013).
In many developing countries, the wastes generated are heavier, wetter and
more corrosive because of their high moisture content (Agunwamba, 1998,
Imam et al., 2008, Komakech et al., 2014, Oyoo et al., 2014). This is further
worsened by the constant breakdown of trucks due to the poor road network,
overuse and the fact that most of the vehicles are purchased second hand.
Furthermore, compactor trucks breakdown prematurely because they are used
to compact high-density waste; the hydraulic system becomes strained from
doing more work than they were designed for.
There is also a lack of legislation in the solid waste sector and where it does
exist, the institutional organisations are weak and not so well developed (Okot-
Okumu and Nyenje, 2011). There are also social constraints in the context of
people’s negative perception regarding the handling of wastes. This can be
evident from the indiscriminate waste disposal, for instance in drainage
channels and along the side of streets.
Garbage heaps harbour rodents and are breeding areas of disease, causing
insect vectors. The leachates from solid waste pollute underground water
resources too. All these constraints have forced residents to resort to burying or
burning the waste they generate, or disposing it of indiscriminately in open
spaces. As a result, in most developing countries only about one to two thirds
of the waste generated is collected and transported to the landfill (Zurbrugg,
2003). The rest is left on vacant plots, along streets, in drainage channels, in
open sewer lines and on railway lines. The nature and set-up of most of the
waste collection points are such that they are located next to drainage channels
(Kinobe et al., 2015c). These prevail more in slum areas with narrow, unpaved
streets and roads, leading to more problems when it rains and all the waste and
soil find their way into the drainage channels. This then leads to blockage and
subsequently flooding.
Solid waste management has become a pressing problem and is now
frequently called for by many urban masses. This has placed a heavy burden on
many municipalities in developing countries to manage the waste effectively.
Most of the waste generated in these urban areas is not collected (Imam et al.,
2008, Wilson et al., 2006). Open dumping of solid waste is the cause of
environmental and health hazards. For instance methane from the anaerobic
13
decomposition of waste causes fires and contributes to global warming, since
the accumulation of greenhouse gases in the atmosphere, particularly carbon
dioxide and methane, is believed to be responsible for global warming. Open
dumps undergo biological and chemical processes that produce leachates
which later pollute the underground water sources. The waste pickers cause
intentional fires at the dumpsites and temporary collection points when they
burn waste to sort out metals or even reduce the volume of the waste dumped.
Still at the dumpsites, food leftovers attract animal rodents and insect vectors
transmit diseases to the people leaving nearby (Jin et al., 2006). Flies and
mosquitos breed in the blocked drains and these are vectors that spread
diseases such as malaria. Furthermore, uncollected waste degrades urban
environments, leading to unattractive aesthetic conditions.
Most waste management schemes in developing countries serve a limited
minority of the urban population, excluding low-income earners living in the
slums. The most vulnerable to this situation are the urban poor, characterised
by poor housing, non-existent services and the effects of inadequate urban
planning, which exposes them to health risks (Zurbrugg, 2002). Free space in
urban areas tends to be on marginal lands such as wetlands and watercourses.
Furthermore it is noted that most municipal authorities tend to allocate their
limited financial resources to the wealthier areas where residents are believed
to pay high taxes and are politically influential.
1.2 Logistics overview
The term ―logistics‖ is used interchangeably to mean supply chain
management (SCM). It refers to the strategic management of the overall supply
chain including procurement, manufacture, distribution and waste disposal
(Waters, 2010). It is the process that involves the flow of materials in an
optimal and organised way from the supplier to a consumer. Logistics involves
planning, creating and monitoring flows of goods and information. All the
definitions encompass processes of moving and handling goods and materials,
from the beginning to the end of the production, the sales process and waste
disposal, with an emphasis on satisfying customers and enhancing business
competitiveness (Lambert et al., 1998a).
One of the defining and most lasting features of the Industrial Revolution in
the 18th and 19
th centuries was the rise of cities. In pre-industrial society, over
80 % of people lived in rural areas (Bairoch and Goertz, 1986). This saw
changes in the agricultural, manufacturing, mining, transportation and
technology sectors that changed the social economic status of the people. An
increase in incomes meant an increase in the consumer base, and hence
14
increased the generation of waste (Blumberg, 2005). Industrialisation also led
to the generation of hazardous waste that had a negative impact on the
environment. This catastrophic disaster called for immediate control of the
health of the people and the environment. This saw the teaming up of
government, private operators and the public to engage in waste removal and
recycling activities. The effects of industrial revolution forced many
governments to introduce environmental legislation and give manufacturers
responsibility for reverse logistics flows, including used products and
manufacturing-induced wastes (Blumberg, 2005)
The emergence of green logistics that aims for sustainable logistics has also
seen a development in logistics. Companies and manufacturing organisations
have started interacting with consumers about the information flow of product
quality, proper disposal and product returns (Lambert et al., 1998b).
1.3 Emergence of reverse logistics
In the early 1990s, reverse logistics attracted increasing attention from
academic researchers, commercial business actors and government officials.
Serious and persistent environmental concerns and government regulations
created a motivation to undertake research in this field: Stock (1998) proposes
the application of reverse logistics in business and society in general; Kopicki
et al. (1993) elaborate the opportunities for reusing and recycling; Lambert et
al., (1998b) investigate how to start and implement reverse logistics
programmes; and Rogers et al. (1999) demonstrate a collection of reverse
logistics business practices using a comprehensive questionnaire among US
industries.
Reverse logistics, as defined by (Rogers and Tibben-Lembke, 1999), is:
The process of planning, implementing, and controlling the efficient, cost-
effective flow of raw materials, in-process inventory, finished goods and related
information from the point of consumption to the point of origin for the purpose
of recapturing value or proper disposal.
The European Working Group on Reverse Logistics in De Brito and Dekker
(2002) defines reverse logistics as:
The process of planning, implementing and controlling backward flows of raw
materials, in-process inventory, packaging and finished goods from the
manufacturing, distribution or use point of recovery to the point of proper
disposal.
The issue with the first definition is that packaging materials are left out. It
focuses on both economic gains and sustainability. Reverse logistics, being a
new subject in the area, has been perceived to mean reversed logistics, returns
15
logistics or reverse distribution. However, with all these definitions, there is an
element of resource recovery and as such are taken to mean the same thing.
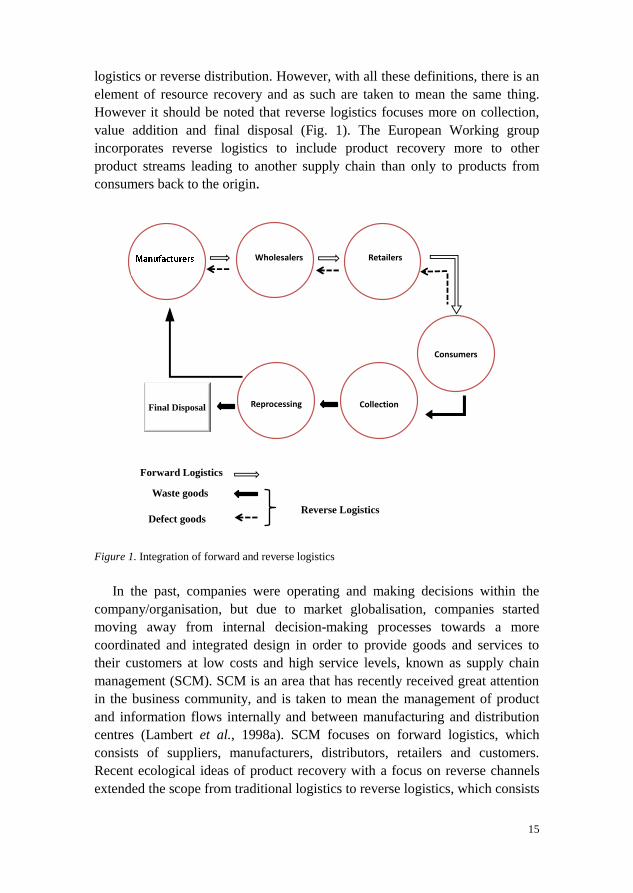
However it should be noted that reverse logistics focuses more on collection,
value addition and final disposal (Fig. 1). The European Working group
incorporates reverse logistics to include product recovery more to other
product streams leading to another supply chain than only to products from
consumers back to the origin.
Figure 1. Integration of forward and reverse logistics
In the past, companies were operating and making decisions within the
company/organisation, but due to market globalisation, companies started
moving away from internal decision-making processes towards a more
coordinated and integrated design in order to provide goods and services to
their customers at low costs and high service levels, known as supply chain
management (SCM). SCM is an area that has recently received great attention
in the business community, and is taken to mean the management of product
and information flows internally and between manufacturing and distribution
centres (Lambert et al., 1998a). SCM focuses on forward logistics, which
consists of suppliers, manufacturers, distributors, retailers and customers.
Recent ecological ideas of product recovery with a focus on reverse channels
extended the scope from traditional logistics to reverse logistics, which consists
Final Disposal
Forward Logistics
Reverse Logistics
Manufactures
Retailers
Wholesalers
Consumers
Collection
Reprocessing
Waste goods
Defect goods
16
of consumers, collection, recyclers and remanufacturers (Rogers and Tibben-
Lembke, 2001, Rogers et al., 1999, Tibben-Lembke and Rogers, 2002,
Fleischmann et al., 2000). Kopicki et al. (1993) point out that the ultimate goal
of a company is efficient resource utilisation, which includes minimising the
materials used and minimising waste, and saving energy through the
production of more environmentally-efficient products by reusing materials
and recycling as much as possible. In recent years, attention has been directed
at product recovery by extending the end of life of products (Rogers et al.,
1999). This system has been practised widely by industrialised countries and
involves extending the scope of traditional supply chain management and
drawing attention to collection, remanufacturing, recycling and reuse. It is a
system that manages the flow of products intended for remanufacture, recycle
and final disposal in the SCM and has received a lot of attention as a profitable
and sustainable aspect in the business society (Dowlatshahi, 2000). In the
business community, reverse logistics has increased competition between
different firms due to customer demands for liberal returns, especially for
products that are obsolete or out-dated in relation to market demand
(Daugherty et al., 2001, Richey et al., 2005).
Environmental management is attracting increasing attention from
researchers and government authorities in SCM. However, despite this
attention, it is notable that an incorporation of the greening system into the
concept is lacking (Lambert et al., 1998b). In order for a company to become
ecologically sustainable, it should have an organisational framework that
addresses the natural environment. Van Hoek (1999) asserts that research
initiatives to move beyond reverse logistics into the development of green
logistics are needed to overcome this problem, hence its emergence.
The emergence of operations around green logistics (concern for the
environment in terms of climate change, pollution, vibrations and accidents
arising from the activities of companies) as efforts intended to reduce the
impacts on the environment of SCM activities have greatly promoted reverse
logistics. Activities include returns, refurbishment, repairs and an emphasis on
a sustainable environment. These activities are already significant in many
companies and they continue to grow (Rogers and Tibben-Lembke, 2001).
With green logistics, sound integrated environmental management with a
decision-making process for the conversion of product recovery into usable
products is promoted.
Proper disposal of electrical and electronic equipment waste at their end of
life and hazardous waste has been urged strongly by the European Union
because of the hazardous materials contained in these appliances (Fleischmann
et al., 2000, Flapper et al., 2005) and it proposes a planned system that
17
considers a good end-of-life disposal system that includes collection,
disassembly, recycling, marketing of the reclaimed products and final disposal.
On the other hand, this has created competition between companies, leading to
quality products and goods. A customer will no longer be concerned with
disposal because reverse logistics looks at the economics, environmental and
legislative reasons and strict environmental and packing regulations for
instance have forced many firms to become responsible for the final residuals
from the sale of products and goods (Dowlatshahi, 2000). With legislation in
place, a number of industries, especially the electronic industry, have set up a
product disposal system for appropriate product recovery and safe disposal
(Nagurney and Toyasaki, 2005).
However the reverse logistics chain in most developing countries is mostly
composed of people working in the informal sector, comprising a huge number
of waste pickers, street children, waste loaders and small-scale shop traders.
Those working in the informal sector are not normally organised, and depend
on recyclables collected from temporary collection points and when trucks
come to dispose of the wastes (Matter et al., 2012). They reduce the inflow of
waste to the landfill, but despite this these marginalised people are never
credited for the services they render with respect to waste management. These
people, especially waste collectors and pickers, are perceived to be unclean and
a public nuisance by many (Wilson et al., 2006). The process is performed by
the poor so that they earn minimum wages for survival, and hence they are at
great risk from toxic waste since the system does not address safety issues
(Bleck and Wettberg, 2012).
Uncertainty is yet another setback to reverse logistics in developing
countries, especially when it comes to decisions about what particular product
to deal with. Decisions about which particular products to recycle depend
heavily on tracking the costs. Furthermore, the reverse logistics of products in
developing countries is substandard, and the addition of value so limited since
the gains made are small but the reprocessing of some products requires
considerable investment within the reverse logistics network (Fleischmann et
al., 2001).
In Uganda, reverse logistics as a topic is not known, but the activities
embedded with in it are being practised by the people in some form of product
recycling. Unlike the sophisticated reverse logistics chain and recycling
systems in developed countries, the Ugandan system has developed from the
traditional collection of organic matter mainly to feed animals, and then
evolved to include the collection of metal scrap from all sources (Kinobe et al.,
2015b). The recovery of reusable materials is performed by people working in
the informal sector who are driven by poverty and the activity acts as a source
18
of income for many poor communities. The waste recycled and reused includes
plastics, metals, food waste, polyethylene bags and sludge. There are no clear
definitive conclusions that can be made on how much waste is recycled or
reused due to the current lack of information.
Despite the low application of reverse logistics in developing countries, it
has attracted significant attention in some operations organisations and waste
management systems. For instance no matter what the product is, how it is sold
or who the customers are, every organisation needs to focus on recovering the
maximum value from returns. The application of reverse logistics in waste
management involves the movement of products in the opposite direction of
the supply chain, from a customer back to the supplier (Subramanian, 2000).
1.4 Waste management
1.4.1 Overview of waste management
Solid waste management is a growing problem in many urban cities in
developing countries. The reason attributed to this is rapid urbanisation due to
the population growth rates from rural areas to urban cities in search of a better
life (Medina, 1997). On average the generation rates in most developing
countries are between 0.3 to 0.6 kg per person per day compared to the 0.9-2
kg per person per day in developed nations (Kaseva and Mbuligwe, 2005,
Troschinetz and Mihelcic, 2009, Karak et al., 2011). Future projections
estimate that the world’s solid waste generation could reach up to 1.42
kg/capita/day (2.2 billion tonnes per year) in 2025 (Hoornweg and Bhada-Tata,
2012).
The limited waste collection in developing countries, including Uganda, is
due to inadequate waste management budgets, poor management, weak
legislation and equipment failures. In the developed world, legislation,
regulations and action plans are in place in the planning of sustainable waste
management. Generally, there is a lack of organisation and planning in waste
management due to insufficient information about regulations and financial
restrictions in many developing countries. The municipalities in these countries
do not have the capacity to manage the increasing volume of waste, leading to
about 35-40 % of the waste being collected and transported to a landfill (Rotich
et al., 2006, Parrot et al., 2009, Nabembezi, 2011). During waste
transportation, the trucks overflow and on many occasions litter the city with
the waste. The trucks used are also manufactured in the context of developed
countries and designed to handle a different kind of waste. This leads to
constant breakdowns of these trucks.
19
The most common disposal method for solid waste in Africa is open
landfills, with no environmental control. Many of these landfills have reached
their capacities and in most cases the environmental conditions are very poor
(Rushbrook, 1999, Remigios, 2010). This has caused considerable land
degradation and contamination of underground water sources through leachate
pollution. Air pollution is common on many of these landfills when burning
waste. Diseases are spread by vector animals such as insects, birds and rodents.
It is only recently that the problems of waste management in developing areas
are being seriously addressed (Brunner and Fellner, 2007, Parrot et al., 2009).
In developing countries, solid waste management as a subject is normally
neglected and not mentioned in many strategic planning processes for
developments (Al-Khatib et al., 2007).
1.4.2 Waste management and the Millennium Development Goals
Solid waste management has a significant impact on the lives, health and
surroundings of all urban dwellers, particularly when there are inadequate
waste collection services. Many populations in developing countries depend on
waste management for their livelihoods, for instance by being employed in the
formal public or private sectors for waste collection or employed in the
informal sector collecting recovery products. Waste management can play an
important role in achieving the Millennium Development Goals (MDG) (Table
1). Organised waste management can create employment, improve public
health and protect the environment.
In September 2000, the Millennium Declaration was approved by 189 heads
of state at the United Nations Millennium Summit. The Declaration outlines
eight broad goals. Within these are eighteen targets, most of which were set for
2015 using 1990 as a benchmark and forty-eight indicators (UNDP, 2014).
These MDGs represent a global commitment by all nations who signed the
Declaration to reduce poverty and improve lives. The purpose of the MDGs
was to improve the living conditions of poor people by adopting the goals. The
policies of MDGs were to target the activities that can lead to the greatest
benefits.
The structure below shows the MDGs and their relationship with solid
waste management:
20
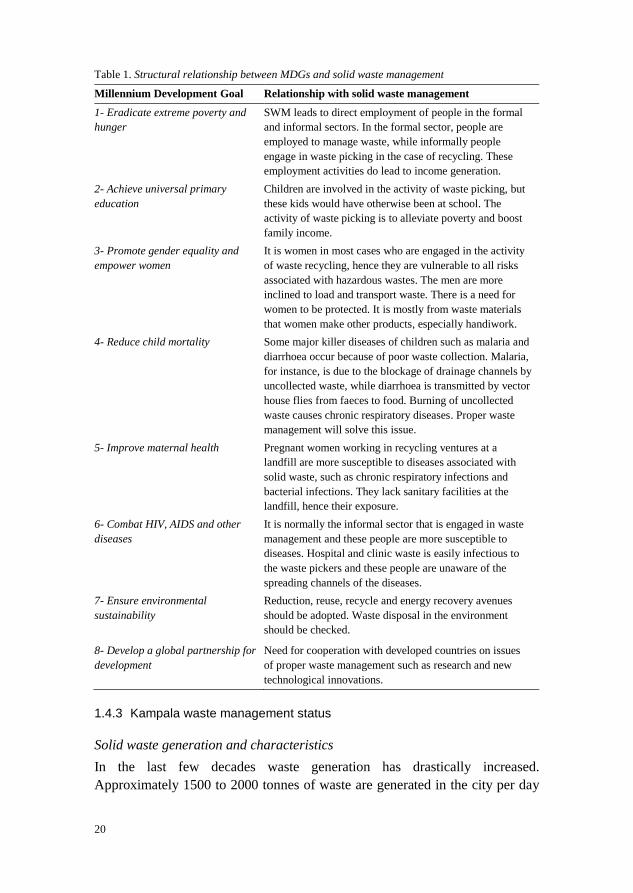
Table 1. Structural relationship between MDGs and solid waste management
Millennium Development Goal Relationship with solid waste management
1- Eradicate extreme poverty and
hunger
SWM leads to direct employment of people in the formal
and informal sectors. In the formal sector, people are
employed to manage waste, while informally people
engage in waste picking in the case of recycling. These
employment activities do lead to income generation.
2- Achieve universal primary
education
Children are involved in the activity of waste picking, but
these kids would have otherwise been at school. The
activity of waste picking is to alleviate poverty and boost
family income.
3- Promote gender equality and
empower women
It is women in most cases who are engaged in the activity
of waste recycling, hence they are vulnerable to all risks
associated with hazardous wastes. The men are more
inclined to load and transport waste. There is a need for
women to be protected. It is mostly from waste materials
that women make other products, especially handiwork.
4- Reduce child mortality
Some major killer diseases of children such as malaria and
diarrhoea occur because of poor waste collection. Malaria,
for instance, is due to the blockage of drainage channels by
uncollected waste, while diarrhoea is transmitted by vector
house flies from faeces to food. Burning of uncollected
waste causes chronic respiratory diseases. Proper waste
management will solve this issue.
5- Improve maternal health
Pregnant women working in recycling ventures at a
landfill are more susceptible to diseases associated with
solid waste, such as chronic respiratory infections and
bacterial infections. They lack sanitary facilities at the
landfill, hence their exposure.
6- Combat HIV, AIDS and other
diseases
It is normally the informal sector that is engaged in waste
management and these people are more susceptible to
diseases. Hospital and clinic waste is easily infectious to
the waste pickers and these people are unaware of the
spreading channels of the diseases.
7- Ensure environmental
sustainability
Reduction, reuse, recycle and energy recovery avenues
should be adopted. Waste disposal in the environment
should be checked.
8- Develop a global partnership for
development
Need for cooperation with developed countries on issues
of proper waste management such as research and new
technological innovations.
1.4.3 Kampala waste management status
Solid waste generation and characteristics
In the last few decades waste generation has drastically increased.
Approximately 1500 to 2000 tonnes of waste are generated in the city per day
21
and this figure is predicted to increase in future (KCC, 2006). This is attributed
to the demographic growth and economic development of the country. The
urban population in 1969 was 33,070, in 1990 it was 774,241 and in 2002 it
was 1,208,544 (UBOS, 2002) and this has further risen rapidly in the last
decade with a population increase of 3.8 % (UBOS, 2012). A similar
relationship of increased waste generation due to an increased population has
been reported in many Sub-Saharan countries (Rotich et al., 2006, Zhen-shan
et al., 2009). Waste composition is not uniform with respect to countries. It
differs greatly between developed and developing countries due to inequality
in income levels. As incomes increase so does waste generation. For instance
in developing countries it ranges from 0.4 to 0.6kg/cap/day (Nabembezi, 2011,
Ojok et al., 2013), in middle income countries from 0.5 to 0.9 kg/cap/day and
in industrialised countries from 0.7 to 1.8 kg/cap/day (Cointreau, 1982).
The waste generated includes household, commercial/institutional, street
cleanings and industrial waste. Waste composition in Kampala, as in many
developing countries, is dominated by organics that have a high moisture
content due to the high proportion of kitchen waste (Ojok et al., 2013, Oteng-
Ababio et al., 2013). In Kampala, the situation is aggravated due to the fact the
city is situated in a tropical region that experiences high rainfall intensities
(Ojok et al., 2013). Biodegradable matter makes up about 80 % of the waste
generated and this is in contrast to the developed world (Troschinetz and
Mihelcic, 2009, Karak et al., 2011, Okot-Okumu and Nyenje, 2011). The waste
is heterogeneous in nature and is not segregated from the household to the
disposal site. This mixture includes a range of materials such as plastics, metals
and hazardous materials that are difficult to deal with.
Collection
In Kampala, most waste is collected in two phases. The first phase is where
waste is stored at the household and then when the need arises it is transported
to the collection point, normally the temporary storage. The second phase is
when waste is collected from temporary storage points and then transported to
the final disposal site (Zhang et al., 2010). Waste that is generated in the city is
not segregated. Only about 40 % of the waste collected is transported to the
landfill (Nabembezi, 2011, Kinobe et al., 2015c). The uncollected waste is
dumped in open spaces, on streets, in markets, and in drainage and storm water
channels. These uncollected wastes create health risks, while the heaped
garbage on the streets becomes an impediment to traffic and an aesthetic
nuisance in the city streets. It is the mandate of the city authority (KCCA) to
manage waste generation in the city.
22
KCCA has trucks that are directed to collect waste in the city. The vehicle
fleet used consists of old second-hand vehicles previously used by
industrialised nations. The vehicles pollute the atmosphere and were not
designed for the local conditions in Uganda. They were designed in the context
of developed nations to handle the waste they produce and this differs from
that of developing nations. These vehicles are sophisticated, expensive and not
easy to operate or maintain.
Due to privatisation in Uganda, there has been a shift from a central
operation to decentralisation, and hence the outcome of the private operators
who obtain contracts from the KCCA to participate in waste collection for a
fee. This idea of the privatisation of government organisations was enacted in
the 1990s, and with the realisation that services were not efficiently and
effectively delivered to the people, the government adopted the system of the
decentralisation of services in 1997 (Okot-Okumu and Nyenje, 2011). On the
side of waste management, the passing of the 2000 waste ordinance meant that
power was passed to private operators from the city authority to collect waste.
However, with this the municipal council is still responsible for the city’s solid
waste management services. Contracts are awarded to qualified operators.
Privatisation was prompted by the city authority being overstretched when it
came to operating services and maintaining its fleet.
Disposal
Most landfills in developing countries are open and waste is dumped
directly onto the land. There is only one recognised disposal site, known as
Kiteezi. It is located about 12 kilometres from the city centre and is where
collected waste from Kampala and its surroundings is disposed of. Before the
landfill reached full capacity, it was 0.04 square km. After exhaustion, more
land was acquired, making a total of 0.11 square km. Kiteezi is an open and
unlined landfill with no groundwater protection and limited leachate recovery
(NEMA, 2004, KCC, 2006). The landfill is an ecologically sensitive area
where groundwater supplies are threatened because it is located on a wetland.
There is susceptibility to both surface and groundwater pollution (Kaseva and
Mbuligwe, 2005). The area is a breeding ground for rats, flies, birds and other
organisms that serve as disease vectors. The landfill is encircled by settlements
and housing, posing a health risk to the people living nearby. The waste pickers
at the landfill burn the waste to reduce its capacity. The smell is a nuisance and
discomfort to the people because the waste is not segregated. Burning of
medical and industrial wastes produces gases that when inhaled cause health
hazards to the surrounding community (Hu et al., 2002, Jang et al., 2006).
23
1.5 Optimised routing of waste
The application of route optimisation in the field of waste management is still a
new concept and very few urban authorities in developing countries consider
having it in effective waste collection (Badran and El-Haggar, 2006). Waste
collection is one of the most important and costly aspects of waste
management as it represents over 70 % of the total budget of waste
management (Ghose et al., 2006, Rotich et al., 2006, Hoornweg and Bhada-
Tata, 2012). Collection of waste has posed a considerable number of
operational problems for local authorities in many cities, involving tasks such
as optimal fleet size, type and scheduled route (Torres and Anton, 1999). This
has provided great opportunity for research to be conducted and to find better
cost-saving measures for municipal authorities. Added to the high costs of
operating and maintaining vehicles, there is concern that these heavy trucks
have a negative impact on the environment due to the quantity of miles driven,
fuel type, engine inefficiency and exhaust gases emitted. Sahoo et al. (2005) in
their study of route optimisation of wastes assert that in order to achieve an
effective waste management system, it is necessary to reduce operational
expenses and optimise vehicle fleet size.
The major shortfall during waste collection in many developing countries is
that the collection vehicles are sent to collect waste from different areas in a
random manner, making it ineffective (Kinobe et al., 2015c). The fleet of
vehicles is not optimised at all. Transport vehicles do not follow scheduled
routes and sometimes double handling of waste becomes inevitable. The
available vehicle types are designed to handle one type of waste stream, they
lack compartments to collect different type of waste, and none of the waste is
segregated. Waste loaders who perform out the action of picking out recyclable
products do sort these unsegregated wastes before it is loaded onto the
vehicles, taking up a considerable amount of time (Wilson et al., 2009, Wilson
et al., 2006).
Effective decision-making in the field of management systems requires the
implementation of vehicle routing techniques capable of taking advantage of
new technologies such as the geographic information system (GIS). Since
routing models make extensive use of spatial data, GIS can provide effective
handling, display and manipulation of such geographical and spatial
information (Ghose et al., 2006, Bosona et al., 2013). These tools eliminate
hours spent on unplanned routing, maximise productivity, optimise equipment
and staff allocations, and allow better control of waste collection operations.
These tools work with a computer software application that generates efficient
vehicle routes for solid waste collection over a road network and can be used
for recycling collection services.
24
There is an increasing awareness and need for municipal authorities to
reduce their overall operational costs. The use of GIS technology is one aspect
that cost-conscious decision makers implement to keep costs down. This is
because GIS provides a powerful resource for identifying cost savings in an
efficient way. One of the main aims of optimised routing is to minimise travel
distances and reduce the fleet size (Nuortio et al., 2006) through the design of
the optimal and cheapest distribution pattern to serve scattered customers.
Through the optimised routes it is possible to measure the efficiency of a
management system, for instance generating an optimal route for a given
vehicle will help minimise the cost. The optimal routes are then determined by
comparing the different paths. These paths can be calculated by different types
of algorithms such as Tabu search, ant colony optimisation and genetic
algorithm (Karadimas and Loumos, 2008).
1.6 Facility location
Facility location is one of the most widely studied location problems in
operations research as its application is widely used within SCM and reverse
logistics (Melo et al., 2009). Facility location involves a selection of a variety
of sites where new facilities are to be located and the selection can be based on
a number of parameters, for instance a minimum travel distance or less fuel
use. An assumption, however, of this is that all the given sites have equivalent
terms in relation to the set-up costs for the location of the new site. A variety of
factors play an important role in facility location. These include distance,
available space, raw materials, labour, market and government policies, to
mention just a few. All these factors have to be analysed and a decision
reached as to the best site. Siting a location for landfill requires a wide and
vigorous evaluation process to come up with a sustainable disposal location
that must follow the governing regulations and at the same time consider
economic, environmental, health and social impacts (Wilson et al., 2007).
Traditionally the closer the facility is to a customer, the better the value of the
product function.. However, this is not the case because other factors are left
out, such as environment, that could be far more important and high investment
costs are associated with the process because it is considered a long-term
investment and is expected to remain in operation for a long period of time. As
such only a single method has to be used in order to achieve the desired
location of the site (Owen and Daskin, 1998). There are a variety of facility
location techniques to be used to decide the best alternative for a site’s
location. The commonly used method in this context is factor rating (Ozcan,
2005, Kumar et al., 2009, Bosona et al., 2013). This method involves

25
qualitative and quantitative inputs, and evaluates alternatives based on a
comparison after establishing a composite value for each alternative. The steps
taken include:
1. Finding out all the important factors needed to locate a site
2. Assigning a weight to each factor. Normally this ranges from 0 to 1.00
3. Assigning a subjective common scale to all the factors ranging from 0 to
100
4. Multiplying the weight factor by the score factor, then adding the scores
together
5. Taking the facility with the highest score as the best option.

26
27
2 Objectives and structure
2.1 Objectives
The main objective of the study was to assess urban solid waste management
including collection, transportation, recycling and disposal to reduce the impact
of waste on health and the environment.
The specific objectives were to:
carry out an extensive literature review and examination of the theory of
reverse logistics and how it is related to waste management in
developing countries (Paper I)
map out the waste collection system in Kampala (Paper II)
perform an optimisation analysis in terms of determining the location of
dumping points and landfill sites and route optimisation of the waste
collection system from Kampala to the final disposal landfill (Paper III)
analyse the reverse logistics systems at the final disposal at the Kiteezi
landfill (Paper IV).
2.2 Thesis structure
The thesis structure is based on Papers I-IV and the relationship between these
papers is shown in Figure 2. The overall outcome of the study could lead to
improvements in the environment, health, the sustainability of resources and
the mobility of Kampala’s solid waste management.
Paper I reviewed literature that provided a good understanding of urban
solid waste management globally and that of Kampala in particular. This in
turn enabled the rest of the studies in Papers II-IV to be planned and executed.
The paper provided an overview of the state of the art in reverse logistics, and
determined the extent of reverse logistics and waste management activity in
low income countries. The paper considered waste management aspects
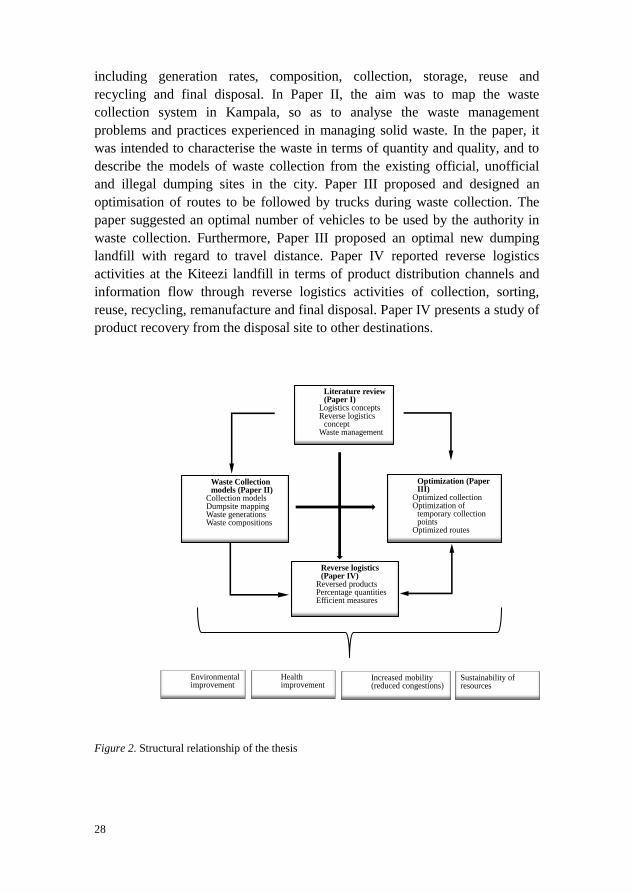
28
including generation rates, composition, collection, storage, reuse and
recycling and final disposal. In Paper II, the aim was to map the waste
collection system in Kampala, so as to analyse the waste management
problems and practices experienced in managing solid waste. In the paper, it
was intended to characterise the waste in terms of quantity and quality, and to
describe the models of waste collection from the existing official, unofficial
and illegal dumping sites in the city. Paper III proposed and designed an
optimisation of routes to be followed by trucks during waste collection. The
paper suggested an optimal number of vehicles to be used by the authority in
waste collection. Furthermore, Paper III proposed an optimal new dumping
landfill with regard to travel distance. Paper IV reported reverse logistics
activities at the Kiteezi landfill in terms of product distribution channels and
information flow through reverse logistics activities of collection, sorting,
reuse, recycling, remanufacture and final disposal. Paper IV presents a study of
product recovery from the disposal site to other destinations.
Figure 2. Structural relationship of the thesis
Environmental improvement
Health improvement
Increased mobility (reduced congestions)
Sustainability of resources
Literature review (Paper I)
Logistics concepts Reverse logistics
concept Waste management
Waste Collection models (Paper II)
Collection models Dumpsite mapping Waste generations Waste compositions
Optimization (Paper III)
Optimized collection Optimization of
temporary collection points
Optimized routes
Reverse logistics (Paper IV)
Reversed products Percentage quantities Efficient measures
29
3 Materials and methods
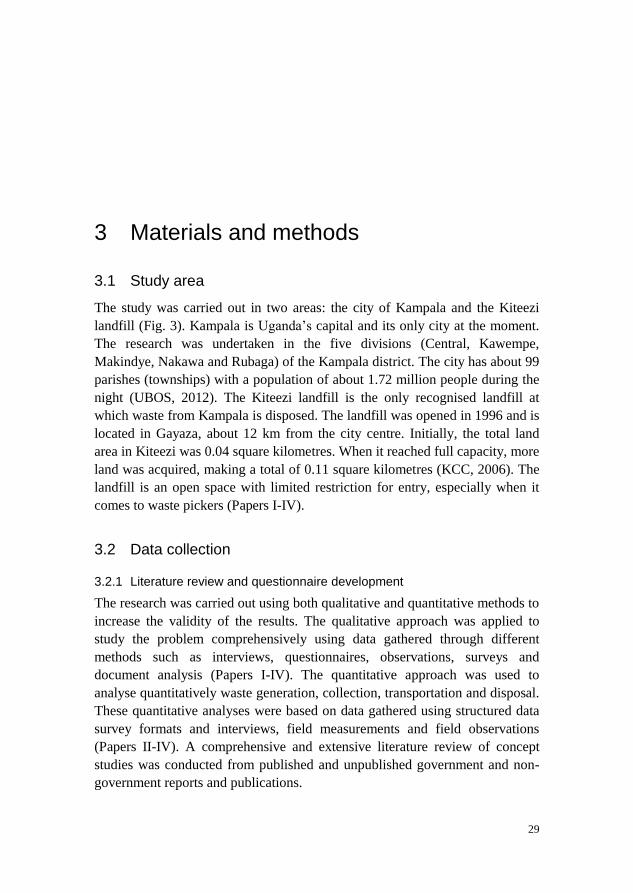
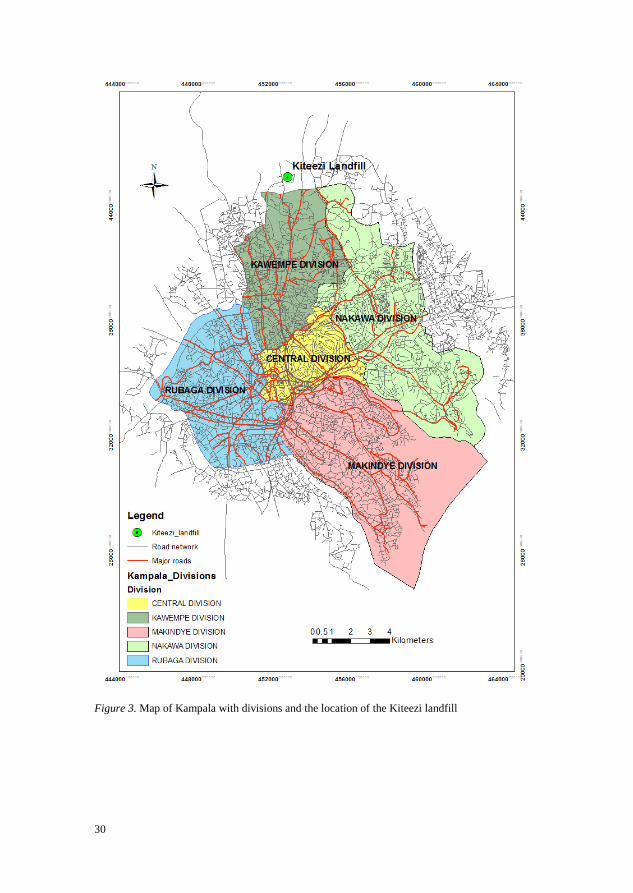
3.1 Study area
The study was carried out in two areas: the city of Kampala and the Kiteezi
landfill (Fig. 3). Kampala is Uganda’s capital and its only city at the moment.
The research was undertaken in the five divisions (Central, Kawempe,
Makindye, Nakawa and Rubaga) of the Kampala district. The city has about 99
parishes (townships) with a population of about 1.72 million people during the
night (UBOS, 2012). The Kiteezi landfill is the only recognised landfill at
which waste from Kampala is disposed. The landfill was opened in 1996 and is
located in Gayaza, about 12 km from the city centre. Initially, the total land
area in Kiteezi was 0.04 square kilometres. When it reached full capacity, more
land was acquired, making a total of 0.11 square kilometres (KCC, 2006). The
landfill is an open space with limited restriction for entry, especially when it
comes to waste pickers (Papers I-IV).
3.2 Data collection
3.2.1 Literature review and questionnaire development
The research was carried out using both qualitative and quantitative methods to
increase the validity of the results. The qualitative approach was applied to
study the problem comprehensively using data gathered through different
methods such as interviews, questionnaires, observations, surveys and
document analysis (Papers I-IV). The quantitative approach was used to
analyse quantitatively waste generation, collection, transportation and disposal.
These quantitative analyses were based on data gathered using structured data
survey formats and interviews, field measurements and field observations
(Papers II-IV). A comprehensive and extensive literature review of concept
studies was conducted from published and unpublished government and non-
government reports and publications.
30
Figure 3. Map of Kampala with divisions and the location of the Kiteezi landfill
31
A thorough online database search was conducted using particular keywords in
academic journal articles to investigate logistics, reverse logistics (Papers I &
IV), waste management (Papers I & II), route optimisation, facility location
(Paper III) and reverse logistics (Paper IV).
3.2.2 Field work
Field work involved primary and secondary data. Primary data included using
structured and unstructured interviews, surveys and observations (Papers II-
IV). The reasons for the structured questionnaire were to provide room for
flexibility in order to acquire more information and even adjust the questions.
The interviews were conducted with formal and informal informants (Papers II
& IV).
Structured interviews were conducted with households (Paper II), waste
pickers, scavengers, waste loaders, small-scale shop dealers of recyclables and
small-scale recycling plants (Papers II & IV). Unstructured interviews were
conducted with KCCA staff, the records manager at the Kiteezi landfill,
supervisors of solid waste collection at divisional level, private operators of
solid waste collection, truck drivers and waste recyclers (Papers II & IV)
3.3 Data analysis
Spreadsheet software in Microsoft Office Excel was used for data entry (Papers
II-IV), and for quickly manipulating rows and columns prior to statistical
analysis (Papers II &IV). The software has a collection of statistical functions,
and a Data Analysis Tool Pak (Paper IV). The software allows integration and
modification of several variables used in route modelling (Paper III).
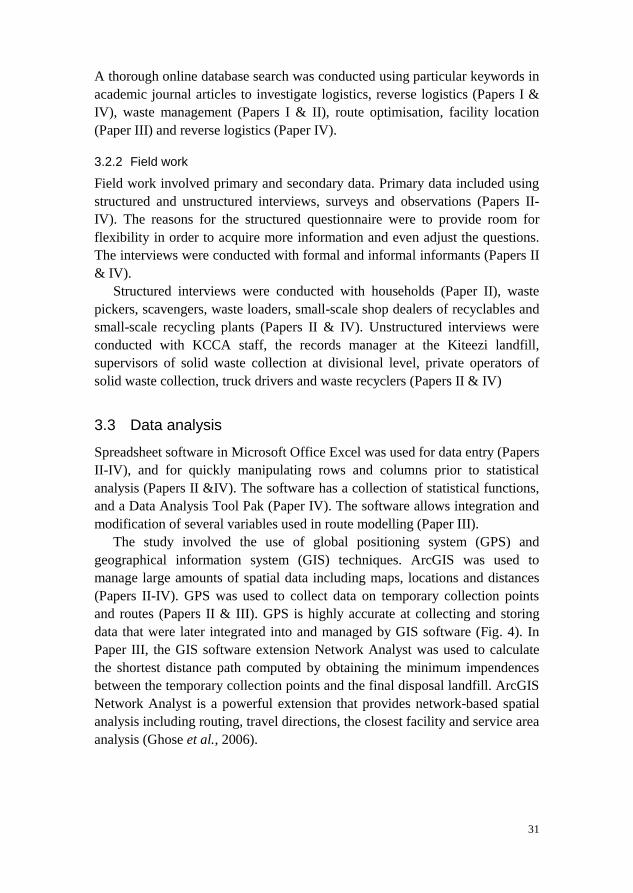
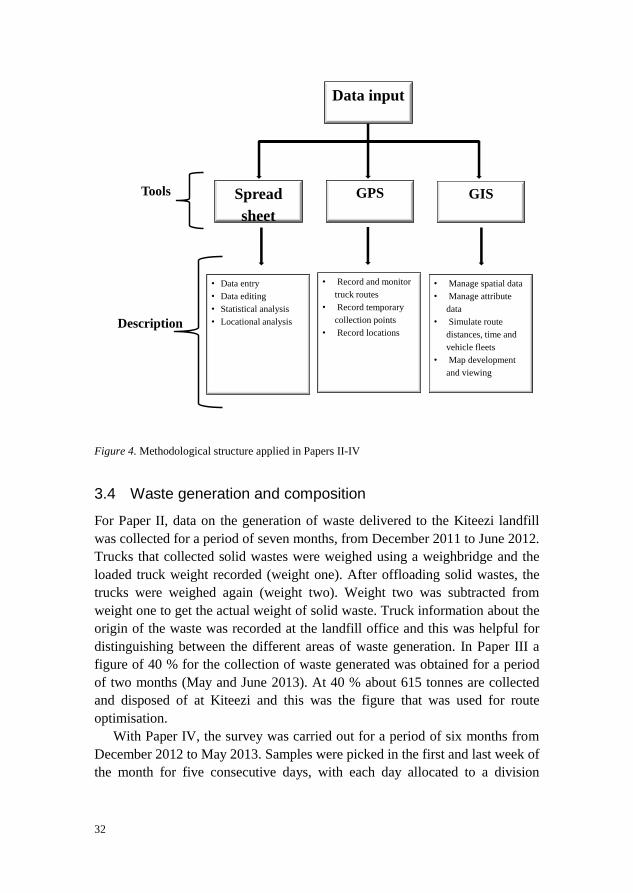
The study involved the use of global positioning system (GPS) and
geographical information system (GIS) techniques. ArcGIS was used to
manage large amounts of spatial data including maps, locations and distances
(Papers II-IV). GPS was used to collect data on temporary collection points
and routes (Papers II & III). GPS is highly accurate at collecting and storing
data that were later integrated into and managed by GIS software (Fig. 4). In
Paper III, the GIS software extension Network Analyst was used to calculate
the shortest distance path computed by obtaining the minimum impendences
between the temporary collection points and the final disposal landfill. ArcGIS
Network Analyst is a powerful extension that provides network-based spatial
analysis including routing, travel directions, the closest facility and service area
analysis (Ghose et al., 2006).
32
<
Figure 4. Methodological structure applied in Papers II-IV
3.4 Waste generation and composition
For Paper II, data on the generation of waste delivered to the Kiteezi landfill
was collected for a period of seven months, from December 2011 to June 2012.
Trucks that collected solid wastes were weighed using a weighbridge and the
loaded truck weight recorded (weight one). After offloading solid wastes, the
trucks were weighed again (weight two). Weight two was subtracted from
weight one to get the actual weight of solid waste. Truck information about the
origin of the waste was recorded at the landfill office and this was helpful for
distinguishing between the different areas of waste generation. In Paper III a
figure of 40 % for the collection of waste generated was obtained for a period
of two months (May and June 2013). At 40 % about 615 tonnes are collected
and disposed of at Kiteezi and this was the figure that was used for route
optimisation.
With Paper IV, the survey was carried out for a period of six months from
December 2012 to May 2013. Samples were picked in the first and last week of
the month for five consecutive days, with each day allocated to a division
GIS GPS Spread
sheet
Tools
• Manage spatial data
• Manage attribute
data
• Simulate route
distances, time and
vehicle fleets
• Map development
and viewing
Description
• Record and monitor
truck routes
• Record temporary
collection points
• Record locations
• Data entry
• Data editing
• Statistical analysis
• Locational analysis
Data input
33
(Central for Monday, Kawempe for Tuesday, Makindye for Wednesday,
Nakawa for Thursday and Rubaga for Friday). A truck schedule for that day
from each of the five divisions was randomly selected and its waste analysed.
Ten Kampala Capital City Authority (KCCA) trucks were sampled per month,
giving a total of 60 truck trips for the entire six-month period. Samples were
sorted, classified and weighed in ten categories of waste stream, including
organics, earth materials, hard plastics, soft plastics, paper, metals, glass,
vegetation, textiles and other wastes.
Paper II classified and categorised waste collection models. In the study,
waste collection models referred to the classification of the existing waste
collection arrangements (concepts) in Kampala. These included poor areas,
medium to upscale wealthier areas, institutions, business centres and market
areas. Waste from the different areas was weighed and quantified. The aim was
to identify waste generation by each model.
In Paper II, a waste composition survey was obtained by randomly picking
two KCCA trucks from each division on a bi-weekly basis for a period of two
months and separating the waste into the categories of organics, plastics, paper,
glass, metals and other special wastes such as medical waste.
The categorisation of waste in Papers II and IV involved collecting, sorting and
weighing individual categories of the waste stream. An area at the landfill
about 7 m in length and 3 m wide was graded flat by a grader on which waste
trucks dumped tips of waste approximately 1 m high at a time. The waste tips
were then spread on the flat ground using a forked hoe. The waste was then
categorised and deposited on a cleared area covered with a high density
polyethylene (HDPE) liner and then weighed. The aim was to know the
composition of waste from Kampala.
The classification of waste for the Paper IV study was focused more on the
―potential use‖ and willingness to pay for the products sorted from waste to
estimate the amount of waste that leaves the landfill. This was followed by an
organisation structure of product collection and redistribution to final
destinations. The network of recovery options undertaken were reuse, recycling
and final disposal with subsequent approaches and outcomes.
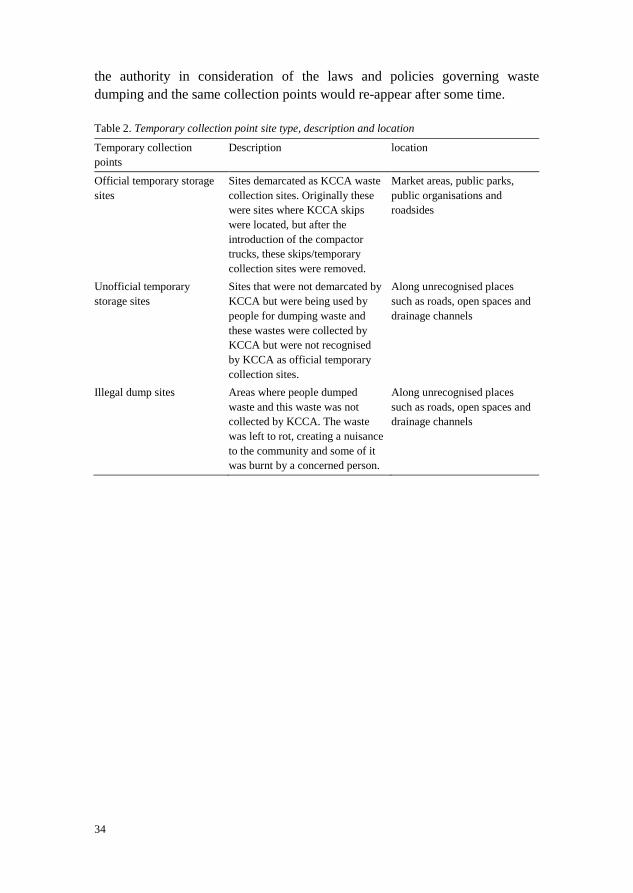
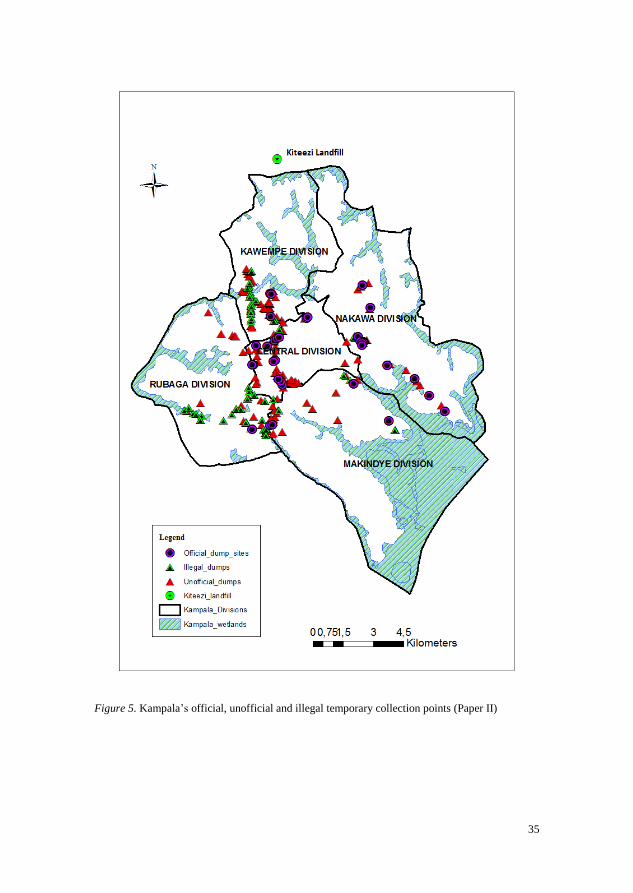
3.5 Description of waste collection points
In Papers II and III, these temporary collection points were used as waste
collection sites (official and unofficial) where trucks picked up waste (Table 2
and Fig. 5). These temporary collection points were characterised by waste
fluctuations, especially with the unofficial temporary storage sites and illegal
collection points. This was because at any time these sites could be removed by
34
the authority in consideration of the laws and policies governing waste
dumping and the same collection points would re-appear after some time.
Table 2. Temporary collection point site type, description and location
Temporary collection
points
Description location
Official temporary storage
sites
Sites demarcated as KCCA waste
collection sites. Originally these
were sites where KCCA skips
were located, but after the
introduction of the compactor
trucks, these skips/temporary
collection sites were removed.
Market areas, public parks,
public organisations and
roadsides
Unofficial temporary
storage sites
Sites that were not demarcated by
KCCA but were being used by
people for dumping waste and
these wastes were collected by
KCCA but were not recognised
by KCCA as official temporary
collection sites.
Along unrecognised places
such as roads, open spaces and
drainage channels
Illegal dump sites Areas where people dumped
waste and this waste was not
collected by KCCA. The waste
was left to rot, creating a nuisance
to the community and some of it
was burnt by a concerned person.
Along unrecognised places
such as roads, open spaces and
drainage channels
35
Figure 5. Kampala’s official, unofficial and illegal temporary collection points (Paper II)
36
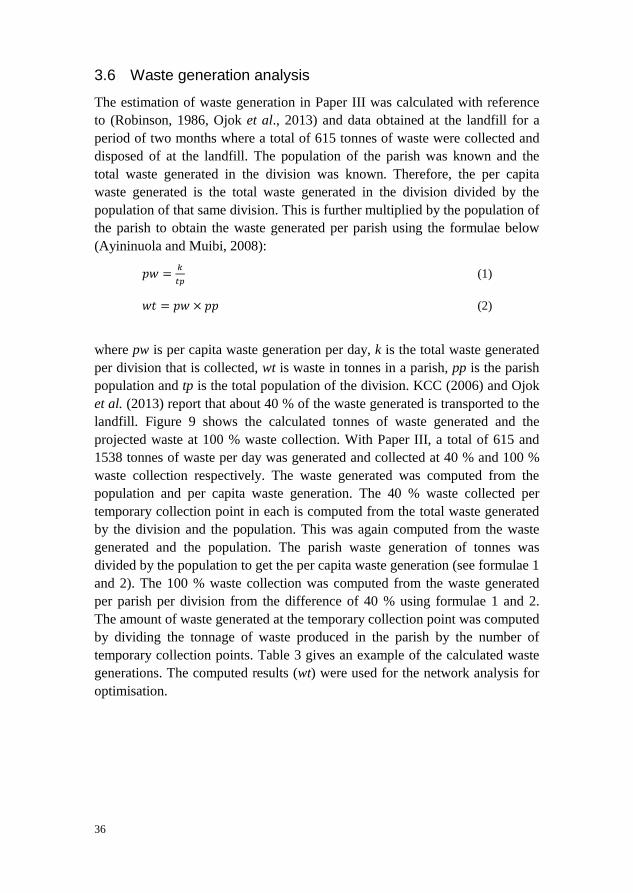
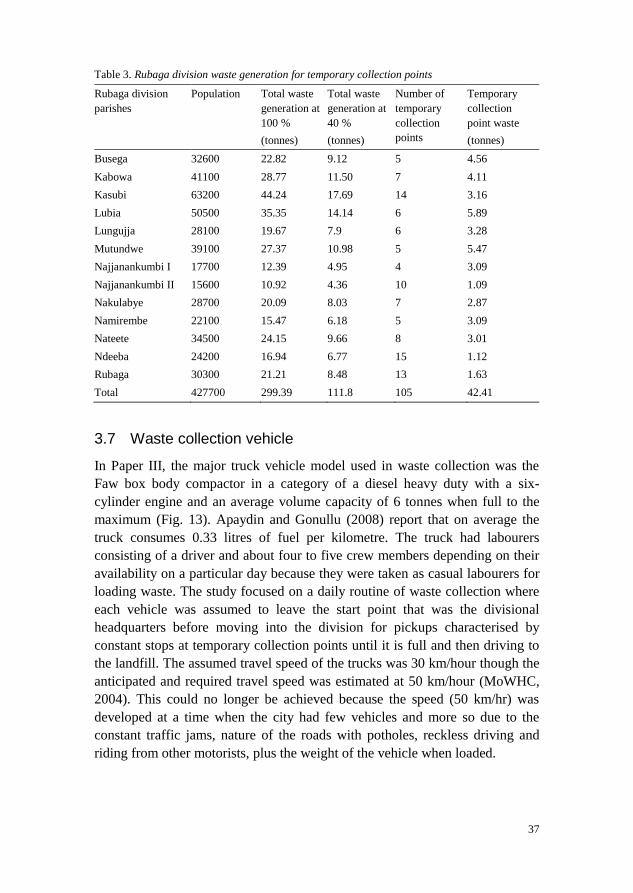
3.6 Waste generation analysis
The estimation of waste generation in Paper III was calculated with reference
to (Robinson, 1986, Ojok et al., 2013) and data obtained at the landfill for a
period of two months where a total of 615 tonnes of waste were collected and
disposed of at the landfill. The population of the parish was known and the
total waste generated in the division was known. Therefore, the per capita
waste generated is the total waste generated in the division divided by the
population of that same division. This is further multiplied by the population of
the parish to obtain the waste generated per parish using the formulae below
(Ayininuola and Muibi, 2008):
(1)
(2)
where pw is per capita waste generation per day, k is the total waste generated
per division that is collected, wt is waste in tonnes in a parish, pp is the parish
population and tp is the total population of the division. KCC (2006) and Ojok
et al. (2013) report that about 40 % of the waste generated is transported to the
landfill. Figure 9 shows the calculated tonnes of waste generated and the
projected waste at 100 % waste collection. With Paper III, a total of 615 and
1538 tonnes of waste per day was generated and collected at 40 % and 100 %
waste collection respectively. The waste generated was computed from the
population and per capita waste generation. The 40 % waste collected per
temporary collection point in each is computed from the total waste generated
by the division and the population. This was again computed from the waste
generated and the population. The parish waste generation of tonnes was
divided by the population to get the per capita waste generation (see formulae 1
and 2). The 100 % waste collection was computed from the waste generated
per parish per division from the difference of 40 % using formulae 1 and 2.
The amount of waste generated at the temporary collection point was computed
by dividing the tonnage of waste produced in the parish by the number of
temporary collection points. Table 3 gives an example of the calculated waste
generations. The computed results (wt) were used for the network analysis for
optimisation.
37
Table 3. Rubaga division waste generation for temporary collection points
Rubaga division
parishes
Population Total waste
generation at
100 %
(tonnes)
Total waste
generation at
40 %
(tonnes)
Number of
temporary
collection
points
Temporary
collection
point waste
(tonnes)
Busega 32600 22.82 9.12 5 4.56
Kabowa 41100 28.77 11.50 7 4.11
Kasubi 63200 44.24 17.69 14 3.16
Lubia 50500 35.35 14.14 6 5.89
Lungujja 28100 19.67 7.9 6 3.28
Mutundwe 39100 27.37 10.98 5 5.47
Najjanankumbi I 17700 12.39 4.95 4 3.09
Najjanankumbi II 15600 10.92 4.36 10 1.09
Nakulabye 28700 20.09 8.03 7 2.87
Namirembe 22100 15.47 6.18 5 3.09
Nateete 34500 24.15 9.66 8 3.01
Ndeeba 24200 16.94 6.77 15 1.12
Rubaga 30300 21.21 8.48 13 1.63
Total 427700 299.39 111.8 105 42.41
3.7 Waste collection vehicle
In Paper III, the major truck vehicle model used in waste collection was the
Faw box body compactor in a category of a diesel heavy duty with a six-
cylinder engine and an average volume capacity of 6 tonnes when full to the
maximum (Fig. 13). Apaydin and Gonullu (2008) report that on average the
truck consumes 0.33 litres of fuel per kilometre. The truck had labourers
consisting of a driver and about four to five crew members depending on their
availability on a particular day because they were taken as casual labourers for
loading waste. The study focused on a daily routine of waste collection where
each vehicle was assumed to leave the start point that was the divisional
headquarters before moving into the division for pickups characterised by
constant stops at temporary collection points until it is full and then driving to
the landfill. The assumed travel speed of the trucks was 30 km/hour though the
anticipated and required travel speed was estimated at 50 km/hour (MoWHC,
2004). This could no longer be achieved because the speed (50 km/hr) was
developed at a time when the city had few vehicles and more so due to the
constant traffic jams, nature of the roads with potholes, reckless driving and
riding from other motorists, plus the weight of the vehicle when loaded.
38
3.8 Vehicle routing (VR) methodology scenarios and description
The optimal truck routes were developed using GIS ArcMap software to find
the shortest distance from the source (start) point then temporary collection
point and finally to the landfill. The speed of the trucks was assumed to be the
same because one common type was used. The software calculated the distance
and travel time of the truck per trip. Using the GIS software, Arc map tools
were used to build a network database of the routes and the data was stored in
polylines, shapes, nodes and arcs. Within the GIS software, an extension tool
of Network Analysis was applied in vehicle routing to determine the shortest
route from the collection points to the landfill (Ghose et al., 2006, Tavares et
al., 2009). The software found the closest temporary collection point and
capacity of waste to be picked up then built up the route for the whole waste to
be hauled. In the study, the service time was assumed to be similar (time of
fuelling and loading of waste).
The VR methodology in Paper III comprised two approaches, namely the
heuristic and deterministic ones (Nagy and Salhi, 2007) and included the
following routing algorithms:
a) recording some of the current routes followed by the trucks and then
optimising the routes
b) creating optimised routes to the Kiteezi landfill with reference to the
official and unofficial dumpsites per division using the current six-tonne
trucks and proposed 10 and 18-tonne trucks to solve the routing problem at
the current 40 % and at the projected 100 % waste collection (improving the
initial available system with the current trucks and increasing the fleet with
a higher tonnage)
c) creating optimised routes by employing an outsourced private operator
using 20-tonne capacity trucks to transport waste to Kiteezi and the new
proposed landfill sites
d) performing location analysis to propose new landfill sites taking into
consideration the sites proposed by KCCA with an emphasis on travel
distances.
For the current recorded routes, optimisation was based only on distance
travelled and time taken without considering other factors such as weight of
waste and loading time.
3.9 Vehicle routing development and assumptions
Optimised routing of distances was solved per division, where the same vehicle
model (Faw box body compactor trucks with capacity of 6 tonnes) started the
journey at the divisional headquarters and made multiple trips, starting at 08:00
39
at the divisional headquarters and returning at the end of the day at 22:00, with
a service time of 20 minutes at each stop (fuelling at petrol station and loading
of waste). With the outsourced private operator, the starting point was the
central divisional headquarters because it is centrally located for all the
divisions to access. The collection vehicle stopped at temporary collection
points (official, unofficial and illegal: 459 in number) (Fig. 6). From the first
temporary collection point, the truck moved to the next optimised dump until it
filled its capacity and thereafter travelled to the landfill for disposal, taking into
account minimisation of distances.
Optimised routes were created using the available six-tonne Faw box body
compactor truck and proposed 10 and 18-tonne trucks to Kiteezi and the
proposed new landfill to solve the scenario at 40 % and 100 % waste
collection. The outsourced private operator was assumed to use 20-tonne
capacity vehicles to create optimised routes to the new proposed landfills. The
VR constraint faced was the homogeneity in make and capacity of the vehicle
used (Faw box body compactor); no route barriers were included, such as the
high traffic flow causing the slow speed of the trucks, and waste fluctuations in
the parish were not considered.
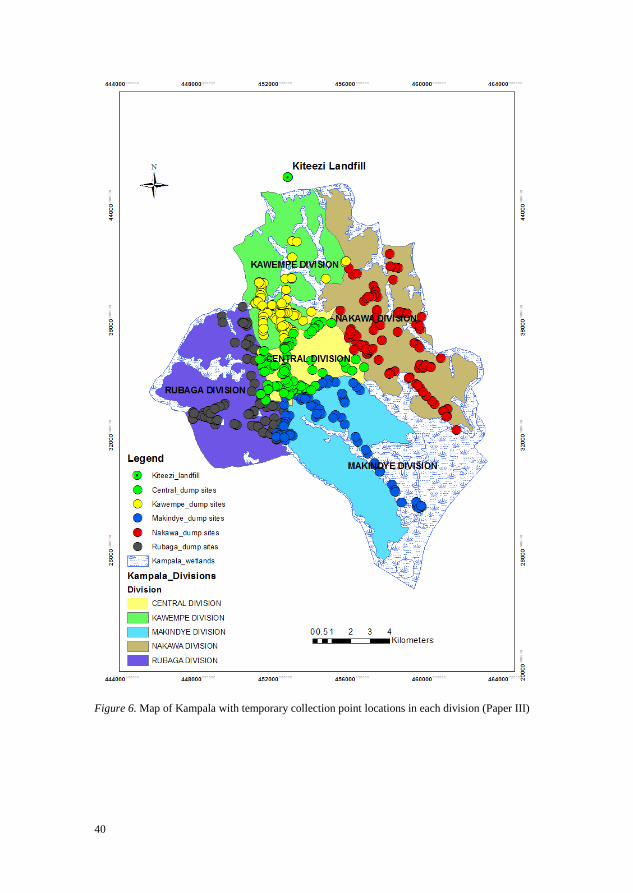
40
Figure 6. Map of Kampala with temporary collection point locations in each division (Paper III)
41
4 Results
4.1 Waste generation and composition
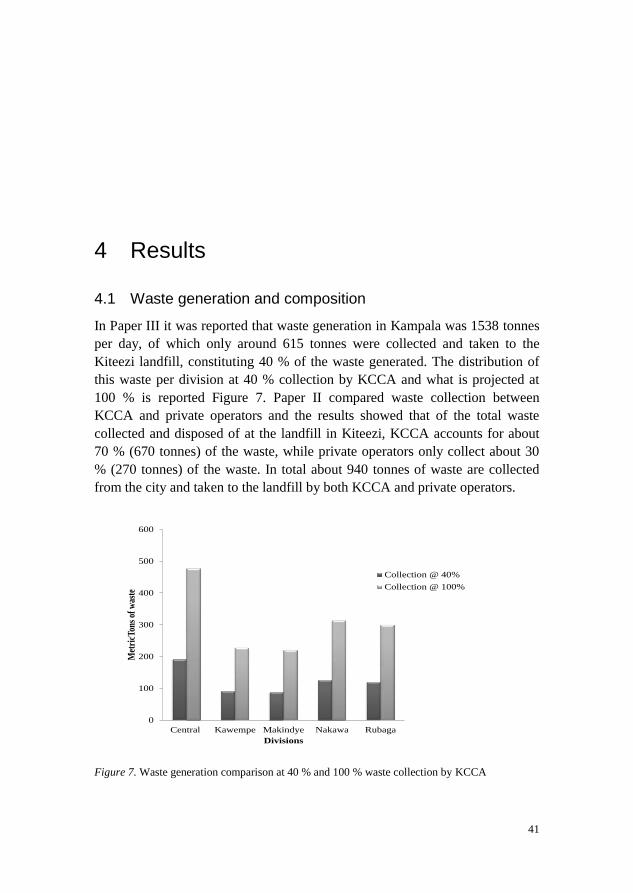
In Paper III it was reported that waste generation in Kampala was 1538 tonnes
per day, of which only around 615 tonnes were collected and taken to the
Kiteezi landfill, constituting 40 % of the waste generated. The distribution of
this waste per division at 40 % collection by KCCA and what is projected at
100 % is reported Figure 7. Paper II compared waste collection between
KCCA and private operators and the results showed that of the total waste
collected and disposed of at the landfill in Kiteezi, KCCA accounts for about
70 % (670 tonnes) of the waste, while private operators only collect about 30
% (270 tonnes) of the waste. In total about 940 tonnes of waste are collected
from the city and taken to the landfill by both KCCA and private operators.
Figure 7. Waste generation comparison at 40 % and 100 % waste collection by KCCA
0
100
200
300
400
500
600
Central Kawempe Makindye Nakawa Rubaga
Met
ricT
ons
of w
aste
Divisions
Collection @ 40%
Collection @ 100%
42
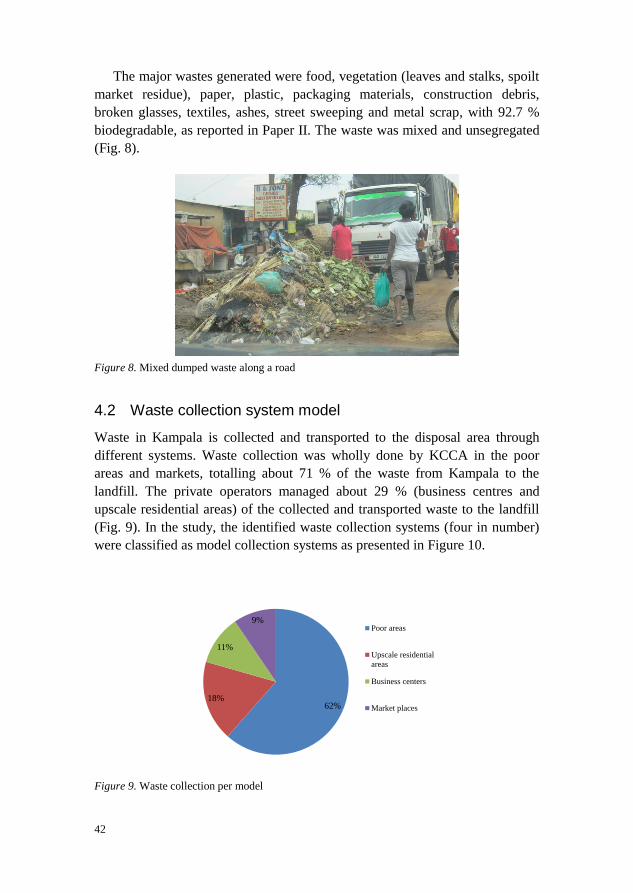
The major wastes generated were food, vegetation (leaves and stalks, spoilt
market residue), paper, plastic, packaging materials, construction debris,
broken glasses, textiles, ashes, street sweeping and metal scrap, with 92.7 %
biodegradable, as reported in Paper II. The waste was mixed and unsegregated
(Fig. 8).
Figure 8. Mixed dumped waste along a road
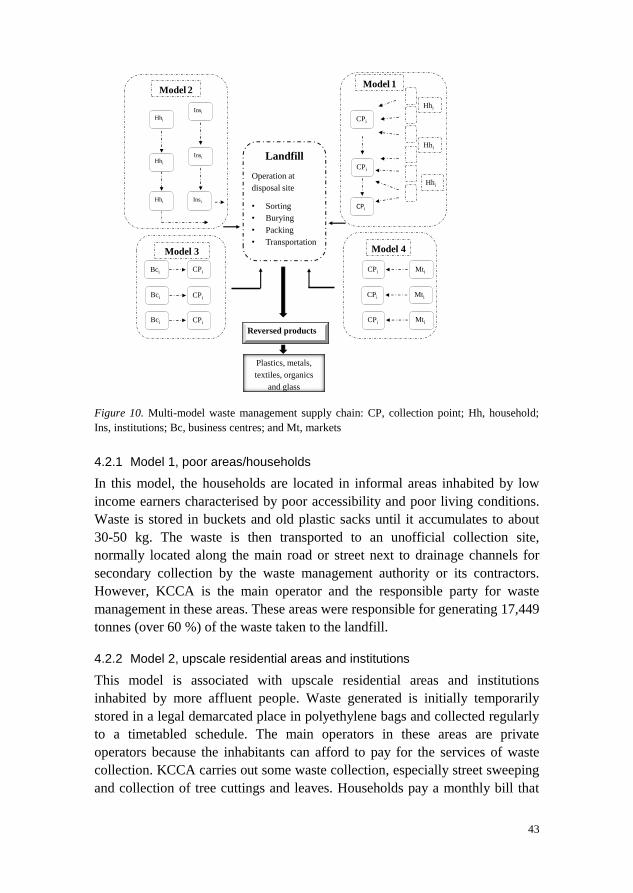
4.2 Waste collection system model
Waste in Kampala is collected and transported to the disposal area through
different systems. Waste collection was wholly done by KCCA in the poor
areas and markets, totalling about 71 % of the waste from Kampala to the
landfill. The private operators managed about 29 % (business centres and
upscale residential areas) of the collected and transported waste to the landfill
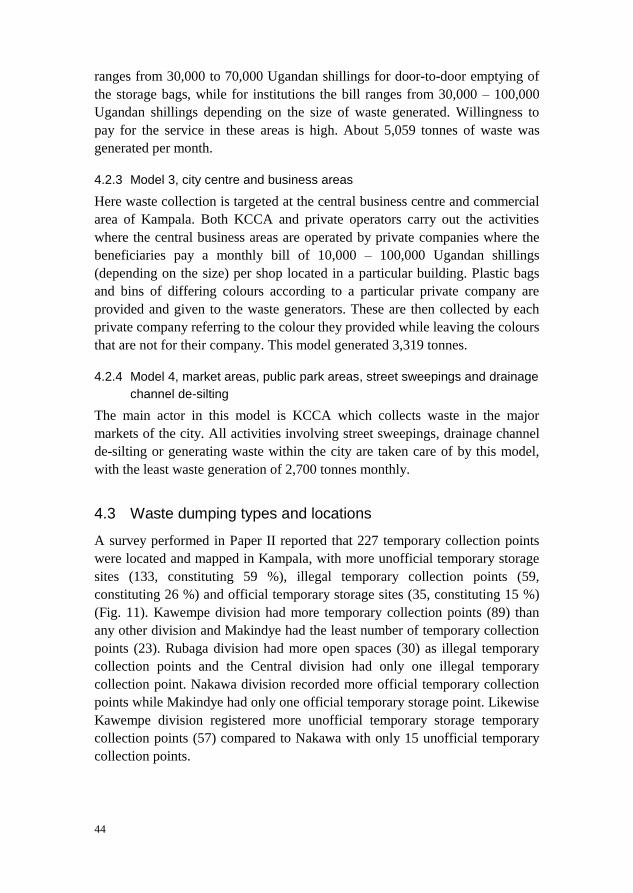
(Fig. 9). In the study, the identified waste collection systems (four in number)
were classified as model collection systems as presented in Figure 10.
Figure 9. Waste collection per model
62% 18%
11%
9% Poor areas
Upscale residential
areas
Business centers
Market places
43
Figure 10. Multi-model waste management supply chain: CP, collection point; Hh, household;
Ins, institutions; Bc, business centres; and Mt, markets
4.2.1 Model 1, poor areas/households
In this model, the households are located in informal areas inhabited by low
income earners characterised by poor accessibility and poor living conditions.
Waste is stored in buckets and old plastic sacks until it accumulates to about
30-50 kg. The waste is then transported to an unofficial collection site,
normally located along the main road or street next to drainage channels for
secondary collection by the waste management authority or its contractors.
However, KCCA is the main operator and the responsible party for waste
management in these areas. These areas were responsible for generating 17,449
tonnes (over 60 %) of the waste taken to the landfill.
4.2.2 Model 2, upscale residential areas and institutions
This model is associated with upscale residential areas and institutions
inhabited by more affluent people. Waste generated is initially temporarily
stored in a legal demarcated place in polyethylene bags and collected regularly
to a timetabled schedule. The main operators in these areas are private
operators because the inhabitants can afford to pay for the services of waste
collection. KCCA carries out some waste collection, especially street sweeping
and collection of tree cuttings and leaves. Households pay a monthly bill that
Plastics, metals,
textiles, organics
and glass
Landfill
Operation at
disposal site
• Sorting
• Burying
• Packing
• Transportation
Model 2
Insi
Insi
Insi
Hhi
Hhi
Hhi
CPi
Hhi
Hhi
Hhi
Model 1
CPi
CPi
Model 3
Bci
Bci
Bci CPi
CPi
CPi
Model 4
CPi
CPi
CPi
Mti
Mti
Mti
Reversed products
44
ranges from 30,000 to 70,000 Ugandan shillings for door-to-door emptying of
the storage bags, while for institutions the bill ranges from 30,000 – 100,000
Ugandan shillings depending on the size of waste generated. Willingness to
pay for the service in these areas is high. About 5,059 tonnes of waste was
generated per month.
4.2.3 Model 3, city centre and business areas
Here waste collection is targeted at the central business centre and commercial
area of Kampala. Both KCCA and private operators carry out the activities
where the central business areas are operated by private companies where the
beneficiaries pay a monthly bill of 10,000 – 100,000 Ugandan shillings
(depending on the size) per shop located in a particular building. Plastic bags
and bins of differing colours according to a particular private company are
provided and given to the waste generators. These are then collected by each
private company referring to the colour they provided while leaving the colours
that are not for their company. This model generated 3,319 tonnes.
4.2.4 Model 4, market areas, public park areas, street sweepings and drainage
channel de-silting
The main actor in this model is KCCA which collects waste in the major
markets of the city. All activities involving street sweepings, drainage channel
de-silting or generating waste within the city are taken care of by this model,
with the least waste generation of 2,700 tonnes monthly.
4.3 Waste dumping types and locations
A survey performed in Paper II reported that 227 temporary collection points
were located and mapped in Kampala, with more unofficial temporary storage
sites (133, constituting 59 %), illegal temporary collection points (59,
constituting 26 %) and official temporary storage sites (35, constituting 15 %)
(Fig. 11). Kawempe division had more temporary collection points (89) than
any other division and Makindye had the least number of temporary collection
points (23). Rubaga division had more open spaces (30) as illegal temporary
collection points and the Central division had only one illegal temporary
collection point. Nakawa division recorded more official temporary collection
points while Makindye had only one official temporary storage point. Likewise
Kawempe division registered more unofficial temporary storage temporary
collection points (57) compared to Nakawa with only 15 unofficial temporary
collection points.
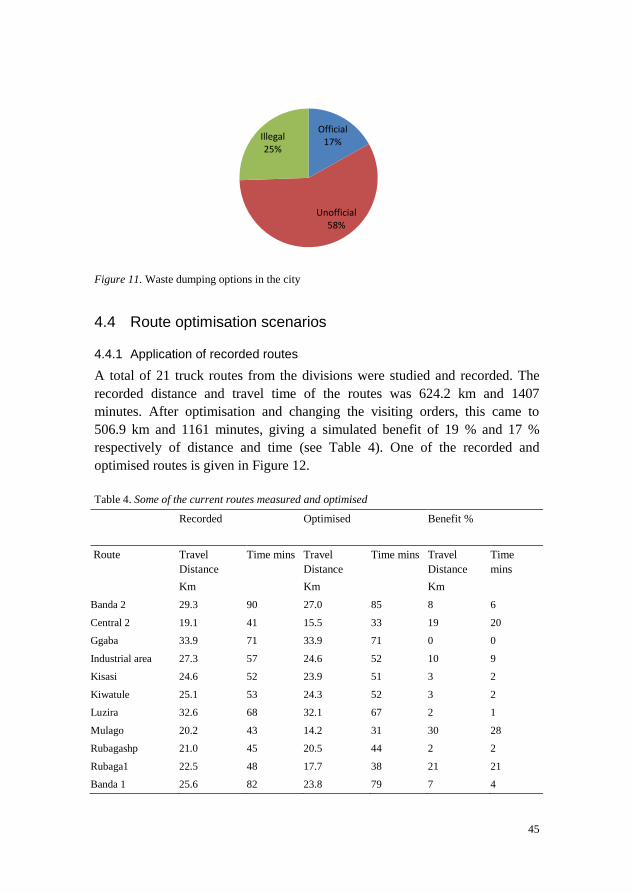
45
Figure 11. Waste dumping options in the city
4.4 Route optimisation scenarios
4.4.1 Application of recorded routes
A total of 21 truck routes from the divisions were studied and recorded. The
recorded distance and travel time of the routes was 624.2 km and 1407
minutes. After optimisation and changing the visiting orders, this came to
506.9 km and 1161 minutes, giving a simulated benefit of 19 % and 17 %
respectively of distance and time (see Table 4). One of the recorded and
optimised routes is given in Figure 12.
Table 4. Some of the current routes measured and optimised
Recorded Optimised Benefit %
Route Travel
Distance
Km
Time mins Travel
Distance
Km
Time mins Travel
Distance
Km
Time
mins
Banda 2 29.3 90 27.0 85 8 6
Central 2 19.1 41 15.5 33 19 20
Ggaba 33.9 71 33.9 71 0 0
Industrial area 27.3 57 24.6 52 10 9
Kisasi 24.6 52 23.9 51 3 2
Kiwatule 25.1 53 24.3 52 3 2
Luzira 32.6 68 32.1 67 2 1
Mulago 20.2 43 14.2 31 30 28
Rubagashp 21.0 45 20.5 44 2 2
Rubaga1 22.5 48 17.7 38 21 21
Banda 1 25.6 82 23.8 79 7 4
Official 17%
Unofficial 58%
Illegal 25%
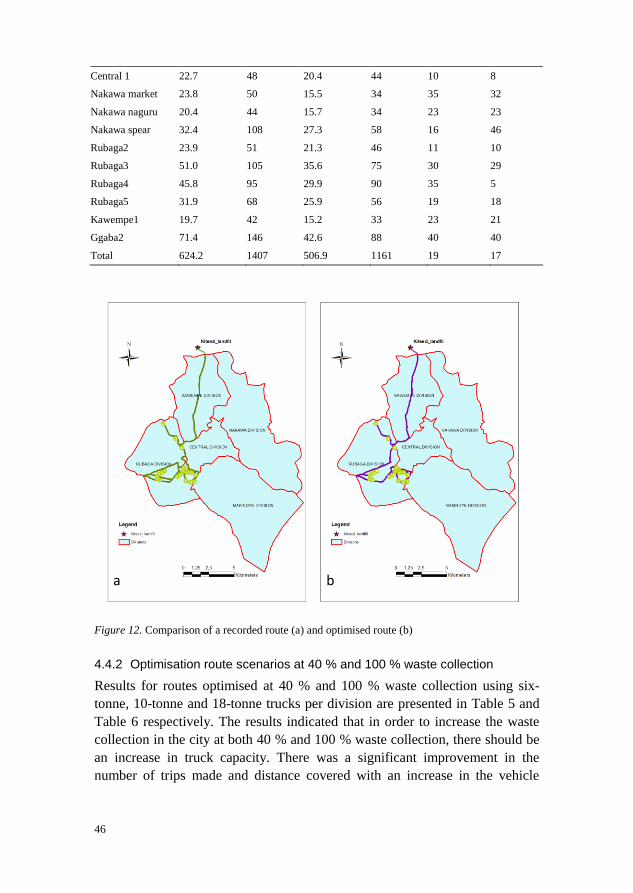
46
Central 1 22.7 48 20.4 44 10 8
Nakawa market 23.8 50 15.5 34 35 32
Nakawa naguru 20.4 44 15.7 34 23 23
Nakawa spear 32.4 108 27.3 58 16 46
Rubaga2 23.9 51 21.3 46 11 10
Rubaga3 51.0 105 35.6 75 30 29
Rubaga4 45.8 95 29.9 90 35 5
Rubaga5 31.9 68 25.9 56 19 18
Kawempe1 19.7 42 15.2 33 23 21
Ggaba2 71.4 146 42.6 88 40 40
Total 624.2 1407 506.9 1161 19 17
Figure 12. Comparison of a recorded route (a) and optimised route (b)
4.4.2 Optimisation route scenarios at 40 % and 100 % waste collection
Results for routes optimised at 40 % and 100 % waste collection using six-
tonne, 10-tonne and 18-tonne trucks per division are presented in Table 5 and
Table 6 respectively. The results indicated that in order to increase the waste
collection in the city at both 40 % and 100 % waste collection, there should be
an increase in truck capacity. There was a significant improvement in the
number of trips made and distance covered with an increase in the vehicle
b a
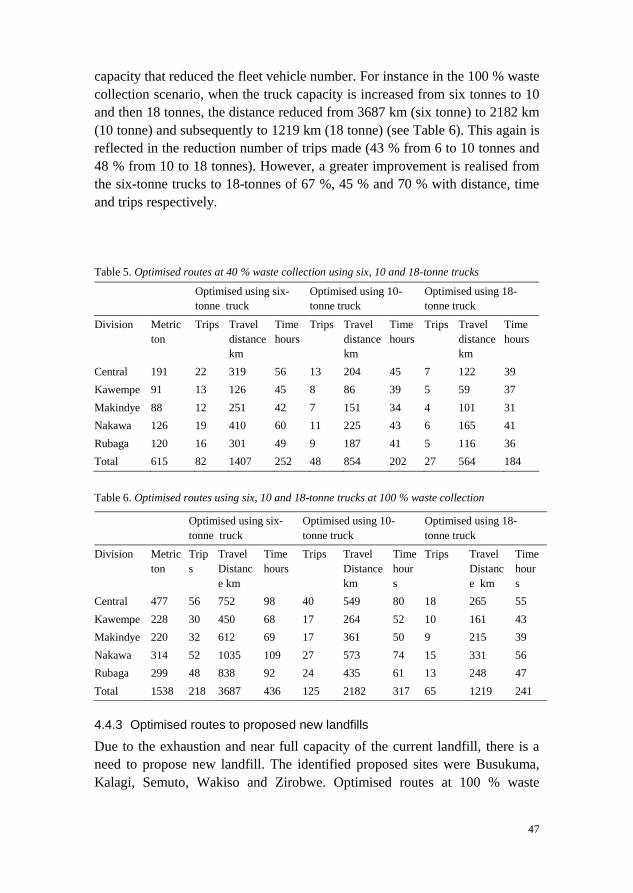
47
capacity that reduced the fleet vehicle number. For instance in the 100 % waste
collection scenario, when the truck capacity is increased from six tonnes to 10
and then 18 tonnes, the distance reduced from 3687 km (six tonne) to 2182 km
(10 tonne) and subsequently to 1219 km (18 tonne) (see Table 6). This again is
reflected in the reduction number of trips made (43 % from 6 to 10 tonnes and
48 % from 10 to 18 tonnes). However, a greater improvement is realised from
the six-tonne trucks to 18-tonnes of 67 %, 45 % and 70 % with distance, time
and trips respectively.
Table 5. Optimised routes at 40 % waste collection using six, 10 and 18-tonne trucks
Optimised using six-
tonne truck
Optimised using 10-
tonne truck
Optimised using 18-
tonne truck
Division Metric
ton
Trips Travel
distance
km
Time
hours
Trips Travel
distance
km
Time
hours
Trips Travel
distance
km
Time
hours
Central 191 22 319 56 13 204 45 7 122 39
Kawempe 91 13 126 45 8 86 39 5 59 37
Makindye 88 12 251 42 7 151 34 4 101 31
Nakawa 126 19 410 60 11 225 43 6 165 41
Rubaga 120 16 301 49 9 187 41 5 116 36
Total 615 82 1407 252 48 854 202 27 564 184
Table 6. Optimised routes using six, 10 and 18-tonne trucks at 100 % waste collection
4.4.3 Optimised routes to proposed new landfills
Due to the exhaustion and near full capacity of the current landfill, there is a
need to propose new landfill. The identified proposed sites were Busukuma,
Kalagi, Semuto, Wakiso and Zirobwe. Optimised routes at 100 % waste
Optimised using six-
tonne truck
Optimised using 10-
tonne truck
Optimised using 18-
tonne truck
Division Metric
ton
Trip
s
Travel
Distanc
e km
Time
hours
Trips Travel
Distance
km
Time
hour
s
Trips Travel
Distanc
e km
Time
hour
s
Central 477 56 752 98 40 549 80 18 265 55
Kawempe 228 30 450 68 17 264 52 10 161 43
Makindye 220 32 612 69 17 361 50 9 215 39
Nakawa 314 52 1035 109 27 573 74 15 331 56
Rubaga 299 48 838 92 24 435 61 13 248 47
Total 1538 218 3687 436 125 2182 317 65 1219 241
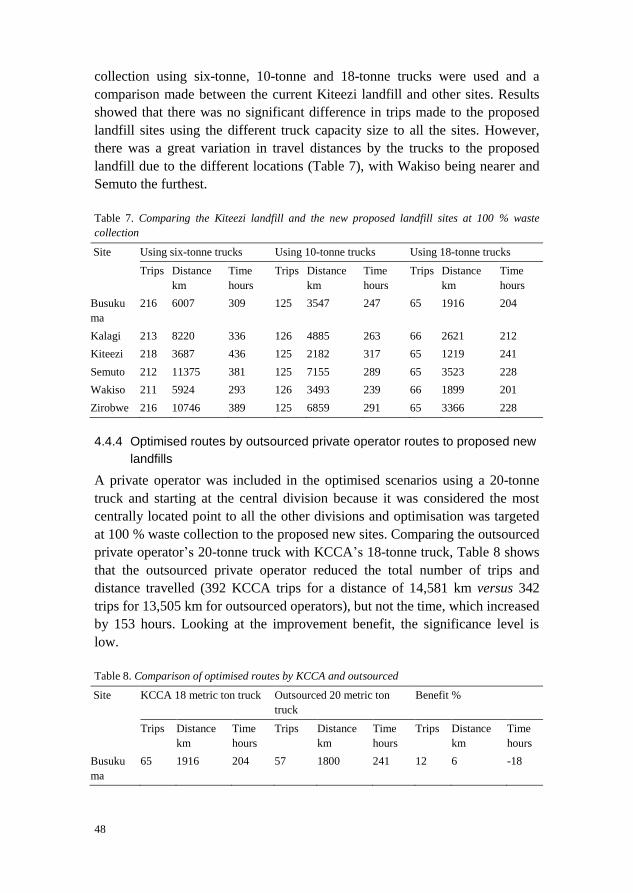
48
collection using six-tonne, 10-tonne and 18-tonne trucks were used and a
comparison made between the current Kiteezi landfill and other sites. Results
showed that there was no significant difference in trips made to the proposed
landfill sites using the different truck capacity size to all the sites. However,
there was a great variation in travel distances by the trucks to the proposed
landfill due to the different locations (Table 7), with Wakiso being nearer and
Semuto the furthest.
Table 7. Comparing the Kiteezi landfill and the new proposed landfill sites at 100 % waste
collection
Site Using six-tonne trucks Using 10-tonne trucks Using 18-tonne trucks
Trips Distance
km
Time
hours
Trips Distance
km
Time
hours
Trips Distance
km
Time
hours
Busuku
ma
216 6007 309 125 3547 247 65 1916 204
Kalagi 213 8220 336 126 4885 263 66 2621 212
Kiteezi 218 3687 436 125 2182 317 65 1219 241
Semuto 212 11375 381 125 7155 289 65 3523 228
Wakiso 211 5924 293 126 3493 239 66 1899 201
Zirobwe 216 10746 389 125 6859 291 65 3366 228
4.4.4 Optimised routes by outsourced private operator routes to proposed new
landfills
A private operator was included in the optimised scenarios using a 20-tonne
truck and starting at the central division because it was considered the most
centrally located point to all the other divisions and optimisation was targeted
at 100 % waste collection to the proposed new sites. Comparing the outsourced
private operator’s 20-tonne truck with KCCA’s 18-tonne truck, Table 8 shows
that the outsourced private operator reduced the total number of trips and
distance travelled (392 KCCA trips for a distance of 14,581 km versus 342
trips for 13,505 km for outsourced operators), but not the time, which increased
by 153 hours. Looking at the improvement benefit, the significance level is
low.
Table 8. Comparison of optimised routes by KCCA and outsourced
Site KCCA 18 metric ton truck Outsourced 20 metric ton
truck
Benefit %
Trips Distance
km
Time
hours
Trips Distance
km
Time
hours
Trips Distance
km
Time
hours
Busuku
ma
65 1916 204 57 1800 241 12 6 -18
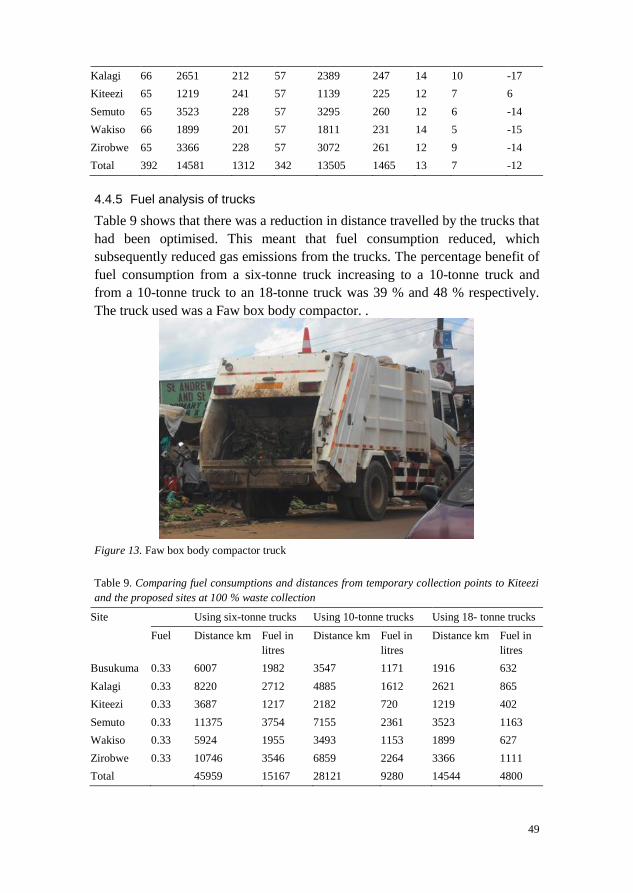
49
Kalagi 66 2651 212 57 2389 247 14 10 -17
Kiteezi 65 1219 241 57 1139 225 12 7 6
Semuto 65 3523 228 57 3295 260 12 6 -14
Wakiso 66 1899 201 57 1811 231 14 5 -15
Zirobwe 65 3366 228 57 3072 261 12 9 -14
Total 392 14581 1312 342 13505 1465 13 7 -12
4.4.5 Fuel analysis of trucks
Table 9 shows that there was a reduction in distance travelled by the trucks that
had been optimised. This meant that fuel consumption reduced, which
subsequently reduced gas emissions from the trucks. The percentage benefit of
fuel consumption from a six-tonne truck increasing to a 10-tonne truck and
from a 10-tonne truck to an 18-tonne truck was 39 % and 48 % respectively.
The truck used was a Faw box body compactor. .
Figure 13. Faw box body compactor truck
Table 9. Comparing fuel consumptions and distances from temporary collection points to Kiteezi
and the proposed sites at 100 % waste collection
Site Using six-tonne trucks Using 10-tonne trucks Using 18- tonne trucks
Fuel Distance km Fuel in
litres
Distance km Fuel in
litres
Distance km Fuel in
litres
Busukuma 0.33 6007 1982 3547 1171 1916 632
Kalagi 0.33 8220 2712 4885 1612 2621 865
Kiteezi 0.33 3687 1217 2182 720 1219 402
Semuto 0.33 11375 3754 7155 2361 3523 1163
Wakiso 0.33 5924 1955 3493 1153 1899 627
Zirobwe 0.33 10746 3546 6859 2264 3366 1111
Total 45959 15167 28121 9280 14544 4800
50
4.5 Reverse logistics network chain
In Paper IV there was an identification of the reverse logistics network chain
that included stages before reaching the landfill and at the landfill and it
extended activities after the landfill (Table 10). The recovery system was
organised with actors performing a particular activity in the channel. The
activities depended on the demand and supply of the products.
Table 10. Arrangement of reverse logistics actors at the Kiteezi landfill
Stages Reverse logistic actors Description
Prior to the
landfill
Waste collectors/street
children
This group moves within households and
temporary collection points looking for
recyclable materials such as plastics, metals,
glass bottles, old shoes etc. The slight
difference between the waste collectors and
street children is that the waste collectors
sometimes pay for the materials from the
households. The street children just search for
the products and they are normally sited near
temporary collection points waiting for waste
which they collect and sell to the refuse
loaders.
Refuse loaders They move on waste trucks loading waste
within the city and are contracted by KCCA
and receive a salary for their work. In addition
to their formal employment, they also collect
and trade recovery materials in order to earn
extra income. Their access to the waste
sources makes it possible for them to collect
and separate waste materials.
At the landfill Waste pickers
These collect different products from the
landfill. The quality of products collected by
the waste pickers is much lower than those
collected by loaders and waste pickers. The
main reason for this is that the sorting has
already taken place earlier in the system, for
instance at household level and at temporary
collection points. Therefore the quality of
materials that reach the landfill site are of a
much lower value.
Small shop dealers They buy the products at source, mainly from
waste collectors, waste pickers, street children
and refuse loaders. They aim for a variety of
products available. They are normally situated
near the landfill. They go an extra mile to add
value to the products by cleaning, washing and
sorting them into categories.
51
Traders/agents* These normally target a particular product.
They buy products from the small-scale
merchants and dealers and prefer cleaner
products. Payment was per kilogram of the
products bought and also depended on the
quality of the product.
Small-scale plastic
processing plants *
These are small firms that have sprung up in
and around the Kiteezi landfill to target plastic
recycling from the landfill. They aim to add
value to the products, which are later sold to
the bigger factories. They carry out limited
processing such as cutting plastics into smaller
pellets.
Post landfill Factories and industries They add great value by processing and
remanufacturing the products purchased. They
usually require a minimum quantity of sorted
and clean materials, which encourages the
existence of intermediaries and waste dealers
who purchase the recyclables recovered by the
waste pickers.
* These groups more or less do the same activities and it is difficult to distinguish between them. The
difference is in their size and location, with the small-scale processing plants being bigger and having a
permanent location.
4.6 Reverse logistics integration
4.6.1 Distribution network
Reverse distribution management of product return flow starts with the product
generators, usually called the suppliers, and these include the households,
restaurants, market places and business centres. These provide waste that is
normally dumped and unsegregated. This waste is later collected from the
temporary collection points by a number of actors, including waste pickers,
street children, refuse loaders and waste pickers, who enter into the distribution
chain up to the landfill. Waste with these actors undergoes activities such as
collection, transporting, separation, cleaning, washing, grading, packaging
selling and buying. At the landfill, small-scale traders, small-scale plants,
agents and factories enter the chain. This brings about competition from
information flow and product acquisitions (Fig. 14). At the landfill in Kiteezi
this involved the removal of defective and environmentally hazardous
materials.
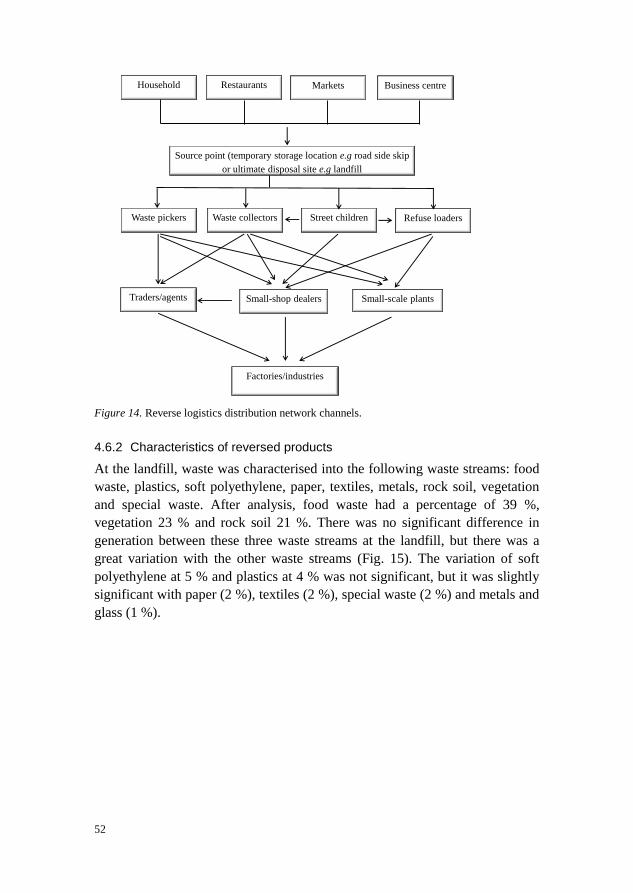
52
Figure 14. Reverse logistics distribution network channels.
4.6.2 Characteristics of reversed products
At the landfill, waste was characterised into the following waste streams: food
waste, plastics, soft polyethylene, paper, textiles, metals, rock soil, vegetation
and special waste. After analysis, food waste had a percentage of 39 %,
vegetation 23 % and rock soil 21 %. There was no significant difference in
generation between these three waste streams at the landfill, but there was a
great variation with the other waste streams (Fig. 15). The variation of soft
polyethylene at 5 % and plastics at 4 % was not significant, but it was slightly
significant with paper (2 %), textiles (2 %), special waste (2 %) and metals and
glass (1 %).
Household Business centre Markets Restaurants
Source point (temporary storage location e.g road side skip
or ultimate disposal site e.g landfill
Refuse loaders Street children Waste collectors
Small-scale plants Traders/agents Small-shop dealers
Factories/industries
Waste pickers
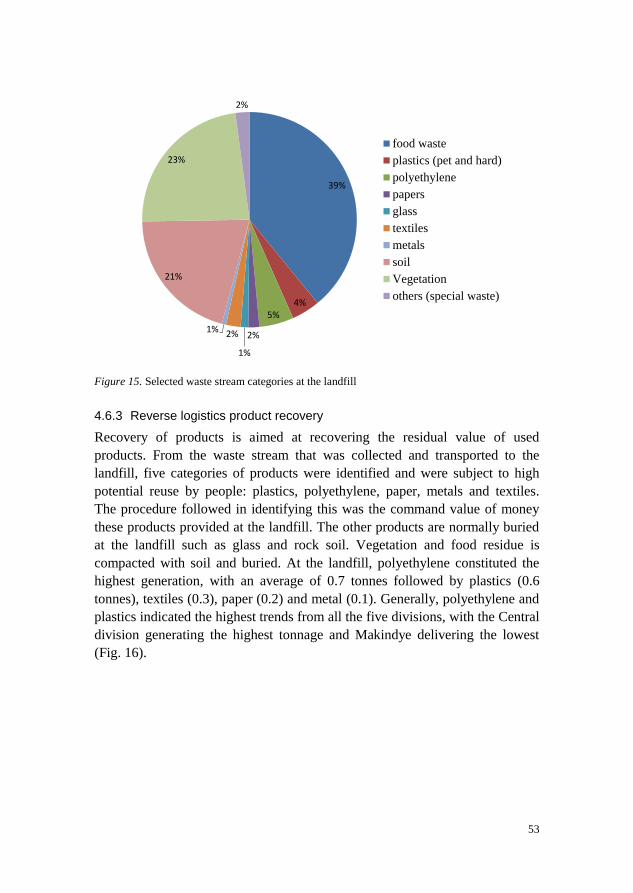
53
Figure 15. Selected waste stream categories at the landfill
4.6.3 Reverse logistics product recovery
Recovery of products is aimed at recovering the residual value of used
products. From the waste stream that was collected and transported to the
landfill, five categories of products were identified and were subject to high
potential reuse by people: plastics, polyethylene, paper, metals and textiles.
The procedure followed in identifying this was the command value of money
these products provided at the landfill. The other products are normally buried
at the landfill such as glass and rock soil. Vegetation and food residue is
compacted with soil and buried. At the landfill, polyethylene constituted the
highest generation, with an average of 0.7 tonnes followed by plastics (0.6
tonnes), textiles (0.3), paper (0.2) and metal (0.1). Generally, polyethylene and
plastics indicated the highest trends from all the five divisions, with the Central
division generating the highest tonnage and Makindye delivering the lowest
(Fig. 16).
39%
4% 5%
2%
1%
2% 1%
21%
23%
2%
food waste
plastics (pet and hard)
polyethylene
papers
glass
textiles
metals
soil
Vegetation
others (special waste)
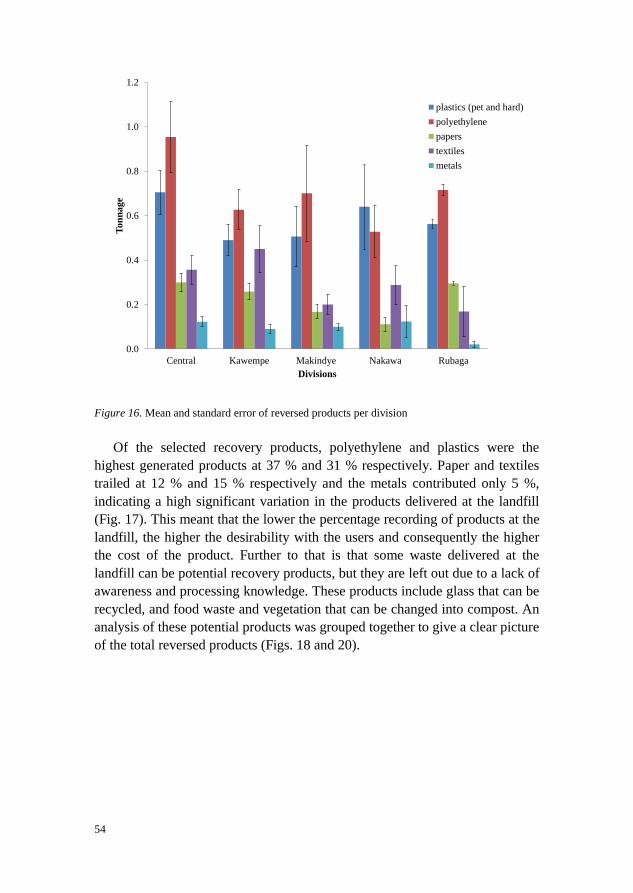
54
Figure 16. Mean and standard error of reversed products per division
Of the selected recovery products, polyethylene and plastics were the
highest generated products at 37 % and 31 % respectively. Paper and textiles
trailed at 12 % and 15 % respectively and the metals contributed only 5 %,
indicating a high significant variation in the products delivered at the landfill
(Fig. 17). This meant that the lower the percentage recording of products at the
landfill, the higher the desirability with the users and consequently the higher
the cost of the product. Further to that is that some waste delivered at the
landfill can be potential recovery products, but they are left out due to a lack of
awareness and processing knowledge. These products include glass that can be
recycled, and food waste and vegetation that can be changed into compost. An
analysis of these potential products was grouped together to give a clear picture
of the total reversed products (Figs. 18 and 20).
0.0
0.2
0.4
0.6
0.8
1.0
1.2
Central Kawempe Makindye Nakawa Rubaga
To
nn
ag
e
Divisions
plastics (pet and hard)
polyethylene
papers
textiles
metals
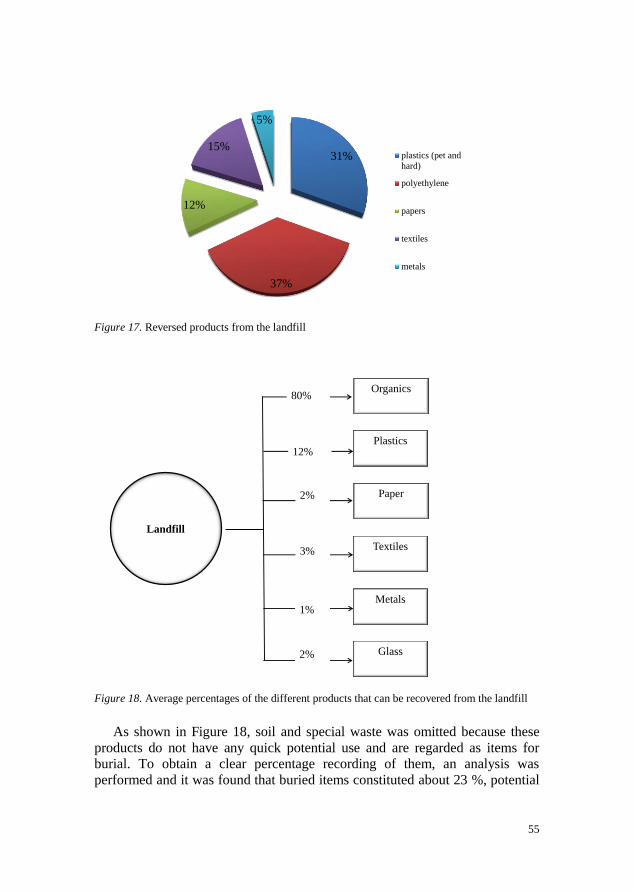
55
Figure 17. Reversed products from the landfill
Figure 18. Average percentages of the different products that can be recovered from the landfill
As shown in Figure 18, soil and special waste was omitted because these
products do not have any quick potential use and are regarded as items for
burial. To obtain a clear percentage recording of them, an analysis was
performed and it was found that buried items constituted about 23 %, potential
31%
37%
12%
15%
5%
plastics (pet and
hard)
polyethylene
papers
textiles
metals
Metals
Textiles
Paper
Plastics
Organics
Glass
Landfill
80%
12%
2%
3%
1%
2%
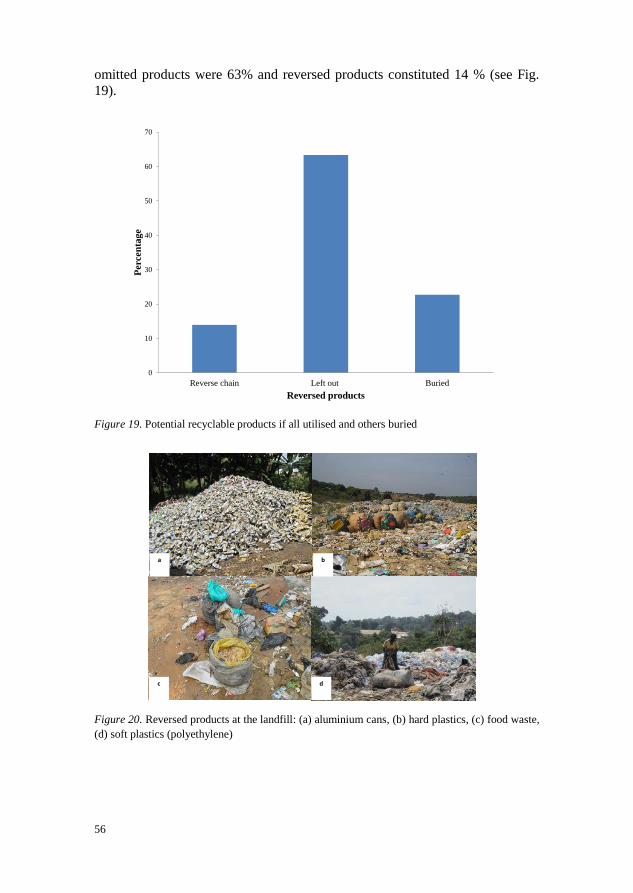
56
omitted products were 63% and reversed products constituted 14 % (see Fig.
19).
Figure 19. Potential recyclable products if all utilised and others buried
Figure 20. Reversed products at the landfill: (a) aluminium cans, (b) hard plastics, (c) food waste,
(d) soft plastics (polyethylene)
0
10
20
30
40
50
60
70
Reverse chain Left out Buried
Perc
en
tag
e
Reversed products
a b
c d
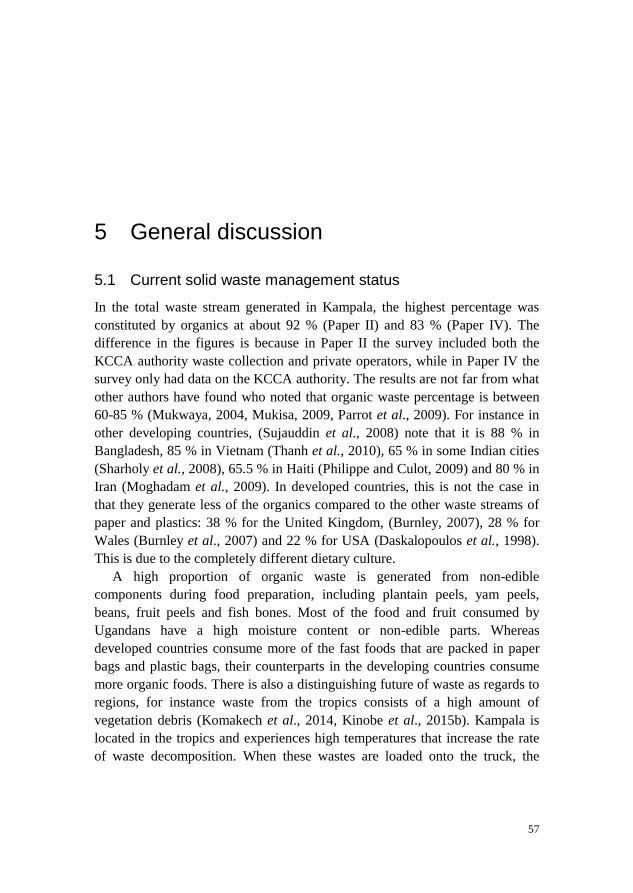
57
5 General discussion
5.1 Current solid waste management status
In the total waste stream generated in Kampala, the highest percentage was
constituted by organics at about 92 % (Paper II) and 83 % (Paper IV). The
difference in the figures is because in Paper II the survey included both the
KCCA authority waste collection and private operators, while in Paper IV the
survey only had data on the KCCA authority. The results are not far from what
other authors have found who noted that organic waste percentage is between
60-85 % (Mukwaya, 2004, Mukisa, 2009, Parrot et al., 2009). For instance in
other developing countries, (Sujauddin et al., 2008) note that it is 88 % in
Bangladesh, 85 % in Vietnam (Thanh et al., 2010), 65 % in some Indian cities
(Sharholy et al., 2008), 65.5 % in Haiti (Philippe and Culot, 2009) and 80 % in
Iran (Moghadam et al., 2009). In developed countries, this is not the case in
that they generate less of the organics compared to the other waste streams of
paper and plastics: 38 % for the United Kingdom, (Burnley, 2007), 28 % for
Wales (Burnley et al., 2007) and 22 % for USA (Daskalopoulos et al., 1998).
This is due to the completely different dietary culture.
A high proportion of organic waste is generated from non-edible
components during food preparation, including plantain peels, yam peels,
beans, fruit peels and fish bones. Most of the food and fruit consumed by
Ugandans have a high moisture content or non-edible parts. Whereas
developed countries consume more of the fast foods that are packed in paper
bags and plastic bags, their counterparts in the developing countries consume
more organic foods. There is also a distinguishing future of waste as regards to
regions, for instance waste from the tropics consists of a high amount of
vegetation debris (Komakech et al., 2014, Kinobe et al., 2015b). Kampala is
located in the tropics and experiences high temperatures that increase the rate
of waste decomposition. When these wastes are loaded onto the truck, the
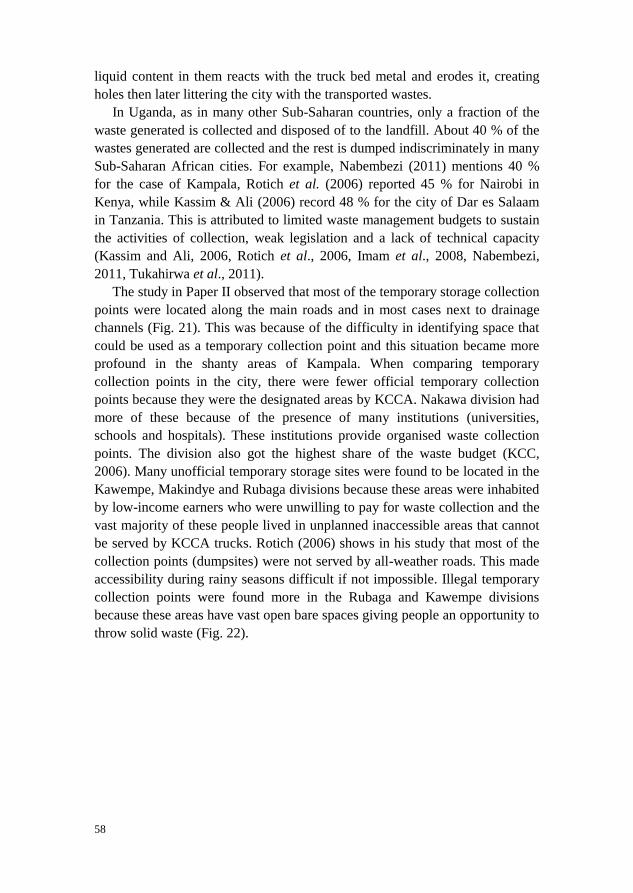
58
liquid content in them reacts with the truck bed metal and erodes it, creating
holes then later littering the city with the transported wastes.
In Uganda, as in many other Sub-Saharan countries, only a fraction of the
waste generated is collected and disposed of to the landfill. About 40 % of the
wastes generated are collected and the rest is dumped indiscriminately in many
Sub-Saharan African cities. For example, Nabembezi (2011) mentions 40 %
for the case of Kampala, Rotich et al. (2006) reported 45 % for Nairobi in
Kenya, while Kassim & Ali (2006) record 48 % for the city of Dar es Salaam
in Tanzania. This is attributed to limited waste management budgets to sustain
the activities of collection, weak legislation and a lack of technical capacity
(Kassim and Ali, 2006, Rotich et al., 2006, Imam et al., 2008, Nabembezi,
2011, Tukahirwa et al., 2011).
The study in Paper II observed that most of the temporary storage collection
points were located along the main roads and in most cases next to drainage
channels (Fig. 21). This was because of the difficulty in identifying space that
could be used as a temporary collection point and this situation became more
profound in the shanty areas of Kampala. When comparing temporary
collection points in the city, there were fewer official temporary collection
points because they were the designated areas by KCCA. Nakawa division had
more of these because of the presence of many institutions (universities,
schools and hospitals). These institutions provide organised waste collection
points. The division also got the highest share of the waste budget (KCC,
2006). Many unofficial temporary storage sites were found to be located in the
Kawempe, Makindye and Rubaga divisions because these areas were inhabited
by low-income earners who were unwilling to pay for waste collection and the
vast majority of these people lived in unplanned inaccessible areas that cannot
be served by KCCA trucks. Rotich (2006) shows in his study that most of the
collection points (dumpsites) were not served by all-weather roads. This made
accessibility during rainy seasons difficult if not impossible. Illegal temporary
collection points were found more in the Rubaga and Kawempe divisions
because these areas have vast open bare spaces giving people an opportunity to
throw solid waste (Fig. 22).
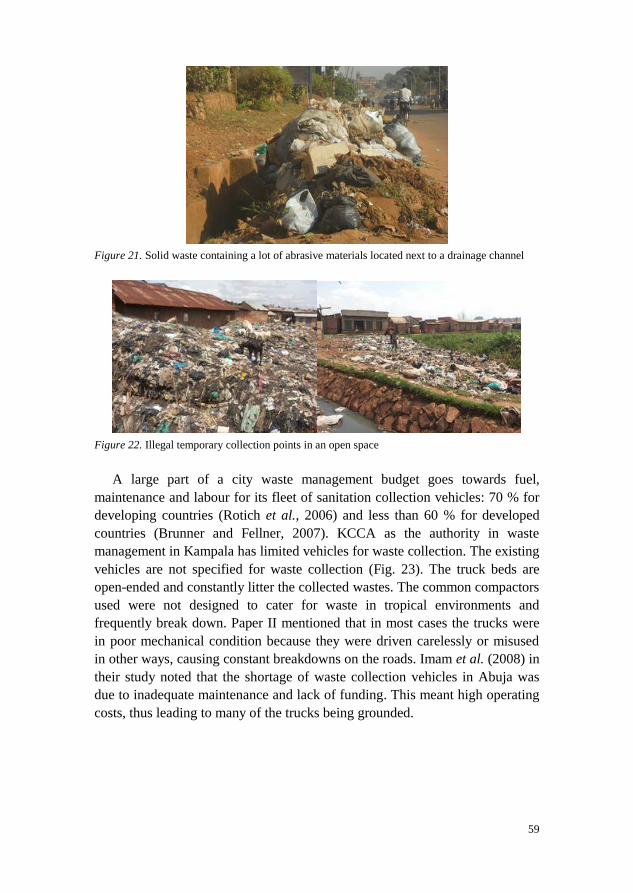
59
Figure 21. Solid waste containing a lot of abrasive materials located next to a drainage channel
Figure 22. Illegal temporary collection points in an open space
A large part of a city waste management budget goes towards fuel,
maintenance and labour for its fleet of sanitation collection vehicles: 70 % for
developing countries (Rotich et al., 2006) and less than 60 % for developed
countries (Brunner and Fellner, 2007). KCCA as the authority in waste
management in Kampala has limited vehicles for waste collection. The existing
vehicles are not specified for waste collection (Fig. 23). The truck beds are
open-ended and constantly litter the collected wastes. The common compactors
used were not designed to cater for waste in tropical environments and
frequently break down. Paper II mentioned that in most cases the trucks were
in poor mechanical condition because they were driven carelessly or misused
in other ways, causing constant breakdowns on the roads. Imam et al. (2008) in
their study noted that the shortage of waste collection vehicles in Abuja was
due to inadequate maintenance and lack of funding. This meant high operating
costs, thus leading to many of the trucks being grounded.
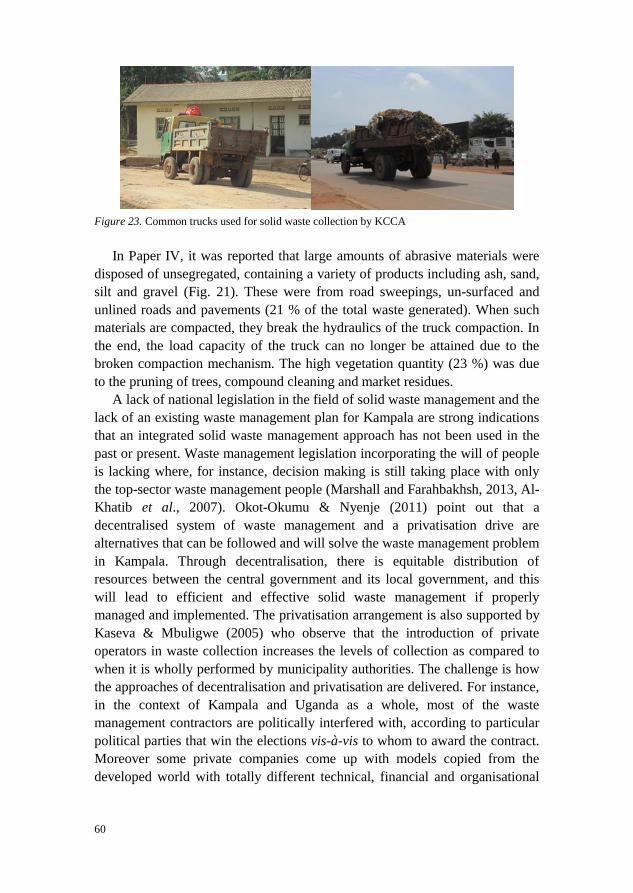
60
Figure 23. Common trucks used for solid waste collection by KCCA
In Paper IV, it was reported that large amounts of abrasive materials were
disposed of unsegregated, containing a variety of products including ash, sand,
silt and gravel (Fig. 21). These were from road sweepings, un-surfaced and
unlined roads and pavements (21 % of the total waste generated). When such
materials are compacted, they break the hydraulics of the truck compaction. In
the end, the load capacity of the truck can no longer be attained due to the
broken compaction mechanism. The high vegetation quantity (23 %) was due
to the pruning of trees, compound cleaning and market residues.
A lack of national legislation in the field of solid waste management and the
lack of an existing waste management plan for Kampala are strong indications
that an integrated solid waste management approach has not been used in the
past or present. Waste management legislation incorporating the will of people
is lacking where, for instance, decision making is still taking place with only
the top-sector waste management people (Marshall and Farahbakhsh, 2013, Al-
Khatib et al., 2007). Okot-Okumu & Nyenje (2011) point out that a
decentralised system of waste management and a privatisation drive are
alternatives that can be followed and will solve the waste management problem
in Kampala. Through decentralisation, there is equitable distribution of
resources between the central government and its local government, and this
will lead to efficient and effective solid waste management if properly
managed and implemented. The privatisation arrangement is also supported by
Kaseva & Mbuligwe (2005) who observe that the introduction of private
operators in waste collection increases the levels of collection as compared to
when it is wholly performed by municipality authorities. The challenge is how
the approaches of decentralisation and privatisation are delivered. For instance,
in the context of Kampala and Uganda as a whole, most of the waste
management contractors are politically interfered with, according to particular
political parties that win the elections vis-à-vis to whom to award the contract.
Moreover some private companies come up with models copied from the
developed world with totally different technical, financial and organisational
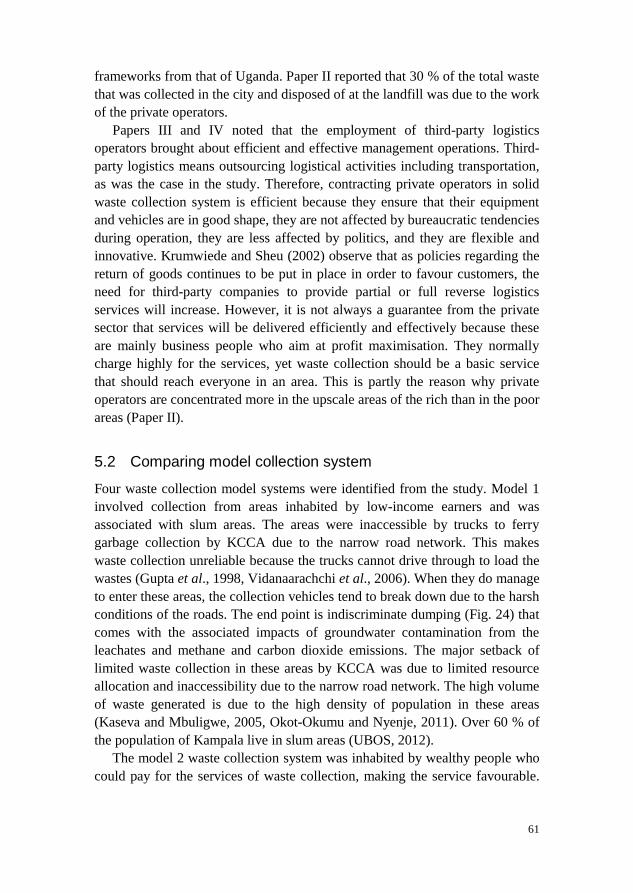
61
frameworks from that of Uganda. Paper II reported that 30 % of the total waste
that was collected in the city and disposed of at the landfill was due to the work
of the private operators.
Papers III and IV noted that the employment of third-party logistics
operators brought about efficient and effective management operations. Third-
party logistics means outsourcing logistical activities including transportation,
as was the case in the study. Therefore, contracting private operators in solid
waste collection system is efficient because they ensure that their equipment
and vehicles are in good shape, they are not affected by bureaucratic tendencies
during operation, they are less affected by politics, and they are flexible and
innovative. Krumwiede and Sheu (2002) observe that as policies regarding the
return of goods continues to be put in place in order to favour customers, the
need for third-party companies to provide partial or full reverse logistics
services will increase. However, it is not always a guarantee from the private
sector that services will be delivered efficiently and effectively because these
are mainly business people who aim at profit maximisation. They normally
charge highly for the services, yet waste collection should be a basic service
that should reach everyone in an area. This is partly the reason why private
operators are concentrated more in the upscale areas of the rich than in the poor
areas (Paper II).
5.2 Comparing model collection system
Four waste collection model systems were identified from the study. Model 1
involved collection from areas inhabited by low-income earners and was
associated with slum areas. The areas were inaccessible by trucks to ferry
garbage collection by KCCA due to the narrow road network. This makes
waste collection unreliable because the trucks cannot drive through to load the
wastes (Gupta et al., 1998, Vidanaarachchi et al., 2006). When they do manage
to enter these areas, the collection vehicles tend to break down due to the harsh
conditions of the roads. The end point is indiscriminate dumping (Fig. 24) that
comes with the associated impacts of groundwater contamination from the
leachates and methane and carbon dioxide emissions. The major setback of
limited waste collection in these areas by KCCA was due to limited resource
allocation and inaccessibility due to the narrow road network. The high volume
of waste generated is due to the high density of population in these areas
(Kaseva and Mbuligwe, 2005, Okot-Okumu and Nyenje, 2011). Over 60 % of
the population of Kampala live in slum areas (UBOS, 2012).
The model 2 waste collection system was inhabited by wealthy people who
could pay for the services of waste collection, making the service favourable.
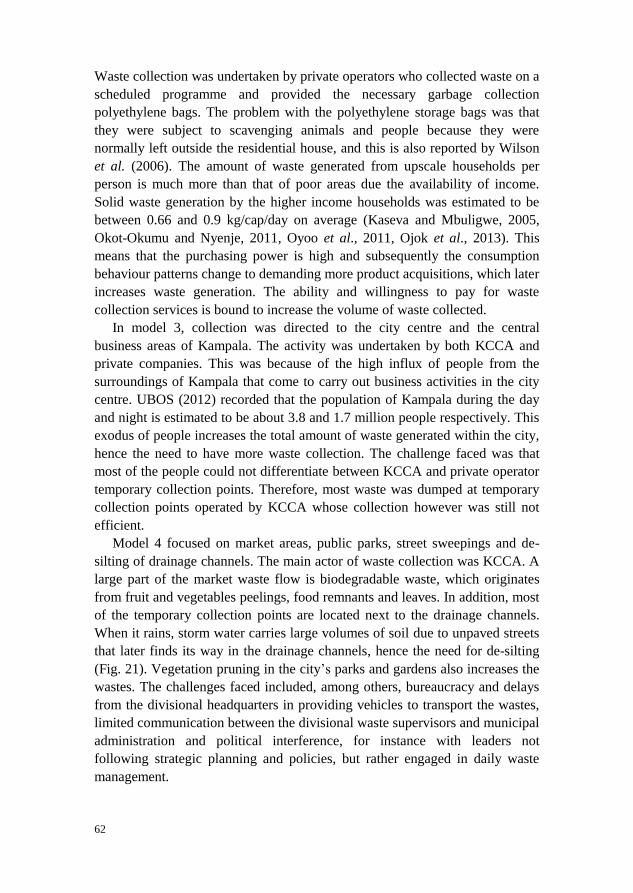
62
Waste collection was undertaken by private operators who collected waste on a
scheduled programme and provided the necessary garbage collection
polyethylene bags. The problem with the polyethylene storage bags was that
they were subject to scavenging animals and people because they were
normally left outside the residential house, and this is also reported by Wilson
et al. (2006). The amount of waste generated from upscale households per
person is much more than that of poor areas due the availability of income.
Solid waste generation by the higher income households was estimated to be
between 0.66 and 0.9 kg/cap/day on average (Kaseva and Mbuligwe, 2005,
Okot-Okumu and Nyenje, 2011, Oyoo et al., 2011, Ojok et al., 2013). This
means that the purchasing power is high and subsequently the consumption
behaviour patterns change to demanding more product acquisitions, which later
increases waste generation. The ability and willingness to pay for waste
collection services is bound to increase the volume of waste collected.
In model 3, collection was directed to the city centre and the central
business areas of Kampala. The activity was undertaken by both KCCA and
private companies. This was because of the high influx of people from the
surroundings of Kampala that come to carry out business activities in the city
centre. UBOS (2012) recorded that the population of Kampala during the day
and night is estimated to be about 3.8 and 1.7 million people respectively. This
exodus of people increases the total amount of waste generated within the city,
hence the need to have more waste collection. The challenge faced was that
most of the people could not differentiate between KCCA and private operator
temporary collection points. Therefore, most waste was dumped at temporary
collection points operated by KCCA whose collection however was still not
efficient.
Model 4 focused on market areas, public parks, street sweepings and de-
silting of drainage channels. The main actor of waste collection was KCCA. A
large part of the market waste flow is biodegradable waste, which originates
from fruit and vegetables peelings, food remnants and leaves. In addition, most
of the temporary collection points are located next to the drainage channels.
When it rains, storm water carries large volumes of soil due to unpaved streets
that later finds its way in the drainage channels, hence the need for de-silting
(Fig. 21). Vegetation pruning in the city’s parks and gardens also increases the
wastes. The challenges faced included, among others, bureaucracy and delays
from the divisional headquarters in providing vehicles to transport the wastes,
limited communication between the divisional waste supervisors and municipal
administration and political interference, for instance with leaders not
following strategic planning and policies, but rather engaged in daily waste
management.
63
In a final analysis, Kaseva & Mbuligwe (2005) and Okot-Okumu & Nyenje
(2011) assert that residential areas are the main generators of waste, followed
by the markets and commercial districts in urban areas. This was not the case
in this study. Paper II noted that the greatest generators of waste were
residential areas, both the upscale areas and slums, followed by the business
areas (commercial) and then the market areas. The argument with this is that in
Kampala there are a limited number of markets (13) and this could be the
reason why there is less waste. It should be noted that the study did not
ascertain the generation rates of these markets in comparison to other markets
in these Sub-Saharan cities. Added to this, another reason could be that in the
study of Paper II, the waste analysed included the contribution of private
operators’ waste collection. This contribution would have increased the total
waste collected and transported to the landfill. This could also have been
missing from the studies by the quoted authors.
Figure 24. Illegal dumping of waste in the city centre (a) slum area (b)
5.3 Optimised route impacts
To date no significant research into optimising solid waste has been carried out
in Kampala and Uganda as a whole. In Kampala, there are no scheduled
routings of trucks for waste collection, no details on the location of temporary
sites or operational hours, poor driving habits, travel impendences and limited
road network information. Paper III mentioned that there was no scheduled
plan for waste collection by trucks. The drivers were called upon to haul waste
when need arose. There was also no scheduled waste collection in a particular
area of operation. The drivers were alerted by solid waste scouts (KCCA
employees) who moved within the divisions identifying areas that had
accumulated waste. This system caused a lot of delay and incurred operational
costs. Truck drivers ended up wasting time and fuel. Teixeira et al. (2004)
illustrate that static routes are preferred by waste collectors because they ease
operations based on the objective of minimising travel distances and time
b a
64
durations. Paper III recorded a 19 % and 17 % benefit on travel distance and
time respectively when the recorded routes were optimised.
The common trucks used to haul waste have a capacity of 6 tonnes, limiting
waste collection and thereby making many trips to the landfill. Paper III
studied and compared different waste truck capacities of six, 10, 18 and 20
tonnes. It was concluded that an increase in truck capacity tonnage reduced
trips to the landfill while increasing on the percentage of waste collected, and
consequently the distances travelled and time to the Kiteezi landfill. Bosona et
al. (2011) apply route optimisation to improve food deliveries in local food
supply chains.
The economies of 20-tonne large-scale trucks compared to the 18-tonne
truck improved the trip and travel distances. However, there was no time
advantage from using the 20-tonne truck. A 12 % hour time is lost and the
argument for this is that the larger the vehicle capacity, the more waste it will
load and carry, meaning that more temporary collection points will be visited,
hence more service time will be accrued and thus increase the time. This is
confirmed by Li et al. (2008) as they show truck scheduling of solid waste
collection while modelling the problem without considering the balanced
loading of waste.
However, it should be noted that it is not the size of the truck that will lead
to proper efficiency of waste collection. Using 20-tonne trucks will mean that a
few of them are needed (Table 11). One argument put forward is that with the
nature of waste generated in Kampala that include soil, silt and a high organic
matter content that erodes the trucks, if one of them breaks down, then a great
quantity of waste will not be collected. Another negative impact of these heavy
trucks will be the difficulty faced in moving in the unplanned streets of
Kampala and also compacting on the roads due to the high tonnage. Moreover,
this can be aggravated further with the unplanned road network and the
location of temporary collection points that are situated on the roadside.
Kinobe et al. (2015a) point out that trucks have to be packed half way in the
road while loading waste, causing traffic jams. These loopholes of unplanned
road networks and lack of details about the location of waste bins are common
in many Sub-Saharan African countries and have been suggested by previous
studies (Rotich et al., 2006, Parrot et al., 2009).
On that note, for these high-capacity trucks to be taken on in Kampala,
there should be a well-planned infrastructure in terms of a good road network,
parking spaces at the collection points and proper operation and maintenance
procedures. Added to that is the need for a well-designed truck system that will
be able to handle the nature of waste generated in the city. One such solution
could be the purchase of trucks designed to handle one or two waste streams
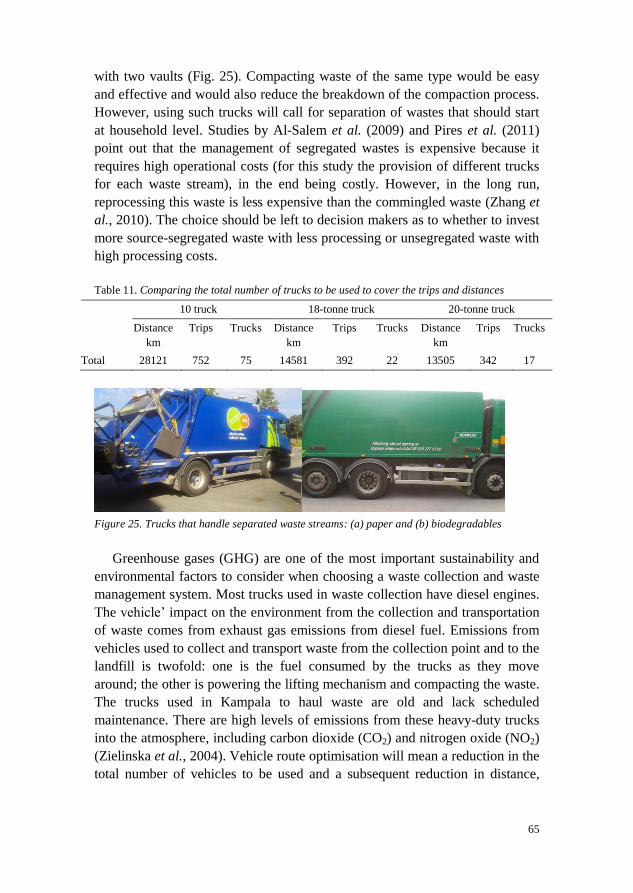
65
with two vaults (Fig. 25). Compacting waste of the same type would be easy
and effective and would also reduce the breakdown of the compaction process.
However, using such trucks will call for separation of wastes that should start
at household level. Studies by Al-Salem et al. (2009) and Pires et al. (2011)
point out that the management of segregated wastes is expensive because it
requires high operational costs (for this study the provision of different trucks
for each waste stream), in the end being costly. However, in the long run,
reprocessing this waste is less expensive than the commingled waste (Zhang et
al., 2010). The choice should be left to decision makers as to whether to invest
more source-segregated waste with less processing or unsegregated waste with
high processing costs.
Table 11. Comparing the total number of trucks to be used to cover the trips and distances
10 truck 18-tonne truck 20-tonne truck
Distance
km
Trips Trucks Distance
km
Trips Trucks Distance
km
Trips Trucks
Total 28121 752 75 14581 392 22 13505 342 17
Figure 25. Trucks that handle separated waste streams: (a) paper and (b) biodegradables
Greenhouse gases (GHG) are one of the most important sustainability and
environmental factors to consider when choosing a waste collection and waste
management system. Most trucks used in waste collection have diesel engines.
The vehicle’ impact on the environment from the collection and transportation
of waste comes from exhaust gas emissions from diesel fuel. Emissions from
vehicles used to collect and transport waste from the collection point and to the
landfill is twofold: one is the fuel consumed by the trucks as they move
around; the other is powering the lifting mechanism and compacting the waste.
The trucks used in Kampala to haul waste are old and lack scheduled
maintenance. There are high levels of emissions from these heavy-duty trucks
into the atmosphere, including carbon dioxide (CO2) and nitrogen oxide (NO2)
(Zielinska et al., 2004). Vehicle route optimisation will mean a reduction in the
total number of vehicles to be used and a subsequent reduction in distance,
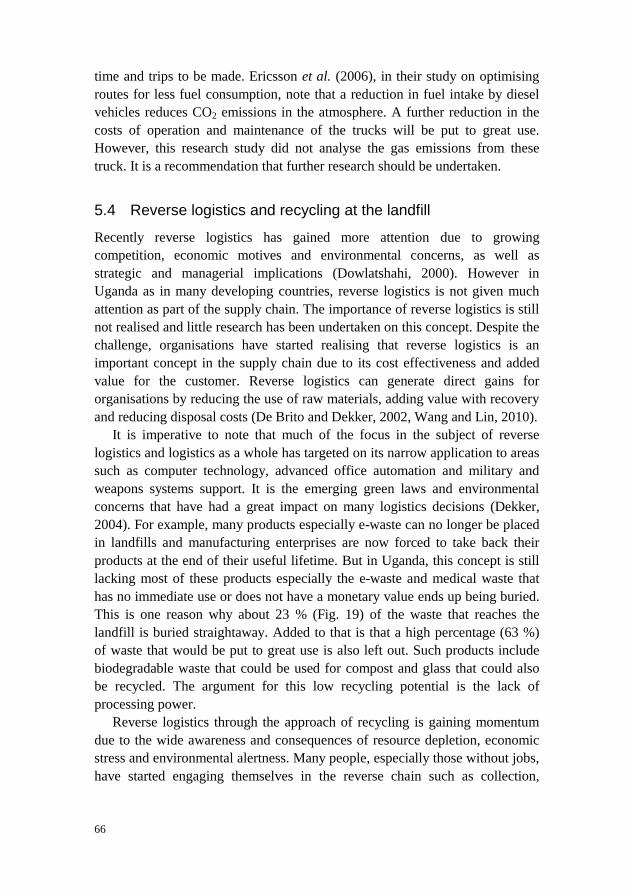
66
time and trips to be made. Ericsson et al. (2006), in their study on optimising
routes for less fuel consumption, note that a reduction in fuel intake by diesel
vehicles reduces CO2 emissions in the atmosphere. A further reduction in the
costs of operation and maintenance of the trucks will be put to great use.
However, this research study did not analyse the gas emissions from these
truck. It is a recommendation that further research should be undertaken.
5.4 Reverse logistics and recycling at the landfill
Recently reverse logistics has gained more attention due to growing
competition, economic motives and environmental concerns, as well as
strategic and managerial implications (Dowlatshahi, 2000). However in
Uganda as in many developing countries, reverse logistics is not given much
attention as part of the supply chain. The importance of reverse logistics is still
not realised and little research has been undertaken on this concept. Despite the
challenge, organisations have started realising that reverse logistics is an
important concept in the supply chain due to its cost effectiveness and added
value for the customer. Reverse logistics can generate direct gains for
organisations by reducing the use of raw materials, adding value with recovery
and reducing disposal costs (De Brito and Dekker, 2002, Wang and Lin, 2010).
It is imperative to note that much of the focus in the subject of reverse
logistics and logistics as a whole has targeted on its narrow application to areas
such as computer technology, advanced office automation and military and
weapons systems support. It is the emerging green laws and environmental
concerns that have had a great impact on many logistics decisions (Dekker,
2004). For example, many products especially e-waste can no longer be placed
in landfills and manufacturing enterprises are now forced to take back their
products at the end of their useful lifetime. But in Uganda, this concept is still
lacking most of these products especially the e-waste and medical waste that
has no immediate use or does not have a monetary value ends up being buried.
This is one reason why about 23 % (Fig. 19) of the waste that reaches the
landfill is buried straightaway. Added to that is that a high percentage (63 %)
of waste that would be put to great use is also left out. Such products include
biodegradable waste that could be used for compost and glass that could also
be recycled. The argument for this low recycling potential is the lack of
processing power.
Reverse logistics through the approach of recycling is gaining momentum
due to the wide awareness and consequences of resource depletion, economic
stress and environmental alertness. Many people, especially those without jobs,
have started engaging themselves in the reverse chain such as collection,
67
distribution and processing to get a source of income (Subramanian, 2000)
(Fig. 26). The main actors found doing this activity were informal people
including waste pickers, waste loaders and street children (Medina, 2000). This
activity has become common, especially in informal settlements where waste
collection is lacking due to inaccessibility by waste trucks and narrow streets.
Waste loaders also separated recyclables before the trucks reached the landfill.
This activity was common with all the waste collection crew members on the
trucks. These waste loaders later sold the products on their way to landfill or
after disposal of other waste, then they share the proceeds. Wilson et al. (2006)
note that this kind of activity involves a lot of time wasting as the refuse
loaders have to spend time looking for products and selling them. The products
that reach the landfill are usually broken, very dirty, mixed with other waste
and of low quality because the valuable products have been removed by the
waste collectors and the waste loaders on the trucks.
Figure 26. Activities at the landfill. Note that the waste pickers wear no protective gear
Whereas in developed countries the end users of the products pay for the
services of recycling (Hayami et al., 2006), in Kampala it was discovered that
the waste collectors pay for recyclable products from households. This is due
to the monetary value attached to the products (Medina, 2000).
Potential recoverable products are plastics, paper and metal that have great
recycling and monetary value (Subramanian, 2000). The most recoverable
were plastics (hard and soft) at Kiteezi that attracted monetary terms from both
suppliers and buyers. Plastics constituted the largest amount of waste entering
the reverse chain.
Subramanian (2000) state that the trend of manufacturing and packaging of
goods, especially food from markets and shops, has changed and plastics are
used as packaging materials. This could be the reason for the high increase in
plastic waste in the waste stream. Chung and Poon (2001) report that such
trends in the composition of Guangzhou waste is attributed to economic
growth, increasing people’s purchasing power. These products have increased
68
in the waste stream and this is the case with Kampala. Al-Salem et al. (2009)
provide an indication that plastics are used in a number of forms in our daily
lives. It is realistic to find considerable amounts in the final waste stream. At
the Kiteezi landfill, there was good profitable business in these products and
most of the recyclers were engaged in plastic recovery. For instance, a
kilogram of clean soft plastics went for 150 shillings and 200 shillings, while
that of hard plastics was between 250 and 300 shillings. It should be noted that
these prices were not fixed and depended on how the products were delivered
in shape, appearance and cleanliness.
Glass was left out of the potential recovery products. This was because in
Uganda no company is engaged in the recycling of glass products, so they end
up being buried at the landfill. Some individuals visited the landfill to collect
glass to be put on the perimeter walls of buildings for security reasons.
Furthermore, organics and vegetation were other products that were left out
due to the zero level commanded in monetary terms. At the landfill these
products are just compacted and buried. On rare occasions some people are
seen collecting pieces of wood or taking some compost manure. However the
quantities taken are too small to be quantified.
Metal was the most expensive waste category to deal with at the landfill.
The cost of metals worldwide is rising. Many mining companies are faced with
rising costs of mining plus paying for the environmental costs of their
operations (Tilton, 1999). This in turn has made metal recycling important. At
the landfill, a kilogram of metal costs 500 Ugandan shillings. However, this
depended on the type and quality and the fluctuation in market prices of metal
contents (Kofoworola, (2007). The low quantity of metal at the landfill was
because the products had been sorted and taken from the waste stream before
reaching the landfill. The retrieval starts at household level, and then is
undertaken by street children and waste loaders. The metal market is readily
available countrywide, both on a large-scale and small-scale basis.
Transportation of reversed products to the landfill and also after the landfill
was done in a rudimentary way. The transportation methods used included
humans, bicycles, motorcycles and old trucks (Fig. 27). This is because the
cost of transportation of reversed products is high. To the transporters, these
products are considered to be waste and believed to damage vehicles, hence the
high costs associated with them. However, Tibben-Lembke and Rogers (2002)
state that transportation costs on many occasions greatly influence economic
viability in the reverse distribution channel. In addition, this explained why
some recycling processing firms and factories provided trucks to small-scale
dealers and small-scale plants in order to boost the operations of product
transportation. Small-scale plants and dealers that were provided with the
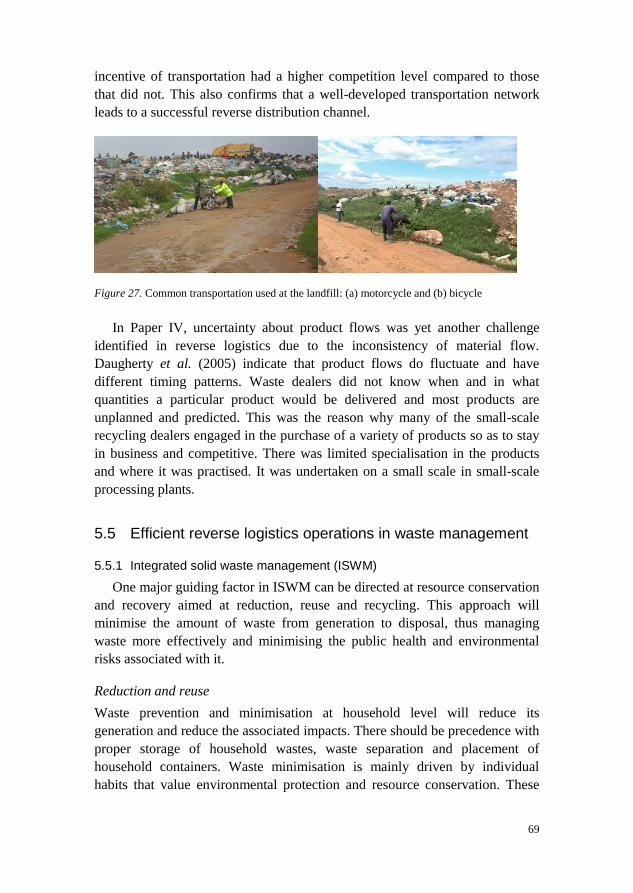
69
incentive of transportation had a higher competition level compared to those
that did not. This also confirms that a well-developed transportation network
leads to a successful reverse distribution channel.
Figure 27. Common transportation used at the landfill: (a) motorcycle and (b) bicycle
In Paper IV, uncertainty about product flows was yet another challenge
identified in reverse logistics due to the inconsistency of material flow.
Daugherty et al. (2005) indicate that product flows do fluctuate and have
different timing patterns. Waste dealers did not know when and in what
quantities a particular product would be delivered and most products are
unplanned and predicted. This was the reason why many of the small-scale
recycling dealers engaged in the purchase of a variety of products so as to stay
in business and competitive. There was limited specialisation in the products
and where it was practised. It was undertaken on a small scale in small-scale
processing plants.
5.5 Efficient reverse logistics operations in waste management
5.5.1 Integrated solid waste management (ISWM)
One major guiding factor in ISWM can be directed at resource conservation
and recovery aimed at reduction, reuse and recycling. This approach will
minimise the amount of waste from generation to disposal, thus managing
waste more effectively and minimising the public health and environmental
risks associated with it.
Reduction and reuse
Waste prevention and minimisation at household level will reduce its
generation and reduce the associated impacts. There should be precedence with
proper storage of household wastes, waste separation and placement of
household containers. Waste minimisation is mainly driven by individual
habits that value environmental protection and resource conservation. These
70
social values take time to develop and change, however they are essential to
environmentally sustainable and cost-effective services. The process of reusing
starts with the assumption that the used materials that flow through our lives
can be a resource rather than refuse. Waste is in the eye of the beholder. One
person’s trash is another person’s treasure.
Recycling
Through their informal recycling activities, waste pickers broaden their sources
of income. They contribute to national industrial competitiveness and benefit
the environment (Paul et al., 2012). Maximum benefits will be gained when the
authority recognises the importance of the informal sector responsibilities in
solid waste management and strengthen their activities in reverse logistics.
Government intervention including the reverse logistics chain in waste
management should be developed and passed. Another way is to come up with
programmes that can join up the reverse chain distribution network of waste
pickers, street children and scavengers. These people work in extremely poor
conditions, so with the support of the programmes formed they can be
registered, then work jointly, hence leading to efficiency. Baud et al. (2001)
assert that in Chennai in India solid waste management alliances, including
formal collection, informal collection, trade and recyclers, teamed up for
sustainable development. Nas & Jaffe (2004) state that in Colombia, the
establishment of scavenger cooperation meant that the benefits that used to go
to the middle-men traders ceased, they were legally recognised, and also
received higher proceeds. Much of the waste stream can be recycled, making
recycling an important component of integrated solid waste management. Each
recyclable product (hard plastics, paper, metals and polyethylene) has a
market-based monetary value.
Technologies
In a situation where recycling of some products cannot be effective,
technologies should be introduced that will reduce the quantity of both
biodegradable and non-degradable waste at the landfill. The available
technologies for treating biodegradable waste components are composting,
anaerobic digestion, landfilling with methane capture for power generation,
and incineration. However, some of these technologies cannot be applied in
Uganda. Incineration is not generally considered economically viable for
developing countries, because their wastes are too wet and too low in
combustibles to burn without supplementary fuel. Where incineration is
implemented in a developing country, air pollution control measures that
address standards comparable to those required in high-income countries
71
should be implemented. Incineration produces toxic emissions. Composting
may be the best alternative because a large percentage of waste generated
comprises biodegradable matter. The compost will later be used as manure and
soil enrichers (Matter et al., 2012).
Another efficient mechanism that is still lacking in reverse logistics in
Uganda is the development of product identification and labelling for the return
of products in the reverse chain. Packaging of products was always mixed and
on many occasions it became difficult to identify a particular product. One
solution to that would be the use of radio frequency identification (RFID) for a
particular product. The tagging would make the tracking and retrieval of
products easier and faster. The labelling system could be introduced to all the
actors that deal in recyclables, such as small shop traders and small-scale
plants, with identities such as PET, LDPE, HDPE, paper etc. after sorting and
grading. This will be a form of value addition.
5.5.2 Policy, legal framework and institutional arrangement
In most countries, solid waste management is a municipal responsibility. In the
case of Kampala it is the KCCA that sets the basic standards, including the
occupational and environmental health and safety standards to be followed.
There are no clear laws around waste management in Uganda and where they
exist, they are weak (Okot-Okumu and Nyenje, 2011). Arrangements are
complicated and often overlap or have areas where no agency is responsible.
Furthermore there is a lack of regulation on certain waste streams such as e-
waste and construction waste. One such solution to the regulatory framework is
to separate management and planning functions from operational functions, as
well as to separate policy development and regulations from implementation
activities. Policy implementers need to adopt specific acts and regulations with
strong enforcement mechanisms to govern their end use. These policies should
also address waste streams that are left out, such as e-waste and construction
and demolition waste.
5.5.3 Operational management
This focuses on the human resources and technical factors in waste
management. On many occasions, these are scarce and lacking. Officials
without technical knowledge of waste management issues are employed to
carry out complex work which they fail to accomplish. Another consequence
of poor administrative planning is that the majority of these services are
directed by personnel with a low educational level and technical training on
solid waste management. This in turn results in a lack of coordination between
the departments such as public health and environmental conservation.
72
Operational management would try and deal practically with planning for
actual operations, considering the demand for services when they arise. The
system should be flexible to handle any disaster with a focus on efficient
collection, transportation recycling and proper disposal.
5.5.4 Financial and economic management
In many developing countries, including Uganda, the waste management sector
is given a low priority in government budget allocations, making the financial
base of its activities weak. This has forced the municipalities to award
contracts to private operators to carry out the activities (Okot-Okumu and
Nyenje, 2011). However on many occasions, poor communities who cannot
afford the services tend to suffer, posing a challenge to those involved in trying
to establish sustainable waste management. Another shortfall of this is that the
officials responsible for effective management of solid waste in this sector lack
accurate information concerning the real costs of operation. There is also a lack
of industrial development important for the procurement and maintenance of
machinery and equipment in the waste management sector. There should be a
cost effective accountability and financial analysis of municipal infrastructure
management.
5.5.5 Public-private participation and awareness
Another way to encourage waste reduction is simply by increasing awareness,
which often leads to process modifications, alternative disposal practices and
product changes. Private enterprises can usually provide solid waste collection
and transfer and disposal services more efficiently and at a lower cost than the
public sector. Private sector involvement will imply a shift in the key role of
government from service delivery to regulation. For this to work, appropriate
systems of monitoring and control of these private operators needs to be
established. Public-private participation operations assume co-responsibilities
for service delivery (Ahmed and Ali, 2006). They come up with the advantages
of flexibility, finance, technical knowledge, entrepreneurial and managerial
skills combined with social responsibility and environmental awareness. In
favourable conditions it is advisable to have both the public and private sectors
playing active roles, thus capitalising on each other’s strength. Involving the
private and public into the waste management system can be in the form of
setting up modern recycling projects, especially for e-waste that contains
hazardous materials. The aim of the project should mainly target the health of
the recyclers and also protect the environment, open up trade and create
valuable jobs in the recovery sector. In so doing the projects would contribute

73
to reducing poverty and at the same time overcome global resource scarcity
(Wilson et al., 2006).

74
75
6 Conclusions and future research
6.1 Conclusions
The increased demographic growth rate and rising urbanisation are challenges
that have hindered sustainable development in terms of the provision of basic
infrastructure and urban services. This has led to a series of problems such as
the high generation and inadequate collection, transportation and disposal of
waste. This has become a major threat to the environment and a risk to the
health of people that will eventually spread to other areas. Little research has
been undertaken concerning proper waste management in Kampala and the
little that has been done only focuses on a small area and concept, such as
generation and composition, leaving out other concepts that are relatively
important. Identifying all the concepts and the organisation of the system is
needed and can be a starting point for proper waste management.
Solid waste management in Kampala is characterised by inefficient
collection methods, insufficient coverage of the collection system and
improper disposal of municipal solid wastes. Approximately 1,538 tonnes of
waste were generated in Kampala per day, of which about 40 % (615
tonnes/day) was collected and transported to the dumping site at Kiteezi. This
waste constituted 92.7 % organics and the remaining 7.3 % was paper, plastics,
metal, glass and other wastes. Waste collection in Kampala is done by KCCA
and private companies that are contracted by KCCA. About 70 % of the waste
collected and transported to the Kiteezi landfill is done by KCCA and about
30 % by private operators.
Optimisation is one aspect in waste management that has been left out. Its
main objective is to minimise travel distances and reduce the fleet size used.
Optimised routes can be achieved using new technologies such as GIS, a tool
that is able to display and manipulate both geographic and spatial information.
Optimisation of waste collection with an increase in truck capacity reduced the
76
distance and travel time to dispose of the waste. An increase in truck capacity
from six tonnes to 10 tonnes reduced travel distances by 39 %, trips by 41 %
and time by 20 %, while from increasing from a 10-tonne truck to an 18-tonne
truck reduced distance by 34 %, trips by 44 % and time by 9 % considering 40
% waste collection.
Reverse logistic activities at the only landfill that serves Kampala suffers
from unfavourable economics and legislative, technical and operational
constraints. The recycling rate in Kampala is still substantially lower compared
to developed countries and the existing non-recycling methods negatively
impact on the environment and people’s health. Of the products delivered to
the landfill, food waste constituted the greatest amount at 39 % followed by
vegetation at 23 % and rock and soil at 21 %. The potential reversed products
from the landfill include hard plastics and soft polyethylene at 68 %, 15 %
textiles, 12 % paper and 5 % metal. These results clearly show how there is
still a lack of recycling and this needs to be addressed. Incorporating reverse
logistics into the waste management sector will reduce the waste that is
disposed to the landfill, emissions from landfill, litter and expenditure on
energy, and will also provide income to the groups involved in the practice.
The system will further increase the service level of manufacturing firms and
reduce the costs of production, and hence increase profitability.
One of fundamental issues in reverse logistics is to establish an effective
and efficient infrastructure by creating an optimal network design that is
lacking in Uganda. Information flow and physical management of product
recovery is not documented anywhere. There is no literature on reverse
logistics in Kampala and significant further research is needed. Therefore there
is a need to develop an integrated approach in which the public, private and
community sectors work together to develop local solutions promoting
sustainable waste management. A comprehensive policy framework by the
government authority should be put in place to link public health,
environmental management, private participation and economic instrument
policies to promote coordination in the waste management sector. This
framework should include incentives to municipal authorities to deliver better
services, recover more costs from users and keep the environment safe. The
experiences of some developed countries indicate that reverse logistics related
to waste management, if fully incorporated, is a promising solution for
developing countries. The potential for reverse logistic activities such as
coordination, route optimisation and innovative materials handling will solve
the urban waste problem if applied.
In a nutshell, the management of waste in developing countries is a very
neglected area in environmental management, leading to increased
77
environmental degradation that is becoming a challenging problem in society.
Conservation of natural resources and the reduction of gas emissions are major
issues all over the world. With the efficient application of reverse logistics
activities, all this will be alleviated.
6.2 Future research
The following research areas could be recommended:
Education and awareness about the subject of logistics and reverse logistics
and how it is related to waste management with emphasis should be made
on the magnitude of reverse logistics application in developing countries;
Optimisation of facility location to determine the optimum location of
landfills, which will maximise the benefits of waste management, this will
require studies of the geotechnical site characteristics, environmental
impact analysis;
Quantification of emissions from waste collection by trucks in Kampala,
and such investigation will help to provide knowledge on how much
emissions is produced by these trucks and how they can be reduced;
Quantification of recyclables that are picked from the waste stream before
reaching the landfill, in the long run, this will help to ascertain how many
recoverable products are generated right from the source of waste
production;
Incorporation of the aspect of solid waste management in planning,
implementing and monitoring with various other departments such as public
health, environmental management, financial administration; and
Encouragement of public/private sector participation in waste management,
where private sector participation will work hand in hand with the
authorities, leading to better service delivery.

78
79
References
Agunwamba, J. C. 1998. "Solid Waste Management in Nigeria: Problems and
Issues." Environmental Management no. 22 (6):849-856. doi:
10.1007/s002679900152.
Ahmed, Shafiul Azam, and Syed Mansoor Ali. 2006. "People as partners:
Facilitating people's participation in public–private partnerships for solid
waste management." Habitat International no. 30 (4):781-796. doi:
http://dx.doi.org/10.1016/j.habitatint.2005.09.004.
Al-Khatib, Issam A., Hassan A. Arafat, Thabet Basheer, Hadeel Shawahneh,
Ammar Salahat, Jaafar Eid, and Wasif Ali. 2007. "Trends and problems of
solid waste management in developing countries: A case study in seven
Palestinian districts." Waste Management no. 27 (12):1910-1919. doi:
http://dx.doi.org/10.1016/j.wasman.2006.11.006.
Al-Khatib, Issam A., Maria Monou, Abdul Salam F. Abu Zahra, Hafez Q.
Shaheen, and Despo Kassinos. 2010. "Solid waste characterization,
quantification and management practices in developing countries. A case
study: Nablus district – Palestine." Journal of Environmental
Management no. 91 (5):1131-1138. doi:
http://dx.doi.org/10.1016/j.jenvman.2010.01.003.
Al-Salem, S. M., P. Lettieri, and J. Baeyens. 2009. "Recycling and recovery routes
of plastic solid waste (PSW): A review." Waste Management no. 29
(10):2625-2643. doi: http://dx.doi.org/10.1016/j.wasman.2009.06.004.
Apaydin, Omer, and M Talha Gonullu. 2008. "Emission control with route
optimization in solid waste collection process: A case study." Sadhana no.
33 (2):71-82.
Ayininuola, Gbenga Matthew, and Musa Adekunle Muibi. 2008. "An engineering
approach to solid waste collection system: Ibadan North as case study."
Waste Management no. 28 (9):1681-1687.
Badran, MF, and SM El-Haggar. 2006. "Optimization of municipal solid waste
management in Port Said–Egypt." Waste Management no. 26 (5):534-545.
Bairoch, Paul, and Gary Goertz. 1986. "Factors of Urbanisation in the Nineteenth
Century Developed Countries A Descriptive and Econometric Analysis."
Urban Studies no. 23 (4):285-305.
80
Baud, ISA, Stelios Grafakos, Michaela Hordijk, and Johan Post. 2001. "Quality of
life and alliances in solid waste management: contributions to urban
sustainable development." Cities no. 18 (1):3-12.
Bleck, Daniela, and Wieland Wettberg. 2012. "Waste collection in developing
countries – Tackling occupational safety and health hazards at their
source." Waste Management no. 32 (11):2009-2017. doi:
http://dx.doi.org/10.1016/j.wasman.2012.03.025.
Blumberg, D.F. 2005. Introduction to management of reverse logistics and closed
loop supply chain processes. Boca Raton, Fla: CRC Press.
Bosona, Techane G, and G Gebresenbet. 2011. "Cluster building and logistics
network integration of local food supply chain." Biosystems engineering
no. 108 (4):293-302.
Bosona, Techane, Ingrid Nordmark, Girma Gebresenbet, and David Ljungberg.
2013. "GIS-Based Analysis of Integrated Food Distribution Network in
Local Food Supply Chain." International Journal of Business and
Management no. 8 (17):p13.
Brunner, P. H., and J. Fellner. 2007. "Setting priorities for waste management
strategies in developing countries." Waste Management and Research no.
25 (3):234-240. doi: 10.1177/0734242x07078296.
Burnley, S. J., J. C. Ellis, R. Flowerdew, A. J. Poll, and H. Prosser. 2007.
"Assessing the composition of municipal solid waste in Wales."
Resources, Conservation and Recycling no. 49 (3):264-283. doi:
http://dx.doi.org/10.1016/j.resconrec.2006.03.015.
Burnley, Stephen J. 2007. "A review of municipal solid waste composition in the
United Kingdom." Waste Management no. 27 (10):1274-1285. doi:
http://dx.doi.org/10.1016/j.wasman.2006.06.018.
Chung, Shan-Shan, and Chi-Sun Poon. 2001. "Characterisation of municipal solid
waste and its recyclable contents of Guangzhou." Waste Management &
Research no. 19 (6):473-485.
Cointreau, SJ. 1982. " Environmental Management of Urban Solid Wastes in
Developing Countries: A Project Guide, Urban Development Technical
Paper No. 5. The International Bank of Reconstruction and
Development/The World Bank, Washington, DC."
Daskalopoulos, E., O. Badr, and S. D. Probert. 1998. "Municipal solid waste: a
prediction methodology for the generation rate and composition in the
European Union countries and the United States of America." Resources,
Conservation and Recycling no. 24 (2):155-166. doi:
http://dx.doi.org/10.1016/S0921-3449(98)00032-9.
Daugherty, P.J., R.G. Richey, S.E. Genchev, and H. Chen. 2005. "Reverse
logistics: superior performance through focused resource commitments to
information technology." Transportation Research Part E: Logistics and
Transportation Review no. 41 (2):77-92.
Daugherty, Patricia J., Chad W. Autry, and Alexander E. Ellinger. 2001. "Reverse
Logistics: The relationship between resource commitment and program
performance." Journal of Business Logistics no. 22 (1):107-123. doi:
10.1002/j.2158-1592.2001.tb00162.x.
81
De Brito, M.P., and R. Dekker. 2002. "Reverse logistics: a framework."
Econometric Institute Report EI no. 38:98.
Dekker, R. 2004. Reverse logistics: quantitative models for closed-loop supply
chains: Springer Verlag.
Diaz, L. F., G. M. Savage, and L. L. Eggerth. 2005. "Alternatives for the treatment
and disposal of healthcare wastes in developing countries." Waste
Management no. 25 (6):626-637. doi:
http://dx.doi.org/10.1016/j.wasman.2005.01.005.
Dowlatshahi, Shad. 2000. "Developing a Theory of Reverse Logistics." interfaces
Sustainable Business no. 30 (3 ): 143-155.
Ericsson, Eva, Hanna Larsson, and Karin Brundell-Freij. 2006. "Optimizing route
choice for lowest fuel consumption – Potential effects of a new driver
support tool." Transportation Research Part C: Emerging Technologies
no. 14 (6):369-383. doi: http://dx.doi.org/10.1016/j.trc.2006.10.001.
Flapper, S.D.P., J.A.E.E. Van Nunen, and L.N. Wassenhove. 2005. Managing
closed-loop supply chains: Springer Verlag.
Fleischmann, M., P. Beullens, J.M. Bloemhof-Ruwaard, and L.N. Van
Wassenhove. 2001. "The impact of product recovery on logistics network
design." Production and Operations Management no. 10 (2):156-173.
Fleischmann, M., H.R. Krikke, R. Dekker, and S.D.P. Flapper. 2000. "A
characterisation of logistics networks for product recovery." Omega no.
28 (6):653-666.
Ghose, M. K., A. K. Dikshit, and S. K. Sharma. 2006. "A GIS based transportation
model for solid waste disposal – A case study on Asansol municipality."
Waste Management no. 26 (11):1287-1293.
Gupta, Shuchi, Krishna Mohan, Rajkumar Prasad, Sujata Gupta, and Arun Kansal.
1998. "Solid waste management in India: options and opportunities."
Resources, Conservation and Recycling no. 24 (2):137-154. doi:
http://dx.doi.org/10.1016/S0921-3449(98)00033-0.
Hayami, Yujiro, A. K. Dikshit, and S. N. Mishra. 2006. "Waste pickers and
collectors in Delhi: Poverty and environment in an urban informal sector."
The Journal of Development Studies no. 42 (1):41-69. doi:
10.1080/00220380500356662.
Hoornweg, Daniel; , and Perinaz Bhada-Tata. 2015. What a Waste: A Global
Review of Solid Waste Management. World Bank 2012 [cited 3rd
February 2015]. Available from
https://www.openknowledge.worldbank.org/handle/10986/17388.
Hu, T.L., J.B. Sheu, and K.H. Huang. 2002. "A reverse logistics cost minimization
model for the treatment of hazardous wastes." Transportation Research
Part E: Logistics and Transportation Review no. 38 (6):457-473.
Imam, A, B Mohammed, David C Wilson, and Christopher R Cheeseman. 2008.
"Solid waste management in Abuja, Nigeria." Waste Management no. 28
(2):468-472.
Jang, Yong-Chul, Cargro Lee, Oh-Sub Yoon, and Hwidong Kim. 2006. "Medical
waste management in Korea." Journal of Environmental Management no.
80 (2):107-115.
82
Jin, Jianjun, Zhishi Wang, and Shenghong Ran. 2006. "Solid waste management in
Macao: practices and challenges." Waste Management no. 26 (9):1045-
1051.
Karadimas, N.V., and V.G. Loumos. 2008. "GIS-based modelling for the
estimation of municipal solid waste generation and collection." Waste
Management & Research no. 26 (4):337-346.
Karak, Tanmoy, R. M. Bhagat, and Pradip Bhattacharyya. 2011. "Municipal Solid
Waste Generation, Composition, and Management: The World Scenario."
Critical Reviews in Environmental Science and Technology no. 42
(15):1509-1630. doi: 10.1080/10643389.2011.569871.
Kaseva, M.E. , and S.E. Mbuligwe. 2005. "Appraisal of solid waste collection
following private sector involvement in Dar es Salaam city, Tanzania."
Habitat International no. 29 (2):353-366.
Kassim, Salha M., and Mansoor Ali. 2006. "Solid waste collection by the private
sector: Households’ perspective, findings from a study in Dar es Salaam
city, Tanzania." Habitat International no. 30 (4):769-780. doi:
http://dx.doi.org/10.1016/j.habitatint.2005.09.003.
KCC. 2006. Solid Waste Management Strategy Report. In City Council of
Kampala, edited by KCC. Kampala, Uganda: Republic of Uganda.
Kinobe, J. R., T. Bosona, G. Gebresenbet, C. B. Niwagaba, and B. Vinnerås. 2015.
"Optimization of waste collection and disposal in Kampala city." Habitat
International no. 49,126-137. doi:
http://dx.doi.org/10.1016/j.habitatint.2015.05.025.
Kinobe, J. R., G. Gebresenbet, C. B. Niwagaba, and B. Vinnerås. 2015. "Reverse
logistics system and recycling potential at a landfill: A case study from
Kampala City." Waste Management no. 42, 82-92. doi:
http://dx.doi.org/10.1016/j.wasman.2015.04.012.
Kinobe, Joel R, Charles B Niwagaba, Girma Gebresenbet, Allan J Komakech, and
Björn Vinnerås. 2015. "Mapping out the solid waste generation and
collection models: The case of Kampala City." Journal of the Air & Waste
Management Association no. 65 (2),197-205.
Kofoworola, O. F. 2007. "Recovery and recycling practices in municipal solid
waste management in Lagos, Nigeria." Waste Management no. 27
(9):1139-1143. doi: http://dx.doi.org/10.1016/j.wasman.2006.05.006.
Komakech, Allan J., Noble E. Banadda, Joel R. Kinobe, Levi Kasisira, Cecilia
Sundberg, Girma Gebresenbet, and Björn Vinnerås. 2014.
"Characterization of municipal waste in Kampala, Uganda." Journal of
the Air & Waste Management Association no. 64 (3):340-348. doi:
10.1080/10962247.2013.861373.
Kopicki, R., M.J. Berg, and L. Legg. 1993. Reuse and recycling - reverse logistics
opportunities, Other Information: DN: From review by Richard F. Poist,
Iowa State Univ., in Transportation Journal, Vol. 34, No. 3 (Spr 1995);
PBD: 1993: Council of Logistics Management, Oak Brook IL.
Krumwiede, Dennis W., and Chwen Sheu. 2002. "A model for reverse logistics
entry by third-party providers." Omega no. 30 (5):325-333. doi:
http://dx.doi.org/10.1016/S0305-0483(02)00049-X.
83
Kumar, S Anil, Kumar S Anil, and N Suresh. 2009. Operations Management: New
Age International.
Lambert, D.M., J.R. Stock, and L. Ellram. 1998. Fundamentals of logistics
management: Irwin/McGraw-Hill, Boston.
Lambert, Douglas M, Martha C Cooper, and Janus D Pagh. 1998. "Supply chain
management: implementation issues and research opportunities."
International Journal of Logistics Management, The no. 9 (2):1-20.
Li, Jing-Quan, Denis Borenstein, and Pitu B Mirchandani. 2008. "Truck scheduling
for solid waste collection in the City of Porto Alegre, Brazil." Omega no.
36 (6):1133-1149.
Marshall, Rachael E., and Khosrow Farahbakhsh. 2013. "Systems approaches to
integrated solid waste management in developing countries." Waste
Management no. 33 (4):988-1003. doi:
http://dx.doi.org/10.1016/j.wasman.2012.12.023.
Matter, Anne, Martin Dietschi, and Christian Zurbrügg. 2012. "Improving the
informal recycling sector through segregation of waste in the household–
The case of Dhaka Bangladesh." Habitat International.
Medina, M. 1997. Globalization, development, and municipal solid waste
management in third world cities, Tijuana, Mexico: El Colegio de la
Forntera Norte,[199.
Medina, Martin. 2000. "Scavenger cooperatives in Asia and Latin America."
Resources, Conservation and Recycling no. 31 (1):51-69. doi:
http://dx.doi.org/10.1016/S0921-3449(00)00071-9.
Melo, M. T., S. Nickel, and F. Saldanha-da-Gama. 2009. "Facility location and
supply chain management – A review." European journal of operational
research no. 196 (2):401-412. doi:
http://dx.doi.org/10.1016/j.ejor.2008.05.007.
Moghadam, MR Alavi, N Mokhtarani, and B Mokhtarani. 2009. "Municipal solid
waste management in Rasht City, Iran." Waste Management no. 29
(1):485-489.
MoWHC. 2004. Ministry of Works, Housing and Communications. Traffic Signs
Manual. Entebbe: Republic of Uganda.
Mukisa, P.K. 2009. Public participation in solid waste management: challenges
and prospects: a case of Kira Town council, Uganda, Universitetet i
Agder, Kristiansand Norway
Mukwaya, I.P. 2004. Urban change in Uganda: The challenge of managing urban
areas in a global environment. Paper read at International Conference on
Globalism and Urban Change, at Chicago USA.
Nabembezi, David. 2011. Solid Waste Management. Study in Bwaise II Parish,
Kawempe Division. NaNa Development Consultants. Kampala: Study for
Water Aid.
Nagurney, Anna, and Fuminori Toyasaki. 2005. "Reverse supply chain
management and electronic waste recycling: a multitiered network
equilibrium framework for e-cycling." Transportation Research Part E:
Logistics and Transportation Review no. 41 (1):1-28. doi:
http://dx.doi.org/10.1016/j.tre.2003.12.001.
84
Nagy, Gábor, and Saïd Salhi. 2007. "Location-routing: Issues, models and
methods." European journal of operational research no. 177 (2):649-672.
Nas, PeterJ M., and Rivke Jaffe. 2004. "Informal Waste Management."
Environment, Development and Sustainability no. 6 (3):337-353. doi:
10.1023/B:ENVI.0000029912.41481.a5.
NEMA. 2004. State Of Environment Report for Uganda. Kampala: National
Environment Management Authority
Nuortio, Teemu, Jari Kytöjoki, Harri Niska, and Olli Bräysy. 2006. "Improved
route planning and scheduling of waste collection and transport." Expert
Systems with Applications no. 30 (2):223-232. doi:
http://dx.doi.org/10.1016/j.eswa.2005.07.009.
Ojok, J, MK Koech, M Tole, and J Okot-Okumu. 2013. "Rate and Quantities of
Household Solid Waste Generated in Kampala City, Uganda." Science
Journal of Environmental Engineering Research no. 2013.
Okot-Okumu, J., and R. Nyenje. 2011. "Municipal solid waste management under
decentralisation in Uganda." Habitat International no. 35:6.
Oteng-Ababio, Martin, Jose Ernesto Melara Arguello, and Offira Gabbay. 2013.
"Solid waste management in African cities: Sorting the facts from the fads
in Accra, Ghana." Habitat International no. 39:96-104.
Owen, Susan Hesse, and Mark S. Daskin. 1998. "Strategic facility location: A
review." European journal of operational research no. 111 (3):423-447.
doi: http://dx.doi.org/10.1016/S0377-2217(98)00186-6.
Oyoo, R, R Leemans, and APJ Mol. 2011. "Future Projections of Urban Waste
Flows aand their Impacts in African Metropolises Cities." Int. J. Environ.
Res no. 5 (3):705-724.
Oyoo, R., R. Leemans, and A. P. J. Mol. 2014. "Comparison of environmental
performance for different waste management scenarios in East Africa:
The case of Kampala City, Uganda." Habitat International no. 44:349-
357. doi: 10.1016/j.habitatint.2014.07.012.
Ozcan, Yasar A. 2005. Quantitative methods in health care management:
techniques and applications. Vol. 4: John Wiley & Sons.
Parrot, Laurent, Joel Sotamenou, and Bernadette Kamgnia Dia. 2009. "Municipal
solid waste management in Africa: Strategies and livelihoods in Yaoundé,
Cameroon." Waste Management no. 29 (2):986-995.
Paul, Johannes G., Joan Arce-Jaque, Neil Ravena, and Salome P. Villamor. 2012.
"Integration of the informal sector into municipal solid waste management
in the Philippines – What does it need?" Waste Management no. 32
(11):2018-2028. doi: http://dx.doi.org/10.1016/j.wasman.2012.05.026.
Philippe, F., and M. Culot. 2009. "Household solid waste generation and
characteristics in Cape Haitian city, Republic of Haiti." Resources,
Conservation and Recycling no. 54 (2):73-78.
Pires, Ana, Graça Martinho, and Ni-Bin Chang. 2011. "Solid waste management in
European countries: A review of systems analysis techniques." Journal of
Environmental Management no. 92 (4):1033-1050. doi:
http://dx.doi.org/10.1016/j.jenvman.2010.11.024.
85
Remigios, Mangizvo V. 2010. "An overview of the management practices at solid
waste disposal sites in African cities and towns." Journal of sustainable
development in Africa no. 12 (7).
Richey, R.G., H. Chen, S.E. Genchev, and P.J. Daugherty. 2005. "Developing
effective reverse logistics programs." Industrial Marketing Management
no. 34 (8):830-840.
Robinson, William D. 1986. The solid waste handbook: a practical guide: Wiley.
com.
Rogers, D.S., and R.S. Tibben-Lembke. 1999. Going backwards: reverse logistics
trends and practices. Vol. 2: Reverse Logistics Executive Council
Pittsburgh, PA.
Rogers, D.S., R.S. Tibben-Lembke, Reno. Center for Logistics Management
University of Nevada, and R.L.E. Council. 1999. Going backwards:
reverse logistics trends and practices. Vol. 2: Reverse Logistics
Executive Council.
Rogers, Dale S., and Ronald Tibben-Lembke. 2001. "AN EXAMINATION OF
REVERSE LOGISTICS PRACTICES." Journal of Business Logistics no.
22 (2):129-148. doi: 10.1002/j.2158-1592.2001.tb00007.x.
Rotich, Henry, K., Zhao Yongsheng, and Dong Jun. 2006. "Municipal solid waste
management challenges in developing countries – Kenyan case study."
Waste Management no. 26 (1):92-100.
Rushbrook, P. 1999. "Getting from subsistence landfill to sophisticated landfill."
Waste Management & Research no. 17 (1):4-9.
Sahoo, Surya, Seongbae Kim, Byung-In Kim, Bob Kraas, and Alexander Popov Jr.
2005. "Routing optimization for waste management." Interfaces no. 35
(1):24-36.
Sharholy, Mufeed, Kafeel Ahmad, Gauhar Mahmood, and R. C. Trivedi. 2008.
"Municipal solid waste management in Indian cities – A review." Waste
Management no. 28 (2):459-467. doi:
http://dx.doi.org/10.1016/j.wasman.2007.02.008.
Stock, James R. 1998. Development and implementation of reverse logistics
programs. Paper read at ANNUAL CONFERENCE PROCEEDINGS,
COUNCIL OF LOGISTICS MANAGEMENT.--.
Subramanian, P. M. 2000. "Plastics recycling and waste management in the US."
Resources, Conservation and Recycling no. 28 (3–4):253-263. doi:
http://dx.doi.org/10.1016/S0921-3449(99)00049-X.
Sujauddin, Mohammad, SMS Huda, and ATM Rafiqul Hoque. 2008. "Household
solid waste characteristics and management in Chittagong, Bangladesh."
Waste Management no. 28 (9):1688-1695.
Tavares, G., Z. Zsigraiova, V. Semiao, and M. G. Carvalho. 2009. "Optimisation of
MSW collection routes for minimum fuel consumption using 3D GIS
modelling." Waste Management no. 29 (3):1176-1185.
Teixeira, João, António Pais Antunes, and Jorge Pinho de Sousa. 2004.
"Recyclable waste collection planning––a case study." European journal
of operational research no. 158 (3):543-554.
86
Thanh, Nguyen Phuc, Yasuhiro Matsui, and Takeshi Fujiwara. 2010. "Household
solid waste generation and characteristic in a Mekong Delta city,
Vietnam." Journal of Environmental Management no. 91 (11):2307-2321.
Tibben-Lembke, R.S., and D.S. Rogers. 2002. "Differences between forward and
reverse logistics in a retail environment." Supply Chain Management: An
International Journal no. 7 (5):271-282.
Tilton, John E. 1999. "The future of recycling." Resources Policy no. 25 (3):197-
204. doi: http://dx.doi.org/10.1016/S0301-4207(99)00027-6.
Torres, Octavio A Carranza, and Francesc Robuste Anton. 1999. "A continuous
approximation model for vehicle routing in solid waste management
systems."
Troschinetz, A.M., and J.R. Mihelcic. 2009. "Sustainable recycling of municipal
solid waste in developing countries." Waste Management no. 29 (2):915-
923.
Tukahirwa, J. T., A. P. J. Mol, and P. Oosterveer. 2011. "Access of urban poor to
NGO/CBO-supplied sanitation and solid waste services in Uganda: The
role of social proximity." Habitat International no. 35 (4):582-591.
UBOS. 2002. The 2002 Uganda Population and Housing Census, Population Size
and Distribution Kampala Uganda: UBOS
———. 2012. Statistical Abstract Of Kampala. edited by Uganda Bureau Of
Statistics. Kampala, Uganda: Government Printers, Kampala.
UNDP. 2014. The Millennium Development Goals UNDP 2014 [cited 30th June
2014].
Van Hoek, Remko I. 1999. "From reversed logistics to green supply chains."
Supply Chain Management: An International Journal no. 4 (3):129-135.
Vidanaarachchi, Chandana K, Samuel TS Yuen, and Sumith Pilapitiya. 2006.
"Municipal solid waste management in the Southern Province of Sri
Lanka: Problems, issues and challenges." Waste Management no. 26
(8):920-930.
Wang, M. J., and S. P. Lin. 2010. "Study on doctor shopping behavior: insight
from patients with upper respiratory tract infection in Taiwan." Health
Policy no. 94 (1):61-7. doi: S0168-8510(09)00229-2 [pii]
10.1016/j.healthpol.2009.08.009.
Waters, Donald. 2010. Global logistics: New directions in supply chain
management: Kogan Page Publishers.
Wilson, David C, Nadine A Smith, Nick C Blakey, and Louise Shaxson. 2007.
"Using research-based knowledge to underpin waste and resources
policy." Waste Management & Research no. 25 (3):247-256.
Wilson, David C., Adebisi O. Araba, Kaine Chinwah, and Christopher R.
Cheeseman. 2009. "Building recycling rates through the informal sector."
Waste Management no. 29 (2):629-635. doi:
http://dx.doi.org/10.1016/j.wasman.2008.06.016.
Wilson, David C., Costas Velis, and Chris Cheeseman. 2006. "Role of informal
sector recycling in waste management in developing countries." Habitat
International no. 30 (4):797-808.
Zhang, Dong Qing, Soon Keat Tan, and Richard M. Gersberg. 2010. "Municipal
solid waste management in China: Status, problems and challenges."
87
Journal of Environmental Management no. 91 (8):1623-1633. doi:
http://dx.doi.org/10.1016/j.jenvman.2010.03.012.
Zhen-shan, Li, Yang Lei, Qu Xiao-Yan, and Sui Yu-mei. 2009. "Municipal solid
waste management in Beijing City." Waste Management no. 29 (9):2596-
2599. doi: http://dx.doi.org/10.1016/j.wasman.2009.03.018.
Zielinska, Barbara, John Sagebiel, Jacob D. McDonald, Kevin Whitney, and
Douglas R. Lawson. 2004. "Emission Rates and Comparative Chemical
Composition from Selected In-Use Diesel and Gasoline-Fueled Vehicles."
Journal of the Air & Waste Management Association no. 54 (9):1138-
1150. doi: 10.1080/10473289.2004.10470973.
Zurbrugg, C. 2002. "Urban solid waste management in low-income countries of
Asia how to cope with the garbage crisis." Presented for: Scientific
Committee on Problems of the Environment (SCOPE) Urban Solid Waste
Management Review Session, Durban, South Africa.
———. 2003. "Solid waste management in developing countries." SWM
introductory text on www. sanicon. net:5.
88
Acknowledgments
First of all, I am greatly indebted to my supervisors, Prof. Girma Gebresenbet,
Assoc. Prof. Björn Vinnerås, and Dr. Charles Niwagaba for their inspiring
enthusiasm, support and guidance. I also thank you for your expertise,
scientific skills and devotion. The knowledge and experience I have received
from you have improved me and will shape my future in research.
I wish to warmly acknowledge the financial support of the Swedish
International Development Cooperation Agency through the Sida/SAREC
Project at Makerere University, Uganda and Swedish University of
Agricultural Sciences, Sweden.
I also wish to thank KCCA management, especially Judith, James,
Josephine, Kenneth, Obedi and Dennis. Thank you for the good collaboration
during my data collection.
I am blessed to have many friends who have acted as pillars and without
whom accomplishing this work would have been a lot harder. To my friends
and colleagues, thanks a lot for your support and encouragement over the
years. Special mention goes to Apollo, Betty, Dennis, Godfrey, Grace, Herbert,
Hillary, JB, Mai, Martin, Max, Michael, Rita, Robinah, Ronald, Rukia and
Umaru. To the staff and my fellow students at the Department of Energy and
Technology at SLU, thanks a lot for making me feel welcome and part of the
family at the department. I will always treasure the moments we spent together.
Special regards to Bosona, Samuel, Ingrid, David, Cecilia, Jenna, Rosta,
Jörgen, Ida, Fufa, Ashenafi and Tadasse. To all my friends outside my work
and studies, thanks for the friendship and support you have always given to me.
My heartfelt thanks go to my family: Mummy, Richard, Loy, James, Noor,
Diana, Jason, Joshua, Julia, Jeremiah, Tyra and Darren. I am most grateful for
your love, support, patience and understanding. Thank you for being such
wonderful people.
Finally, I thank God for the gift of life and I attribute the completion of this
work to his will. With God, all things are possible.


![GW 1# ;] - Kampala](https://img.pdfslide.us/doc/110x75/620e40353090141c8a298df6/gw-1-kampala.jpg)