Embed Size (px)
Citation preview
ASSESSMENT OF TURKISH BRIDGE STANDARDS
AND TECHNIQUES
A THESIS
SUBMITTED ON THE TWENTYFIRST DAY OF JANUARY 2004
TO THE DEPARTMENT OF
CIVIL AND ENVIRONMENTAL ENGINEERING
IN PARTIAL FULFILLMENT OF THE REQUIREMENTS
OF THE GRADUATE SCHOOL
OF TULANE UNIVERSITY
FOR THE DEGREE
OF
MASTER OF SCIENCE
BY
___________________________
Mustafa Sehmuz Lok
APPROVED:_________________________ Anthony J. Lamanna, Ph.D.
Director
_________________________ Paul H. Ziehl, Ph.D., P.E.
_________________________ Reda M. Bakeer, Ph.D., P.E.
ASSESSMENT OF TURKISH BRIDGE STANDARDS
AND TECHNIQUES
AN ABSTRACT
SUBMITTED ON THE TWENTYFIRST DAY OF JANUARY 2004
TO THE DEPARTMENT OF
CIVIL AND ENVIRONMENTAL ENGINEERING
IN PARTIAL FULFILLMENT OF THE REQUIREMENTS
OF THE GRADUATE SCHOOL OF TULANE UNIVERSITY
FOR THE DEGREE
OF
MASTER OF SCIENCE
BY
___________________________
Mustafa Sehmuz Lok
APPROVED:_________________________ Anthony J. Lamanna, Ph.D.
Director
_________________________ Paul H. Ziehl, Ph.D., P.E.
_________________________ Reda M. Bakeer, Ph.D., P.E.
ii
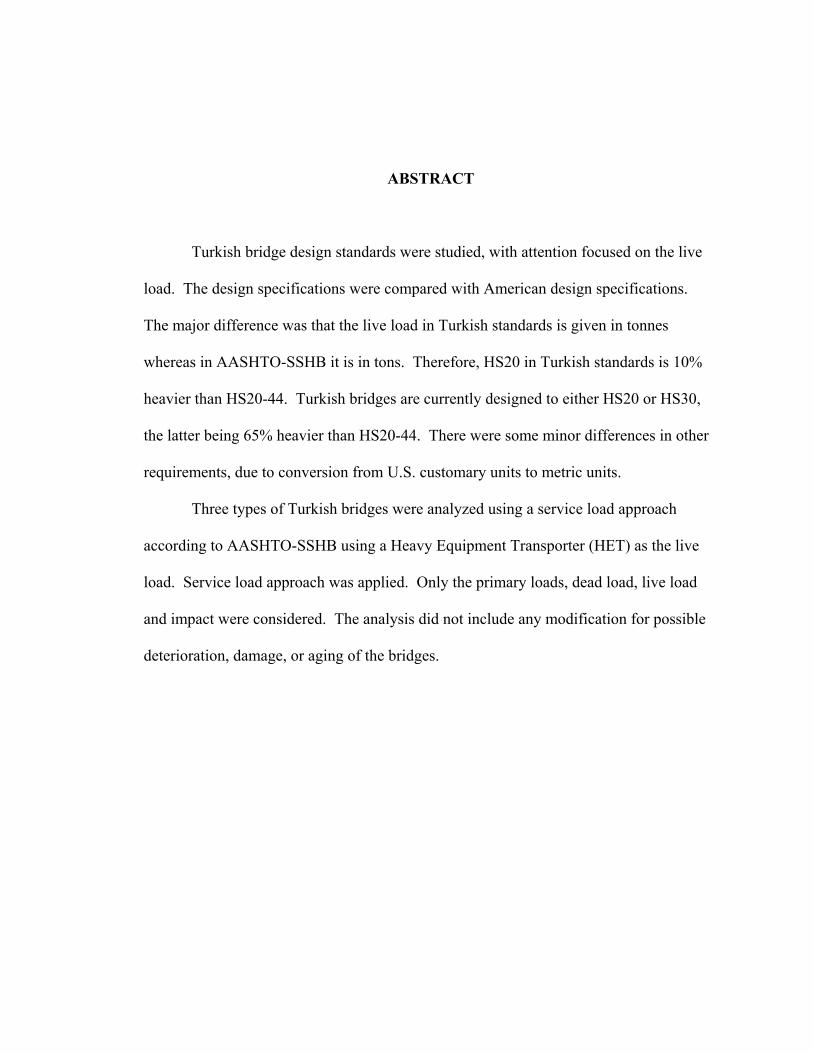
ABSTRACT
Turkish bridge design standards were studied, with attention focused on the live
load. The design specifications were compared with American design specifications.
The major difference was that the live load in Turkish standards is given in tonnes
whereas in AASHTO-SSHB it is in tons. Therefore, HS20 in Turkish standards is 10%
heavier than HS20-44. Turkish bridges are currently designed to either HS20 or HS30,
the latter being 65% heavier than HS20-44. There were some minor differences in other
requirements, due to conversion from U.S. customary units to metric units.
Three types of Turkish bridges were analyzed using a service load approach
according to AASHTO-SSHB using a Heavy Equipment Transporter (HET) as the live
load. Service load approach was applied. Only the primary loads, dead load, live load
and impact were considered. The analysis did not include any modification for possible
deterioration, damage, or aging of the bridges.
MMMMMMMMMMMMMMMMMMMMMMMMMMMM


ii
ACKNOWLEDGMENT
I would like to thank the following people for their contributions to the
completion of this thesis. My parents, Mr. Omer L. Lok and Mrs. Gulhan Lok, for their
continuing support and encouragement. My advisor, Dr. Anthony J. Lamanna, for his
assistance and guidance throughout my graduate studies. My committee members, Drs.
Paul H. Ziehl and Reda M. Bakeer, who have provided extensive guidance and support.
My professors at Middle East Technical University in Turkey and Tulane University in
Louisiana for the knowledge and experience that I have gained throughout my
undergraduate and graduate study.
I would like to thank Mr. James C. Ray and Mr. Gerardo I. Velazquez, the project
managers funding the study at the US Army Corps of Engineers. I also would like to
thank Mr. Terry Stanton who supplied essential field information for the analysis of the
actual bridges. I would also like to extend a special gratitude to Mr. T. Sahin and Mrs. F.
Sahin, from General Directorate of Highways of Turkey, for providing documents and
specifications crucial for this study. Finally, I would like to thank my colleagues who
helped me in many ways.
iii
TABLE OF CONTENTS ACKNOWLEDGEMENT ii LIST OF TABLES vii LIST OF FIGURES viii CHAPTER 1 INTRODUCTION
1.1 Background 1 1.2 Objectives 1 1.3 Methodology and Scope 2 1.4 Bridge Selection 2 1.5 Live Load 3 1.6 Software 4 1.7 Thesis Layout 5 1.8 Disclaimer 6
CHAPTER 2 GENERAL BACKGROUND
2.1 Turkish Transportation System 7 2.1.1 Railways 7 2.1.2 Airports 8 2.1.3 Seaports 8 2.1.4 Roadways 8
2.2 General Directorate of Highways 11 2.3 Present Condition of Bridges 13 2.4 Material - Manufacturing Specifications 14 2.5 Design Specifications 15
CHAPTER 3 COMPARISON OF TURKISH AND AMERICAN SPECIFICATIONS
3.1 Materials 17 3.1.1 Specified Concrete Properties 17 3.1.2 Steel 18 3.1.3 Prestressing Strand 19
3.2 Loading 19 3.2.1 Dead Load 19 3.2.2 Live Load 20 3.2.3 Standard Truck and Lane Loads 20 3.2.4 Traffic Lanes: 22 3.2.5 Minimum Loading 22 3.2.6 Application of Live Load 23 3.2.7 Impact 23 3.2.8 Reduction in Load Intensity 25
iv
3.2.9 Overloading 25 1) AASHTO-SSHB 25 2) TSRB 26
3.2.10 Sidewalk Loading 27 1) AASHTO-SSHB 27 2) TSRB 28
3.3 Distribution of Loads 28 3.4 Design Method 30
3.4.1 Allowable Stresses 31 3.4.2 Load Factors for LFD 31
3.5 Summary 31 CHAPTER 4 ANALYSIS OF THE BIRECIK BRIDGE
4.1 Introduction. 33 4.2 Analysis of the Birecik Bridge 37
4.2.1 Slab 38 1) Effective Span 38 2) Dead Load 38 3) Live Load 39 4) Main Steel 39 5) Column Punching 41 6) One-Way Shear Failure Check 41 7) Tire Punching 42
4.2.2 SAP2000 Model 43 1) Distribution Factor. 44 2) Impact Factor. 45 3) Effective Flange Width. 45 4) Convergence Check of the Model 45 5) Section Modeling 47 6) Loading. 50 7) Results 50 8) Critical Moment / Axial Force Combinations Check 52 9) Column Stability Considering Slenderness Effect 54 10) Punching Shear in Arch 56 11) Shear Check in the Girder 57
4.3 Summary of Results. 59 4.3.1 Slab. 59 4.3.2 2-D Computer Model. 59
CHAPTER 5 ANALYSIS OF COMPOSITE I-GIRDER BRIDGE
5.1 Introduction 61 5.2 Analysis 62
5.2.1 Slab 62 1) Effective Span 62 2) Dead Load. 62 3) Live Load. 63
v
4) Main Steel 63 5) Distribution Steel. 65 6) Temperature Steel 65 7) Column Punching 65 8) Tire Punching 65
5.2.2 Girders. 66 5.2.2.1 Interior Girder 67
1) Dead Load 67 2) Live Load 67
5.2.2.2 Exterior Girder 67 1) Dead Load 67 2) Live Load 68
5.2.2.3 Girder Check 69 1) Girder at the Midspan. 70 2) Girder at the Support 73 3) Shear Stress Check. 75
5.3 Summary of Results 76 5.3.1 Slab 76 5.3.2 Girder 76
CHAPTER 6 ANALYSIS OF THE CANDIR BRIDGE
6.1 Introduction 78 6.2 Analysis 80
6.2.1 Slab 81 1) Effective Span 81 2) Dead Load 81 3) Live Load 81 4) Main Steel 82 5) Distribution Steel 83 6) Temperature Steel 84 7) Column Punching 84 8) Tire Punching 84
6.2.2 Girders 85 6.2.2.1 Interior Girder 86
1) Dead Load 86 2) Live Load 86 3) Check Web Area for Shear 88 4) Check Moment Capacity of the Interior Girder 89 5) Check Shear Reinforcement 90
6.2.2.2 Exterior Girder 92 1) Dead Load 92 2) Live Load 92 3) Check Moment Capacity of the Exterior Girder 94 4) Check Shear Reinforcement 94
6.3 Summary of Results 94 6.3.1 Slab 95
vi
6.3.2 Girder 95 CHAPTER 7 SUMMARY AND CONCLUSIONS
7.1 Introduction 96 7.2 Comparison of Specifications 96 7.3 Analysis Results 98 7.4 Conclusions of Analysis 99 7.5 Further Research 99
APPENDIX A SAMPLE BRIDGE INVENTORY CARDS 101 APPENDIX B TRUCKS 106 APPENDIX C ANALYSIS DIAGRAMS OF BIRECIK BRIDGE 110 APPENDIX D PICTURES OF BIRECIK BRIDGE, FEBRUARY, 2003 121 APPENDIX E PICTURES OF CANDIR BRIDGE, MAY, 2003 127 REFERENCES 134 BIOGRAPHY 136
vii
LIST OF TABLES
Table 2.1 By 2003, the length of the roadway network according to surface type (9).
Table 2.2 The number and the length of the Turkish Bridges according to their types, 2001 (9).
Table 3.1 The compressive strength of concrete used in Turkey (14). Table 3.2 Properties of steel used in Turkey and in the United States (2, 16, and
17). Table 3.3 Comparison of unit weight of materials for dead load calculation
(2, 13). Table 3.4 Comparison of standard truck and lane loadings. Table 3.5 Roadway width and corresponding number of traffic lanes. Table 3.6 Minimum loading requirements. Table 3.7 Comparison of Impact formulas. Table 3.8 Comparison of impact fraction for culverts. Table 3.9 Comparison of impact fraction for culverts. Table 3.10 Sidewalk uniform loading comparison. Table 3.11 Distribution factors for bending moment in interior stringers for
one lane. Table 3.12 Distribution factors for the moment in interior stringers for two or
more lanes. Table 3.13 Distribution factors for bending moments in transverse beams. Table 4.1 Displacements of selected points (in) in the corresponding
computer model. Table 4.2 The critical internal forces for each member type. Table 4.3 The maximum axial and shear force for each member type. Table 5.1 Maximum Moments for exterior girder. Table 5.2 Maximum Shear forces for exterior girder.
9
1417
18
2021222324242528
2929
30
4651527070
viii
LIST OF FIGURES Figure 1.1 A Heavy Equipment Transporter with an M-1 tank. Figure 1.2 Axle loading and assumed transverse geometry of HET for
analysis. Figure 2.1 Turkish Expressways and Major Seaports, 2000 (10). Figure 2.2 Traffic flow map in state highways, 2000 (10). Figure 2.3 Trans European Motorway in Turkey, 2000 (10). Figure 2.4 Organization chart of the General Directorate of Highways (9). Figure 3.1 Heavy commercial hauler of the TSRB (13). Figure 4.1 Location of the Birecik Bridge on the traffic flow map. Figure 4.2 One of the arches of the Birecik Bridge. Figure 4.3 Plan of the bridge deck. Figure 4.4 Vertical dimensions of the arch. Figure 4.5 The deck of the Birecik Bridge. Figure 4.6 Model arch for SAP2000 analysis. Figure 4.7 The columns of the main arch monitored for the convergence
in SAP2000. Figure 4.8 Convergence curves for the values of vertical displacement
of selected points. Figure 4.9 Element section composition of the structure modeled
in SAP2000. Figure 4.10 The 3-Arch model used in SAP2000 analysis. Figure 4.11 The Birecik Bridge. Figure 4.12 Deformed shape of the main arch (half-arch), SAP2000. Figure 5.1 Cross-section of the bridge (25). Figure 5.2 Layout of the bridge (25). Figure 5.3 Exterior and adjacent interior girder supporting the deck (25). Figure 5.4 Placement of vehicle for the maximum load on the exterior
girder (25). Figure 5.5 Composite sections with cover plate at midspan (25). Figure 5.6 Transformed section at midspan (25). Figure 5.7 Section at the support (concrete slab was in tension zone) (25). Figure 6.1 Location of the Candir Bridge on the traffic flow map. Figure 6.2 Cross-section of the bridge (26). Figure 6.3 One of the simple spans (26). Figure 6.4 HET positioning on the deck for critical case (26). Figure 6.5 Positioning of HET for maximum shear force at support (26). Figure 6.6 T-Girder section and tension rebars (26). Figure 6.7 Placement of vehicle for the maximum load on the exterior girder. Figure A.1 Bridge Inventory Card, Card 1- Page1 (12).
4
49
10111226333435363644
46
47
48494951616268
69717274787979878889
92102
ix
Figure A.2 Bridge Inventory Card, Card 1- Page2 (12). Figure A.3 Bridge Inventory Card, Card 2- Page1 (12). Figure A.4 Bridge Inventory Card, Card 2- Page2 (12) Figure B.1 HS Truck Geometry (2, 13). Figure B.2 H-Truck Geometry (2, 13). Figure B.3 Overloading Type-A for Turkish expressways (14). Figure B.4 Overloading Type-B for Turkish expressways (14). Figure C.1 Moment diagram of the main arch, Birecik Bridge. Figure C.2 Shear Force diagram of the main arch, Birecik Bridge. Figure C.3 Axial Force diagram of the main arch, Birecik Bridge. Figure C.4 Interaction diagram of the Column 4 for the minimum steel (1 percent). Figure C.5 Interaction diagram of the Column 4 with 2.64 percent steel. Figure C.6 Interaction diagram of the Column 2 (slender) with 2.64 percent
steel. Figure C.7 Interaction diagram of the Arch for the minimum steel. Figure C.8 Interaction diagram of the Arch-Crown for the minimum steel. Figure C.9 Interaction diagram of the Girder for the minimum steel. Figure C.10 Interaction diagram of the Column-Wall for the minimum steel. Figure D.1 The traffic on the Birecik Bridge. Figure D.2 Side view of the Birecik Bridge. Figure D.3 Side view of the Birecik Bridge and the Euphrates River. Figure D.4 Side view of the arches of the Birecik Bridge. Figure D.5 The arches of the Birecik Bridge on the land. Figure D.6 The arch rib of the Birecik Bridge. Figure D.7 The deck of the Birecik Bridge. Figure D.8 A detail of column-beam-diaphragm connection of the
Birecik Bridge. Figure D.9 The arches, and the column wall of the Birecik Bridge. Figure D.10 The exterior girder and the diaphragm of the Birecik Bridge. Figure E.1 The approach of the Candir Bridge. Figure E.2 Side view of the Candir Bridge. Figure E.3 Abutments of the Candir Bridge and the new bridge. Figure E.4 The Candir River in the summer. Figure E.5 The deck and the pier cap of the Candir Bridge. Figure E.6 A detail of the deck of the Candir Bridge. Figure E.7 The exterior girder of the Candir Bridge. Figure E.8 The simple span support of the Candir Bridge. Figure E.9 The first support of the Candir Bridge from the west. Figure E.10 The girder of the Candir Bridge resting on an abutment. Figure E.11 Construction of the new bridge. Figure E.12 The pier of the new bridge.
103104105107108109109111112113
114115
116117118119120122122123123124124125
125126126128128129129130130131131132132133133
1
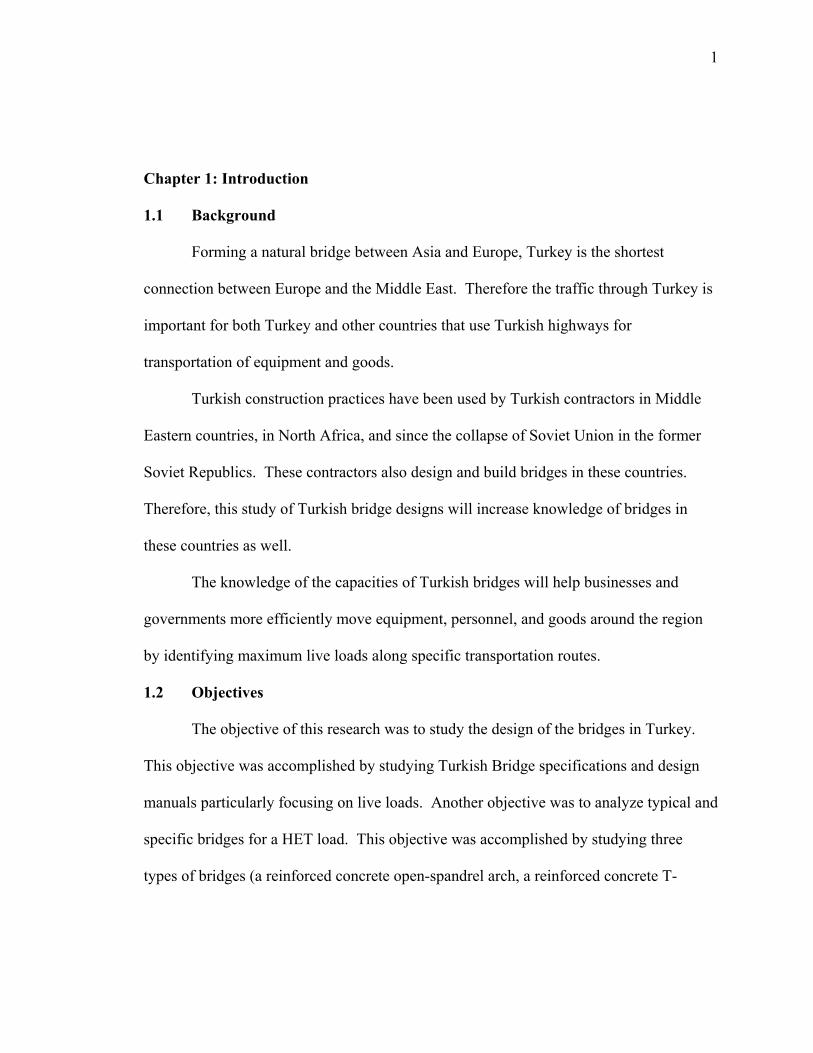
Chapter 1: Introduction
1.1 Background
Forming a natural bridge between Asia and Europe, Turkey is the shortest
connection between Europe and the Middle East. Therefore the traffic through Turkey is
important for both Turkey and other countries that use Turkish highways for
transportation of equipment and goods.
Turkish construction practices have been used by Turkish contractors in Middle
Eastern countries, in North Africa, and since the collapse of Soviet Union in the former
Soviet Republics. These contractors also design and build bridges in these countries.
Therefore, this study of Turkish bridge designs will increase knowledge of bridges in
these countries as well.
The knowledge of the capacities of Turkish bridges will help businesses and
governments more efficiently move equipment, personnel, and goods around the region
by identifying maximum live loads along specific transportation routes.
1.2 Objectives
The objective of this research was to study the design of the bridges in Turkey.
This objective was accomplished by studying Turkish Bridge specifications and design
manuals particularly focusing on live loads. Another objective was to analyze typical and
specific bridges for a HET load. This objective was accomplished by studying three
types of bridges (a reinforced concrete open-spandrel arch, a reinforced concrete T-
2
Girder, and a composite steel I-Girder bridge) and by analyzing the superstructures of
these bridges for HET loading.
1.3 Methodology and Scope
Bridge engineers in the General Directorate of Highways (GDH), the department
responsible for the design, construction, operation and maintenance of Turkish highways
and bridges, were contacted. Design practices were discussed, and design specifications
were obtained. These specifications were studied and compared with American
Association of State Highway and Transportation Officials-Standard Specifications for
Highway Bridges (AASHTO-SSHB). The specifications for construction materials were
also studied. In order to understand Turkish bridge design, blueprints of three types of
Turkish bridges were obtained and studied.
These bridges were analyzed using Allowable Stress Design (ASD) approach for
primary loads (dead load, live load and impact) only. Neither the loads nor the section
capacities were factored as the bridges were checked with service load approach for
overloading. First-order analysis was used. Environmental factors, possible damages,
cracks, deterioration, aging and any vandalism that might have occurred were not
considered in the analysis. Assumptions were made for any missing information for the
analysis.
1.4 Bridge Selection
Three different types of Turkish bridges were selected. The first one is the
Birecik Bridge, a reinforced concrete open-spandrel arch bridge in southeast Turkey. The
design drawings of the bridge could not be found. The external dimensions of the bridge
were obtained through a Turkish survey team. The investigators analyzed this bridge
3
with engineering assumptions. As there was no information about the reinforcement
details, the amount of reinforcement assumed in the bridge was the minimum steel
required by the American Concrete Institute (ACI). The minimum reinforcement
requirements of the Turkish standards are the same as ACI. The analysis of this bridge is
presented in Chapter 4.
The second bridge type was adopted from generic design plans prepared by the
GDH. It is an I-Girder steel-concrete deck bridge. The substructure of the bridge was
not analyzed as this project focused on the bridge superstructures. The analysis of this
bridge is presented in Chapter 5.
The third type is the Candir Bridge, a reinforced concrete T-Girder bridge in
northwest Turkey. The actual superstructure plans were obtained from the GDH. The
analysis of this bridge is presented in Chapter 6.
This selection was a representative sample of Turkish bridges as 90 percent of
bridges in Turkey are concrete, although some are prestressed concrete and Gerber-type
bridges (simply supporting the suspended segment of the center span on the cantilevered
ends of the girders of the side spans). A prestressed concrete bridge was not selected for
the analysis as these bridges are relatively new and were designed to higher axle loads
than the relatively old bridges considered in this study.
1.5 Live Load
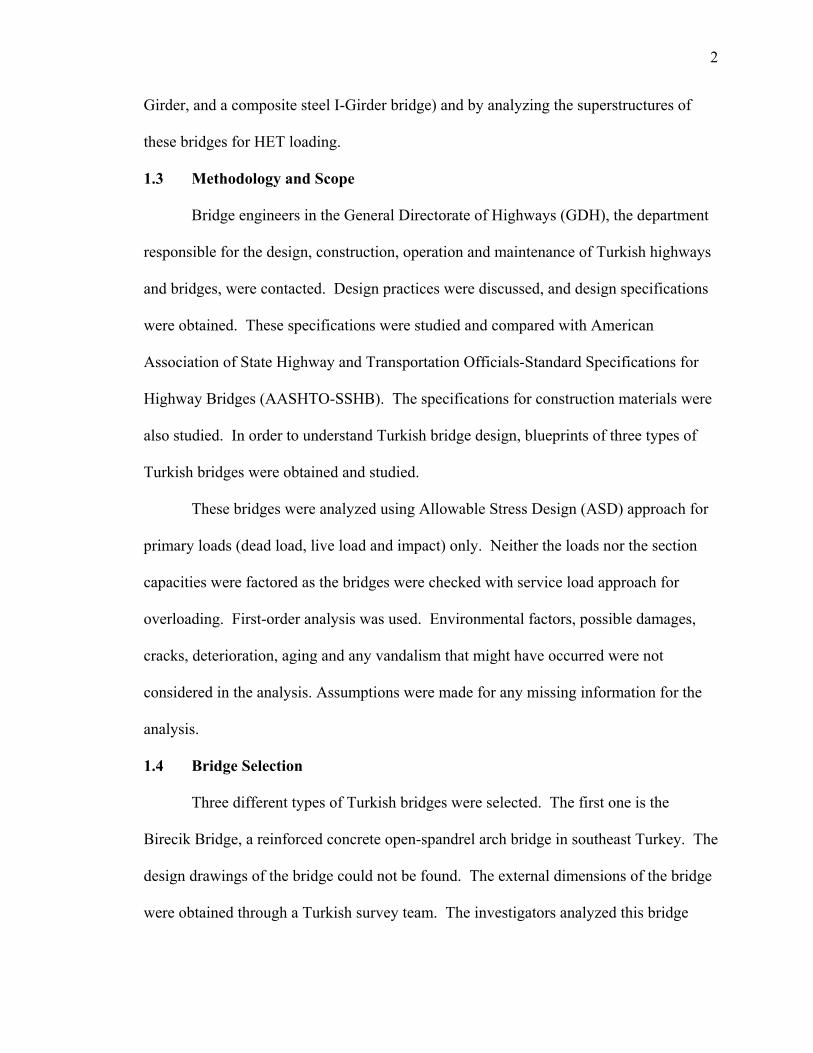
The live load used in the analysis of the bridges was the Heavy Equipment
Transporter (HET) shown in Figure 1.1. It has a total weight of 104.7 tonnes (230.8 kips)
distributed over nine axles.
4
Figure 1.1: A Heavy Equipment Transporter with an M-1 tank.
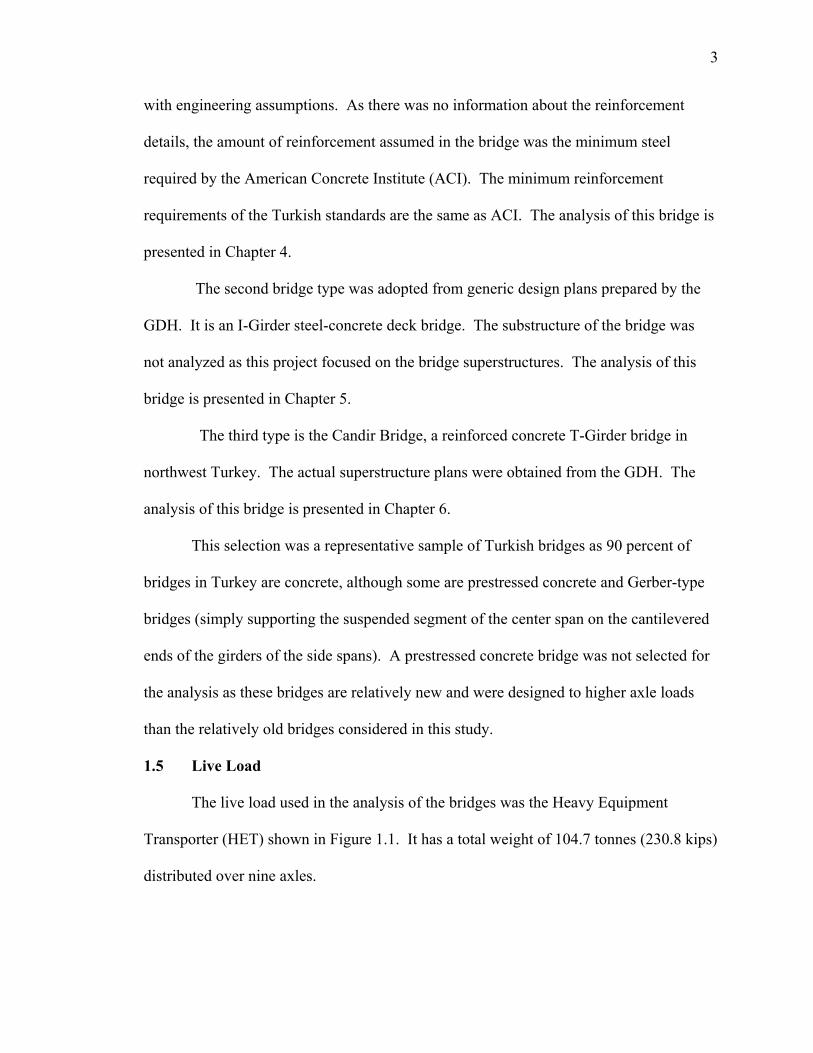
To get the standard truck geometry of AASHTO-SSHB (1, 2), the load on each axle
was assumed to act at two points 1.83 m (6 ft) apart from each other in the transverse
direction, as shown in Figure 1.2. HET distributes the load over 28 tires; however, it was
assumed that the load was distributed over 18 tires. Results of the analysis were
conservative with this assumption as in the actual case the total load is spread on 28 tires.
This figure also shows the axle spacing and axle load configuration for the HET.
Figure 1.2: Axle loading and assumed transverse geometry of HET for analysis.
1.6 Software
SAP2000 (Structural Analysis Program) was used to model and analyze the
bridges. SAP is a finite analysis program that was initially developed at the University of
California-Berkeley about 25 years ago. SAP2000 is the latest release of the SAP series
of computer programs, which has been used widely for structural analysis. The ongoing
5
usage of the program and continuing program upgrades are strong indicators that most
program bugs have been identified and corrected (3). This program was selected as it is a
well-known and accepted finite analysis program and the investigators had prior
knowledge of the program. A comprehensive series of verification examples are
provided with the software (4).
AutoCAD 2002, a computer aided drawing program, was used to prepare
drawings. This program was developed by Autodesk Incorporated (5).
PCACOL V3, a concrete analysis program, was used to obtain interaction
diagrams and to analyze the sections of the members. This program was developed by
the Portland Cement Association (6). Version 3 is the latest edition of PCACOL and was
developed in 1999. This version is based on the 1995 edition of ACI 318 code. The
basic analysis equations did not change after this edition.
1.7 Thesis Layout
An introduction, general remarks and objectives are given in Chapter 1. General
background of transportation systems, specifically highway transportation, and design
specifications in Turkey are presented in Chapter 2. Chapter 3 compares Turkish
material and design specifications with the ones used in the United States. Chapter 4
presents the analysis of an open spandrel arch bridge in Turkey. Chapter 5 presents the
analysis of a concrete slab, steel I-Girder bridge. The analysis of a simple span
reinforced concrete T-Girder bridge is presented in Chapter 6. Chapter 7 includes a
comparison and discussion of the results. Additionally, an inventory card example of a
bridge in Turkey is presented in Appendix A. Appendix B presents live load truck
geometries of Turkish and American specifications. Computer output diagrams of the
6
Birecik Bridge are presented in Appendix C. Appendix D and Appendix E present
pictures of the Birecik and Candir Bridges, respectively.
1.8 Disclaimer
This research study analyzed three selected Turkish bridges focusing on the live
load, the dead load and the impact only. Other possible loads were not considered.
Assumptions were made in order to complete the analysis, when actual conditions were
unavailable. If the design drawings were available, it was assumed that the bridges had
been constructed perfectly according to the drawings. Considerable resources have been
expended to complete the analyses and to assess the capacities of the bridges according to
these assumptions. The results obtained from this research study do not necessarily show
the actual conditions of the bridges. More accurate and dependable results could be
obtained by conducting nondestructive and/or destructive tests, field investigations, and
actual measurements of the bridges.
7
Chapter 2: General Background
2.1 Turkish Transportation System
The Ministry of Transportation is responsible for Turkish Railways, Airports and
Seaports. The General Directorate of Highways, a directorate of Ministry of Public
Works and Settlement, is responsible for the highways and bridges.
2.1.1 Railways
Under the Ottomans, at the end of the 19th century non-Turkish companies
constructed the portion of the Berlin-to-Baghdad railroad that crossed Turkey, as well as
a few other lines used mostly for mining development and the export of agricultural
products. During the first decades of the Turkish Republic, track length was increased
from 4,018 km (2,497 mile) in 1923 to 7,324 km (4,551 mile) in 1950. As of today, the
total length of the main railway network is 8,607 km (5,348 mile). Although rail lines
linked most important cities, there were few cross connections between lines, and routes
were often circuitous. As a result of increased use of trucks, the railroads carry only one-
quarter of surface freight, mostly long-haul bulk commodities (7). There are more than
24,000 bridges along Turkish Railways, 92 percent of which were constructed more than
40 years ago. Half of all bridges were constructed during the first twenty years of the
Turkish Republic, between 1920-1940. For construction materials, Turkish Standards
(TS-500, TS-708) are being used. The specification used for design and loading criteria
is the German Specification for Design of Railways (8).
8
2.1.2 Airports
Turkey has 105 airports, sixty-nine of which have paved runways, and twenty of
which are international (7). The main four international airports are located in Istanbul,
Ankara, Izmir and Antalya. In 2000, the total number of passengers carried to, from, or
within Turkey on all airlines reached about 35 million.
2.1.3 Seaports
Turkey has a coastline of 8,333 km (5,178 mile). Istanbul, the most important
port, is followed by Mersin, Izmir, Iskenderun, and Kocaeli. The major seaports are
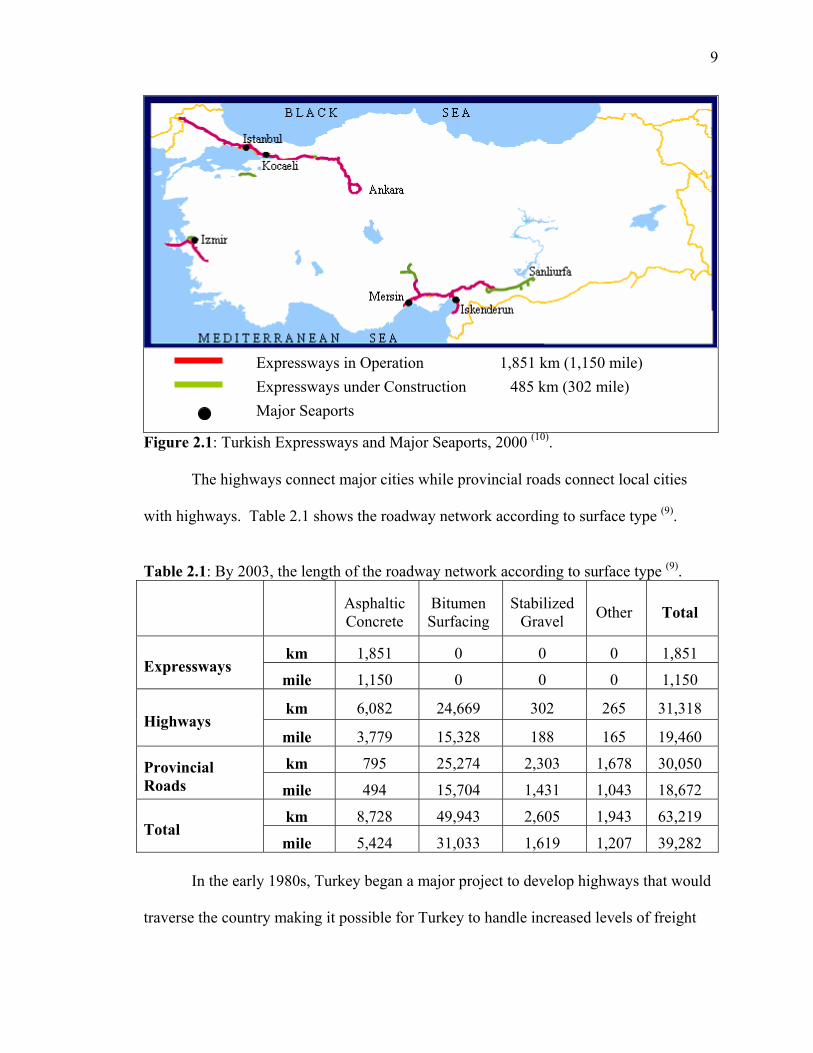
shown in Figure 2.1. Shipping is much less important than land transport, but its volume
has expanded rapidly in the early 1990s. Other than the ferry across the Lake Van,
internal shipping is insignificant because few rivers in Turkey are navigable (7).
2.1.4 Roadways
After World War II, transportation development concentrated on the roadway
network system (7). As a result, by 2003 Turkey has nearly 63,219 km (39,283 mile) of
all-weather highways, of which about 92.8 percent is paved. These roads can be
classified as expressways, highways, and provincial roads controlled by the GDH (9).
There are also some 300,000 km (186,000 mile) of dirt roads in rural areas, which are
controlled by the Ministry of Cultivation and Village Affairs. GDH is not responsible for
the construction or maintenance of these roads. The main expressway is the one
connecting Europe-Istanbul-Ankara. A map showing the expressway network is given in
Figure 2.1.
9
Figure 2.1: Turkish Expressways and Major Seaports, 2000 (10).
The highways connect major cities while provincial roads connect local cities
with highways. Table 2.1 shows the roadway network according to surface type (9).
Table 2.1: By 2003, the length of the roadway network according to surface type (9).
Asphaltic Concrete
Bitumen Surfacing
Stabilized Gravel Other Total
km 1,851 0 0 0 1,851 Expressways
mile 1,150 0 0 0 1,150
km 6,082 24,669 302 265 31,318 Highways
mile 3,779 15,328 188 165 19,460
km 795 25,274 2,303 1,678 30,050 Provincial Roads mile 494 15,704 1,431 1,043 18,672
km 8,728 49,943 2,605 1,943 63,219 Total
mile 5,424 31,033 1,619 1,207 39,282
In the early 1980s, Turkey began a major project to develop highways that would
traverse the country making it possible for Turkey to handle increased levels of freight
Expressways in Operation 1,851 km (1,150 mile) Expressways under Construction 485 km (302 mile) Major Seaports
10
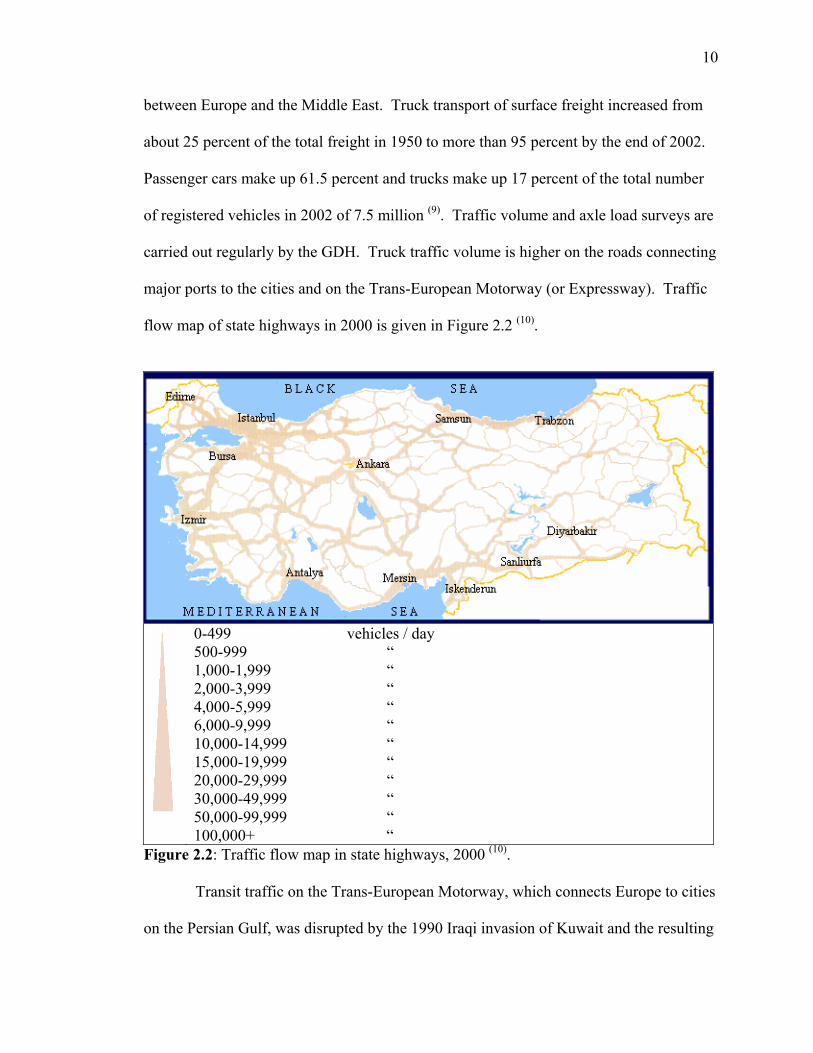
between Europe and the Middle East. Truck transport of surface freight increased from
about 25 percent of the total freight in 1950 to more than 95 percent by the end of 2002.
Passenger cars make up 61.5 percent and trucks make up 17 percent of the total number
of registered vehicles in 2002 of 7.5 million (9). Traffic volume and axle load surveys are
carried out regularly by the GDH. Truck traffic volume is higher on the roads connecting
major ports to the cities and on the Trans-European Motorway (or Expressway). Traffic
flow map of state highways in 2000 is given in Figure 2.2 (10).
0-499 vehicles / day 500-999 “ 1,000-1,999 “ 2,000-3,999 “ 4,000-5,999 “ 6,000-9,999 “ 10,000-14,999 “ 15,000-19,999 “ 20,000-29,999 “ 30,000-49,999 “ 50,000-99,999 “ 100,000+ “
Figure 2.2: Traffic flow map in state highways, 2000 (10).
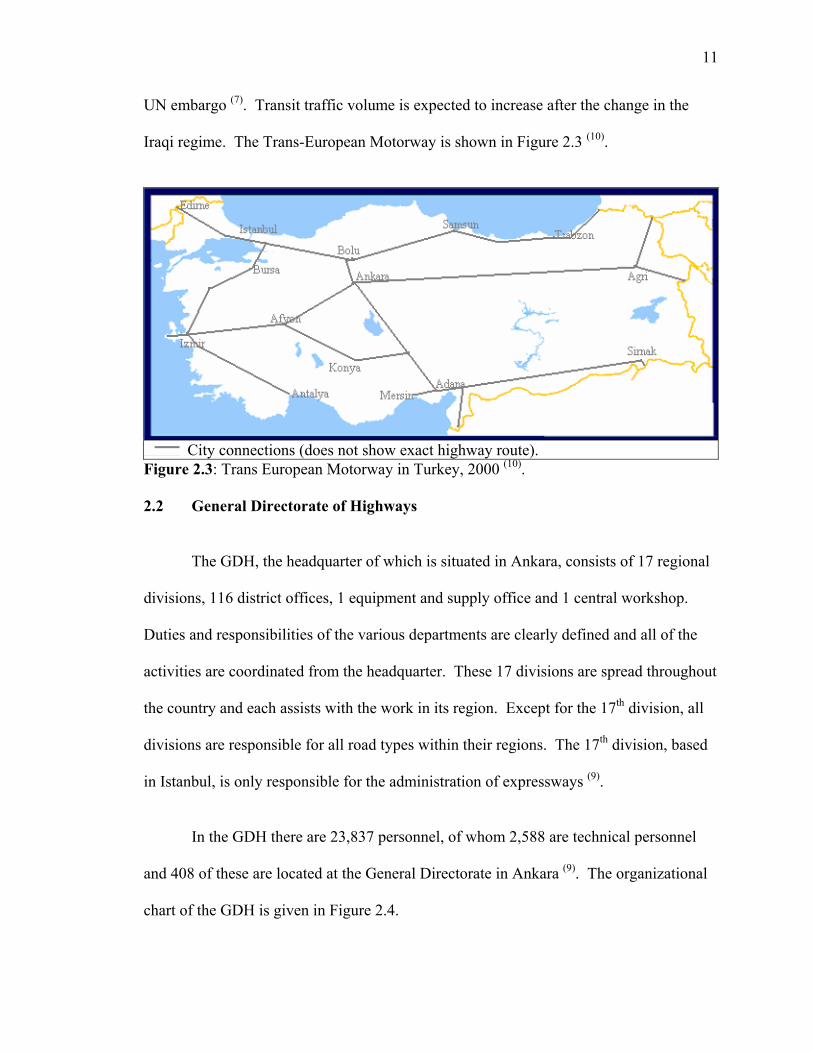
Transit traffic on the Trans-European Motorway, which connects Europe to cities
on the Persian Gulf, was disrupted by the 1990 Iraqi invasion of Kuwait and the resulting
11
UN embargo (7). Transit traffic volume is expected to increase after the change in the
Iraqi regime. The Trans-European Motorway is shown in Figure 2.3 (10).
City connections (does not show exact highway route). Figure 2.3: Trans European Motorway in Turkey, 2000 (10). 2.2 General Directorate of Highways
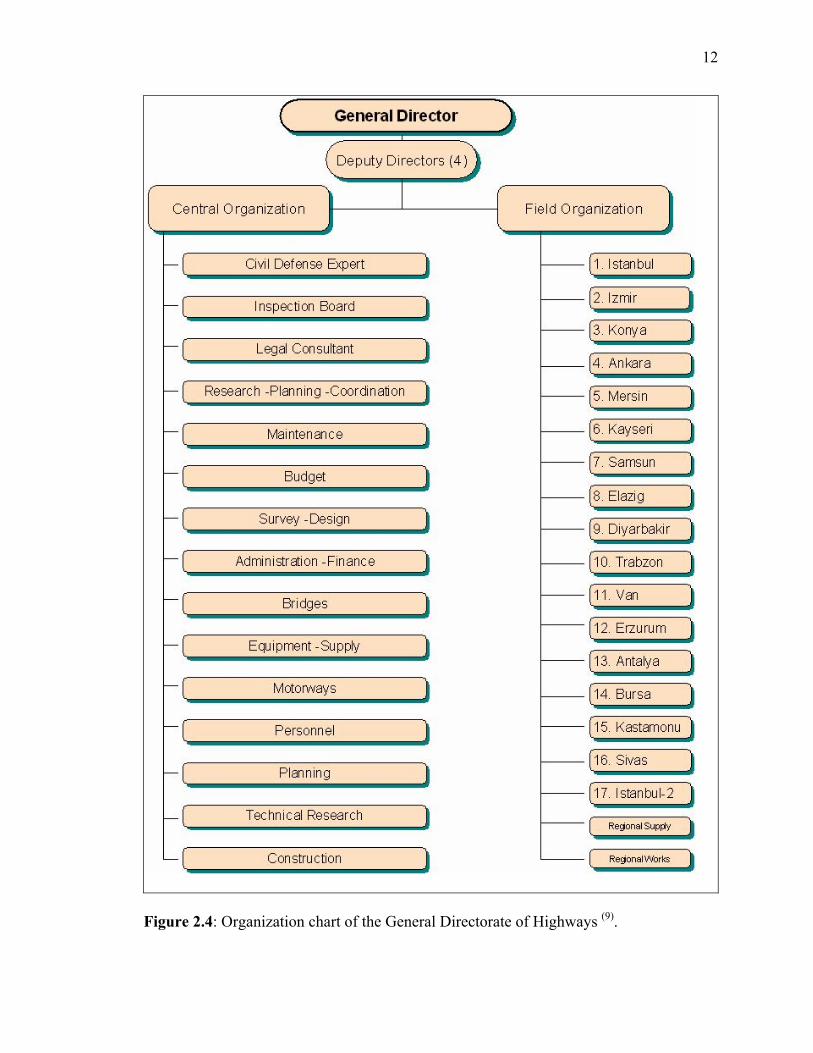
The GDH, the headquarter of which is situated in Ankara, consists of 17 regional
divisions, 116 district offices, 1 equipment and supply office and 1 central workshop.
Duties and responsibilities of the various departments are clearly defined and all of the
activities are coordinated from the headquarter. These 17 divisions are spread throughout
the country and each assists with the work in its region. Except for the 17th division, all
divisions are responsible for all road types within their regions. The 17th division, based
in Istanbul, is only responsible for the administration of expressways (9).
In the GDH there are 23,837 personnel, of whom 2,588 are technical personnel
and 408 of these are located at the General Directorate in Ankara (9). The organizational
chart of the GDH is given in Figure 2.4.
12
Figure 2.4: Organization chart of the General Directorate of Highways (9).
13
The GDH is a public institution which is funded primarily through the general
budget of Turkish Government, but also has supplementary budget contributions. In
each fiscal year, the Parliament allocates the general budget for each department in
accordance with the policies of government and the investment plans. Each year, the
GDH collates all the projected expenditure requirements from the 17 regional divisions
for necessity and emergency evaluation. The budget is apportioned according to this
evaluation (9).
Due to the present economic crisis in Turkey, the GDH is facing budgetary
problems. Due to inadequate allocations from the general budget, external resources
from international finance institutions, such as the World Bank and European Investment
Bank, are used for the construction of feasible bridges (9).
Another preferred type of funding is private financing via the Built-Operate-
Transfer (BOT) model (9). In the BOT model, local or foreign companies finance and
construct bridges using their own resources. They then operate the bridges for a certain
period of time, to pay of the debt, repay the equity, and then transfer the bridge to the
government at the end of a concession period at no cost to the government (11).
2.3 Present Condition of Bridges
By the end of 1950 there were 1,028 bridges with a total length of 34 kilometers
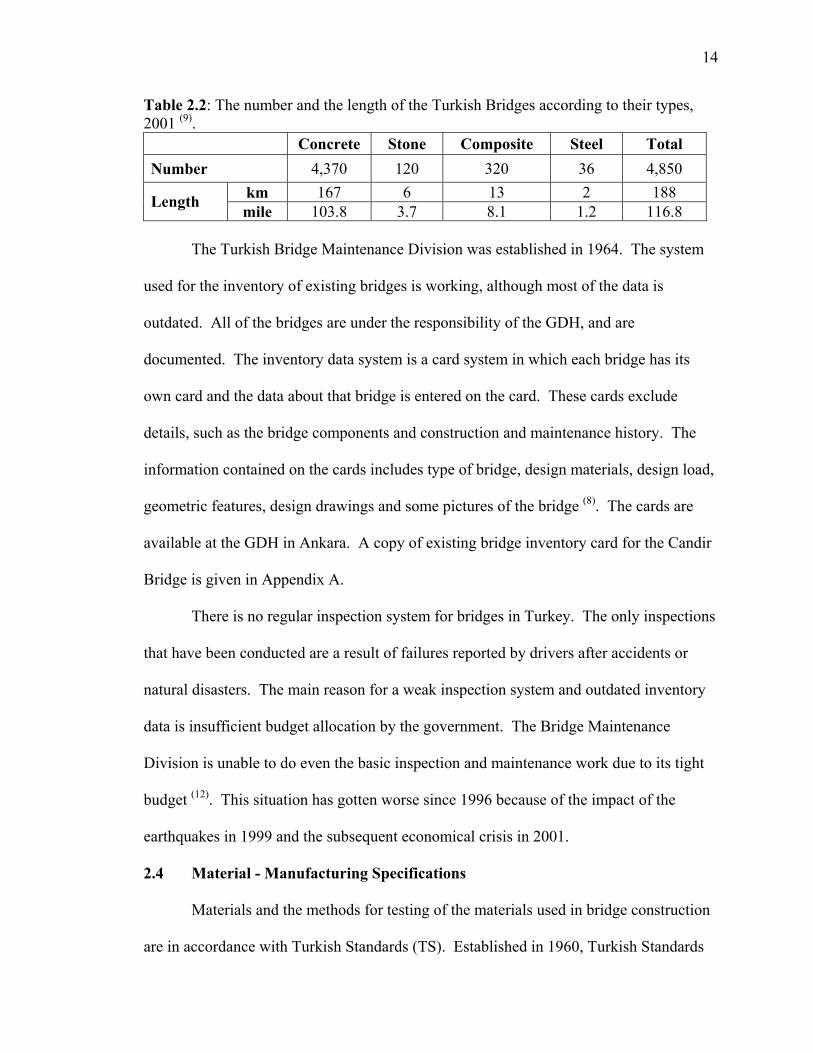
(21 miles) in Turkey. The Table 2.2 shows the number and total length of the existing
bridges according to their types by 2001 (9).
14
Table 2.2: The number and the length of the Turkish Bridges according to their types, 2001 (9). Concrete Stone Composite Steel Total Number 4,370 120 320 36 4,850
km 167 6 13 2 188 Length mile 103.8 3.7 8.1 1.2 116.8
The Turkish Bridge Maintenance Division was established in 1964. The system
used for the inventory of existing bridges is working, although most of the data is
outdated. All of the bridges are under the responsibility of the GDH, and are
documented. The inventory data system is a card system in which each bridge has its
own card and the data about that bridge is entered on the card. These cards exclude
details, such as the bridge components and construction and maintenance history. The
information contained on the cards includes type of bridge, design materials, design load,
geometric features, design drawings and some pictures of the bridge (8). The cards are
available at the GDH in Ankara. A copy of existing bridge inventory card for the Candir
Bridge is given in Appendix A.
There is no regular inspection system for bridges in Turkey. The only inspections
that have been conducted are a result of failures reported by drivers after accidents or
natural disasters. The main reason for a weak inspection system and outdated inventory
data is insufficient budget allocation by the government. The Bridge Maintenance
Division is unable to do even the basic inspection and maintenance work due to its tight
budget (12). This situation has gotten worse since 1996 because of the impact of the
earthquakes in 1999 and the subsequent economical crisis in 2001.
2.4 Material - Manufacturing Specifications
Materials and the methods for testing of the materials used in bridge construction
are in accordance with Turkish Standards (TS). Established in 1960, Turkish Standards

15
Institution (TSI) has published a considerable number of standards covering the use,
manufacturing, and testing of materials. The development of TS has been primarily
adapted from publications of the American Association of State Highway Officials
(AASHO), and American Society for Testing and Materials (ASTM). To enable Turkish
products to be exported to the other countries, such as European countries, the materials
produced in Turkey according to TS are also in compliance with the standards of other
countries, such as European Standards, and Euro Norm (12).
Most of the construction materials, such as cement, steel rebars and prestressing
strands, are produced in Turkey. Some manufacturers have International Standards
Organization 9001 (ISO 9001) certification. Ready-mix concrete, produced according to
Turkish Standards, is available for construction. In recent years, there has been an
increase in the construction of precast and prestressed concrete bridges. Fabricated steel
bridges are not very popular due to the higher capital costs associated with steel
construction and the high costs related to the maintenance of steel bridges. Facilities for
fabrication of steel bridges are available (12).
2.5 Design Specifications
The GDH is responsible for the design of all State Highway and Expressway
bridges except for those which are funded by the World Bank. Projects funded by the
World Bank are based on selection criteria of a consulting engineering firm, identified by
the rules of the Bank. The Technical Specifications for Road Bridges (TSRB), published
(in Turkish) in 1982, is the main specification for design of highway bridges. (13) TSRB
was adopted from AASHTO-SSHB 1977. It includes requirements for the design
loading, load distribution, and allowable limits for the various types of construction
16
materials such as timber, concrete and steel (13). If the bridge is in a seismic zone, the
GDH requires the use of AASHTO- Standard Specifications for Seismic Design of
Highway Bridges (AASHTO-SDHB). If it is a special bridge or the span is ‘very long’
(although the limit is not defined), it is required to be designed to a foreign specification
decided by the GDH (12). For most of the bridges, the TSRB is only used for the loading
and geometric criteria while AASHTO-SSHB / AASHTO-SDHB is used for all other
requirements (12).
Engineering Works Criteria Report (EWCR), which was published (in Turkish)
by the GDH in 1997, is a reference that gives general criteria and requirements for the
construction of bridges. This report requires that “Unless otherwise stated, all bridges
shall be designed according to the latest edition of AASHTO-SSHB or AASHTO-
SDHB” (14). This report also covers the properties of construction materials, such as
concrete, steel and prestressing strands.
Standard Bridge Types, published (in Turkish) by the GDH in 1953, is a reference
for the design of reinforced concrete bridges. The concrete used in these bridges was
required to have compression strength of 22.1 MPa (3,200 psi). The steel type was ST37.
The live load for the design was HS20. It only covered simple span T-Girder bridges. It
included all the reinforcement and formwork details for both the substructure and the
superstructure for which maximum span length was 15.70 m (51.5 ft) (15).
17
CHAPTER 3: Comparison of Turkish and American Specifications
3.1 Materials
The properties of materials to be used in construction of bridges are defined in the
TS, published by TSI. If a material is not found in the TS, the GDH recommends the use
of a relevant foreign standard (12). The design values for concrete, steel and prestressing
strands in the TS are compared to the values used in the United States in the following
subsections.
3.1.1 Specified Concrete Properties
The concrete used in Turkish bridges until the 1980s had a 28-day compressive
strength of 22.1 MPa (3,200 psi) (15). As ready mixed concrete was not common during
the construction of older bridges, the compressive strength of concrete prepared at the site
would have varied for these bridges.
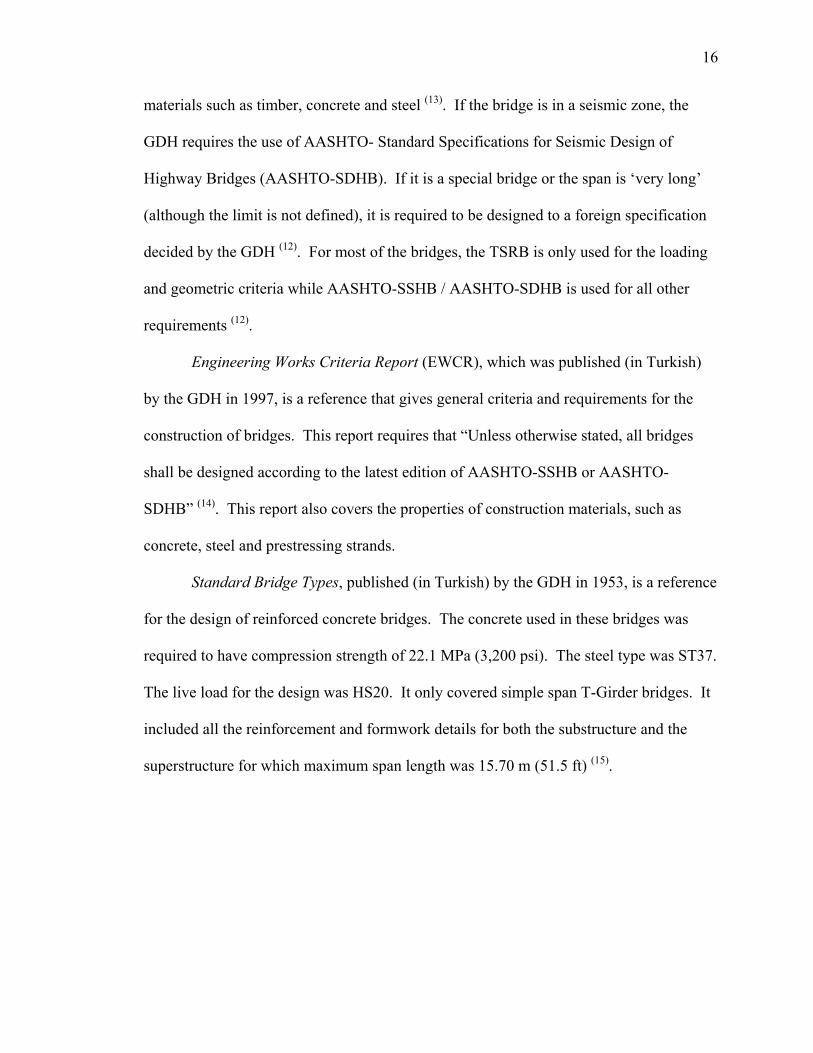
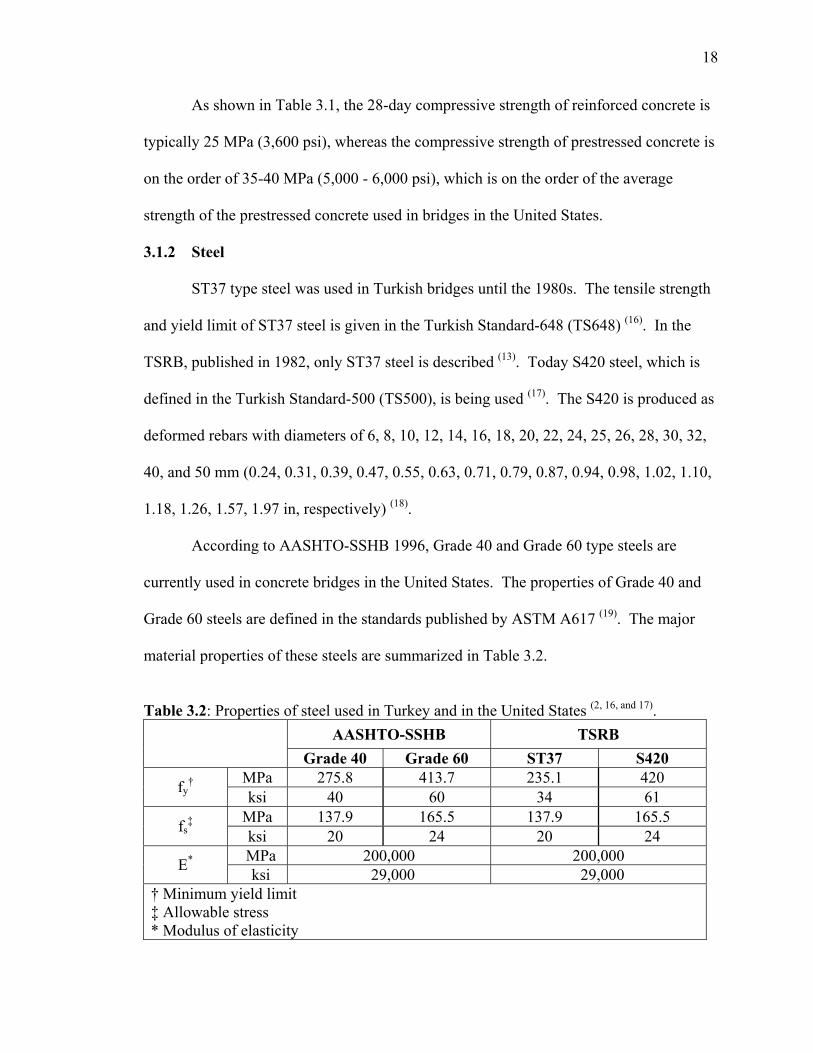
Table 3.1 shows the concrete types currently used, and the corresponding
specified compressive strengths for different applications in Turkey (14). Almost all of the
concrete used by the construction industry today is ready mixed concrete.
Table 3.1: The compressive strength of concrete used in Turkey (14). fc'**
Type of Application Designation*
MPa psi Reinforced Concrete: C25 25 3,630 Post-Tensioned Prestressed Concrete C35 35 5,080 Precast Prestressed Concrete C40 40 5,800 * C stands for concrete and the number following C represents the specified
compressive strength of the concrete in Mega Pascal after 28 days. ** Compressive strength of concrete at 28 days.
18
As shown in Table 3.1, the 28-day compressive strength of reinforced concrete is
typically 25 MPa (3,600 psi), whereas the compressive strength of prestressed concrete is
on the order of 35-40 MPa (5,000 - 6,000 psi), which is on the order of the average
strength of the prestressed concrete used in bridges in the United States.
3.1.2 Steel
ST37 type steel was used in Turkish bridges until the 1980s. The tensile strength
and yield limit of ST37 steel is given in the Turkish Standard-648 (TS648) (16). In the
TSRB, published in 1982, only ST37 steel is described (13). Today S420 steel, which is
defined in the Turkish Standard-500 (TS500), is being used (17). The S420 is produced as
deformed rebars with diameters of 6, 8, 10, 12, 14, 16, 18, 20, 22, 24, 25, 26, 28, 30, 32,
40, and 50 mm (0.24, 0.31, 0.39, 0.47, 0.55, 0.63, 0.71, 0.79, 0.87, 0.94, 0.98, 1.02, 1.10,
1.18, 1.26, 1.57, 1.97 in, respectively) (18).
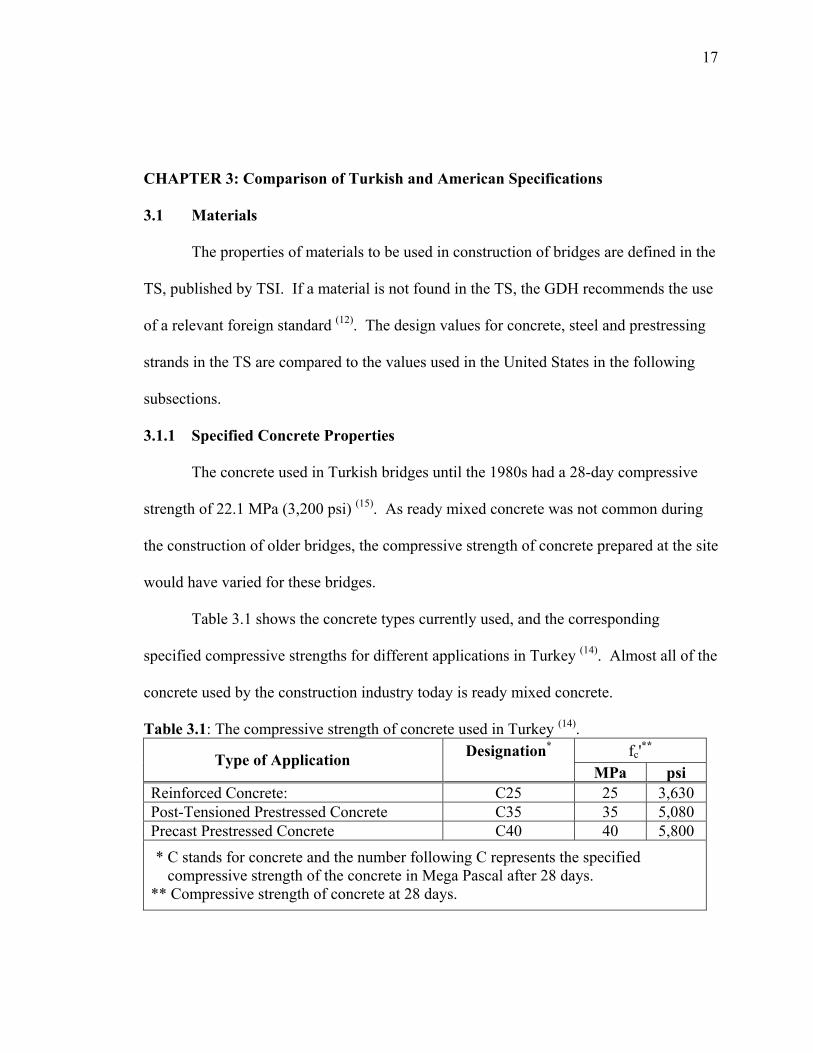
According to AASHTO-SSHB 1996, Grade 40 and Grade 60 type steels are
currently used in concrete bridges in the United States. The properties of Grade 40 and
Grade 60 steels are defined in the standards published by ASTM A617 (19). The major
material properties of these steels are summarized in Table 3.2.
Table 3.2: Properties of steel used in Turkey and in the United States (2, 16, and 17).
AASHTO-SSHB TSRB Grade 40 Grade 60 ST37 S420
MPa 275.8 413.7 235.1 420 fy†
ksi 40 60 34 61 MPa 137.9 165.5 137.9 165.5 fs
‡
ksi 20 24 20 24 MPa 200,000 200,000 E* ksi 29,000 29,000
† Minimum yield limit ‡ Allowable stress * Modulus of elasticity
19
As seen in Table 3.2, the same modulus of elasticity is used in both specifications.
Yield limit of S420 steel is 61 ksi, which is almost the same as the yield limit of Grade 60
steel. Allowable stresses for Grade 60 and S420 are equal. Although allowable stresses
for ST37 steel and Grade 40 steel are equal, the yield limit of Grade 40 steel is about
fifteen percent higher than that of ST37 steel.
3.1.3 Prestressing Strand
For prestressed concrete bridges, Low Relaxation 7-strand Grade 270, which has
a minimum yield limit of 1,861 MPa (270 ksi), is being used in Turkey (14). The nominal
diameters of these strands are 12.7 mm (0.5 in) or 15.2 mm (0.6 in) (14). The same strand
had been used before 1997. The properties of this strand are defined in ASTM A416 (20).
3.2 Loading
In both AASHTO-SSHB and TSRB, structures are designed to carry dead load,
live load, impact of the live load, and wind loads. Bridges are also designed for
longitudinal forces, centrifugal forces, thermal forces, earth pressure, buoyancy,
shrinkage stresses, rib shortening, erection stresses, ice and current pressure, and
earthquake stresses, when they exist.
3.2.1 Dead Load
Table 3.3 shows the comparison of the weights of the main materials to be used in
computing the dead load of a structure according to AASHTO-SSHB and TSRB. As
shown in Table 3.3, unit weights of steel and aluminum are the same in both standards.
Unit weight of cast iron is slightly different due to conversion from U.S. customary units
to International System of Units (SI). AASHTO-SSHB gives the unit weight of wood as
801 kg/m3 (50 pcf); however, in TSRB it varies between 650-1,000 kg/m3 (41-62 pcf),
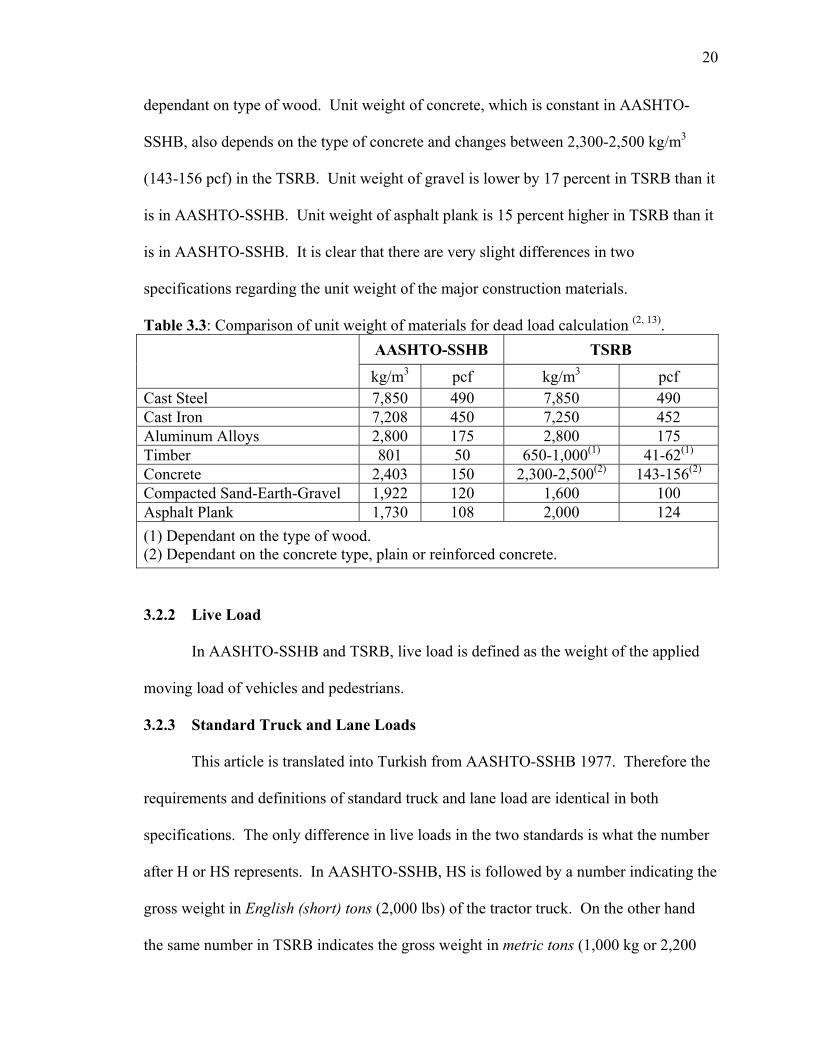
20
dependant on type of wood. Unit weight of concrete, which is constant in AASHTO-
SSHB, also depends on the type of concrete and changes between 2,300-2,500 kg/m3
(143-156 pcf) in the TSRB. Unit weight of gravel is lower by 17 percent in TSRB than it
is in AASHTO-SSHB. Unit weight of asphalt plank is 15 percent higher in TSRB than it
is in AASHTO-SSHB. It is clear that there are very slight differences in two
specifications regarding the unit weight of the major construction materials.
Table 3.3: Comparison of unit weight of materials for dead load calculation (2, 13). AASHTO-SSHB TSRB
kg/m3 pcf kg/m3 pcf
Cast Steel 7,850 490 7,850 490 Cast Iron 7,208 450 7,250 452 Aluminum Alloys 2,800 175 2,800 175 Timber 801 50 650-1,000(1) 41-62(1) Concrete 2,403 150 2,300-2,500(2) 143-156(2) Compacted Sand-Earth-Gravel 1,922 120 1,600 100 Asphalt Plank 1,730 108 2,000 124 (1) Dependant on the type of wood. (2) Dependant on the concrete type, plain or reinforced concrete.
3.2.2 Live Load
In AASHTO-SSHB and TSRB, live load is defined as the weight of the applied
moving load of vehicles and pedestrians.
3.2.3 Standard Truck and Lane Loads
This article is translated into Turkish from AASHTO-SSHB 1977. Therefore the
requirements and definitions of standard truck and lane load are identical in both
specifications. The only difference in live loads in the two standards is what the number
after H or HS represents. In AASHTO-SSHB, HS is followed by a number indicating the
gross weight in English (short) tons (2,000 lbs) of the tractor truck. On the other hand
the same number in TSRB indicates the gross weight in metric tons (1,000 kg or 2,200
21
lbs) of the standard truck. This is similar for the H truck and lane loading; therefore, any
load in TSRB is 10 percent heavier than its equivalent in AASHTO-SSHB.
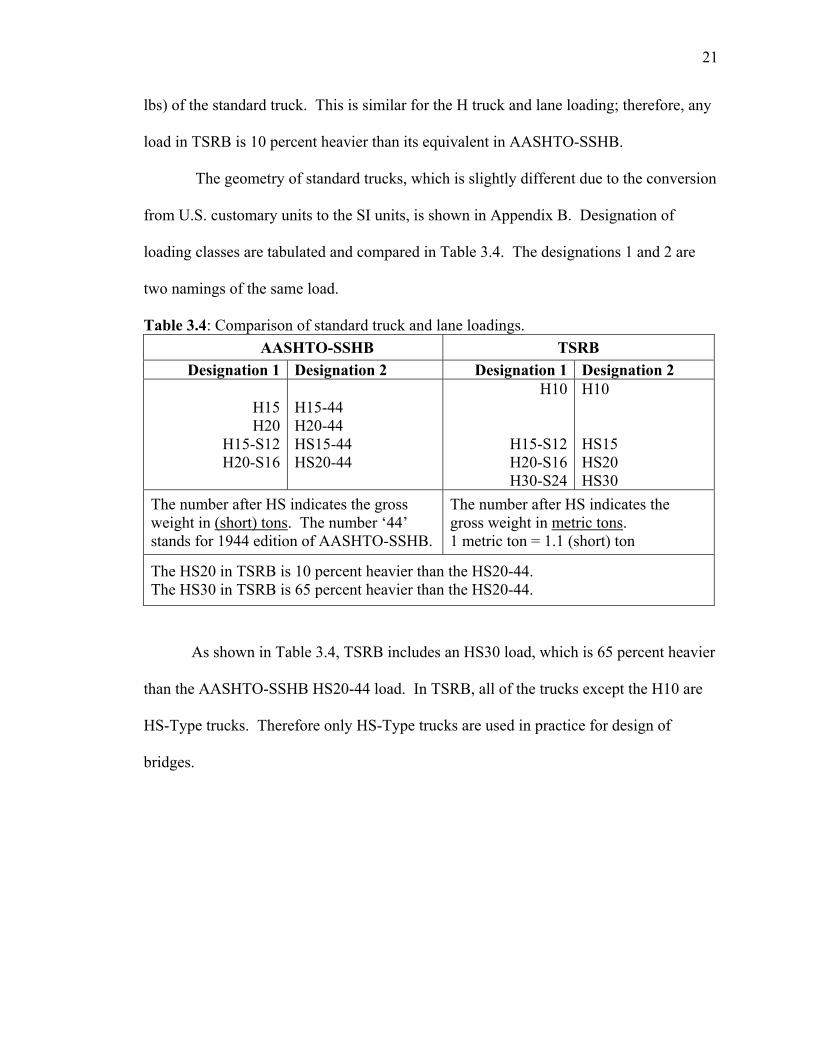
The geometry of standard trucks, which is slightly different due to the conversion
from U.S. customary units to the SI units, is shown in Appendix B. Designation of
loading classes are tabulated and compared in Table 3.4. The designations 1 and 2 are
two namings of the same load.
Table 3.4: Comparison of standard truck and lane loadings. AASHTO-SSHB TSRB
Designation 1 Designation 2 Designation 1 Designation 2
H15 H20
H15-S12 H20-S16
H15-44 H20-44 HS15-44 HS20-44
H10
H15-S12H20-S16H30-S24
H10 HS15 HS20 HS30
The number after HS indicates the gross weight in (short) tons. The number ‘44’ stands for 1944 edition of AASHTO-SSHB.
The number after HS indicates the gross weight in metric tons. 1 metric ton = 1.1 (short) ton
The HS20 in TSRB is 10 percent heavier than the HS20-44. The HS30 in TSRB is 65 percent heavier than the HS20-44.
As shown in Table 3.4, TSRB includes an HS30 load, which is 65 percent heavier
than the AASHTO-SSHB HS20-44 load. In TSRB, all of the trucks except the H10 are
HS-Type trucks. Therefore only HS-Type trucks are used in practice for design of
bridges.
22
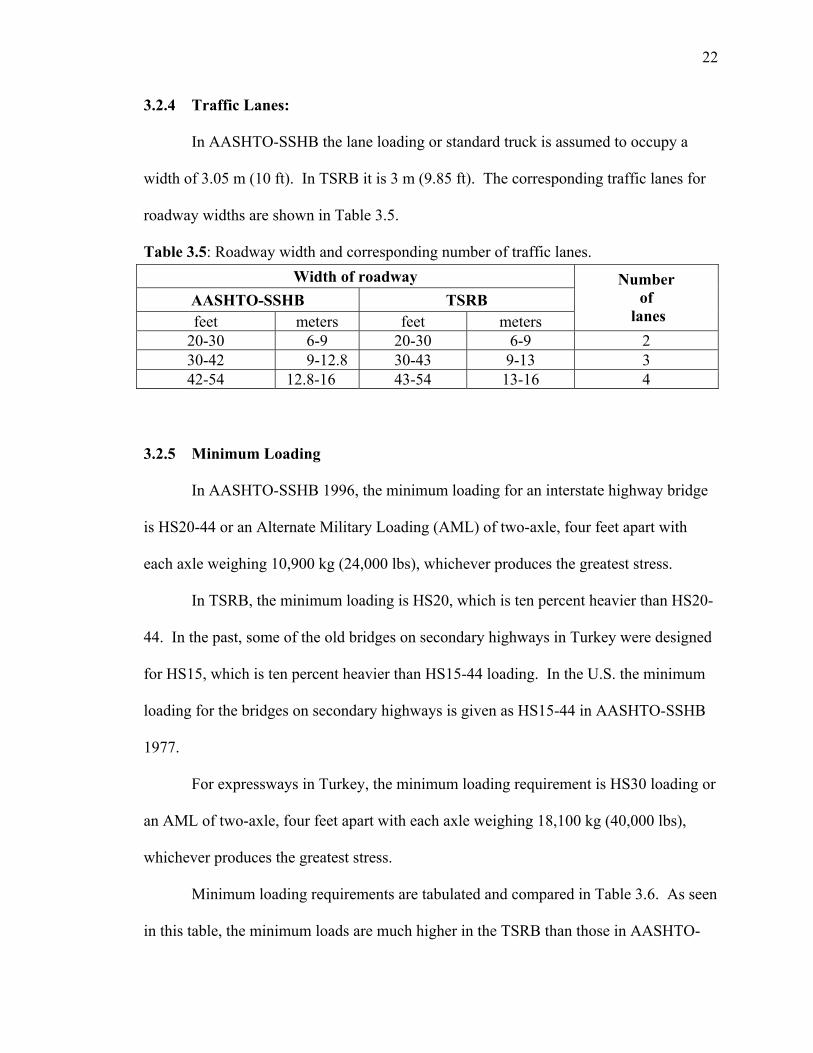
3.2.4 Traffic Lanes:
In AASHTO-SSHB the lane loading or standard truck is assumed to occupy a
width of 3.05 m (10 ft). In TSRB it is 3 m (9.85 ft). The corresponding traffic lanes for
roadway widths are shown in Table 3.5.
Table 3.5: Roadway width and corresponding number of traffic lanes.
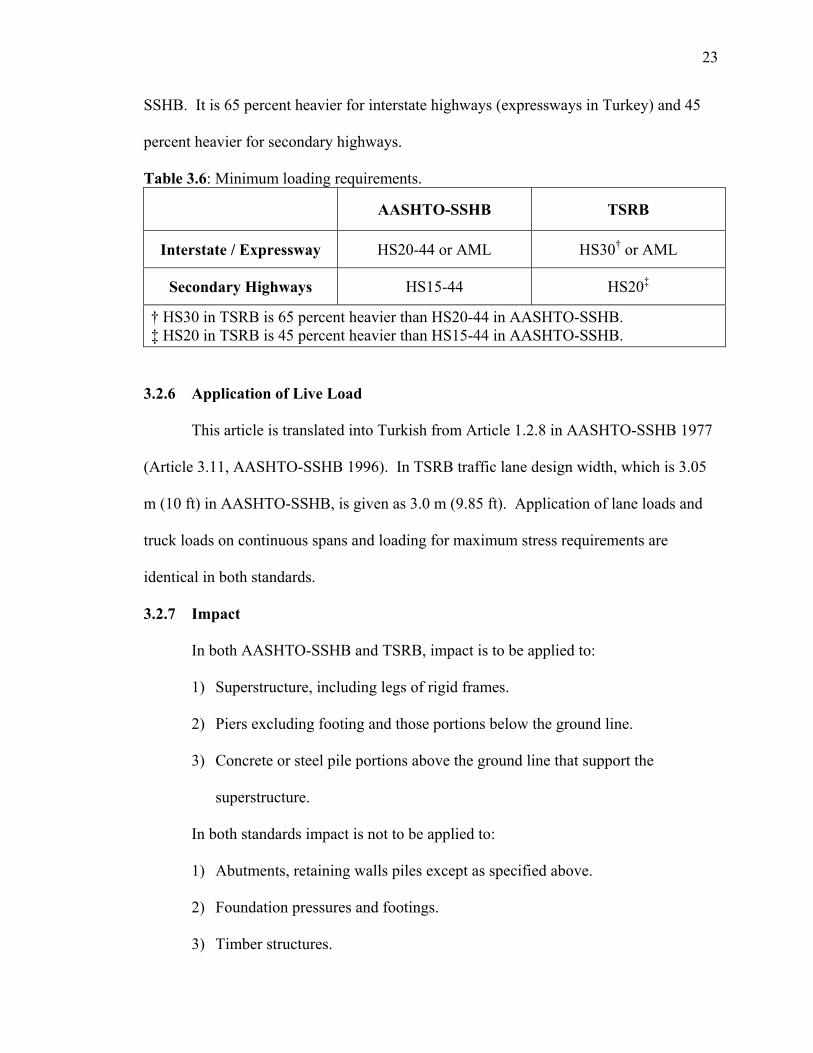
3.2.5 Minimum Loading
In AASHTO-SSHB 1996, the minimum loading for an interstate highway bridge
is HS20-44 or an Alternate Military Loading (AML) of two-axle, four feet apart with
each axle weighing 10,900 kg (24,000 lbs), whichever produces the greatest stress.
In TSRB, the minimum loading is HS20, which is ten percent heavier than HS20-
44. In the past, some of the old bridges on secondary highways in Turkey were designed
for HS15, which is ten percent heavier than HS15-44 loading. In the U.S. the minimum
loading for the bridges on secondary highways is given as HS15-44 in AASHTO-SSHB
1977.
For expressways in Turkey, the minimum loading requirement is HS30 loading or
an AML of two-axle, four feet apart with each axle weighing 18,100 kg (40,000 lbs),
whichever produces the greatest stress.
Minimum loading requirements are tabulated and compared in Table 3.6. As seen
in this table, the minimum loads are much higher in the TSRB than those in AASHTO-
Width of roadway AASHTO-SSHB TSRB feet meters feet meters
Number of
lanes 20-30 6-9 20-30 6-9 2 30-42 9-12.8 30-43 9-13 3 42-54 12.8-16 43-54 13-16 4
23
SSHB. It is 65 percent heavier for interstate highways (expressways in Turkey) and 45
percent heavier for secondary highways.
Table 3.6: Minimum loading requirements.
AASHTO-SSHB TSRB
Interstate / Expressway HS20-44 or AML HS30† or AML
Secondary Highways HS15-44 HS20‡
† HS30 in TSRB is 65 percent heavier than HS20-44 in AASHTO-SSHB. ‡ HS20 in TSRB is 45 percent heavier than HS15-44 in AASHTO-SSHB.
3.2.6 Application of Live Load
This article is translated into Turkish from Article 1.2.8 in AASHTO-SSHB 1977
(Article 3.11, AASHTO-SSHB 1996). In TSRB traffic lane design width, which is 3.05
m (10 ft) in AASHTO-SSHB, is given as 3.0 m (9.85 ft). Application of lane loads and
truck loads on continuous spans and loading for maximum stress requirements are
identical in both standards.
3.2.7 Impact
In both AASHTO-SSHB and TSRB, impact is to be applied to:
1) Superstructure, including legs of rigid frames.
2) Piers excluding footing and those portions below the ground line.
3) Concrete or steel pile portions above the ground line that support the
superstructure.
In both standards impact is not to be applied to:
1) Abutments, retaining walls piles except as specified above.
2) Foundation pressures and footings.
3) Timber structures.
24
4) Sidewalk loads.
5) Culverts and structures having 3 feet or more cover (in TSRB, it is 1 m or 3.28
ft)
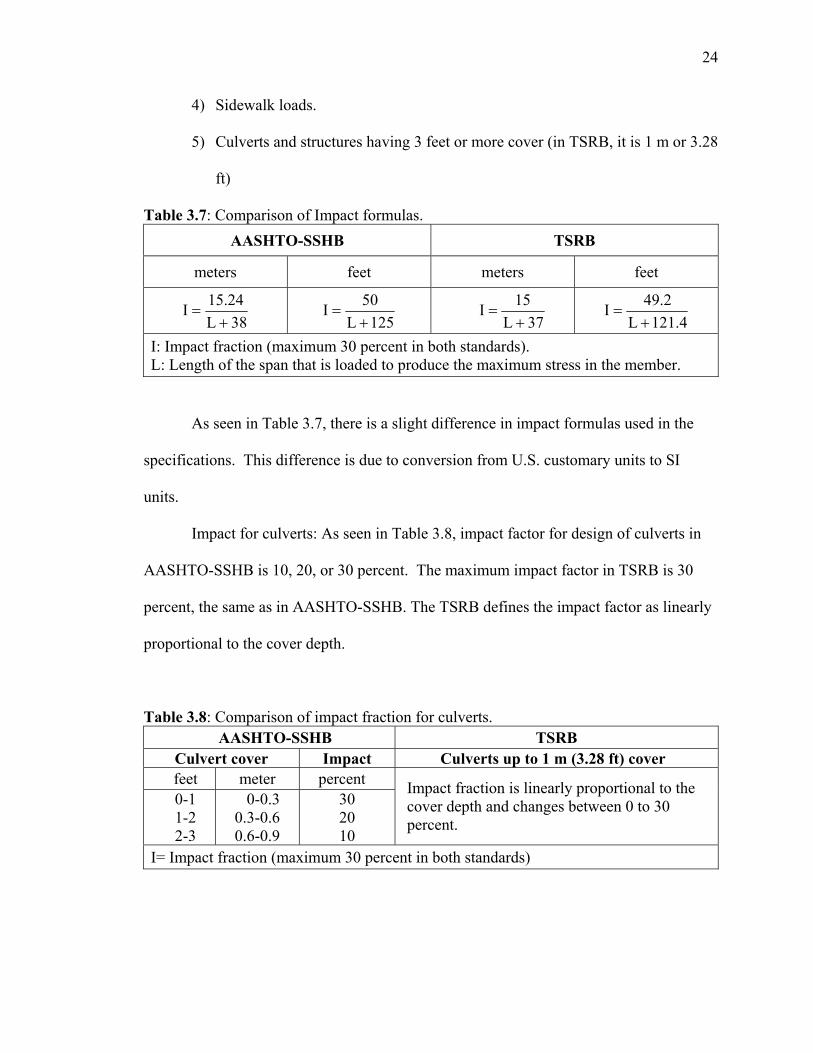
Table 3.7: Comparison of Impact formulas. AASHTO-SSHB TSRB
meters feet meters feet
38L24.15I+
= 125L
50I+
= 37L
15I+
= 4.121L
2.49I+
=
I: Impact fraction (maximum 30 percent in both standards). L: Length of the span that is loaded to produce the maximum stress in the member.
As seen in Table 3.7, there is a slight difference in impact formulas used in the
specifications. This difference is due to conversion from U.S. customary units to SI
units.
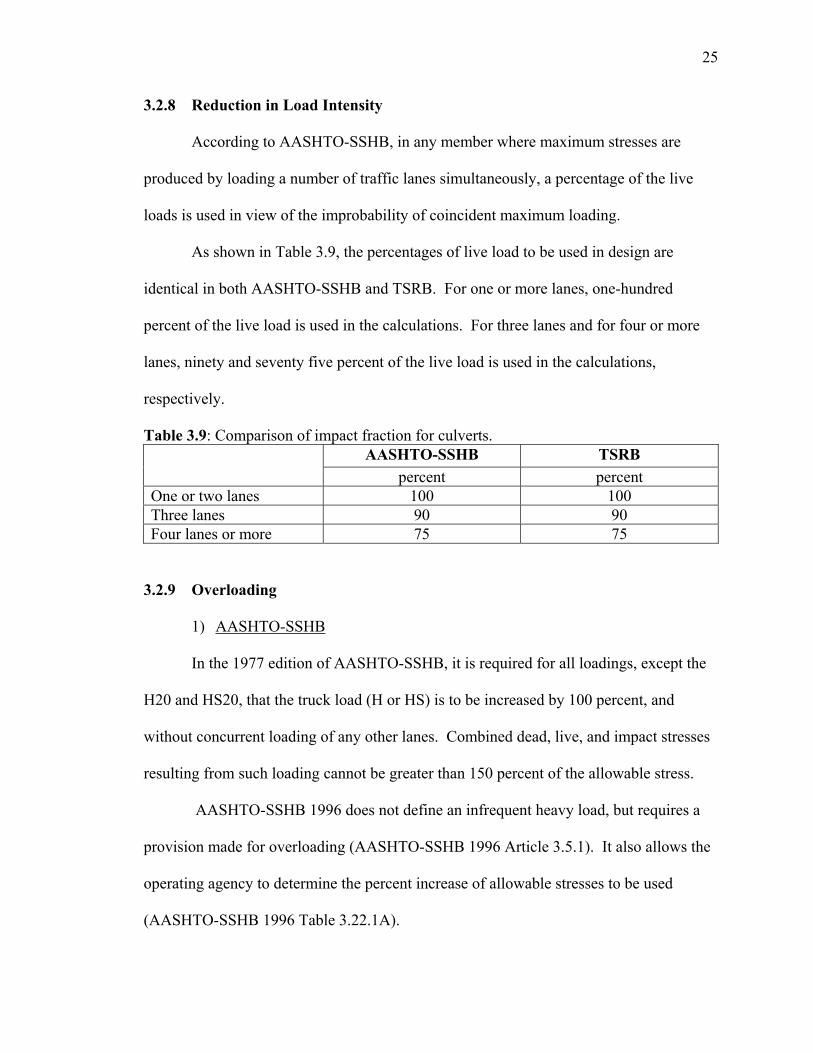
Impact for culverts: As seen in Table 3.8, impact factor for design of culverts in
AASHTO-SSHB is 10, 20, or 30 percent. The maximum impact factor in TSRB is 30
percent, the same as in AASHTO-SSHB. The TSRB defines the impact factor as linearly
proportional to the cover depth.
Table 3.8: Comparison of impact fraction for culverts. AASHTO-SSHB TSRB
Culvert cover Impact Culverts up to 1 m (3.28 ft) cover feet meter percent 0-1 1-2 2-3
0-0.3 0.3-0.6 0.6-0.9
30 20 10
Impact fraction is linearly proportional to the cover depth and changes between 0 to 30 percent.
I= Impact fraction (maximum 30 percent in both standards)
25
3.2.8 Reduction in Load Intensity
According to AASHTO-SSHB, in any member where maximum stresses are
produced by loading a number of traffic lanes simultaneously, a percentage of the live
loads is used in view of the improbability of coincident maximum loading.
As shown in Table 3.9, the percentages of live load to be used in design are
identical in both AASHTO-SSHB and TSRB. For one or more lanes, one-hundred
percent of the live load is used in the calculations. For three lanes and for four or more
lanes, ninety and seventy five percent of the live load is used in the calculations,
respectively.
Table 3.9: Comparison of impact fraction for culverts. AASHTO-SSHB TSRB
percent percent
One or two lanes 100 100 Three lanes 90 90 Four lanes or more 75 75
3.2.9 Overloading
1) AASHTO-SSHB
In the 1977 edition of AASHTO-SSHB, it is required for all loadings, except the
H20 and HS20, that the truck load (H or HS) is to be increased by 100 percent, and
without concurrent loading of any other lanes. Combined dead, live, and impact stresses
resulting from such loading cannot be greater than 150 percent of the allowable stress.
AASHTO-SSHB 1996 does not define an infrequent heavy load, but requires a
provision made for overloading (AASHTO-SSHB 1996 Article 3.5.1). It also allows the
operating agency to determine the percent increase of allowable stresses to be used
(AASHTO-SSHB 1996 Table 3.22.1A).
26
The overloading provision in AASHTO-SSHB is only for bridges designed for
loading less than the H20, which is not applicable today. Therefore, most states have
made their own provisions for overloading and design their bridges according to some
infrequent heavy vehicles defined in their local specifications.
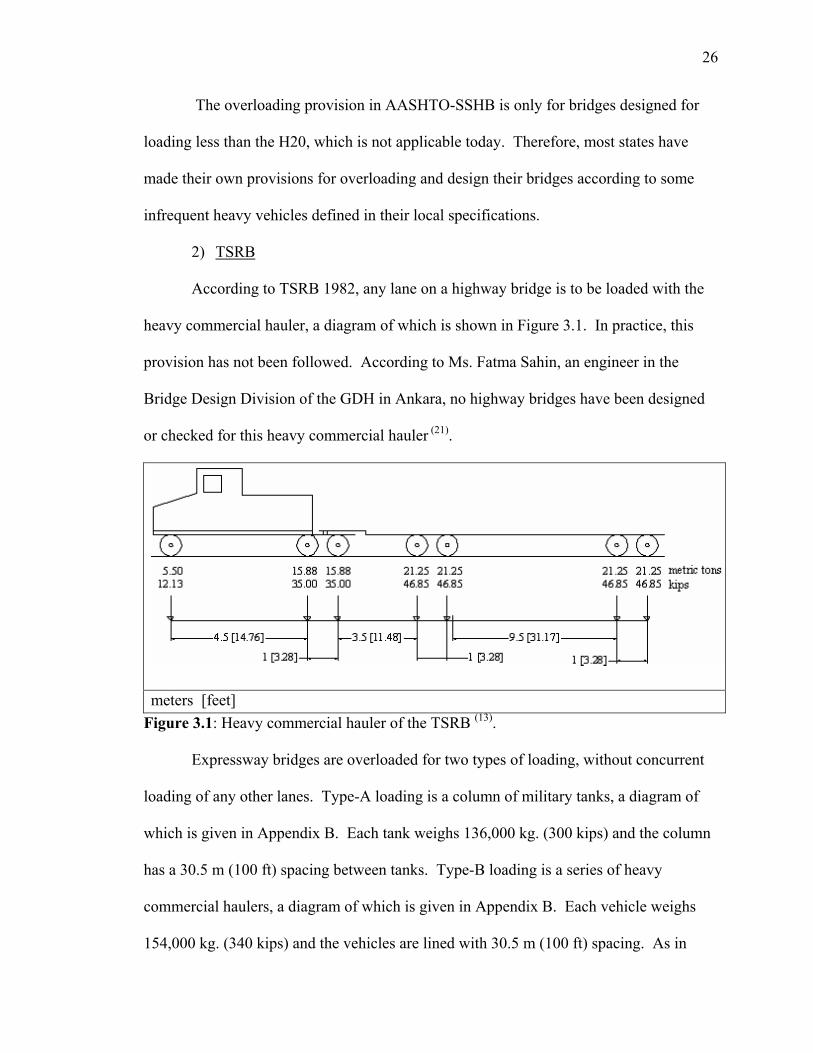
2) TSRB
According to TSRB 1982, any lane on a highway bridge is to be loaded with the
heavy commercial hauler, a diagram of which is shown in Figure 3.1. In practice, this
provision has not been followed. According to Ms. Fatma Sahin, an engineer in the
Bridge Design Division of the GDH in Ankara, no highway bridges have been designed
or checked for this heavy commercial hauler (21).
meters [feet] Figure 3.1: Heavy commercial hauler of the TSRB (13).
Expressway bridges are overloaded for two types of loading, without concurrent
loading of any other lanes. Type-A loading is a column of military tanks, a diagram of
which is given in Appendix B. Each tank weighs 136,000 kg. (300 kips) and the column
has a 30.5 m (100 ft) spacing between tanks. Type-B loading is a series of heavy
commercial haulers, a diagram of which is given in Appendix B. Each vehicle weighs
154,000 kg. (340 kips) and the vehicles are lined with 30.5 m (100 ft) spacing. As in
27
AASHTO-SSHB, combined dead, live, and impact stresses resulting from such loadings
are limited to no more than 150 percent of the allowable stresses.
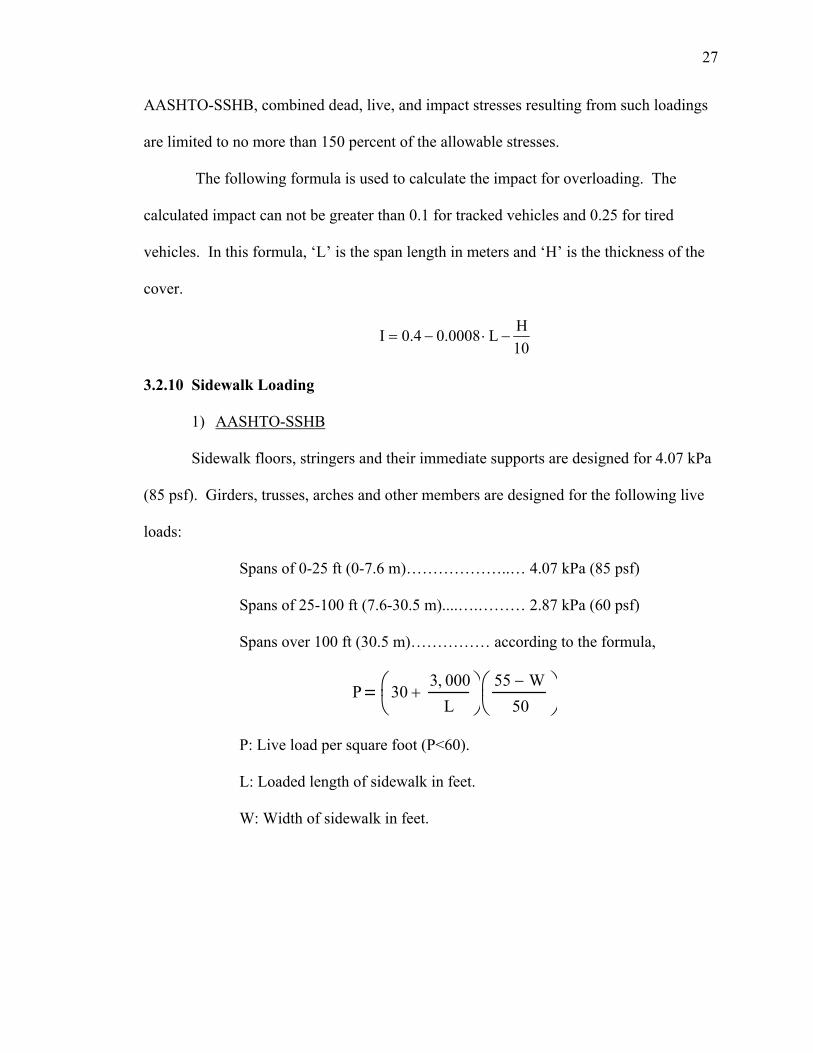
The following formula is used to calculate the impact for overloading. The
calculated impact can not be greater than 0.1 for tracked vehicles and 0.25 for tired
vehicles. In this formula, ‘L’ is the span length in meters and ‘H’ is the thickness of the
cover.
10HL0008.04.0I −⋅−=
3.2.10 Sidewalk Loading
1) AASHTO-SSHB
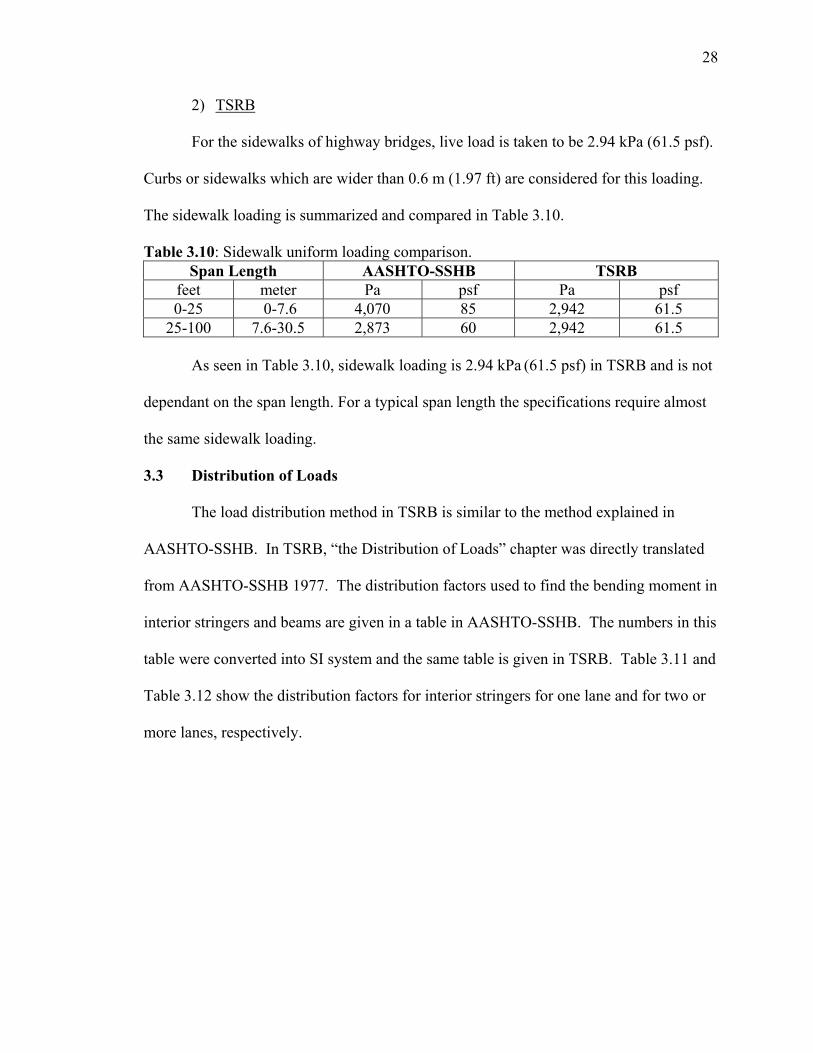
Sidewalk floors, stringers and their immediate supports are designed for 4.07 kPa
(85 psf). Girders, trusses, arches and other members are designed for the following live
loads:
Spans of 0-25 ft (0-7.6 m)………………..… 4.07 kPa (85 psf)
Spans of 25-100 ft (7.6-30.5 m)....….……… 2.87 kPa (60 psf)
Spans over 100 ft (30.5 m)…………… according to the formula,
P 303 000,
L+
55 W−
50
P: Live load per square foot (P<60).
L: Loaded length of sidewalk in feet.
W: Width of sidewalk in feet.
28
2) TSRB
For the sidewalks of highway bridges, live load is taken to be 2.94 kPa (61.5 psf).
Curbs or sidewalks which are wider than 0.6 m (1.97 ft) are considered for this loading.
The sidewalk loading is summarized and compared in Table 3.10.
Table 3.10: Sidewalk uniform loading comparison. Span Length AASHTO-SSHB TSRB
feet meter Pa psf Pa psf 0-25 0-7.6 4,070 85 2,942 61.5
25-100 7.6-30.5 2,873 60 2,942 61.5
As seen in Table 3.10, sidewalk loading is 2.94 kPa (61.5 psf) in TSRB and is not
dependant on the span length. For a typical span length the specifications require almost
the same sidewalk loading.
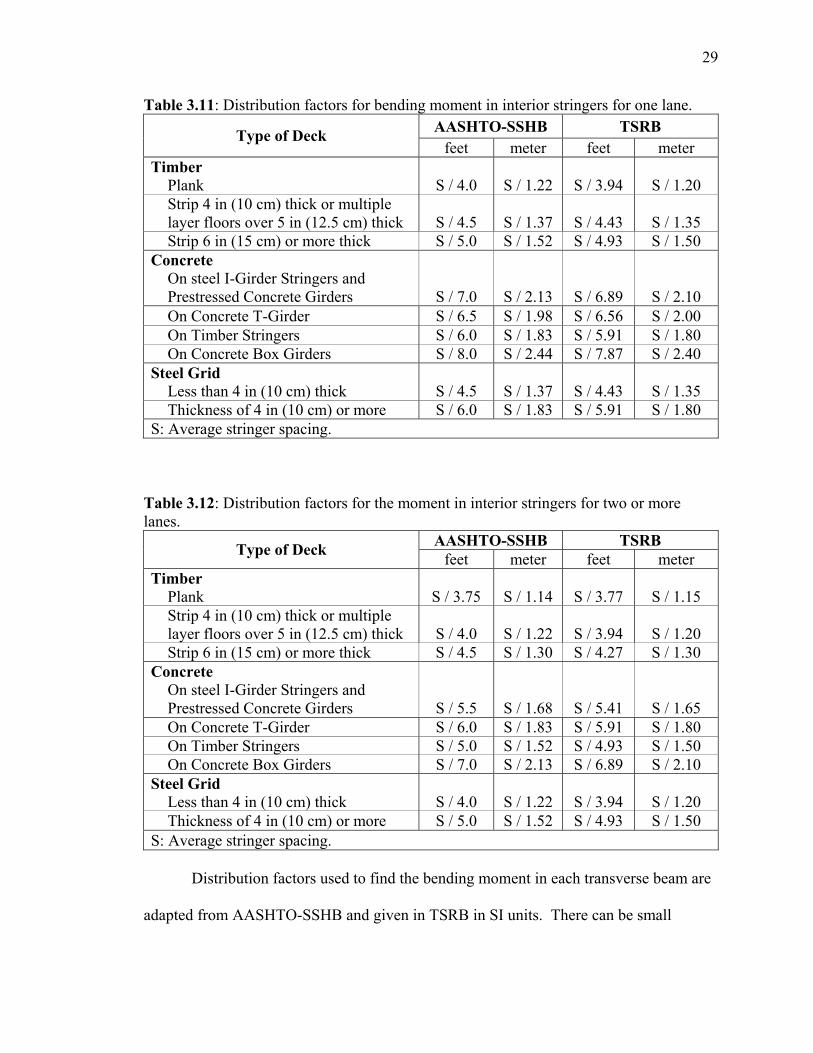
3.3 Distribution of Loads
The load distribution method in TSRB is similar to the method explained in
AASHTO-SSHB. In TSRB, “the Distribution of Loads” chapter was directly translated
from AASHTO-SSHB 1977. The distribution factors used to find the bending moment in
interior stringers and beams are given in a table in AASHTO-SSHB. The numbers in this
table were converted into SI system and the same table is given in TSRB. Table 3.11 and
Table 3.12 show the distribution factors for interior stringers for one lane and for two or
more lanes, respectively.
29
Table 3.11: Distribution factors for bending moment in interior stringers for one lane. AASHTO-SSHB TSRB Type of Deck
feet meter feet meter Timber
Plank
S / 4.0
S / 1.22 S / 3.94
S / 1.20
Strip 4 in (10 cm) thick or multiple layer floors over 5 in (12.5 cm) thick
S / 4.5
S / 1.37
S / 4.43
S / 1.35
Strip 6 in (15 cm) or more thick S / 5.0 S / 1.52 S / 4.93 S / 1.50 Concrete
On steel I-Girder Stringers and Prestressed Concrete Girders
S / 7.0
S / 2.13
S / 6.89
S / 2.10 On Concrete T-Girder S / 6.5 S / 1.98 S / 6.56 S / 2.00 On Timber Stringers S / 6.0 S / 1.83 S / 5.91 S / 1.80 On Concrete Box Girders S / 8.0 S / 2.44 S / 7.87 S / 2.40
Steel Grid Less than 4 in (10 cm) thick
S / 4.5
S / 1.37
S / 4.43
S / 1.35
Thickness of 4 in (10 cm) or more S / 6.0 S / 1.83 S / 5.91 S / 1.80 S: Average stringer spacing.
Table 3.12: Distribution factors for the moment in interior stringers for two or more lanes.
AASHTO-SSHB TSRB Type of Deck feet meter feet meter Timber
Plank
S / 3.75
S / 1.14
S / 3.77
S / 1.15 Strip 4 in (10 cm) thick or multiple layer floors over 5 in (12.5 cm) thick
S / 4.0
S / 1.22
S / 3.94
S / 1.20
Strip 6 in (15 cm) or more thick S / 4.5 S / 1.30 S / 4.27 S / 1.30 Concrete
On steel I-Girder Stringers and Prestressed Concrete Girders
S / 5.5
S / 1.68
S / 5.41
S / 1.65 On Concrete T-Girder S / 6.0 S / 1.83 S / 5.91 S / 1.80 On Timber Stringers S / 5.0 S / 1.52 S / 4.93 S / 1.50 On Concrete Box Girders S / 7.0 S / 2.13 S / 6.89 S / 2.10
Steel Grid Less than 4 in (10 cm) thick
S / 4.0
S / 1.22
S / 3.94
S / 1.20
Thickness of 4 in (10 cm) or more S / 5.0 S / 1.52 S / 4.93 S / 1.50 S: Average stringer spacing.
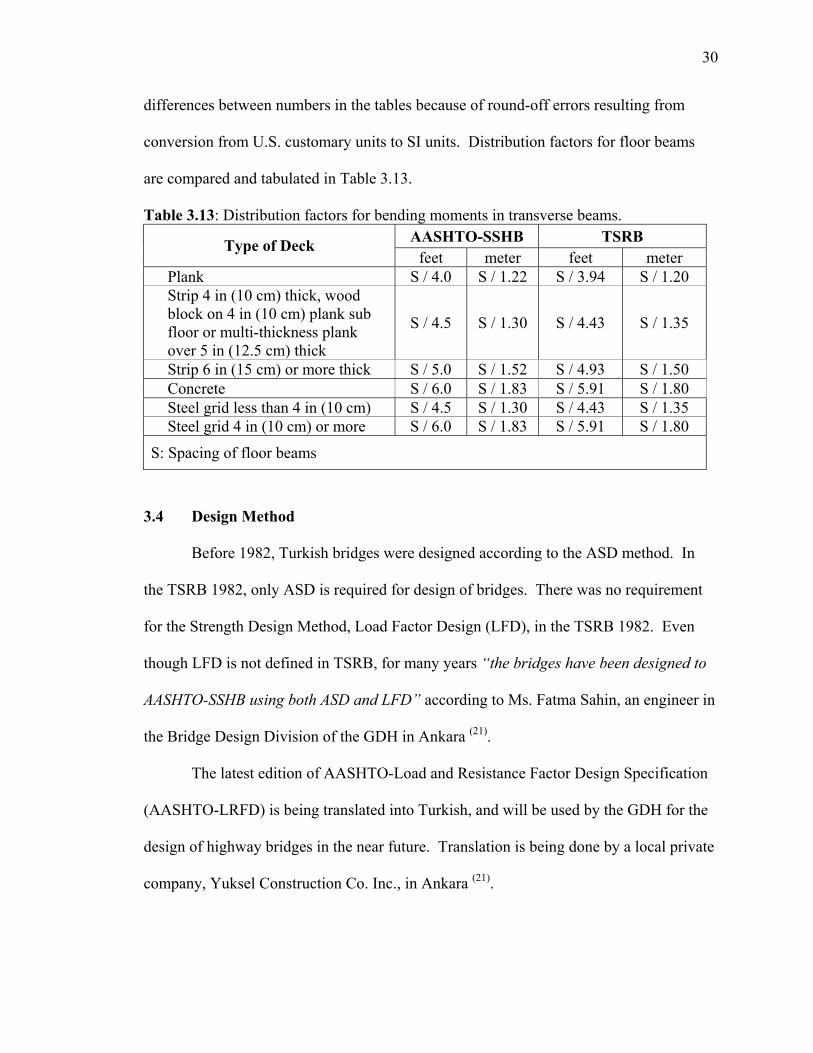
Distribution factors used to find the bending moment in each transverse beam are
adapted from AASHTO-SSHB and given in TSRB in SI units. There can be small
30
differences between numbers in the tables because of round-off errors resulting from
conversion from U.S. customary units to SI units. Distribution factors for floor beams
are compared and tabulated in Table 3.13.
Table 3.13: Distribution factors for bending moments in transverse beams. AASHTO-SSHB TSRB Type of Deck
feet meter feet meter Plank S / 4.0 S / 1.22 S / 3.94 S / 1.20 Strip 4 in (10 cm) thick, wood block on 4 in (10 cm) plank sub floor or multi-thickness plank over 5 in (12.5 cm) thick
S / 4.5 S / 1.30 S / 4.43 S / 1.35
Strip 6 in (15 cm) or more thick S / 5.0 S / 1.52 S / 4.93 S / 1.50 Concrete S / 6.0 S / 1.83 S / 5.91 S / 1.80 Steel grid less than 4 in (10 cm) S / 4.5 S / 1.30 S / 4.43 S / 1.35 Steel grid 4 in (10 cm) or more S / 6.0 S / 1.83 S / 5.91 S / 1.80
S: Spacing of floor beams
3.4 Design Method
Before 1982, Turkish bridges were designed according to the ASD method. In
the TSRB 1982, only ASD is required for design of bridges. There was no requirement
for the Strength Design Method, Load Factor Design (LFD), in the TSRB 1982. Even
though LFD is not defined in TSRB, for many years “the bridges have been designed to
AASHTO-SSHB using both ASD and LFD” according to Ms. Fatma Sahin, an engineer in
the Bridge Design Division of the GDH in Ankara (21).
The latest edition of AASHTO-Load and Resistance Factor Design Specification
(AASHTO-LRFD) is being translated into Turkish, and will be used by the GDH for the
design of highway bridges in the near future. Translation is being done by a local private
company, Yuksel Construction Co. Inc., in Ankara (21).
31
3.4.1 Allowable Stresses
For bridge design in Turkey, allowable stresses for both reinforced and
prestressed concrete are obtained using the formulas given in AASHTO-SSHB.
Allowable stresses for steel are tabulated in Table 3.2.
3.4.2 Load Factors for LFD
In the design of bridges in Turkey, the load factors used in LFD are same as the
ones used in AASHTO-SSHB. For example, the formula applied to find the factored
dead load and live load combination is I))(LL1.67 (DL1.3 +⋅+⋅ , where DL, LL and I
are dead load, live load and impact, respectively. This formula represents Group-I
loading combination used in AASHTO-SSHB for LFD.
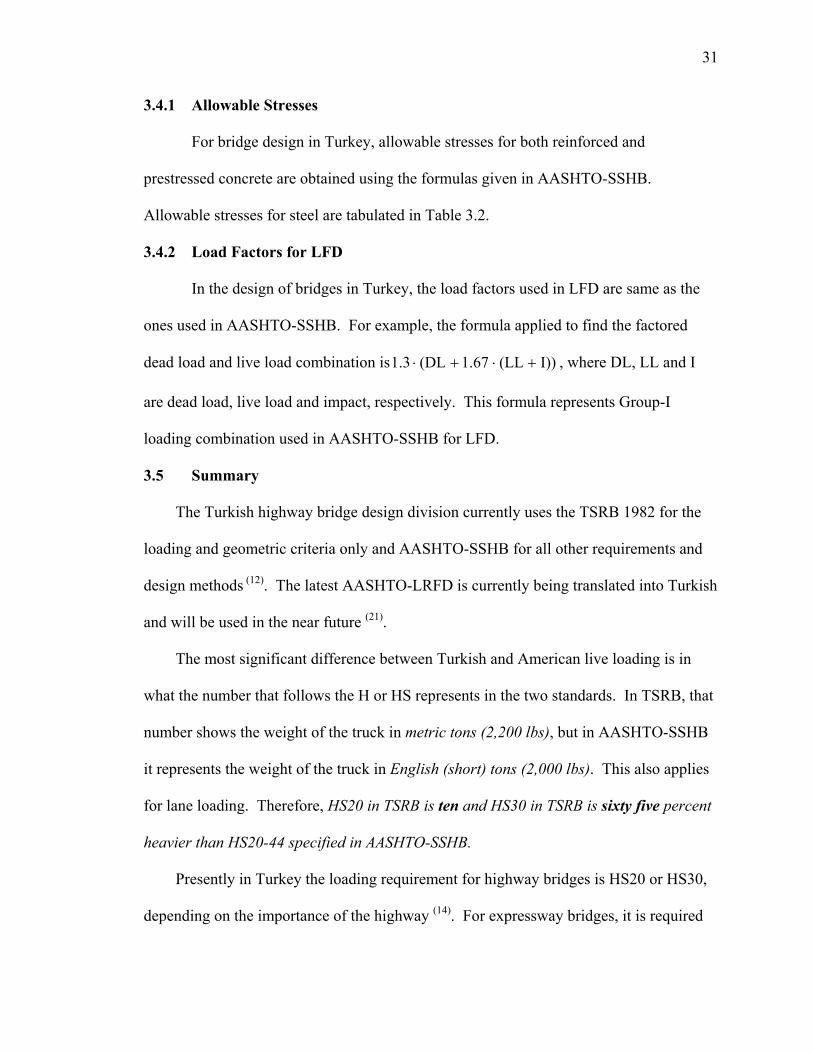
3.5 Summary
The Turkish highway bridge design division currently uses the TSRB 1982 for the
loading and geometric criteria only and AASHTO-SSHB for all other requirements and
design methods (12). The latest AASHTO-LRFD is currently being translated into Turkish
and will be used in the near future (21).
The most significant difference between Turkish and American live loading is in
what the number that follows the H or HS represents in the two standards. In TSRB, that
number shows the weight of the truck in metric tons (2,200 lbs), but in AASHTO-SSHB
it represents the weight of the truck in English (short) tons (2,000 lbs). This also applies
for lane loading. Therefore, HS20 in TSRB is ten and HS30 in TSRB is sixty five percent
heavier than HS20-44 specified in AASHTO-SSHB.
Presently in Turkey the loading requirement for highway bridges is HS20 or HS30,
depending on the importance of the highway (14). For expressway bridges, it is required
32
to design according to HS30 or AML, and to check the bridge for overloading with Type-
A and Type-B vehicles, for which the diagrams are given in Appendix B.
33
Chapter 4: Analysis of the Birecik Bridge
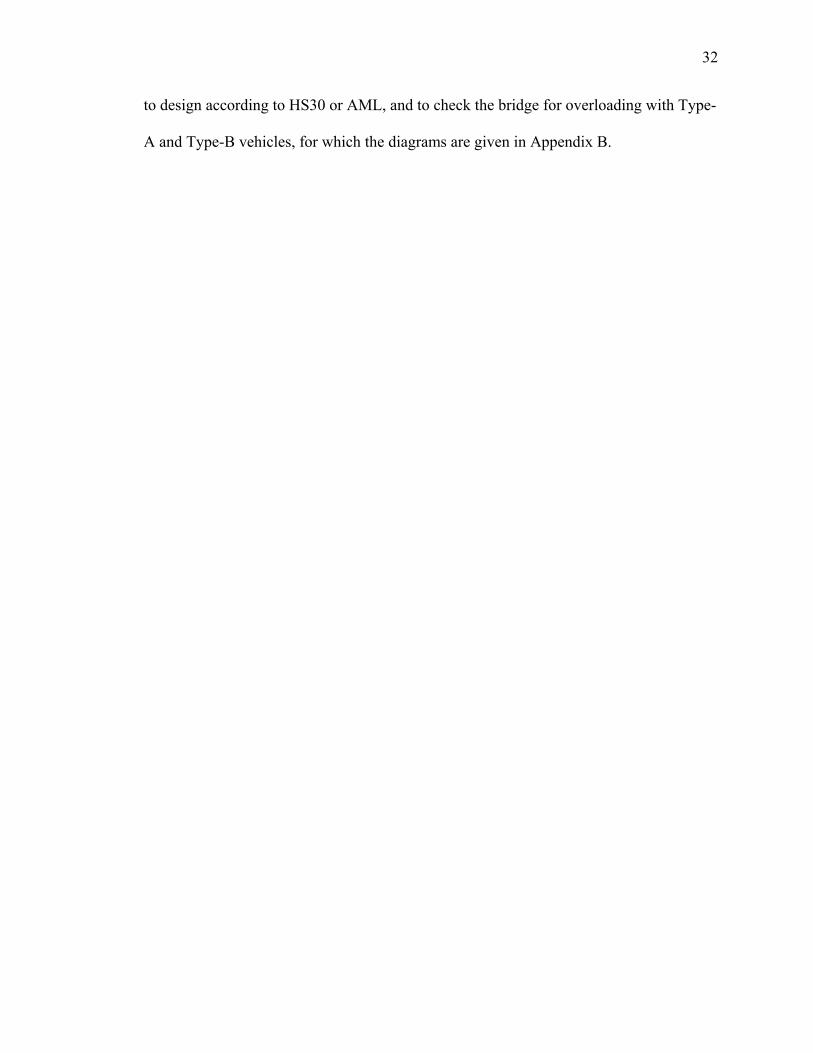
4.1 Introduction
The Birecik Bridge, which crosses the Euphrates River, was constructed in 1956.
The bridge is in southeastern Turkey and is located on the state highway connecting
Gaziantep and Birecik. The location of the bridge is marked with a star in Figure 4.1.
Several photographs of the bridge were taken in February, 2003 and are given in
Appendix D.
Figure 4.1: Location of the Birecik Bridge on the traffic flow map.
The total length of the bridge, which consists of two parts, is 694.6 m (2,279 ft).
The first part was constructed as a 15-span Gerber Girder reinforced concrete bridge.
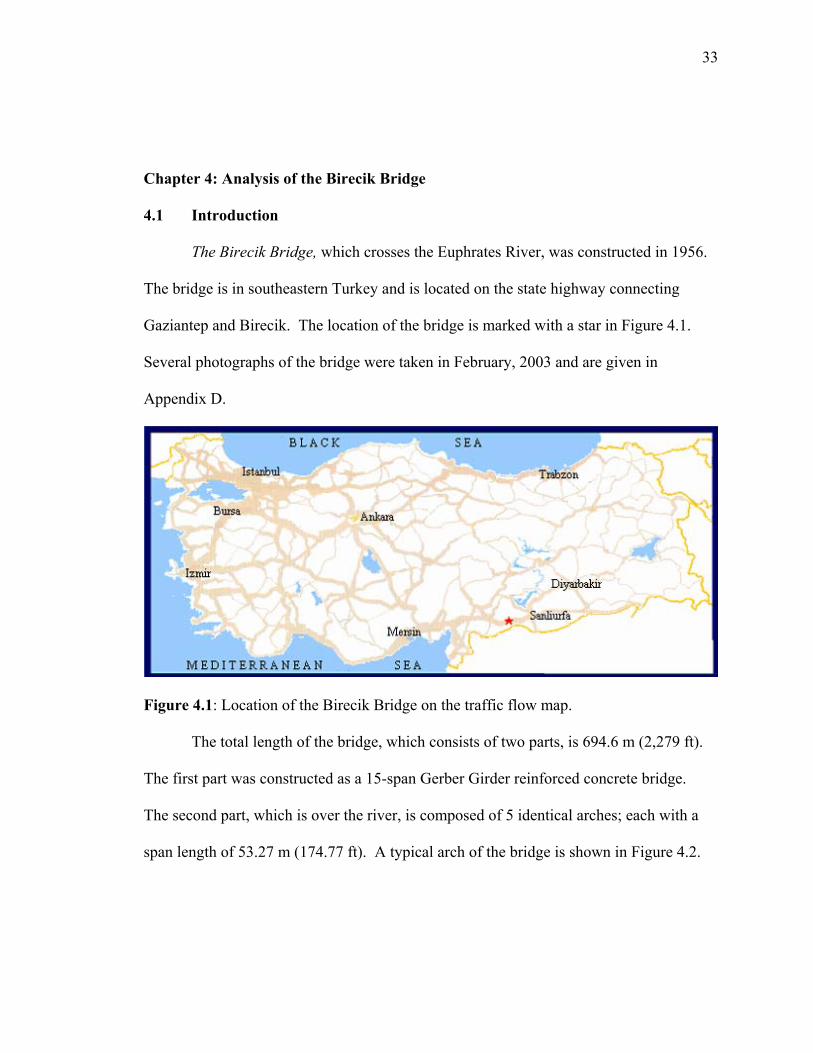
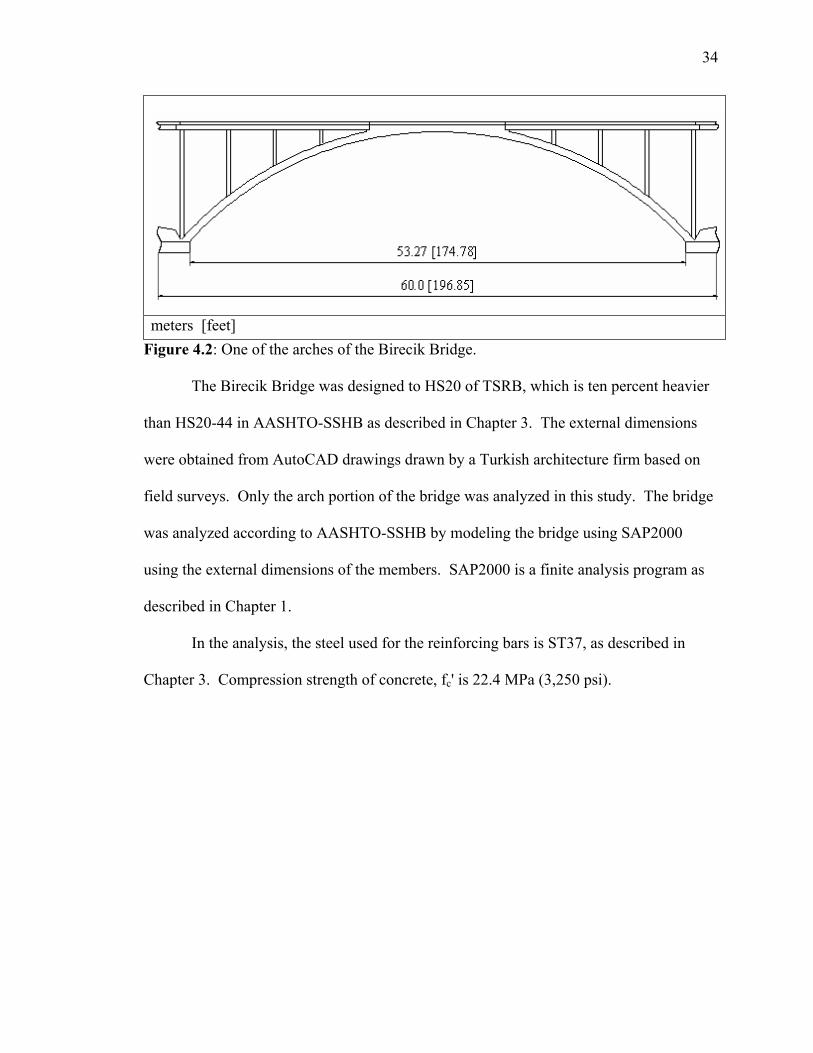
The second part, which is over the river, is composed of 5 identical arches; each with a
span length of 53.27 m (174.77 ft). A typical arch of the bridge is shown in Figure 4.2.
34
meters [feet] Figure 4.2: One of the arches of the Birecik Bridge.
The Birecik Bridge was designed to HS20 of TSRB, which is ten percent heavier
than HS20-44 in AASHTO-SSHB as described in Chapter 3. The external dimensions
were obtained from AutoCAD drawings drawn by a Turkish architecture firm based on
field surveys. Only the arch portion of the bridge was analyzed in this study. The bridge
was analyzed according to AASHTO-SSHB by modeling the bridge using SAP2000
using the external dimensions of the members. SAP2000 is a finite analysis program as
described in Chapter 1.
In the analysis, the steel used for the reinforcing bars is ST37, as described in
Chapter 3. Compression strength of concrete, fc' is 22.4 MPa (3,250 psi).
35
Centimeters [inches] Column
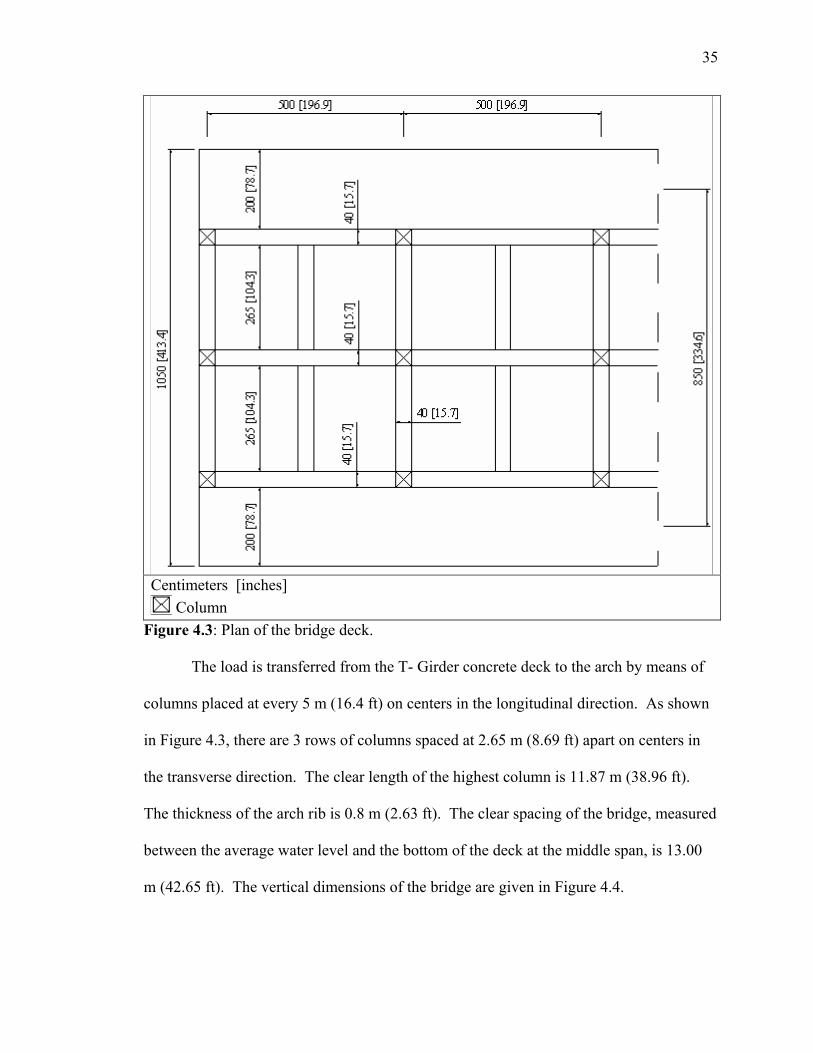
Figure 4.3: Plan of the bridge deck.
The load is transferred from the T- Girder concrete deck to the arch by means of
columns placed at every 5 m (16.4 ft) on centers in the longitudinal direction. As shown
in Figure 4.3, there are 3 rows of columns spaced at 2.65 m (8.69 ft) apart on centers in
the transverse direction. The clear length of the highest column is 11.87 m (38.96 ft).
The thickness of the arch rib is 0.8 m (2.63 ft). The clear spacing of the bridge, measured
between the average water level and the bottom of the deck at the middle span, is 13.00
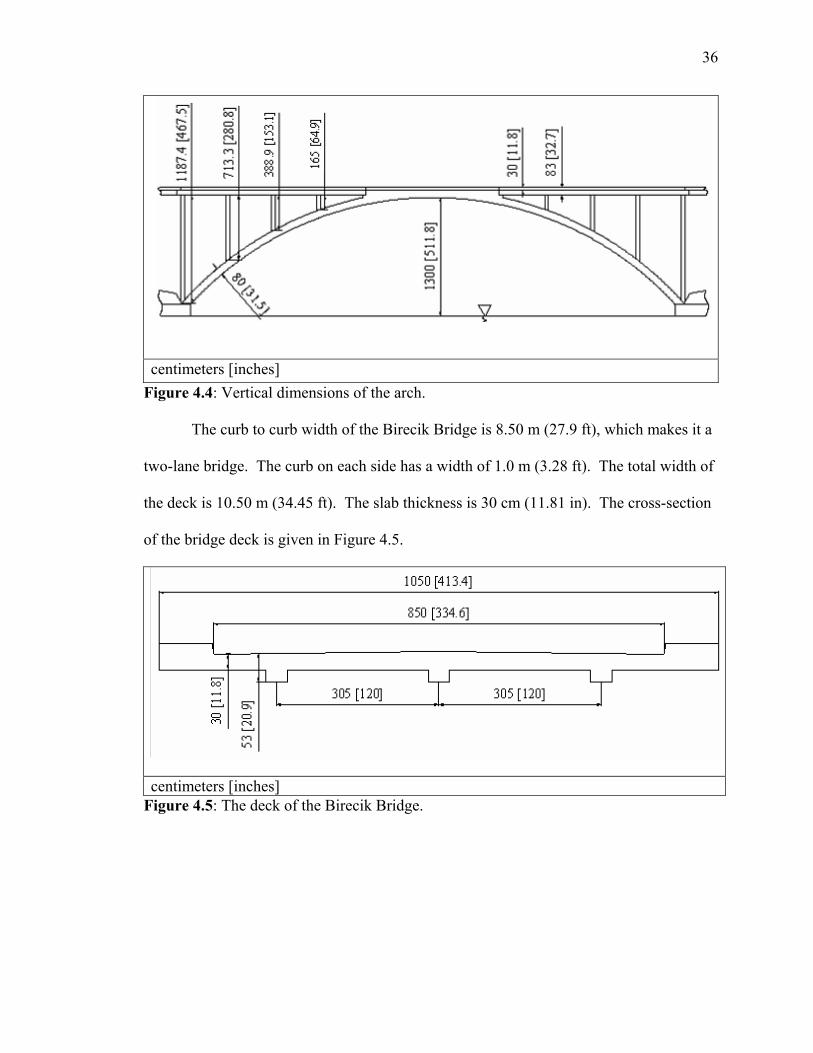
m (42.65 ft). The vertical dimensions of the bridge are given in Figure 4.4.
36
centimeters [inches] Figure 4.4: Vertical dimensions of the arch.
The curb to curb width of the Birecik Bridge is 8.50 m (27.9 ft), which makes it a
two-lane bridge. The curb on each side has a width of 1.0 m (3.28 ft). The total width of
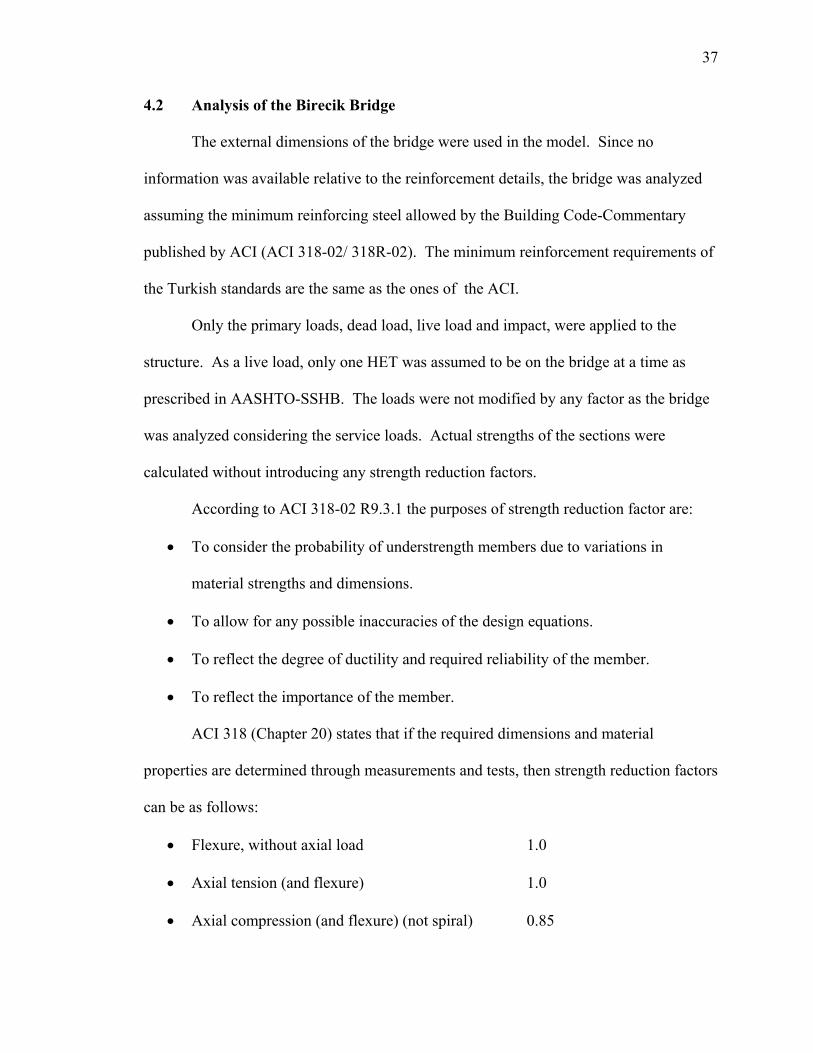
the deck is 10.50 m (34.45 ft). The slab thickness is 30 cm (11.81 in). The cross-section
of the bridge deck is given in Figure 4.5.
centimeters [inches] Figure 4.5: The deck of the Birecik Bridge.
37
4.2 Analysis of the Birecik Bridge
The external dimensions of the bridge were used in the model. Since no
information was available relative to the reinforcement details, the bridge was analyzed
assuming the minimum reinforcing steel allowed by the Building Code-Commentary
published by ACI (ACI 318-02/ 318R-02). The minimum reinforcement requirements of
the Turkish standards are the same as the ones of the ACI.
Only the primary loads, dead load, live load and impact, were applied to the
structure. As a live load, only one HET was assumed to be on the bridge at a time as
prescribed in AASHTO-SSHB. The loads were not modified by any factor as the bridge
was analyzed considering the service loads. Actual strengths of the sections were
calculated without introducing any strength reduction factors.
According to ACI 318-02 R9.3.1 the purposes of strength reduction factor are:
• To consider the probability of understrength members due to variations in
material strengths and dimensions.
• To allow for any possible inaccuracies of the design equations.
• To reflect the degree of ductility and required reliability of the member.
• To reflect the importance of the member.
ACI 318 (Chapter 20) states that if the required dimensions and material
properties are determined through measurements and tests, then strength reduction factors
can be as follows:
• Flexure, without axial load 1.0
• Axial tension (and flexure) 1.0
• Axial compression (and flexure) (not spiral) 0.85
38
• Shear 0.9
This research study assumed all the strength reduction factors as 1.0. As the
bridges under consideration were constructed about 40 years ago, the concrete would
typically have higher compressive strength than the 28-day compression strength, which
was neglected in the calculations. Therefore in the actual case the strength of the
concrete is higher than the value used in the calculations. The dimensions of this bridge
were obtained from site investigations and were actual in-place dimensions. Therefore
the probability of variations in the dimensions of the members was low.
4.2.1 Slab
The bridge slab was checked by the ASD approach prescribed in AASHTO-
SSHB. The minimum allowable main reinforcing steel was assumed present.
Distribution steel and temperature steel were not checked as no information was available
in this regard.
1) Effective Span
According to AASHTO-SSHB 3.24.1.2a, effective span, S, is the clear span
between T-Girders.
33.104S = in = 8.69 ft (2.65 m)
2) Dead Load
Dead load of the slab was calculated in terms of uniform pressure (ksf).
Self weight of slab, w1: w1= ⋅t γ
where t: thickness of slab in feet
γ: Unit weight of concrete
39
w1= 1475.0kcf 150.0ft/in 12
in 8.11=⋅ ksf (7.0623 kPa)
Wearing surface, assumed, w2: w2= 0.019 ksf (0.91 kPa)
Total dead load, ksf 0.1665019.01475.0 w w w 21 =+=+= (7.972 kPa)
Dead load moment, MD:
ftk 257.110
)ft 69.8(ksf 1665.010
SwM22
D −=⋅
=⋅
±= (1.704 kN-m)
3) Live Load
Live load moment, ML, at midspan of the slab was calculated according to
AASHTO-SSHB 3.24.3.1 using the rear wheel of the HET as the loading.
Rear wheel load of HET, PHET = 15.7 kips (69.8 kN)
196.4kips 7.1532
2ft 69.88.0P32
2S8.0M HETL =⋅+
⋅=⋅+
⋅= k-ft (5.689 kN-m)
Impact Factor, I: (AASHTO-SSHB 3.8.2.1)
3.037.0125ft 69.8
50125S
50I >=+
=+
= (Maximum allowable)
Hence I = 0.3
ML+I = 454.5196.4)3.01(M)I1( L =⋅+=⋅+ k-ft (7.395 kN-m)
Total design moment, MT = MD + ML+I
MT = 1.257 k-ft + 5.454 k-ft = 6.71 k-ft (9.1 kN-m)
4) Main Steel
Yield stress for ST37 steel is given in Turkish Standards (TS-648).
fy= 34,000 psi (234.4 MPa)
Allowable stress for ST37 steel is given in Turkish Standards (TS-648).
fs= 20,000 psi (137.9 MPa)
40
Allowable stress for concrete is 0.4 times of the concrete nominal strength (fc').
fc= psi 250,34.0'f4.0 c ⋅=⋅ = 1,300 psi (8.96 MPa)
Modular ratio (n), the ratio of the modulus of elasticity of steel to that of concrete,
is given in AASHTO-SSHB 10.38.1.3. Modular ratio is dependant on the concrete
nominal strength (fc').
n = 9 (for fc' = 3,250 psi (22.4MPa))
The design coefficients k (neutral axis factor), and j (lever-arm factor) were
calculated.
369.0
psi 300,1psi 000,209
9
ff
n
nk
c
s=
+=
+=
877.03k1j =−=
The distance from the concrete surface to the center of the rebars was assumed as
1.8 in. Therefore, the depth of the slab (d) was calculated as,
in 0.10in 8.1in 8.118.1td =−=−= (0.254 m)
Required slab depth, dr:
877.0369.0psi 300,15.0ftlbs 710,6
jkf5.0M
dc
Tr ⋅⋅⋅
−=
⋅⋅⋅=
dr = 5.65 in (0.14 m) < 10 in (0.254 m) OK.
Minimum slab depth, dmin: (AASHTO-SSHB Table 8.9.2)
dmin = )m 254.0( in 10)m 19.0( in 48.7ft/in 1230
10ft 69.830
10S<=⋅
+=
+ OK.
The minimum steel amount is calculated according to ACI 318-02 (22).
41
Minimum steelyy
c
fdb200db
f'f3 ⋅
>⋅⋅=
2
y
c in 0.60in 10in 12psi 34,000psi 3,2503
dbf
'f3=⋅⋅=⋅⋅ per foot of slab
2
y
in 0.70psi 34,000in 10in 12200
fdb200 =
⋅=
⋅ per foot of slab, governs.
Hence, 0.70 in2 steel per foot of slab (the minimum required by ACI 318-02) was
assumed to be present at the top and at the bottom of the slab.
Required steel, As:
ft/in 1210877.0000,20
ftlbs 710,6djf
MA
s
Ts ⋅
⋅⋅−
=⋅⋅
=
)cm (4.52 in 70.0)cm (2.97 in 46.0A 2222s <= OK.
5) Column Punching
According to AASHTO 8.15.5.6.1, the slab should be checked for punching shear
in the vicinity of concentrated loads and reactions. The punching of the column into the
slab was neglected, since the columns of the bridge frame into the beams, which in turn
support the slab. This is shown in Figure D.8 in Appendix D.
6) One-Way Shear Failure Check
The concrete slab was checked against the shear failure in longitudinal direction.
The shear capacity of the concrete, Vc, was calculated as;
7.131012250,32db'f2V cc =⋅⋅=⋅⋅= kips (AASHTO-SSHB 8-49)
,where b = 12 in (unit width of slab)
d = 10 in (depth of slab)
42
The maximum shear force in the slab, V, was obtained from SAP2000 model as
3.25 kips.
V = 3.25 kips < 13.7 kips O.K.
7) Tire Punching
If the load applied to the slab by a tire was greater than the punching shear
capacity of the slab, the tire would penetrate (‘punch’) through the slab. The punching
shear of a tire of the HET was checked according to AASHTO-SSHB 8.15.5.6.
According to AASHTO-SSHB 3.30, the contact area of the tire, A, is:
P01.0A ⋅=
where P = Load on the tire (lbs)
The most critical tire was one of the rear tires, for which the load was 7,850 lbs
(34.92 kN). For this load, the contact area was calculated as 78.5 in2 (506.5 cm2), using
the equation given above. The contact area is given as a rectangle, for which the ratio of
the long side to the short side is 2.5. Therefore the rectangle was 14 in x 5.6 in (0.36 m x
0.14 m). Punching stress is calculated by;
dbVv0 ⋅
= (AASHTO-SSHB 8-12)
where, v = Shear stress
b0 : Perimeter of the critical section (AASHTO-SSHB 8.15.5.6.1b)
d : Depth of the section
'f8.1'f)β28.0(v cc
cc <+= (AASHTO-SSHB 8-13)
where vc : Punching shear stress capacity
fc': Nominal strength of concrete
43
Therefore, punching shear capacity, Vc, is:
Vc = 2.72dbv 0c =⋅⋅ kips (321.2 kN)
Tire Load = 7.85 kips (34.92 kN) < 72.2 kips (321.2 kN) O.K.
4.2.2 SAP2000 Model
The Birecik Bridge was modeled in SAP2000 described in Chapter 1 as a plane
frame. Frame/cable objects of SAP2000 were used for the model. These objects are used
to model beams, columns, braces, trusses, and/or cable members.
In the ‘Bridge Analysis’ section, SAP2000 Analysis Reference Manual says that
one “should model the bridge structure primarily with Frame elements” (23). According to
this reference, the displacements, reactions and frame element internal forces can be
determined due to the influence of vehicle live loads (23). Other element types (shell,
plane, solid, etc.) may be used; they contribute to the stiffness and may carry part of the
load, but they are not analyzed for the effect of vehicle load (23).
Vehicle live loads can only be applied to frame elements, thus live loads cannot
be represented as acting directly on bridge decks modeled with shell or solid or other
elements (23). Element internal forces due to vehicle live loads are computed only for
frame elements in SAP2000 (23). The bridge was modeled in 2-D using frame elements
because of these restrictions. This 2-D model resulted in a conservative representation of
the actual structure. More accurate representation of the bridge would have been
obtained by modeling it in 3-D, which was beyond the scope of this research study.
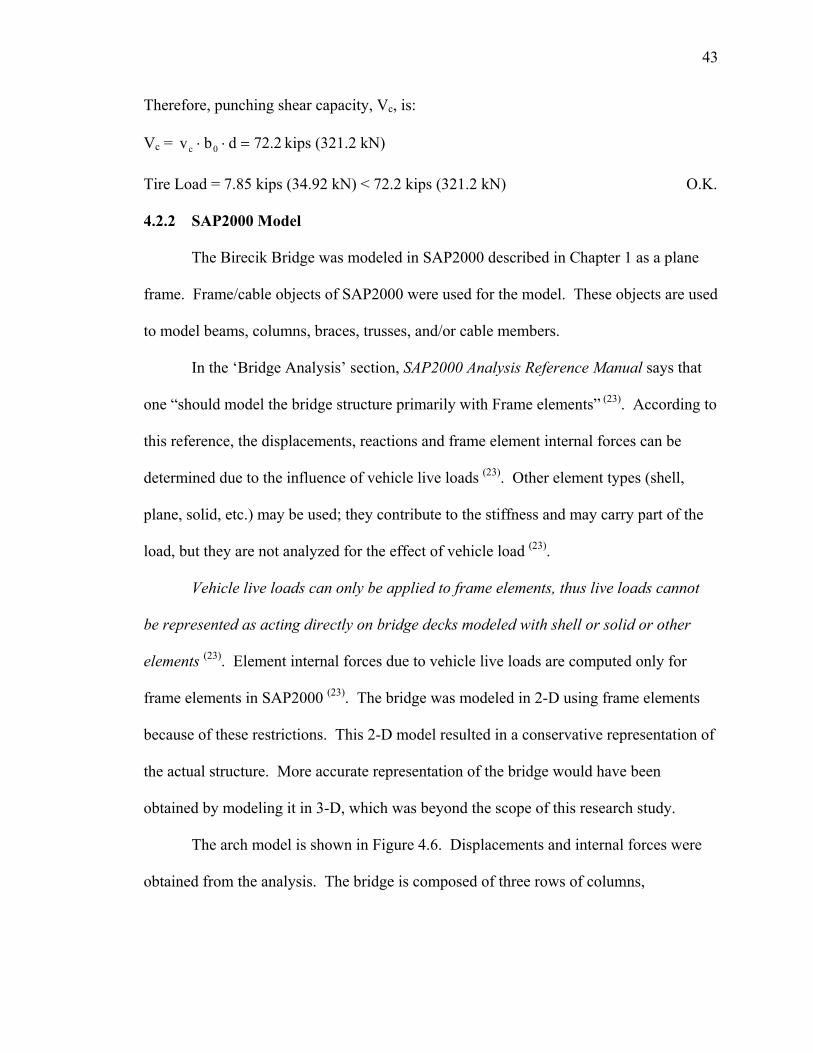
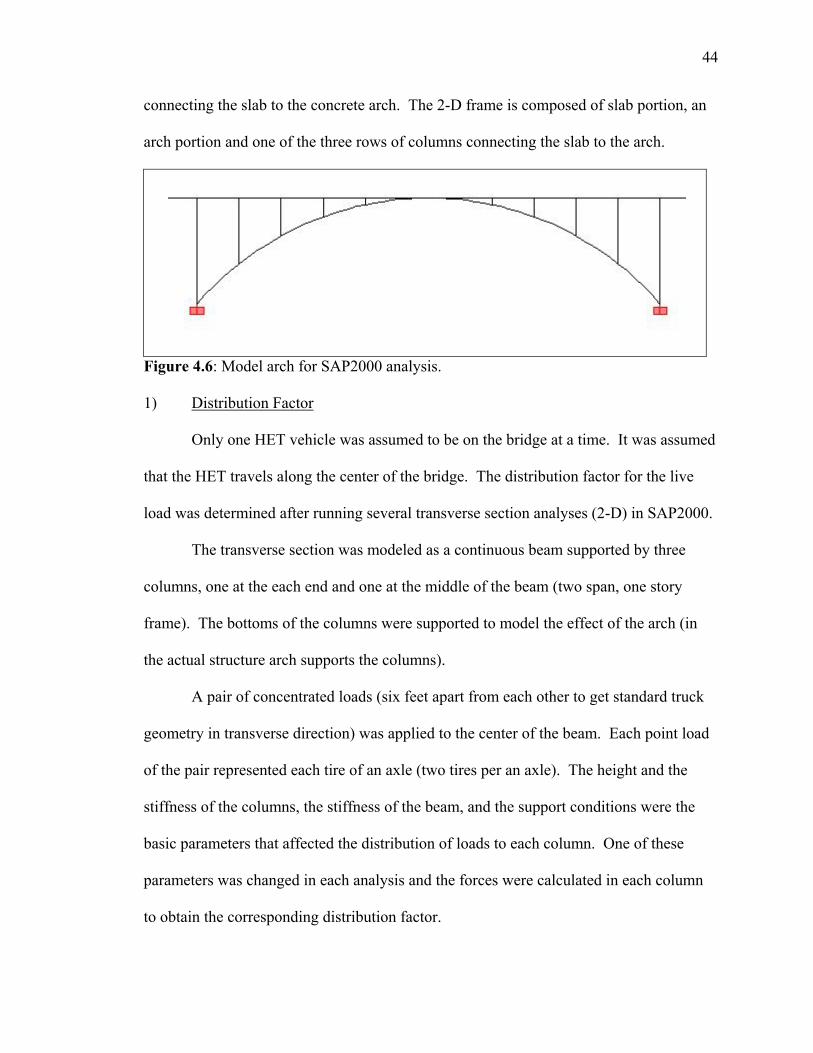
The arch model is shown in Figure 4.6. Displacements and internal forces were
obtained from the analysis. The bridge is composed of three rows of columns,
44
connecting the slab to the concrete arch. The 2-D frame is composed of slab portion, an
arch portion and one of the three rows of columns connecting the slab to the arch.
Figure 4.6: Model arch for SAP2000 analysis.
1) Distribution Factor
Only one HET vehicle was assumed to be on the bridge at a time. It was assumed
that the HET travels along the center of the bridge. The distribution factor for the live
load was determined after running several transverse section analyses (2-D) in SAP2000.
The transverse section was modeled as a continuous beam supported by three
columns, one at the each end and one at the middle of the beam (two span, one story
frame). The bottoms of the columns were supported to model the effect of the arch (in
the actual structure arch supports the columns).
A pair of concentrated loads (six feet apart from each other to get standard truck
geometry in transverse direction) was applied to the center of the beam. Each point load
of the pair represented each tire of an axle (two tires per an axle). The height and the
stiffness of the columns, the stiffness of the beam, and the support conditions were the
basic parameters that affected the distribution of loads to each column. One of these
parameters was changed in each analysis and the forces were calculated in each column
to obtain the corresponding distribution factor.
45
The percentage of live load carried by the central column ranged between forty
to eighty percent depending on the height, stiffness of the columns, and stiffness of the
slab and arch.
The distribution factor was assumed to be of the worst case, 0.80, which means
that eighty percent of the live load was carried by the main bay.
2) Impact Factor
The impact factor was calculated as;
I = 70.1125ft 174.78
50125L
50=
+=
+<0.3
where L: Clear span length in feet.
Hence I=0.17
This impact factor was used for the analysis of the 2-D structure in SAP2000.
3) Effective Flange Width
Effective flange width is the minimum of, (AASHTO-SSHB 8.10.1.1)
1. be = 2.494
ft 196.854Length Span
== in (1.2 m)
2. be = Girder spacing = 104.3 in (2.6 m)
3. be = 12 times the slab thickness + the web width = 157.4 in (4 m)
Hence be = 49.2 in (1.2 m)
4) Convergence Check of the Model
Each arch and the corresponding deck slab were modeled four times. Each time,
the number of elements was increased to monitor the convergence of the analysis results.
The structure was modeled with 11, 55, 110, and 220 elements in the first, second, third,
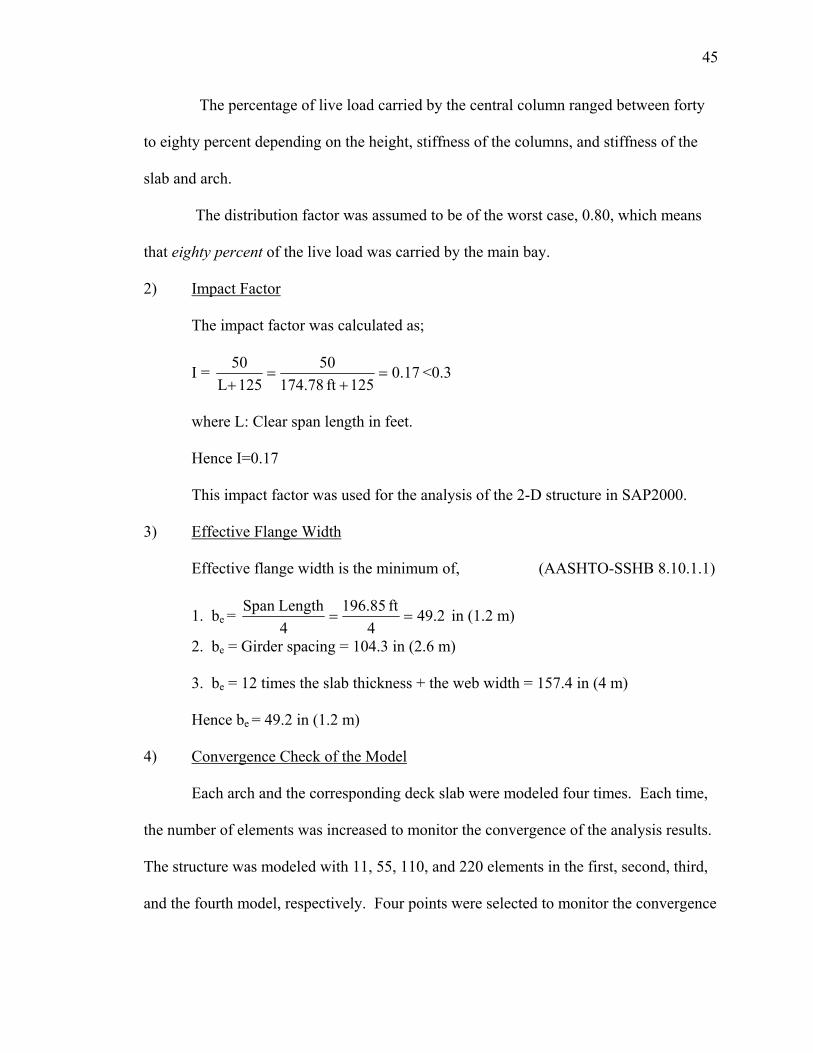
and the fourth model, respectively. Four points were selected to monitor the convergence
46
of the computer model. These points are the top of the columns numbered and shown in
Figure 4.7.
Figure 4.7: The columns of the main arch monitored for the convergence in SAP2000.
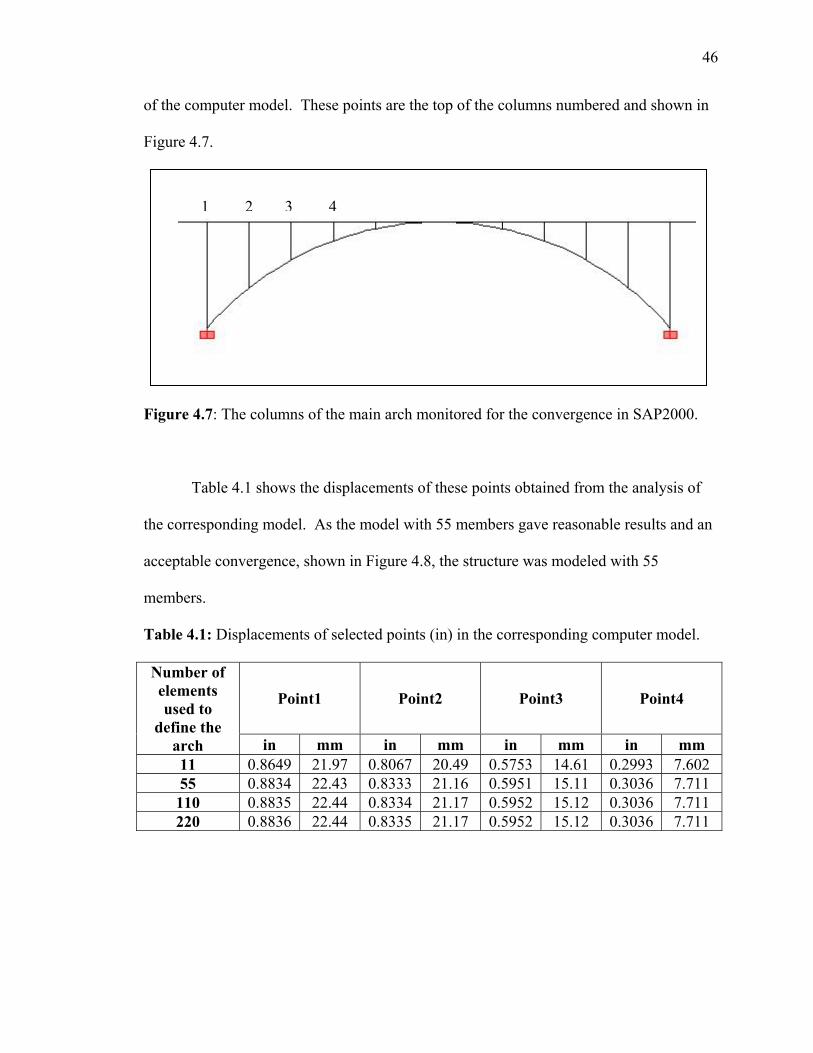
Table 4.1 shows the displacements of these points obtained from the analysis of
the corresponding model. As the model with 55 members gave reasonable results and an
acceptable convergence, shown in Figure 4.8, the structure was modeled with 55
members.
Table 4.1: Displacements of selected points (in) in the corresponding computer model.
Point1 Point2 Point3 Point4
Number of elements used to
define the arch in mm in mm in mm in mm 11 0.8649 21.97 0.8067 20.49 0.5753 14.61 0.2993 7.602 55 0.8834 22.43 0.8333 21.16 0.5951 15.11 0.3036 7.711 110 0.8835 22.44 0.8334 21.17 0.5952 15.12 0.3036 7.711 220 0.8836 22.44 0.8335 21.17 0.5952 15.12 0.3036 7.711
1 2 3 4
47
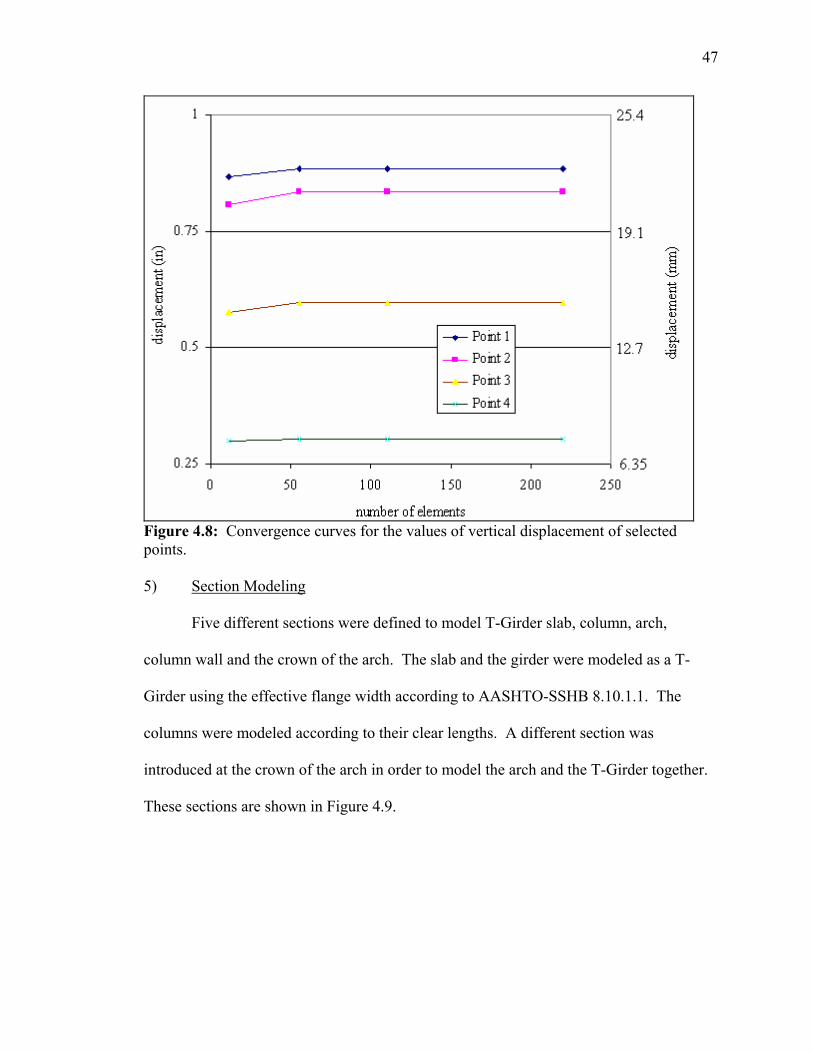
Figure 4.8: Convergence curves for the values of vertical displacement of selected points. 5) Section Modeling
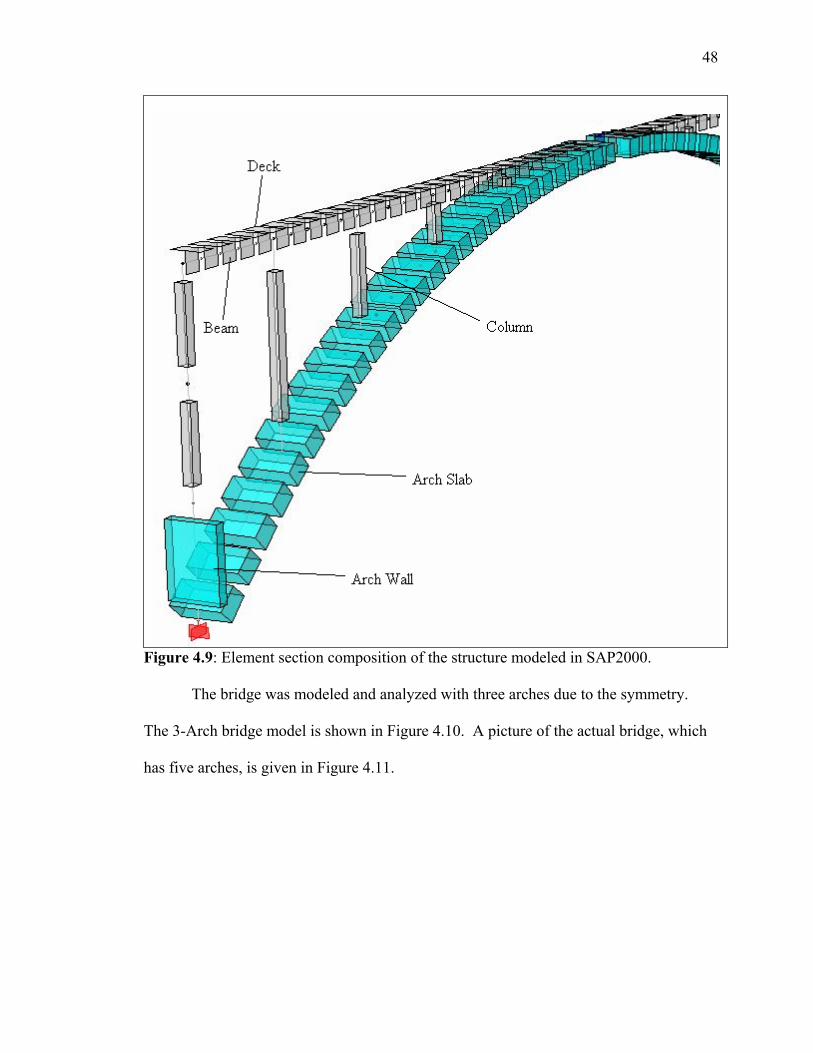
Five different sections were defined to model T-Girder slab, column, arch,
column wall and the crown of the arch. The slab and the girder were modeled as a T-
Girder using the effective flange width according to AASHTO-SSHB 8.10.1.1. The
columns were modeled according to their clear lengths. A different section was
introduced at the crown of the arch in order to model the arch and the T-Girder together.
These sections are shown in Figure 4.9.
48
Figure 4.9: Element section composition of the structure modeled in SAP2000.
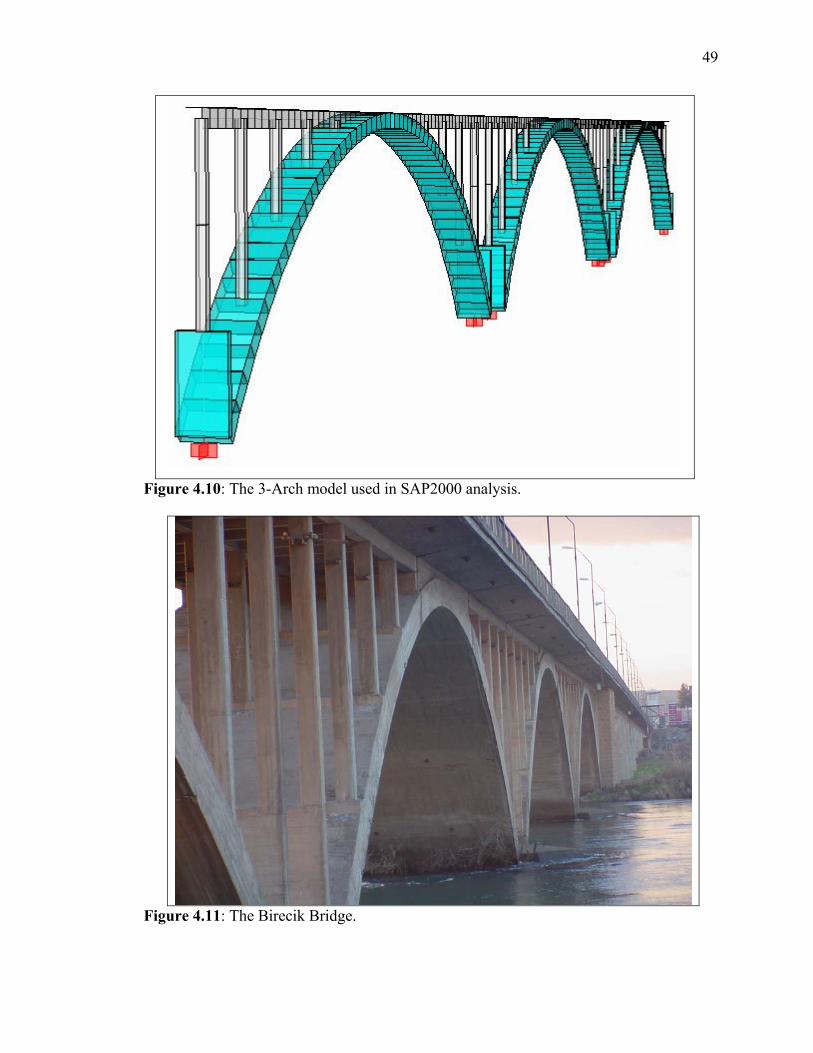
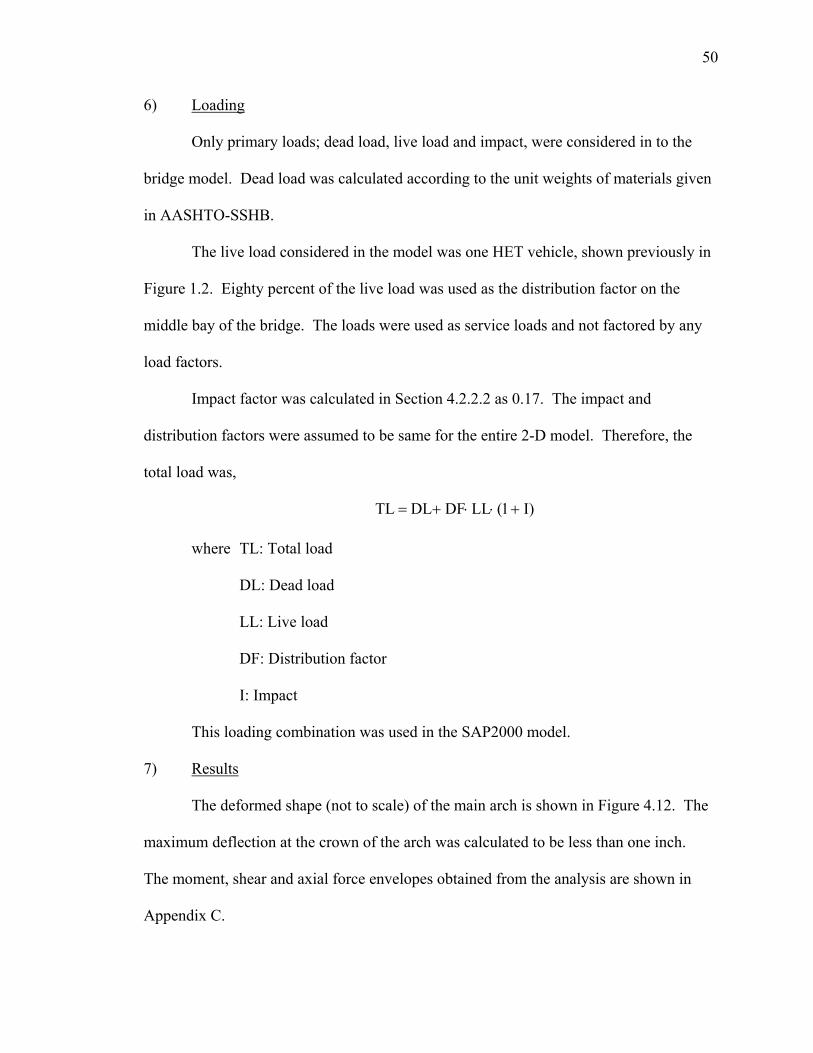
The bridge was modeled and analyzed with three arches due to the symmetry.
The 3-Arch bridge model is shown in Figure 4.10. A picture of the actual bridge, which
has five arches, is given in Figure 4.11.
49
Figure 4.10: The 3-Arch model used in SAP2000 analysis.
Figure 4.11: The Birecik Bridge.
50
6) Loading
Only primary loads; dead load, live load and impact, were considered in to the
bridge model. Dead load was calculated according to the unit weights of materials given
in AASHTO-SSHB.
The live load considered in the model was one HET vehicle, shown previously in
Figure 1.2. Eighty percent of the live load was used as the distribution factor on the
middle bay of the bridge. The loads were used as service loads and not factored by any
load factors.
Impact factor was calculated in Section 4.2.2.2 as 0.17. The impact and
distribution factors were assumed to be same for the entire 2-D model. Therefore, the
total load was,
I)1(LLDFDLTL +⋅⋅+=
where TL: Total load
DL: Dead load
LL: Live load
DF: Distribution factor
I: Impact
This loading combination was used in the SAP2000 model.
7) Results
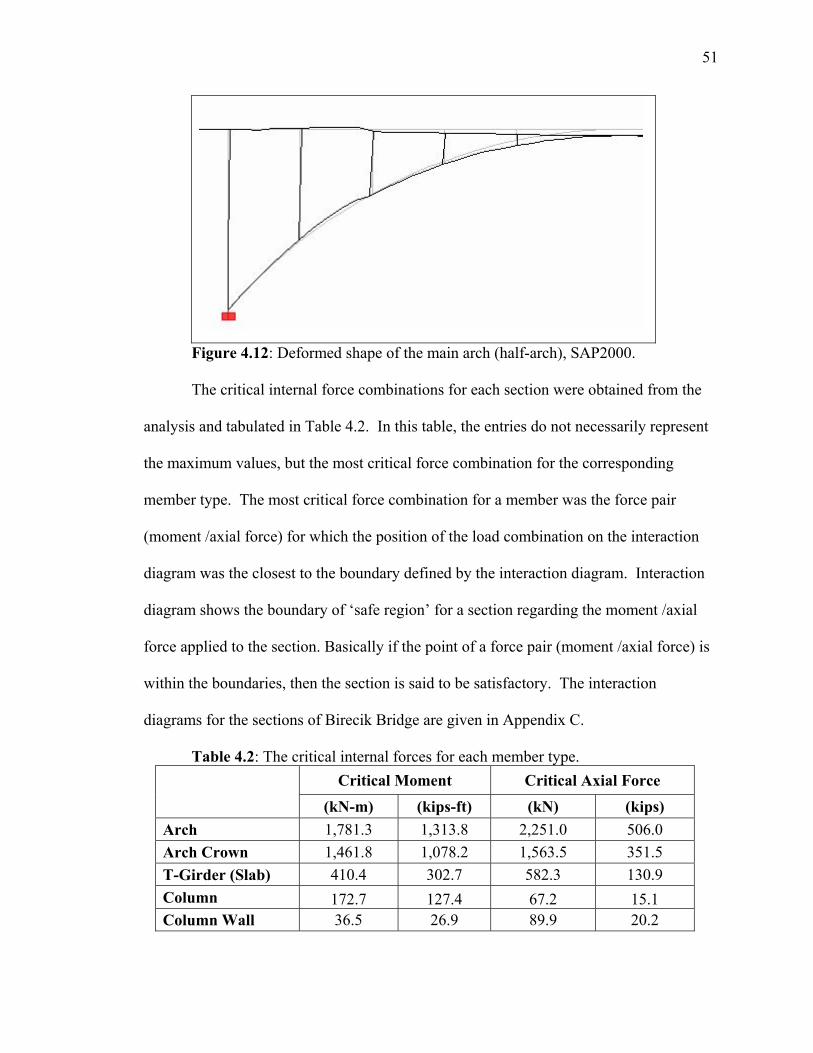
The deformed shape (not to scale) of the main arch is shown in Figure 4.12. The
maximum deflection at the crown of the arch was calculated to be less than one inch.
The moment, shear and axial force envelopes obtained from the analysis are shown in
Appendix C.
51
Figure 4.12: Deformed shape of the main arch (half-arch), SAP2000.
The critical internal force combinations for each section were obtained from the
analysis and tabulated in Table 4.2. In this table, the entries do not necessarily represent
the maximum values, but the most critical force combination for the corresponding
member type. The most critical force combination for a member was the force pair
(moment /axial force) for which the position of the load combination on the interaction
diagram was the closest to the boundary defined by the interaction diagram. Interaction
diagram shows the boundary of ‘safe region’ for a section regarding the moment /axial
force applied to the section. Basically if the point of a force pair (moment /axial force) is
within the boundaries, then the section is said to be satisfactory. The interaction
diagrams for the sections of Birecik Bridge are given in Appendix C.
Table 4.2: The critical internal forces for each member type. Critical Moment Critical Axial Force
(kN-m) (kips-ft) (kN) (kips)
Arch 1,781.3 1,313.8 2,251.0 506.0 Arch Crown 1,461.8 1,078.2 1,563.5 351.5 T-Girder (Slab) 410.4 302.7 582.3 130.9 Column 172.7 127.4 67.2 15.1 Column Wall 36.5 26.9 89.9 20.2
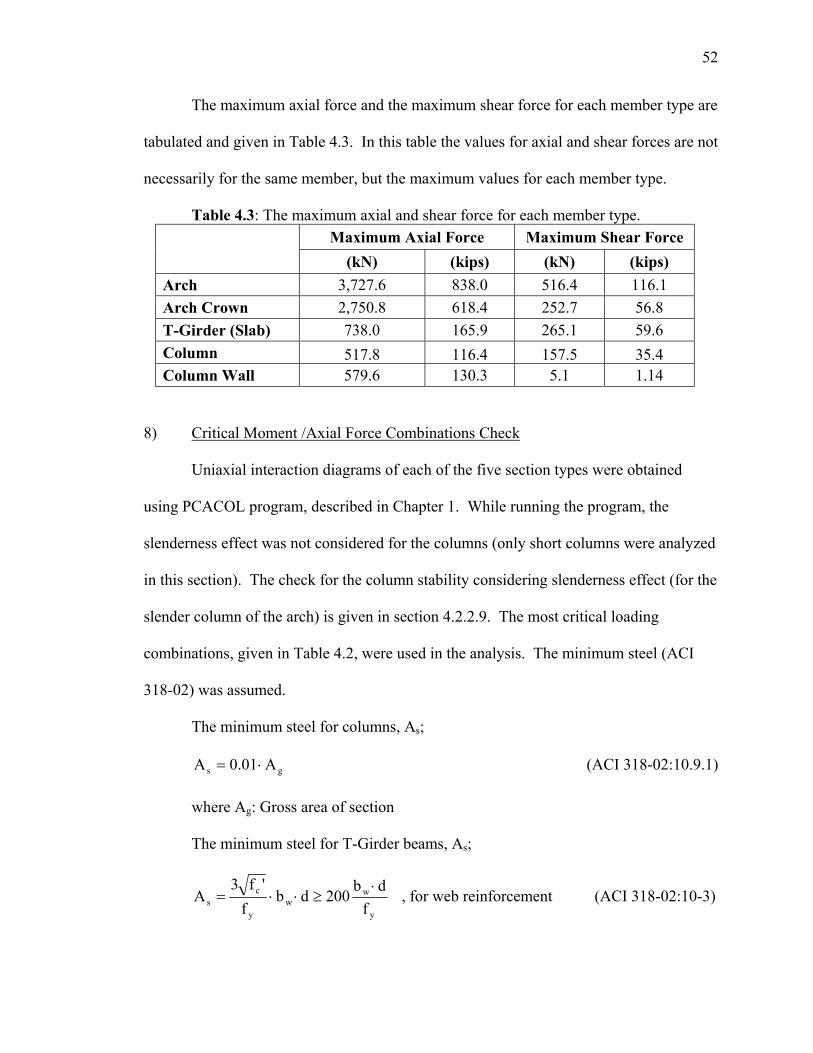
52
The maximum axial force and the maximum shear force for each member type are
tabulated and given in Table 4.3. In this table the values for axial and shear forces are not
necessarily for the same member, but the maximum values for each member type.
Table 4.3: The maximum axial and shear force for each member type. Maximum Axial Force Maximum Shear Force
(kN) (kips) (kN) (kips)
Arch 3,727.6 838.0 516.4 116.1 Arch Crown 2,750.8 618.4 252.7 56.8 T-Girder (Slab) 738.0 165.9 265.1 59.6 Column 517.8 116.4 157.5 35.4 Column Wall 579.6 130.3 5.1 1.14
8) Critical Moment /Axial Force Combinations Check
Uniaxial interaction diagrams of each of the five section types were obtained
using PCACOL program, described in Chapter 1. While running the program, the
slenderness effect was not considered for the columns (only short columns were analyzed
in this section). The check for the column stability considering slenderness effect (for the
slender column of the arch) is given in section 4.2.2.9. The most critical loading
combinations, given in Table 4.2, were used in the analysis. The minimum steel (ACI
318-02) was assumed.
The minimum steel for columns, As;
gs A0.01A ⋅= (ACI 318-02:10.9.1)
where Ag: Gross area of section
The minimum steel for T-Girder beams, As;
y
ww
y
cs f
db200db
f'f3
A⋅
≥⋅⋅= , for web reinforcement (ACI 318-02:10-3)
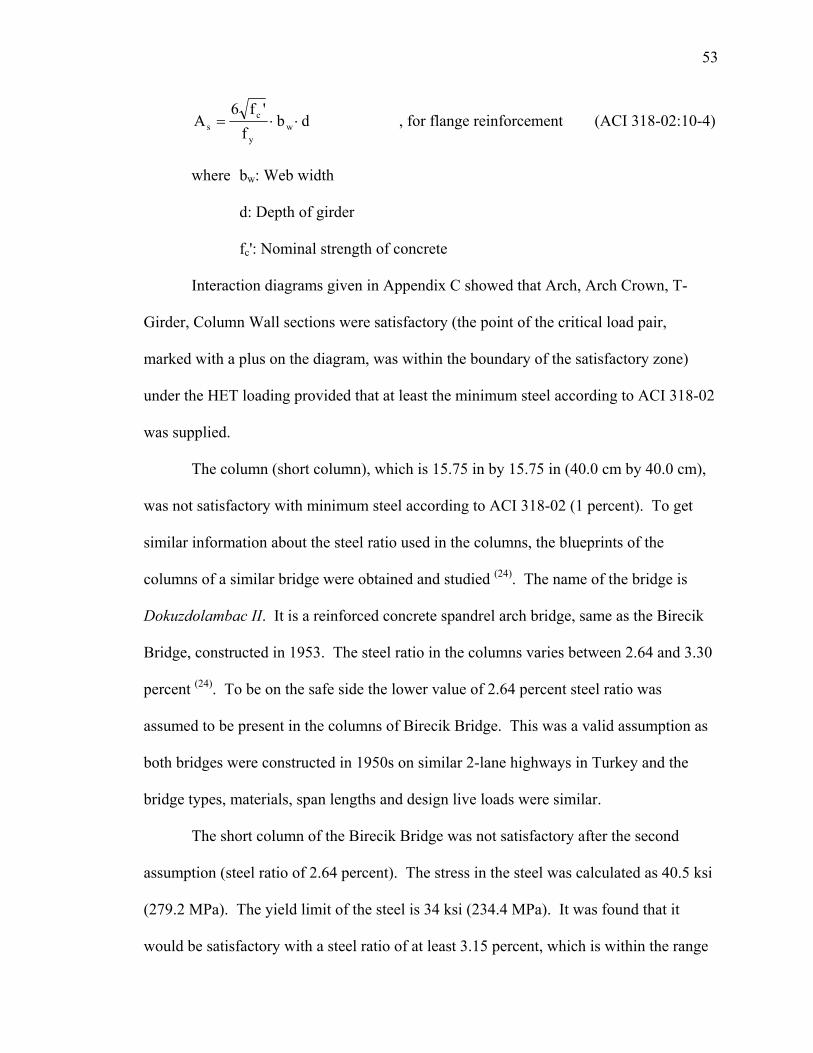
53
dbf
'f6A w
y
cs ⋅⋅= , for flange reinforcement (ACI 318-02:10-4)
where bw: Web width
d: Depth of girder
fc': Nominal strength of concrete
Interaction diagrams given in Appendix C showed that Arch, Arch Crown, T-
Girder, Column Wall sections were satisfactory (the point of the critical load pair,
marked with a plus on the diagram, was within the boundary of the satisfactory zone)
under the HET loading provided that at least the minimum steel according to ACI 318-02
was supplied.
The column (short column), which is 15.75 in by 15.75 in (40.0 cm by 40.0 cm),
was not satisfactory with minimum steel according to ACI 318-02 (1 percent). To get
similar information about the steel ratio used in the columns, the blueprints of the
columns of a similar bridge were obtained and studied (24). The name of the bridge is
Dokuzdolambac II. It is a reinforced concrete spandrel arch bridge, same as the Birecik
Bridge, constructed in 1953. The steel ratio in the columns varies between 2.64 and 3.30
percent (24). To be on the safe side the lower value of 2.64 percent steel ratio was
assumed to be present in the columns of Birecik Bridge. This was a valid assumption as
both bridges were constructed in 1950s on similar 2-lane highways in Turkey and the
bridge types, materials, span lengths and design live loads were similar.
The short column of the Birecik Bridge was not satisfactory after the second
assumption (steel ratio of 2.64 percent). The stress in the steel was calculated as 40.5 ksi
(279.2 MPa). The yield limit of the steel is 34 ksi (234.4 MPa). It was found that it
would be satisfactory with a steel ratio of at least 3.15 percent, which is within the range
54
of steel reinforcing in the Dokuzdolambac II Bridge. It was concluded that the (short)
column was not safe for the HET loading. The interaction diagrams for 1 and 2.64
percent steel ratios are given in Appendix C.
9) Column Stability Considering Slenderness Effect
Column 2 (shown in Figure 4.7), the most critical slender column of the Birecik
Bridge, was checked considering the slenderness effect using moment magnification
method.
Clear length of the column, l = 305.7 in (7.8 m)
Dimensions of the column (h x h) = 15.75 in x 15.75 in (40.0 cm x 40.0 cm)
Radius of gyration, r = 0.3h = in 75.153.0 ⋅ = 4.73 in (0.12 m)
Axial force in the column, P = 116.4 kips (517.8 kN) (from Table 4.2)
Moment at the top, M1 = 30.6 kips-ft (41.5 kN-m)
Moment at the bottom, M2 = 55.0 kips-ft (74.6 kN-m)
These were the highest end moments causing single curvature. There was a
possibility that this column be in double curvature with smaller end moments. Single
curvature with higher end moments was checked as it was the most critical case.
For a sway (unbraced) frame;
According to AASHTO-SSHB 8.16.5.2.6, moment magnification method can be
used only if the slenderness of the column is smaller than 100 ( 100r
lk<
⋅ ). The column
was analyzed assuming the worst case ( 100r
lk=
⋅ ). If the slenderness was greater than
100, then the column would be subject to an analysis considering material non-linearity
and cracking, effects of member curvature and lateral drift, duration of the loads,
55
shrinkage and creep, and interaction with the supporting foundation (ACI 318-02
10.10.1). This analysis, which requires more information about the structure, was beyond
the scope of this research study. Therefore the length factor, k, was calculated by
assuming that the slenderness was equal to 100.
Length factor, k = 1.54
Magnified moment, Mc, is defined by:
2c MM ⋅= δ (AASHTO-SSHB 8-40)
, where δ , the magnification factor, is defined by:
0.1
PP
1
1
c
≥
⋅−
=
∑∑
φ
δ (AASHTO-SSHB 8-41A)
, where Pc, the critical load, is defined by:
2
2
c )l(kEIπP
⋅⋅
= (AASHTO-SSHB 8-42)
, where EI, flexural stiffness, is defined by:
d
gc
1IE4.0
EIβ+⋅⋅
= (AASHTO-SSHB 8-43)
,where P = Axial load
Ec= Modulus of elasticity of concrete
Ig = Moment of inertia of gross area
dβ = Ratio of maximum dead load moment to total load moment.
dβ , obtained from SAP2000 analysis, was 0.16.
These calculations showed that,
δ = 1.85
56
Therefore,
8.1015585.1Mc =⋅= kips-ft (138.0 kN-m)
The slender column was found to be satisfactory for these forces as shown in the
interaction diagram, given in Appendix C (Figure C.6).
10) Punching Shear in Arch
If the shear force applied to the arch slab by a column was greater than the
punching shear capacity of the arch slab then the column would penetrate (‘punch’)
through the arch slab. The punching shear was checked according to ACI 318-02.
According to ACI 318-02, punching shear capacity of an arch is the smallest of:
a) db'f)β4(2V 0c
cc ⋅⋅+= (ACI 318-02 11-35)
b) db'f)b
dα(2V 0c
0
sc ⋅⋅
⋅+= (ACI 318-02 11-36)
c) db'f4V 0cc ⋅⋅= (ACI 318-02 11-37)
where Vc : Punching capacity
cβ : The ratio of long side to short side of the column
fc': Nominal strength of concrete
b0 : Perimeter of the critical section (ACI 318-02: 11.12.1.2)
d : Depth of the section
sα : Constant (40 for interior columns, 30 for edge columns)
The maximum shear force = 116.1 kips (516.4 kN) (from Table 4.2)
For edge column, the capacity was calculated according to ACI 318-02:11-37
(critical), given above. The capacity, Vc, was:
57
Vc = 664 kips (2,953.6 kN) > 116.1 kips (516.4 kN) O.K.
For interior column, the capacity was calculated according to ACI 318-02:11-35
(critical), given above. The capacity, Vc, was:
Vc = 996 kips (4,430.4 kN) > 116.1 kips (516.4 kN) O.K.
11) Shear Check in the Girder
Allowable shear stress in concrete is : vc = 'f95.0 c (AASHTO-SSHB 8.15.5.2.1)
Allowable shear to be carried by shear reinforcement, vs is :
vs = 'f4 c (AASHTO-SSHB 8.15.5.3.9)
Maximum allowable shear for the section, v is :
v = vc + vs = psi 282'f4.95'f4'f0.95 ccc ==+ (1.9 MPa)
Required web area = 2in 052ksi0.282
kips 70.57vV
== (0.13 m2)
,where V: Maximum shear force in the girder (from Table 4.2)
Actual web area = in 2.03in 15.75dbw ⋅=⋅
)m (0.13 in 052)m (0.31 in 475 2222 >= O.K.
Where bw: Web width
d: Depth of the girder
Hence concrete web area is satisfactory in regard to the shear stress.
Stress in the shear reinforcement (stirrups) was checked:
Allowable shear stress in concrete, vc= 'f95.0 c (AASHTO-SSHB 8.15.5.2.1)
58
vc = 54.2 psi (0.37 MPa)
Shear stress carried by steel, vs:
psi .117psi 54.2in 30.2in 15.75
lbs 006,95vdb
Vv cw
s =−⋅
=−⋅
= (0.49 MPa)
Assuming that minimum shear reinforcement was used,
y
wv
fb
50s
A= (Minimum shear reinforcement according to ACI 318-02:11-13)
where Av: Area of shear reinforcement
s: Spacing of the stirrups
0.0232s
A v = in2/in , supplied (the minimum shear reinforcement)
Check stress in the stirrup with the minimum steel, fs:
in/in 0.0232in 15.75psi .117
sAbv
f 2v
wss
⋅=
⋅=
psi 270,84fs = (332.8 MPa) > 34,000 psi (234.4 MPa) (yield limit stress)
Minimum steel was not satisfactory for shear reinforcement in the girders. As the
minimum steel was not satisfactory the information for shear reinforcement was obtained
from the blueprints of Dokuzdolambac II Bridge. It was found that the diameter of the
stirrups was 1.2 cm and they were installed with a 25 cm spacing (24). This amount of
steel was almost the same as #4 stirrups placed every 10 in (0.254 m). Therefore it was
assumed that #4 stirrups were present at every 10 in (0.254 m) throughout the beam.
Checking the stress in the stirrup with the new steel ratio assumption;
in 10in 0.4in 15.75psi .117
sAbv
f 2v
wss
⋅=
⋅=
59
psi 000,82fs = (193.1 MPa) > 20,000 psi (137.9 MPa) (allowable stress)
< 34,000 psi (234.4 MPa) (yield limit)
Stress in the stirrup was 40 percent higher than the allowable stress. It was still
lower than the minimum yield limit, which was acceptable (as the steel did not yield)
considering the conservative approach used in the analysis (HET was assumed to have 18
tires instead of 28, which resulted in higher concentrated loads and higher distribution
factor than the actual case).
4.3 Summary of Results
An open spandrel reinforced concrete arch bridge, constructed in 1956, was
analyzed according to AASHTO-SSHB with no load factors using the HET as the live
load. The calculations did not consider any factors of safety. Neither the loads nor the
section capacities were factored. The only safety factors included in the calculations
were due to the use of allowable stresses instead of the nominal strength for the materials.
4.3.1 Slab
It was assumed that the minimum reinforcement steel according to ACI 318-02
was used. Thickness of the slab and the main steel were satisfactory. The section was
adequate against shear failure.
4.3.2 2-D Computer Model
The analysis of a 2-D model in SAP2000 and in PCACOL showed that all bridge
members except the columns were satisfactory assuming minimum amount of steel in
each section. The columns, on the other hand, were not satisfactory assuming the
minimum steel was used. In order to make another assumption, the blueprints of an
identical bridge were studied. The steel ratio used in the columns of this bridge
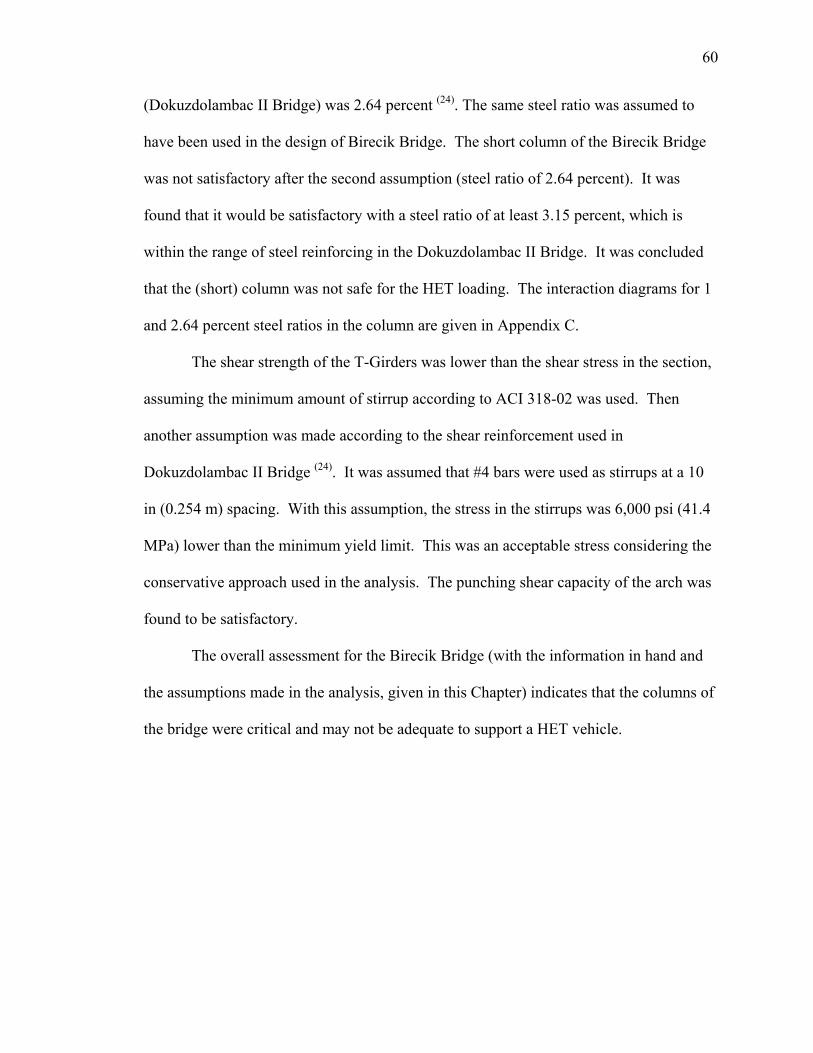
60
(Dokuzdolambac II Bridge) was 2.64 percent (24). The same steel ratio was assumed to
have been used in the design of Birecik Bridge. The short column of the Birecik Bridge
was not satisfactory after the second assumption (steel ratio of 2.64 percent). It was
found that it would be satisfactory with a steel ratio of at least 3.15 percent, which is
within the range of steel reinforcing in the Dokuzdolambac II Bridge. It was concluded
that the (short) column was not safe for the HET loading. The interaction diagrams for 1
and 2.64 percent steel ratios in the column are given in Appendix C.
The shear strength of the T-Girders was lower than the shear stress in the section,
assuming the minimum amount of stirrup according to ACI 318-02 was used. Then
another assumption was made according to the shear reinforcement used in
Dokuzdolambac II Bridge (24). It was assumed that #4 bars were used as stirrups at a 10
in (0.254 m) spacing. With this assumption, the stress in the stirrups was 6,000 psi (41.4
MPa) lower than the minimum yield limit. This was an acceptable stress considering the
conservative approach used in the analysis. The punching shear capacity of the arch was
found to be satisfactory.
The overall assessment for the Birecik Bridge (with the information in hand and
the assumptions made in the analysis, given in this Chapter) indicates that the columns of
the bridge were critical and may not be adequate to support a HET vehicle.
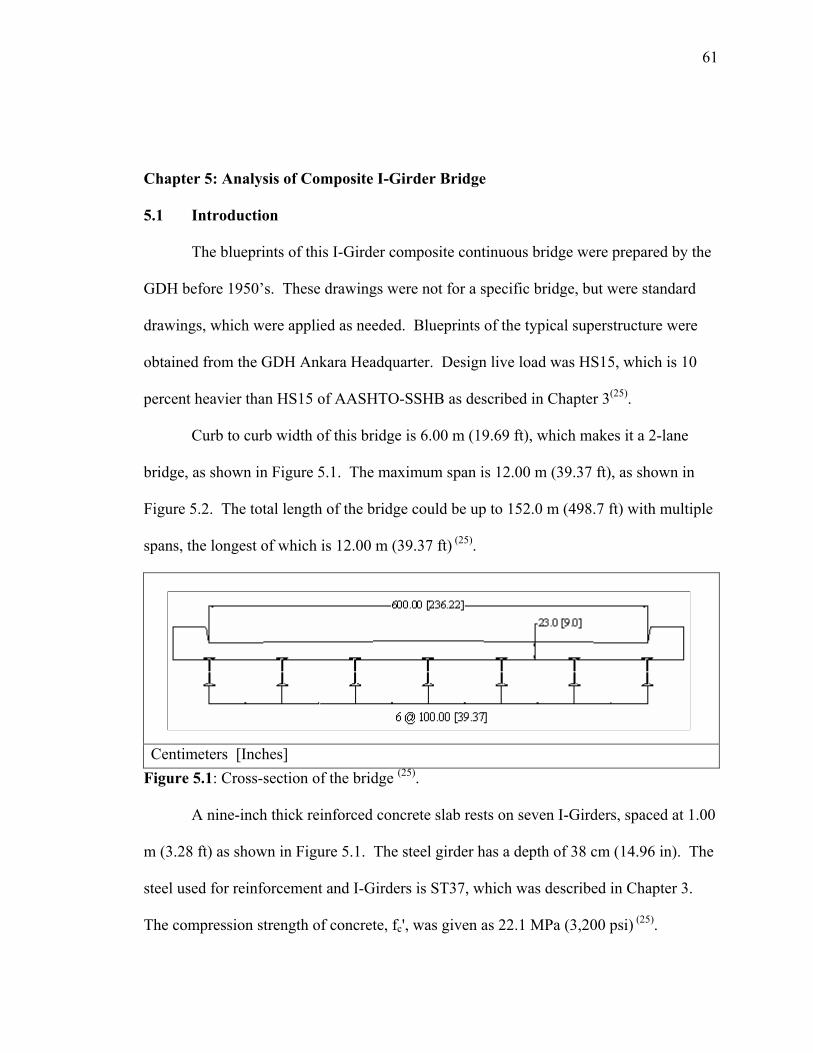
61
Chapter 5: Analysis of Composite I-Girder Bridge
5.1 Introduction
The blueprints of this I-Girder composite continuous bridge were prepared by the
GDH before 1950’s. These drawings were not for a specific bridge, but were standard
drawings, which were applied as needed. Blueprints of the typical superstructure were
obtained from the GDH Ankara Headquarter. Design live load was HS15, which is 10
percent heavier than HS15 of AASHTO-SSHB as described in Chapter 3(25).
Curb to curb width of this bridge is 6.00 m (19.69 ft), which makes it a 2-lane
bridge, as shown in Figure 5.1. The maximum span is 12.00 m (39.37 ft), as shown in
Figure 5.2. The total length of the bridge could be up to 152.0 m (498.7 ft) with multiple
spans, the longest of which is 12.00 m (39.37 ft) (25).
Centimeters [Inches] Figure 5.1: Cross-section of the bridge (25).
A nine-inch thick reinforced concrete slab rests on seven I-Girders, spaced at 1.00
m (3.28 ft) as shown in Figure 5.1. The steel girder has a depth of 38 cm (14.96 in). The
steel used for reinforcement and I-Girders is ST37, which was described in Chapter 3.
The compression strength of concrete, fc', was given as 22.1 MPa (3,200 psi) (25).
62
Figure 5.2: Layout of the bridge (25).
5.2 Analysis of the I-Girder Bridge
Slab, exterior girder and interior girder, were checked using the ASD approach
given in AASHTO-SSHB. The substructure of the bridge was not analyzed as the focus
of the research was primarily on the superstructure.
The bridge was also modeled using SAP2000 and the internal forces were
obtained from a 2-D analysis. Only the primary loads; dead load, live load and impact,
were applied to the structure. Only one HET vehicle at a time was assumed to be on the
bridge, as prescribed in AASHTO-SSHB. Actual strengths of the sections were
calculated without introducing strength reduction factors, described in Chapter 4. Loads
were not modified by any factor.
5.2.1 Slab
1) Effective Span
Computation of the effective span length, S was made according to
AASHTO-SSHB 3.24.1.2b.
ft 034.3ft/in 12
in 9.55.0ft 28.3S =⋅−= (0.92 m)
2) Dead Load
Dead load of the slab was calculated in terms of pressure (ksf).
Self weight of slab, w1: w1= t ⋅ γ
where t: thickness of slab in feet
γ: Unit weight of concrete
63
w1= 1125.0kcf 150.0ft/in 12
in 9=⋅ ksf (5.3865 kPa)
Wearing surface, assumed, w2: w2= 0.0275 ksf (1.3167 kPa)
Total dead load, w: ksf 0.1400275.01125.0 w w w 21 =+=+= (6.703 kPa)
Dead load moment, MD:
ftk 129.010
)ft 034.3(ksf 14.010
SwM22
D −=⋅
=⋅
±= (0.175 kN-m)
3) Live Load
Live load moment at midspan, ML, was calculated according to the formula given
in AASHTO-SSHB 3.24.3.1 using the rear wheel of HET as the loading.
Rear wheel load of HET, PHET = 15.7 kips (69.8 kN)
976.1kips 7.1532
2ft 034.38.0P32
2S8.0M HETL =⋅+
⋅=⋅+
⋅= k-ft (2.679 kN-m)
where S: Effective span length in feet.
Impact Factor, I: (AASHTO-SSHB 3.8.2.1)
3.039.0125ft 034.3
50125S
50I >=+
=+
= (Maximum allowable)
Hence I = 0.3
ML+I = 569.2ftk 976.1)3.01(M)I1( L =−⋅+=⋅+ k-ft (3.483 kN-m)
The total design moment, MT = MD + ML+I
MT = 0.129 k-ft + 2.569 k-ft = 2.698 k-ft (3.658 kN-m)
4) Main Steel
Yield stress for ST37 steel is given in Turkish Standards (TS-648).
fy: 34,000 psi (234.4 MPa)
Allowable stress for ST37 steel is given in Turkish Standards (TS-648).
64
fs: 20,000 psi (137.9 MPa)
According to ACI 318-02, the allowable stress for reinforced concrete is 0.4 times
of the concrete nominal strength (fc').
fc= psi 200,34.0'f4.0 c ⋅=⋅ = 1,280 psi (8.8 MPa)
Modular ratio (n), the ratio of the modulus of elasticity of steel to that of concrete,
is given in AASHTO-SSHB 10.38.1.3. Modular ratio is dependant on the concrete
nominal strength (fc').
n = 9 for fc'=3,200 psi (22.1 MPa)
The design coefficients k (neutral axis factor), and j (lever-arm factor) were
calculated.
365.0
psi 280,1psi 000,209
9
ff
n
nk
c
s=
+=
+=
878.03k1j =−=
Required slab depth, dr:
jkf5.0M
dc
Tr ⋅⋅⋅=
cm) (17.78 in 7cm) (9.22 in 63.3878.0365.0psi 280,15.0
ftlbs 698,2dr <=⋅⋅⋅
−= OK.
Supplied main steel = 0.57 in2 (3.68 cm2) per foot of slab (25).
Required steel, As:
djfM
As
Ts ⋅⋅= ft/in 12
in 7878.0psi 000,20ftlbs 698,2
⋅⋅⋅
−=
26.0As = in2 (1.68 cm2) < 0.57 in2 (3.68 cm2) OK.
65
5) Distribution Steel (AASHTO-SSHB 3.24.10.2)
Supplied distribution steel = 0.244 in2 (1.57 cm2) per foot of slab (25).
Percentage = % 67% 125034.3
220S
220>== (Maximum allowable)
The amount of distribution steel can be at most 67 percent of the supplied main
steel. Therefore, the required distribution steel is,
Required steel = 176.0in 263.067.0 2 =⋅ in2 (1.14 cm2)
< 0.244 in2 (1.57 cm2) OK.
6) Temperature Steel
According to AASHTO-SSHB 8.20, the required temperature steel per foot of
slab should be constant and equal to 0.125 in2 (0.806 cm2).
Supplied temperature steel = 0.487 in2 (3.142 cm2) per foot of slab (25).
Required steel = 0.125 in2 (0.806 cm2) < 0.487 in2 (3.142 cm2) OK.
7) Column Punching
According to AASHTO 8.15.5.6.1, the slab should be checked for punching shear
in the vicinity of concentrated loads and reactions. The punching of the column into the
slab was neglected, since the columns of the bridge support the I-Girders, which in turn
support the slab.
8) Tire Punching
If the load applied to the slab by a tire was greater than the punching shear
capacity of the slab, the tire would penetrate (‘punch’) through the slab. The punching
shear of a tire of the HET was checked according to AASHTO-SSHB 8.15.5.6.
According to AASHTO-SSHB 3.30, the contact area of the tire is:
66
P01.0A ⋅=
where A = Contact area (in2)
P = Load on the tire (lbs)
The most critical tire was one of the rear tires, for which the load was 7,850 lbs
(34.92 kN). For this load, the contact area was calculated as 78.5 in2 (506.5 cm2), using
the equation given above. The contact area is given as a rectangle, for which the ratio of
the long side to the short side is 2.5. Therefore the rectangle was 14 in x 5.6 in (0.36 m x
0.14 m). Punching stress is calculated by;
dbVv0 ⋅
= (AASHTO-SSHB 8-12)
where, v = Shear stress
b0 : Perimeter of the critical section (AASHTO-SSHB 8.15.5.6.1b)
d : Depth of the section
'f8.1'f)β28.0(v cc
cc <+= (AASHTO-SSHB 8-13)
where vc : Punching shear stress capacity
fc': Nominal strength of concrete
Therefore, punching shear capacity, Vc, is:
Vc = 9.42dbv 0c =⋅⋅ kips (190.8 kN)
Tire Load = 7.85 kips (34.92 kN) < 42.9 kips (190.8 kN) O.K.
5.2.2 Girders
Curb and railing load was assumed to be distributed equally to all stringers as per
AASHTO-SSHB 3.23.2.3.1.1.
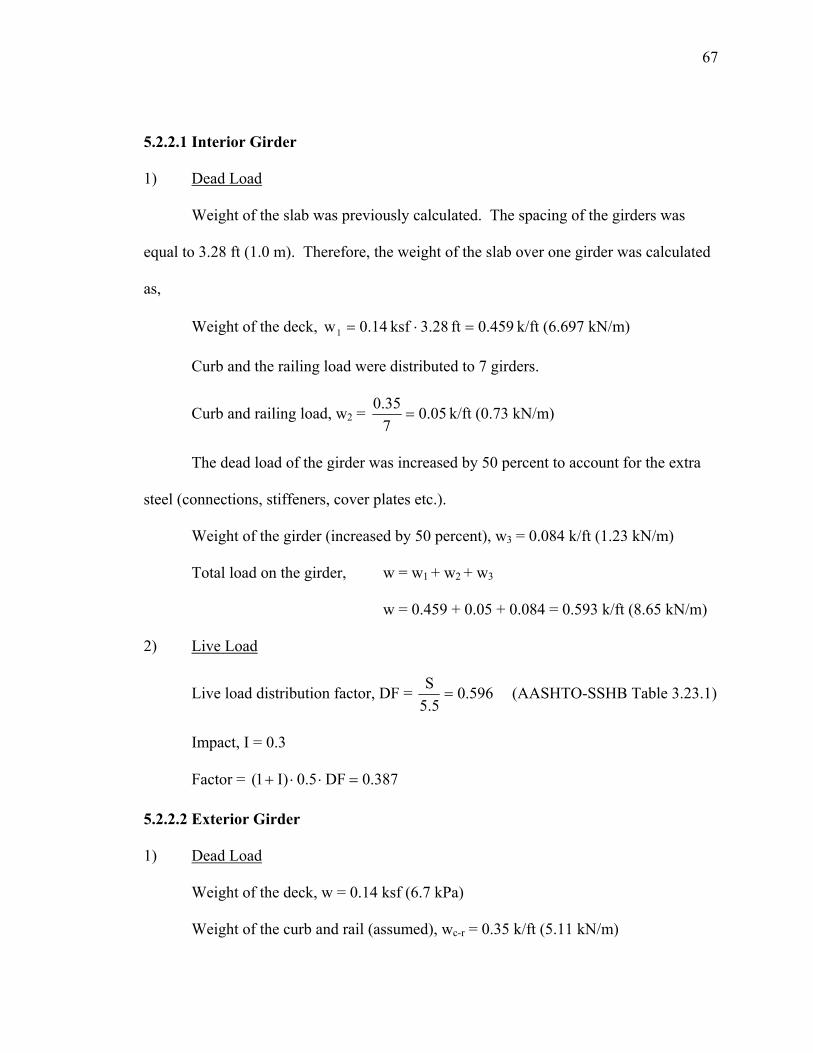
67
5.2.2.1 Interior Girder
1) Dead Load
Weight of the slab was previously calculated. The spacing of the girders was
equal to 3.28 ft (1.0 m). Therefore, the weight of the slab over one girder was calculated
as,
Weight of the deck, 459.0ft 28.3ksf 14.0w1 =⋅= k/ft (6.697 kN/m)
Curb and the railing load were distributed to 7 girders.
Curb and railing load, w2 = 05.0735.0
= k/ft (0.73 kN/m)
The dead load of the girder was increased by 50 percent to account for the extra
steel (connections, stiffeners, cover plates etc.).
Weight of the girder (increased by 50 percent), w3 = 0.084 k/ft (1.23 kN/m)
Total load on the girder, w = w1 + w2 + w3
w = 0.459 + 0.05 + 0.084 = 0.593 k/ft (8.65 kN/m)
2) Live Load
Live load distribution factor, DF = 596.05.5
S= (AASHTO-SSHB Table 3.23.1)
Impact, I = 0.3
Factor = 387.0DF5.0)I1( =⋅⋅+
5.2.2.2 Exterior Girder
1) Dead Load
Weight of the deck, w = 0.14 ksf (6.7 kPa)
Weight of the curb and rail (assumed), wc-r = 0.35 k/ft (5.11 kN/m)
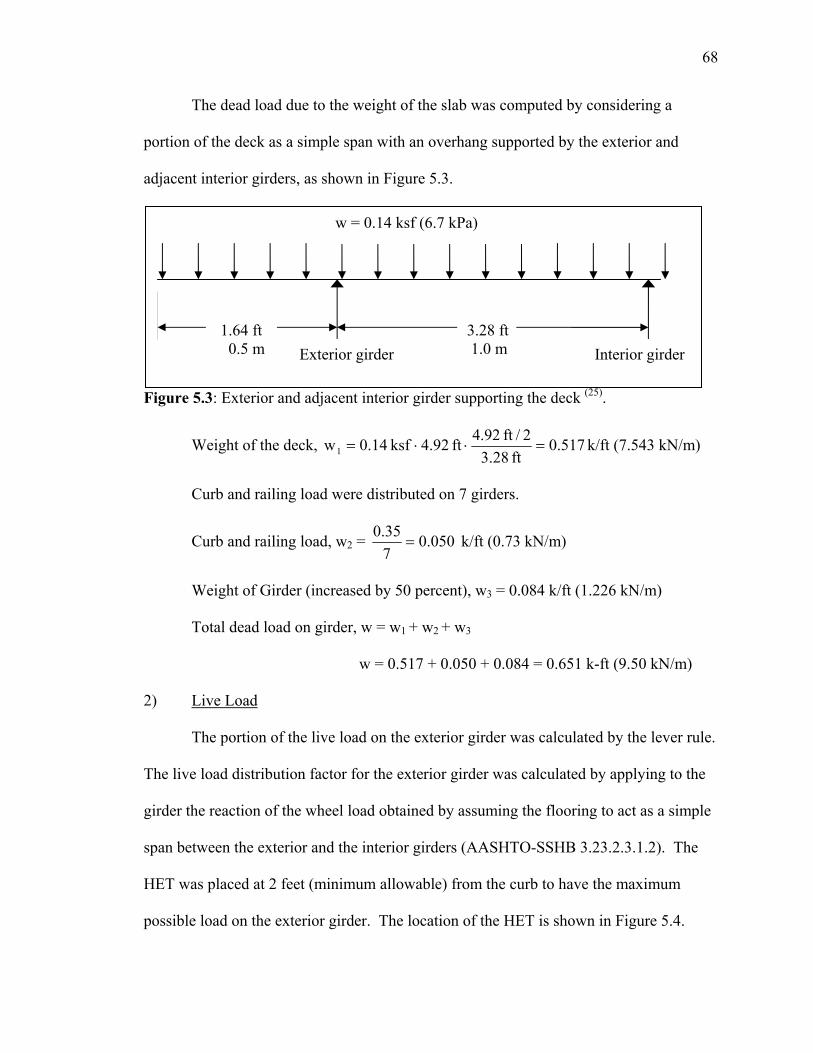
68
The dead load due to the weight of the slab was computed by considering a
portion of the deck as a simple span with an overhang supported by the exterior and
adjacent interior girders, as shown in Figure 5.3.
Figure 5.3: Exterior and adjacent interior girder supporting the deck (25).
Weight of the deck, 517.0ft28.3
2/ft 92.4ft 92.4ksf 14.0w1 =⋅⋅= k/ft (7.543 kN/m)
Curb and railing load were distributed on 7 girders.
Curb and railing load, w2 = 050.0735.0
= k/ft (0.73 kN/m)
Weight of Girder (increased by 50 percent), w3 = 0.084 k/ft (1.226 kN/m)
Total dead load on girder, w = w1 + w2 + w3
w = 0.517 + 0.050 + 0.084 = 0.651 k-ft (9.50 kN/m)
2) Live Load
The portion of the live load on the exterior girder was calculated by the lever rule.
The live load distribution factor for the exterior girder was calculated by applying to the
girder the reaction of the wheel load obtained by assuming the flooring to act as a simple
span between the exterior and the interior girders (AASHTO-SSHB 3.23.2.3.1.2). The
HET was placed at 2 feet (minimum allowable) from the curb to have the maximum
possible load on the exterior girder. The location of the HET is shown in Figure 5.4.
w = 0.14 ksf (6.7 kPa)
Exterior girder Interior girder1.64 ft 0.5 m
3.28 ft 1.0 m
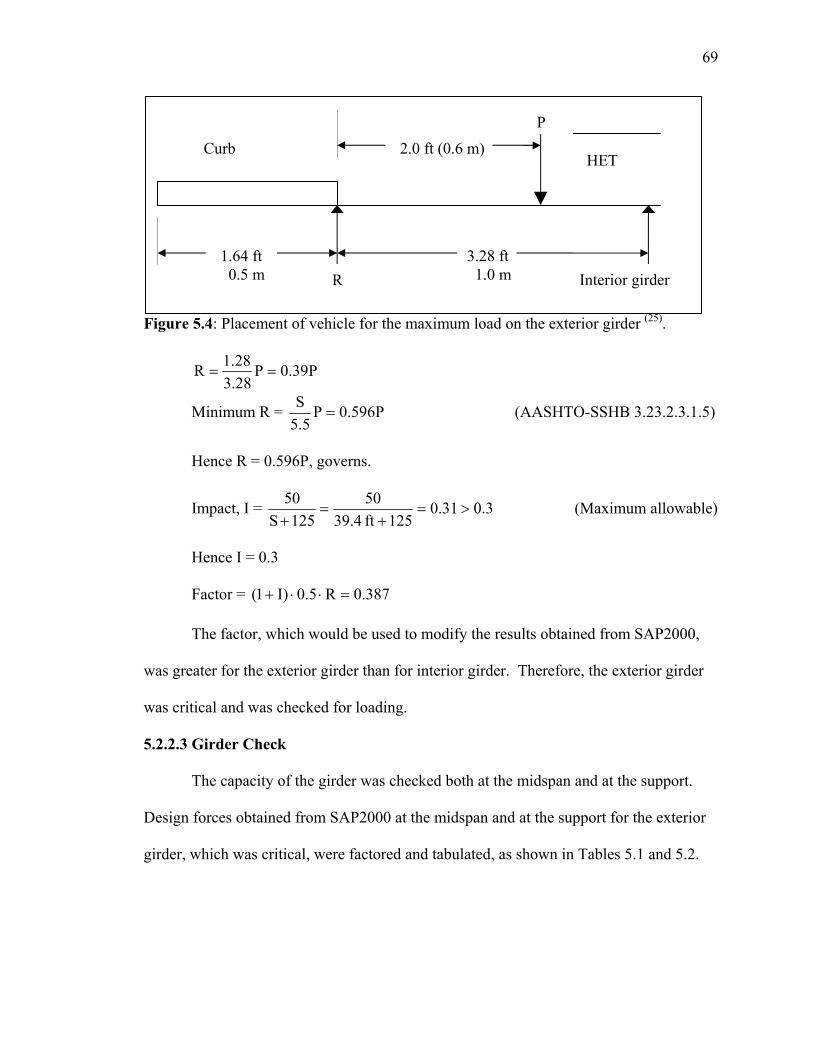
69
Figure 5.4: Placement of vehicle for the maximum load on the exterior girder (25).
P39.0P28.328.1R ==
Minimum R = P596.0P5.5
S= (AASHTO-SSHB 3.23.2.3.1.5)
Hence R = 0.596P, governs.
Impact, I = 3.031.0125ft4.39
50125S
50>=
+=
+ (Maximum allowable)
Hence I = 0.3
Factor = 387.0R5.0)I1( =⋅⋅+
The factor, which would be used to modify the results obtained from SAP2000,
was greater for the exterior girder than for interior girder. Therefore, the exterior girder
was critical and was checked for loading.
5.2.2.3 Girder Check
The capacity of the girder was checked both at the midspan and at the support.
Design forces obtained from SAP2000 at the midspan and at the support for the exterior
girder, which was critical, were factored and tabulated, as shown in Tables 5.1 and 5.2.
R Interior girder 1.64 ft 0.5 m
3.28 ft 1.0 m
2.0 ft (0.6 m) HET
Curb P
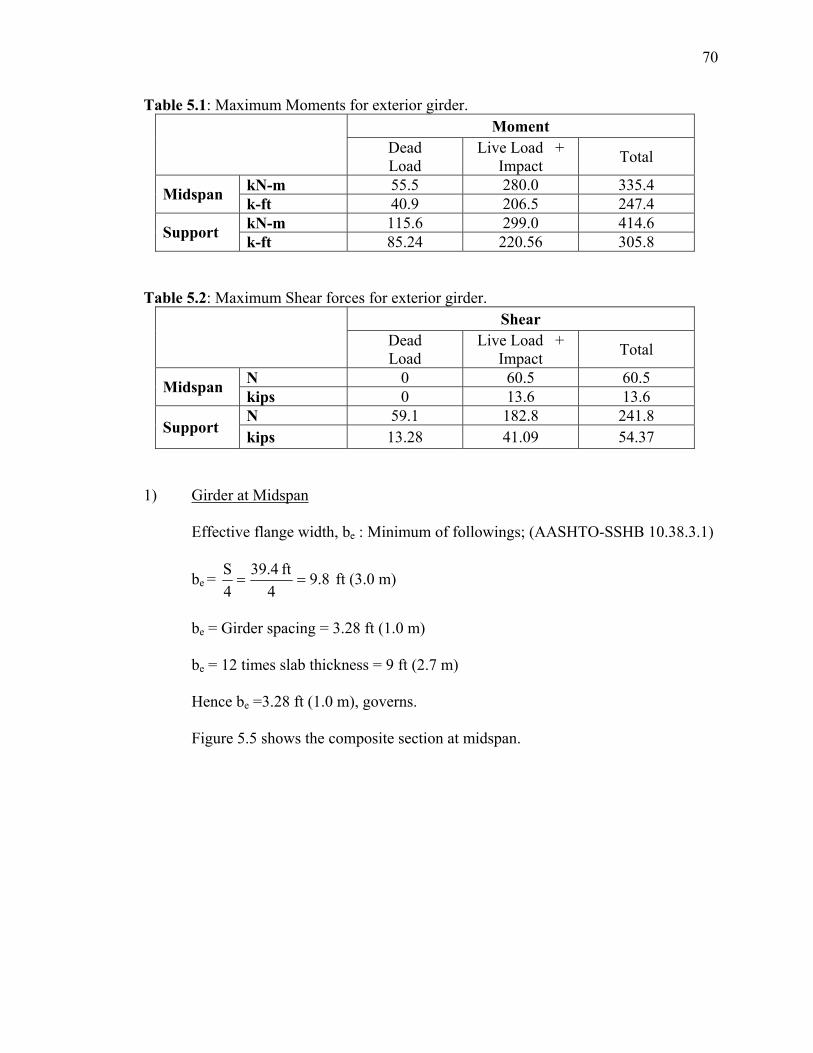
70
Table 5.1: Maximum Moments for exterior girder. Moment
Dead Load
Live Load + Impact Total
kN-m 55.5 280.0 335.4 Midspan k-ft 40.9 206.5 247.4 kN-m 115.6 299.0 414.6 Support k-ft 85.24 220.56 305.8
Table 5.2: Maximum Shear forces for exterior girder. Shear
Dead Load
Live Load + Impact Total
N 0 60.5 60.5 Midspan kips 0 13.6 13.6 N 59.1 182.8 241.8
Support kips 13.28 41.09 54.37
1) Girder at Midspan
Effective flange width, be : Minimum of followings; (AASHTO-SSHB 10.38.3.1)
be = 8.94
ft 4.394S
== ft (3.0 m)
be = Girder spacing = 3.28 ft (1.0 m)
be = 12 times slab thickness = 9 ft (2.7 m)
Hence be =3.28 ft (1.0 m), governs.
Figure 5.5 shows the composite section at midspan.
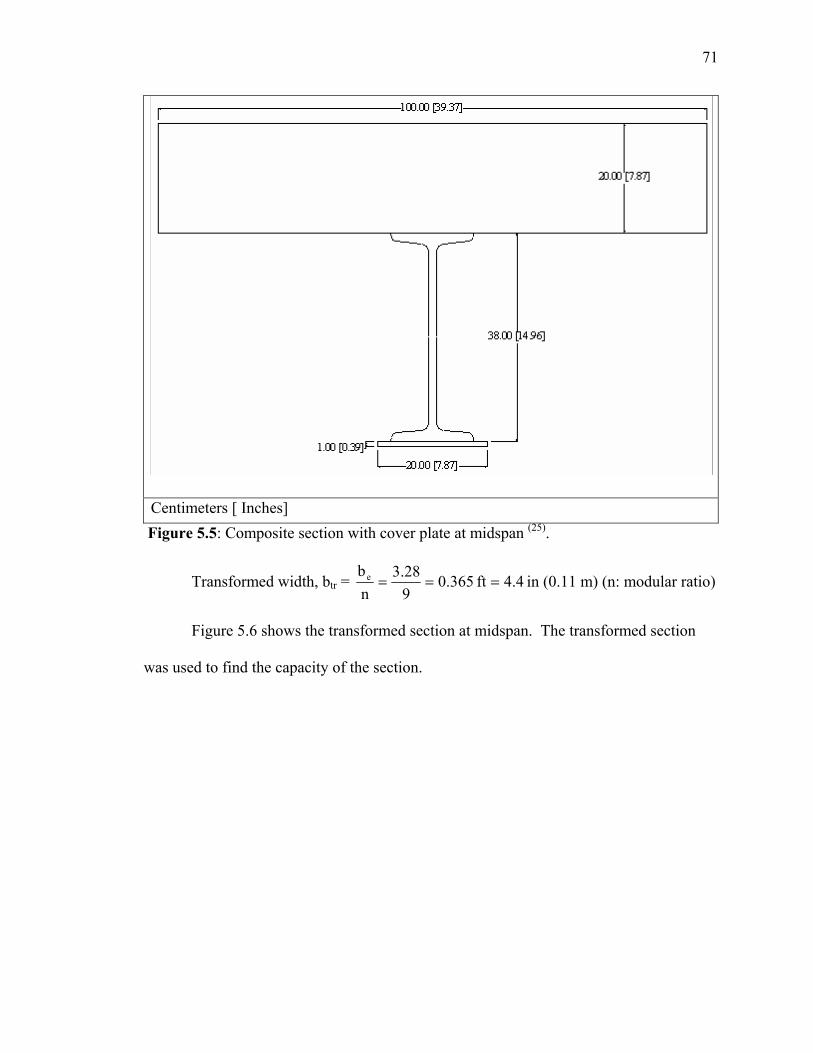
71
Centimeters [ Inches] Figure 5.5: Composite section with cover plate at midspan (25).
Transformed width, btr = 4.4ft 365.0928.3
nbe === in (0.11 m) (n: modular ratio)
Figure 5.6 shows the transformed section at midspan. The transformed section
was used to find the capacity of the section.
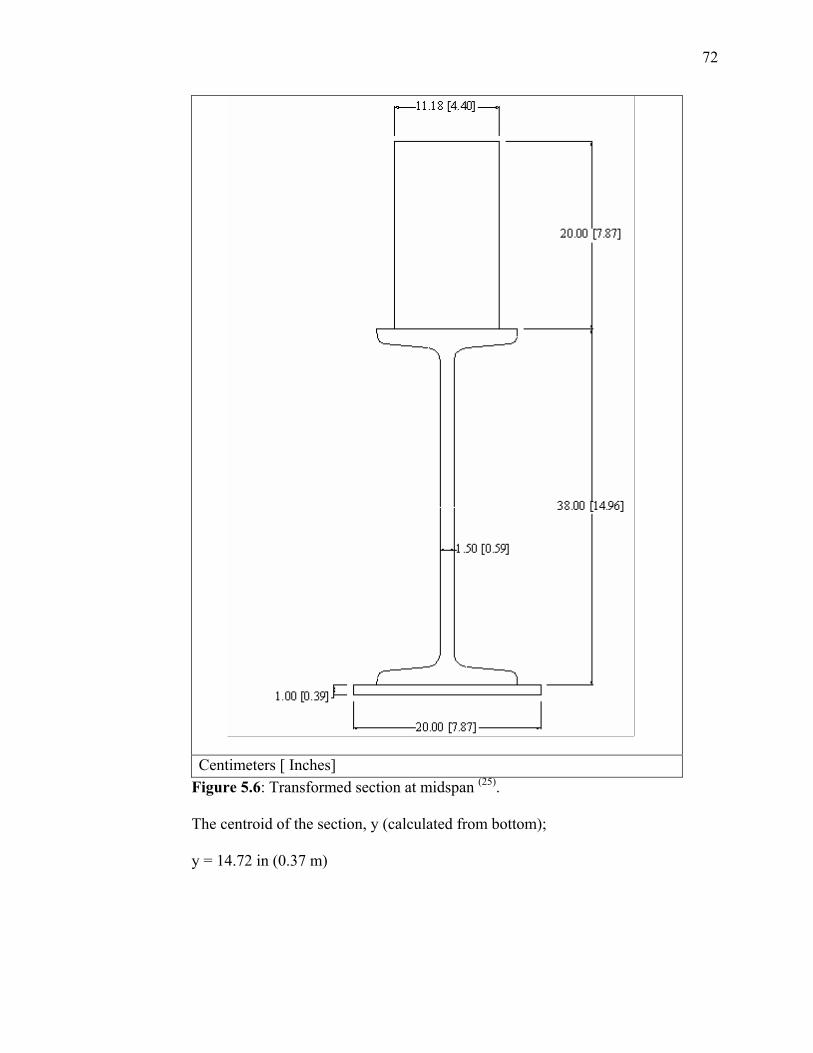
72
Centimeters [ Inches] Figure 5.6: Transformed section at midspan (25).
The centroid of the section, y (calculated from bottom);
y = 14.72 in (0.37 m)
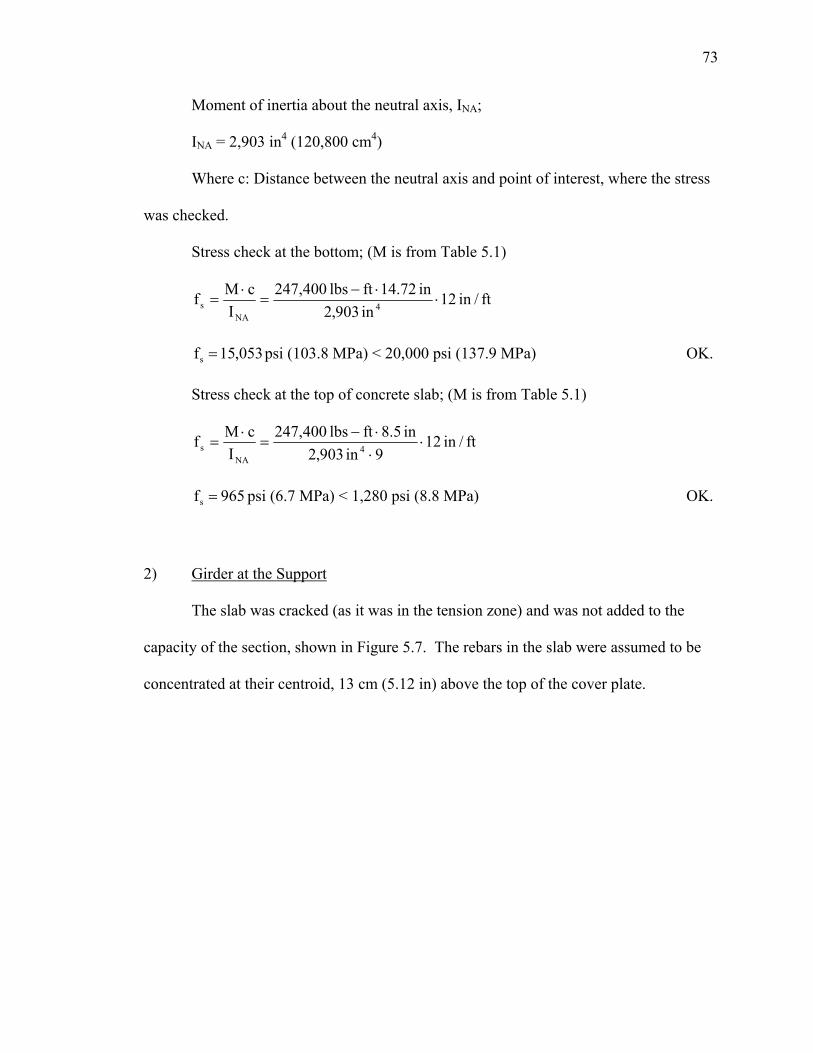
73
Moment of inertia about the neutral axis, INA;
INA = 2,903 in4 (120,800 cm4)
Where c: Distance between the neutral axis and point of interest, where the stress
was checked.
Stress check at the bottom; (M is from Table 5.1)
ft/in 12in 903,2
in 72.14ftlbs 400,247I
cMf 4NA
s ⋅⋅−
=⋅
=
053,15fs = psi (103.8 MPa) < 20,000 psi (137.9 MPa) OK.
Stress check at the top of concrete slab; (M is from Table 5.1)
ft/in 129in 903,2
in 5.8ftlbs 400,247I
cMf 4NA
s ⋅⋅⋅−
=⋅
=
965fs = psi (6.7 MPa) < 1,280 psi (8.8 MPa) OK.
2) Girder at the Support
The slab was cracked (as it was in the tension zone) and was not added to the
capacity of the section, shown in Figure 5.7. The rebars in the slab were assumed to be
concentrated at their centroid, 13 cm (5.12 in) above the top of the cover plate.
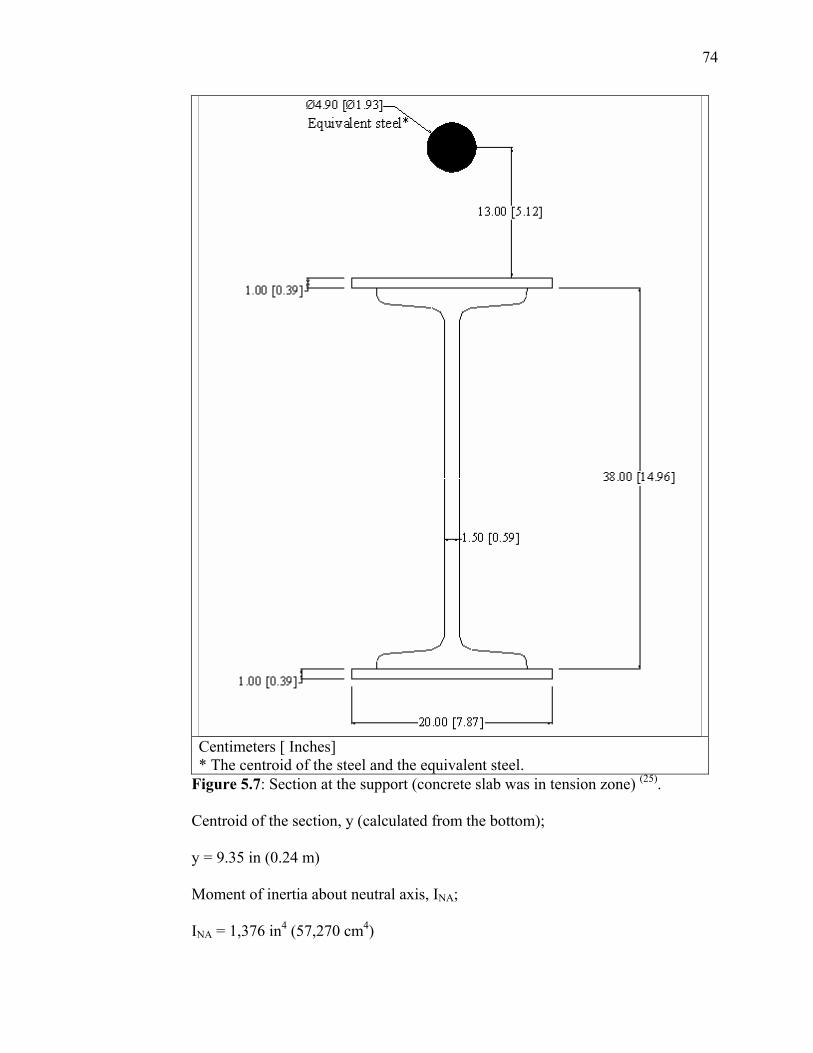
74
Centimeters [ Inches] * The centroid of the steel and the equivalent steel.
Figure 5.7: Section at the support (concrete slab was in tension zone) (25).
Centroid of the section, y (calculated from the bottom);
y = 9.35 in (0.24 m)
Moment of inertia about neutral axis, INA;
INA = 1,376 in4 (57,270 cm4)
75
c: Distance between the neutral axis and point of interest, where the stress was
checked.
Stress check at the bottom; (M is from Table 5.1)
801,24ft/in 12in 376,1
in 3.9ftlbs 800,305I
cMf 4NA
s =⋅⋅−
=⋅
= psi (171 MPa)
fs >20,000 psi (137.9 MPa) (allowable stress)
fs <34,000 psi (234.4 MPa) (yield limit stress)
Stress check at the reinforcement; (M is from Table 5.1)
695,30ft/in 12in 376,1
in 51.11ftlbs 800,305I
cMf 4NA
s =⋅⋅−
=⋅
= psi (211.6 MPa)
fs >20,000 psi (137.9 MPa) (allowable stress)
fs <34,000 psi (234.4 MPa) (yield limit stress)
Although the stresses in the cover plate and slab reinforcement were greater than
the allowable stresses, they were still under the yield limit stress. The stresses in the steel
did not cause failure in the material and the steel did not yield.
3) Shear Stress Check
Design shear stress, Vd = 54.37 kips (241.85 kN) (from Table 5.2)
Allowable shear stress, Fv
Fv 22.113433.0F33.0 y =⋅=⋅= ksi (77.36 MPa)
Shear stress was assumed to be carried entirely by the web of the girder and it was
assumed to be distributed uniformly in the web (AASHTO-SSHB 10.38.5.2).
76
Shear stress, fv = 16.6in 59.0in 96.14
kips 37.54td
V
w
=⋅
=⋅
ksi (42.47 MPa)
fv < 11.22 ksi (77.36 MPa) OK.
where V: Maximum shear force (Table 5.2)
d : depth of I-Girder
tw: thickness of web
5.3 Summary of Results
A composite steel I-Girder bridge, which has a maximum span of 12 m (39.37 ft),
was analyzed for the HET. Results of these analysis are given below for each individual
component of the bridge.
5.3.1 Slab
Thickness of the slab, main steel, and distribution and temperature steel used in
the slab were satisfactory. The slab was adequate against shear failure.
5.3.2 Girder
The exterior girder was analyzed as the stresses were higher than those in interior
girder. Shear stress in the girder was found to be carried safely.
For bending stress at the midspan section, the girder was satisfactory. On the
other hand, at the support section where the concrete slab was in tension zone and carries
no stress, the girder did not satisfy the allowable stress requirements neither in the rebars
at the top nor at the cover plate at the bottom. While both the top and the bottom stresses
due to bending were greater than the allowable, they were smaller than the yield limit for
the steel, ST37. The yield limit for ST37 steel is 34,000 psi (234.4 MPa). However, this
value presents the minimum yield limit for that material. The actual yield strength of
steel is typically higher than the minimum yield limit. The value of 34,000 psi (234.4
77
MPa) is not the average yield limit, but the minimum. Therefore, standard construction
steel (such as ST37) would typically have more capacity than the specified minimum
yield limit. The stress at the rebars, which was calculated as 30,600 psi (211 MPa), is
close to the yield limit for the steel. However it is smaller than the minimum yield limit,
34,000 psi (234.4 MPa).
To summarize, the capacity of the bridge according to the original drawings
(without introducing any factors of safety) was acceptable as none of the stresses
exceeded the minimum yield limits, although they were very high as described above.
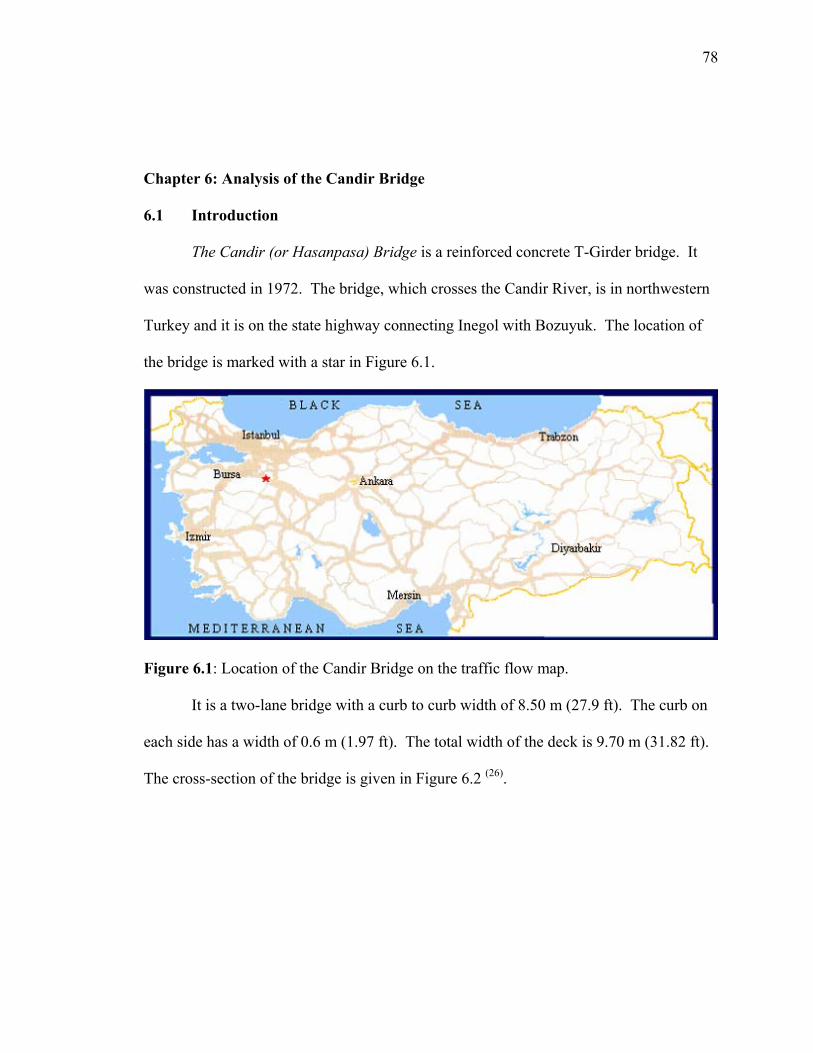
78
Chapter 6: Analysis of the Candir Bridge
6.1 Introduction
The Candir (or Hasanpasa) Bridge is a reinforced concrete T-Girder bridge. It
was constructed in 1972. The bridge, which crosses the Candir River, is in northwestern
Turkey and it is on the state highway connecting Inegol with Bozuyuk. The location of
the bridge is marked with a star in Figure 6.1.
Figure 6.1: Location of the Candir Bridge on the traffic flow map.
It is a two-lane bridge with a curb to curb width of 8.50 m (27.9 ft). The curb on
each side has a width of 0.6 m (1.97 ft). The total width of the deck is 9.70 m (31.82 ft).
The cross-section of the bridge is given in Figure 6.2 (26).
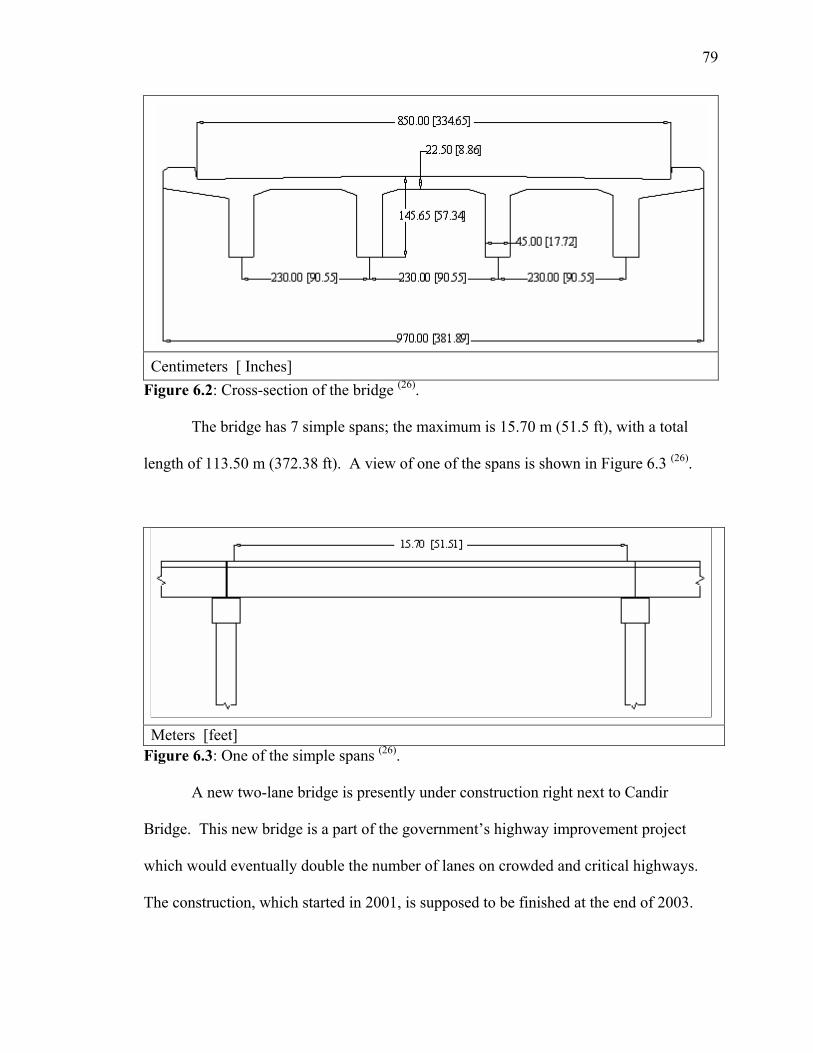
79
Centimeters [ Inches]
Figure 6.2: Cross-section of the bridge (26).
The bridge has 7 simple spans; the maximum is 15.70 m (51.5 ft), with a total
length of 113.50 m (372.38 ft). A view of one of the spans is shown in Figure 6.3 (26).
Meters [feet]
Figure 6.3: One of the simple spans (26).
A new two-lane bridge is presently under construction right next to Candir
Bridge. This new bridge is a part of the government’s highway improvement project
which would eventually double the number of lanes on crowded and critical highways.
The construction, which started in 2001, is supposed to be finished at the end of 2003.
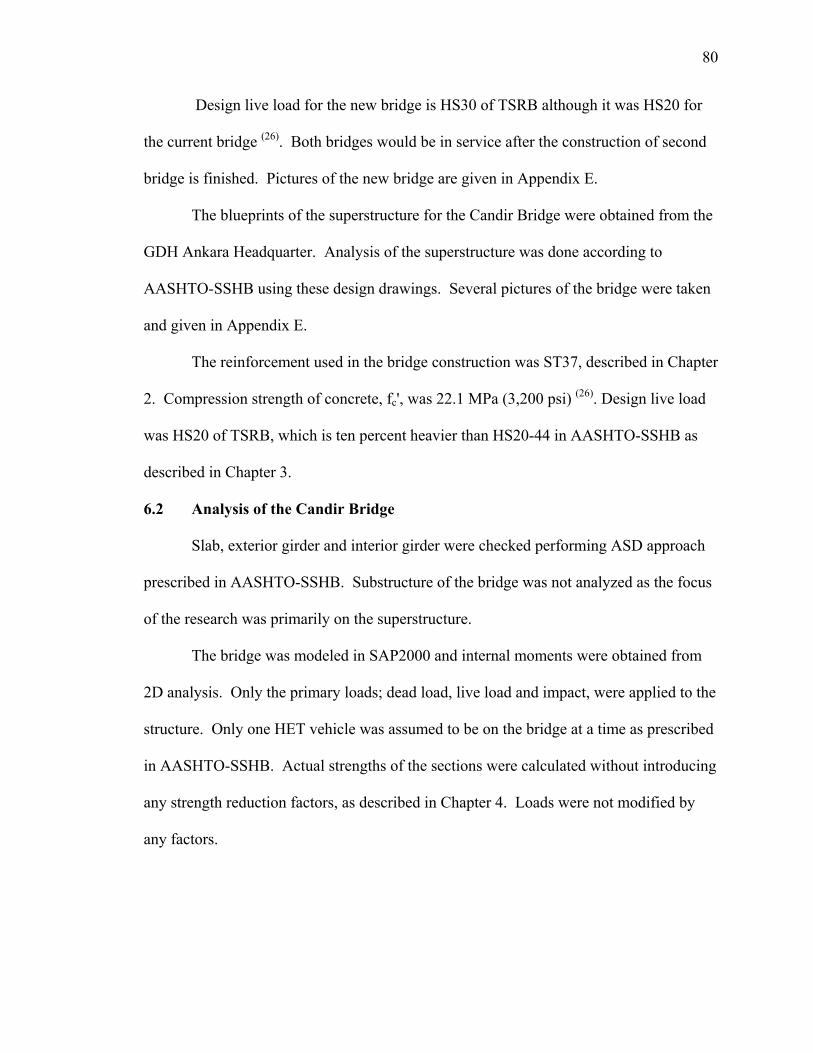
80
Design live load for the new bridge is HS30 of TSRB although it was HS20 for
the current bridge (26). Both bridges would be in service after the construction of second
bridge is finished. Pictures of the new bridge are given in Appendix E.
The blueprints of the superstructure for the Candir Bridge were obtained from the
GDH Ankara Headquarter. Analysis of the superstructure was done according to
AASHTO-SSHB using these design drawings. Several pictures of the bridge were taken
and given in Appendix E.
The reinforcement used in the bridge construction was ST37, described in Chapter
2. Compression strength of concrete, fc', was 22.1 MPa (3,200 psi) (26). Design live load
was HS20 of TSRB, which is ten percent heavier than HS20-44 in AASHTO-SSHB as
described in Chapter 3.
6.2 Analysis of the Candir Bridge
Slab, exterior girder and interior girder were checked performing ASD approach
prescribed in AASHTO-SSHB. Substructure of the bridge was not analyzed as the focus
of the research was primarily on the superstructure.
The bridge was modeled in SAP2000 and internal moments were obtained from
2D analysis. Only the primary loads; dead load, live load and impact, were applied to the
structure. Only one HET vehicle was assumed to be on the bridge at a time as prescribed
in AASHTO-SSHB. Actual strengths of the sections were calculated without introducing
any strength reduction factors, as described in Chapter 4. Loads were not modified by
any factors.
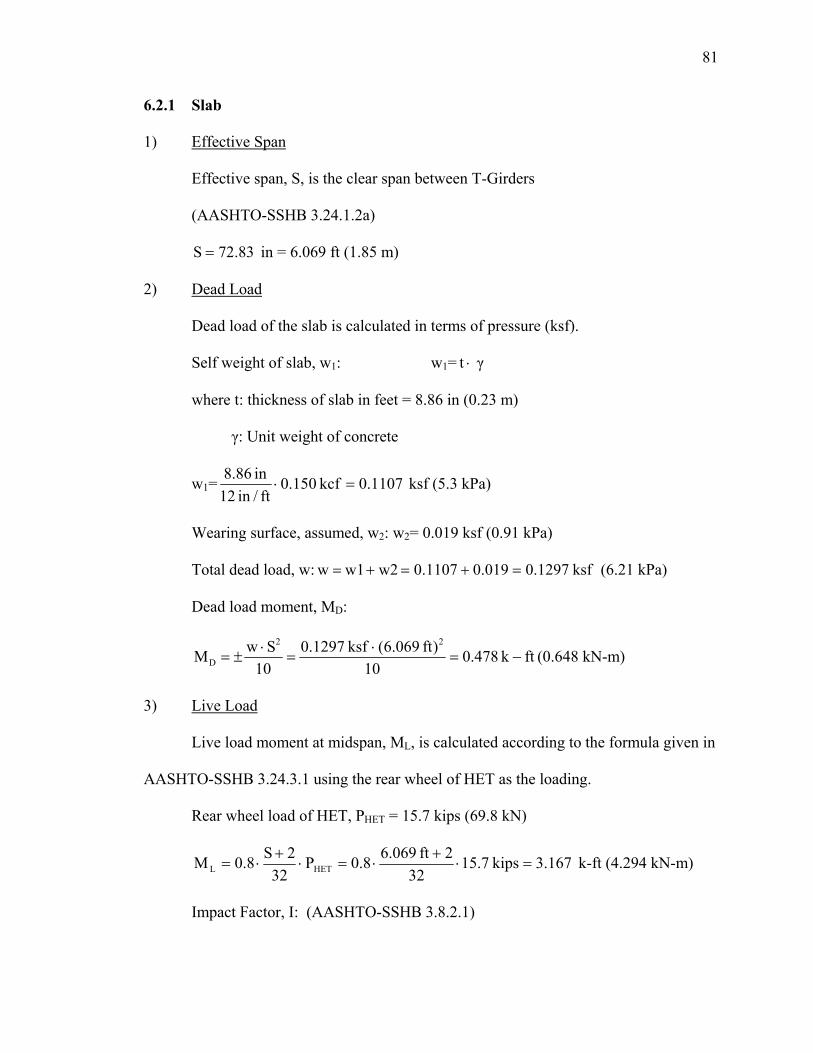
81
6.2.1 Slab
1) Effective Span
Effective span, S, is the clear span between T-Girders
(AASHTO-SSHB 3.24.1.2a)
83.72S = in = 6.069 ft (1.85 m)
2) Dead Load
Dead load of the slab is calculated in terms of pressure (ksf).
Self weight of slab, w1: w1= ⋅t γ
where t: thickness of slab in feet = 8.86 in (0.23 m)
γ: Unit weight of concrete
w1= 1107.0kcf 150.0ft/in 12
in 86.8=⋅ ksf (5.3 kPa)
Wearing surface, assumed, w2: w2= 0.019 ksf (0.91 kPa)
Total dead load, w: ksf 0.1297019.01107.0 w2 w1 w =+=+= (6.21 kPa)
Dead load moment, MD:
ftk 478.010
)ft 069.6(ksf 1297.010
SwM22
D −=⋅
=⋅
±= (0.648 kN-m)
3) Live Load
Live load moment at midspan, ML, is calculated according to the formula given in
AASHTO-SSHB 3.24.3.1 using the rear wheel of HET as the loading.
Rear wheel load of HET, PHET = 15.7 kips (69.8 kN)
167.3kips 7.1532
2ft 069.68.0P32
2S8.0M HETL =⋅+
⋅=⋅+
⋅= k-ft (4.294 kN-m)
Impact Factor, I: (AASHTO-SSHB 3.8.2.1)
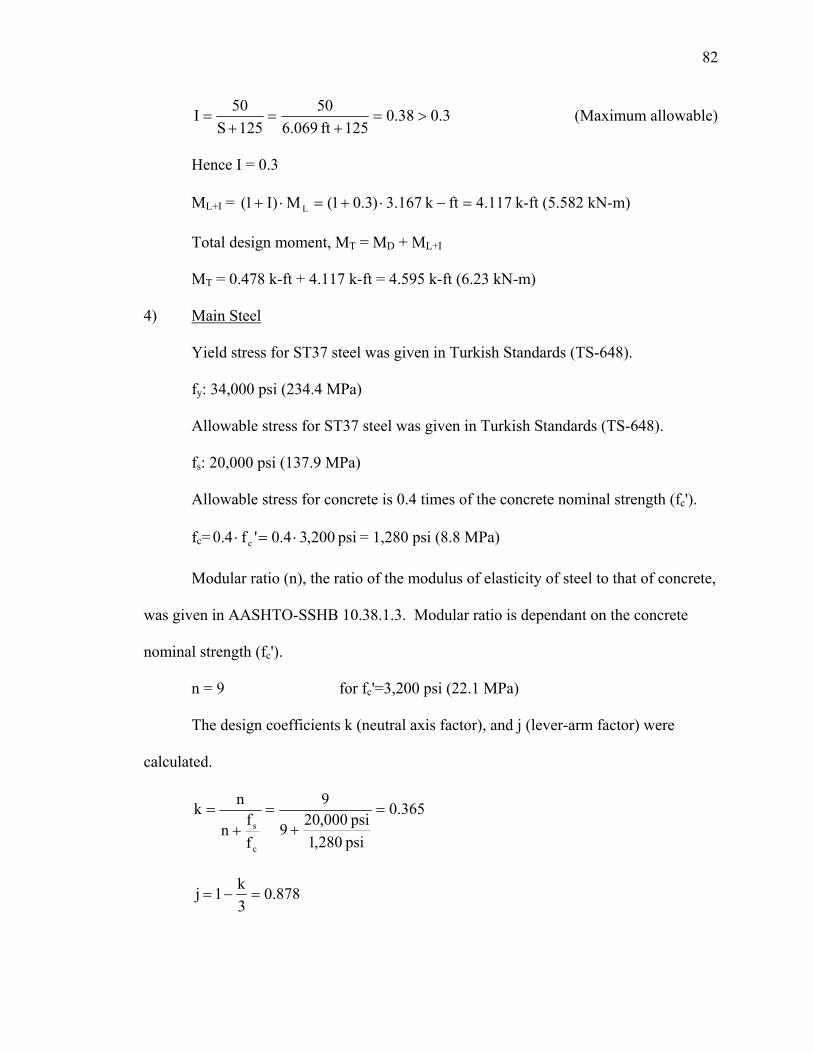
82
3.038.0125ft 069.6
50125S
50I >=+
=+
= (Maximum allowable)
Hence I = 0.3
ML+I = 117.4ftk 167.3)3.01(M)I1( L =−⋅+=⋅+ k-ft (5.582 kN-m)
Total design moment, MT = MD + ML+I
MT = 0.478 k-ft + 4.117 k-ft = 4.595 k-ft (6.23 kN-m)
4) Main Steel
Yield stress for ST37 steel was given in Turkish Standards (TS-648).
fy: 34,000 psi (234.4 MPa)
Allowable stress for ST37 steel was given in Turkish Standards (TS-648).
fs: 20,000 psi (137.9 MPa)
Allowable stress for concrete is 0.4 times of the concrete nominal strength (fc').
fc= psi 200,34.0'f4.0 c ⋅=⋅ = 1,280 psi (8.8 MPa)
Modular ratio (n), the ratio of the modulus of elasticity of steel to that of concrete,
was given in AASHTO-SSHB 10.38.1.3. Modular ratio is dependant on the concrete
nominal strength (fc').
n = 9 for fc'=3,200 psi (22.1 MPa)
The design coefficients k (neutral axis factor), and j (lever-arm factor) were
calculated.
365.0
psi 280,1psi 000,209
9
ff
n
nk
c
s=
+=
+=
878.03k1j =−=
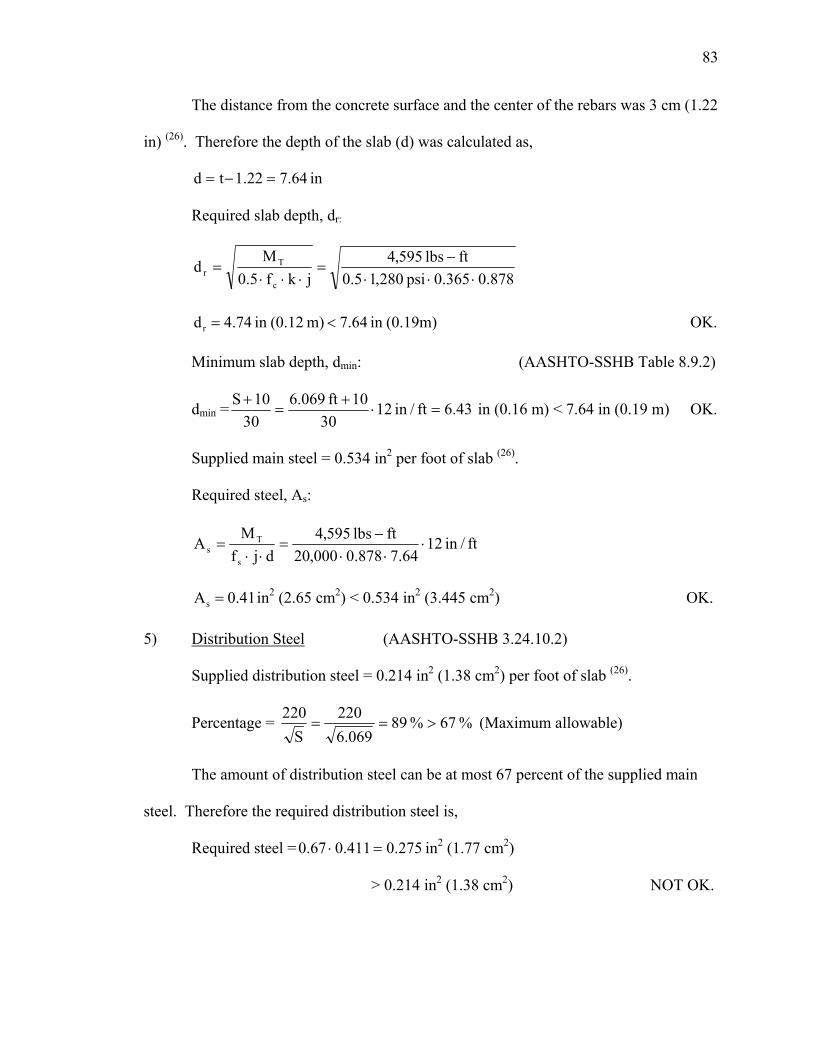
83
The distance from the concrete surface and the center of the rebars was 3 cm (1.22
in) (26). Therefore the depth of the slab (d) was calculated as,
in 64.722.1td =−=
Required slab depth, dr:
878.0365.0psi 280,15.0ftlbs 595,4
jkf5.0M
dc
Tr ⋅⋅⋅
−=
⋅⋅⋅=
(0.19m) in 64.7m) (0.12in 74.4dr <= OK.
Minimum slab depth, dmin: (AASHTO-SSHB Table 8.9.2)
dmin = 43.6ft/in 1230
10ft 069.630
10S=⋅
+=
+ in (0.16 m) < 7.64 in (0.19 m) OK.
Supplied main steel = 0.534 in2 per foot of slab (26).
Required steel, As:
ft/in 1264.7878.0000,20
ftlbs 595,4djf
MA
s
Ts ⋅
⋅⋅−
=⋅⋅
=
41.0As = in2 (2.65 cm2) < 0.534 in2 (3.445 cm2) OK.
5) Distribution Steel (AASHTO-SSHB 3.24.10.2)
Supplied distribution steel = 0.214 in2 (1.38 cm2) per foot of slab (26).
Percentage = % 67% 89069.6
220S
220>== (Maximum allowable)
The amount of distribution steel can be at most 67 percent of the supplied main
steel. Therefore the required distribution steel is,
Required steel = 275.0411.067.0 =⋅ in2 (1.77 cm2)
> 0.214 in2 (1.38 cm2) NOT OK.
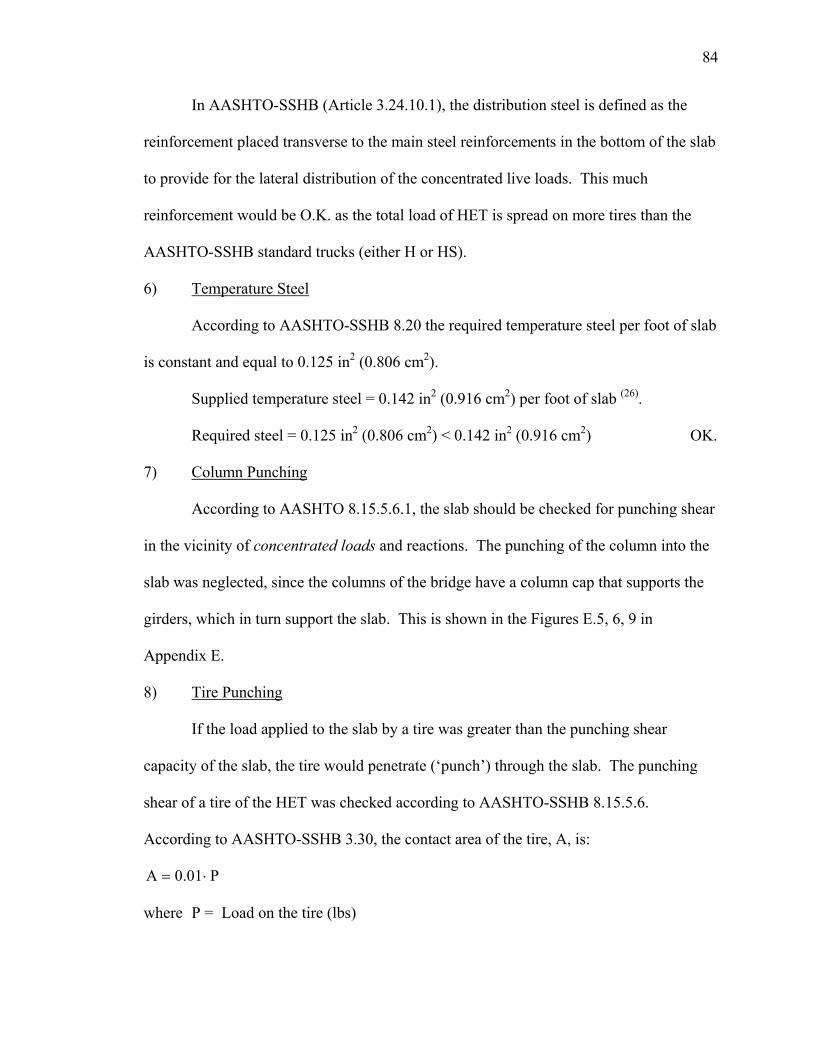
84
In AASHTO-SSHB (Article 3.24.10.1), the distribution steel is defined as the
reinforcement placed transverse to the main steel reinforcements in the bottom of the slab
to provide for the lateral distribution of the concentrated live loads. This much
reinforcement would be O.K. as the total load of HET is spread on more tires than the
AASHTO-SSHB standard trucks (either H or HS).
6) Temperature Steel
According to AASHTO-SSHB 8.20 the required temperature steel per foot of slab
is constant and equal to 0.125 in2 (0.806 cm2).
Supplied temperature steel = 0.142 in2 (0.916 cm2) per foot of slab (26).
Required steel = 0.125 in2 (0.806 cm2) < 0.142 in2 (0.916 cm2) OK.
7) Column Punching
According to AASHTO 8.15.5.6.1, the slab should be checked for punching shear
in the vicinity of concentrated loads and reactions. The punching of the column into the
slab was neglected, since the columns of the bridge have a column cap that supports the
girders, which in turn support the slab. This is shown in the Figures E.5, 6, 9 in
Appendix E.
8) Tire Punching
If the load applied to the slab by a tire was greater than the punching shear
capacity of the slab, the tire would penetrate (‘punch’) through the slab. The punching
shear of a tire of the HET was checked according to AASHTO-SSHB 8.15.5.6.
According to AASHTO-SSHB 3.30, the contact area of the tire, A, is:
P01.0A ⋅=
where P = Load on the tire (lbs)
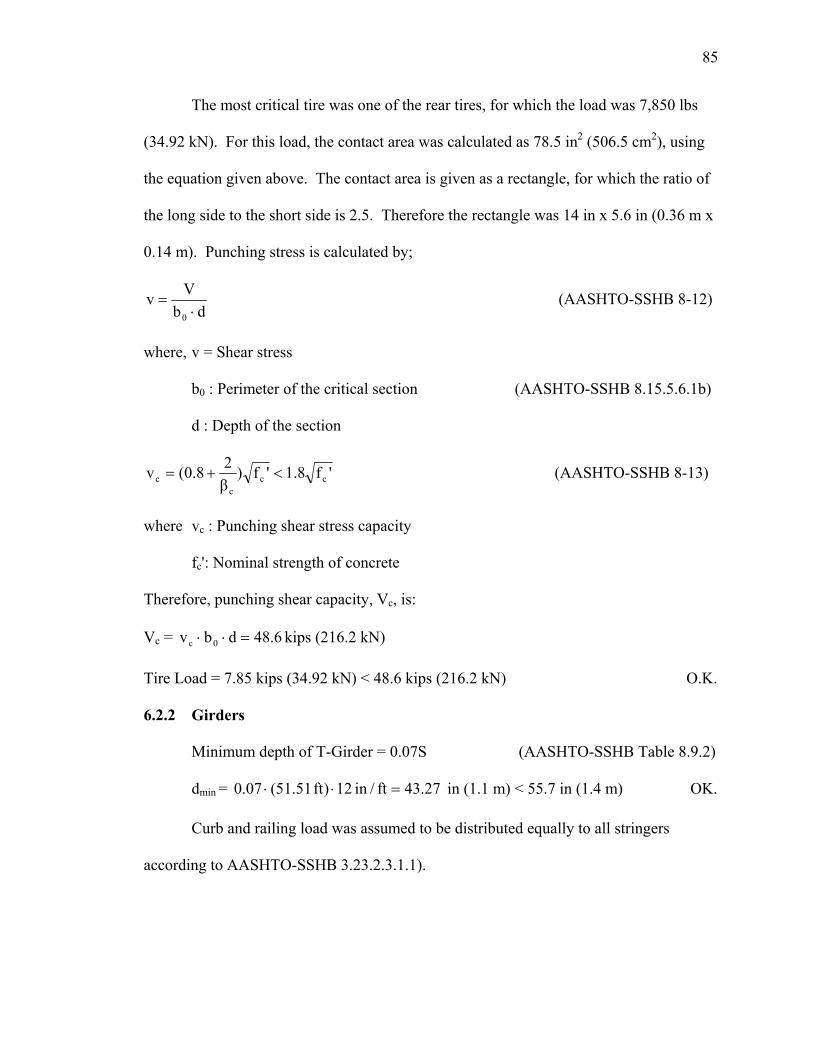
85
The most critical tire was one of the rear tires, for which the load was 7,850 lbs
(34.92 kN). For this load, the contact area was calculated as 78.5 in2 (506.5 cm2), using
the equation given above. The contact area is given as a rectangle, for which the ratio of
the long side to the short side is 2.5. Therefore the rectangle was 14 in x 5.6 in (0.36 m x
0.14 m). Punching stress is calculated by;
dbVv0 ⋅
= (AASHTO-SSHB 8-12)
where, v = Shear stress
b0 : Perimeter of the critical section (AASHTO-SSHB 8.15.5.6.1b)
d : Depth of the section
'f8.1'f)β28.0(v cc
cc <+= (AASHTO-SSHB 8-13)
where vc : Punching shear stress capacity
fc': Nominal strength of concrete
Therefore, punching shear capacity, Vc, is:
Vc = 6.48dbv 0c =⋅⋅ kips (216.2 kN)
Tire Load = 7.85 kips (34.92 kN) < 48.6 kips (216.2 kN) O.K.
6.2.2 Girders
Minimum depth of T-Girder = 0.07S (AASHTO-SSHB Table 8.9.2)
dmin = 27.43ft/in 12)ft 51.51(07.0 =⋅⋅ in (1.1 m) < 55.7 in (1.4 m) OK.
Curb and railing load was assumed to be distributed equally to all stringers
according to AASHTO-SSHB 3.23.2.3.1.1).
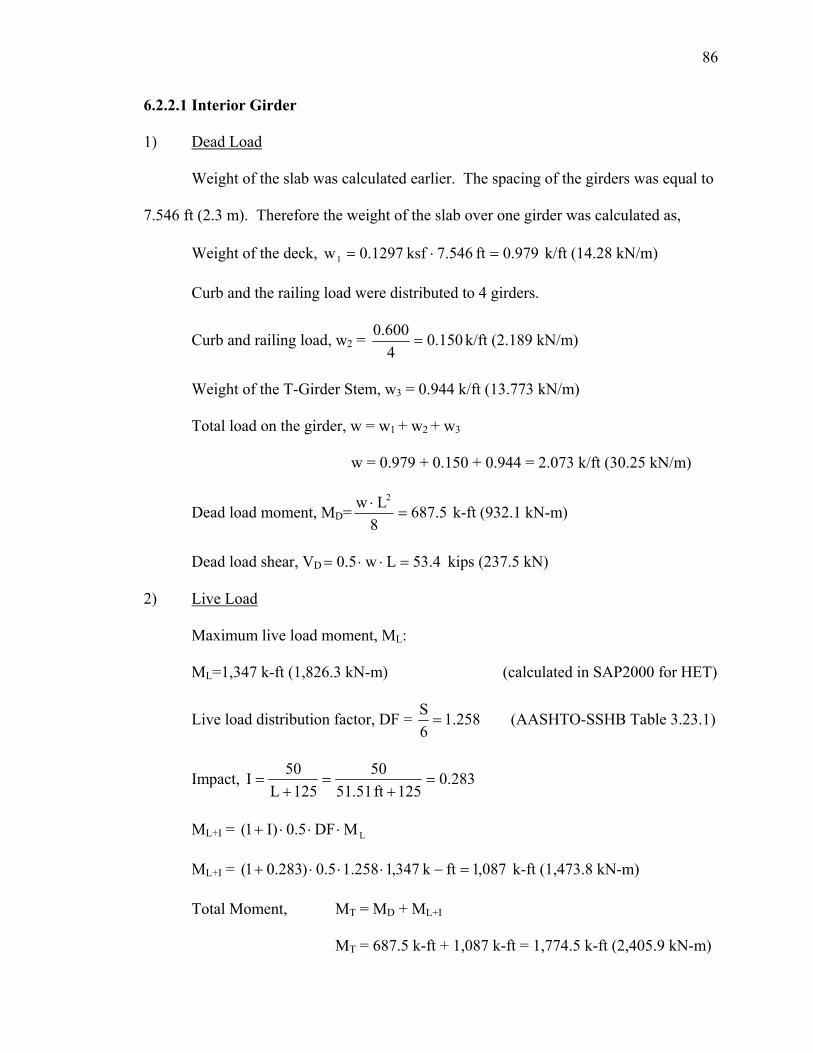
86
6.2.2.1 Interior Girder
1) Dead Load
Weight of the slab was calculated earlier. The spacing of the girders was equal to
7.546 ft (2.3 m). Therefore the weight of the slab over one girder was calculated as,
Weight of the deck, 979.0ft 546.7ksf 1297.0w1 =⋅= k/ft (14.28 kN/m)
Curb and the railing load were distributed to 4 girders.
Curb and railing load, w2 = 150.04600.0
= k/ft (2.189 kN/m)
Weight of the T-Girder Stem, w3 = 0.944 k/ft (13.773 kN/m)
Total load on the girder, w = w1 + w2 + w3
w = 0.979 + 0.150 + 0.944 = 2.073 k/ft (30.25 kN/m)
Dead load moment, MD= 5.6878Lw 2
=⋅ k-ft (932.1 kN-m)
Dead load shear, VD 4.53Lw5.0 =⋅⋅= kips (237.5 kN)
2) Live Load
Maximum live load moment, ML:
ML=1,347 k-ft (1,826.3 kN-m) (calculated in SAP2000 for HET)
Live load distribution factor, DF = 258.16S= (AASHTO-SSHB Table 3.23.1)
Impact, 283.0125ft51.51
50125L
50I =+
=+
=
ML+I = LMDF5.0)I1( ⋅⋅⋅+
ML+I = 087,1ftk 347,1258.15.0)283.01( =−⋅⋅⋅+ k-ft (1,473.8 kN-m)
Total Moment, MT = MD + ML+I
MT = 687.5 k-ft + 1,087 k-ft = 1,774.5 k-ft (2,405.9 kN-m)
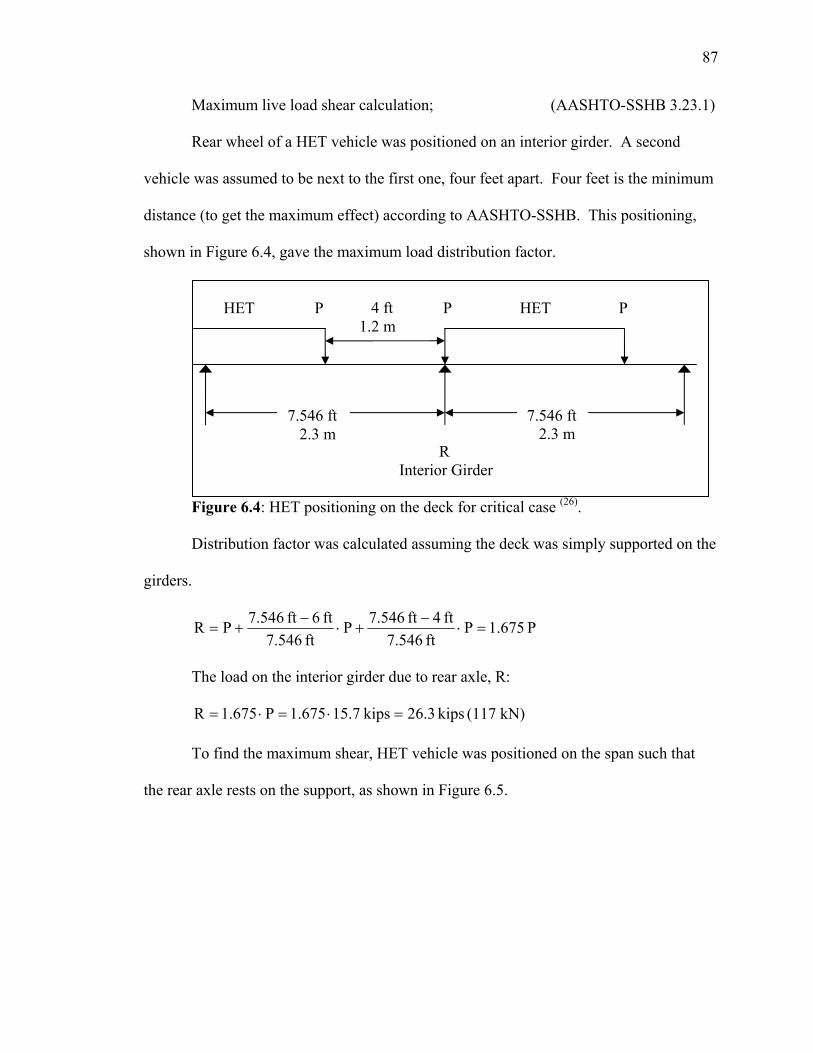
87
Maximum live load shear calculation; (AASHTO-SSHB 3.23.1)
Rear wheel of a HET vehicle was positioned on an interior girder. A second
vehicle was assumed to be next to the first one, four feet apart. Four feet is the minimum
distance (to get the maximum effect) according to AASHTO-SSHB. This positioning,
shown in Figure 6.4, gave the maximum load distribution factor.
Figure 6.4: HET positioning on the deck for critical case (26).
Distribution factor was calculated assuming the deck was simply supported on the
girders.
P 675.1Pft546.7
ft 4ft 546.7Pft 546.7
ft 6ft 546.7PR =⋅−
+⋅−
+=
The load on the interior girder due to rear axle, R:
kips 3.26kips 7.15675.1P675.1R =⋅=⋅= (117 kN)
To find the maximum shear, HET vehicle was positioned on the span such that
the rear axle rests on the support, as shown in Figure 6.5.
P HET P
R Interior Girder
7.546 ft 2.3 m
4 ft 1.2 m
HET P
7.546 ft 2.3 m
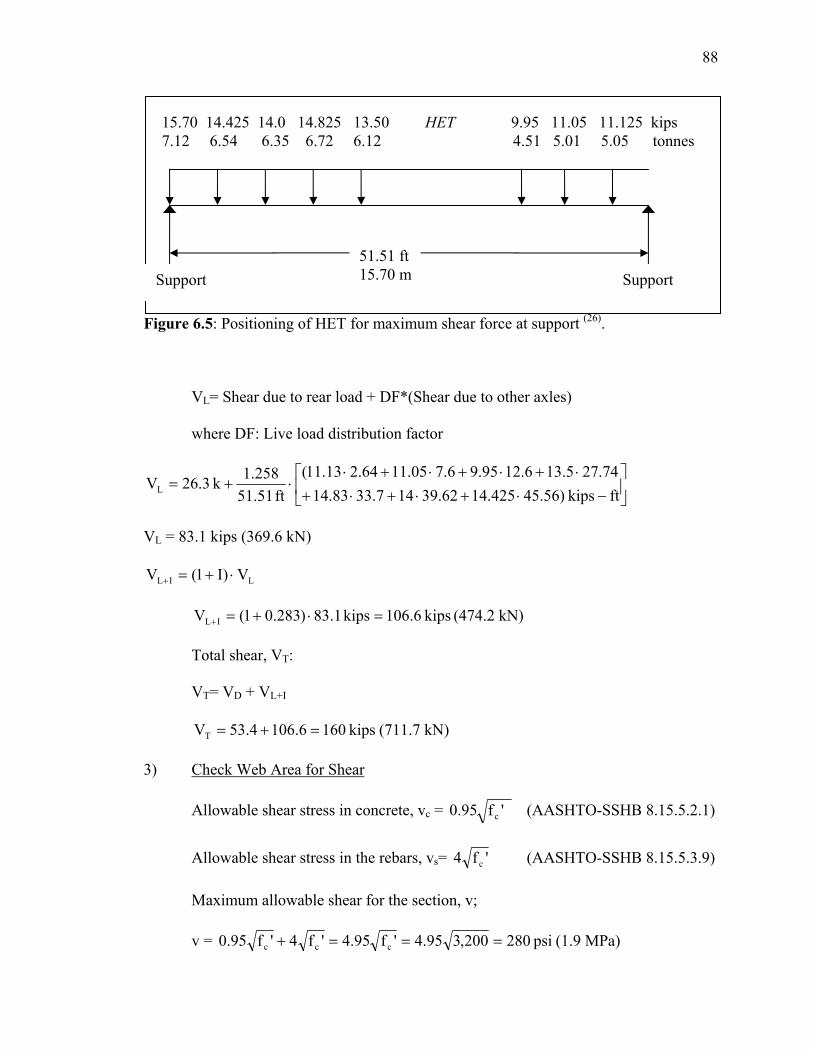
88
Figure 6.5: Positioning of HET for maximum shear force at support (26).
VL= Shear due to rear load + DF*(Shear due to other axles)
where DF: Live load distribution factor
−⋅+⋅+⋅+
⋅+⋅+⋅+⋅⋅+=
ftkips )56.45425.1462.39147.3383.1474.275.136.1295.96.705.1164.213.11(
ft 51.51258.1k 3.26VL
VL = 83.1 kips (369.6 kN)
LIL V)I1(V ⋅+=+
kips 6.106kips 1.83)283.01(V IL =⋅+=+ (474.2 kN)
Total shear, VT:
VT= VD + VL+I
kips 1606.1064.53VT =+= (711.7 kN)
3) Check Web Area for Shear
Allowable shear stress in concrete, vc = 'f95.0 c (AASHTO-SSHB 8.15.5.2.1)
Allowable shear stress in the rebars, vs= 'f4 c (AASHTO-SSHB 8.15.5.3.9)
Maximum allowable shear for the section, v;
v = psi 280200,395.4'f95.4'f4'f95.0 ccc ===+ (1.9 MPa)
Support 51.51 ft 15.70 m Support
15.70 14.425 14.0 14.825 13.50 HET 9.95 11.05 11.125 kips 7.12 6.54 6.35 6.72 6.12 4.51 5.01 5.05 tonnes
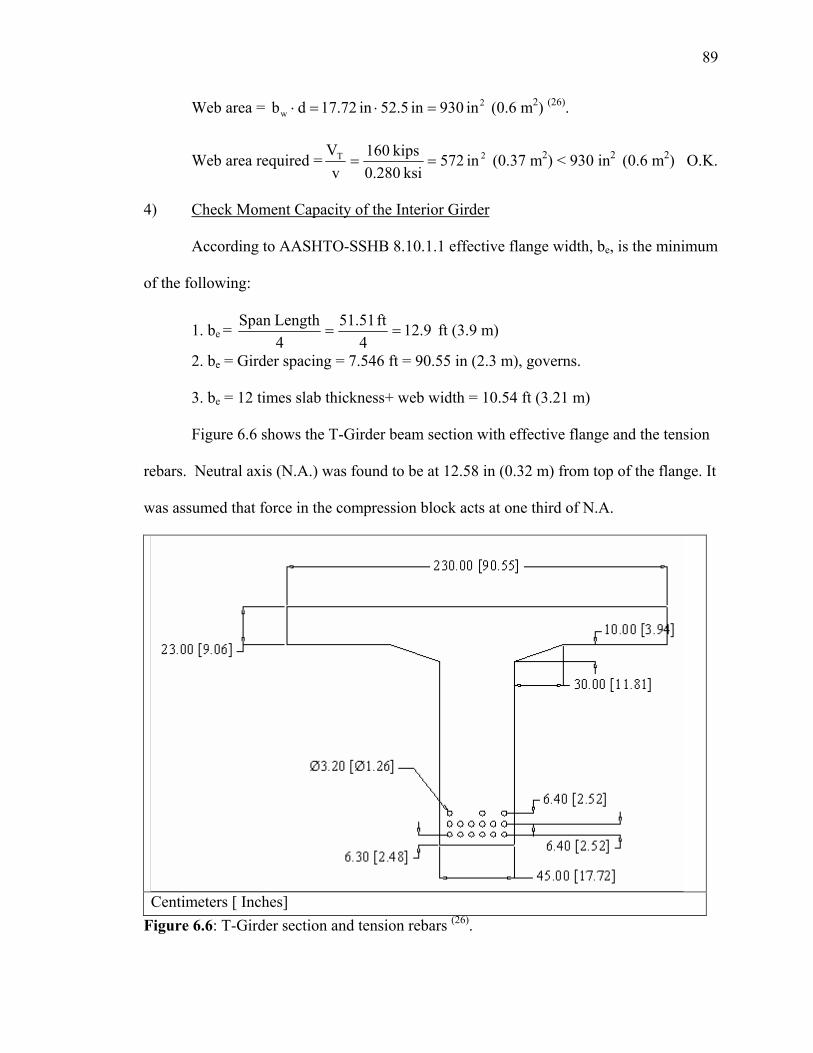
89
Web area = 2w in 930in 5.52in 72.17db =⋅=⋅ (0.6 m2) (26).
Web area required = 2T in 572ksi280.0
kips 160v
V== (0.37 m2) < 930 in2 (0.6 m2) O.K.
4) Check Moment Capacity of the Interior Girder
According to AASHTO-SSHB 8.10.1.1 effective flange width, be, is the minimum
of the following:
1. be = 9.124
ft 51.514Length Span
== ft (3.9 m)
2. be = Girder spacing = 7.546 ft = 90.55 in (2.3 m), governs.
3. be = 12 times slab thickness+ web width = 10.54 ft (3.21 m)
Figure 6.6 shows the T-Girder beam section with effective flange and the tension
rebars. Neutral axis (N.A.) was found to be at 12.58 in (0.32 m) from top of the flange. It
was assumed that force in the compression block acts at one third of N.A.
Centimeters [ Inches]
Figure 6.6: T-Girder section and tension rebars (26).
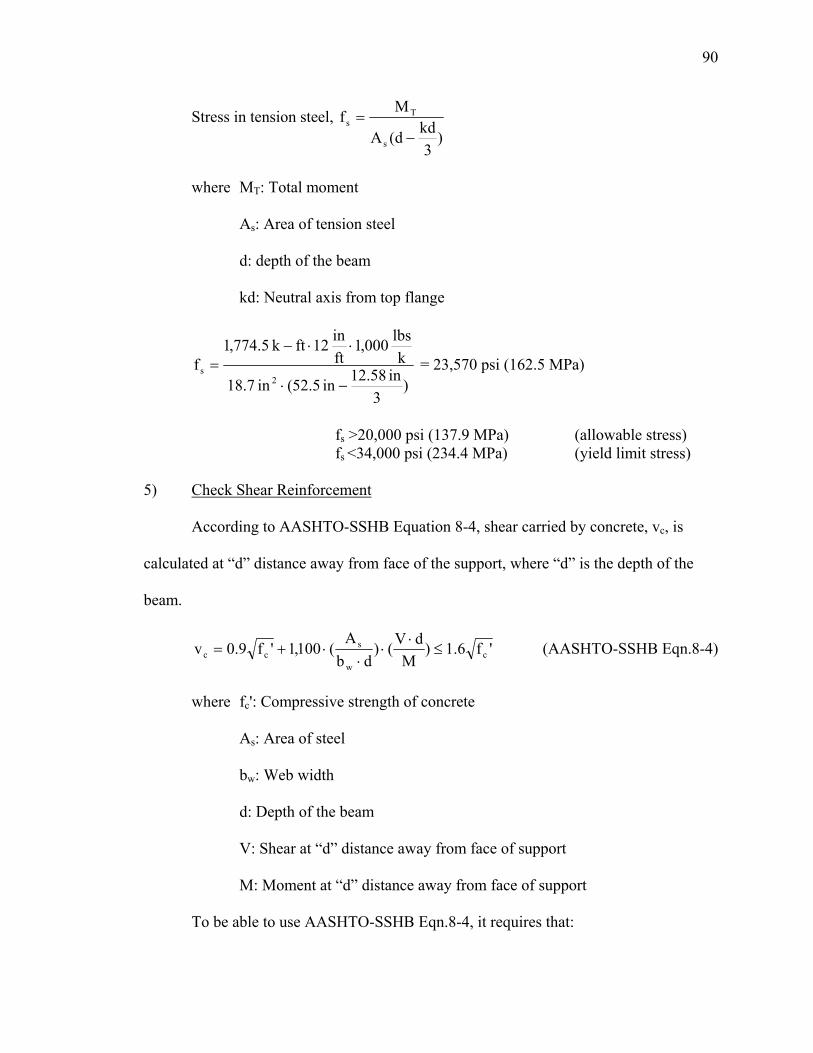
90
Stress in tension steel, )
3kdd(A
Mfs
Ts
−=
where MT: Total moment
As: Area of tension steel
d: depth of the beam
kd: Neutral axis from top flange
)3
in 58.12in 5.52(in 7.18
klbs 000,1
ftin 12ftk 5.774,1
f2
s
−⋅
⋅⋅−= = 23,570 psi (162.5 MPa)
fs >20,000 psi (137.9 MPa) (allowable stress) fs <34,000 psi (234.4 MPa) (yield limit stress)
5) Check Shear Reinforcement
According to AASHTO-SSHB Equation 8-4, shear carried by concrete, vc, is
calculated at “d” distance away from face of the support, where “d” is the depth of the
beam.
'f6.1)M
dV()db
A(100,1'f9.0v c
w
scc ≤
⋅⋅
⋅⋅+= (AASHTO-SSHB Eqn.8-4)
where fc': Compressive strength of concrete
As: Area of steel
bw: Web width
d: Depth of the beam
V: Shear at “d” distance away from face of support
M: Moment at “d” distance away from face of support
To be able to use AASHTO-SSHB Eqn.8-4, it requires that:
91
0.1M
dV<
⋅
0.1797.0inkips 172,8in 5.52kips 124
MdV
<=−
⋅=
⋅ O.K
psi 5.90'f6.1psi 5.68)797.0()in5.52in72.17
in 7.18(100,1psi 200,39.0v c
2
c =≤=⋅⋅
⋅+=
Therefore vc= 85.5 psi (0.6 MPa)
Shear stress carried by steel, vs:
psi 8.64psi 5.68in 5.52in 72.17
lbs 000,124vdb
Vv cw
s =−⋅
=−⋅
= (0.4 MPa)
Area of supplied stirrup, Av, and spacing, s, at the girder:
Av = 0.35 in2 (2.26 cm2)
s = 9.84 in (0.25 m)
Check stress in the stirrup, fs:
v
wss A
sbvf
⋅⋅=
psi 282,32in 35.0
in 84.9in 72.17psi 8.64f 2s =⋅⋅
= (222.6 MPa)
f s >20,000 psi (137.9 MPa) (allowable stress)
fs <34,000 psi (234.4 MPa) (yield limit stress)
The stress in the stirrup was very close to the minimum yield limit; however the
rebars were not expected to yield at this level of stress as the minimum yield strength of
the steel is 34,000 psi (234.4 MPa). Moreover, to simplify the analysis the HET load,
which was spread over 28 tires, was assumed to be spread over 18 tires (2 tires per axle).
This was a conservative assumption. The stresses due to the load spread over 28 tires
92
would have been smaller than these stresses. Therefore the section capacity was
acceptable as the stress was smaller than the minimum yield limit and considering the
conservative approach used.
6.2.2.2 Exterior Girder
1) Dead Load
Total load on girder, w = 2.073 k-ft (2.811 kN-m) (same as interior girder)
MD= 5.6878Lw 2
=⋅ k-ft (932.1 kN-m)
VD 4.53Lw5.0 =⋅⋅= kips (237.5 kN)
2) Live Load
The portion of the live load on the exterior girder was calculated by lever rule.
The live load distribution factor for the exterior girder was calculated by applying to the
girder the reaction of the wheel load obtained by assuming the flooring to act as a simple
span between the exterior and the interior girder (AASHTO-SSHB 3.23.2.3.1.2). The
HET was placed 2 feet (minimum allowable) from the curb to have the maximum
possible load on the exterior girder. The placement of HET is shown in Figure 6.7.
Figure 6.7: Placement of vehicle for the maximum load on the exterior girder.
Interior girder4.59 ft 1.4 m
7.546 ft 2.3 m
HET Curb
2.0 ft (0.6 m)
Exterior girder
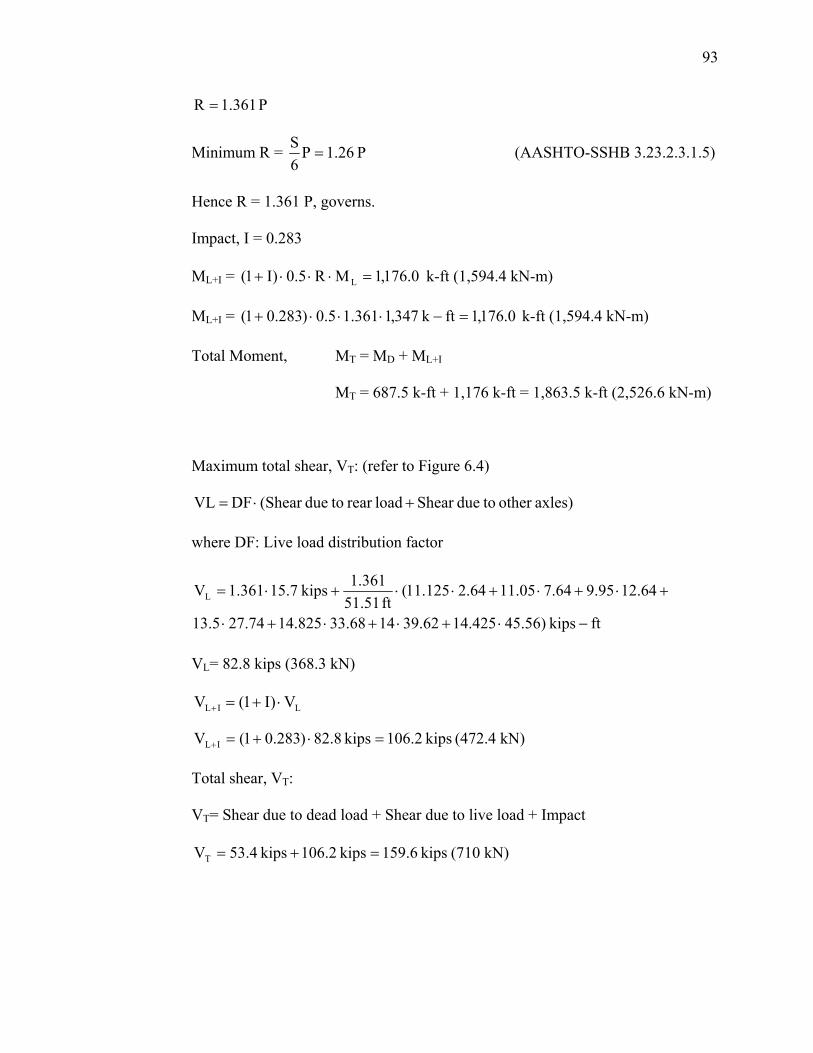
93
P 361.1R =
Minimum R = P 26.1P6S
= (AASHTO-SSHB 3.23.2.3.1.5)
Hence R = 1.361 P, governs.
Impact, I = 0.283
ML+I = 0.176,1MR5.0)I1( L =⋅⋅⋅+ k-ft (1,594.4 kN-m)
ML+I = 0.176,1ftk 347,1361.15.0)283.01( =−⋅⋅⋅+ k-ft (1,594.4 kN-m)
Total Moment, MT = MD + ML+I
MT = 687.5 k-ft + 1,176 k-ft = 1,863.5 k-ft (2,526.6 kN-m)
Maximum total shear, VT: (refer to Figure 6.4)
axles)other todueShear loadrear todue(Shear DF VL +⋅=
where DF: Live load distribution factor
ftkips )56.45425.1462.391468.33825.1474.275.13
64.1295.964.705.1164.2125.11(ft 51.51
361.1kips 7.15361.1VL
−⋅+⋅+⋅+⋅
+⋅+⋅+⋅⋅+⋅=
VL= 82.8 kips (368.3 kN)
kips 2.106kips 8.82)283.01(V IL =⋅+=+ (472.4 kN)
Total shear, VT:
VT= Shear due to dead load + Shear due to live load + Impact
kips 6.159kips 2.106kips 4.53VT =+= (710 kN)
LIL V)I1(V ⋅+=+
94
3) Check Moment Capacity of the Exterior Girder
Exterior girder was assumed to have same capacity as the interior girder.
Check stress in steel, fs:
)3
kdd(A
Mfs
Ts
−=
where MT: Total moment
As: Area of tension steel
d: depth of the beam
kd: Neutral axis from top flange
psi 755,24)
3in 58.12in 5.52(in 7.18
klbs 000,1
ftin 12ftk 5.863,1
f2
s =−⋅
⋅⋅−= (170.7 MPa)
fs >20,000 psi (137.9 MPa) (allowable stress) fs <34,000 psi (234.4 MPa) (yield limit stress)
The calculated stress was acceptable as it is smaller than the minimum yield limit
and considering the conservative approach used (HET was assumed to have 18 tires
instead of 28).
4) Check Shear Reinforcement
It was assumed that shear stress carried by steel was same as the interior girder.
Therefore the stress in the exterior girders stirrups was same as the stress in the interior
girders stirrup. See section 6.2.2.1 (5).
6.3 Summary of Results
A reinforced concrete T-Girder bridge, which has a maximum span of 15.7 m
(51.51 ft), was analyzed according to AASHTO-SSHB using the HET as the live load.
95
6.3.1 Slab
Thickness of the slab, main steel, and temperature steel supplied in the slab are
satisfactory according to ASD; however, the distribution steel is 22 percent less than what
is required. The distribution steel helps the slab distribute the concentrated loads
effectively to the girders. This much distribution steel would be O.K. considering the
conservative approach used (HET was assumed to have 18 tires instead of 28, which
resulted in more concentrated loads than the actual case). The section was adequate
against shear failure.
6.3.2 Girder
Interior and exterior girders are analyzed according to ASD. Maximum bending
stress is found to be 23.6 ksi (162.7 MPa) in interior girder and 24.8 ksi (171 MPa) in
exterior girder. These are higher than allowable stress (20,000 psi) for ST37 steel;
however, they are still less than yield limit of the steel (34,000 psi). Therefore girders are
safe according to bending stress without considering any factors of safety.
Tensile stress carried by the stirrups was calculated as 32.3 ksi (222.7 MPa) in
both girders. This is more than 60 percent higher than allowable stress (20,000 psi) but
still less than the minimum yield limit of ST37 steel. Although the stress in the stirrups
was very critical and they were almost yielded it could be said that they are safe as the
materials did not yield.
96
Chapter 7: Summary and Conclusions
7.1 Introduction
Turkish design specifications and construction materials were compared with
American specifications and materials. Three types of bridges were analyzed according
to AASHTO-SSHB using the HET as the live load on the bridges. Only the primary
loads, dead load, live load and impact, were considered. The analysis did not include any
modification for deterioration, damages, and aging of the bridges. The achievements and
the results are summarized below.
7.2 Comparison of Specifications
The Turkish highway bridge design division currently uses the TSRB 1982 for the
loading and geometric criteria only and AASHTO-SSHB for all other requirements and
design methods (12). In fact TSRB 1982 was adopted from AASHTO-SSHB 1977. Hence
there was no major difference between these two specifications regarding design
methodology and requirements. There were some minor differences, which were pointed
out in Chapter 3, due to conversion from U.S. customary units to SI units.
Currently the GDH is translating the latest AASHTO-LRFD edition into Turkish,
which will be used soon in bridge design (21). Moreover Engineering Work Criteria
Report (EWCR), published by the GDH in 1997, states that “Unless otherwise stated, all
the bridges shall be designed according to the latest edition of AASHTO-SSHB or
AASHTO-SDHB” (14).
97
The most significant difference between Turkish and American live loading was
in what the number coming after H or HS represents in two standards. In TSRB that
number shows the weight of the truck in metric tons, but in AASHTO-SSHB it shows the
weight of the truck in English (short) tons. This also applies for lane loading. This
results in ten percent heavier loads used for bridge design in Turkey. Therefore, HS20 in
TSRB is ten and HS30 in TSRB is sixty five percent heavier than HS20-44 in AASHTO-
SSHB.
In general, bridges are designed to higher loads in Turkey. Although AASHTO-
SSHB is being used, the GDH requires higher design live loads. Currently, the design
load for highway bridges is HS20 or HS30, depending on the traffic volume of the
highway (14).
For expressway (equivalent to interstates) bridges design load is HS30 or
Alternate Military Loading (AML-36,000 kg or 80 kips), described in Chapter 3. These
bridges are also checked with Type-A (136,000 kg or 300 kips) and Type-B (154,000 kg
or 340 kips) vehicles. Figures of the design vehicles are given in Appendix B. In the
U.S. although AASHTO-SSHB has not introduced a heavy commercial hauler loading
yet, each State’s Department of Transportation developed its own design truck for this
purpose.
The engineers in the bridge design division of the GDH had been to U.S. for
training in several Departments of Transportations (DOT). According to Ms. Fatma
Sahin, engineer in Bridge Design Division of the GDH in Ankara, the GDH has strong
connections with U.S. DOT’s, such as Pennsylvania Department of Transportation
(PENNDOT) and California Department of Transportation (Caltrans). Currently the
98
GDH uses PENNDOT’s bridge design software for prestressed concrete bridge design.
While using the software the design engineer increases the live load ten percent because
of the reason described above.
7.3 Analysis Results
1) The blueprints of Birecik Bridge could not be obtained from the GDH as the
bridge is located in a ‘security zone’ for the Government. Therefore the bridge was
analyzed using the external dimensions and assuming that the minimum reinforcement
according to ACI 318-02 was present.
The analysis was done in two parts. First, the slab was analyzed. It was safe. In
the second part the bridge was modeled in 2-D in SAP2000. The analysis of 2-D model
in SAP2000 and in PCACOL showed that all the members but the columns were
satisfactory assuming minimum amount of steel at the sections. The columns did not
satisfy the requirements with the minimum steel (1 percent) assumption. Blueprints of a
similar bridge (Dokuzdolambac II Bridge) were obtained from the GDH. The steel ratio
in the columns of this bridge was assumed to be present in Birecik Bridge. Instead of 1
percent reinforcement 2.64 percent was assumed. The column was not safe after this
assumption, but would be safe assuming 3.15 percent reinforcement, which is within the
range of steel reinforcing in the Dokuzdolambac II Bridge.
The shear was critical in T-Girders, assuming the minimum steel for the stirrups
according to ACI 318-02 was used. Then a new assumption was made according to the
blueprints of Dokuzdolambac II Bridge. With this assumption the stress in the stirrups
were in the acceptable range.
99
2) The slab of the steel composite I-Girder bridge was safe. In the girder, the only
critical stress was the bending stress at the support. It was more than the allowable stress
but still 10 percent less than the minimum yield limit of the steel (34,000 psi). Therefore
it was in the acceptable range.
3) The results of the analysis of the Candir Bridge showed that the slab was safe.
The bending stresses were twenty percent higher than the allowable stresses, which was
acceptable. The stress in the stirrups was around 32,000 psi (220.6 MPa). Although
critical, it was still 5 percent less than the minimum yield limit of steel (34,000 psi).
Therefore it was acceptable.
7.4 Conclusions of Analysis
The overall assessment for the Birecik Bridge (with the assumptions made in the
analysis, given in Chapter 4) indicates that the columns of the bridge were critical and
may not be adequate to support a HET vehicle safely. If the reinforcing ratio was
assumed to be the highest of the range seen in a similar bridge, the columns would be
safe. For the I-Girder and the Candir Bridges, the highest stresses in the superstructures
were at least 5 percent smaller than the minimum yield limit of steel, 34,000 psi. In
actual case this steel would typically yield at more than 34,000 psi as this value is the
minimum requirement of the code. Moreover, assumed transverse geometry of HET
resulted in higher stresses than the actual vehicle as it was assumed that the weight of
HET was distributed over 18 tires instead of 28.
7.5 Further Research
1) This project has focused almost exclusively on the superstructure analysis of
the bridges. The substructure (piers, abutments, bearings, piles etc.) should be analyzed.
100
2) This project did not consider any possible damage, aging, environmental
factors, or the possible poor workmanship. Present condition of the bridges should be
investigated and the analysis should be modified to take these factors into account.
3) The bridges should be analyzed according to AASHTO-Load and
Resistance Factor Design (LRFD) for overloading to examine the effect of different
analysis methods on the results.
4) Some selected bridges in seismic zones should be analyzed according to
AASHTO-SDHB, which is also used in bridge design in Turkey.
5) Different types of bridges should be analyzed. Especially stone arch
bridges, some of which are more than 500 years old and still in service, should be
checked for overloading.
6) Turkish bridge construction practices should be studied by conducting field
surveys and site investigations.

101
APPENDIX A
SAMPLE BRIDGE INVENTORY CARDS
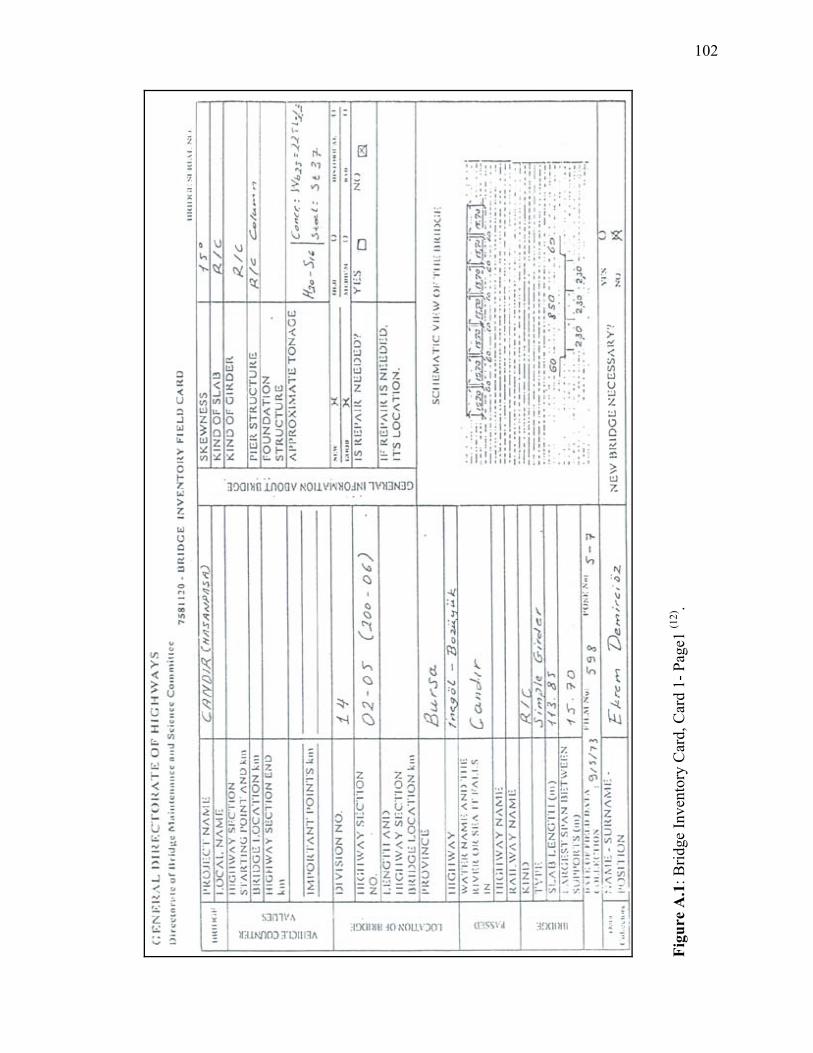
102
Figu
re A
.1: B
ridge
Inve
ntor
y C
ard,
Car
d 1-
Pag
e1 (1
2).
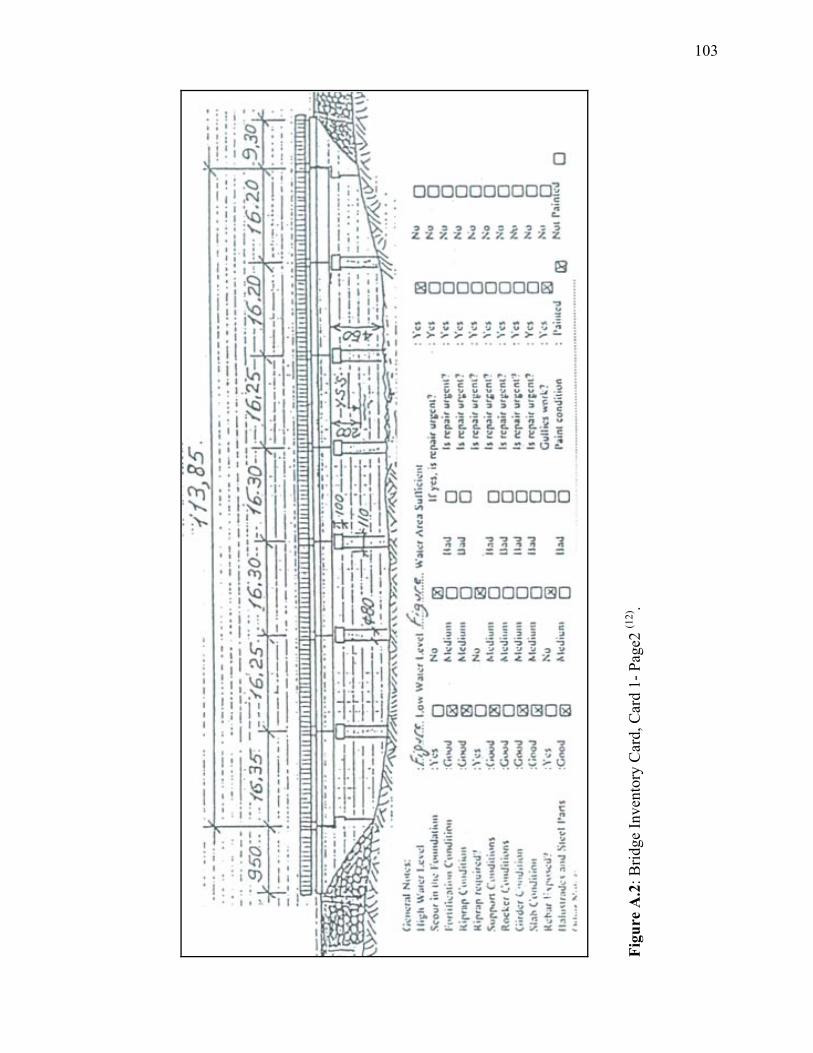
103
Figu
re A
.2: B
ridge
Inve
ntor
y C
ard,
Car
d 1-
Pag
e2 (1
2).
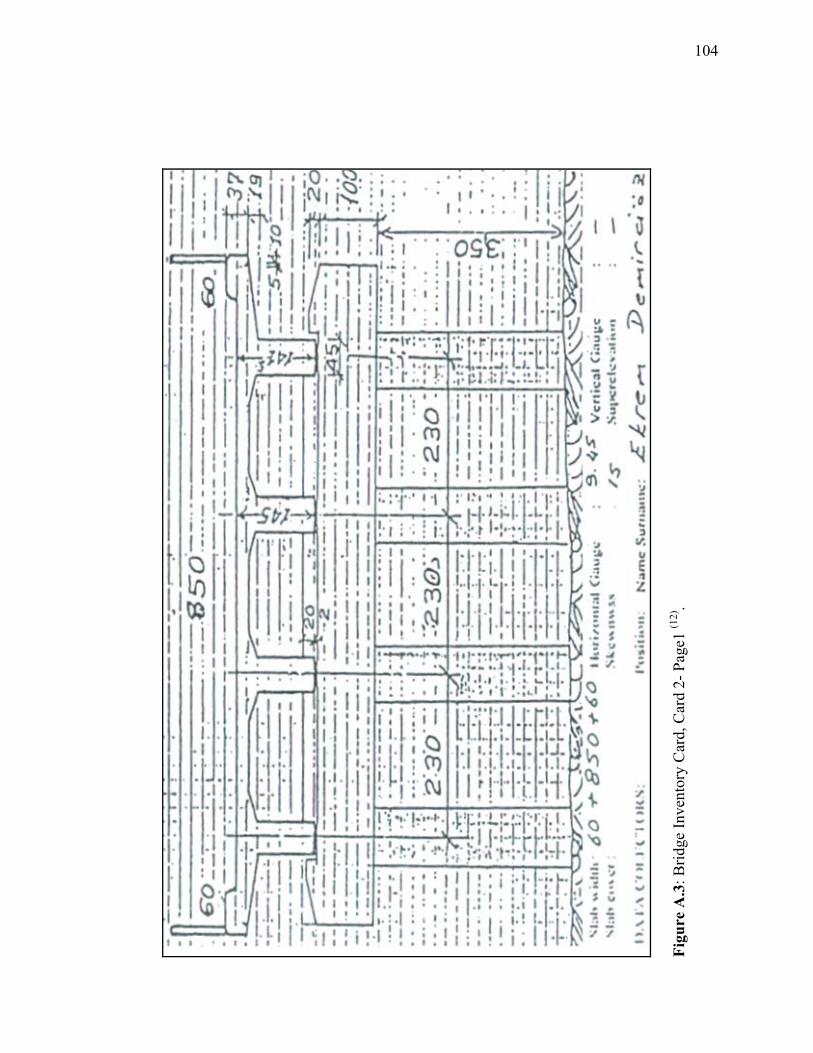
104
Fi
gure
A.3
: Brid
ge In
vent
ory
Car
d, C
ard
2- P
age1
(12)
.
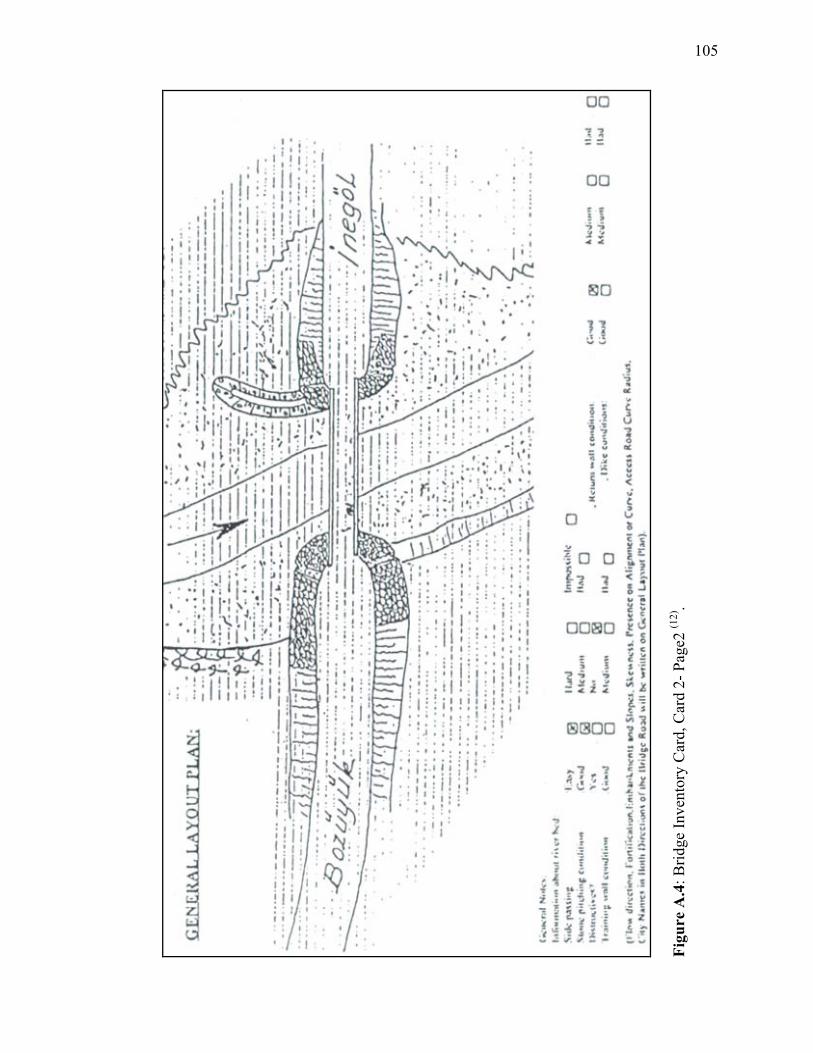
105
Figu
re A
.4: B
ridge
Inve
ntor
y C
ard,
Car
d 2-
Pag
e2 (1
2).
106
APPENDIX B
TRUCKS
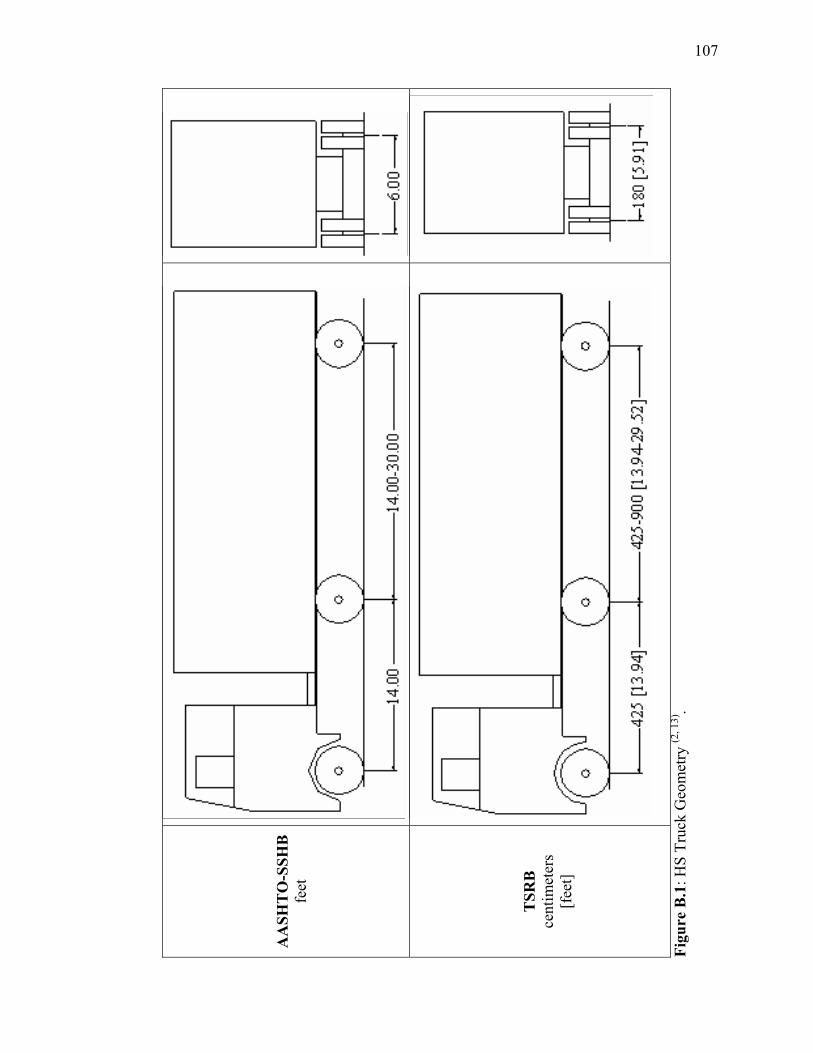
107
AA
SHT
O-S
SHB
fe
et
T
SRB
ce
ntim
eter
s [f
eet]
Figu
re B
.1: H
S Tr
uck
Geo
met
ry (2
, 13)
.
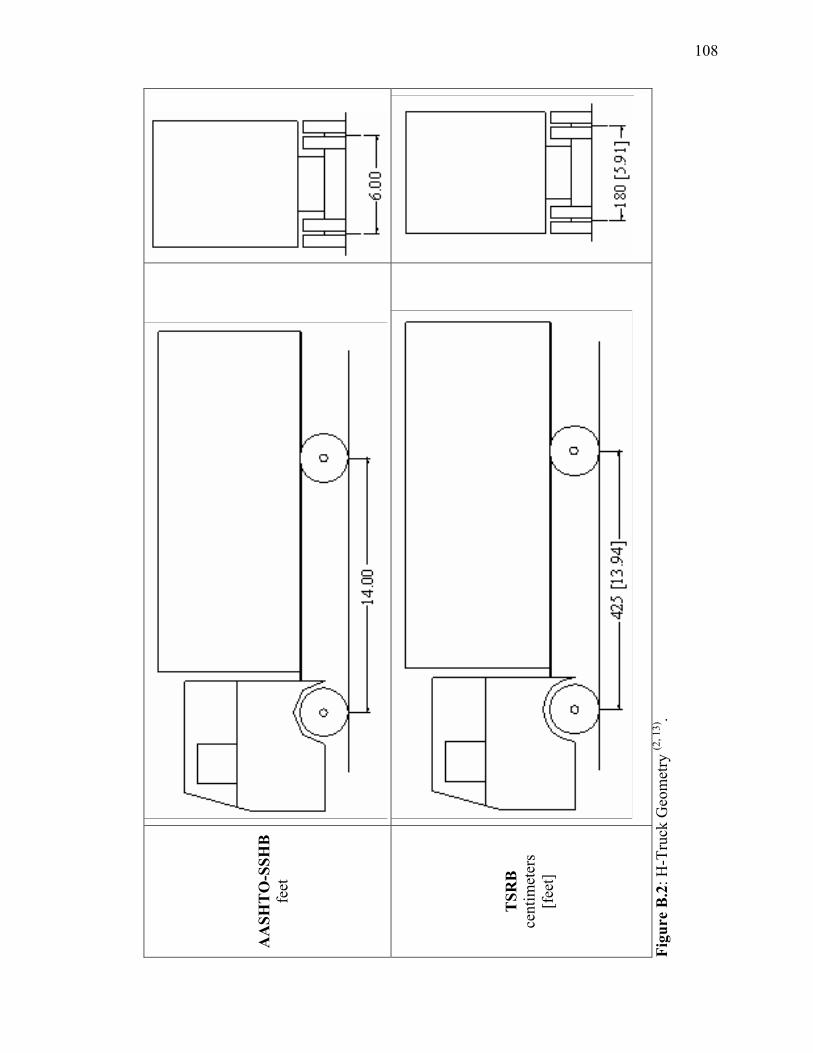
108
A
ASH
TO
-SSH
B
feet
T
SRB
ce
ntim
eter
s [f
eet]
Figu
re B
.2: H
-Tru
ck G
eom
etry
(2, 1
3).
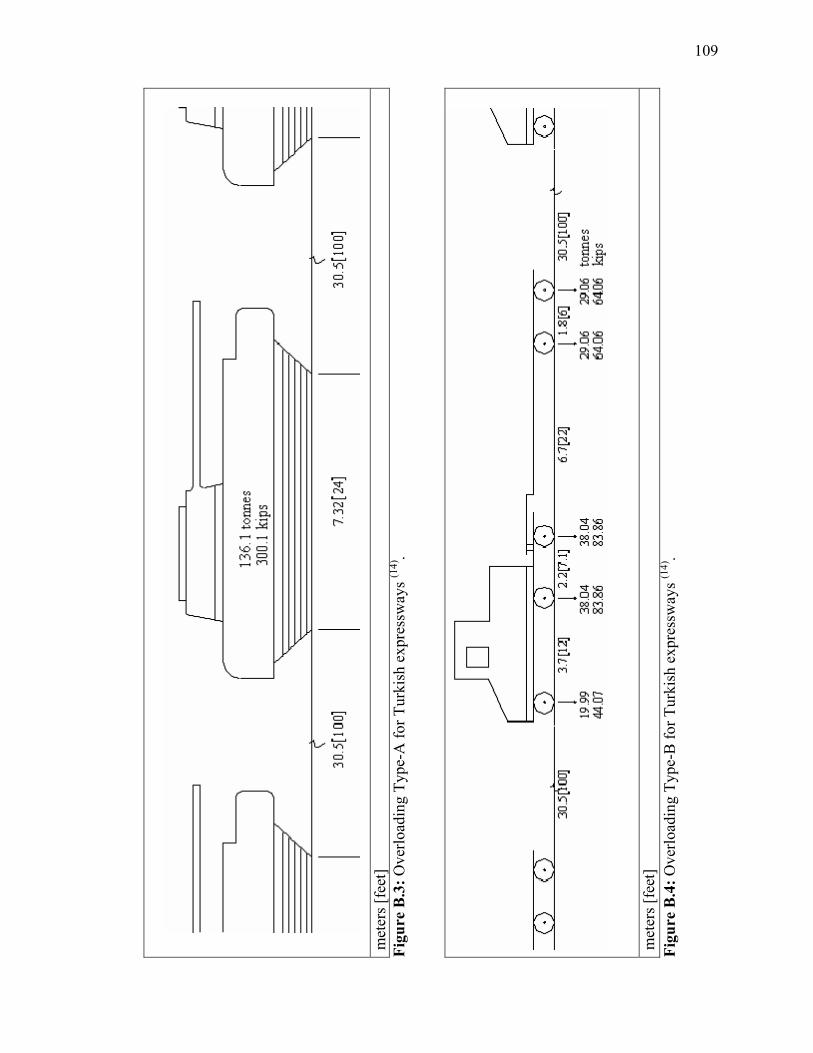
109
m
eter
s [fe
et]
Figu
re B
.3: O
verlo
adin
g Ty
pe-A
for T
urki
sh e
xpre
ssw
ays (1
4).
met
ers [
feet
] Fi
gure
B.4
: Ove
rload
ing
Type
-B fo
r Tur
kish
exp
ress
way
s (14)
.
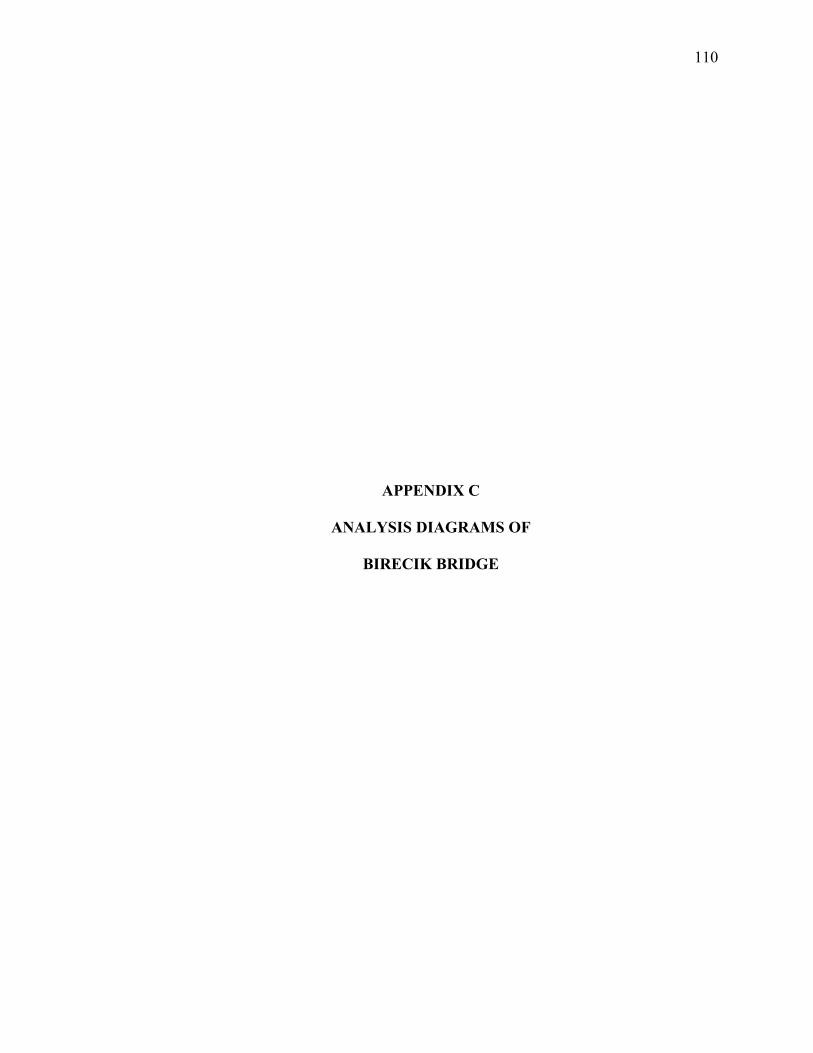
110
APPENDIX C
ANALYSIS DIAGRAMS OF
BIRECIK BRIDGE
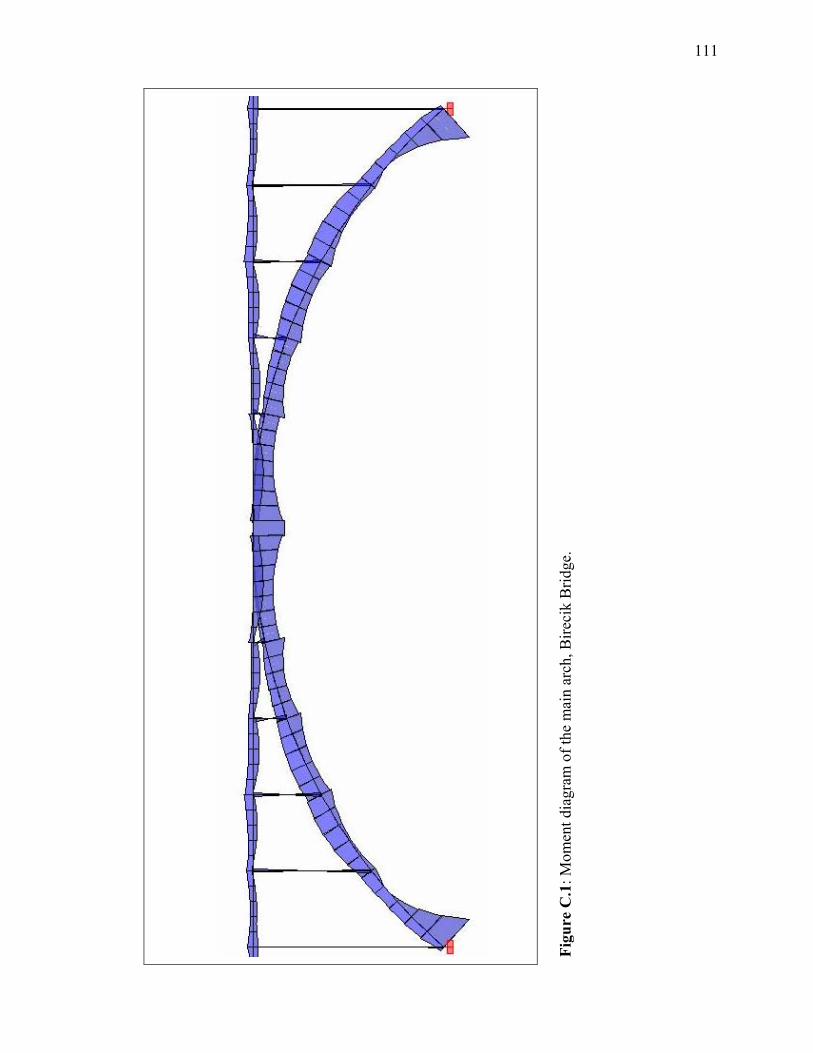
111
Figu
re C
.1: M
omen
t dia
gram
of t
he m
ain
arch
, Bire
cik
Brid
ge.
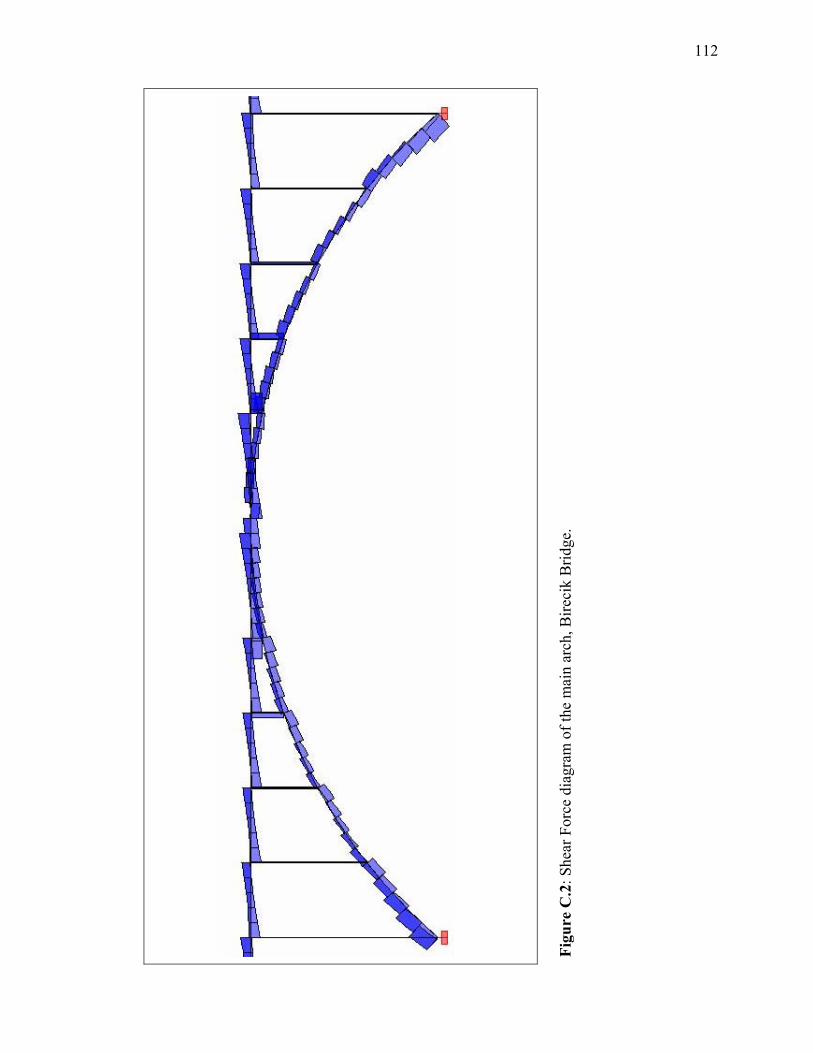
112
Figu
re C
.2: S
hear
For
ce d
iagr
am o
f the
mai
n ar
ch, B
ireci
k B
ridge
.
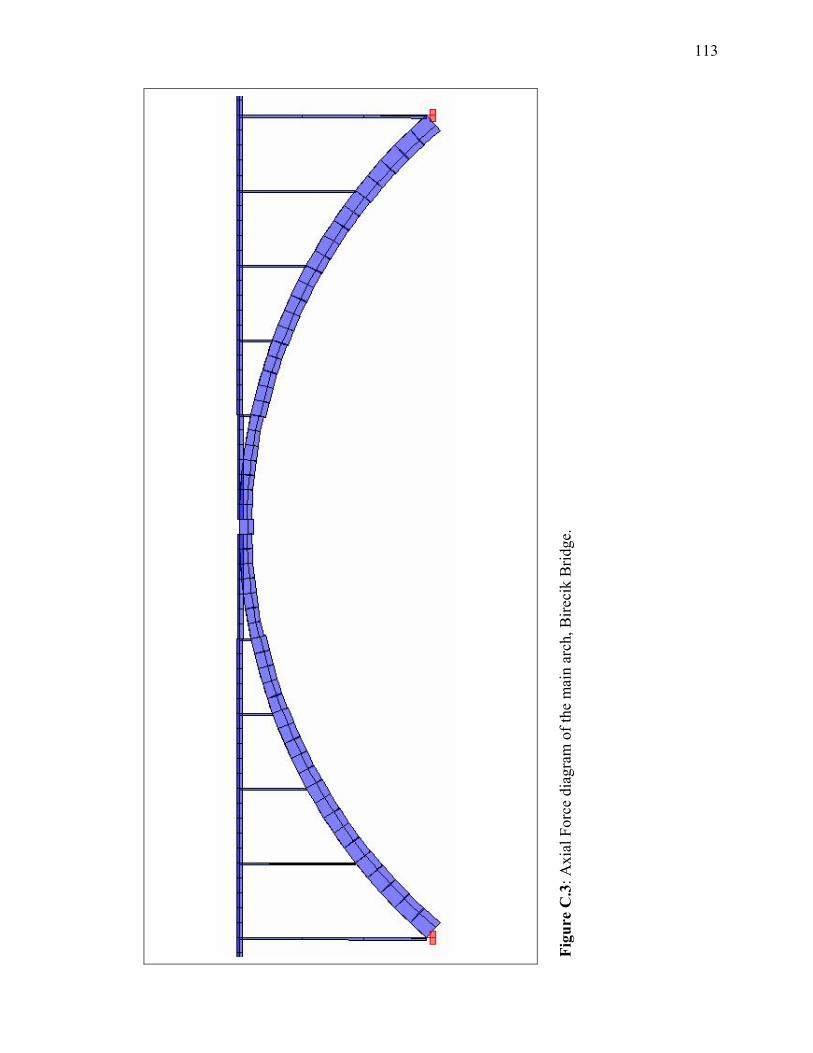
113
Figu
re C
.3: A
xial
For
ce d
iagr
am o
f the
mai
n ar
ch, B
ireci
k B
ridge
.
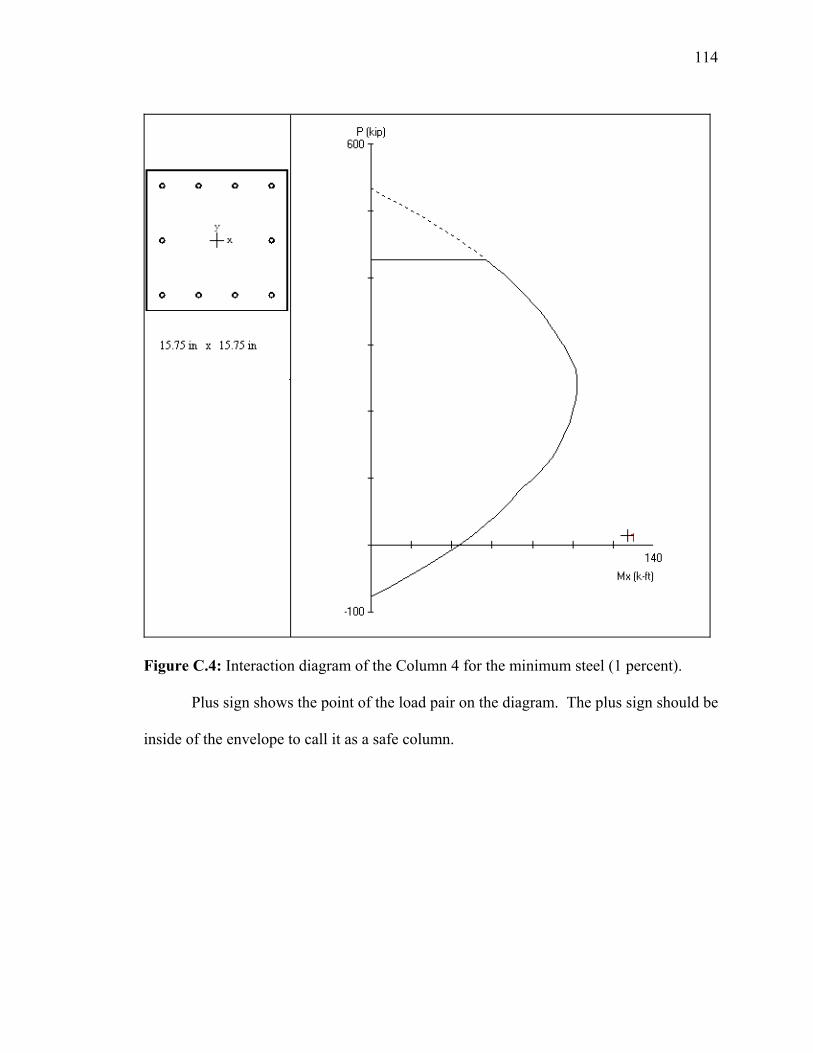
114
Figure C.4: Interaction diagram of the Column 4 for the minimum steel (1 percent).
Plus sign shows the point of the load pair on the diagram. The plus sign should be
inside of the envelope to call it as a safe column.
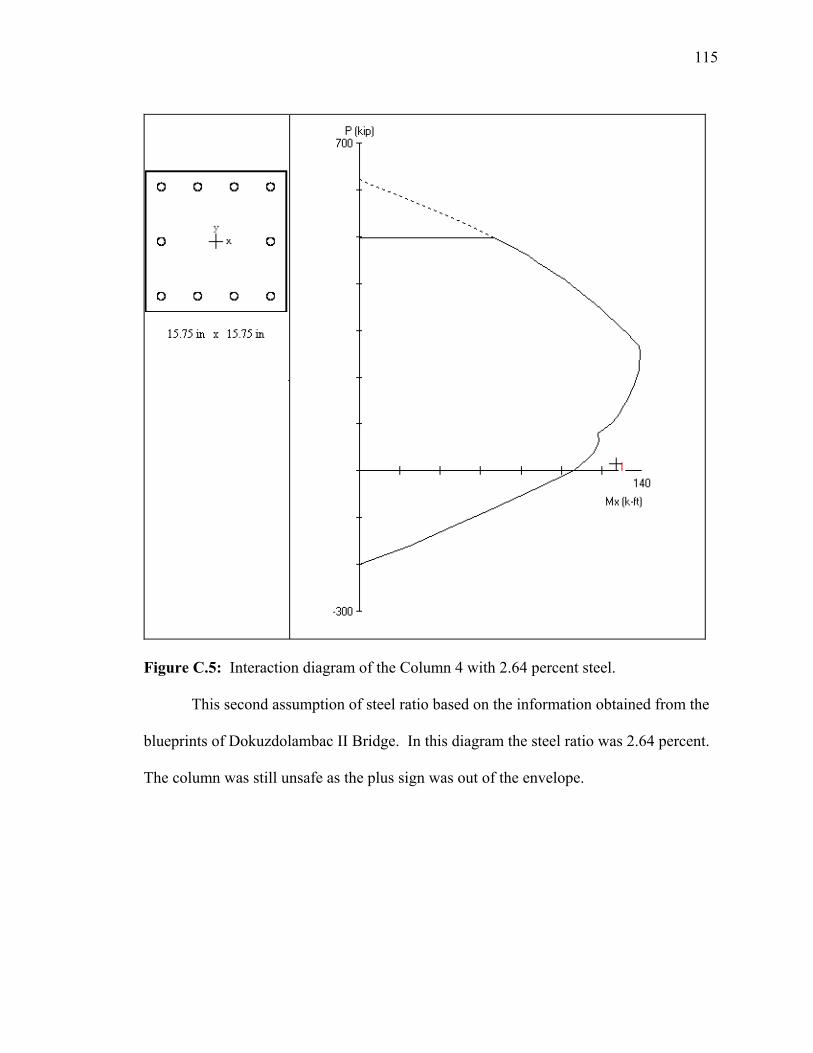
115
Figure C.5: Interaction diagram of the Column 4 with 2.64 percent steel.
This second assumption of steel ratio based on the information obtained from the
blueprints of Dokuzdolambac II Bridge. In this diagram the steel ratio was 2.64 percent.
The column was still unsafe as the plus sign was out of the envelope.
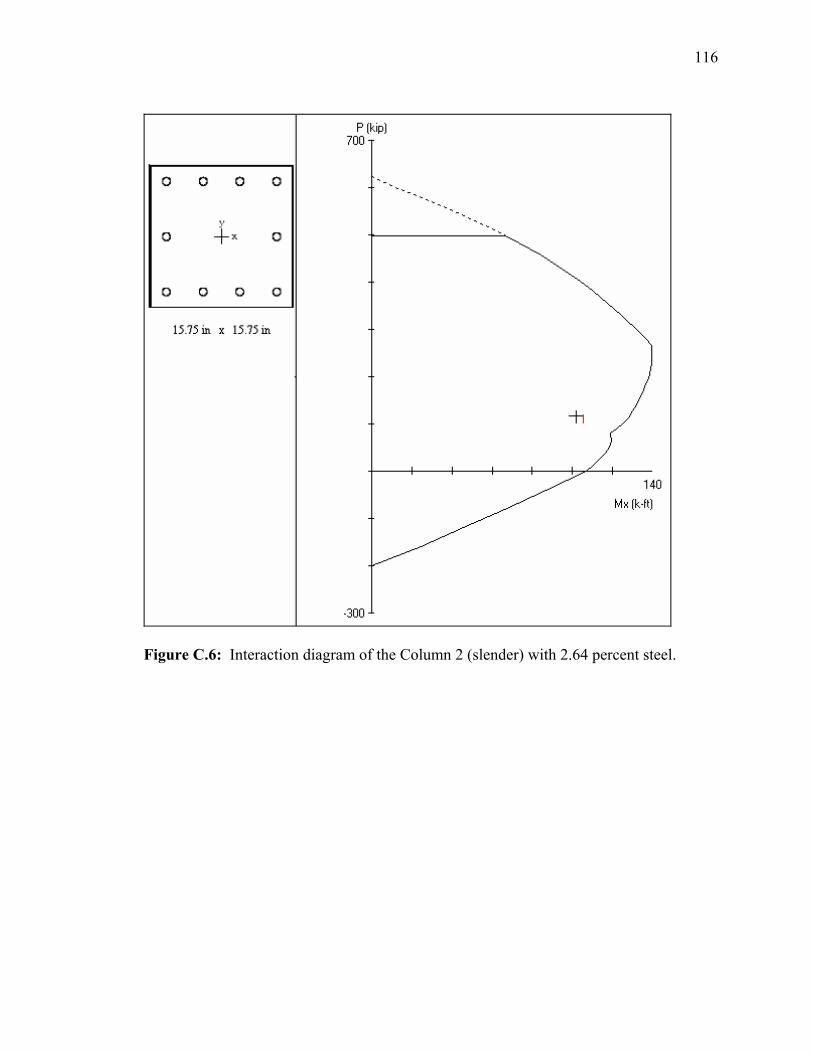
116
Figure C.6: Interaction diagram of the Column 2 (slender) with 2.64 percent steel.
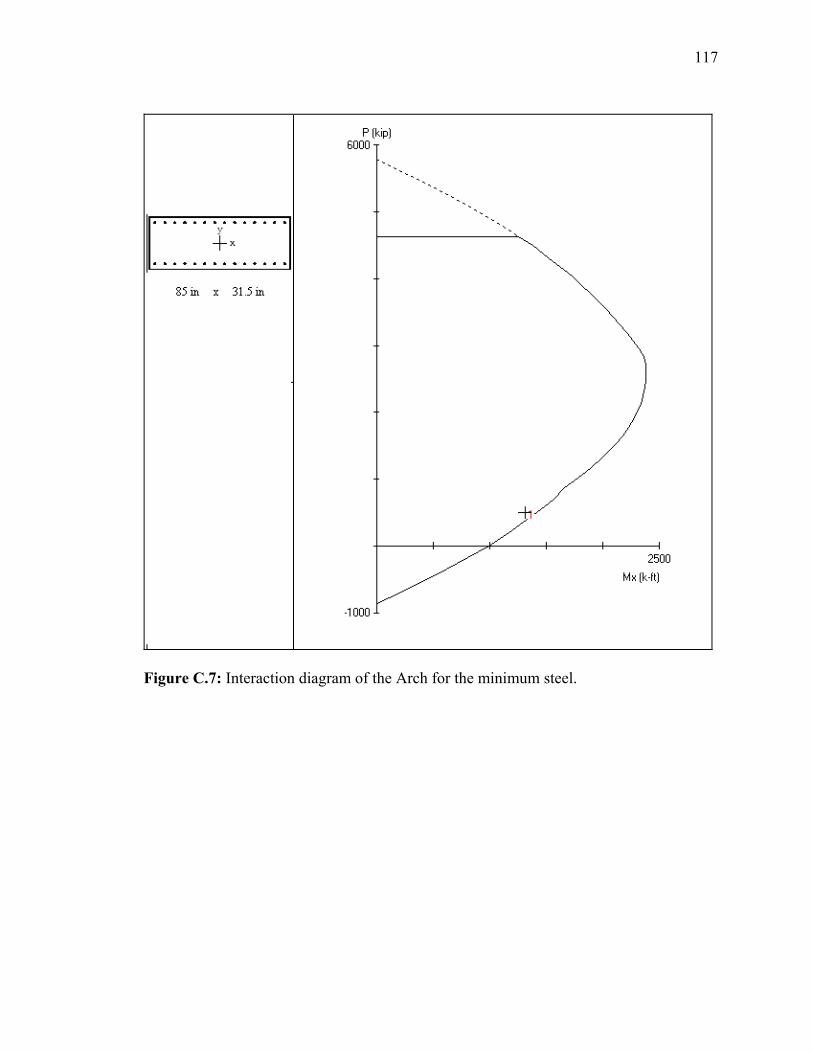
117
Figure C.7: Interaction diagram of the Arch for the minimum steel.
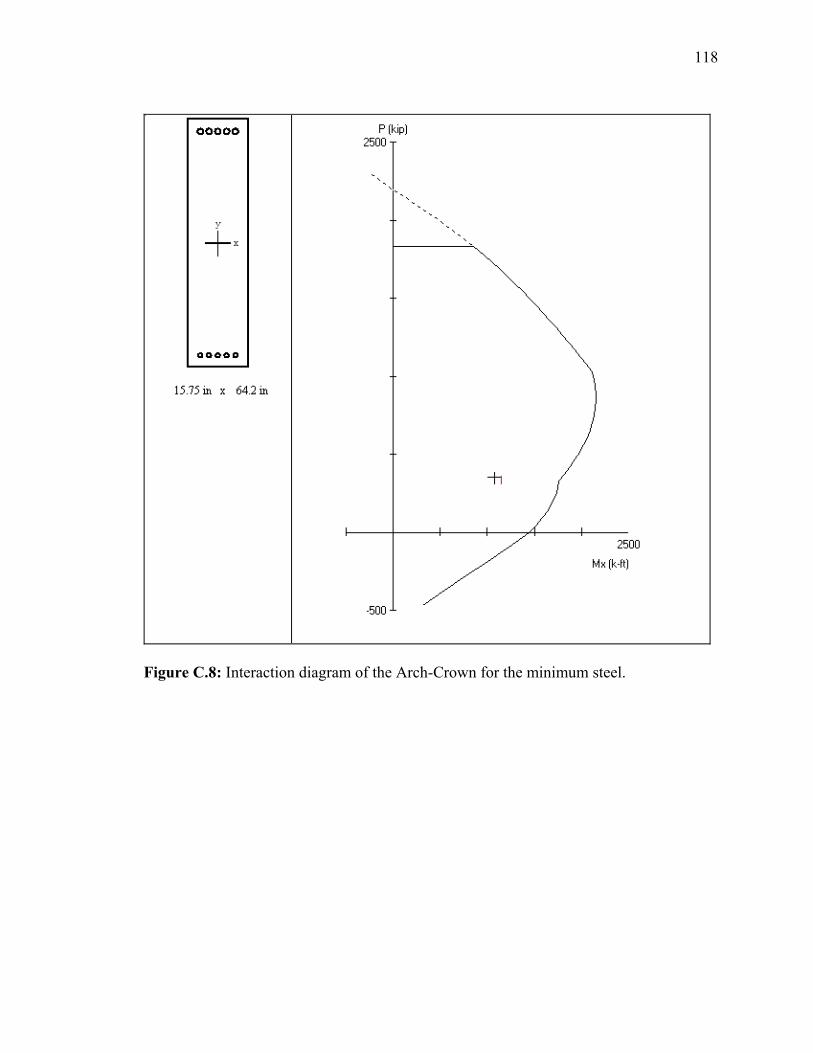
118
Figure C.8: Interaction diagram of the Arch-Crown for the minimum steel.
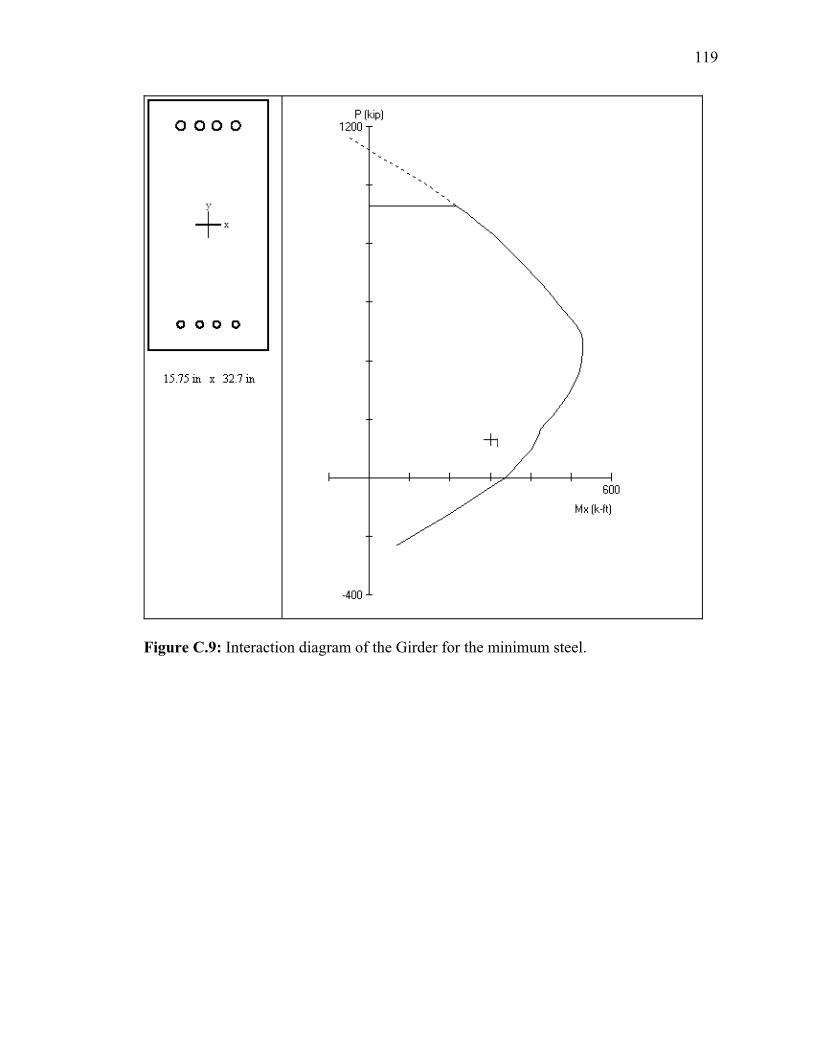
119
Figure C.9: Interaction diagram of the Girder for the minimum steel.
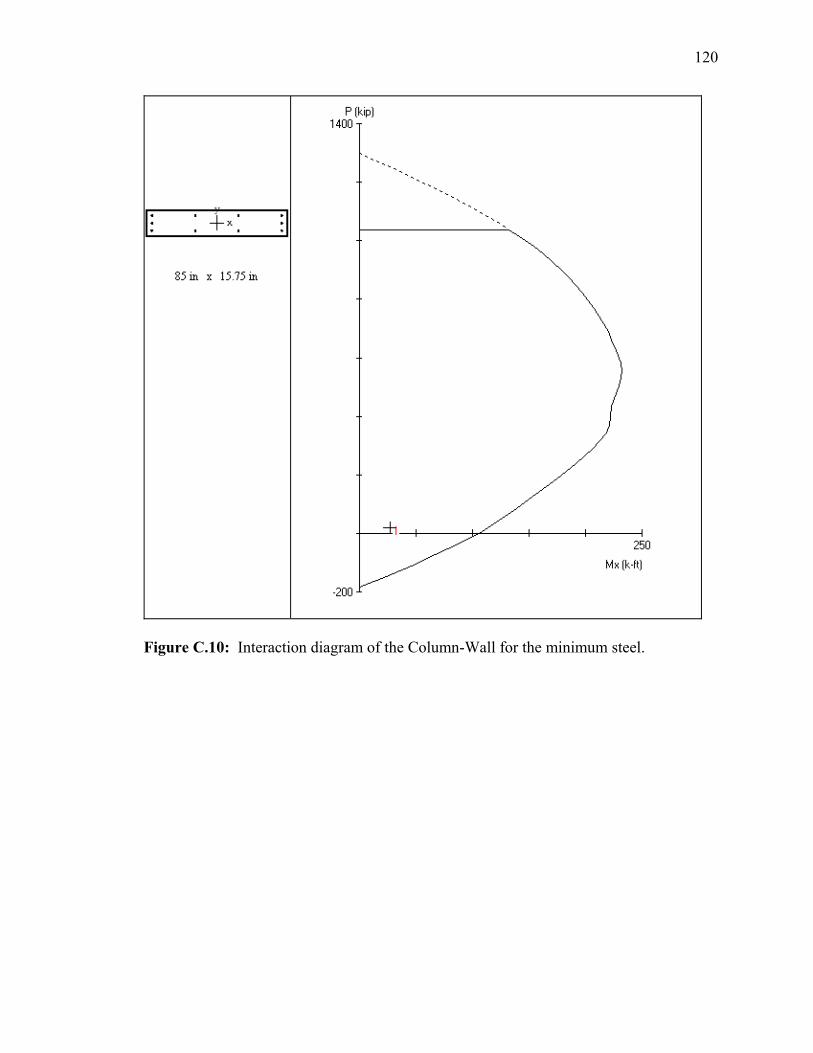
120
Figure C.10: Interaction diagram of the Column-Wall for the minimum steel.
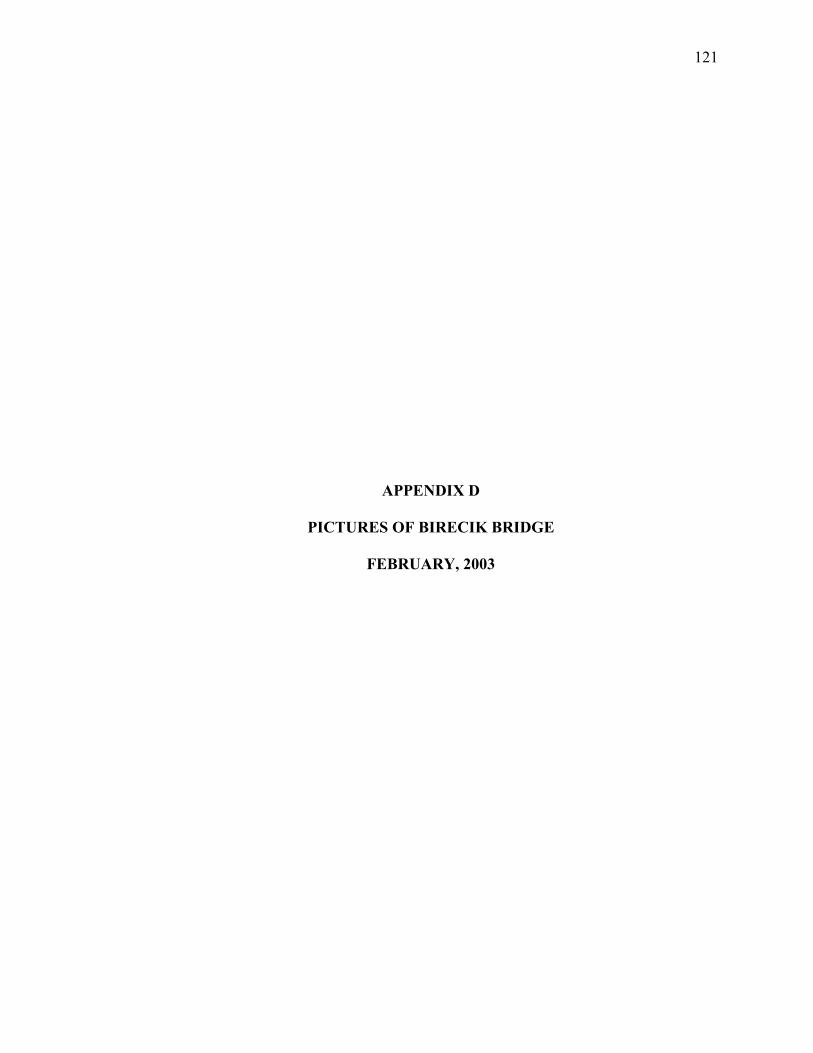
121
APPENDIX D
PICTURES OF BIRECIK BRIDGE
FEBRUARY, 2003
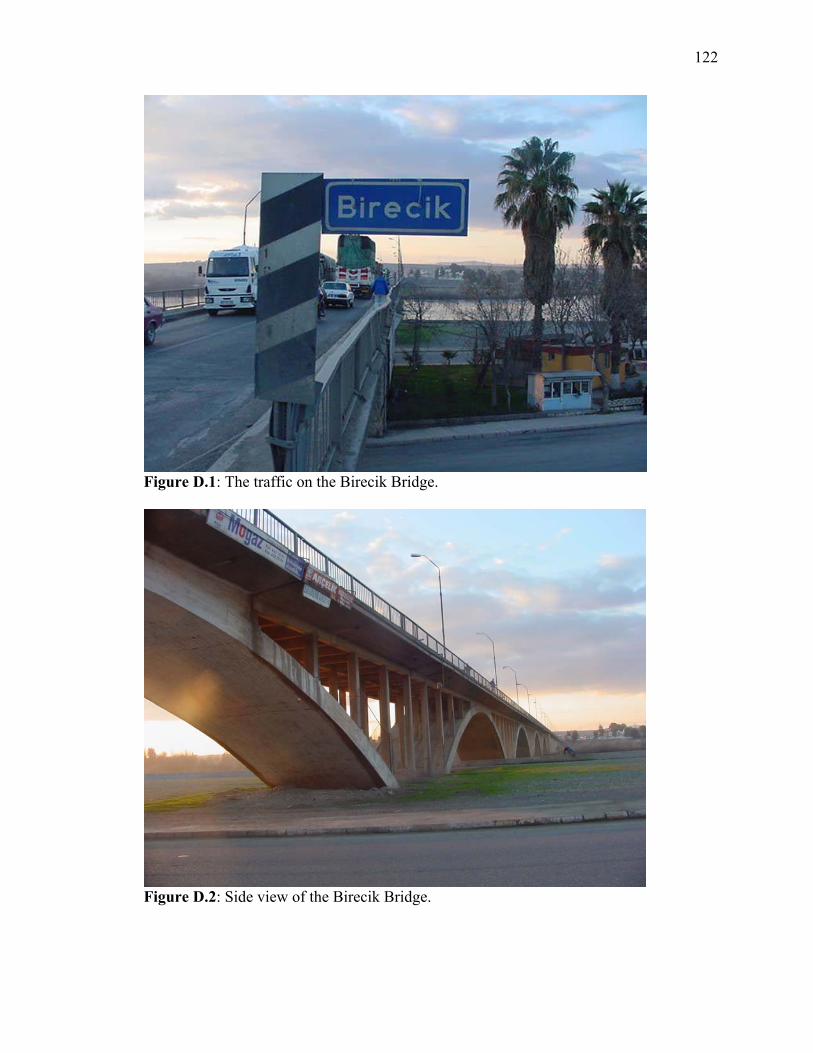
122
Figure D.1: The traffic on the Birecik Bridge.
Figure D.2: Side view of the Birecik Bridge.
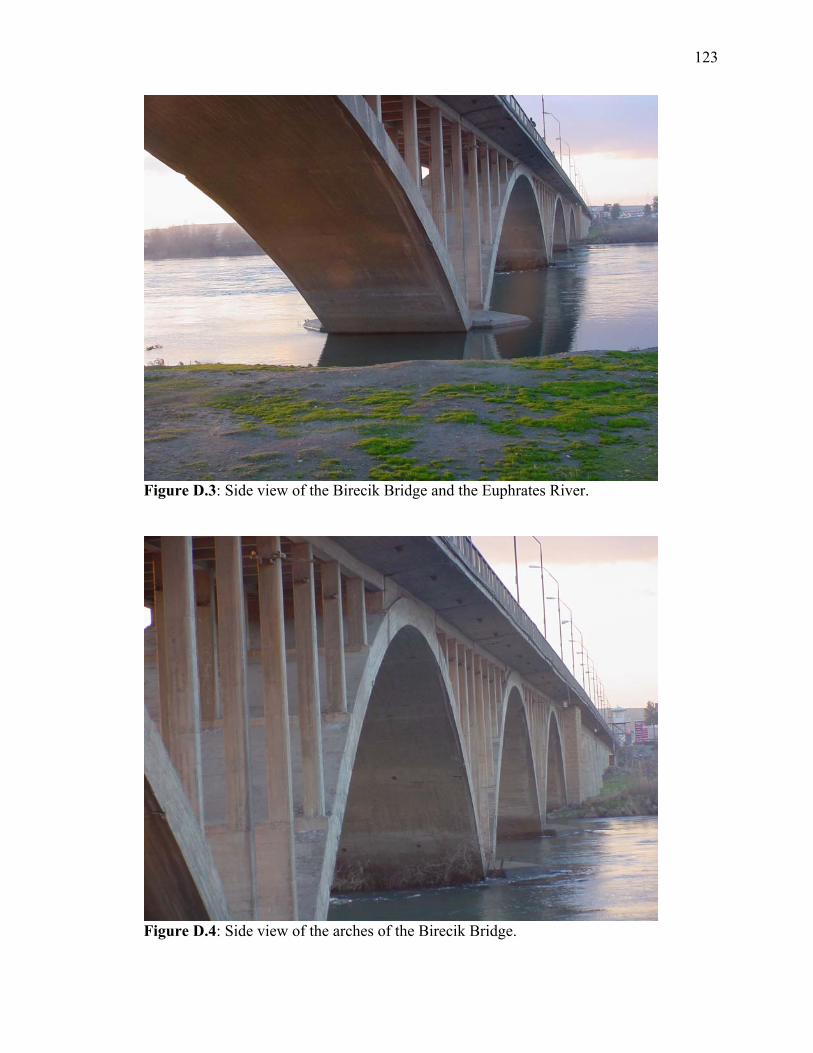
123
Figure D.3: Side view of the Birecik Bridge and the Euphrates River.
Figure D.4: Side view of the arches of the Birecik Bridge.
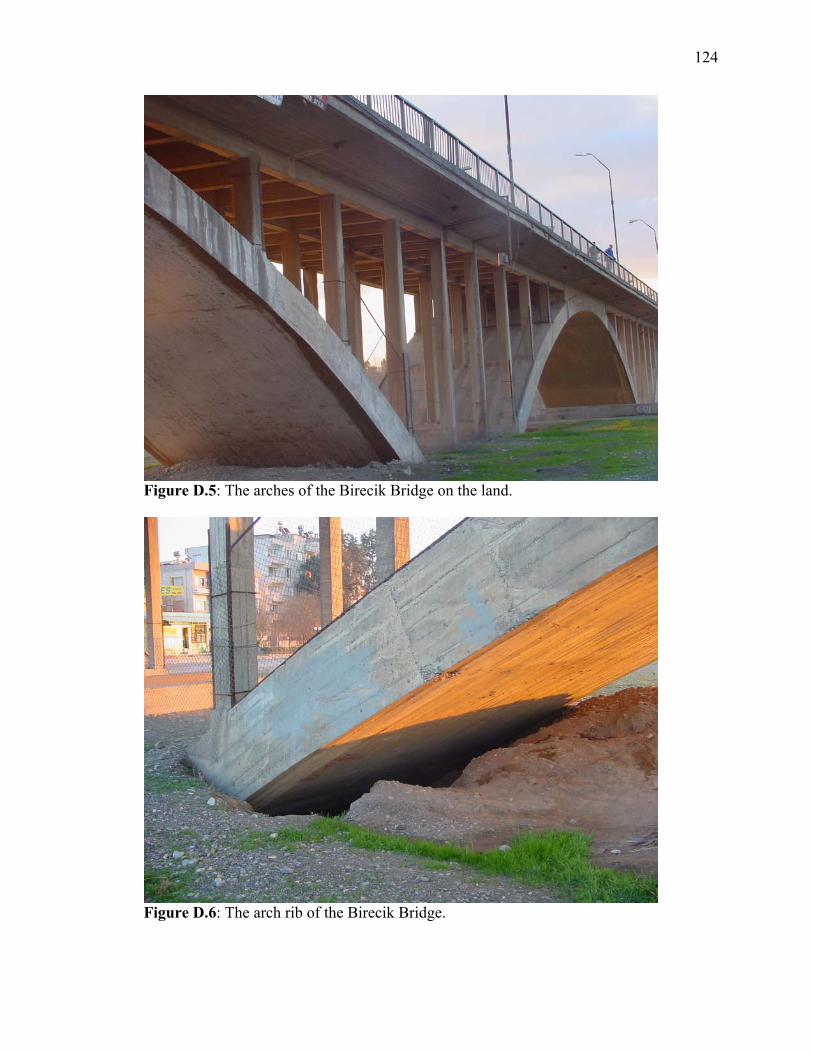
124
Figure D.5: The arches of the Birecik Bridge on the land.
Figure D.6: The arch rib of the Birecik Bridge.
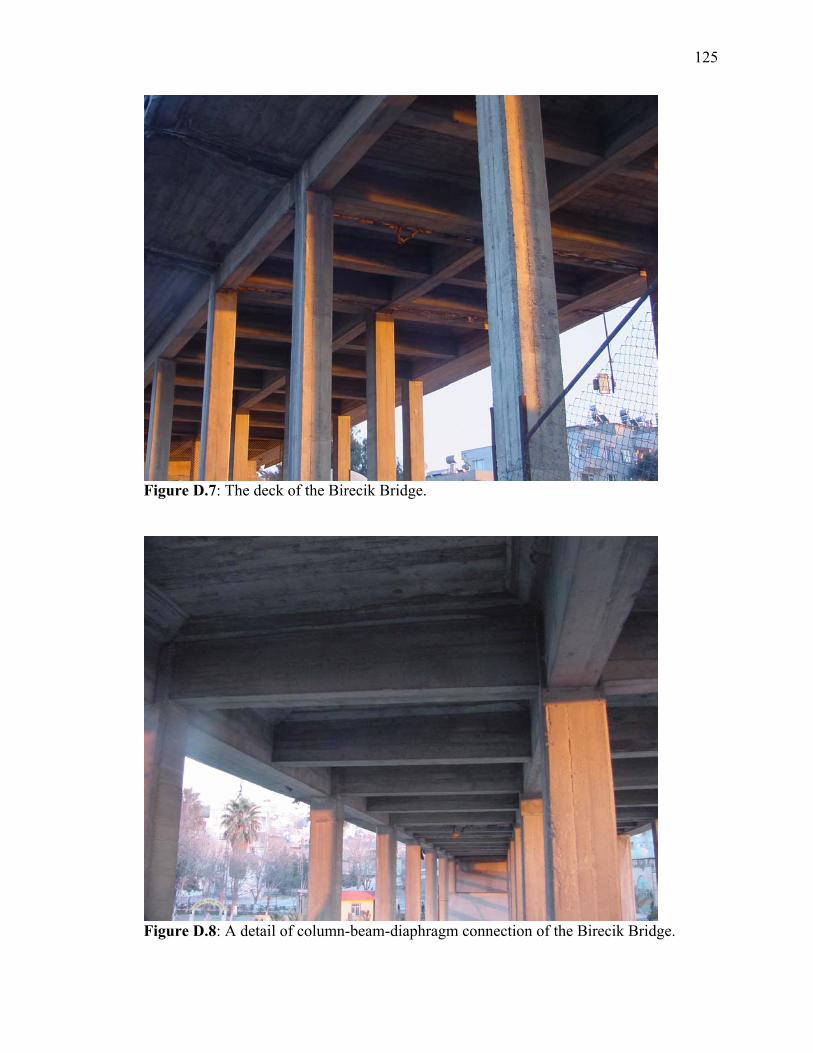
125
Figure D.7: The deck of the Birecik Bridge.
Figure D.8: A detail of column-beam-diaphragm connection of the Birecik Bridge.
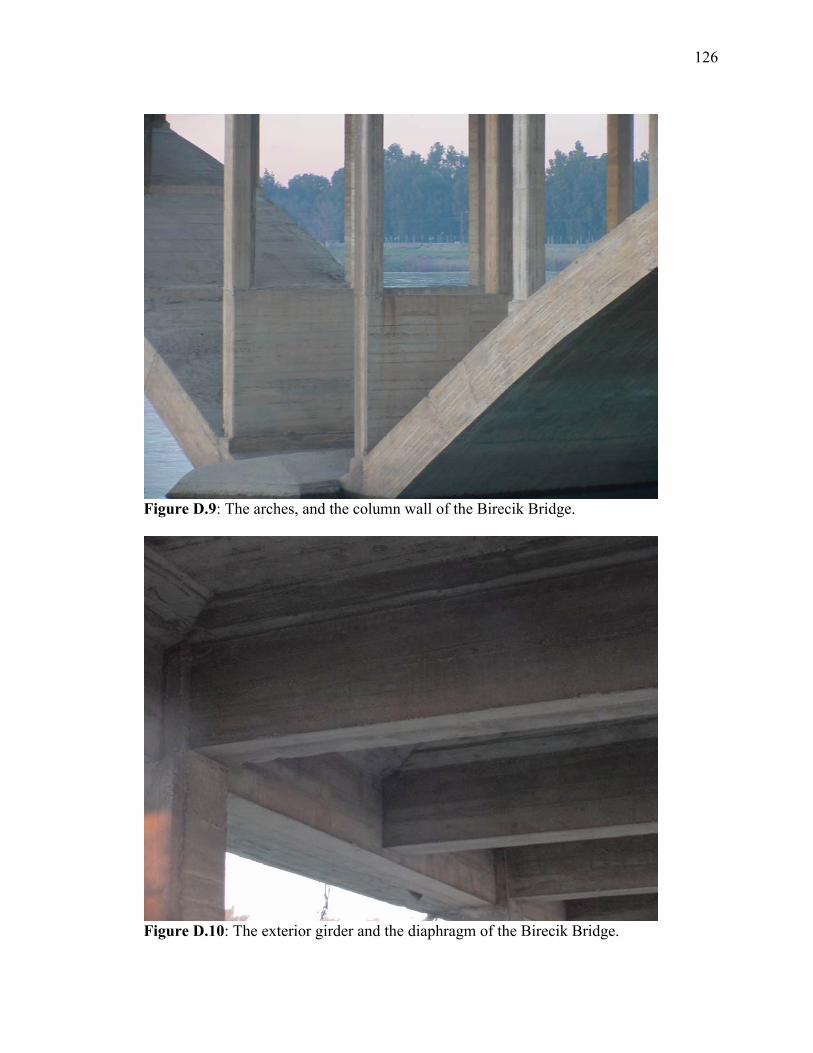
126
Figure D.9: The arches, and the column wall of the Birecik Bridge.
Figure D.10: The exterior girder and the diaphragm of the Birecik Bridge.
127
APPENDIX E
PICTURES OF CANDIR BRIDGE
MAY, 2003
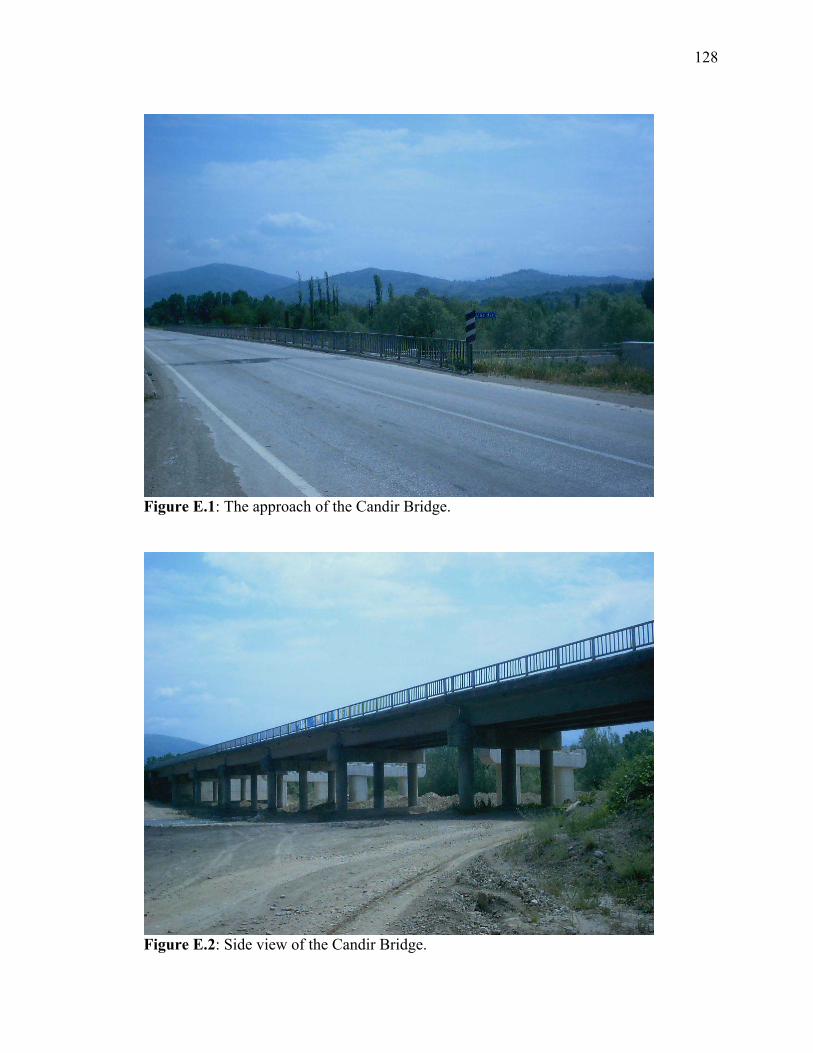
128
Figure E.1: The approach of the Candir Bridge.
Figure E.2: Side view of the Candir Bridge.
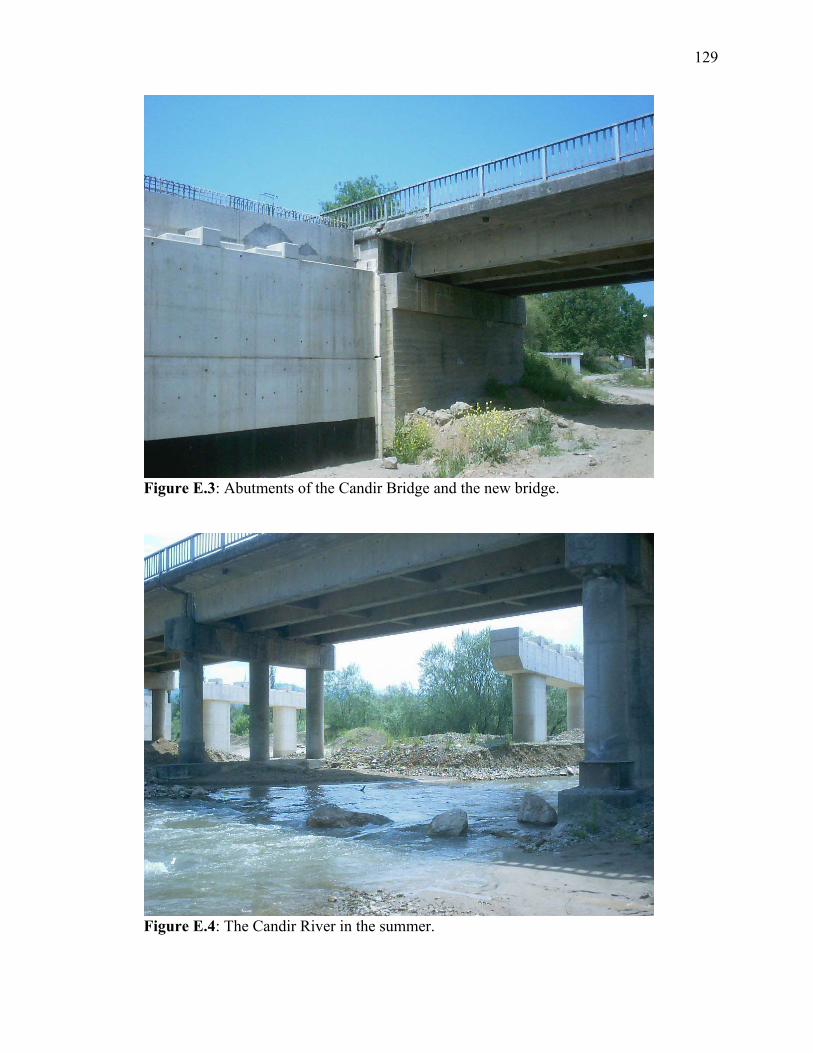
129
Figure E.3: Abutments of the Candir Bridge and the new bridge.
Figure E.4: The Candir River in the summer.
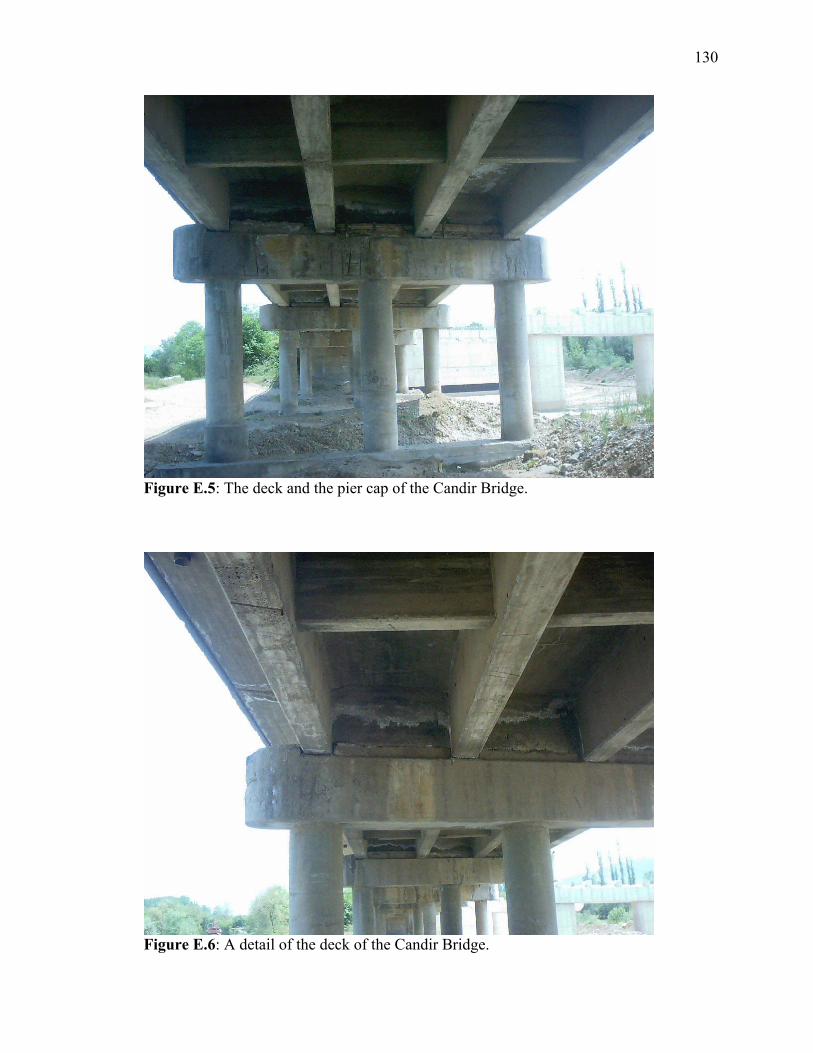
130
Figure E.5: The deck and the pier cap of the Candir Bridge.
Figure E.6: A detail of the deck of the Candir Bridge.
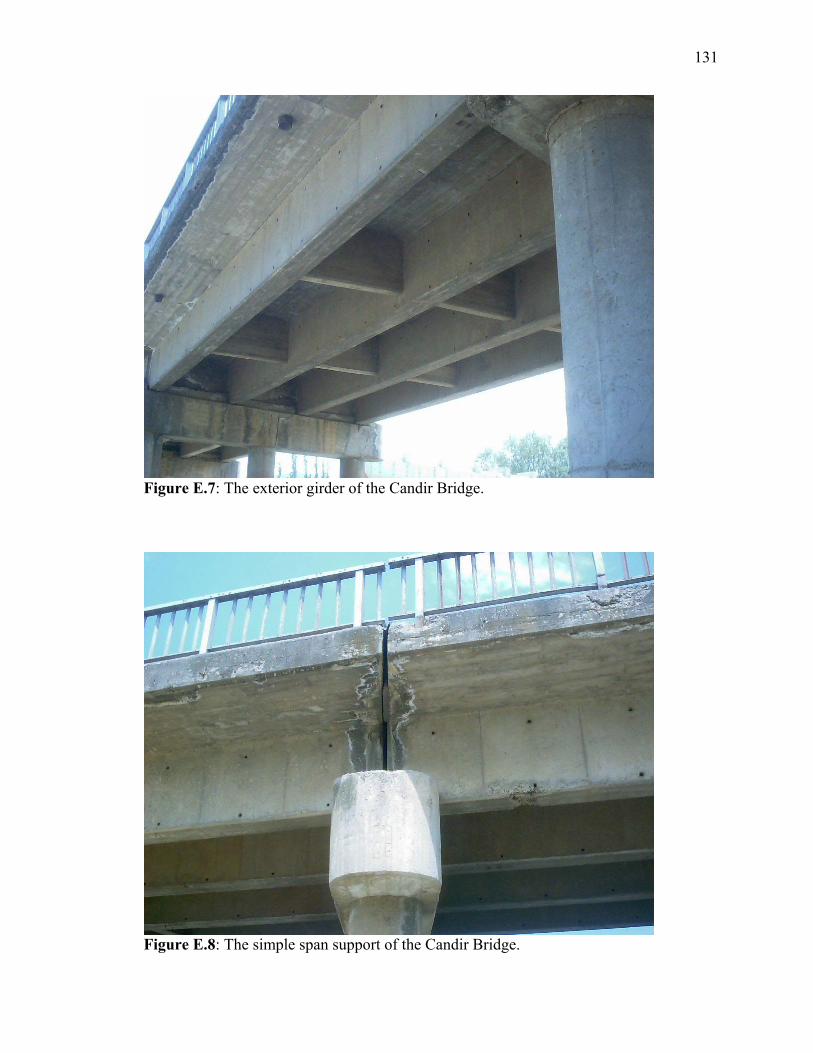
131
Figure E.7: The exterior girder of the Candir Bridge.
Figure E.8: The simple span support of the Candir Bridge.
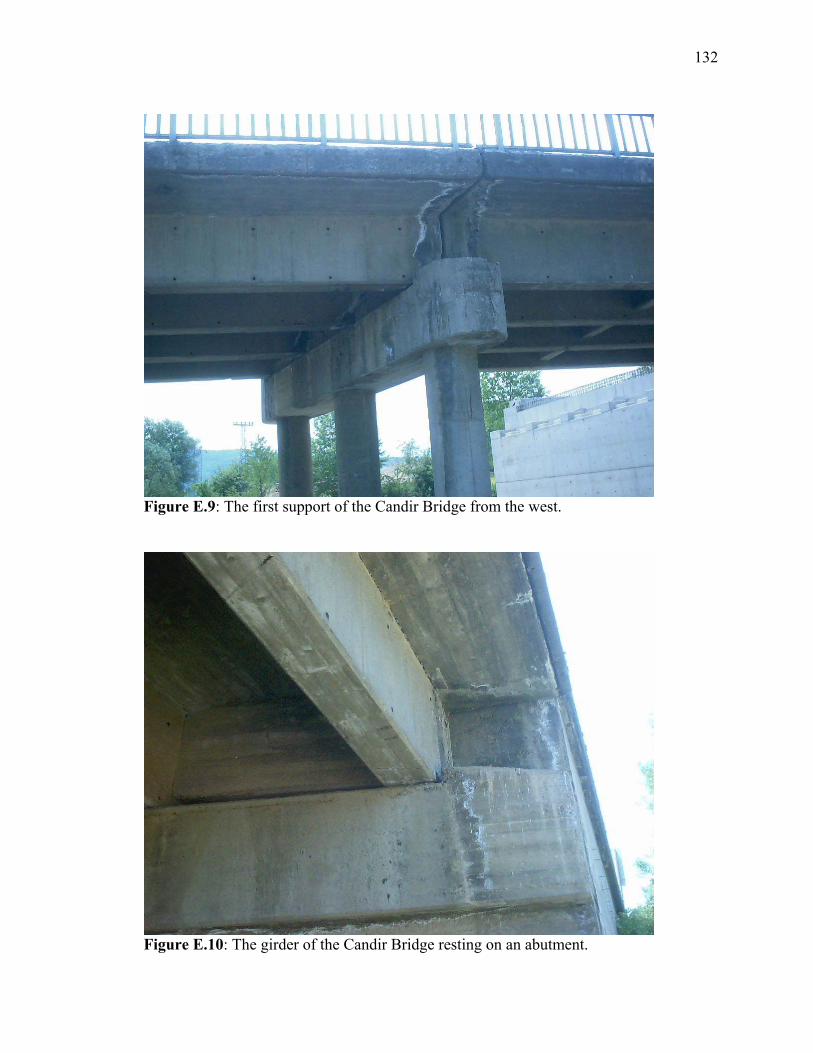
132
Figure E.9: The first support of the Candir Bridge from the west.
Figure E.10: The girder of the Candir Bridge resting on an abutment.
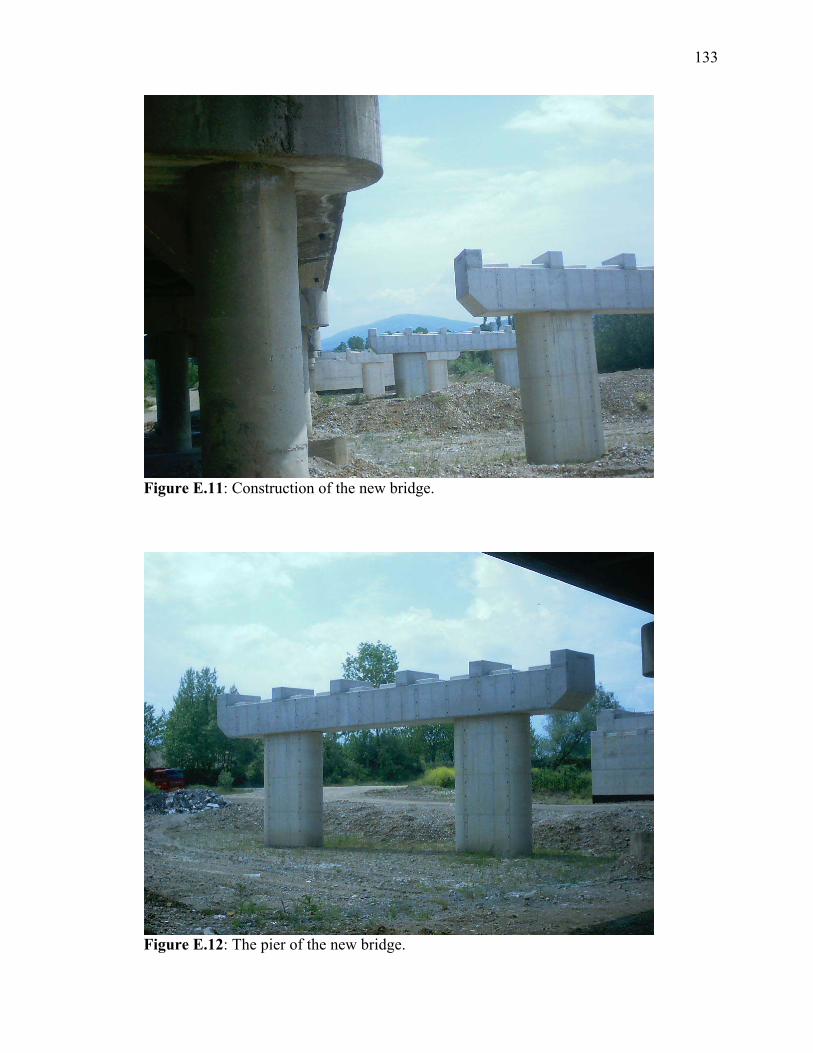
133
Figure E.11: Construction of the new bridge.
Figure E.12: The pier of the new bridge.
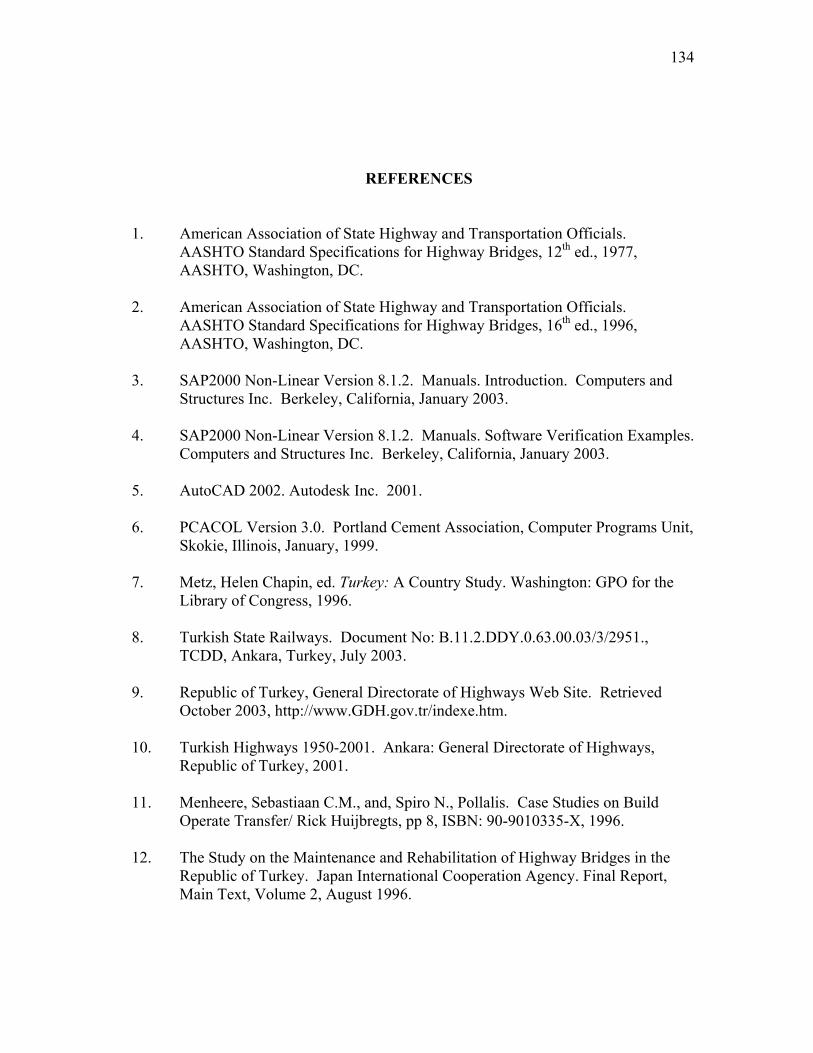
134
REFERENCES 1. American Association of State Highway and Transportation Officials.
AASHTO Standard Specifications for Highway Bridges, 12th ed., 1977, AASHTO, Washington, DC.
2. American Association of State Highway and Transportation Officials.
AASHTO Standard Specifications for Highway Bridges, 16th ed., 1996, AASHTO, Washington, DC.
3. SAP2000 Non-Linear Version 8.1.2. Manuals. Introduction. Computers and
Structures Inc. Berkeley, California, January 2003.
4. SAP2000 Non-Linear Version 8.1.2. Manuals. Software Verification Examples. Computers and Structures Inc. Berkeley, California, January 2003.
5. AutoCAD 2002. Autodesk Inc. 2001.
6. PCACOL Version 3.0. Portland Cement Association, Computer Programs Unit,
Skokie, Illinois, January, 1999.
7. Metz, Helen Chapin, ed. Turkey: A Country Study. Washington: GPO for the Library of Congress, 1996.
8. Turkish State Railways. Document No: B.11.2.DDY.0.63.00.03/3/2951.,
TCDD, Ankara, Turkey, July 2003. 9. Republic of Turkey, General Directorate of Highways Web Site. Retrieved
October 2003, http://www.GDH.gov.tr/indexe.htm. 10. Turkish Highways 1950-2001. Ankara: General Directorate of Highways,
Republic of Turkey, 2001. 11. Menheere, Sebastiaan C.M., and, Spiro N., Pollalis. Case Studies on Build
Operate Transfer/ Rick Huijbregts, pp 8, ISBN: 90-9010335-X, 1996. 12. The Study on the Maintenance and Rehabilitation of Highway Bridges in the
Republic of Turkey. Japan International Cooperation Agency. Final Report, Main Text, Volume 2, August 1996.
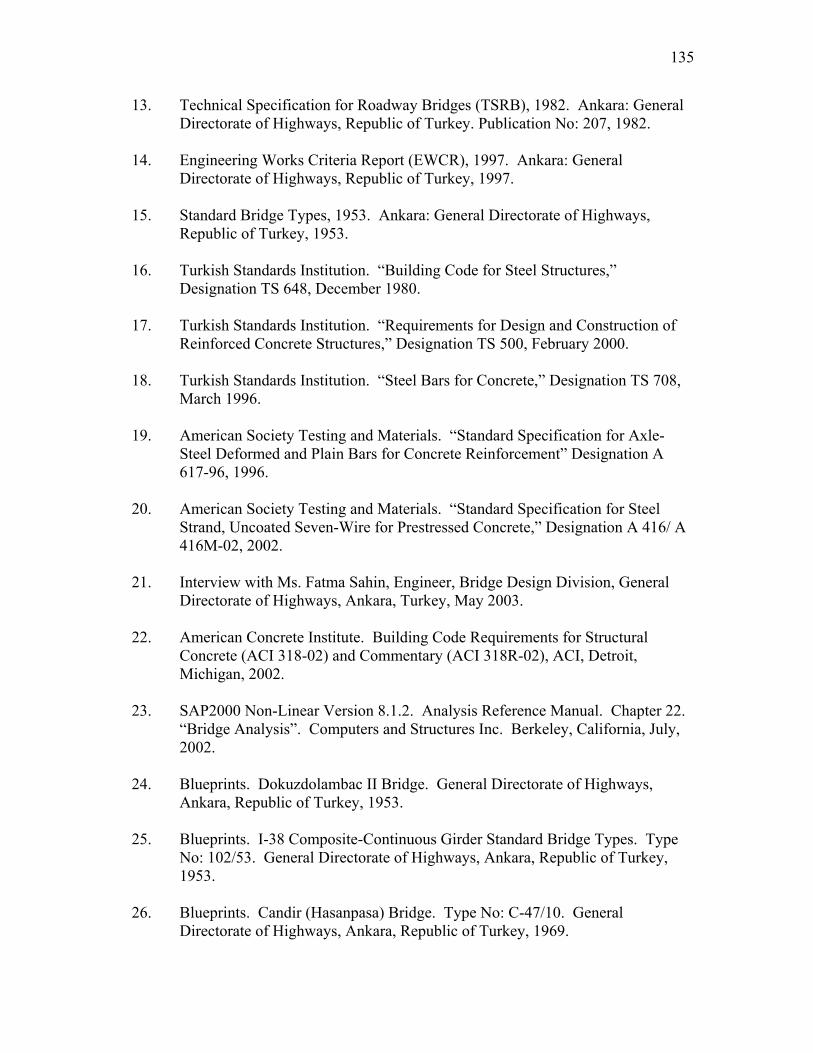
135
13. Technical Specification for Roadway Bridges (TSRB), 1982. Ankara: General Directorate of Highways, Republic of Turkey. Publication No: 207, 1982.
14. Engineering Works Criteria Report (EWCR), 1997. Ankara: General
Directorate of Highways, Republic of Turkey, 1997. 15. Standard Bridge Types, 1953. Ankara: General Directorate of Highways,
Republic of Turkey, 1953. 16. Turkish Standards Institution. “Building Code for Steel Structures,”
Designation TS 648, December 1980. 17. Turkish Standards Institution. “Requirements for Design and Construction of
Reinforced Concrete Structures,” Designation TS 500, February 2000. 18. Turkish Standards Institution. “Steel Bars for Concrete,” Designation TS 708,
March 1996. 19. American Society Testing and Materials. “Standard Specification for Axle-
Steel Deformed and Plain Bars for Concrete Reinforcement” Designation A 617-96, 1996.
20. American Society Testing and Materials. “Standard Specification for Steel
Strand, Uncoated Seven-Wire for Prestressed Concrete,” Designation A 416/ A 416M-02, 2002.
21. Interview with Ms. Fatma Sahin, Engineer, Bridge Design Division, General
Directorate of Highways, Ankara, Turkey, May 2003. 22. American Concrete Institute. Building Code Requirements for Structural
Concrete (ACI 318-02) and Commentary (ACI 318R-02), ACI, Detroit, Michigan, 2002.
23. SAP2000 Non-Linear Version 8.1.2. Analysis Reference Manual. Chapter 22.
“Bridge Analysis”. Computers and Structures Inc. Berkeley, California, July, 2002.
24. Blueprints. Dokuzdolambac II Bridge. General Directorate of Highways,
Ankara, Republic of Turkey, 1953. 25. Blueprints. I-38 Composite-Continuous Girder Standard Bridge Types. Type
No: 102/53. General Directorate of Highways, Ankara, Republic of Turkey, 1953.
26. Blueprints. Candir (Hasanpasa) Bridge. Type No: C-47/10. General
Directorate of Highways, Ankara, Republic of Turkey, 1969.
136
BIOGRAPHY
Mustafa Sehmuz Lok was born in Ankara, Turkey on October 24, 1979, the son
of Omer Lutfi Lok and Gulhan Lok. After attending Anatolian High School, Ankara he
entered the Middle East Technical University, Ankara, Turkey. In 2002 he completed
the requirements for the degree of Bachelor of Science in Civil Engineering.
In the Fall of 2002, he entered the Graduate Division of School of Engineering
at Tulane University, New Orleans, Louisiana. Until 2004 he was concerned with the
bridge standards and techniques under the direction of Doctor Anthony J. Lamanna. He
is currently a candidate for the degree of Master of Science in Engineering at Tulane
University.
Address (US): 6333 South Johnson Street New Orleans, Louisiana 70118 Address (Turkey): 9. Cadde Altincay Sitesi A-25
06610, Cankaya, Ankara, Turkey
This thesis was typed by the Author.