Embed Size (px)
Citation preview
ASSESSMENT OF THE SIZE AND SCOPE OF NON-FOSSIL FUELS SYSTEMS TO PHASE OUT OIL GAS & COAL
Simon P. Michaux
20/09/2021
Associate Professor Mineral Processing & Geometallurgy
20.09.2021
1
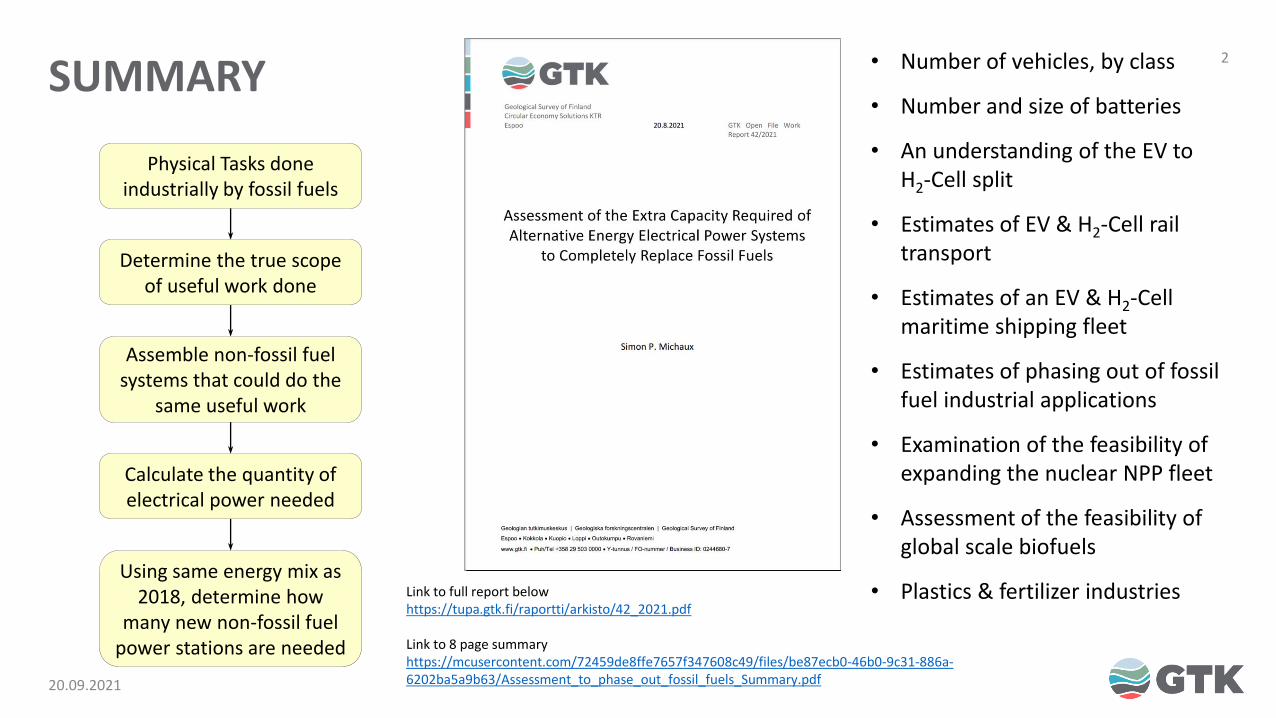
SUMMARY
20.09.2021
2
Link to full report belowhttps://tupa.gtk.fi/raportti/arkisto/42_2021.pdf
Link to 8 page summaryhttps://mcusercontent.com/72459de8ffe7657f347608c49/files/be87ecb0-46b0-9c31-886a-6202ba5a9b63/Assessment_to_phase_out_fossil_fuels_Summary.pdf
Using same energy mix as 2018, determine how
many new non-fossil fuel power stations are needed
Physical Tasks done industrially by fossil fuels
Determine the true scope of useful work done
Assemble non-fossil fuel systems that could do the
same useful work
Calculate the quantity of electrical power needed
• Number of vehicles, by class
• Number and size of batteries
• An understanding of the EV to H2-Cell split
• Estimates of EV & H2-Cell rail transport
• Estimates of an EV & H2-Cell maritime shipping fleet
• Estimates of phasing out of fossil fuel industrial applications
• Examination of the feasibility of expanding the nuclear NPP fleet
• Assessment of the feasibility of global scale biofuels
• Plastics & fertilizer industries
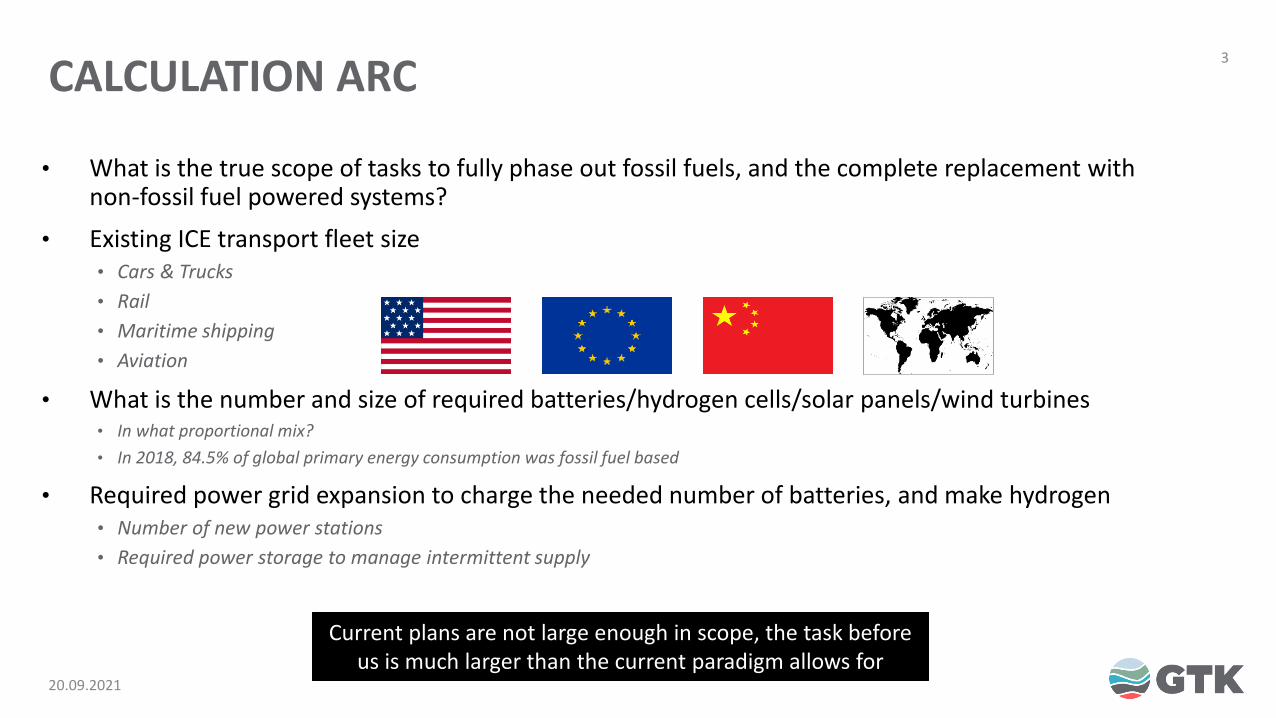
CALCULATION ARC
• What is the true scope of tasks to fully phase out fossil fuels, and the complete replacement with non-fossil fuel powered systems?
• Existing ICE transport fleet size• Cars & Trucks
• Rail
• Maritime shipping
• Aviation
• What is the number and size of required batteries/hydrogen cells/solar panels/wind turbines• In what proportional mix?
• In 2018, 84.5% of global primary energy consumption was fossil fuel based
• Required power grid expansion to charge the needed number of batteries, and make hydrogen• Number of new power stations
• Required power storage to manage intermittent supply
20.09.2021
3
Current plans are not large enough in scope, the task before us is much larger than the current paradigm allows for

20.9.2021
4
BASELINE CALCULATION• The global fleet of vehicles is estimated to be 1.416 billion, which travelled an estimated 15.87
trillion km in the year 2018• 0.7% is EV in 2020
• For the same energy output:• …an Electric Vehicle system requires battery storage mass 3.2 times the fuel tank (@700bar) mass of a hydrogen H-Cell system
• …meanwhile a hydrogen H-Cell system will require 2.5 times more electricity compared to a Electric Vehicle system
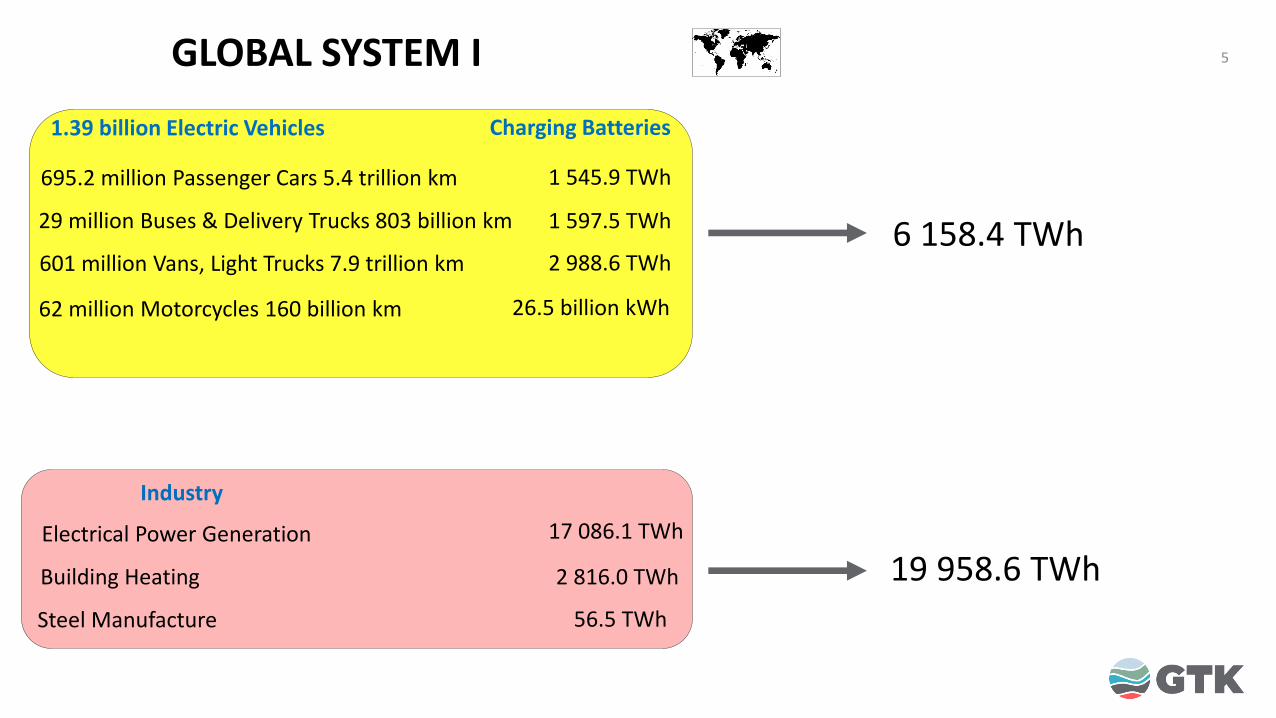
• All short-range transport could be done by Electric Vehicle systems• All passenger cars, commercial vans, delivery trucks and buses (1.39 billion vehicles), would travel 14.25 trillion km in 365 days
• This would require 65.19 TWh of batteries (282.6 million tonnes of Li-Ion batteries)
• An annual additional 6 158.4 TWh of electricity will be required from the global power grid to charge those batteries
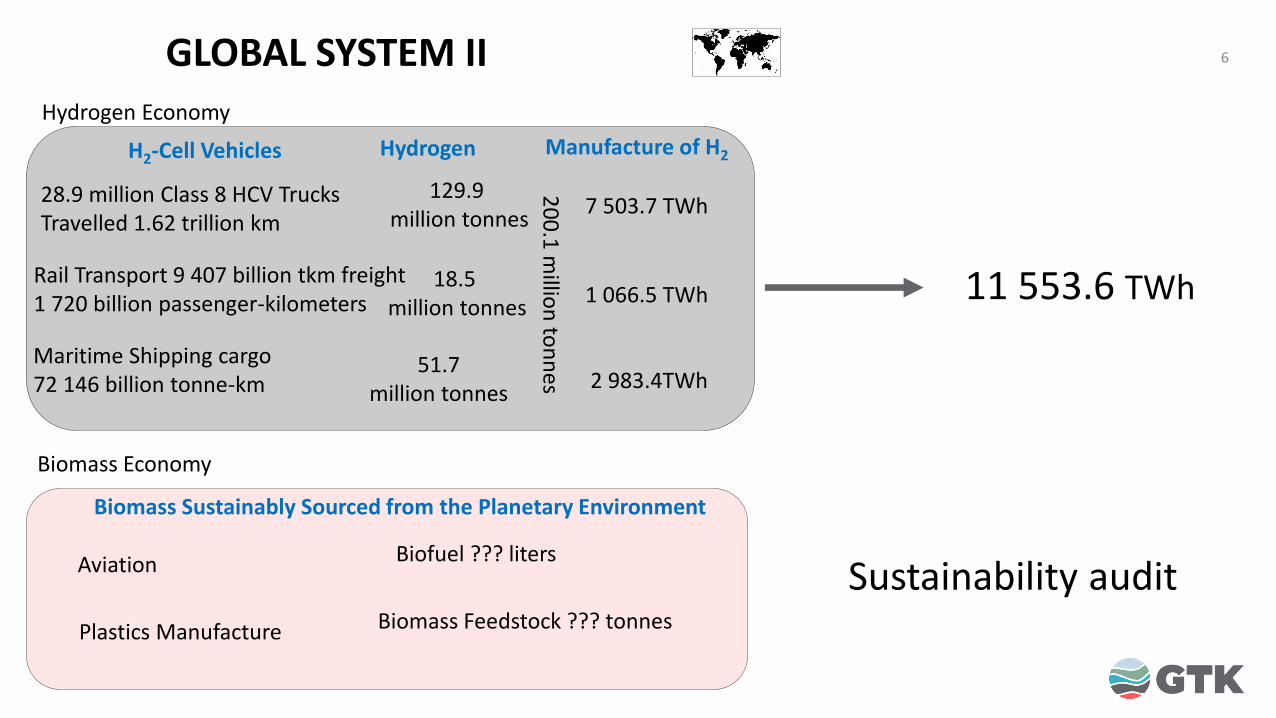
• All long-range distance transport could be powered with a hydrogen fuel cells• All Class 8 HCV trucks, the rail transport network (including freight), and the maritime ship fleet
• In total, 200.1 million tonnes of hydrogen would be needed annually
• This would require, 11 553.6 TWh of additional electricity
5
62 million Motorcycles 160 billion km
29 million Buses & Delivery Trucks 803 billion km
695.2 million Passenger Cars 5.4 trillion km 1 545.9 TWh
1 597.5 TWh
26.5 billion kWh
601 million Vans, Light Trucks 7.9 trillion km 2 988.6 TWh
1.39 billion Electric Vehicles Charging Batteries
GLOBAL SYSTEM I
Building Heating
Steel Manufacture
Electrical Power Generation 17 086.1 TWh
2 816.0 TWh
56.5 TWh
Industry
6 158.4 TWh
19 958.6 TWh
6
28.9 million Class 8 HCV TrucksTravelled 1.62 trillion km
129.9 million tonnes
Maritime Shipping cargo72 146 billion tonne-km
51.7 million tonnes
18.5 million tonnes
Rail Transport 9 407 billion tkm freight1 720 billion passenger-kilometers
7 503.7 TWh
1 066.5 TWh
2 983.4TWh
HydrogenH2-Cell Vehicles Manufacture of H2
20
0.1
millio
n to
nn
es
Hydrogen Economy
Aviation
Plastics Manufacture
Biofuel ??? liters
Biomass Sustainably Sourced from the Planetary Environment
Biomass Feedstock ??? tonnes
Biomass Economy
11 553.6 TWh
GLOBAL SYSTEM II
Sustainability audit

20.9.2021
7GLOBAL SYSTEM III
=
221 594 NEW Non-Fossil FuelPower Stations
EV 6 158.4 TWh
Industry 19 958.6 TWh
H2 11 553.6 TWh
Additional Annual Electrical Power
Requires 37 670.6 TWh
Wind Power
5 154.4 TWh63 445 stations
Solar Power
2 311.1 TWh69 573 stations
Nuclear Power
10 679.7 TWh834 stations
16 576.9 TWh12 504 stations
Hydro Power
Other RenewablesGeothermal & Tidal
367.7 TWh609 stations
Biowaste to Energy
2 580.8 TWh74 628 stations
Pow
er storage b
uffer 5
74
.27
TWh
Power plant fleet in 2018 was 46 423 stations

20.9.2021
8
0
5,000
10,000
15,000
20,000
25,000
30,000
35,000
40,000
45,000
50,000
Global Non-Fossil Fuel ElectrictyGeneration Capacity in 2018
Extra power draw required from theglobal electricity grid to completely
phase out fossil fuels, with a hybrid ofnon-fossil fuel systems
(TW
h)
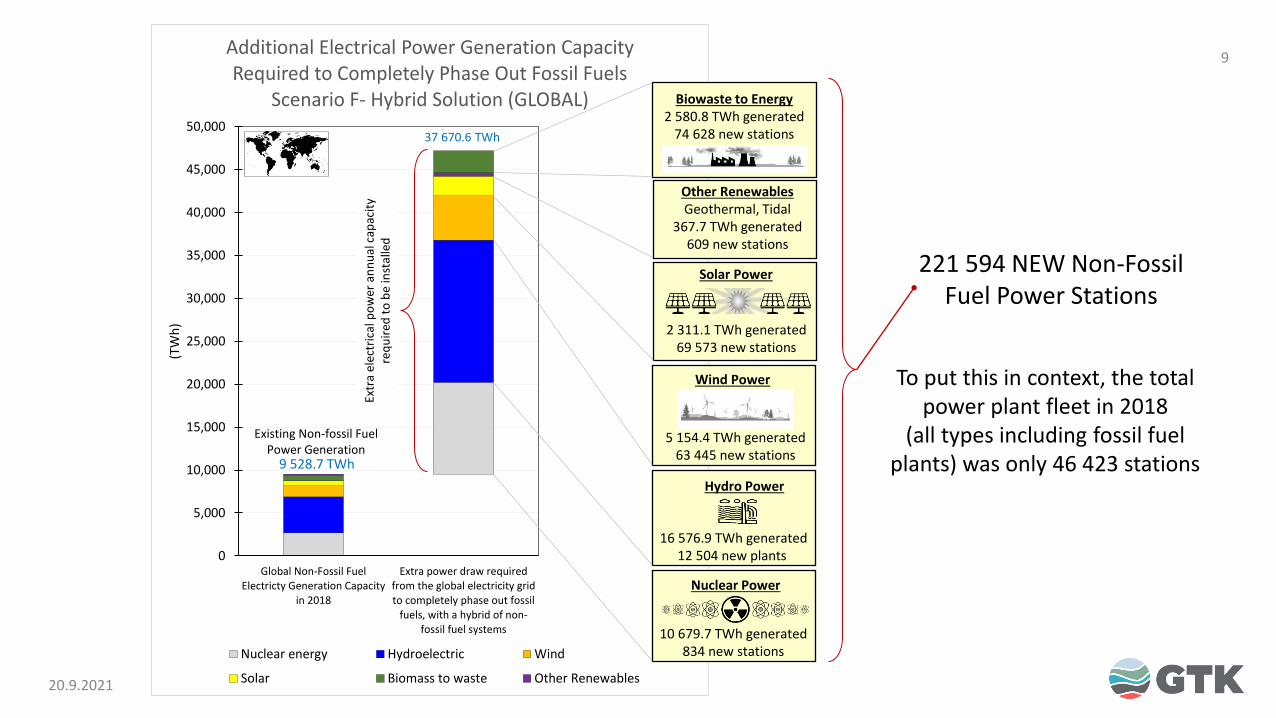
Additional Electrical Power Generation Capacity Required to Completely Phase Out Fossil Fuels
Scenario F- Hybrid Solution (GLOBAL)
Nuclear energy Hydroelectric Wind
Solar Biomass to waste Other Renewables
Electrical power required to phase out gas and coal power generation
Electrical power required charge EV
batteries
Electric power required to produce hydrogen
for H2-Cell vehicles
Electrical power required to phase out gas building heating
Electrical power required to phase out coal fired steel manufacture
Coal
Gas
Oil
Extr
a el
ectr
ical
po
wer
an
nu
al c
apac
ity
req
uir
ed t
o b
e in
stal
led
17
08
6.1
TW
hto
be
ph
ased
ou
t9 528.7 TWh
Existing Non-fossil Fuel Power Generation
37 670.6 TWh
Total electrical power production in 2018
was 26 614 TWh
20.9.2021
9
0
5,000
10,000
15,000
20,000
25,000
30,000
35,000
40,000
45,000
50,000
Global Non-Fossil FuelElectricty Generation Capacity
in 2018
Extra power draw requiredfrom the global electricity gridto completely phase out fossil
fuels, with a hybrid of non-fossil fuel systems
(TW
h)
Additional Electrical Power Generation Capacity Required to Completely Phase Out Fossil Fuels
Scenario F- Hybrid Solution (GLOBAL)
Nuclear energy Hydroelectric Wind
Solar Biomass to waste Other Renewables
9 528.7 TWh
Existing Non-fossil Fuel Power Generation
Extr
a el
ectr
ical
po
wer
an
nu
al c
apac
ity
req
uir
ed t
o b
e in
stal
led
37 670.6 TWh
Nuclear Power
10 679.7 TWh generated834 new stations
16 576.9 TWh generated12 504 new plants
Hydro Power
Solar Power
2 311.1 TWh generated69 573 new stations
Biowaste to Energy2 580.8 TWh generated
74 628 new stations
Wind Power
5 154.4 TWh generated63 445 new stations
Other RenewablesGeothermal, Tidal
367.7 TWh generated609 new stations
To put this in context, the total power plant fleet in 2018
(all types including fossil fuel plants) was only 46 423 stations
221 594 NEW Non-Fossil Fuel Power Stations
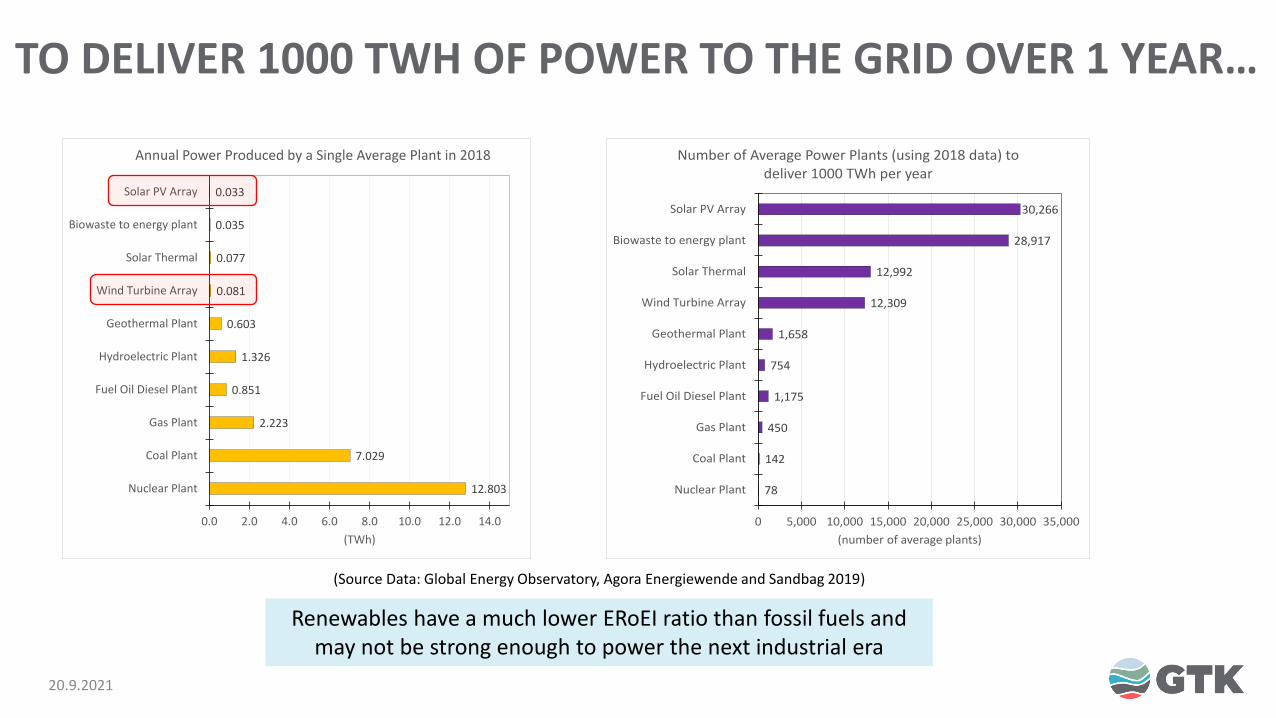
TO DELIVER 1000 TWH OF POWER TO THE GRID OVER 1 YEAR…
20.9.2021
12.803
7.029
2.223
0.851
1.326
0.603
0.081
0.077
0.035
0.033
0.0 2.0 4.0 6.0 8.0 10.0 12.0 14.0
Nuclear Plant
Coal Plant
Gas Plant
Fuel Oil Diesel Plant
Hydroelectric Plant
Geothermal Plant
Wind Turbine Array
Solar Thermal
Biowaste to energy plant
Solar PV Array
(TWh)
Annual Power Produced by a Single Average Plant in 2018
78
142
450
1,175
754
1,658
12,309
12,992
28,917
30,266
0 5,000 10,000 15,000 20,000 25,000 30,000 35,000
Nuclear Plant
Coal Plant
Gas Plant
Fuel Oil Diesel Plant
Hydroelectric Plant
Geothermal Plant
Wind Turbine Array
Solar Thermal
Biowaste to energy plant
Solar PV Array
(number of average plants)
Number of Average Power Plants (using 2018 data) to deliver 1000 TWh per year
Renewables have a much lower ERoEI ratio than fossil fuels and may not be strong enough to power the next industrial era
(Source Data: Global Energy Observatory, Agora Energiewende and Sandbag 2019)

20.9.2021
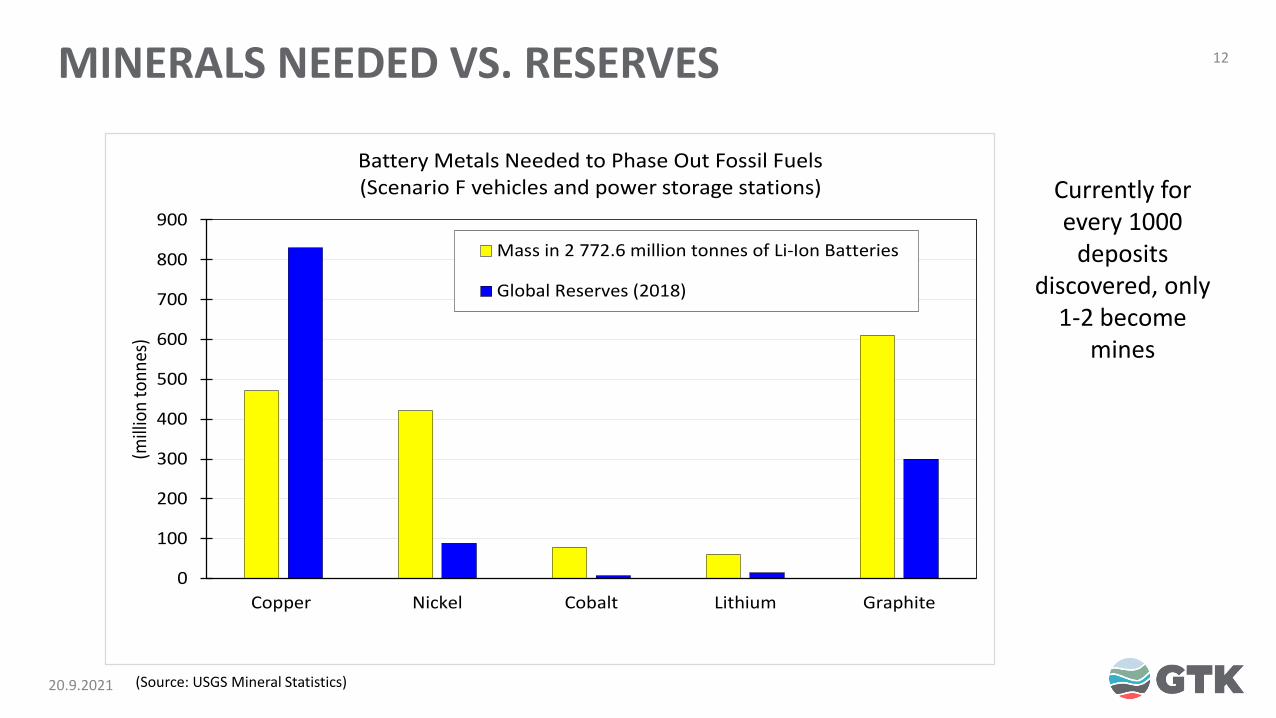
11MINERALS NEEDED VS. RESERVES
Metal2018 Global
Annual Production
Mass in 2 772.6 million tonnes of Li-Ion
Batteries
Years of Production at 2018 Capacity Required to Phase
Out Fossil Fuels
(tonnes) (million tonnes) (years of production)
Copper 21,000,000 471.3 22.4
Aluminium Metal from smelter production
60,000,000 235.7 3.9
Nickel 2,300,000 421.2 183.1
Cobalt 140,000 77.4 552.5
Lithium 85,000 60.2 707.8
Graphite 930,000 610.0 655.9(Source: USGS Mineral Statistics)
20.9.2021
12MINERALS NEEDED VS. RESERVES
0
100
200
300
400
500
600
700
800
900
Copper Nickel Cobalt Lithium Graphite
(mill
ion
tonn
es)
Battery Metals Needed to Phase Out Fossil Fuels(Scenario F vehicles and power storage stations)
Mass in 2 772.6 million tonnes of Li-Ion Batteries
Global Reserves (2018)
(Source: USGS Mineral Statistics)
Currently for every 1000
deposits discovered, only
1-2 become mines

20.9.2021
13
CURRENT THINKING UNDERESTIMATES THE SCALES
1 000 TWh
5 313.6 TWh
0
1000
2000
3000
4000
5000
6000
Electric power demand if 30% ofglobal vehicle fleet is EV by 2030(World Economic Forum 2019)
Electric power demand if 30% of the2018 global fleet was EV as
calculated in Scenario F
Ele
ctrc
ity
De
ma
nd
(T
Wh
)30% of the global vehicle fleet becomes EV by 2030
Comparison: current
projections of required
electric power demand to charge EV
batteries vs. outcomes of Scenario F
(World Map Image by Clker-Free-Vector-Images
from Pixabay)
20.9.2021
14
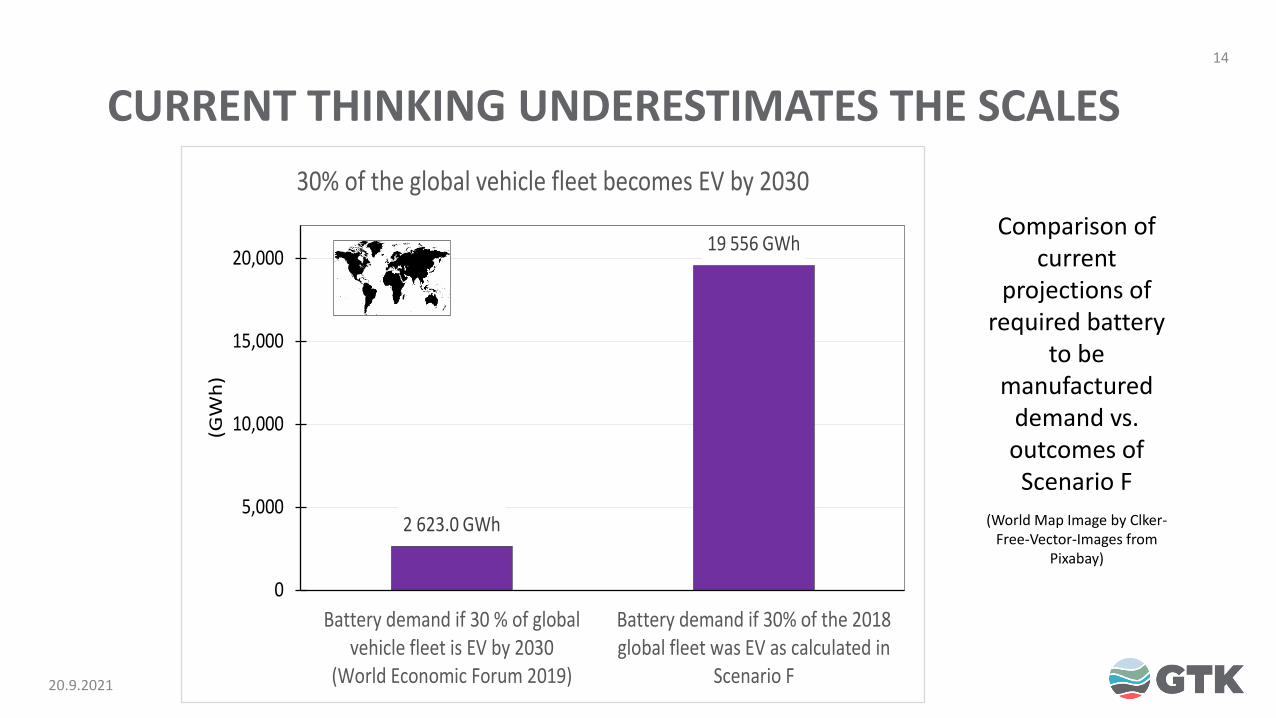
CURRENT THINKING UNDERESTIMATES THE SCALES
2 623.0 GWh
19 556 GWh
0
5,000
10,000
15,000
20,000
Battery demand if 30 % of globalvehicle fleet is EV by 2030
(World Economic Forum 2019)
Battery demand if 30% of the 2018global fleet was EV as calculated in
Scenario F
(GW
h)
30% of the global vehicle fleet becomes EV by 2030
Comparison of current
projections of required battery
to be manufactured
demand vs. outcomes of Scenario F
(World Map Image by Clker-Free-Vector-Images from
Pixabay)
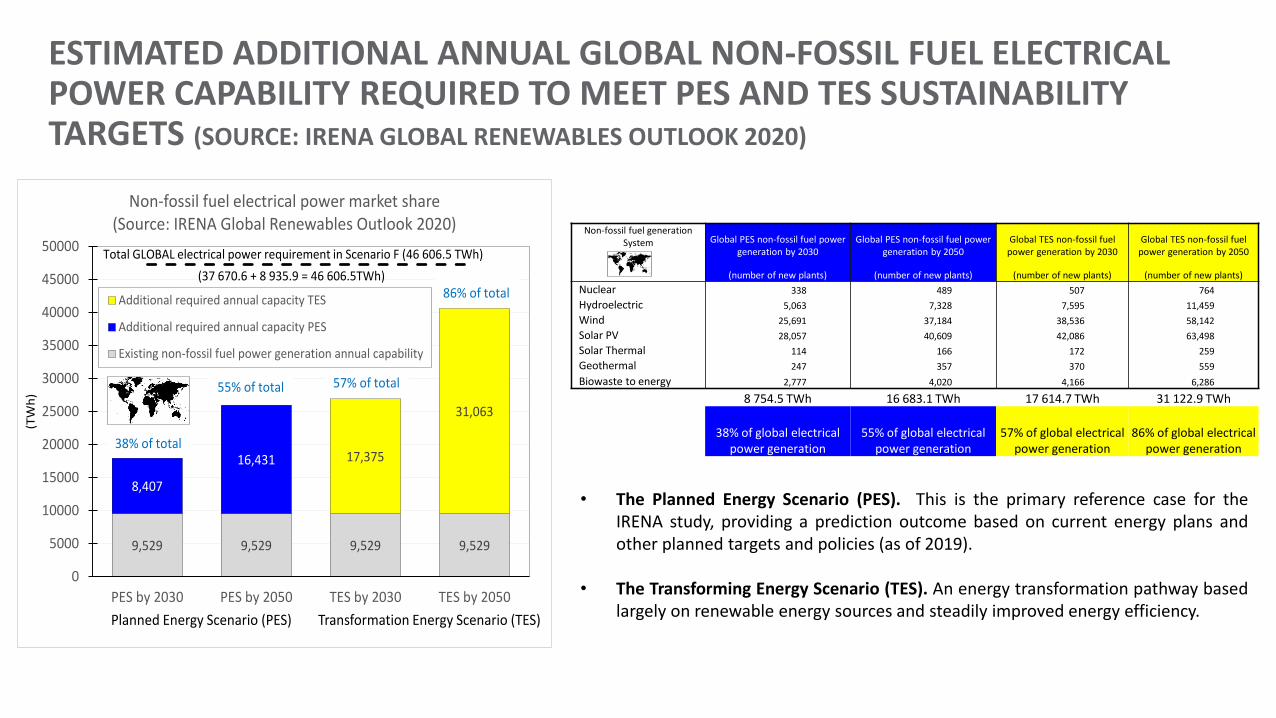
9,529 9,529 9,529 9,529
8,407
16,431 17,375
31,063
0
5000
10000
15000
20000
25000
30000
35000
40000
45000
50000
PES by 2030 PES by 2050 TES by 2030 TES by 2050
(TW
h)
Non-fossil fuel electrical power market share (Source: IRENA Global Renewables Outlook 2020)
Additional required annual capacity TES
Additional required annual capacity PES
Existing non-fossil fuel power generation annual capability
Planned Energy Scenario (PES) Transformation Energy Scenario (TES)
38% of total
86% of total
57% of total55% of total
Total GLOBAL electrical power requirement in Scenario F (46 606.5 TWh)
(37 670.6 + 8 935.9 = 46 606.5TWh)
Non-fossil fuel generation System Global PES non-fossil fuel power
generation by 2030Global PES non-fossil fuel power
generation by 2050Global TES non-fossil fuel
power generation by 2030Global TES non-fossil fuel
power generation by 2050
(number of new plants) (number of new plants) (number of new plants) (number of new plants)
Nuclear 338 489 507 764
Hydroelectric 5,063 7,328 7,595 11,459
Wind 25,691 37,184 38,536 58,142
Solar PV 28,057 40,609 42,086 63,498
Solar Thermal 114 166 172 259
Geothermal 247 357 370 559
Biowaste to energy 2,777 4,020 4,166 6,286
8 754.5 TWh 16 683.1 TWh 17 614.7 TWh 31 122.9 TWh
38% of global electrical power generation
55% of global electrical power generation
57% of global electrical power generation
86% of global electrical power generation
ESTIMATED ADDITIONAL ANNUAL GLOBAL NON-FOSSIL FUEL ELECTRICAL POWER CAPABILITY REQUIRED TO MEET PES AND TES SUSTAINABILITY TARGETS (SOURCE: IRENA GLOBAL RENEWABLES OUTLOOK 2020)
• The Planned Energy Scenario (PES). This is the primary reference case for theIRENA study, providing a prediction outcome based on current energy plans andother planned targets and policies (as of 2019).
• The Transforming Energy Scenario (TES). An energy transformation pathway basedlargely on renewable energy sources and steadily improved energy efficiency.

20.9.2021
16
CONCLUSIONS
• Additional non-fossil fuel electrical power annual capacity is 37 670.6 TWh
• The same non-fossil fuel energy mix of 2018 translates into 221 594 new power plants• To put this in context, the total power plant fleet in 2018 (all types including fossil fuel plants) was only 46 423 stations
• Electrical power generated from solar and wind sources are highly intermittent, both across 24-hour cycle and in seasonal context. • A power storage buffer is required if these power generation systems are to be used on a large scale.
• A conservative estimate is a 4-week power capacity buffer for solar and wind• From Scenario F, the power storage buffer capacity for the global electrical power system would be 573.4 TWh
• The number of 100 MW stations would be 5.7 million, and the mass of lithium ion batteries would be 2.5 billion tonnes
• The total mass of lithium ion batteries required to phase out fossil fuels is 2.78 billion tonnes
20.9.2021
17CONCLUSIONS
• Current thinking has seriously underestimated the scale of the task ahead
• Battery chemistries other than lithium-ion should/will be developed, each with different mineral resources required
• There is a projected mineral shortage to supply raw materials for battery manufacture
• 2018 production rates are not even close to being appropriate
• Current mineral reserves are also not large enough to deliver the needed volumes
• Metals of all kinds are about to become much more valuable• Evolution of the industrial ecosystem and its market is likely
• There is a coming Renaissance for the exploration for and mining of minerals

Simon P. MichauxAssociate Professor GeometallurgyUnit Minerals Processing and Materials Research - Circular Economy SolutionsOre Characterization, Process Engineering & Mineral Intelligence
Geological Survey of Finland/Geologian tutkimuskeskusPO Box 96, (Vuorimiehentie 2)F1-02151 Espoo, FINLAND
[email protected]: +358 (0)50 348 6443
KIITOS &
THANK YOU