Embed Size (px)
Citation preview
1
Assessment of the Situation of Environment Statistics
in the 13 Member States of the Economic and Social
Commission Of Western Asia (ESCWA)
Prepared by
Khamis Raddad
United Nations Statistics Division, 2002
2
AcknowledgmentsThe consultant would like to thank the partners who made this mission possible.
The continued support of UNSD employees made the work easy and valuable and theconsultant would especially like to thank Mr. Stefan Schweinfest, Ms Eszter Horvath,Ms. Maila Puolamaa, Ms Tanja Srebotnjak, Ms. Reena Shah, Ms. Angela Me, andMs. Isabela Heng.
The ESCWA office also provide support to this project, the consultant would liketo acknowledge Mr. Ahmed Hussein, Ms. Zeina Mezher and Mr. Mohamed EL-Badrawy.
Finally the consultant would like to thank the Mr. Yassin Yassin at the office ofUNDP in Saudi Arabia, and the respondents in the countries visited for theircooperation, especially the staff of the Central Statistical Organization in Yemen aswell as other countries visited.
3
PART ONE
Consultancy purpose and summary
Introduction
Justification of the project
Main objectives of the project
Methods used in the assessment
The consultancy, the ways and means used for assessment
4
Introduction
Few countries in the ESCWA region seriously started to tackle environmentstatistics and to consider it one of their primary activities. Other countries have onlyrecently begun to initiate activities in this field or consider it a secondary priority. Afew countries have so far not engaged in environment statistics in the ESCWA Region.
On the other hand, the environment is becoming one of the most importantsubjects. This growing interest is attributed to the serious threats facing theenvironment in all of its components and their negative and destructive impacts onhumans and their surroundings as a result of negligence and irresponsible behavior.The importance of environment statistics is considered a benchmark for sustainabledevelopment and can be used to specify the priorities, needs, resources, and the abilityof each country to establish sustainable development programs, which includenumerous fields of statistics and indicators. These programs are global issues and aresuggested by international and regional agencies such as the United Nations and theEuropean Community.
Agenda 21 emphasizes the needs for environment statistics and sustainabledevelopment indicators. In addition, the system of national accounts includesenvironment statistics as one of the main issues to be taken into consideration whencalculating the GDP.
Environment statistics is integrated into the infrastructure of sustainabledevelopment in order to fill the data gaps and to reduce redundancies in environmentaldata collection. Furthermore, an efficient environmental information system needs tobe accurate, comprehensive and up to-date.
Justification of the Assessment
Sustainable development requires accurate, comprehensive and up-to date datato specify and monitor progress towards target goals. The regional and internationalagencies therefore recommended developing environment statistics as part of theproject “Strengthening Statistical Capacity in the ESCWA Region”. This project willaim at building a statistical network in the region. The network facilitates a regionalapproach to official statistics as well as strengthens the coordination of the compilationand dissemination of official statistics. Furthermore, the project will address the needof the region to improve statistical capacity demands of recent internationalconferences for statistical information. As part of the environment statistics component a training workshop will beorganized in 2003 and, subject to the needs and availability of resources, fellowshiparrangements will be conducted.
Main objectives of the Consultancy
1. To prepare an assessment of the situation in environment statistics inthe 13 ESCWA countries: of primary interest are the status of datacollection and compilation in different fields of environment statistics,the institutions involved, the frequencies of data production, role of thenational statistical office, and the co-ordination of the work on thenational and regional level.
2. To investigate what are the priority areas for the countries in thedevelopment of environment statistics.
5
3. To investigate the capacities of regional institutions working on andwith environmental data to participate in the planned fellowshiptraining for national environment statistics in 2003/4.
The consultancy, the ways and means used for the assessment
1. The consultant visited 6 of the 13 ESCWA countries: Lebanon, the Syrian ArabRepublic, Egypt, Yemen, The Sultanate of Oman, and Saudi Arabia, and metthe persons in charge of environment statistics programmes in those countries.Interviews were conducted to assess the status, capacities, needs and prioritieswith respect to the development of environment statistics. A set of questionshad been developed in cooperation with UNSD for this purpose (Annex 1contains the names, titles and contact details of the persons interviewed andAnnex 2 contains the questionnaires used for the interviews).
2. The consultant also studied the available documents such as books and articles,and studied the data available on the Internet (Annex 3 contains a list ofpublications and internet addresses).
3. The consultant collected for all 13 countries relevant information fromsecondary sources, for example, the Blue Plan project and CEDARE. He alsomet the responsible persons in four regional agencies to discuss the ability ofeach agency to contribute to the project.
4. The consultant used telephone and Internet communication to collect additionalinformation.
The consultant found that the best way to accomplish the mission is to visit eachcountry individually and to discuss with the responsible persons at the relevantinstitutions the current situation and how it can be improved. In fact, most of theenvironmental information and data are dispersed and the national statistical offices(NSO) are not always aware of this information. This situation was observed in someof the countries visited.
Another objective of the mission was to raise the level of importance ofenvironment statistics at the NSO and environmental agency and to encourage thedirectors to initiate and sustaining existing environment statistics programs.
UNSD and ESCWA are invited to use the experiences made in the Blue Planactivities in the five the ESCWA countries, which participate in the project.
6
PART TWO
1. Over all assessment and conclusions
2. Introduction
3. Institutional Background and Legislation
4. Sources of environmental data and statistics
5. Institutions dealing with environmental information
6. Human resources
7. Financial resources
8. Area of data production
9. Data dissemination
10. Activities in environment statistics
11. Methodologies
12. Publications and databases
13. Data gaps
14. Priorities
15. Main difficulties
16. Recommendations
7
Introduction
There are considerable variations in the situation of environment statisticsbetween the ESCWA countries, which could be classified into four major classes asfollows. It is noted that due to the fact that the consultant could not visit all countries,the classification below is subject to adjustment if any new information becomesavailable:1. Countries that have not yet started environment statistics programmes: Oman,
Saudi Arabia, Iraq, and Lebanon.2. Countries that only recently started such programmes: Yemen. These countries
need technical support to initiate the work correctly and to provide training andother technical assistance.
3. Countries that started partial programmes: The Syrian Arab Republic, Egypt,United Arab Emirates, Bahrain, Qatar, and Kuwait. In some of these countries astrengthened environmental statistical law is needed, while others need torecruit technical employees. In general the work in these countries is still at thebeginning.
4. Countries with a relatively long experience in environment statistics: Jordanand Palestine. These countries are relatively advanced compared to othercountries in the region yet many issues remain to be solved.
Institutional Background and Legislation
It is noted that the legislative situation with regard to environment statistics differsfrom one country to another: While Jordan and Palestine base their activities on ageneral statistical law, which includes environment statistics, the statistical law inBahrain and the United Arab Emirates covers environment statistics implicitly. Egyptand Lebanon intend to release an environment statistics law.
In general, however, it is noticed that the legislation does not necessarily pose aconstraint to carrying out environment statistics activities. Often the countries caninitiate environment statistics and subsequently improve the law where necessary.
Sources of environmental data and statistics
Environmental data sources depend heavily on the availability of data from theprimary data collectors. For example, air quality data require a functioning monitoringsystem, which does not exist in Yemen, and in the Syrian Arab Republic some data areproduced for local use only. The most common sources of environmental data are:
- Governmental agencies: this source is mentioned as themain source of data in all ESCWA countries. Thegovernment agencies include the Statistical Office,Ministry of Water, Ministry of Environment, andMinistry of Agriculture.
- Special surveys on environment statistics, e.g. onhazardous waste statistics in Jordan and industrial wastestatistics in Palestine.
8
- Secondary data from other surveys conducted by theNSO in areas such as agriculture statistics, economicstatistics. In some cases (e.g. Jordan) additionalquestions for environment statistics were added to theregular questionnaires.
To use data sources in an efficient way requires, first of all, a well-builtinfrastructure including monitoring stations, secondly, the protection of sensitiveinformation, thirdly, the training of employees for the production of timely and high-quality information by statistical office, and finally, a sufficient level of quality of thedata and the avoidance of duplication of data. On other hand, due to the lack of sufficient employees and their often limitedexperience in environment statistics, it is noticed that the statistical offices often useonly a minimal part of already available data.
Institutions dealing with environmental information
It is noticed that numerous governmental agencies and NGO’s work in theenvironmental field but their concern is mainly environmental protection. This meansthat often no documentation system exists and therefore the availability of consistentinformation for use by the statistical office is limited. In some cases duplication exists sometimes leading to incomparable data. It is thusessential to create a body or agency to guide all environmental institutions with respectto the documentation and exchange of information and environmental data.
Human resources
It is noticed that in most ESCWA countries (e.g. Egypt, Lebanon and Yemen)only one employee is working on environment statistics, which sometimes hasadditional duties. On the other hand, the Syrian Arab Republic and Jordan have allocated severalstaff to environment statistics but their work situation is not stable, i.e. they are oftentransferred to other missions limiting capacity building and resulting in a generalreduction of the quantity and quality of work accomplished. The Director of the BluePlan project, which provides training to employees, supported this finding. Closer cooperation and collaboration is recommended in environment statisticsbecause the technicians and statisticians need to work together, otherwise any trainingor other assistance will not be effective, a point supported by Mr. Khordagui.
Financial resources
Most ESCWA countries, notably the Syrian Arab Republic, Egypt, Yemen, andLebanon, have not allocated a separate budget for environment statistics and thestatistical offices sometimes depend mainly on foreign support to continue or developtheir projects (e.g. Palestine), which are then often dependent on the priorities of thedonor country and not national priorities. Therefore, an individual budget is needed, at least at the initiation stage.
Area of data production
9
The consultant noticed that most ESCWA countries concentrate on a few relevantfields such as meteorological, population, and agricultural statistics, which are alreadycompiled under different categories. In some countries, areas of work include wasteand water statistics, e.g. in Yemen, which collects data on earthquakes and Kuwait,which concentrates on waste statistics and water quality. This situation reflects thelevel of priority given to environment statistics but the data produced reflect a stillpreliminary stage of development.
Data dissemination
Except for Jordan and Palestine no other countries have so far produced specificreports in environment statistics. Some countries included a few tables in the annualstatistical report or other reports such as health statistics reports. The data disseminated through modern technologies and the Internet are alsolimited and differ across countries in terms of the methods used for the design of thetables and their contents. This situation also reflects the varying priorities and areas ofconcern in the countries and the need for harmonizing data dissemination methodsusing a minimum set of tables to produce regional aggregates.
Activities in environment statistics
The activities in the collection of environmental data and information throughspecial surveys are limited and the items covered vary between countries. Somecountries collect data on waste, others on water and electricity. In addition, thesampling units often differ between countries from individuals to economicenterprises (e.g. Jordan) and even government institutions (e.g. Iraq). In general, the number of surveys conducted is limited and covers only a smallfraction of environment statistics and sometimes only a specific part of the country.Overall, these surveys should be reviewed in order to achieve more homogeneity inthe region and they should be consistent with national priorities. It is recommended toprepare a pilot survey covering one or more countries in the region, which can be usedas a model for other countries. Statistical modeling techniques are applied in very few countries.
Methodologies
In most cases (e.g. the Syrian Arab Republic, Lebanon, and Egypt) the nationalstatistical offices collect data from government institutions. Some of the available datain the statistical offices are used to calculate some indicators and aggregate availabledata for presentation in some tables but no proper statistical methodology has beenused such as sampling design, the specification of the survey population, methods ofdata collection, methods of calculation and modeling to produce indicators. In addition, the concepts and methods applied by the countries vary. Internationaldefinitions should be used wherever applicable: documents prepared by the UnitedNations and the Blue Plan project are sufficient for this purpose and could beimproved over time. The use of classifications is sometimes a challenge because often severalclassifications exist, e.g. for land use. On the other hand, some categories do not yethave an internationally accepted classification such as waste statistics. It is noticed
10
that the countries in the region use several international classifications as well asnational classifications, the latter of which creates difficulties in comparing dataacross countries. This means that more work is required in these fields byinternational agencies to harmonize the available classifications and to producemanuals for their application. The national statistical offices are also invited to makebetter use of existing international classifications.
Publications and databases
As mentioned above annual statistical reports are the main publications containingstatistics relating to the environment. The annual environmental report produced inJordan is the only comprehensive report for environment statistics in the region. InPalestine a special report is produced for each individual area in environmentstatistics. Annex 2 lists the publications containing environment statistics. Databases are available in some countries, for example, Lebanon and Jordan.These databases include environmental information and indicators and are mainlycreated by the environmental protection agencies and not the statistical offices. It istherefore emphasized that the statistical offices develop databases utilizing theirexperience in handling large amounts of data. The availability and user-friendliness of a database is another very important issuebut in reality no country has reached a satisfactory stage in this regard.
Data gaps
The consultant specified existing data gaps through interviews, recommendationsfrom regional agencies as well as by studying existing documents and publications. It is noticed that the gaps include basic environment statistics such as water andair quality but the situation differs among countries: in Jordan and Palestine, forexample, large amounts of data relating to water quality and resources are available.On the other hand, other countries have only very few tables relating to this field. Ingeneral there are pressing data gaps in all ESCWA countries, in particular in thefollowing areas:
1. Water quantity statistics including precipitation, water supply, water demandand water distribution.
2. Water quality including drinking water quality, river water quality, lake andmarine water quality, sewage and treated water quality.
3. Air quality and air emissions.4. Waste statistics, quantities generated by source, methods of disposal and
composition.5. Biodiversity and ecosystems health.6. Environmental accounting. The persons interviewed in the countries visited mentioned the gaps above. Theconsultant notes that in some cases the information could be available in someagencies but their source is still unknown, the information is not available in sufficientamounts or is of limited accuracy.
Priorities
11
The priorities specified by the countries differ depending on their respectiveneeds, past experience and activities as well as institutional and financial resources. Ingeneral, the Syrian Arab Republic mentioned water statistics, solid and liquid wastes,and natural resources, Lebanon and Egypt listed water and air statistics as their firstpriority, Jordan specified water statistics, land cover, waste statistics, environmentalaccounting, and environmental indicators, and Yemen and Saudi Arabia prioritizehousehold environment statistics, costal zone and marine water quality as well aswater statistics.
Hence, the consultant concludes that a first step in most ESCWA countries (e.g.Lebanon, Egypt, Oman, and the Syrian Arab Republic) would be to initiate theestablishment of an environment statistics division/unit, which administers this typeof statistics. This should then be followed by the formation of an environmentstatistics committee consisting of the main agencies dealing with environmentalinformation. This will facilitate the specification of the data needed as well aspertaining data gaps.
The collection of documents, information and available data from differentinstitutions relating to environment statistics in each country is recommended beforeother steps are taken.
The main themes proposed for the ESCWA region are:
1. Water statistics since the main challenge the countries in the region arefacing is an increasing shortage of water. The production of fresh wateris very expensive, especially the desalination of seawater. Hence, waterstatistics are of highest priority in all ESCWA countries. The suggesteditems to be covered are:
i. Water supply by source and cost of water production.ii. Water use by sectors: the water quantity reaching the
final user, and the quantity of water distributed from thesource. Water quality including the quality of drinkingwater, sewage water, treated water and marine water.
iii. Import and export of water including water inflow andoutflow.
iv. Water indicators, for example, per capita waterconsumption.
v. Sewage water plants.2. Solid and liquid wastes, including hazardous waste, e.g. medical and
industrial hazardous wastes.i. Quantity of wastes generated by source.ii. Composition of wastes.iii. Methods of disposal.iv. Cost of disposing of wastes and related waste
indicators.3. Air statistics
i. Air quality in hot spots.ii. Air emissions: quantities of pollutants emitted by
source.iii. Quantity of ozone depleting substances used by type.
4. Land use and land coveri. Distribution of land by current use.ii. Classification of land by agro-climatic zone.
12
iii. Changes in land use.iv. Land degradation and Soil erosion.v. Desertification.
5. Environmental and sustainable development indicators.6. Natural resource statistics.
Main difficulties
1. The absence of an environment statistics division in most of the nationalstatistical offices in the ESCWA countries such as Lebanon, Egypt, Oman andSaudi Arabia, which hinders effectiveness and improvement of the work in thisfield.
2. As a result of the dispersion of environmental information, the aggregation ofdata and information is time consuming, expensive and often results inincomparable data.
3. Due to the lack of a sufficient number of monitoring stations and otherinfrastructure problems, the availability of environmental data from theirimmediate sources is very limited.
4. One of the main constraints is the high cost of conducting environmentalsurveys and the lack of sufficient funds in the ESCWA countries for thesesurveys.
5. Limited expertise, in particular in environment statistics and insufficient humanresources in national statistical offices for environment statistics.
6. The cooperation between the concerned agencies in the field needs to beimproved.
7. Environment statistics can be highly sensitive, which renders the collection ofreliable data more difficult.
8. The field of environment statistics as well as manuals and methodological toolsused in environment statistics are still evolving and under development and/ornot adopted in the ESCWA region. Most of these documents are not availablein Arabic.
9. The low salaries in the government sector compared with the private sector areone of the main obstacles for recruiting and retaining skilled staff.
10. Limited financial resources.
Recommendations
1. Legislation and initiation of environmental statistical division
Considering the absence of environment statistics units in most national statisticaloffices in the ESCWA region and the lack of legislative guidelines to undertake thisactivity, the national statistical offices are encouraged to emphasize the need foressential adjustments in the statistical law allowing the sustained establishment of andenvironmental programme with experienced statisticians, environmental specialistsand enumerators as well as the long-term allocation of financial resources. Alegislative underpinning is considered particularly beneficial in countries withdecentralized statistical activities such as Oman.
The time-consuming training of statisticians in environment statistics withoutlegislative support and a designated environment statistics unit may result in a wasteof resources without generating the desirable long-term capacity in this area.
13
2. Cooperation
The restriction of environment statistics to statisticians at the national statisticaloffices is not desirable and often unfeasible, unless the statisticians also have abackground in environmental sciences. It is hence important to establish a system ofcoordination and cooperation between the NSO and other environmentaladministrative agencies such as the Ministry of Environment or the EnvironmentalProtection Agency.
It is very important to simplify the exchange of environmental information andharmonize the available data by using the same standards, concepts, and definitions.3. Manuals and Other Tools
To establish a harmonized system and to acquire comparable data from theESCWA countries, it is suggested to provide a manual that covers environmentstatistics, the basic concepts and definitions, methods for data collection, tabulation ofenvironmental data, and the calculation of environmental indicators as well as theapplication of classifications.
It is suggested to use available material prepared by United Nations agencies, theBlue Plan project, and regional agencies. The adoption of this material to fit into theregional characteristics of ESCWA is important, as is the translation of the availabledocuments into Arabic.
It is furthermore important evaluate the application of modern technology such asGIS in the region. In this regard it is suggested to develop environmental softwaresimilar to the Echems Software for environment database, which was developed by theBlue Plan project in Microsoft Access. It is a database software, available in Englishand French, which can be used by multiple-users and can handle over 3000 variables.
The program could also be used to aggregate data from the countries in the region.But this program cannot be used for data entry or data editing no operations manualhas been prepared yet.
Of further benefit would be a pilot compendium of environment statistics, whichcould serve as an example for the ESCWA countries to produce national compendia.The consultant suggests using the national data compendium model prepared under theBlue Plan project and adjusting it to the particular characteristics of the ESCWAregion.
The consultant considers it desirable to provide the ESCWA countries withstandard emissions coefficients etc.
4. Training
In order to strengthen the capacities in environment statistics, the training courseshould include:
1. An introduction to the principles and methods of environment statisticsincluding concepts and definitions, treatment of environmental data etc.
2. The integration and aggregation of environmental data from diverse origins.3. The methods for tabulating environment statistics.4. The qualitative analysis of thematic statistics: water, land use, soil degradation,
and waste.
14
5. The use of statistical tools in environment statistics, for example, specificsources of data and how to obtain data from these sources, basic principles forsurvey design, calculation of population parameters, estimation of coefficients,statistical modeling. (For more details, please see Annex 4 for a lectureprepared by the consultant for a training course in Malta in March 2002).
5. Technical assistance
Due to the varying levels of development of environment statistics in the ESCWAcountries, the technical assistance required needs to be tailored to the specific needs ofthe countries. Long-term technical assistance could hence be organized as follows:
Conduct consultancy missions to those countries, which have already gainedexperience in environment statistics such as Jordan and Palestine. For these countriesit is important to evaluate the current situation and to determine the strengths andweaknesses to further improve the situation. Data dissemination can often beimproved in these countries including the methods for data tabulation. It is alsorecommended to provide training on environmental indicators and the classification ofindicators into pressure, state and response indicators.
Provide training in the institutionalization of environment statistics. Thissuggestion includes expert missions to assist in the initiation stage of the work and toprovide on the job training. This form of assistance is suggested for those countries,which recently began working in the area such as Yemen and Egypt as well as thosethat are planning to start such as Lebanon. The training is suggested to cover theprinciples of environment statistics. In addition the consultant suggests training on theaggregation of data from different sources for the production of pilot compendia.
Those countries, which already engaged in certain areas but are not yet producingany publications or other tangible outputs such as the Syrian Arab Republic require aconsultancy mission that provides them with training on the production of statisticaltables from raw data as well as methods for estimation and filling data gaps. Toimprove their situation, the countries would benefit from intermediate training and theexchange of practical work experiences.
The consultant discussed this point with the responsible persons and theyindicated that the language is one of the main constraints in the Syrian Arab Republic,Yemen, and Egypt. It is thus recommended to use Arabic instead of English as thelanguage of instruction.
6. Equipment and other requirements
It is difficult to specify the equipment needed since many ESCWA countries juststarted or want to start environment statistics. In this view, the consultant suggests tospecify the needs for each country after the work has started and depending on aspecific request from the country.
It is, however, desirable to provide some material for the following purposes:
1. Software for environment statistics. It is suggested to make use ofavailable software, which could be adopted to serve the entire region.
2. International classifications for the main themes used in environmentstatistics, e.g. wastes including hazardous wastes and land useclassification.
15
3. International and suggested national standards for the mainenvironmental themes, e.g. on drinking water quality, treated sewagewater quality, toxic residuals in food, and air quality. It is suggested touse available information prepared by international agencies such asWHO and FAO in addition to the national standards prepared by someESCWA countries.
7. Pilot survey
The consultant proposes to conduct an environmental survey in one of theESCWA countries to provide on-the-job training to the participants attending theworkshop. This survey would also provide useful information on the level ofexperience of the participants and their respective needs as well as a picture of thepresent situation in the country, which in turn is expected to help improving themanuals and other documents.
8. General
The comprehensive computerization and documentation of information isrecommended.
It is suggested to invite the national statistics offices to specify their priorities,which are consistent with their national objectives in order to achieve the goals ofenvironment statistics.
9. For UNSD
The consultant proposes conducting a workshop for environment statisticscovering the following main topics:
1. Justification and importance of environment statistics.2. The importance of environment statistics for decision makers and
policy-making.3. Identification of the main topics relating to environment statistics such
as water, air quality waste, etc.4. Detailed exploration of major topics such as water and air statistics.5. Specification of data sources and their proper use.6. Inclusion of some practical exercises to calculate environmental
indicators, e.g. water demand, water supply, and air emissions.7. Presentation of case studies from the initial survey design to releasing
final results and conclusions in topics such as water, land use, andwaste statistics.
It is suggested to use Arabic wherever possible and to invite two participants fromeach country, one from the NSO and the other from the Ministry of Environment, tothe workshop.
It is recommended to provide fellowship tours for countries that have specialistsworking in environment statistics to visit the statistical offices in more advancedcountries and gain practical experiences. One such candidate country would beJordan, which already hosted trainees from other countries in 2001 at the DOS andwhose Director General is a supporter of this type of arrangement. The target personsfor these study tours are the technicians in environment statistics from those countries
16
that want to start an environment statistics programme. The study tours could alsoinclude regional institutions, for example, CEDARE, which also has experience inhosting trainees. The consultant discussed this point with the Executive Director ofCEDARE who accepted the idea to host participants from the ESCWA countries.
The study tours should be tailored to the needs and levels of expertise of theparticipants in order to ensure that technicians are prepared in a way that maximizesthe benefit of the training programme. Other criteria to be determined are the lengthof the training as well as the provision of the supporting documents and trainingmaterial.
10. For ESCWA
In general the consultant considers it desirable to establish one specialist inenvironment statistics at the ESCWA office to provide essential expertise andassistance to the ESCWA countries including technical advise, to maintain contactswith specialists at the NSOs, and to act as a general reference person for environmentstatistics in this region.
11. Candidate Institutions for Fellowship Tours and Other Activities
1. CEDARE: they can provide training in GIS.2. ACSAD: the have good experience in desertification studies and how
to use GIS for this purpose and it could be used for land use and landcover.
3. Department of Statistics (Jordan): they can host trainees on waterstatistics and study tours and can also provide a case study.
4. Lebanese Environment and Development Observatory (LEDO): theycan provide training on database development for sustainableindicators.
5. The Blue Plan project can provide manuals, training documents;classifications and software prepared by Blue Plan for this project,which will could helpful.
6. There are experts in each field of environment statistics and they couldbe hired to provide training.
17
PART THREE
A - THE SITUATION IN THE ESCWA COUNTRIES
1. The Syrian Arab Republic
2. Lebanon
3. Egypt
4. Jordan
5. Palestine
6. Yemen
7. Saudi Arabia
8. Iraq
9. Kuwait
10. Bahrain
11. The Sultanate of Oman
12. Qatar
13. United Arab Emirates
B REGIONAL INSTITUTIONS
1. The Center for Environment and Development for the Arab Region and
Europe (CEDARE)
2. The Arab Center for the Studies of Arid Zones and Dry Lands (ACSAD)
3. United Nations, Economic and Social Commission for Western Asia
(ESCWA)
4. Plan Bleu
18
A THE SITUATION IN THE ESCWA COUNTRIES
1. Syria
The consultant visited Syria from 5 to 9 April 2002. The visits in Syria includedthe Central Bureau of Statistics (CBS), the Ministry of Environment, and The Centerfor Environment and Development for the Arab Region and Europe (CEDARE). Theconsultant also met the Director of the Blue Plan project during his mission in Syria.
The consultant met the responsible persons for environmental activities as well asadministrative persons in these agencies (see Annex 1 for a complete list). Theconsultant also attended a meeting in the Ministry of Environment with members fromboth the CBS and the Ministry of Environment in addition to the Director of the BluePlan project to discuss how to improve environment statistics in Syria.
Institutional Background and Legislation
In Syria the Central Bureau of Statistics (CBS) has the responsibility to publishand produce statistical data on the environment. Other institutions cannot produce anyofficial statistics without the agreement of CBS. The 1986 statistical law, the articlesrelating to this law as well as the decree no. 87 reflect this situation. The law includesall type of statistics and the responsibilities of the CBS mentioned in the law includethe compilation, evaluation, and dissemination of statistics, which are used indetermining the status, changes and trends in economics and social development.
This statistical law is a general law for all types of statistics and is thus alsoapplicable to environment statistics. No special law exists for environment statistics.On the other hand, the Ministry of Environment has established a GeneralCommission for Environmental Affairs (GCEA), which consists of seven unitsincluding a statistical division.
The Ministry of Environment and its executive body, the GCEA, have theresponsibility for environmental issues and management in the country. Theadministrative supervision of the Prime Minister was instituted in 1985. Thepresidential decree N° 11 dated 1991 created the GCEA. The GCEA is wellrecognised in the overall development structure. The activities relating to environmentstatistics in this agency are:
§ Creation of a database and a GIS facility as well as the creation of thestatistical service: the main objectives of this new service are thecollection of data with the help of CBS and other partners.
The law distributes the duties in environment statistic between both the CBS andMinistry of Environment. It is noticed that the law is working well for activities suchas agricultural statistics.
It is also noticed that the CBS is the Center that receives the information fromother ministries and government agencies, processes and disseminates the data, andpublishes the National Statistical Yearbook for each activity. But the CBS has only alimited ability to conduct surveys or to collect data from the field. Usually, thedifferent governorates send their administrative reports to the CBS directly. Thesedata include public activities.

19
To serve the CBS in the above activities, the other governmental agencies havethe responsibility to maintain the registers and prepare progress reports on their ownactivities. For example, the different directorates of the Ministry of Agriculture collectdata relating to agricultural statistics and the treated information is sent to the center,which then provides the CBS with this data. The CBS reviews and finalizes the resultsand publishes them. The same process supposedly takes place in the Ministry ofEnvironment.
In 1998 the CBS created the Industry and Environment directorate and theMinistry of Environment created a statistical division in 1999. The latter works underthe supervision of the General Commission for Environmental Affairs and has abranch in each governorate to collect environmental data and send it to the statisticaldivision in the Ministry of Environment, which provides the CBS with this data. Thework is carried out in cooperation between the head of environment statistics in theCBS and the head of the statistical division in the Ministry of Environment. The finalresults are supposed to be published by CBS.
As a result of this situation, the quality of the data depends on both the CBS andthe original data source, which depends to some extent on the enumerator whocollected the data. It is thus important to improve the quality of data through trainingof the enumerators and those employees dealing with statistical data in the differentagencies.
Sources of environmental data and statistics
The consultant studied the data available and disseminated in the statisticalabstract. He noticed a large amount of raw data scattered across different agencies.The data available in the CBS is computerized but the data available in the Ministryof Environment exists only in hard copy and for local use by the Ministry.
The sources of environmental data listed in the table below are the main sourcesof data at the current time but many other sources and data may be available butunknown to the consultant, for example, data from sewage companies, the GeneralOrganization for Remote Sensing for land use data, he Marine Institute in Lattakia fordata on the marine environment, and the Universities for several topics.
Institution Data TimeCentral Bureau ofStatistics.
Population and demographic indicators Yearly
Ministry of Environment Air quality (the consultant understands thatmonitoring stations exist for air quality butthe data is available only for local use),biodiversity, land use and marineenvironment.
Yearly
Ministry of Irrigation. Length of rivers, flow rates of the mostimportant rivers and springs, lakes area,fresh water resources, fresh water uses, andcharacteristics of main dams.
Yearly
Ministry of Agriculture. Land use and forest (the FAO classificationwas applied, the results published by CBS).
Yearly
Ministry of Housing. Waste water treatment and quality Yearly
General Directorate of Atmospheric phenomena, temperature, Yearly
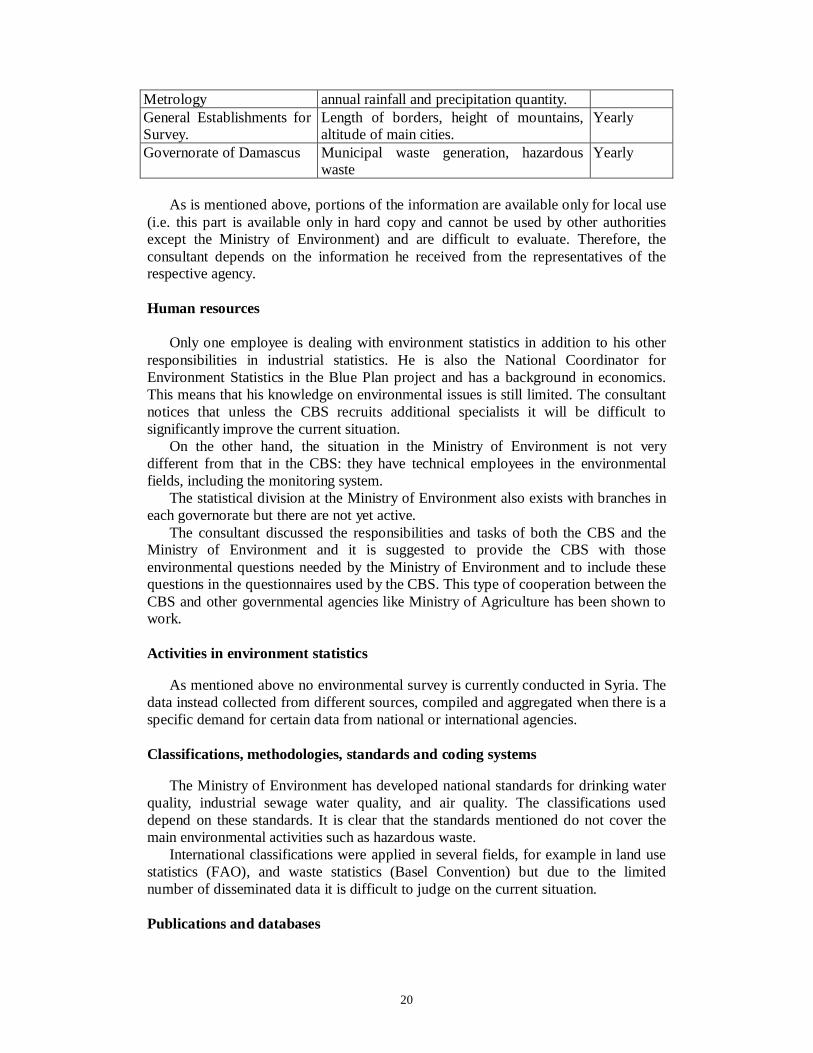
20
Metrology annual rainfall and precipitation quantity.General Establishments forSurvey.
Length of borders, height of mountains,altitude of main cities.
Yearly
Governorate of Damascus Municipal waste generation, hazardouswaste
Yearly
As is mentioned above, portions of the information are available only for local use(i.e. this part is available only in hard copy and cannot be used by other authoritiesexcept the Ministry of Environment) and are difficult to evaluate. Therefore, theconsultant depends on the information he received from the representatives of therespective agency.
Human resources
Only one employee is dealing with environment statistics in addition to his otherresponsibilities in industrial statistics. He is also the National Coordinator forEnvironment Statistics in the Blue Plan project and has a background in economics.This means that his knowledge on environmental issues is still limited. The consultantnotices that unless the CBS recruits additional specialists it will be difficult tosignificantly improve the current situation.
On the other hand, the situation in the Ministry of Environment is not verydifferent from that in the CBS: they have technical employees in the environmentalfields, including the monitoring system.
The statistical division at the Ministry of Environment also exists with branches ineach governorate but there are not yet active.
The consultant discussed the responsibilities and tasks of both the CBS and theMinistry of Environment and it is suggested to provide the CBS with thoseenvironmental questions needed by the Ministry of Environment and to include thesequestions in the questionnaires used by the CBS. This type of cooperation between theCBS and other governmental agencies like Ministry of Agriculture has been shown towork.
Activities in environment statistics
As mentioned above no environmental survey is currently conducted in Syria. Thedata instead collected from different sources, compiled and aggregated when there is aspecific demand for certain data from national or international agencies.
Classifications, methodologies, standards and coding systems
The Ministry of Environment has developed national standards for drinking waterquality, industrial sewage water quality, and air quality. The classifications useddepend on these standards. It is clear that the standards mentioned do not cover themain environmental activities such as hazardous waste.
International classifications were applied in several fields, for example in land usestatistics (FAO), and waste statistics (Basel Convention) but due to the limitednumber of disseminated data it is difficult to judge on the current situation.
Publications and databases
21
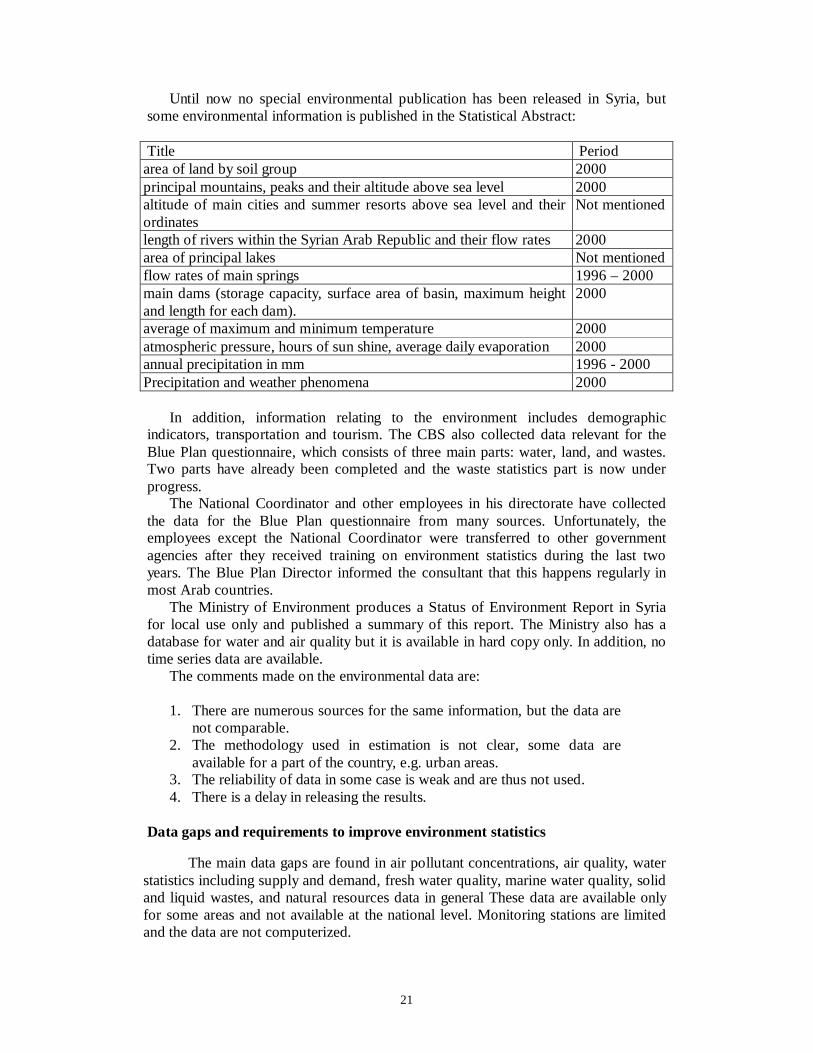
Until now no special environmental publication has been released in Syria, butsome environmental information is published in the Statistical Abstract:
Title Periodarea of land by soil group 2000principal mountains, peaks and their altitude above sea level 2000altitude of main cities and summer resorts above sea level and theirordinates
Not mentioned
length of rivers within the Syrian Arab Republic and their flow rates 2000area of principal lakes Not mentionedflow rates of main springs 1996 – 2000main dams (storage capacity, surface area of basin, maximum heightand length for each dam).
2000
average of maximum and minimum temperature 2000atmospheric pressure, hours of sun shine, average daily evaporation 2000annual precipitation in mm 1996 - 2000Precipitation and weather phenomena 2000
In addition, information relating to the environment includes demographicindicators, transportation and tourism. The CBS also collected data relevant for theBlue Plan questionnaire, which consists of three main parts: water, land, and wastes.Two parts have already been completed and the waste statistics part is now underprogress.
The National Coordinator and other employees in his directorate have collectedthe data for the Blue Plan questionnaire from many sources. Unfortunately, theemployees except the National Coordinator were transferred to other governmentagencies after they received training on environment statistics during the last twoyears. The Blue Plan Director informed the consultant that this happens regularly inmost Arab countries.
The Ministry of Environment produces a Status of Environment Report in Syriafor local use only and published a summary of this report. The Ministry also has adatabase for water and air quality but it is available in hard copy only. In addition, notime series data are available.
The comments made on the environmental data are:
1. There are numerous sources for the same information, but the data arenot comparable.
2. The methodology used in estimation is not clear, some data areavailable for a part of the country, e.g. urban areas.
3. The reliability of data in some case is weak and are thus not used.4. There is a delay in releasing the results.
Data gaps and requirements to improve environment statistics
The main data gaps are found in air pollutant concentrations, air quality, waterstatistics including supply and demand, fresh water quality, marine water quality, solidand liquid wastes, and natural resources data in general These data are available onlyfor some areas and not available at the national level. Monitoring stations are limitedand the data are not computerized.

22
The requirements to improve environment statistics in Syria
Referring to the discussion above and according to a study undertaken by Mr.Khordagui the needs are specified as follows:
1. Recruiting employees with background in different fields ofenvironmental sciences by the CBS to work as permanent staff inenvironment statistics.
2. Building a system of cooperation between the CBS and the Ministry ofEnvironment.
3. Establishing a statistical division in the Ministry of Environment.4. Providing training to CBS and Ministry of Environment employees. It
is suggested to start from the principles of environment statistics and tocover the major area of water statistics. The training should include acase study from the region and provide a manual. The language usedfor this training should be Arabic.
5. It is suggested to conduct a regional project in the countries including,for example, Syria, Jordan, Iraq, and Saudi Arabia,
6. Other material such as software and information technology isrequired.
Main difficulties
The main difficulties faced in environment statistics are:
1. As a result of scattered information relating to many areas in this fieldand dispersion of information across different institutions, theaggregation of data and information is time consuming, expensive andmay result in incomparable data.
2. Sometimes the data are not available from its source, e.g. data from theMinistry of Environment.
3. Due to the shortage of funds to conduct environmental survey, the workrequires financial and technical assistance.
Recommendations
To improve environment statistics, it is recommended to provide training to bothCBS and Ministry of Environment employees. The training should cover differentfields of environment statistics, concentrate on capacity building, foster stability inworking conditions, and increase the cooperation between the region countries in thisfield.
23
2. Lebanon
The consultant visited Lebanon from 2 to 5 April 2002. The visits in Lebanoncovered the ESCWA Office, the Central Administration of Statistics (CAS), and theMinistry of Environment. The consultant first met Mr. Ahmed Hussein, Mr. MohamedG. Al-Badrawy, and Mr. Hosny K. Khordagui. The purpose of the mission wascommunicated and the best method for implementing the work was discussed. Theconsultant discussed the situation of environment statistics in the ESCWA countries,which was followed by a meeting with the Director General of CAS and theresponsible person for environment statistics. He then visited the Ministry ofEnvironment and met the director of the Lebanese Environment and DevelopmentObservatory (LEDO) and other employees in LEDO.
Institutional Background and Legislation
The Central Administration of Statistics (CAS) currently does not include in itsstructure a unit/section responsible for environment statistics. However, thepreparation of a decree especially for environment statistics is under way as Ms.Maral Totalian said and this year the statistical law was adjusted to includeenvironment statistics in its activities. This legal process is time consuming, as itrequires the agreement of the Council of Ministers and other legislative agencies.
Thus, until now the CAS does not have an environment statistics division but oneemployee is taking care of logistic activities relating to this field.
The general administrative organization of the Lebanese State, according to lawIII of 16/6/1959 and decree 2894 of 16/12/1959, requires each ministry to collect thestatistics relevant for its activities and communicate them to the CentralAdministration of Statistics (various agencies deal with statistical data including theprivate sector, i.e. other agencies collect data. However, in the case of theenvironmental field the consultant understands that only LEDO is involved as will beexplained later).
On the other hand, the Ministry of Environment hosts the Lebanese Environmentand Development Observatory (LEDO) since 1999. The main objectives of thisproject are to provide and improve environmental data. The project was funded by theEuropean Union. LEDO started the coordination with national partners from thepublic, private, academic sectors, research institutions and non- governmentalorganizations.
Although LEDO has the responsibility to do the work in the field of environmentand development indicators, this is not included in the decree 5591 of 30/8/1994,which is related to the tasks of the Ministry of Environment, regulating that theMinistry can only produce the statistics for its own purposes.
In general the legislative situation in Lebanon needs to be improved to includeenvironment statistics activities and to clearly specify the relations between thevarious government agencies.
Sources of environment statistics
The sources of data used to derive indicators are mentioned in detail in thepublication Environment and Development Indicators for Lebanon. The indicatortopics covered are:

24
Institution IndicatorsCentral Administration ofstatistics.
Demography, standard of living, services
Ministry of Energy andWater.
Consumption/production patters, energy and water(access to water network and to safe drinkingwater, total water demand by sector, annual energyconsumption per inhabitant, agriculture waterdemand, annual energy consumption, share ofproduction of renewable energy resource etc.)
Ministry of Agriculture. Agricultural statistics such as use of pesticides, useof fertilizers, area irrigated with treated/untreatedsewage, forest area, arable land, area effected bydesertification, burned forest area per year etc.
Ministry of Interior andMunicipalities.
Industry, transport, wastes (generation of solidwastes, distribution, area and activity of quarries,number of passenger cars per 100 inhabitants,stocks of motor vehicles by age and fuel type etc).
Ministry of Environment. Destination of municipal waste, composition ofmunicipal waste, protected coastal area, publicexpenditure on environmental protection as % ofGDP, cost of management of municipal solidwaste, total expenditures on protected areas,expenditure on wastewater management by type.
In addition to the above main topics, details on environmental indicators such asunit, type (state, pressure or response), timeframe and concerned institutions are givenin the table below. However, the periodicity of each indicator is not mentioned
LEDO can calculate about two thirds of the suggested indicators and it isgenerally a document of good quality that could be used for training purposes since itmentions the methodology for calculating each indicator.
Indicator Concerned institutionsAirEmissions of green house gases (GHG)Sulfur oxides, nitrogen oxides, concentration oflow level ozone, and consumption of ozonedepleting substances, global solar UV index.
Ministry of Environment
25
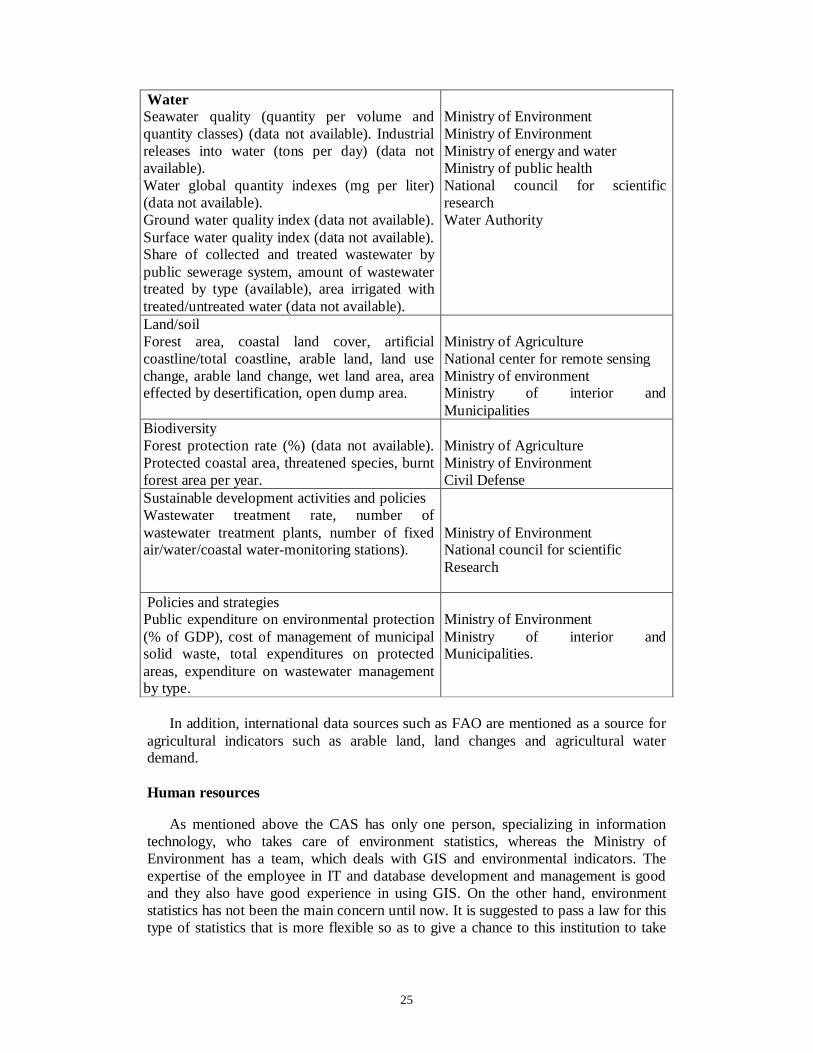
WaterSeawater quality (quantity per volume andquantity classes) (data not available). Industrialreleases into water (tons per day) (data notavailable).Water global quantity indexes (mg per liter)(data not available).Ground water quality index (data not available).Surface water quality index (data not available).Share of collected and treated wastewater bypublic sewerage system, amount of wastewatertreated by type (available), area irrigated withtreated/untreated water (data not available).
Ministry of EnvironmentMinistry of EnvironmentMinistry of energy and waterMinistry of public healthNational council for scientificresearchWater Authority
Land/soilForest area, coastal land cover, artificialcoastline/total coastline, arable land, land usechange, arable land change, wet land area, areaeffected by desertification, open dump area.
Ministry of AgricultureNational center for remote sensingMinistry of environmentMinistry of interior andMunicipalities
BiodiversityForest protection rate (%) (data not available).Protected coastal area, threatened species, burntforest area per year.
Ministry of AgricultureMinistry of EnvironmentCivil Defense
Sustainable development activities and policiesWastewater treatment rate, number ofwastewater treatment plants, number of fixedair/water/coastal water-monitoring stations).
Ministry of EnvironmentNational council for scientificResearch
Policies and strategiesPublic expenditure on environmental protection(% of GDP), cost of management of municipalsolid waste, total expenditures on protectedareas, expenditure on wastewater managementby type.
Ministry of EnvironmentMinistry of interior andMunicipalities.
In addition, international data sources such as FAO are mentioned as a source foragricultural indicators such as arable land, land changes and agricultural waterdemand.
Human resources
As mentioned above the CAS has only one person, specializing in informationtechnology, who takes care of environment statistics, whereas the Ministry ofEnvironment has a team, which deals with GIS and environmental indicators. Theexpertise of the employee in IT and database development and management is goodand they also have good experience in using GIS. On the other hand, environmentstatistics has not been the main concern until now. It is suggested to pass a law for thistype of statistics that is more flexible so as to give a chance to this institution to take
26
part in the work: As was mentioned by the Director General of CAS, the CAS wantsto engage in collaboration with the Ministry of Environment.
The consultant notices that it might be easier to initiate an environment statisticsprogramme in and through LEDO after providing a short training and some technicalsupport. LEDO also should continue working as a national institution after theEuropean Union has completed its work and even though foreign financing will cease,the government granted continued support. However, the director of the Blue Planproject has doubts on the continuity of the work once foreign support has stopped. Sothe consultant suggests encouraging the government to support this activity.
Activities in environment statistics
The activities in the CAS cover the minimal requirements for completing the BluePlan questionnaire. This questionnaire contains three main parts: water, land, andwaste. The consultant understands that the work is still in progress in Lebanon and theperson hired through the Blue Plan project is in the process of completing it. Thus, thelimited activity and involvement of CAS becomes apparent. CAS also provides somestatistical data, mainly demographic data, to the Ministry of Environment.
On the other hand, LEDO, which works under the umbrella of the Ministry ofEnvironment, collects and compiles data from different sources to deriveenvironmental indicators and is building a database for environmental data by usingGIS tools.
Classifications, methodologies, standards and coding systems
The CAS is not active in this field except for filling out the Blue Planquestionnaire. The questionnaire applies the classifications used in the EuropeanUnion.
LEDO applies international classifications such as those by FAO for agricultureand land indicators, European classifications (Blue Plan), and WHO Guidelines for airquality. Furthermore, the indicators are classified by type, using internationalclassifications (the indicators are divided into three types: pressure, state and responseindicators and 90 indicators were chosen from 130 indicators identified by theMediterranean Commission on Sustainable Development (MCSD)). Data collection isconducted using secondary data from different sources and the methodology ofcalculating each indicator is described.
It is noticed that these statistical activities are still at the early stage and henceneed time and further development in order to improve.
Publications and databases
The CAS so far has not produced any publication relating to environment statisticsbut LEDO produced one publication called Environment and Development Indicatorsfor Lebanon, (the publication date is not mentioned but it appears to be 2000).
This publication contains a specification of indicators derived in the Blue Planproject and the source of the data for each indicator. A total of 90 indicators aredefined into different types of indicators and LEDO succeeded in calculating most(60) of the suggested 90 indicators. The report is available under the addresswww.moe.gov.lb/ledo/index.htm. The page is updated whenever new data becomeavailable but due to lack of data not all indicators are currently calculated. In addition,
27
the publication is also available on CD-Rom. This work should be continued and usedto build a database based on which an environmental compendium could be publishedusing the available data.
Data gaps and priorities
The main data gaps were found in the following areas:
1. Water quality including river and drinking water.2. Air quality and air emissions.3. Industrial sewage water quality especially the sewage water disposed of
into rivers.
The suggested priorities are:
1. Development of an environmental monitoring system at the local level(decentralization of the work).
2. The data should cover the whole country (comprehensiveness).3. The main issues covered in the project should cover water statistics and
air statistics.
The requirements to improve environment statistics in Lebanon
1. Provide training on environment statistics starting with concepts andmethods of data collection. The training suggested includes casestudies, the design of questionnaires, and the provision of a manual,which includes a description of methods for data collection.
2. Training on data cleaning and data processing3. It needs financial and technical support to collect environmental data.4. The existing good relations between CAS and the Ministry of
Environment could be further improved through teamwork. In fact, inenvironment statistics a close cooperation between specialists inenvironmental sciences and statisticians is always required.
It is clear that when the work is at this early stage, it is difficult to specify theneeds in terms of equipment etc. and therefore no recommendations are made as tothis regard.
Main difficulties
1. Shortage of specialists in the CAS and the Ministry of Environment inenvironment statistics.
2. Environment statistics is a new subject in Lebanon and therefore theexisting experience in this field is almost negligible.
3. There is a shortage of data due to the lack of monitoring and other datacollection activities in the environmental fields.
4. There exists a shortage of equipment and other facilities forobservatory purposes.
5. Currently, there is no information system available in Lebanon forenvironment statistics.

28
Recommendations
Due to the time that is needed to adjust the statistical law governing the CAS andthe ability of LEDO to carry out some statistical work in this field, it is recommendedto extend the work facilitating the cooperation between the two institutions and byproviding training for both institutions while concentrating on capacity building.
29
3. Egypt
The consultant visited Egypt from 19 to 22 April, covering the Central Agency forPublic Mobilization and Statistics (CAPMAS). The consultant visited CAPMASagain in March together with the Egyptian Environmental Affairs Agency (EEAA)and the Center for Environment and Development for Arab Region and Europe(CEDARE). The consultant discussed the situation of environment statistics andfuture programmes to improve these activities.
Institutional Background and Legislation
The Central Agency for Public Mobilization and Statistics (CAPMAS) is theagency responsible to conduct surveys, processing the data, and publishing numeroustypes of statistics based on sample surveys or censuses.
This agency supposedly has full authority as declared in the presidential decreeno. 1946. In reference to the statistical law, all other bodies should obtain permissionfrom CAPMAS prior to any statistical work.
The agency has a sufficient number of employees to carry out its duties in anefficient way but until now environment statistics does not exist. The initiation of anew directorate for environment statistics is scheduled to take place during 2002, afterthe official agreement for this process has been given. This new activity then needs torecruit employees. The exact plan how to accomplish this project is still not entirelyclear and no time schedule has been set for the completion of the different stages.Since the allocation of funds needs the agreement from the Ministry of Finance, afurther delay in time is anticipated.
On the other hand, the Egyptian Environmental Affairs Agency (EEAA) is themain body responsible for environmental management in Egypt. It was established in1982 as an environmental affairs committee and became a full authority by decisionof the cabinet of ministers in 1985. As a result of the issuance of the EnvironmentalLaw no. 4/1994 in 1995, the EEAA was reorganized and strengthened and its dutiesand obligations were set forth. The EEAA is mainly a coordinating body, i.e. itsexecutive powers are few and limited. Most of the functions have required it tointeract with other organizations and ministries in order to perform the work. Achairman of a board of directors who is at the level of first deputy minister managesthe EEAA.
Law 4/94 defined the duties of the EEAA in article 5. Following are theinformation-related duties of the EEAA as outlined by the article:
1. Participation in the preparation and execution of the nationalenvironmental monitoring program and making use of its data.
2. In cooperation with information centers in other bodies, gatheringnational and international data pertaining to the state of theenvironment and the changes that happen to it. This data should beevaluated and used in environmental management and planning, andpublished.
3. Preparing periodic reports on the main environmental indicators.
The law of environment requires the EEAA to submit an annual state of theEnvironment Report to the President of the Republic and Cabinet of Ministers with acopy to be deposited in the Egyptian People’s Assembly (Parliament). This report
30
would require a large number of environment statistics. This law requires allinstitutions that are concerned and subject to it to keep environmental recordscontaining statistics on their discharges of various pollutants. Governmental andprivate institutions, which produce polluted materials, should maintain logbookscontaining statistics on their discharges of various pollutants. As these records arequite detailed, they are expected to generate a huge amount of statistics.
In order to undertake the environmental information functions as mandated by thelaw, the reorganized EEAA has established an Environmental Information Sector,which is presided over by a deputy minister. The sector is mandated to undertake allthe environmental information functions for the EEAA; In order to enable the sectorto work effectively, a major project is underway to create an environmentalinformation system, but until now there is no environment statistics output fromEEAA nor CAPMAS.
The consultant understands that Dr. Ala’a Alserhan who works in theEnvironmental Center at Ian Shames University is at the mean time preparing anenvironmental status report for Egypt.
Sources of environmental data and statistics
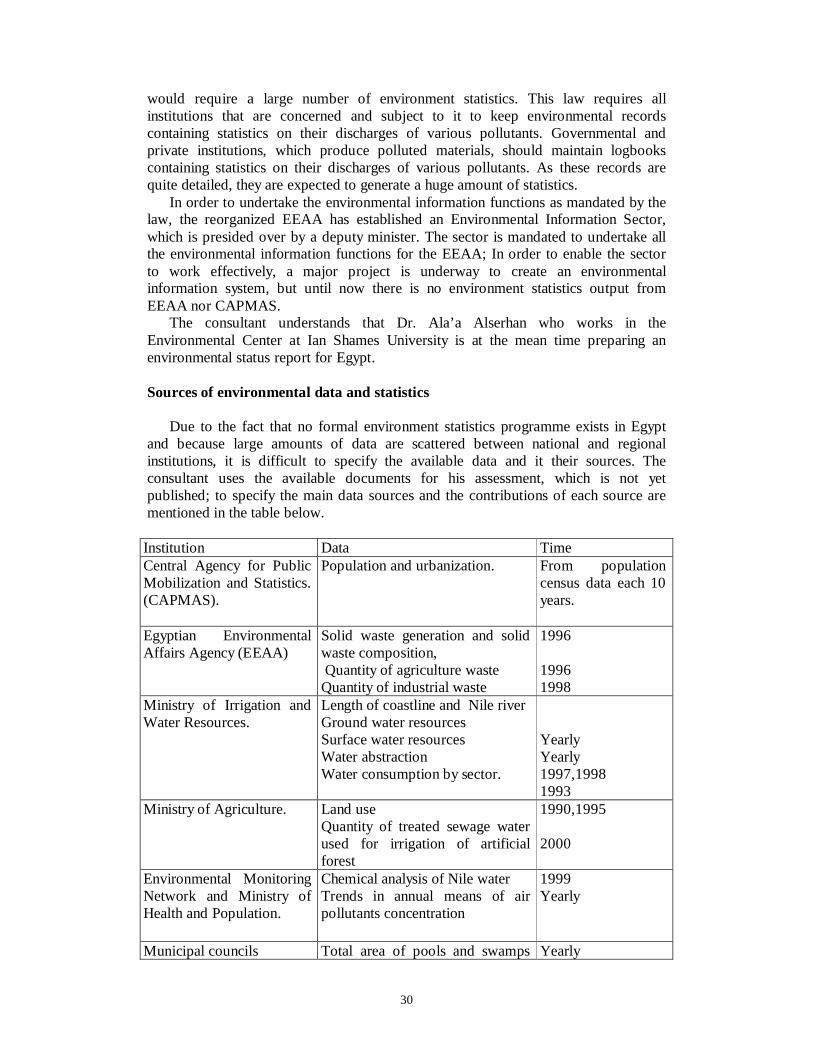
Due to the fact that no formal environment statistics programme exists in Egyptand because large amounts of data are scattered between national and regionalinstitutions, it is difficult to specify the available data and it their sources. Theconsultant uses the available documents for his assessment, which is not yetpublished; to specify the main data sources and the contributions of each source arementioned in the table below.
Institution Data TimeCentral Agency for PublicMobilization and Statistics.(CAPMAS).
Population and urbanization. From populationcensus data each 10years.
Egyptian EnvironmentalAffairs Agency (EEAA)
Solid waste generation and solidwaste composition, Quantity of agriculture wasteQuantity of industrial waste
1996
19961998
Ministry of Irrigation andWater Resources.
Length of coastline and Nile riverGround water resourcesSurface water resourcesWater abstractionWater consumption by sector.
YearlyYearly1997,19981993
Ministry of Agriculture. Land useQuantity of treated sewage waterused for irrigation of artificialforest
1990,1995
2000
Environmental MonitoringNetwork and Ministry ofHealth and Population.
Chemical analysis of Nile waterTrends in annual means of airpollutants concentration
1999Yearly
Municipal councils Total area of pools and swamps Yearly

31
and filled up area of pools.FAO Precipitation 1985General Dep. Of Traffic Trends in stocks of motor vehicles 1997, 1998National Research center Industrial wastes, which are
causing pollution of the Nile river2001 study
Human resources
CAPMAS employs approximately 6000 people but unfortunately only oneemployee is allocated to carry out work in environment statistics in addition to hisother duties as a technical affairs officer. The employee is a demographer and he isthe national coordinator for the Blue Plan project.
The EEAA has no statistician but a technician in environmental science includinginformation systems. In order to improve environment statistics in Egypt it is first ofall necessary to initiate the establishment of an environment statistics division atCAPMAS and to specify its relationships with other institutions such as EEAA.
After that the recruitment of a sufficient number of specialists in different fieldssuch as environmental science, soil science, agriculture, biology and chemical inaddition to the statistician is required, which should be followed by a trainingprogramme for the employees (from both CAPMAS and EEAA) in statisticalmethodology and environment statistics.
It is also recommended to establish a statistical division in institutions such as theMinistry of Environment in order to deal with the statistical data arising in theinstitution and to provide CAPMAS with useful data.
Publications and databases
The consultant notices that neither a special publication nor database exist inCAPMAS. The only output available is a draft of a few tables prepared by thenational coordinator of the Blue Plan project. These tables are available in addition tothe information used to complete the Blue Plan questionnaire.
But there is scattered information available in many governmental and otheragencies, which could be utilized for the compilation of some environment statistics.It should also be mentioned that there are some tables relating to environmentstatistics such as meteorological data, geographical data, and demographic data.
The EEAA (Egyptian Environmental Affairs Agency) has established aninformation system project called EEIS. Both Canadian International DevelopmentAgency (CIDA) and the Danish International Development Agency (DANIDA)supported the execution of this project.
The EEIS project covers two main topics: i) water resources and water pollution,ii) air pollution. The data will be acquired from different institutions using acomputer network to establish between the project center and the agency underconcern.
At the time being, the GIS unit has been established and a pilot study forenvironmental geographic information system in Greater Cairo produced. The centeralso has relations with other institutions collecting environmental information but theavailable statistics at the center are still limited.

32
Activities in environment statistics
No environmental survey has yet been carried out by CAPMAS but it is plannedto conduct a sample survey on waste statistics in 2002, which will cover only onegovernorate.
Also, CAPMAS is considering adding one question relating to the environment tothe questionnaire used for other surveys by CAMPAS, for example, householdsurveys and economic enterprises surveys. This is a first step but not sufficient tomeet the demand for environment statistics.
It is therefore suggested to use other sources of data, for example, secondary datafrom governmental and other agencies and to conduct surveys on core environmentaltopics such as water use and wastewater treatment.
The EEAA with the help of CIDA conducted a pilot study for an environmentalgeographic information system in the Greater Cairo area with the aim to provide theurban planners and decision makers with reliable information.
In addition to the study completed by the National Research Center in 2001 onindustrial waste that causes pollution to the river Nile other studies have been carriedout by national and international agencies but are not documented in a central placeaccessible to the data users. It is therefore important to find a way to document allenvironmental studies and to build database for this purpose.
Classifications, methodologies, standards and coding systems
Due to the limited activities in the area of environment statistics at CAMPAS, it isnoticed that neither statistical methodology nor a coding system are currently used,except in part to fill out the questionnaire of the Blue Plan project, which is atemporary project and mainly done with the help of a Blue Plan expert who takes partin the data collection from different institutions and data tabulation work.
EEAA has access to international standards and the agency has the authority toenact national standards for the environment and acceptable levels of pollution.
The methodology used for data collection is gathering data available fromdifferent institutions and from some research studies and monitoring stations but nofield survey is conducted for this purpose.
Publications and databases
As mentioned above many institutions deal with environmental data but theprogrammes of these institutions are not connected with each other. Rather, eachinstitution tries to establish its own environmental database and works independently.CAPMAS produces a large number of annual reports in different fields of statistics,for example, in economic statistics, agriculture, demographic statistics, and miningand petroleum. However, no publication exists for environment statistics. The existingpublications could be used as secondary sources of data to produce some parts ofenvironment statistics.
Data requirements to improve environment statistics
In general it is rather difficult to decide whether there are data gaps when nostatistical data published by CAPMAS and only scattered data are available in
33
different areas, which need to be aggregated and tabulated. The huge volume of datathat is supposedly available depends on the EEAA Law but is not clearly determined.The consultant notices that there is a lack of data in the main topics water, air, land,and waste. The responsible person in CAPMAS specified these areas as the main fieldof priority in order to fill the existing gaps:
1. Water statistics including quantity and quality.2. Air quality.3. Toxic residuals in food and food safety4. Public health and epidemiological data on disease rates attributable to
pollution
Although these are the main areas with data gaps, some data such as land use dataexist in Egypt. The most important step is thus to establish a division, which collectsthe available information from different sources and can then specify the data gaps inmore detail.
Requirements to improve environment statistics in Egypt
1. It is suggested to create a committee for environment statistics.2. Provide training to employees in both CAMPAS and EEAA as both
institutions work in this field. The training should start with theconcepts and definitions as well as provide a practical introduction toenvironment statistics in addition to the statistical methodology neededto produce environment statistics. The short mission of foreign expertwould also contribute to achieve this objective.
3. Prepare manuals that contain the most widely used classifications andmethodologies for environment statistics.
4. Provide technical and financial support to improve and sustain theactivities.
Main difficulties
1. Environmental data are not available from its source, e.g. EEAA.2. The shortage of qualified persons and of equipment for environment
statistics.3. The cooperation between the agencies working in environment
statistics and on environmental issues needs to improve.4. The lack of sufficient information due to the limited number of
monitoring stations.5. The lack of an institutionalized programme on environmental issues
and the prioritization of the work in this area.
Recommendations
In addition to the suggestions above it is recommended to initiate a statisticaldivision in CAPMAS and to deposit sufficient human and financial resources todevelop and sustain an environment statistics programme in the division. It is alsorecommended to recruit qualified personnel and to provide staff with sufficienttraining to handle their tasks.
Also it is recommended to invite the EEAA to take a share of the responsibilities.

34
The creation of committee for environment statistics is also recommended.
35
4. Jordan
Institutional Background and Legislation
Based on the statistical law number 24 in 1950 and it is amendments, thedepartment of statistics (DOS) in Jordan is the responsible agency that conducts andpublishes all types of statistics, and any other institution cannot engage in this type ofwork without the prior agreement from DOS.
The government requested in 1994 that the DOS initiate a new unit forenvironment statistics. Since then this unit has become a section and it has the samethe rights as any other statistical section. The section conducts its activities under theumbrella of statistical law.
There are other agencies that deal with environmental information andenvironment statistics such as the National Information Center. This Center hosts thefocal point for the environmental information system, which includes environmentstatistics, and also hosts the environmental information committee, which consist ofthe main agencies producing environmental data.
All of the relevant Ministries, e.g. the Ministry of Water and Irrigation and theMinistry of Health, have an environment division, which also maintains a database fortheir main activities. This way the DOS is continuously provided with large quantitiesof data, which could be used to produce environment statistics.
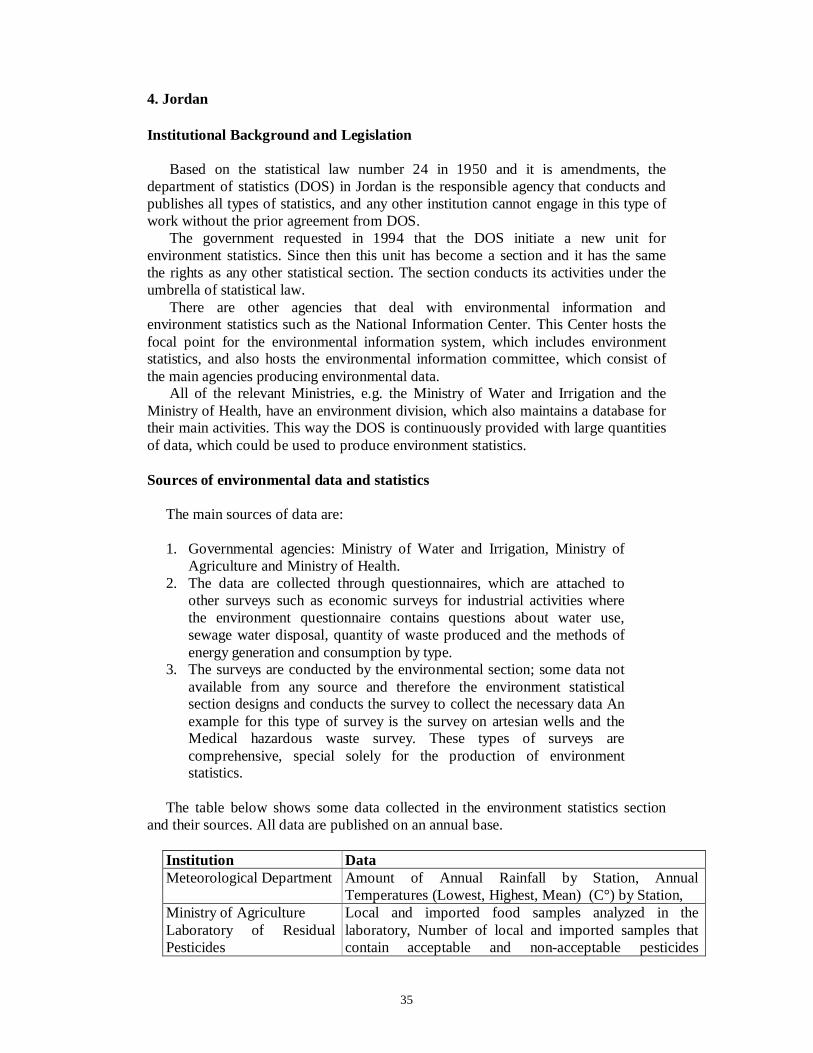
Sources of environmental data and statistics
The main sources of data are:
1. Governmental agencies: Ministry of Water and Irrigation, Ministry ofAgriculture and Ministry of Health.
2. The data are collected through questionnaires, which are attached toother surveys such as economic surveys for industrial activities wherethe environment questionnaire contains questions about water use,sewage water disposal, quantity of waste produced and the methods ofenergy generation and consumption by type.
3. The surveys are conducted by the environmental section; some data notavailable from any source and therefore the environment statisticalsection designs and conducts the survey to collect the necessary data Anexample for this type of survey is the survey on artesian wells and theMedical hazardous waste survey. These types of surveys arecomprehensive, special solely for the production of environmentstatistics.
The table below shows some data collected in the environment statistics sectionand their sources. All data are published on an annual base.
Institution DataMeteorological Department Amount of Annual Rainfall by Station, Annual
Temperatures (Lowest, Highest, Mean) (C°) by Station,Ministry of AgricultureLaboratory of ResidualPesticides
Local and imported food samples analyzed in thelaboratory, Number of local and imported samples thatcontain acceptable and non-acceptable pesticides

36
residuals.Ministry of Health:Environmental Health.
The General Monthly Rate of TSP, Pb, Relative Humidityand Wind Speed in Downtown & Shmeisani Stations,Monthly Distribution of The General Average for TheTotal Suspended Particles TSP) and Lead Concentration(Pb) in Air of Down Town, Shmesani, Abu-NsairandMarka Stations, Detailed and Specialized Results ofMicrobial and Parasites Tests for Treated Water byTreatment plant, Status of Cleaning Plants by Design andOperating Capacities to Hydraulic and Organic Load inJordan, Results of Chemical Tests from Out Door ofSewage Water by Treatment Plant, Results of Chemical&Physical Analysis for Drinking Water in Jordan,
Ministry of Agriculture:Directorate of ForestationAnd Range
Distribution Of Forests Area By Type And Tenure (thiswork was done with the help of USAID using the FAOClassification and the scientific name for each plant).
Number of Forests Fires, Number of Damaged Trees andArea Damaged in Donum (.1 hectare), Area of Reforested,Replanted and Length of Planted Roads.
Water Authority Comparison of Surface Water Budget 1998/ 1999 Seasonwith Long-Term Average 1937-1999
Annual Report of NationalElectric Power Company
Distribution of Quantity & Percentage of ElectricalEnergy (GWh) by Consumption Sector 1993-1999
Report of Ministry ofEnergy and NaturalResources.
Production of Potash (Metric Ton) and Distribution(Domestic and Export).
Annual Report of theJordanian PhosphateMining Company
Geological Reservation of Raw Phosphate and Oil Shalein Jordan, Produced Dried Phosphate (Thousand Ton) byMine
Ministry of Agriculture Quantity of Imported, Locally Produced and Exports ofRecorded Pesticides by Kind (L - Kg), Quantity ofImported, Locally Produced and Exported Pesticides byGroup (L - Kg).
Department of Statistics Quantity of Solid & Liquid Wastes in Medical Servicesand Industrial Sector by Category and Method of Disposal(the WHO classification was applied).Quantity of water used and Sewage Water by EconomicActivity for Services Sector and Industrial Sector,Quantity of Solid Wastes Resulted From Services SectorDistributed by Method of Disposing of Solid Wastes andEconomic Activity.
The Jordan CementFactories.
Produced Cement and Klencer (Ton) by Factory
National Cancer Registry Number of cancer cases by site, geder, governorate.Ministry of health-diseasecontrol directorate
Number of Meningococcal Meningitis, Ttyphoid, Paratyphoid, measles, German Maeasles, Mumps,Brucellosispulmonart TB, Cut leshmaniasis, diarrhea, and

37
no. Of infection diseaseTraffic Department Number of vehiclesRoyal Society For TheConservation Of Nature.
Number of wild and marine organisms by kind
Human resources
The Environment statistics Section at DOS employs six staff members withtraining in different scientific fields such as water science, geology, chemistry,biology, and other agricultural fields.
At the beginning of the work, DOS hired only temporary employees and then theDOS recruited staff during 2001. That means that the new employees need trainingand time is required to substitute the temporary employees who have built up a lot ofexperience during last few years.
Other agencies and governmental bodies such as the Ministry of Municipality andEnvironment and the Ministry of Heath do not have statisticians but instead employtechnical experts in environmental science. Therefore, a close cooperation betweenDOS and the Ministries is essential.
Furthermore, training of the staff of the Ministries in the basic concepts andprinciples of environment statistics is recommended.
Activities in environment statistics
The DOS adopted the following methods for data collection:
1. Collects the available data from different governmental agencies, e.g.the Ministry of Water and Irrigation. These data are then classified bysubject, processed, and used to produce useful and comparable statistics.The DOS also collects some raw data and laboratory sheet data, whichare tabulated at DOS.
2. Data are also collected by adding a page to surveys already conductedby DOS, e.g. economic enterprise surveys. The page added to thissurvey includes questions on water consumption, sewage waterproduction and method of disposal, quantity of solid waste producedand method of disposal.
3. The environmental section conducts a survey on hazardous waste thatcovers the chemical manufacturers and health services activitiesgenerating hazardous waste. This survey is carried out annually since1996 and it covers all enterprises except the clinics and smallenterprises, which are covered through sampling.
Another survey that was conducted for two years is a survey on the use of waterfrom artesian wells to provide data on the quantity of water pumped and to calculatethe average consumption of water for each type of crop and for other uses of water.
These three sources of data were used to provide information on a low cost basisbut there are many problems such as a lack of continuity in data availability as well asthe format and units of measurement used in the data collection.
With respect to questionnaires attached to other surveys the problem of non-sampling error is eminent because administrative persons in each enterprise usuallyfill out the main questionnaire, whereas the environmental questions require a
38
technical expert. Thus, the DOS has decided to apply the environmental surveysindependently starting in 2002.
The third method creates some problems such as an increase in non-response dueto the repeated visits of enterprises every year.The DOS also hosts trainees in environment statistics from different countries as partof the Blue Plan project and the Blue Plan invites the trainers from DOS to take partin training courses in environment statistics.
Classifications, methodologies, standards and coding systems
The DOS uses international classifications such as ISIC for economic activities,CPC for commodities, and FAO for land use. The methodologies applied by DOSwere already mentioned above, that is the combination of data collected fromsecondary sources with those collected through field survey.
The Jordan Institution for Standards and Methodology (the it is web site iswww.jism.gov.jo) is the responsible agency to produce standards for all commoditiesin Jordan including water quality and food and other standards relevant for theenvironment. The standards are brought before the standard committee, which has aspecial committee for each field. The standards set forth for environment statistics areused. In some case where the Jordanian standard is not available, internationalstandards are applied.
For the coding system of chemical hazardous wastes the DOS adopted aclassification using ISIC and documents on hazardous waste available from the BaselConvention on the Transboundary Movement of Hazardous Wastes.
Data collection estimation compilation methods applied in data collection
The data are collected from governmental agencies, other institutions and fromannual reports and surveys. The data are collected in different formats and types suchas:
1. Laboratory data sheet, which are tabulated and from which the resultsare extracted, e.g. drinking water quality.
2. Annual reports such as forest reports. The data aggregated from theavailable information in these reports.
3. Monthly reports like pesticide residual.4. Some information is collected by questionnaire attached to the
economic enterprises survey.5. The data also collected through special questionnaires such as the
hazardous waste survey.
Some indicators are calculated from the available information in different reports.
Frequency of data production
Some data are collected on a monthly basis, for example, meteorological data anddrinking water quality whereas other data are collected yearly. In general all data arepublished yearly.
39
Publications and databases
The DOS produces an annual environment statistics report since 1995. The mostcurrent report was published in 2000 and contains about 15 main topics, among whichare natural condition, population indicators, economic indicators, pesticide residuals,agricultural indicators, air quality, biodiversity, water statistics, energy and minerals,and solid and liquid wastes including hazardous waste.
In addition the DOS conducted a survey called urban agriculture, e.g. small scalefarming, agricultural production in gardens etc., which covered the indoorenvironment and the demographic characteristics of households. It included someopinions of families on the environmental situation.
The data relating to environment statistics available on the Internet website of theDOS under www.dos.gov.jo. Most of the annual report tables can be found on thispage. The database of environment statistics is also available from the Internet site ofthe National Information Center under www.nic.gov.jo. This site has a focal point forenvironmental information and it has links to the main sources of environmentalinformation in Jordan.
Frequency, characterization of databases, compatibility
Despite the relative early start of the environmental protection activities in Jordan,environment statistics still has many data gaps and some fields are not covered yet.The main categories with a lack of data are:
1. Municipal waste, the available data only cover the capital Amman.2. Land cover, land use, and change of land use.3. Water outflow, water inflow and water quality in rivers and the sea.4. Desertification.5. Biodiversity it is available only for some local areas.6. Agriculture waste, and waste from other economic activities, which are
not yet covered.7. Air quality is monitored only at very few stations and air emissions
should also be calculated for the main pollutants.8. Environmental accounting including environmental expenditures. This
is the main gap of environment statistics but due to the limitedavailability of technical and financial recourses it is difficult to builtexpertise in this area in the short-term.
Hence the priorities specified by the decision makers are as follows and theydepend on the demands from Agenda 21 and sustainable development indicators:
1. To cover water statistics in more detail, e.g. water import and irrigationand the quality of treated water.
2. Land cover and a more detailed survey on land use and changes in landuse.
3. Improvement of the work on waste statistics, which includes municipalwaste, is required.
4. Initiation of a GIS database including the position of main pointsources such as chemical manufactories and sewage water treatmentplants.
40
5. It is very important to start environmental accounting to meet thedemand of national accounting in DOS, the SNA 1993 (System ofNational Account 1993) includes a part for environmental accounting.
6. It is also suggested to conduct some data analysis at least a descriptiveanalysis for the main environmental topics.
7. Improve the environmental indicators.
Main difficulties
1. Environment statistics is more sensitive than any other type of statisticsand it is thus difficult to collect reliable data from the field.
2. Environment statistics is more expensive than most other types ofstatistics.
3. Environment statistics is a complex field and covers all humanactivities. It is therefore difficult to meet the demand for data or tospecify the priorities.
4. The manuals and tools used for this type of statistics are stillincomplete and not adapted to the characteristics of the ESCWAregion.
5. This type of statistics needs experience and expertise in many fields,e.g. agriculture and statistics.
Recommendations
1. It is recommended to improve the environment statistics systemthrough the creation of a committee and to foster teamwork includingNGOs that are active in this field.
2. It is recommended to build a complete environmental statistical systemincluding manuals, classifications, and guidelines for standardization,methodology and case studies in ESCWA region.
3. The financial support for this type of statistics like other type ofstatistics is very important because it is new subject and many pointsneed to be clarified.
4. The cooperation of the countries in the region is required in order totransfer the experiences and knowledge from one country to another.
The activities in Jordan with respect to environment statistics are rather advancedbut still a lot of work remains to be completed. Many data gaps need to be filled andan improvement in data quality is also required. Also, in some areas the work has notyet begun and should be initiated.

41
5. Palestine
Institutional Background and Legislation
Based on the statistical law no 5 approved in 2000 the main function of thePalestinian Central Bureau of Statistics (PCBS) is to provide impartial statistics on allfields of statistics including environment statistics.
The PCBS has one directorate called the Area Statistics Directorate (ASD) whosemain duty is to produce, compile and disseminate reliable statistics related to land andactivities taking place on land which mainly relate to environment statistics. The ASDhas also established links with other directorates.
The main areas covered by the ASD are land use, natural resources,transportation, and tourism. To achieve the objectives of this directorate it wasdivided into 8 departments as follows:
1. Agriculture Statistics Department.2. Transportation & Communication Statistics Department3. Environment Department4. Natural Resources Department5. Tourism Statistics Department6. Housing and Housing Conditions Statistics Department7. Land Use Statistics Department8. Energy Statistics Department
It is noticed that most of the work of these departments is directly related toenvironment statistics and thus reflects the importance paid to environment statisticsat PCBS.
Sources of environmental data and statistics
The main sources of environmental data are:
1. The results of the surveys conducted for environment statisticspurposes such as Household Environmental Surveys. Anenvironmental questionnaire has been designed for this survey, and atwo-stage stratified cluster random sampling design was applied toconduct the survey. The survey covered Palestinians households in theWest Bank and in Gaza Strip.
2. The available data from other departments of PCBS.3. Data from governmental agencies such as:
i. Ministry of Planning and International Cooperation.ii. Palestinian Water Authority.iii. Palestinian Geographic Center.iv. Ministry of Health.
Publications and databases
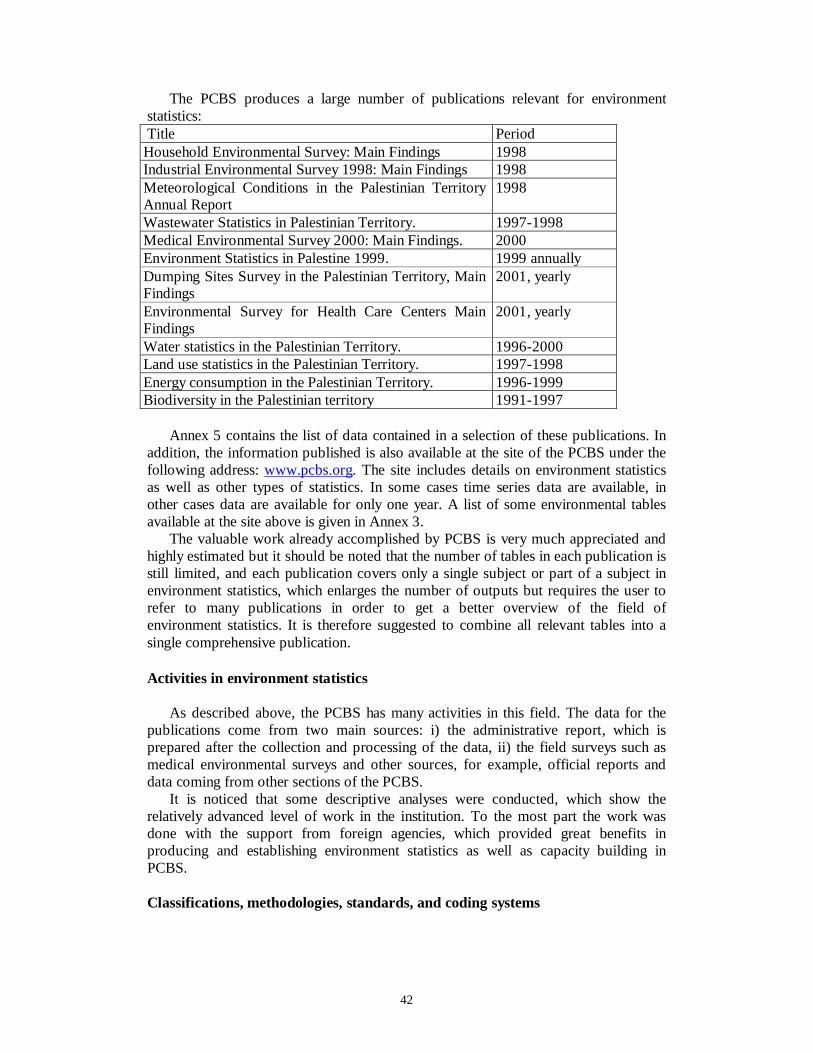
42
The PCBS produces a large number of publications relevant for environmentstatistics:Title Period
Household Environmental Survey: Main Findings 1998Industrial Environmental Survey 1998: Main Findings 1998Meteorological Conditions in the Palestinian TerritoryAnnual Report
1998
Wastewater Statistics in Palestinian Territory. 1997-1998Medical Environmental Survey 2000: Main Findings. 2000Environment Statistics in Palestine 1999. 1999 annuallyDumping Sites Survey in the Palestinian Territory, MainFindings
2001, yearly
Environmental Survey for Health Care Centers MainFindings
2001, yearly
Water statistics in the Palestinian Territory. 1996-2000Land use statistics in the Palestinian Territory. 1997-1998Energy consumption in the Palestinian Territory. 1996-1999Biodiversity in the Palestinian territory 1991-1997
Annex 5 contains the list of data contained in a selection of these publications. Inaddition, the information published is also available at the site of the PCBS under thefollowing address: www.pcbs.org. The site includes details on environment statisticsas well as other types of statistics. In some cases time series data are available, inother cases data are available for only one year. A list of some environmental tablesavailable at the site above is given in Annex 3.
The valuable work already accomplished by PCBS is very much appreciated andhighly estimated but it should be noted that the number of tables in each publication isstill limited, and each publication covers only a single subject or part of a subject inenvironment statistics, which enlarges the number of outputs but requires the user torefer to many publications in order to get a better overview of the field ofenvironment statistics. It is therefore suggested to combine all relevant tables into asingle comprehensive publication.
Activities in environment statistics
As described above, the PCBS has many activities in this field. The data for thepublications come from two main sources: i) the administrative report, which isprepared after the collection and processing of the data, ii) the field surveys such asmedical environmental surveys and other sources, for example, official reports anddata coming from other sections of the PCBS.
It is noticed that some descriptive analyses were conducted, which show therelatively advanced level of work in the institution. To the most part the work wasdone with the support from foreign agencies, which provided great benefits inproducing and establishing environment statistics as well as capacity building inPCBS.
Classifications, methodologies, standards, and coding systems

43
It is apparent from the publication that the PCBS uses international classificationssuch as ISIC for economic activities, and partially for medical wastes. But thestandards used, for example in water statistics, are not mentioned in the report. Itcould be that no national standards are available or that these standards were not used.Furthermore, the methods of tabulation of water quality data need to be reviewed.
The methodologies used in environment statistics are described in detail in bothArabic and English. For example, water and land statistics are compiled from theadministrative records of Palestinian Ministries and institutions as the main datasources, while for energy the data are extracted by attaching energy questionnaires tothe household and economic surveys, which are conducted annually by PCBS. Acoding system is not applied in the publications.
Data gaps
Despite the large number of publications released by PCBS, many substantivegaps remain:
1. Water quality, e.g. biological parameters of drinking water quality andthe quality of sewage water released by wastewater treatment plants.
2. Land use statistics could be further disaggregated as this subjectincludes about 64% of land classified into other type.
3. Waste statistics has many data gaps, in particular, the generation ofhazardous wastes and the quantities of waste produced by sector.
4. Air quality has only limited information.
Considering the political conditions in Palestine, the overall situation with respectto environment statistics is rather remarkable and should be further expanded.
Requirements for improving environment statistics in Palestine
It is difficult to anticipate the future needs in this area from the material available.Therefore, the suggested requirements are subject to adjustment if any newinformation becomes available. Based on the current information, the followingrequirements are identified:
1. Training on data dissemination techniques of environment statistics.2. Improving the use of secondary data from different sources, e.g. the
Ministry of Environment.3. Due to the limited use of GIS data in environment statistics it seems
that training is needed on the use and applications of new GIStechnologies.
4. Better cooperation between the PCBS and other agencies will bebeneficial given the current limitations in data sources and funding.Furthermore, the creation of an environment statistics committee andinformation system could improve the situation.
Main difficulties
44
The instable political situation in Palestine makes it particularly difficult to sustainenvironment statistics programmes as it is affecting among other things the conduct offield surveys. In addition there are other difficulties:
1. The limited availability of data on topics such as air quality.2. Environment statistics is a fairly new subject, which requires training
and expertise.3. The conduct of field surveys is expensive and the lack of sufficient and
continued financing is one of the main constraints in the furtherdevelopment of environment statistics.
Recommendations
1. It is recommended to review the methods of data dissemination byreducing the number of publications.
2. It is recommended to increase the cooperation between PCBS andother relevant agencies with regard to the collection and processing ofenvironmental information.
3. The priorities of environment statistics should be setout morespecifically and the projects should be consistent with nationalobjectives (not donor objectives).
45
6. Yemen
The consultant visited Yemen from 22 to 26 April 2002. The visits in Yemencovered the Central Statistical Organization (CSO), the Environment ProtectionAuthority (EPA), the National Water Resources Authority (NWRA), and the Ministryof Agriculture. The consultant met Mr. Mohamed Abdel Rehim, Deputy of theDirector General for Planning and Information and, in addition, he has been shownrelevant documents as well as available software.
Institutional Background and Legislation
According to law 28 of 1995 the Central Statistical Organization (CSO) is the soleagency that has the authority to collect statistical data except for data relating to themilitary and security corporations. Thus, the legal framework of the CSO alsoincludes environmental data collection. In addition, the proposed structural set-up ofthe CSO includes the General Department of Production and Environment statistics.
Yemen is currently in the process of passing a decree in accordance to the above-mentioned framework, which will hopefully come into effect in the near future. Thework of the CSO is organized and carried out according to the legal framework,which means that there are no legal constraints to produce environment statistics.
In addition, the Environment Protection Authority (EPA) has the responsibility toproduce an environmental status report in Yemen, which includes someenvironmental data. But the data used in the report are not collected in field surveysby EPA but by other agencies and institutions. In this regard, there appears to be noduplication of efforts but rather a system of shared responsibilities and teamwork. Onthe other hand, an expansion of the work programme of the CSO in environmentstatistics may give rise to some duplication in the future.
Sources of environmental data and statistics
The main sources of environmental and other relevant data are as follows:
1. The CSO, which provides data relating to social and economicindicators, sources of drinking water for households, and access ofhouseholds to the public sewage water system.
2. The Public Electricity Cooperation, which provides data on access ofhouseholds to the public electricity system.
3. The Ministry of Health, which provides data on the number of hospitals.4. The Public Board and Civil Aviation Authority, which provides
meteorological data.5. The Ministry of Transport, which provides data relating to
transportation and shipping.6. The Public Board for Water Resources, which provides data on water
resources.7. The Ministry of Works and Urban Development, which provides data
on solid wastes and drinking water purification.8. The National Center for Earthquakes, which provides information
related to earthquakes.9. The Public Corporation for Water and Sanitary Sewage, which provides
data on sewage water.

46
Not yet utilized sources of information are:
1. The National Water Resources Authority (NWRA), which hasinformation on drinking water quality and water resources at nationallevel.
2. The Ministry of Agriculture with its sub-divisions:a. Directorate of natural ranges.b. Directorate of agriculture statistics.c. Directorate of plant protection.d. Directorate of irrigation.
In addition, many studies have been conducted with the support of foreignagencies and companies, for example:
1. The British company Hunting classified the plants according to familyand species as well as estimated forest density for some areas inYemen.
2. A focal point for desertification, which is linked to the NationalPlanning Committee, collected data on desertification for 1996, 1998,and 2000 from the National Planning Commission for the Resistanceof Desertification (Source of information: Head of Instructions at theMinistry of Agriculture, no further details could be gathered).
3. The Institute of Applied Geosciences, Netherlands conducted a waterassessment. The results are available but are scattered and the timeseries are not homogenous. Most of the information is available in hardcopy only and the project was conducted for purposes other thanenvironment statistics.
Human resources
At the time of the visits there was only one employee allocated to work onenvironment statistics, who also has other tasks in the Agricultural Census. Thebackground of the staff member is in statistics but his main experience is inagricultural statistics. The consultant notices that the knowledge of the staff memberis based mostly on the self-study of available documents and tables, which means thattraining is required to increase his capacities.
The consultant discussed the shortage of employees in environment statistics withMr. Gradah, the Chairman of the CSO, who promised to lend his full support to thisobjective. Mr Gradah also emphasized his interest in receiving assistance from aninternational agency, which he emphasized as absolutely needed.
The Deputy Director General of Planning and Information at EPA is involved inan environmental information system. He has at his disposal a database with efficientsoftware in Microsoft Access, which was developed in a joint project with TheNetherlands. It is noticed that although the software is operational, the database hasmany gaps and numerous empty cells as a result of the scarcity of information. Themain data source feeding into this database are the CSO data. The consultantsuggested that the CSO may therefore consider using this software.
47
Activities in environment statistics
As mentioned above, the main sources of data used by the CSO and otheragencies are secondary data, collected in collaboration between the CSO, the Ministryof Environment and other governmental agencies. In addition, a demographicenvironmental survey is currently being prepared. The survey will cover a sample ofhouseholds through interviews. The consultant has seen the draft of the questionnaire,which is not yet finalized, but is similar to the questionnaire developed in Oman,which is mentioned later.
It is clear from the visits that the activities in the area of environment statistics arestill at an early stage in Yemen and it will take time, human, and financial resources toreach a more satisfactory situation.
Classifications, methodologies, standards, and coding systems
Due to the limited quantity of data available at the CSO, which concentrates onindicators, no classification system is currently being used. Therefore, as mentionedbefore, all data disseminated in the field of environment statistics should be reviewed.
Aggregation of data from secondary sources is performed but no standards orcoding systems have been used.
Publications and databases
Until now, no special publication for environment statistics has been released. TheCSO includes a chapter Environment in its Statistical Yearbook. This chapter containsthe following tables:
Title Source PeriodSocial and economicindicators
CSO, Ministry of Health,Public Board of WaterResources, Ministry ofTransport.
1999, 2000
Temperature in degreesCelsius
Public Board of CivilAviation.
2000, monthly
Relative Humidity Public Board of CivilAviation.
2000, monthly
Quantity of monthlyrainfall
Public Board of CivilAviation.
2000, monthly
Wind speed and direction. Public Board of CivilAviation.
2000, monthly
Quantity of solid waste atgovernorate’s center
Ministry of Works andUrban Development
2000, yearly
Quantity of spoiled orinedible foods
Ministry of Works andUrban Development
2000, yearly
Number of stations fordrinking water purification,water bottled in plasticcontainers.
Ministry of Works andUrban Development
2000, yearly
Distribution of number and CSO, Household budget 1998
48
ratio of dwellings andpopulation according towater source.
survey.
Distribution of number andratio of dwellings andpopulation by means ofsanitary sewage
CSO, Household budgetsurvey.
1998
Distribution of the numberand ratio of dwellings andpopulation according tosource of light.
CSO, Household budgetsurvey.
1998
Distribution of number andratio of dwellings andpopulation according tosource of cooking fuel.
CSO, Household budgetsurvey.
1998
Number of registereddomestic and internationalearthquake events.
National Center ofEarthquake Monitoring.
2000, monthly
Quantity of production andconsumption of water.
Public Corporation forWater and SanitarySewage.
2000, yearly
Number of subscribers andbeneficiaries of sanitarysewage service.
Public Corporation forWater and SanitarySewage.
2000, yearly
In addition, the Statistical Yearbook contains information relating to theenvironment such as demographic indicators, agriculture, and health statistics.
The consultant notices that the quantity of data disseminated in the StatisticalYearbook is rather limited in comparison to the amount of data available in the CSOand other agencies such as the Natural Water Resources Authority (NWRA) and theMinistry of Agriculture. In addition, the arrangement of tables and methods used forthe calculations need to be reviewed.
On other hand, as mentioned before, the EPA has a database with some quantitiesof information, which it acquired mainly from the CSO. This emphasizes the need forbetter cooperation between the two agencies.
The consultant visited the following agencies: The NRWA, the EPA, the ForestDirectorate and the Agriculture Statistics Directorate as well as the library in theMinistry of Agriculture. The consultant found the following environmentally relevantinformation:
1. Ground water quantity and abstraction at the national level.2. Water quality.3. Forest area.4. Plant classification in some area.5. Protected area.
The information is available in hard copy or sometimes on laboratory data sheets,which poses the risk of information loss if it is not computerized and archivedproperly. The consultant agreed with the Chairman of the CSO to build a database and
49
document all information available in the CSO. However, this work requires afinancial budget and external technical assistance.
Data gaps and priorities
The main data gaps determined are:
1. Water statistics such as the quantity of renewable ground and surfacewater, data on water production and consumption at the national levelas well as drinking water quality.
2. Forest area and area affected by desertification.3. Air quality. It noticed that except for one station, which is currently not
working, there is no other air quality monitoring station in Yemen.4. Hazardous waste and solid waste, the latter of which is currently
available only for the governorate’s center.
The suggested priorities are:
1. Demographic and environment statistics focusing on indoorenvironment statistics and environmental indicators.
2. Water statistics with a complete evaluation at the national level forwater supply, water consumption, and water quality.
3. Fertilizer and pesticides consumption.4. Coastal zone and marine water quality.
The requirements to improve environment statistics in Yemen
1. Training and capacity building; it is suggested to provide training onthe fundamental principles of environment statistics.
2. It is suggested to organize a study tour for the employees working inthis field to countries more advanced in the development ofenvironment statistics and environmental monitoring in the ESCWAregion.
3. It is suggested to provide training on how to derive and calculateenvironmental indicators and on how to link the indicators toenvironmental impacts.
4. It is recommended to provide manuals and to explain existingclassifications and coding systems in Arabic.
5. Tools and materials: Provide the CSO with PCs for use in environmentstatistics and for the development and use of databases.
6. Capacity building on the use of information systems and dataprocessing systems is required.
Main difficulties
1. The large number of agencies dealing with water management, oftenresulting in incomparable data and difficulties in the aggregation of thedata from different sources.
2. The overall scarcity of relevant data.
50
3. Non-response to surveys on environmental topics and limitedcooperation between data providers and CSO.
4. The sensitivity of some of the environmental information.5. The insufficient number of employees who are allocated to work in
this field.6. The limited experiences of the staff members due to the relative
novelty of the field.7. The absence of an environmental consciousness in general.
Recommendations
1. It is recommended to promote teamwork and to bring together allagencies directly involved in environmental issues and statistics.
2. It is proposed to collect all available information from the varioussources and to properly document it.
3. It is recommended to provide training to the members of the CSO andthe staff members from the EPA.
4. External assistance is considered important, in particular technicalassistance.
51
7. Saudi Arabia
The consultant visited Saudi Arabia from 5 to 11 July. In particular, the consultantvisited the Executive Office of UNDP and met the UN Residential Representativewith whom he discussed the situation of environment statistics in general.Subsequently, the consultant visited the Central Department of Statistics (CDS) andthe Ministry of Agriculture and Water in Riyadh. A meeting with the Meteorologyand Environmental Protection Administration (MEPA) in Jeddah followed this visitwhere the consultant met the responsible persons for environment statistics. He alsovisited the FAO Library in Riyadh and a center for documentation in MEPA.
Institutional Background and Legislation
The Central Department of Statistics (CDS) was established in accordance withthe Public Statistics Law issued through the Royal Decree no. (23) dated 7/12/1379hejri (1960 AD). It is considered the central authority of statistics in the Kingdom ofSaudi Arabia. The CDS shall be entrusted with the task of conducting all commercial,economic, health, educational, industrial, financial, and agricultural or any otherstatistics as required. By virtue of the law, the CDS is responsible for developing thescientific methodology, statistical or technical instructions, which help the otherstatistical departments in different governmental agencies to collect and preparedifferent statistics related to the work of that agency. These departments will providethe CDS, regularly, with statistical data. Hence, the CDS has the technical authority tosupervise all governmental agencies that produce statistical data, which results in asystem somewhere between a centralized system and a decentralized system. Theactivities of the CDS are conducted by activating the statistical work in thegovernmental agencies and developing it through the coordination with statisticaldepartments in order to prepare the statistics related to their official tasks.
On the other hand, the Meteorology and Environmental Protection Administration(MEPA) is the agency responsible for environmental protection, including theresponse to pollution of all kinds. The MEPA also has the authority to establish thedifferent environmental standards as necessary. This responsibility was established byRoyal Decree on 24.4.1401 Hijri, (28.2.1981 AD).
The Ministry of Agriculture and Water has the authority and responsibility toproduce statistical data related to its activities, which takes place under thesupervision by CDS.
Sources of environmental data and statistics
Please note that Internet addresses can be found in Annex 3).1. Central Department of Statistics (CDS), which provides data from its own
sources and from secondary sources relevant to the environment, e.g. weatherconditions statistics, population statistics, and health statistics.
2. Meteorology and Environmental Protection Administration (MEPA), whichprovides data on waste including hazardous waste, marine water quality in theGulf, air quality, air and water quality standards, and meteorological data.
3. Ministry of Agriculture and Water, which provides data on land use, crop areafor the main crops, area of range land fenced, fenced forestation area andparks belonging to the Ministry of Agriculture and Water, area of national

52
parks, area of green parks, quantity of pesticides imported, quantity offertilizers imported, number of wells, number of dams and their capacity, andquantity of treated sewage water used for irrigation.
4. National Commission for Wildlife Conservation and Development, whichprovides information on protected area and biodiversity in the protected areas.
5. Saline Water Conversion Corporation, which provides data on the quantity ofdesalinated water produced and the amount of electricity produced (1980 –2000).
6. Ministry of Health, which conducts drinking water quality analyses.7. Saudi Arabian Standards Organization (SASO), which develops the national
standards.
Human resources
The CDS has planned no environment statistics activities except the newHousehold Environmental Survey for 2002 and has not allocated any employee towork in this area. Mr. Mohanna, The Deputy Director General for Statistical Affairs,indicated that it is time to initiate a division for environment statistics.
A statistical division exists in the Ministry of Agriculture and Water foragricultural statistics, which includes some relevant environment statistics.
Activities in environment statistics
The CDS has only limited on-going activities relevant for environment statistics,which, as mentioned above, includes a Household Environmental Survey. This type ofactivity is applied in many countries in the ESCWA region such as Oman and Yemen.The survey covers indoor pollution to some extent and can be regarded as a first butnot sufficient step towards the full establishment of an environment statisticsprogramme.
On the other hand, the Meteorology and Environmental Protection Administration(MEPA) has many activities directly relating to environment statistics, for example,air quality monitoring. MEPA operates 11 stations. In addition, MEPA supervisesother stations operated by other institution such as ARAMCO and the Arab OilCompany. The data of all stations are available from MEPA. Also, the MEPAmonitors marine water quality in the Arab Gulf as well as groundwater quality incertain areas, e.g. in Jeddah. In addition, other institutions monitor coastal zone area,where other institutions operate 10 monitoring stations.
The Ministry of Agriculture and Water has a monitoring system for surface andground water resources and desalination water stations.
Classifications, methodologies, standards and coding systems
CDS uses international classifications, e.g. ISIC for the classification of economicactivities and the Harmonized System for external trade operations. No classificationspecialist for environment statistics is currently working at CDS.
In addition, the Ministry of Agriculture and Water uses the FAO classification forland use, which is already used by most agriculture statistics divisions in the ESCWAregion. MEPA also uses some classifications for hazardous chemicals and air quality.
53
Methodology
The methodology used for environment statistics is a mixture of differentmethods, for example, household sample surveys, which are used to collect data forthe Household Environmental Survey. The other method for compiling environmentaldata is report keeping from monitoring stations but this method needs to be revisedand improved.
Standards and coding systems
The MEPA produces environmental protection standards, which are mentioned indocument no. 1409-01. These standards include the Saudi Arabian standards for airquality and organic pollutants. The standard of water quality including drinking waterand marine water is not mentioned.
Publications and databases
The consultant found a large amount of data and information relating to theenvironment in Saudi Arabia. Parts of these data are published in the AnnualStatistical Report, while other data are published in the Annual Agriculture Report ordisseminated on the Internet. Yet other information is available only in hard copy forlocal use such as drinking water quality. Concluding, the data are scattered acrossareas as well as in method of tabulation and recording. The positive point is thatMEPA has a center for documentation of scientific documents and information, whichthe consultant visited. The center concentrates mainly on meteorological informationand some other information relating to the environment but it is good first step andhopefully the Center can expand its documentation programme.
The main data relating to the environment available in Saudi Arabia arementioned in the table below:
Title Source PeriodAverage Air Pressure, By Month and MeteorologicalStation (In Millibars).
StatisticalYearbook
Monthly, 2000
Average Temperature, Average Maximum Temperature,Extreme Maximum Temperature, Average MinimumTemperature, and Minimum Temperature By Month andMeteorological Station.( In Centigrade Degrees Celsius ).
StatisticalYearbook
Monthly, 2000
Average Relative Humidity, Maximum Relative Humidity,Minimum Relative Humidity By Month andMeteorological Station: 2000 A.D.( In Percent )
StatisticalYearbook
Monthly, 2000
Rainfall, By Month and Meteorological Station: 2000. StatisticalYearbook
Monthly, 2000
Direction and Average Speed of the Prevailing Wind,Direction and Speed of Maximum Wind, By Month andMeteorological Station: 2000 A.D. (Direction by CompassPoints and Speed in Knots)(Direction by Compass Points and Speed in Knots)
StatisticalYearbook
Monthly, 2000
Days with Sandstorms, Thunderstorms and Fog, By Monthand Meteorological Station.
StatisticalYearbook
Monthly, 2000
Occupied households by house type and source of drinking Statistical Yearly, 2000

54
water in administrative areas YearbookFires Accidents By Region Statistical
YearbookYearly 1419 And1420 A.H. 1999AD
Percentage of Fire Accidents by Month: StatisticalYearbook
Yearly 1416 -1420 A.H. 1995AD
Number of Fires by Property Type StatisticalYearbook
yearly 1419 And1420 A.H. 1998AD
Generating Capacity, Peak Load, No. of Subscribers,Electricity Production, Consumption and IndustrialConsumption.
StatisticalYearbook
yearly1410-1420 A.H.1989-1999 AD
Generating Capacity, Peak Load, No. Of Subscribers,Electricity Consumption and Industrial Consumption byRegion
StatisticalYearbook
Yearly 1410-1420 A.H. 1989-1999 AD
Quantity of Electricity Generated, by Desalination Plant (InMegawatt Hour)
StatisticalYearbook
1410 - 1420A.H. 1989-1999AD
Quantity of Water Desalinated, by Desalination Plant: (Inthousands of cubic meters)
StatisticalYearbook
1410 - 1420A.H. 1989-1999AD
Water Consumption and Number of Subscribers, by city(Quantity in thousand Cubic Meters)
StatisticalYearbook
1410 - 1420A.H. 1989-1999AD
Cement Production, by Company (In Tons). StatisticalYearbook
1410 - 1412 A.H1989-1991 AD
Production of the National Gypsum Company, by Monthand Product (In Tons)
StatisticalYearbook
1998 - 2000A.D.
Natural Gas Sales, by Station (IN tons) StatisticalYearbook
1999 and 2000A.D.
The Development of Road Construction from StatisticalYearbook
1411/1412-1420/1421 A.H.1990/1991 AD
The Lengths of Roads Constructed up Till End of. (InKilometers)
StatisticalYearbook
1419/1420 and1420/1421 A.H1998/19991999/2000
Vehicles Imported, by Type. StatisticalYearbook
1991-2000 A.D.
Oil Tankers and Oil Products, by Port and Month. StatisticalYearbook
Total Land Area Distributed in kingdom according to theArable Land distribution Scheme Up to the End of
Ministry ofagriculture andWater
1420 A.H. 1999AD
Estimated Area of All Crops, By Administrative Region(Trade. & Spec.)
Ministry ofagriculture andWater
Yearly, 2000.
Length of Agriculture Roads Ministry of Yearly, 2000.
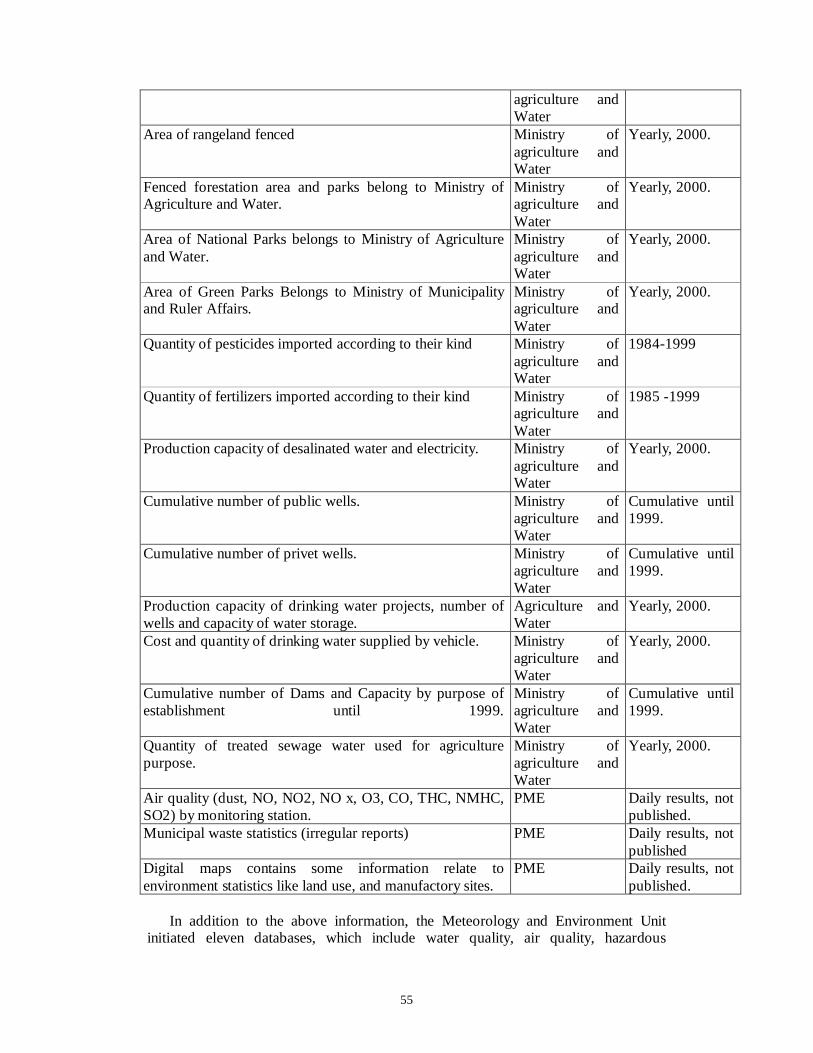
55
agriculture andWater
Area of rangeland fenced Ministry ofagriculture andWater
Yearly, 2000.
Fenced forestation area and parks belong to Ministry ofAgriculture and Water.
Ministry ofagriculture andWater
Yearly, 2000.
Area of National Parks belongs to Ministry of Agricultureand Water.
Ministry ofagriculture andWater
Yearly, 2000.
Area of Green Parks Belongs to Ministry of Municipalityand Ruler Affairs.
Ministry ofagriculture andWater
Yearly, 2000.
Quantity of pesticides imported according to their kind Ministry ofagriculture andWater
1984-1999
Quantity of fertilizers imported according to their kind Ministry ofagriculture andWater
1985 -1999
Production capacity of desalinated water and electricity. Ministry ofagriculture andWater
Yearly, 2000.
Cumulative number of public wells. Ministry ofagriculture andWater
Cumulative until1999.
Cumulative number of privet wells. Ministry ofagriculture andWater
Cumulative until1999.
Production capacity of drinking water projects, number ofwells and capacity of water storage.
Agriculture andWater
Yearly, 2000.
Cost and quantity of drinking water supplied by vehicle. Ministry ofagriculture andWater
Yearly, 2000.
Cumulative number of Dams and Capacity by purpose ofestablishment until 1999.
Ministry ofagriculture andWater
Cumulative until1999.
Quantity of treated sewage water used for agriculturepurpose.
Ministry ofagriculture andWater
Yearly, 2000.
Air quality (dust, NO, NO2, NO x, O3, CO, THC, NMHC,SO2) by monitoring station.
PME Daily results, notpublished.
Municipal waste statistics (irregular reports) PME Daily results, notpublished
Digital maps contains some information relate toenvironment statistics like land use, and manufactory sites.
PME Daily results, notpublished.
In addition to the above information, the Meteorology and Environment Unitinitiated eleven databases, which include water quality, air quality, hazardous

56
chemicals and environmental companies. These databases are helpful for manyenvironment statistics activities in Saudi Arabia.
A relatively large number of scientific studies were conducted such as, forexample, plant cover and desertification, the effect of oil pollution during the GulfCrises, pollution in the coastal zone in Jeddah, and the enumeration of the forest areaand rangeland, which includes a classification of soil, flora, and fauna. This lastproject is currently under way.
In addition, the National Report on the Current Situation of the Environment inSaudi Arabia contains six chapters:
1. General information about Saudi Arabia.2. Improvement of environment management concepts.3. The Meteorology and Environmental Protection Administration
(MEPA).4. Human activities that affect the environment.5. The current situation of environment and natural resources.6. Environmental management and future challenge.
Data gaps and priorities
It is difficult to specify the data gaps when no specific environmental divisionexists that is responsible for cataloging and administering the large amounts of datascattered across governmental agencies and private institutions. In general, Mr.Sameer J. Ghazi, the Director of Natural Resources at MEPA specified the gaps andpriorities in environment statistics as follows:
1. Coastal zone including marine water quality, biodiversity andpollution.
2. Classification flora and fauna in general.3. Environmental monitoring system to cover the country.
In addition, the CDS added the Household Environmental Survey. The otheragencies did not mention any other points.
The requirements for improving environment statistics in Saudi Arabia
The response to this question was that after attendance of the workshop onenvironment statistics and after having been trained in the concepts and methods ofenvironment statistics, ideas and needs can be formulated. At this point only generalstatements referring to the need for documents and materials on environment statisticsand on how to start an environment statistics programme can be made. Technicalassistance and expert instructions will also be needed throughout the initiation stage.
Main difficulties
1. The absence of a designated division to administer and direct the workin environment statistics as well as a lack of knowledge on how toinstitutionalize an environment statistics system.
57
2. The fact that information is so scattered across different areas and thatsome of the information is available only in hard copy, while otherinformation is not documented properly.
3. The sensitivity of the environmental information in some fields, inparticular water statistics, creates some difficulties.
4. The limited experience in environment statistics and the lack ofprioritization of environmental monitoring and statistics.
Recommendations
1. It is recommended to provide training to members from the CDS and membersfrom MEPA.
2. Due to the large amount of data available in different institutions, it isrecommended to collect all available data and produce a first environmentalcompendium.
3. It is recommended to set-up a technical team from the various relevantinstitutions.
4. The provision of external technical assistance to initiate the new division andto produce the environmental compendium is recommended.
58
8. Iraq
The Central Statistical Organization (CSO) is the responsible agency to conductsurveys and to publish environmentally relevant statistical data. Since statistics ingeneral is currently no priority area and lacks sufficient financing and equipment, theactivities of the CSO in this field are very limited.
Based on the law no. 747 from 1998, the Center of Environmental Protection atthe Ministry of Health is the responsible agency to monitor the environmentalsituation in Iraq and to produce monthly reports on the environmental status in Iraq. Itappears that currently no reports are produced by the Center.
Only one annual survey is conducted by the CSO covering water and electricityand the survey provides information on water production and consumption as well aselectricity production and consumption. The data are collected from the governmentalagencies by sending a questionnaire to the responsible persons in each agency.
Other available data relating to the environment are, among others, demographicstatistics.
Due to the absence of communication facilities and other constraints, theconsultant could not get sufficient information about the current situation ofenvironment statistics in Iraq. The reply he received states that no activities inenvironment statistics are taking place in Iraq at this time, except for the survey whichwas mentioned above.
Therefore it can only be concluded that the level of development of environmentstatistics is very weak at the current time.
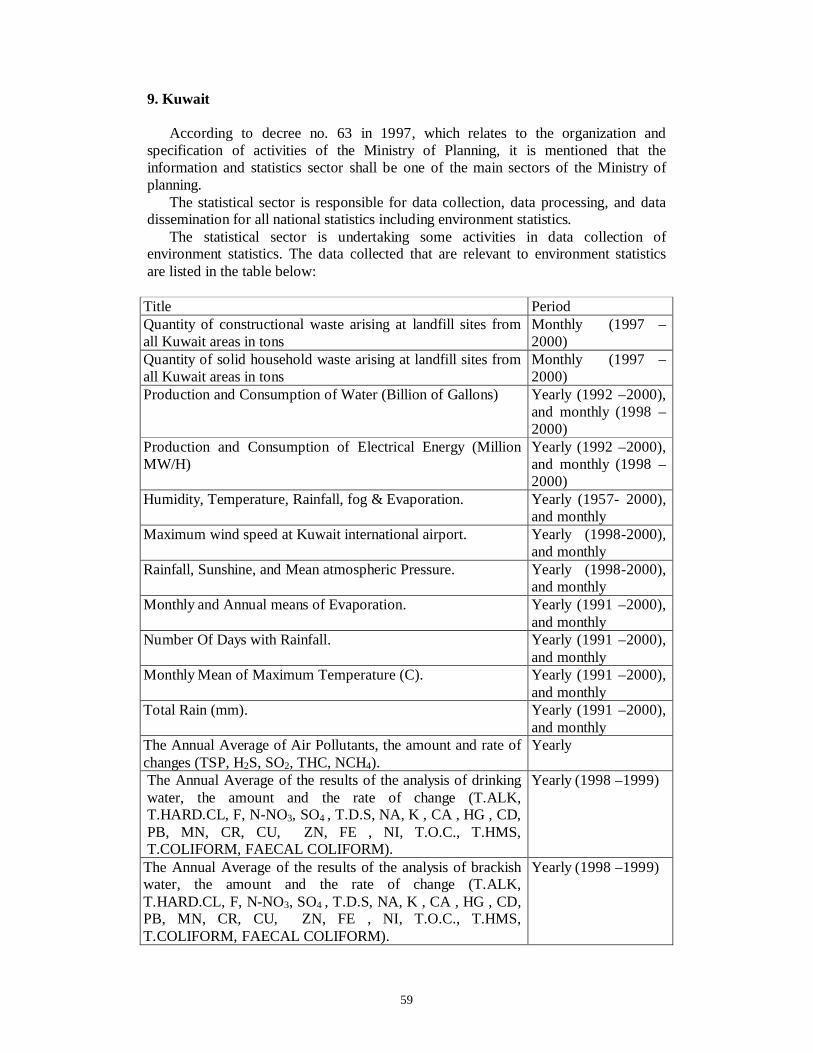
59
9. Kuwait
According to decree no. 63 in 1997, which relates to the organization andspecification of activities of the Ministry of Planning, it is mentioned that theinformation and statistics sector shall be one of the main sectors of the Ministry ofplanning.
The statistical sector is responsible for data collection, data processing, and datadissemination for all national statistics including environment statistics.
The statistical sector is undertaking some activities in data collection ofenvironment statistics. The data collected that are relevant to environment statisticsare listed in the table below:
Title PeriodQuantity of constructional waste arising at landfill sites fromall Kuwait areas in tons
Monthly (1997 –2000)
Quantity of solid household waste arising at landfill sites fromall Kuwait areas in tons
Monthly (1997 –2000)
Production and Consumption of Water (Billion of Gallons) Yearly (1992 –2000),and monthly (1998 –2000)
Production and Consumption of Electrical Energy (MillionMW/H)
Yearly (1992 –2000),and monthly (1998 –2000)
Humidity, Temperature, Rainfall, fog & Evaporation. Yearly (1957- 2000),and monthly
Maximum wind speed at Kuwait international airport. Yearly (1998-2000),and monthly
Rainfall, Sunshine, and Mean atmospheric Pressure. Yearly (1998-2000),and monthly
Monthly and Annual means of Evaporation. Yearly (1991 –2000),and monthly
Number Of Days with Rainfall. Yearly (1991 –2000),and monthly
Monthly Mean of Maximum Temperature (C). Yearly (1991 –2000),and monthly
Total Rain (mm). Yearly (1991 –2000),and monthly
The Annual Average of Air Pollutants, the amount and rate ofchanges (TSP, H2S, SO2, THC, NCH4).
Yearly
The Annual Average of the results of the analysis of drinkingwater, the amount and the rate of change (T.ALK,T.HARD.CL, F, N-NO3, SO4 , T.D.S, NA, K , CA , HG , CD,PB, MN, CR, CU, ZN, FE , NI, T.O.C., T.HMS,T.COLIFORM, FAECAL COLIFORM).
Yearly (1998 –1999)
The Annual Average of the results of the analysis of brackishwater, the amount and the rate of change (T.ALK,T.HARD.CL, F, N-NO3, SO4 , T.D.S, NA, K , CA , HG , CD,PB, MN, CR, CU, ZN, FE , NI, T.O.C., T.HMS,T.COLIFORM, FAECAL COLIFORM).
Yearly (1998 –1999)
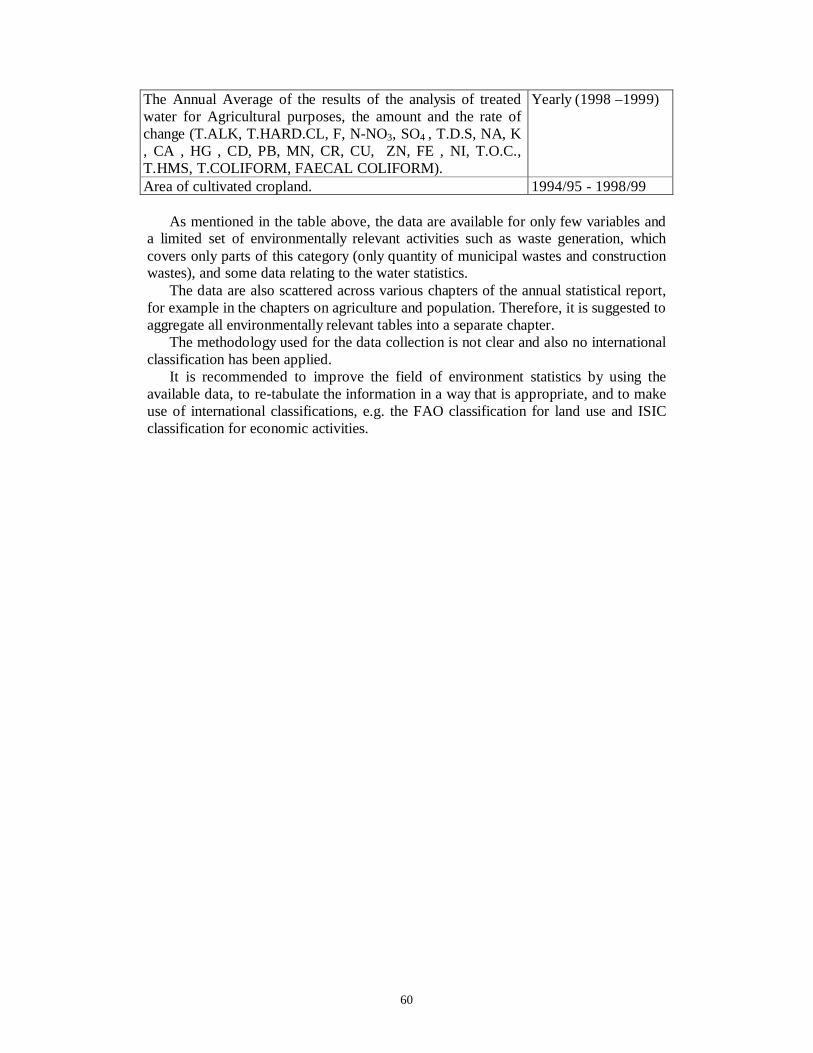
60
The Annual Average of the results of the analysis of treatedwater for Agricultural purposes, the amount and the rate ofchange (T.ALK, T.HARD.CL, F, N-NO3, SO4 , T.D.S, NA, K, CA , HG , CD, PB, MN, CR, CU, ZN, FE , NI, T.O.C.,T.HMS, T.COLIFORM, FAECAL COLIFORM).
Yearly (1998 –1999)
Area of cultivated cropland. 1994/95 - 1998/99
As mentioned in the table above, the data are available for only few variables anda limited set of environmentally relevant activities such as waste generation, whichcovers only parts of this category (only quantity of municipal wastes and constructionwastes), and some data relating to the water statistics.
The data are also scattered across various chapters of the annual statistical report,for example in the chapters on agriculture and population. Therefore, it is suggested toaggregate all environmentally relevant tables into a separate chapter.
The methodology used for the data collection is not clear and also no internationalclassification has been applied.
It is recommended to improve the field of environment statistics by using theavailable data, to re-tabulate the information in a way that is appropriate, and to makeuse of international classifications, e.g. the FAO classification for land use and ISICclassification for economic activities.
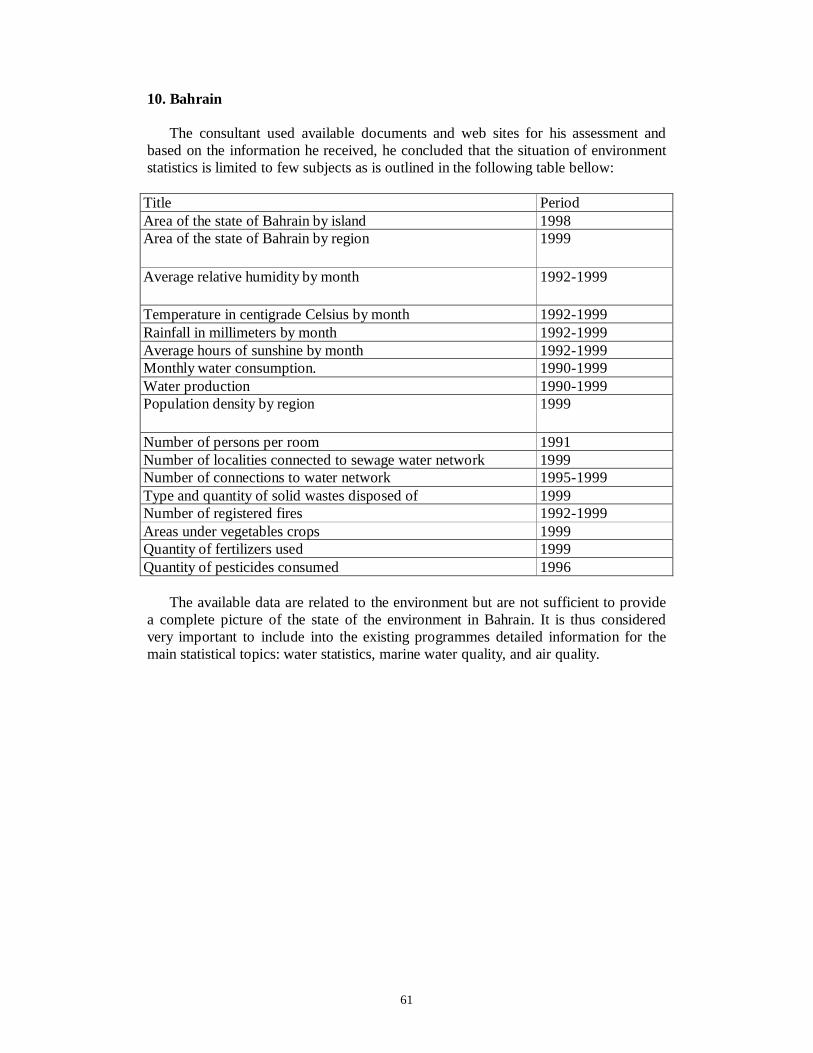
61
10. Bahrain
The consultant used available documents and web sites for his assessment andbased on the information he received, he concluded that the situation of environmentstatistics is limited to few subjects as is outlined in the following table bellow:
Title PeriodArea of the state of Bahrain by island 1998Area of the state of Bahrain by region 1999
Average relative humidity by month 1992-1999
Temperature in centigrade Celsius by month 1992-1999Rainfall in millimeters by month 1992-1999Average hours of sunshine by month 1992-1999Monthly water consumption. 1990-1999Water production 1990-1999Population density by region 1999
Number of persons per room 1991Number of localities connected to sewage water network 1999Number of connections to water network 1995-1999Type and quantity of solid wastes disposed of 1999Number of registered fires 1992-1999Areas under vegetables crops 1999Quantity of fertilizers used 1999Quantity of pesticides consumed 1996
The available data are related to the environment but are not sufficient to providea complete picture of the state of the environment in Bahrain. It is thus consideredvery important to include into the existing programmes detailed information for themain statistical topics: water statistics, marine water quality, and air quality.
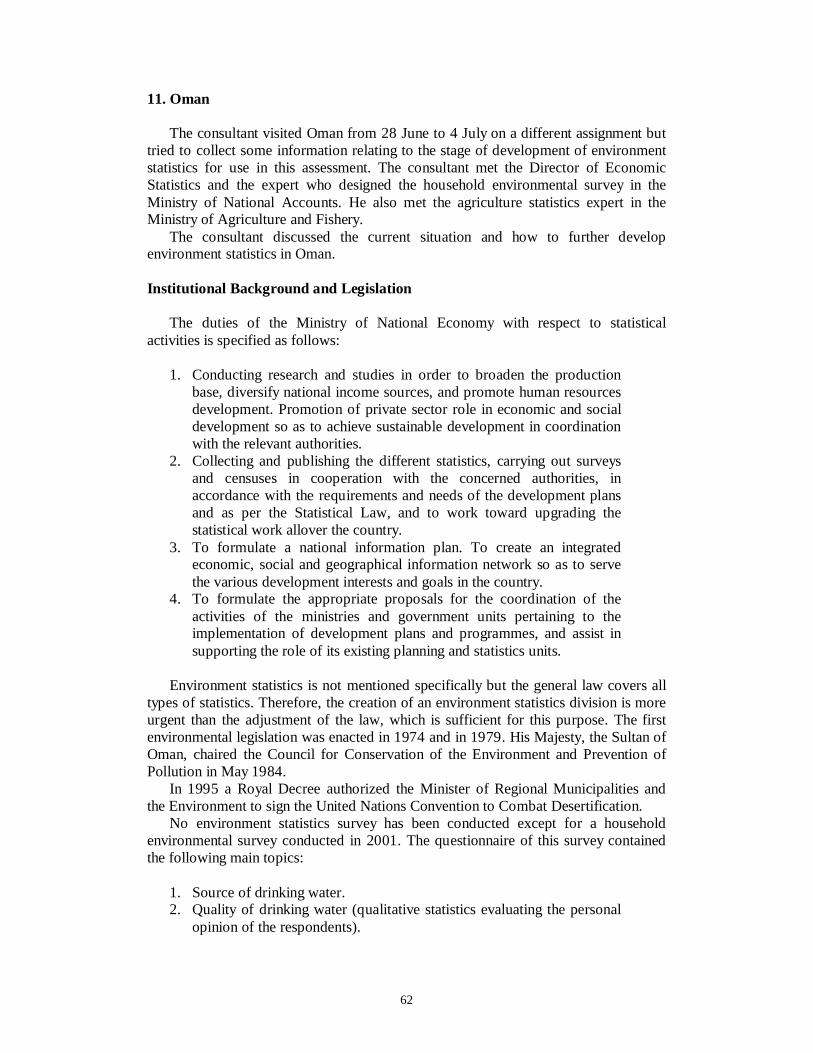
62
11. Oman
The consultant visited Oman from 28 June to 4 July on a different assignment buttried to collect some information relating to the stage of development of environmentstatistics for use in this assessment. The consultant met the Director of EconomicStatistics and the expert who designed the household environmental survey in theMinistry of National Accounts. He also met the agriculture statistics expert in theMinistry of Agriculture and Fishery.
The consultant discussed the current situation and how to further developenvironment statistics in Oman.
Institutional Background and Legislation
The duties of the Ministry of National Economy with respect to statisticalactivities is specified as follows:
1. Conducting research and studies in order to broaden the productionbase, diversify national income sources, and promote human resourcesdevelopment. Promotion of private sector role in economic and socialdevelopment so as to achieve sustainable development in coordinationwith the relevant authorities.
2. Collecting and publishing the different statistics, carrying out surveysand censuses in cooperation with the concerned authorities, inaccordance with the requirements and needs of the development plansand as per the Statistical Law, and to work toward upgrading thestatistical work allover the country.
3. To formulate a national information plan. To create an integratedeconomic, social and geographical information network so as to servethe various development interests and goals in the country.
4. To formulate the appropriate proposals for the coordination of theactivities of the ministries and government units pertaining to theimplementation of development plans and programmes, and assist insupporting the role of its existing planning and statistics units.
Environment statistics is not mentioned specifically but the general law covers alltypes of statistics. Therefore, the creation of an environment statistics division is moreurgent than the adjustment of the law, which is sufficient for this purpose. The firstenvironmental legislation was enacted in 1974 and in 1979. His Majesty, the Sultan ofOman, chaired the Council for Conservation of the Environment and Prevention ofPollution in May 1984.
In 1995 a Royal Decree authorized the Minister of Regional Municipalities andthe Environment to sign the United Nations Convention to Combat Desertification.
No environment statistics survey has been conducted except for a householdenvironmental survey conducted in 2001. The questionnaire of this survey containedthe following main topics:
1. Source of drinking water.2. Quality of drinking water (qualitative statistics evaluating the personal
opinion of the respondents).
63
3. Quantity and method of disposal of household wastes (cesspool orpublic waste collection network etc).
4. Method of sewage water disposal.5. Information on cesspool.6. Pollution in the close vicinity of the house (evaluating personal opinion
of the respondents with respect to noise, bad smell, etc).7. Use of chemical detergents in the house (including chemical materials
used for cleaning purpose inside the house).8. Use of pesticides inside the house (yes/no)
This questionnaire recorded living conditions. It is a qualitative questionnaire,thus providing only limited results, which may additionally be strongly affected byindividual opinions. On the other hand, the questionnaire provides some statisticaldata relating to the environment.
The table below lists the subjects included in the annual report that are related tothe environment.
Title PeriodMaximum and minimum temperature (degrees Celsius) bystation
Yearly
Maximum and minimum humidity in % by station YearlyTotal annual rainfall by station YearlyMonthly maximum and minimum temperature (degreesCelsius) by station.
Monthly
Monthly total annual rainfall by station MonthlyAgriculture land distribution YearlyEstimates of cultivated area and production by crop YearlyAreas treated against dobas bug & the quantity ofinsecticides utilized
Yearly
Consumption of electric power by sector; YearlyProduction and consumption of electricity YearlyProduction and consumption (use) of water Yearly and monthly
Production & distribution of water by governorate, regionand number of connections.
Yearly and monthly
Production & export of crude oil by production companies YearlyCrude oil production & uses. Yearly
In addition, some information relevant for environment statistics is available fromother sources such as water use from the Ministry of Agriculture as well as Wildlife,Natural Reserves, population of Arabian Oryx, Endangered Species, and Rare Plants& Trees from the Ministry of Information.
It is noticed that the data are scattered just as in many other countries, whichrequires time to collect the available data in order to produce environmentalcompendium.
The available data provide a starting point for environment statistics but it isnoticed that without a specialist in environment statistics and the establishment of acorresponding section or division, the work will be severely hampered and result in alack of consistency and harmonization. Therefore, the first step is to encourage Omar

64
to establish an environment statistics section followed by a specification of thepriorities and needs.
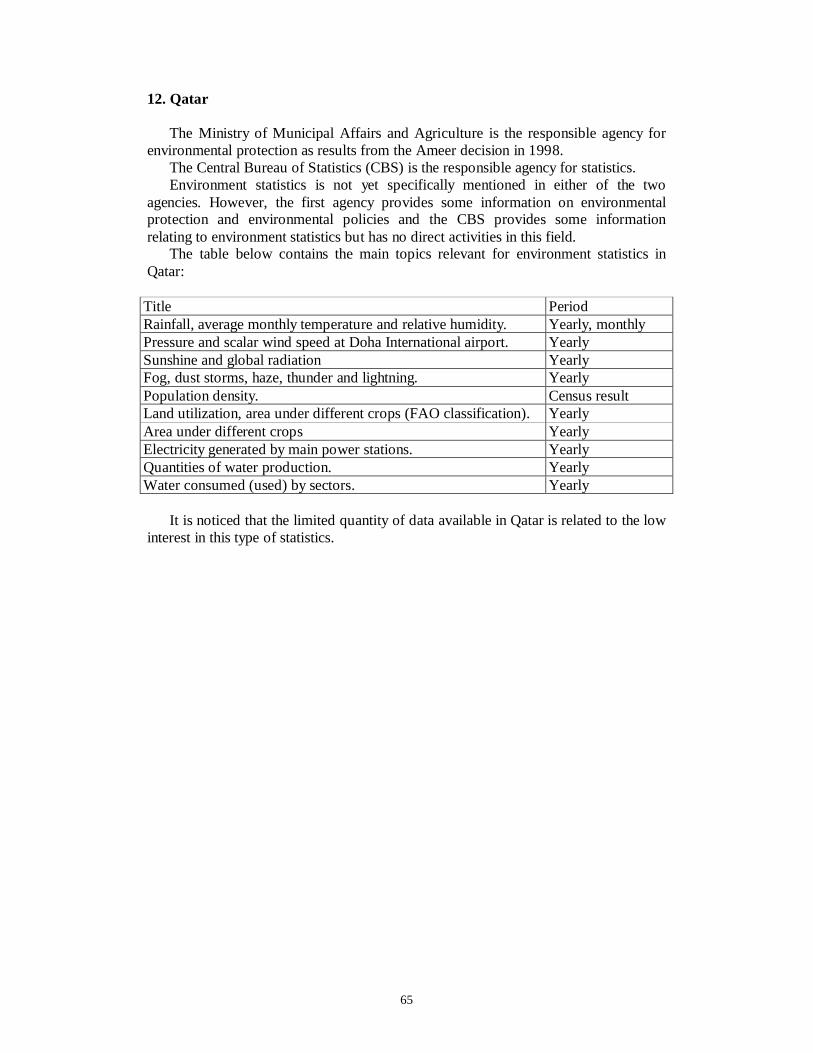
65
12. Qatar
The Ministry of Municipal Affairs and Agriculture is the responsible agency forenvironmental protection as results from the Ameer decision in 1998.
The Central Bureau of Statistics (CBS) is the responsible agency for statistics.Environment statistics is not yet specifically mentioned in either of the two
agencies. However, the first agency provides some information on environmentalprotection and environmental policies and the CBS provides some informationrelating to environment statistics but has no direct activities in this field.
The table below contains the main topics relevant for environment statistics inQatar:
Title PeriodRainfall, average monthly temperature and relative humidity. Yearly, monthlyPressure and scalar wind speed at Doha International airport. YearlySunshine and global radiation YearlyFog, dust storms, haze, thunder and lightning. YearlyPopulation density. Census resultLand utilization, area under different crops (FAO classification). YearlyArea under different crops YearlyElectricity generated by main power stations. YearlyQuantities of water production. YearlyWater consumed (used) by sectors. Yearly
It is noticed that the limited quantity of data available in Qatar is related to the lowinterest in this type of statistics.
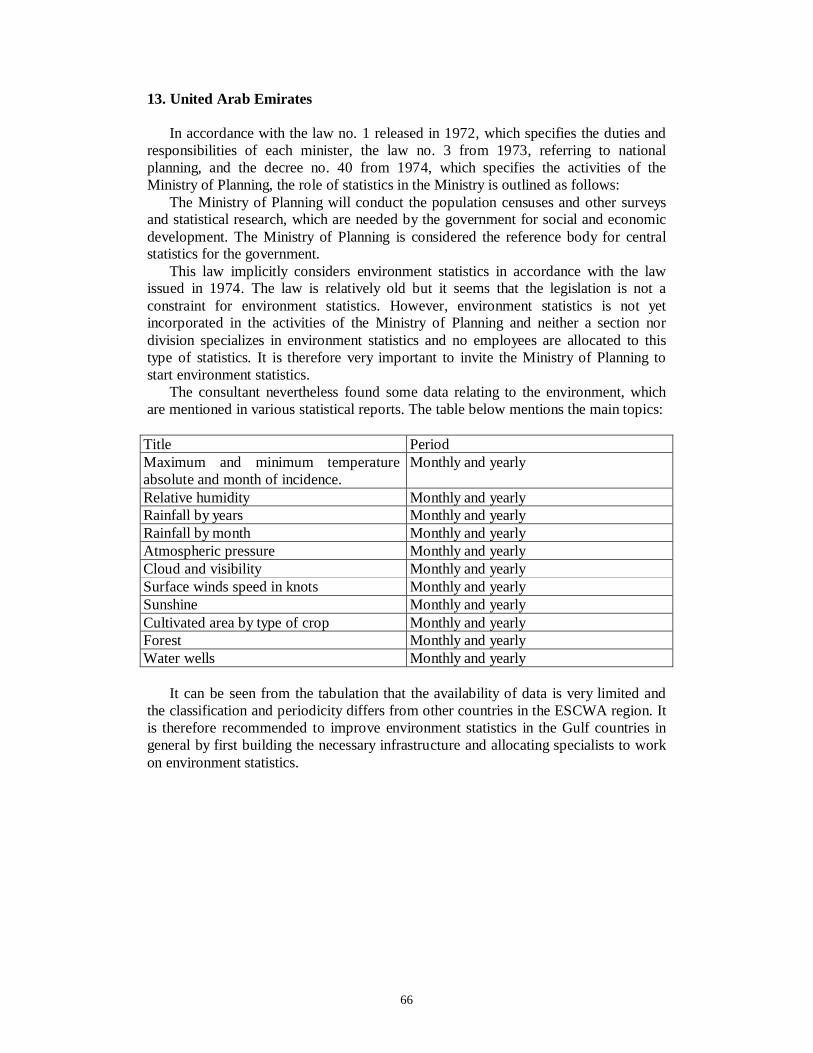
66
13. United Arab Emirates
In accordance with the law no. 1 released in 1972, which specifies the duties andresponsibilities of each minister, the law no. 3 from 1973, referring to nationalplanning, and the decree no. 40 from 1974, which specifies the activities of theMinistry of Planning, the role of statistics in the Ministry is outlined as follows:
The Ministry of Planning will conduct the population censuses and other surveysand statistical research, which are needed by the government for social and economicdevelopment. The Ministry of Planning is considered the reference body for centralstatistics for the government.
This law implicitly considers environment statistics in accordance with the lawissued in 1974. The law is relatively old but it seems that the legislation is not aconstraint for environment statistics. However, environment statistics is not yetincorporated in the activities of the Ministry of Planning and neither a section nordivision specializes in environment statistics and no employees are allocated to thistype of statistics. It is therefore very important to invite the Ministry of Planning tostart environment statistics.
The consultant nevertheless found some data relating to the environment, whichare mentioned in various statistical reports. The table below mentions the main topics:
Title PeriodMaximum and minimum temperatureabsolute and month of incidence.
Monthly and yearly
Relative humidity Monthly and yearlyRainfall by years Monthly and yearlyRainfall by month Monthly and yearlyAtmospheric pressure Monthly and yearlyCloud and visibility Monthly and yearlySurface winds speed in knots Monthly and yearlySunshine Monthly and yearlyCultivated area by type of crop Monthly and yearlyForest Monthly and yearlyWater wells Monthly and yearly
It can be seen from the tabulation that the availability of data is very limited andthe classification and periodicity differs from other countries in the ESCWA region. Itis therefore recommended to improve environment statistics in the Gulf countries ingeneral by first building the necessary infrastructure and allocating specialists to workon environment statistics.
67
The Center for Environment and Development for the Arab Region and Europe(CEDARE)
CEDARE was established on the basis of a joint commitment by the threeprincipal sponsors, namely the government of Egypt (GOE), the Arab Fund forEconomic and Social Development (AFESD) and the United Nations DevelopmentProgram (UNDP).
The main mission of CEDARE is capacity building of national institutions(CEDARE mainly deals with the Ministries of Environment) to enhanceenvironmental management and sustainable development. Its mandate covers fiveprograms, Freshwater resources management, Land resources management,Urbanization and human settlements, Industrialization for sustainable development,and Marine resources management. CEDARE concentrates on the first threeprograms.
A cross–cutting theme, which includes environmental assessment was identified.In addition, CEDARE has developed regional as well as national GIS systems for theArab countries, which include some information related to natural resources and landcover but still there are many gaps.
CEDARE also has an Information Services Unit. The task of this unit is to assistin the creation and strengthening of national environmental information system,production of environmental information, developing information technologyprograms, and promoting data harmonization and standardization.
CEDARE produces a CD, which contains the GIS database for the Arab region,environment- related databases, publications, documents, and reports as well asgeneral information on CEDARE.
CEDARE designed a home page www.cedare.org.eg that provides detailedinformation on the center, documentation, databases, and other information.
The international, regional and national agencies can use the available informationfrom CEDARE to produce environment statistics and build databases in fields such asnatural resources.
CEDARE signed a memorandum in the middle of March 2002 with ESCWA tocooperate in four areas:
1. Water resources management.2. Environmental policies and strategies.3. Information and GIS.4. Urbanization and human settlements.
CEDARE has the necessary facilities and experienced trainers to provide trainingin environmental information systems such as GIS. The consultant discussed thepotential for cooperation between ESCWA and CEDARE in the 2003 program andthe Executive Director agreed to provide support in accordance with the recentlysigned Memorandum between ESCWA and CEDARE.
The consultant noticed that CEDARE usually deals with the Ministries ofEnvironment and related institutions but that no contact exists between CEDARE andthe National Statistical Offices. This point was discussed and no constrains wereidentified that would prevent the future inclusion of the statistical offices intoCEDARE’s activities. However, the ability of this center to provide training inenvironment statistics is limited due to the lack of environmental statisticians.
68
The Arab Center for the Studies of Arid Zones and Dry Lands (ACSAD)
The Center was established in 1971 and consists of the states of the ArabLeague. The mandate of this Center is to improve the situation of the dry lands in theArab region, which includes combating desertification and increasing the green areain the Arab region. The Center completed a study called State of Desertification in theArab Region and the ways and means to deal with it. The study was published in1996, includes all of Arab countries, and the main themes covered by the study areclimate, geology and geomorphology, water resources, soil resources, plant cover,desertification status, and methods to combat desertification.
Two principal sponsors, the United Nations Environment Program (UNEP) andthe General Department of Economic Affairs of the League of Arab States (LAS),have accomplished this work on the basis of a joint commitment. T document wasprepared using available information from different sources, which lead to somedifferences in the temporal coverage between tables, inconsistency of tables, andsometimes out of date data. ACSAD has begun to update this report.
As mentioned above, the tasks of the Center are to combat desertification usingremote sensing among other tools and to produce statistical information on the statusand trends in desertification. Information is available, for example, for the HamaadBasin.
The data required for by the Center include natural resources statistics, forest dataas well as information on biodiversity.
The ability of the Center to provide training in environment statistics is limited todesertification and remote senescing but is deemed desirable to cooperate with theCenter for technical assistance and as a source of environment statistics.
69
United Nations, Economic and Social Commission for Western Asia (ESCWA)
The consultant discussed the environment statistics situation in ESCWA with Mr.Hosny Khordagui, the Chief of the Environmental Coordination Unit and Mr.Mohamed Al-Badrawy, the First Statistician. The discussion can be summarized asfollows:
1. The collection of environmental data from secondary sources facessome problems such as lack of sufficient documentation ofenvironmental data in the most of the countries. This requires technicaland financial capacities. And even if the data are available, thecredibility of the information is not guaranteed. The correspondinginformation and statistics need to be reviewed, including verification ofthe standardization, coding and classification used.
2. It is important to develop a core set of environmental indicators and tryto provide those on a regular basis.
3. It is important to specify the sources of the data.4. The training of statisticians is not feasible unless they have a
background in environmental science. It is therefore suggested toprovide training to both statisticians and technical staff in theenvironment agencies. In addition it is suggested to establish technicalexperts in the national statistic offices.
5. It is suggested to specify the data gaps and to clearly mention theimportance of creating an environmental information system.
6. Any training should start from the principles of environment statistics,including concepts and definitions.
In general the consultant finds it desirable to have a specialist in environmentstatistics base in the office of ESCWA to provide the essential expertise to theESCWA countries and to maintain communication with the specialists at the NSOs.The expert could also act as a reference person for environment statistics in the regionand be the focal point for environmental information, statistics, and experiencebetween ESCWA countries.
70
Plan Bleu Plan Blue
In 1975 in Barcelona, the Mediterranean coastal states adopted a MediterraneanAction plan (MAP) under the auspices of UNEP. The MAP consist of threecomponents:
1. Assessment of Mediterranean pollution.2. Integrated planning (socio-economic component).3. The Blue Plan (systemic and prospective studies)4. The Priority Action Programme (PAP).5. The institutional component, which covers all legal activities
concerning the implementation of the Convention for the protection ofthe Mediterranean Sea against pollution.
The Blue Plan is located in Sophia Antipolis in France. It has many tasks relatingto sustainable development indicators in the Mediterranean basin.
Here, the consultant concentrates on the activities of Blue Plan in environmentstatistics: After the initial assessment of the situation of environment statistics in theMediterranean countries and the specification of the priorities to be covered by a taskforce in this field, the Blue Plan began its work on environment activities.
The Mediterranean countries include five ESCWA countries: the Syrian ArabRepublic, Lebanon, Egypt, Palestine, and Jordan. The activities that take place as partof the Blue Plan are:
1. Training courses: six one-week training courses were conducted duringthe first project stage. The courses covered main fields of environmentstatistics like water, waste, and land use statistics. All lectures of thesecourses were held in both English and French. The consultant suggestsmaking use of this material in the ESCWA region.
2. Study tours for one or two employees from the NSOs to the moreadvanced institutions working in environment statistics, e.g. IFEN. TheDOS in Jordan is the only institution hosting study tours in the ArabMediterranean countries.
3. The Blue Plan developed a MS Access software for use as anenvironment statistics database. The software needs to be improvedand made user-friendlier. The consultant suggests making use of thissoftware after the adjustments have been made.
4. The Blue Plan experts visited the countries in six missions to completethe questionnaire on environment statistics and to explain statisticalmethods to the NSOs employees.
5. Three task force meetings took place in Sophia Antipolis and the taskforce has a yearly meeting to evaluate the situation of last year and toapprove the plan for the following year. Four Mediterranean countriesand three European countries were represented in these task forces.
6. The Blue Plan also provides some equipment such as PCs and softwareto the NSOs.
7. The Blue Plan furthermore arranged the translation of thequestionnaire into Arabic.
71
The Blue Plan project is the only project specializing in environment statistics.Huge numbers of documents and materials have been prepared in this field, despitethe fact that this type of statistics has only recently been initiated in the Mediterraneancountries.
The first stage of the Blue Plan is nearly completed and a meeting will take placein Turkey by the end of 2002.
In the second stage additional activities will be included and regional training willbe organized.
The consultant discussed the opportunity with the Director of Blue Plan tocooperate with UNSD and ESCWA with respect to the project component inenvironment statistics in ESCWA. The proposal was appreciated and Blue Plan willcooperate within the five countries, which are both members of ESCWA as well asthe Mediterranean countries. He will also provide any help such as available materialson environmental issues to UNSD. The consultant advises to make use of theavailable materials prepared by Blue Plan to date.
The Blue Plan also collects detailed data from the Mediterranean countriesrelating to water, land, waste, and other environment statistics. These data could beused as a starting point for to the production of an environmental compendium forESCWA countries.
The consultant proposes that UNSD may review very closely the extensive workconducted by the Blue Plan project to define potential areas for collaboration,strategies to build on the results, and to further facilitate the development ofenvironment statistics.
72
Annex 1
Names and addresses of contact persons
Name Country Title AddressDr. YahiaAwaidah
Syria Director ofEnvironmentalManagementDirectorate
Ministry of State forEnvironmental AffairsTel oo963 113321902/3330510: [email protected]
Ms. Reem Abed -Rabboh
Syria Director of waterResourcesManagementDepartment
Ministry of State forEnvironmental AffairsTel oo963 11 3321902/333051e-mail [email protected]
Mr. Ihsan Amer Syria Director of theDepartment ofIndustrial andEnvironmentstatistics
Central Bureau of StatisticsAbu RumanehTel 00963 11 333 58 30 e-mail [email protected]
Dr. Hassan Habib ACSAD Syria Director ofMonitoring andCombatingDesertificationProject
The Arab Center For thestudies of Arid Zones and DryLands (ACSAD)Tel 00963 11 5743039 [email protected]
Mr. Abdul RahimLoulou
ACSAD Syria Agr. Engineer The arab Center For thestudies of Arid Zones and DryLands (ACSAD)Tel 00963 11 5743039 e-
Dr.Hosny K.Khordagui
(ESCWA)Lebanon
Chief ofEnvironmentalCoordination Unit
Economic and SocialCommission for Western Asia(ESCWA) Tel 009611 [email protected]
Mr. MohamedG.Al-Badrawy
(ESCWA)Lebanon
First Statistician Economic and SocialCommission for Western Asia(ESCWA) Tel 009611 [email protected]
Mr. Georges Akl Lebanon Project Manager Ministry of Environment Tel00961 4 522222 [email protected]
Ms. MaralTotalian
Lebanon Director General Central Administration ofStatistics Tel 00961 1 373160e-mail [email protected]
Mr. Ziad Abdallah Lebanon Statistician-ITManager
Central Administration ofStatistics Tel 00961 1 373163e-mail [email protected]
Mr. Jean Iotti France Project Director Plane bleu Tel 0033 492387130 [email protected]
Mr. Ashraf Badr Egypt Under secretary ofstate of CAPMASpresident office
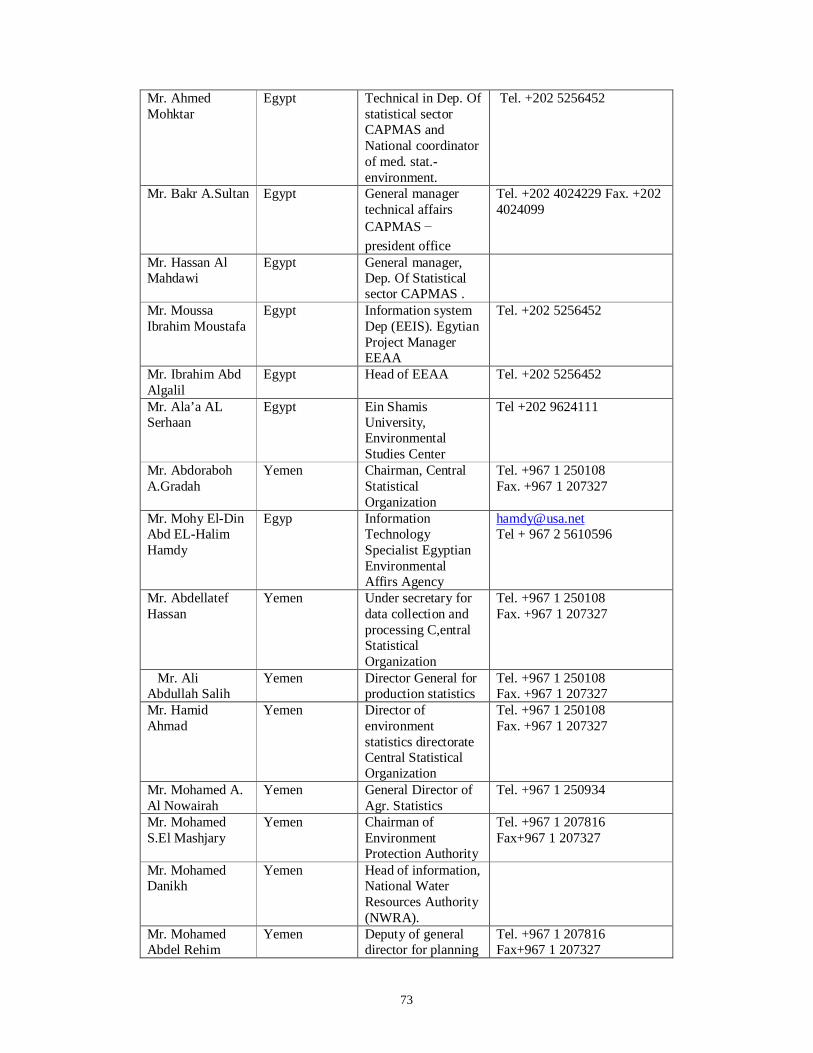
73
Mr. AhmedMohktar
Egypt Technical in Dep. Ofstatistical sectorCAPMAS andNational coordinatorof med. stat.-environment.
Tel. +202 5256452
Mr. Bakr A.Sultan Egypt General managertechnical affairsCAPMASpresident office
Tel. +202 4024229 Fax. +2024024099
Mr. Hassan AlMahdawi
Egypt General manager,Dep. Of Statisticalsector CAPMAS .
Mr. MoussaIbrahim Moustafa
Egypt Information systemDep (EEIS). EgytianProject ManagerEEAA
Tel. +202 5256452
Mr. Ibrahim AbdAlgalil
Egypt Head of EEAA Tel. +202 5256452
Mr. Ala’a ALSerhaan
Egypt Ein ShamisUniversity,EnvironmentalStudies Center
Tel +202 9624111
Mr. AbdorabohA.Gradah
Yemen Chairman, CentralStatisticalOrganization
Tel. +967 1 250108Fax. +967 1 207327
Mr. Mohy El-DinAbd EL-HalimHamdy
Egyp InformationTechnologySpecialist EgyptianEnvironmentalAffirs Agency
[email protected] + 967 2 5610596
Mr. AbdellatefHassan
Yemen Under secretary fordata collection andprocessing C,entralStatisticalOrganization
Tel. +967 1 250108Fax. +967 1 207327
Mr. AliAbdullah Salih
Yemen Director General forproduction statistics
Tel. +967 1 250108Fax. +967 1 207327
Mr. HamidAhmad
Yemen Director ofenvironmentstatistics directorateCentral StatisticalOrganization
Tel. +967 1 250108Fax. +967 1 207327
Mr. Mohamed A.Al Nowairah
Yemen General Director ofAgr. Statistics
Tel. +967 1 250934
Mr. MohamedS.El Mashjary
Yemen Chairman ofEnvironmentProtection Authority
Tel. +967 1 207816Fax+967 1 207327
Mr. MohamedDanikh
Yemen Head of information,National WaterResources Authority(NWRA).
Mr. MohamedAbdel Rehim
Yemen Deputy of generaldirector for planning
Tel. +967 1 207816Fax+967 1 207327

74
and information,EnvironmentProtection Authority
Mr. Ahmad ALI Yemen Head of range,Ministry ofAgriculture
Tel. +967 1 250934
Mr. Kamal Sabet CEDARE,Egypt
Executive director Tel. +202 4513921Fax + 202 4513918
Mr. Ahmed AbdelRehim
CEDARE,Egypt
GIS, remote sensingspecialist.
[email protected]. +202 4513921Fax + 202 4513918
Mr. HossamAllam
CEDARE,Egypt
Information systemspecialist
[email protected]. +202 4513921Fax + 202 4513918
Mr. MohannaA.AL-Mohanna.
Saudi Arabia Deputy GeneralDirector forStatistical Affairs
[email protected]. +966 1 4013058Fax +966 1 4050648
Mr. MoslehAhmadAlghammdi
Saudi Arabia Deputy of GeneralDirector ofEconomic Studiesand Statistics,Minstry ofAgriculture andIrrigation
[email protected] +966 1 4031193
Mr. AbdelhRahmaanAlghanam
Saudi Arabia Director ofEconomic Studiesand Statistics,Minstry ofAgriculture andIrrigation
[email protected] +966 1 403119
Mr. MohammedO.Al-Sakhan
Saudi Arabia G.Dir.Range andForestry Dep.
Tel. +966 1 1033702Fax +966 1 4033702
Mr. SameerJ.Ghazi
Saudi Arabia Director, NaturalResources GeneralDirectorateMeteorology andEnvironmentProtectionAdministration.
[email protected]. +966 2 6512312 ext 2644Fax +966 2 6517832
Mr. Abd AlazizAL-Issa
Saudi Arabia Director general ofMeteorology andEnvironmentProtectionAdministration.
Tel. +966 2 6512312 ext 2644Fax +966 2 6517832
Mr. Adnan Kaf Saudi Arabia Specialist on airquality Meteorologyand EnvironmentProtectionAdministration.
Tel. +966 2 6512312 ext 2644Fax +966 2 6517832
Mr. Sabir Said Al-Harbi
Oman Director General ofEconomic StatisticsMinistry of NationalEconomy.
[email protected] + 968 604920Fax +968 698909
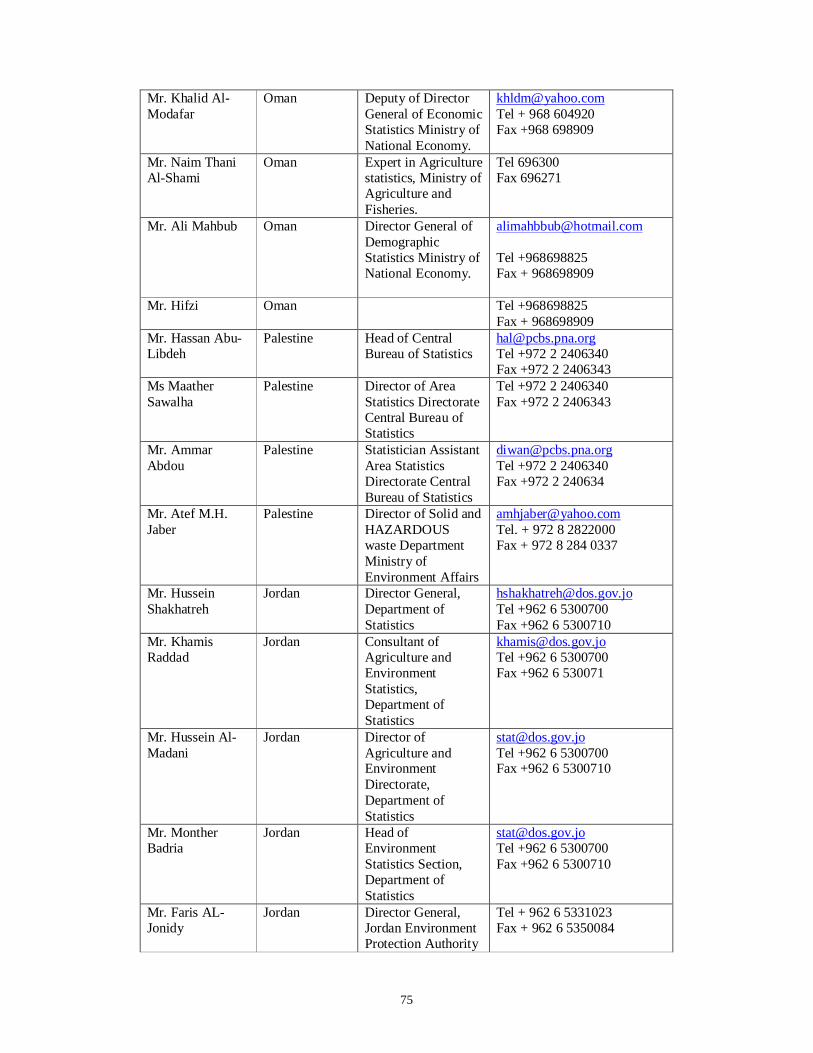
75
Mr. Khalid Al-Modafar
Oman Deputy of DirectorGeneral of EconomicStatistics Ministry ofNational Economy.
[email protected] + 968 604920Fax +968 698909
Mr. Naim ThaniAl-Shami
Oman Expert in Agriculturestatistics, Ministry ofAgriculture andFisheries.
Tel 696300Fax 696271
Mr. Ali Mahbub Oman Director General ofDemographicStatistics Ministry ofNational Economy.
Tel +968698825Fax + 968698909
Mr. Hifzi Oman Tel +968698825Fax + 968698909
Mr. Hassan Abu-Libdeh
Palestine Head of CentralBureau of Statistics
[email protected] +972 2 2406340Fax +972 2 2406343
Ms MaatherSawalha
Palestine Director of AreaStatistics DirectorateCentral Bureau ofStatistics
Tel +972 2 2406340Fax +972 2 2406343
Mr. AmmarAbdou
Palestine Statistician AssistantArea StatisticsDirectorate CentralBureau of Statistics
[email protected] +972 2 2406340Fax +972 2 240634
Mr. Atef M.H.Jaber
Palestine Director of Solid andHAZARDOUSwaste DepartmentMinistry ofEnvironment Affairs
[email protected]. + 972 8 2822000Fax + 972 8 284 0337
Mr. HusseinShakhatreh
Jordan Director General,Department ofStatistics
[email protected] +962 6 5300700Fax +962 6 5300710
Mr. KhamisRaddad
Jordan Consultant ofAgriculture andEnvironmentStatistics,Department ofStatistics
[email protected] +962 6 5300700Fax +962 6 530071
Mr. Hussein Al-Madani
Jordan Director ofAgriculture andEnvironmentDirectorate,Department ofStatistics
[email protected] +962 6 5300700Fax +962 6 5300710
Mr. MontherBadria
Jordan Head ofEnvironmentStatistics Section,Department ofStatistics
[email protected] +962 6 5300700Fax +962 6 5300710
Mr. Faris AL-Jonidy
Jordan Director General,Jordan EnvironmentProtection Authority
Tel + 962 6 5331023Fax + 962 6 5350084
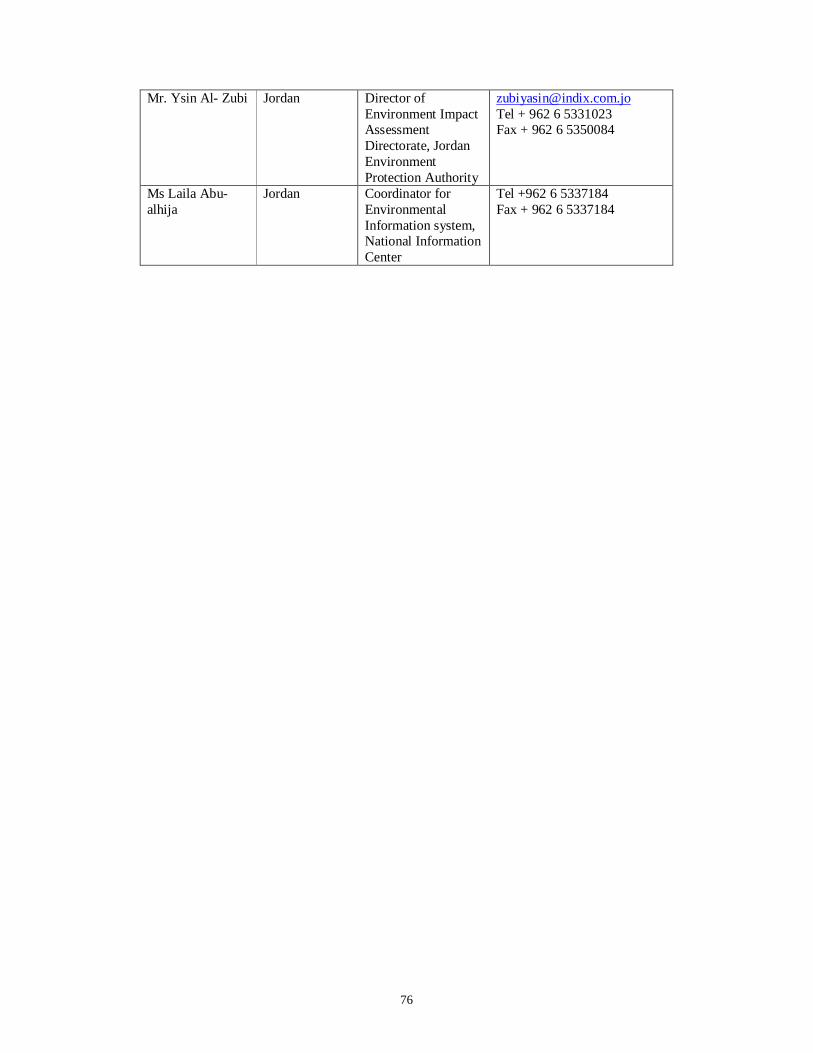
76
Mr. Ysin Al- Zubi Jordan Director ofEnvironment ImpactAssessmentDirectorate, JordanEnvironmentProtection Authority
[email protected] + 962 6 5331023Fax + 962 6 5350084
Ms Laila Abu-alhija
Jordan Coordinator forEnvironmentalInformation system,National InformationCenter
Tel +962 6 5337184Fax + 962 6 5337184
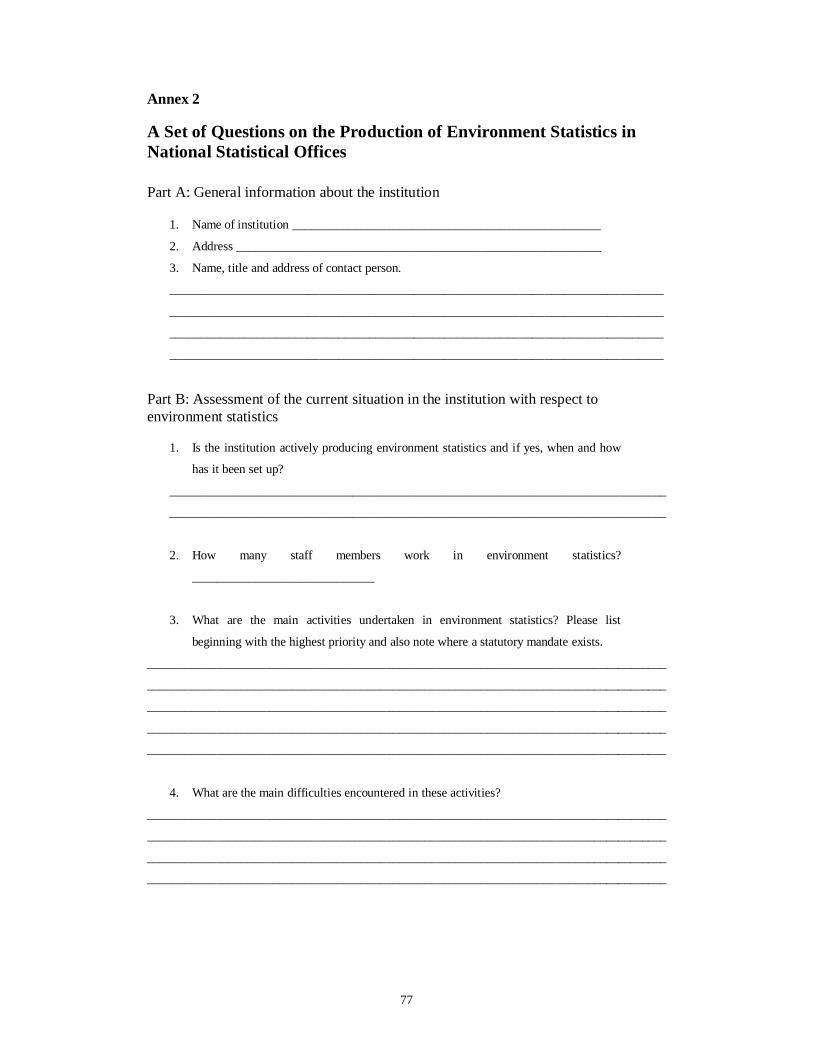
77
Annex 2
A Set of Questions on the Production of Environment Statistics inNational Statistical Offices
Part A: General information about the institution
1. Name of institution _________________________________________________
2. Address __________________________________________________________
3. Name, title and address of contact person.
_______________________________________________________________________________
_______________________________________________________________________________
_______________________________________________________________________________
_______________________________________________________________________________
Part B: Assessment of the current situation in the institution with respect toenvironment statistics
1. Is the institution actively producing environment statistics and if yes, when and how
has it been set up?
_______________________________________________________________________________
_______________________________________________________________________________
2. How many staff members work in environment statistics?
_____________________________
3. What are the main activities undertaken in environment statistics? Please list
beginning with the highest priority and also note where a statutory mandate exists.
___________________________________________________________________________________
___________________________________________________________________________________
___________________________________________________________________________________
___________________________________________________________________________________
___________________________________________________________________________________
4. What are the main difficulties encountered in these activities?
___________________________________________________________________________________
___________________________________________________________________________________
___________________________________________________________________________________
___________________________________________________________________________________

78
5. If the institution is conducting or planning to conduct [when?] data collection in
environmentally relevant fields, please describe these activities in terms of type
[surveys in specific fields of environment statistics, environment statistics integrated
in other surveys such as census etc., other], coverage [national, regional, urban,
local, other], frequency [annual, ad-hoc, other], and which national or international
classifications, definitions and methodologies are used?
___________________________________________________________________________________
___________________________________________________________________________________
___________________________________________________________________________________
6. If environmental data are compiled from various institutions, what are the major data
sources?
___________________________________________________________________________________
___________________________________________________________________________________
___________________________________________________________________________________
___________________________________________________________________________________
___________________________________________________________________________________
7. What are the outputs produced in environment statistics? Please list all publications
such as statistical yearbooks, environment statistics compendia, technical reports, ad-
hoc studies etc.
___________________________________________________________________________________
___________________________________________________________________________________
___________________________________________________________________________________
___________________________________________________________________________________
8. Which are the main institutions involved in the production environment statistics and
data [e.g. Ministry of Environment, Agriculture etc.] and describe the type of
cooperation [Regular meetings, joint projects, ad-hoc collaboration, etc.]?
___________________________________________________________________________________
___________________________________________________________________________________
___________________________________________________________________________________
___________________________________________________________________________________
9. Describe the role of the different institutions involved in the collection, analysis and
dissemination of environmental information? [Which is the lead institution in each
domain? Which institution is responsible for the compilation of environmental data
to international questionnaires? etc.]
___________________________________________________________________________________
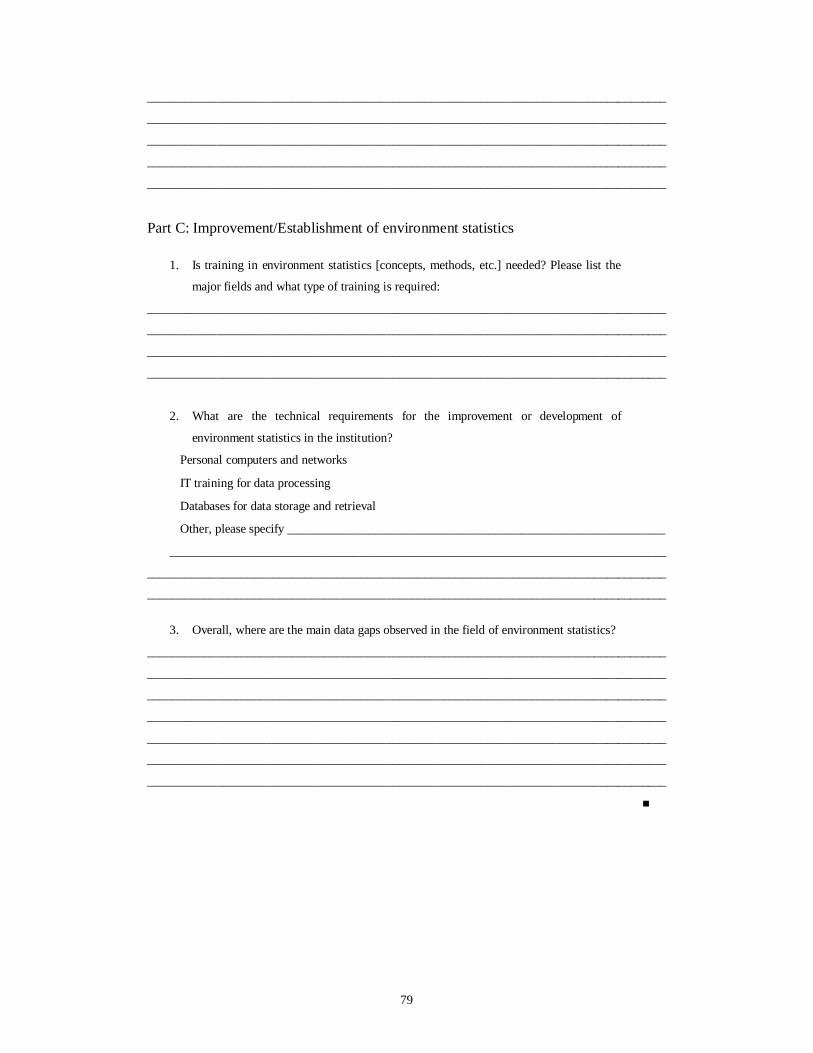
79
___________________________________________________________________________________
___________________________________________________________________________________
___________________________________________________________________________________
___________________________________________________________________________________
___________________________________________________________________________________
Part C: Improvement/Establishment of environment statistics
1. Is training in environment statistics [concepts, methods, etc.] needed? Please list the
major fields and what type of training is required:
___________________________________________________________________________________
___________________________________________________________________________________
___________________________________________________________________________________
___________________________________________________________________________________
2. What are the technical requirements for the improvement or development of
environment statistics in the institution?
Personal computers and networks
IT training for data processing
Databases for data storage and retrieval
Other, please specify ____________________________________________________________
_______________________________________________________________________________
___________________________________________________________________________________
___________________________________________________________________________________
3. Overall, where are the main data gaps observed in the field of environment statistics?
___________________________________________________________________________________
___________________________________________________________________________________
___________________________________________________________________________________
___________________________________________________________________________________
___________________________________________________________________________________
___________________________________________________________________________________
___________________________________________________________________________________
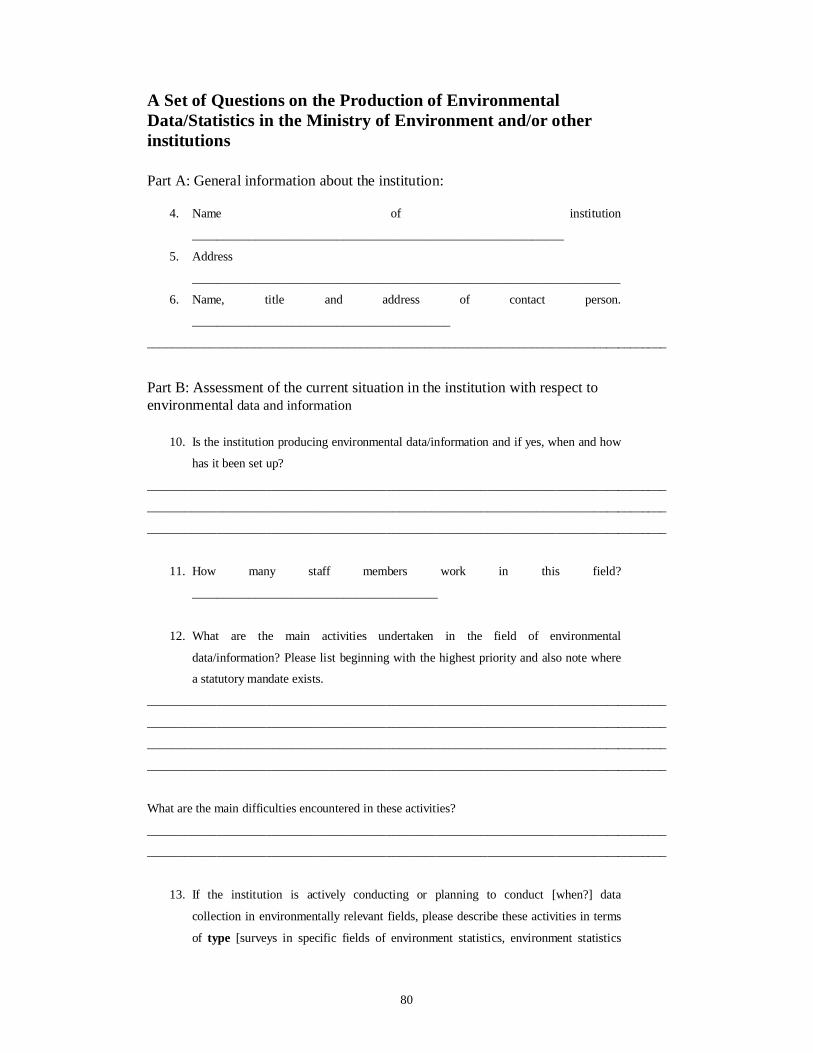
80
A Set of Questions on the Production of EnvironmentalData/Statistics in the Ministry of Environment and/or otherinstitutions
Part A: General information about the institution:
4. Name of institution
___________________________________________________________
5. Address
____________________________________________________________________
6. Name, title and address of contact person.
_________________________________________
___________________________________________________________________________________
Part B: Assessment of the current situation in the institution with respect toenvironmental data and information
10. Is the institution producing environmental data/information and if yes, when and how
has it been set up?
___________________________________________________________________________________
___________________________________________________________________________________
___________________________________________________________________________________
11. How many staff members work in this field?
_______________________________________
12. What are the main activities undertaken in the field of environmental
data/information? Please list beginning with the highest priority and also note where
a statutory mandate exists.
___________________________________________________________________________________
___________________________________________________________________________________
___________________________________________________________________________________
___________________________________________________________________________________
What are the main difficulties encountered in these activities?
___________________________________________________________________________________
___________________________________________________________________________________
13. If the institution is actively conducting or planning to conduct [when?] data
collection in environmentally relevant fields, please describe these activities in terms
of type [surveys in specific fields of environment statistics, environment statistics

81
integrated in other surveys such as census etc., other], coverage [national, regional,
urban, local, other], frequency [annual, ad-hoc, other], and which national or
international classifications, definitions and methodologies are used?
___________________________________________________________________________________
___________________________________________________________________________________
___________________________________________________________________________________
___________________________________________________________________________________
___________________________________________________________________________________
14. If environmental data are compiled from various institutions, what are the major data
sources?
___________________________________________________________________________________
___________________________________________________________________________________
___________________________________________________________________________________
___________________________________________________________________________________
___________________________________________________________________________________
15. What are the outputs produced with respect to environmental data/information?
Please list all publications such as state of the environment report, environmental
compendia, technical reports, ad-hoc studies, etc.
___________________________________________________________________________________
___________________________________________________________________________________
___________________________________________________________________________________
___________________________________________________________________________________
16. Which are the main institutions involved in the production of environmental
data/information [e.g. National Statistical Office, Ministry of Agriculture, Natural
Resources, etc.] and describe the type of cooperation [Regular meetings, joint
projects, ad-hoc collaboration, etc.]?
___________________________________________________________________________________
___________________________________________________________________________________
___________________________________________________________________________________
___________________________________________________________________________________
17. Describe the role of the different institutions involved in the collection, analysis and
dissemination of environmental information? [Which is the lead institution in each

82
domain? Which institution is responsible for the compilation of environmental data
to international questionnaires and/or conventions? etc.]
___________________________________________________________________________________
___________________________________________________________________________________
___________________________________________________________________________________
___________________________________________________________________________________
___________________________________________________________________________________
___________________________________________________________________________________
___________________________________________________________________________________
Part C: Improvement/Establishment of environment statistics
4. Is training in the field of environmental data/information [concepts, methods, etc.]
needed? Please list the major fields and what type of training is required:
___________________________________________________________________________________
___________________________________________________________________________________
___________________________________________________________________________________
___________________________________________________________________________________
5. What are the technical requirements for the improvement or development of
environmental data/information in the institution?
Personal computers and networks
IT training for data processing
Databases for data storage and retrieval
Other, please specify ____________________________________________________________
_______________________________________________________________________________
Part D: Users of environmental data
1. Please, specify the major sources of environmental data your institution is using.
___________________________________________________________________________________
___________________________________________________________________________________
___________________________________________________________________________________
___________________________________________________________________________________
2. Please comment on the quality of the data the institution uses. [Coverage, timeliness,
reliability etc.]
___________________________________________________________________________________
___________________________________________________________________________________
___________________________________________________________________________________
___________________________________________________________________________________

83
3. Overall, where are the main data gaps observed in the field of environmental
data/information?
___________________________________________________________________________________
___________________________________________________________________________________
___________________________________________________________________________________
___________________________________________________________________________________
___________________________________________________________________________________
4. Are there currently any projects, co-operations, etc. under way for the development
of environmental data? Please list the project title, participating institutions, scope of
the project, time frame, expected outcomes etc.
___________________________________________________________________________________
___________________________________________________________________________________
___________________________________________________________________________________
___________________________________________________________________________________
5. What recommendations does the institution make with regard to the improvement of
environmental data/information?
___________________________________________________________________________________
___________________________________________________________________________________
___________________________________________________________________________________
___________________________________________________________________________________
___________________________________________________________________________________
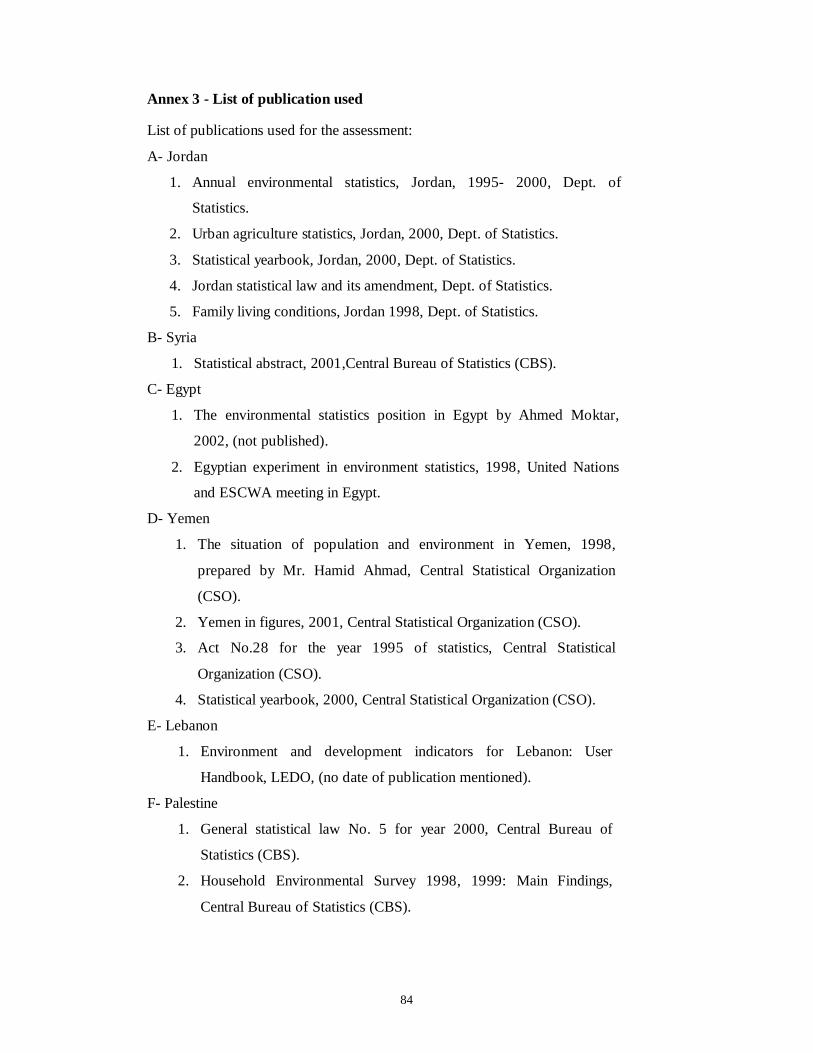
84
Annex 3 - List of publication used
List of publications used for the assessment:
A- Jordan
1. Annual environmental statistics, Jordan, 1995- 2000, Dept. of
Statistics.
2. Urban agriculture statistics, Jordan, 2000, Dept. of Statistics.
3. Statistical yearbook, Jordan, 2000, Dept. of Statistics.
4. Jordan statistical law and its amendment, Dept. of Statistics.
5. Family living conditions, Jordan 1998, Dept. of Statistics.
B- Syria
1. Statistical abstract, 2001,Central Bureau of Statistics (CBS).
C- Egypt
1. The environmental statistics position in Egypt by Ahmed Moktar,
2002, (not published).
2. Egyptian experiment in environment statistics, 1998, United Nations
and ESCWA meeting in Egypt.
D- Yemen
1. The situation of population and environment in Yemen, 1998,
prepared by Mr. Hamid Ahmad, Central Statistical Organization
(CSO).
2. Yemen in figures, 2001, Central Statistical Organization (CSO).
3. Act No.28 for the year 1995 of statistics, Central Statistical
Organization (CSO).
4. Statistical yearbook, 2000, Central Statistical Organization (CSO).
E- Lebanon
1. Environment and development indicators for Lebanon: User
Handbook, LEDO, (no date of publication mentioned).
F- Palestine
1. General statistical law No. 5 for year 2000, Central Bureau of
Statistics (CBS).
2. Household Environmental Survey 1998, 1999: Main Findings,
Central Bureau of Statistics (CBS).
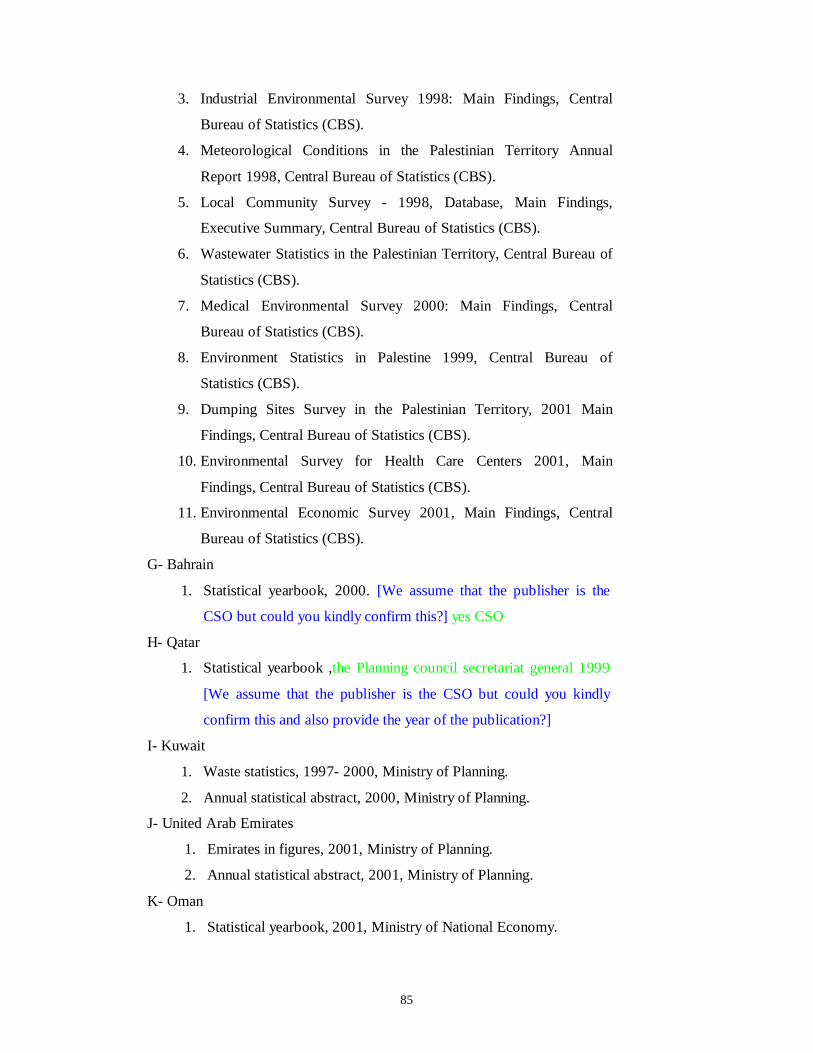
85
3. Industrial Environmental Survey 1998: Main Findings, Central
Bureau of Statistics (CBS).
4. Meteorological Conditions in the Palestinian Territory Annual
Report 1998, Central Bureau of Statistics (CBS).
5. Local Community Survey - 1998, Database, Main Findings,
Executive Summary, Central Bureau of Statistics (CBS).
6. Wastewater Statistics in the Palestinian Territory, Central Bureau of
Statistics (CBS).
7. Medical Environmental Survey 2000: Main Findings, Central
Bureau of Statistics (CBS).
8. Environment Statistics in Palestine 1999, Central Bureau of
Statistics (CBS).
9. Dumping Sites Survey in the Palestinian Territory, 2001 Main
Findings, Central Bureau of Statistics (CBS).
10. Environmental Survey for Health Care Centers 2001, Main
Findings, Central Bureau of Statistics (CBS).
11. Environmental Economic Survey 2001, Main Findings, Central
Bureau of Statistics (CBS).
G- Bahrain
1. Statistical yearbook, 2000. [We assume that the publisher is the
CSO but could you kindly confirm this?] yes CSO
H- Qatar
1. Statistical yearbook ,the Planning council secretariat general 1999
[We assume that the publisher is the CSO but could you kindly
confirm this and also provide the year of the publication?]
I- Kuwait
1. Waste statistics, 1997- 2000, Ministry of Planning.
2. Annual statistical abstract, 2000, Ministry of Planning.
J- United Arab Emirates
1. Emirates in figures, 2001, Ministry of Planning.
2. Annual statistical abstract, 2001, Ministry of Planning.
K- Oman
1. Statistical yearbook, 2001, Ministry of National Economy.
86
2. Questionnaire of environmental statistics survey, 2001, Ministry
of National Economy.
L- Iraq
1. Environmental Statistics and Ability to improve it, 1998, United
Nations and ESCWA meeting in Egypt.
M- Saudi Arabia
1. Statistical Yearbook 2000, Ministry of Planning Statistical Affairs.
2. Agriculture Statistical Year book 2001, Ministry of Agriculture and
Irrigation.
3. Environmental Protection Standards, Meteorology and Environmental
Protection Administration.
N- Blue Plan
1. A blue plan for the Mediterranean peoples from ideas to action,
1997 [Is this a published report and could you provide the
name of the publisher?]. it published by blue plan
2. A blue plan for the Mediterranean peoples from thought to
action [Is this a published report and could you provide the
name of the publisher?] it published by blue plan
3.
O- United Nations
1. Glossary of Environment Statistics, United Nations 1997, (Sales
No.E.96.XVII.12).
2. Manual: Questionnaire on transmission of information 1998, United
Nations Environment Programme (UNEP).
P- CEDARE
1. CEDARE, CD-Rom, 199???? [Could you kindly check the year?].
2. Chronicle CEDARE (6 articles), 1998- 2000.
3. Directory of Arab environmental periodicals [Could you kindly
provide the name of the publisher and the year of publication?].the
publisher is CEDARE, I don’t know the year because the document in
my house
Q- ACSAD
1. State of desertification in the Arab region and ways and means to deal
with it, 1996, ACSAD with support by the United Nations

87
Environment Programme (UNEP) and CAMRE [Could you kindly
provide the full name of this institution?]. Arab Center for the Studies
of Arid Zones and Dry land

88
List of Internet addresses:
Internet address Institution Country
www.dos.gov.jo. Dept. of Statistics Jordan
www.nic.gov.jo. National Information
Center
Jordan
www.uae.gov.ae/mop. Ministry of Planning United
Arab
Emirates
www.mop.gov.kw/mopwebsite. Ministry of Planning Kuwait
www.moe.gov.lb/ledo/index.htm. Ministry of Environment,
LEDO
Lebanon
www.bahrain.gov.bh. Government of Bahrain Bahrain
www.cedare.org.eg. CEDARE Egypt
www.cas.gov.lb. Central Administration for
Statistics
Lebanon
www.pcbs.org. Palestinian Central Bureau
of Statistics
Palestine
www.planbleu.org. Blue Plan France
www.escwa.org.lb. ESCWA Lebanon
www.eeaa.gov.eg. Egyptian Environmental
Affairs Agency
Egypt
www.moe.gov.lb. Ministry of Environment Lebanon
www.planning.gov.sa Ministry of Planning Saudi
Arabia
www.mepa.org.sa Meteorology and
Environment Protection
Administration
Saudi
Arabia
www.ncwcd.gov.sa National Commission for
Wildlife Conservation
Saudi
Arabia
www.swcc.gov.sa Saline Water Conversion
Corporation
Saudi
Arabia
www.moh.gov.sa Ministry of Health Saudi

89
Arabia
www.saso.org.sa Saudi Arabian Standards
Organization
Saudi
Arabia
www.omannet.com Oman National Information
net
Oman
90
Annex 4
Specific use of usual tools to produce environment statistics
IntroductionThe environment statistics is a comprehensive statistics, it covers most of statistical
fields, and it use all methods of data collection and data treatment, also it use some analysis
method to derive the technical coefficient and to build modules. In addition, it uses most of
statistical tools like GIS.
The main challenge is how to get data from different sources and to make it consistence
before aggregate it to make complete view in the studied field. The statistical methods can
solve part of this problem, but to come up with this problem too much work is still required.
If the reliability and reasonability of data were required the limitations of using
statistical methods should be taken into account.
Sources of dataDue to the huge size of data used in this activity no individual source can cover every
thing, so there are many sources of data like:
a- Official governmental source.
It includes the registers forms from different institution including annual and monthly
reports, in addition to the scientific reports and progress reports.
The institution also provides data by spreadsheet and some institutions have
information system. The huge quantity of data and information could be collected and
tabulated and used to produce statistical information from it.
As example of this source is ministry of water which provide data about
water supply, water distribution, water pricing, water use and precipitation quantity …ect.
b- N G O’s source
There are many agencies and volunteers’ work on environmental protection,
rehabilitation, education and other activities relate to this field. Some data was
available as a result of conducting there usual works, this data is not in the statistical
way, but the environment statistician can make use of this data.
As example of this source is Royal Society for Protection of Nature that they
take care about some preservative areas and they plant classification and they take
care about wild animal. As a result they provide information relate to bird
classification, statistician in biodiversity statistics could use this data.
c- Statistical Offices
91
The statistical offices have data and information in all fields like demographic,
agriculture and economic statistics. It is include information relate to the environment fields
like water, energy consumption of this sectors, land use …ect.
The information could be aggregate and re tabulate to produce new
environment tables. This source contributes on good part of environment statistics
with low cost, so any statistician should concentrate on this source before thinking
about conducting field survey to collect data.
d- Additional questions to the questionnaires applied at the statistical office
Some time the usual surveys, which conducted periodically by statistical offices,
provide data that could be used in environment statistics, but some extra information was
needed, to fill the gaps of environment data. So the addition of few question to the
questionnaire applied in this survey could be sufficient, which minimize the cost of data
collection and keep the results consistence with other results produced by statistical
offices.
An example of this approach is adding some question on economic enterprises survey
like water quantity consumed, quantity of energy used, quantity of waste produced and
method of disposal.
e- Specialist surveys
In addition to the sources mentioned above another source is available which
conceder as most expensive source, when the data not available in any source or the data not
reliable, and the information was needed the suggested method is to collect data from the
target population.
Many methods of data collection could be applied depending on type of data
and the domain and accuracy of the results. As example to know the situation of land
use and land covers you can use satellite image and agriculture surveys
f- Other sources of data
There are other sources like international agency that collect or produce data
relate to environment, and statistics of other countries like external trade, departure
and arrival statistics and water statistics. in addition the use of statistical analysis and
building modules and deriving technical coefficient also could be applied.
Basic principles to apply survey
There are variance methods to collect data by using survey. Also many purposes were
required for each survey .the variation between survey and another mainly due to objectives,
the survey design, the availability of time and resources and characteristic of the target
92
population. In general there are some basic principles should be taken into considerations for
any survey to achieve the goal. The main principles are:
1 – specify the objectives of the survey
For each study there is main objectives to be achieved, these objectives
should be reasonable, applicable, and fitted with the available resources and time
required. The data user wants as much data as he can get, but due to the limitation of
resources this demand should be adapted by current situation, so the main objectives
should be proportional with the capacity of the institution. In addition the objectives
should be clear, understandable consistence and veritable.
First you need to raise the question that are we really need to conduct a
survey, if the answer yes, you can specify the data needed by this items:
- What’s the data needed in pressing and has priority relate to other
data?
- Who own the study?
- What’s the budget deposit for this study?
- What’s the availability of human resources to conduct the study?
- What’s the level of accuracy for study results?
- What’s the dead line to issue the results?
2-Dummy tables
Depending on the objectives mentioned above the dummy tables should be prepared
before designing questionnaire. These dummy tables should include all items mentioned in
the objectives in details, if any objective not covers in the correct way in the dummy tables
and questionnaire it will create problems after collecting data.
3-Questionnaire design
The questionnaire should be fitted with the objectives mentioned above, each
objective should be has all questions related to it, the questionnaire design is a difficult job. It
needs proficiently and specialist on the field of study in addition to the high expertise on
statistics, it needs time and prepare many draft and make pilot survey to check each individual
question in the questionnaire, also it need to check the time needed to fill the questionnaire
and to check questions ordered in the questionnaire.
-Preparation of questions
The specification of questions should be mentioned in the questionnaire will be
done by using the dummy tables, the questionnaire also should include questions for other
purpose like identification questions and some questions to check the reply of main
questions.

93
-Questions order
The questionnaire should start with identification questions like address of the
establishment, then the key questions like activity of establishment then summary
questions for the main topics, after that you can have separate card for each topic contains
all question relate to the that topic.
-Questions words
The words of the questions should be clear, easy to understand, each word has one
meaning to avoid misunderstanding, each question should includes one informatics only.
-Questionnaire length
The questionnaire shouldn’t be too long because non-sampling errors will
increase, also non-response rate will increase, so the questionnaire should include only
the essential questions to reduce the time of filling the questionnaire. If the questionnaire
is long and all questions are important it is recommended to divide this questionnaire into
tow part and fill each part in one visit, the maximum time to fill the questionnaire should
be not exceed 40 minutes.
4- concepts and definitions
For each study there are concepts and terms used, this concepts should be fitted
with international definitions, or national definitions depending on the objectives of the
study. The questionnaire instruction manual should include definitions and clarifications
and some examples for all concepts and terms used in the study.
5- survey population
The target population subject to the survey should be clear, can reached by the
enumerators.
6-Frame and sampling units
The frame defined as a list or a map contains all sampling units. The frame
should be:
- Comprehensive covered all sampling units at the target population.
- Up to date.
- Homogenous, all sampling units from the same type; like enterprises
or farms or households.
- Avoided from duplication or missing of some sampling units.
The sampling units are all parts of the population and could be natural like
families or artificial like farms. These sampling units should be defined and free from any
interaction. Each sampling unit should have chance to drawn in the sample.
6-Sampling design
94
This subject will cover in details in the next section, in general the sampling
design should be efficient: the cost is minimum with high precision, accurate, the
sampling error at the minimum size. The sampling design should include these points:
- The technical capability of the working team and the software
available for this purpose. When every thing available you can apply
complex sample design with high efficiency but if some thing not
available you need to change the policy.
- The availability of finance and materials.
- The domains for information release; if the results will be published
at governorate level it needs more sampling units than when it will be
published at national level.
- The required time to issue the results.
- The level of accuracy.
- The objectives of the study.
- The expected size of non-response rate.
- Periodically of the survey.
7-Methods of data collection
There are many method of data collection like:
- Telephone.
- -Normal mail.
- -e-mail.
- - Interviewing the response.
- - Actual measurement.
The method of data collection depends on the nature of the population, the
availability of resources, and the level of accuracy. The instruction should be clear to all
enumerators to use the same method of data collection to avoid any bias.
8-training of enumerators and other field workers:
It is important to give a sufficient training to all employees by the person who
design the questionnaire (the same source give training to all workers to reduce non-
sampling errors). The training will include lectures and some practical at the office then
some practical at the field.
9-The time reference.
The time reference for each part of questionnaire should be clear and reasonable,
in addition the time reference for data collection and the dead line to issue the report also
should known in advance prior to start conducting the field work.
10-Pilot survey
95
It is essential to conduct pilot survey before starting of actual fieldwork. The
purpose of pilot survey is to examine the questionnaire design and the time needed to fill
the questionnaire and to check the understanding of the work by the field workers. In
general it is important to review the plan of the survey to avoid any unwanted problems.
11-Field work
The most critical and important step is the fieldwork. The good regulation of the
field work including daily and weakly plan is very important to succeed in the mission, it
is important also to reduce the non-response rate and to take care about quality control in
data collection, many methods could be applied like editing the filed questionnaire at the
field including spot check and apply post enumeration survey. The time of work field
always limited because the cost of this step is very high, so it needs incentive work by all
survey employees, finally the output of the survey mainly depend on this step, so it
should be under control of high position person of the survey team.
12-Data processing and data entry
This step includes questionnaire editing and data cleaning.
Data tabulation
Data entry and computer editing
Extraction of the survey results
13-Preparation of tabulation report
After extracting of results and tabulated it by using the adjusted dummy tables
prepared before. The tabulation report should include theoretical part that’s mention the
objectives and survey methodology, sampling design, method of data collection, and
summary of the results.
Then the tabulation report will include the tables classified by subject. The tables
should be clear, understandable, friendly to use by data users, and it should be in the good
form.
14-Analysis of results
The results mentioned in the tabulation report could be used by the person who is
familiar with the statistical tables, but the decision maker cant understand what’s behind
this results, so he can’t make any inference or take any decision, so it is important to
produce analytical report contain at least some descriptive analysis. By this report you
make more use of the survey results and you get good impressions from data users.
Sampling techniques applied in environment statistics The sampling design for environmental survey is similar to the sampling design of
corresponding survey; as a result of extensive of fields covered by environment statistics
the vast of samples design will apply, the sampling design required the expertise, updated
frame and clear objectives of the survey and the domains. The efficient sample design is
96
the design that provides high accuracy with the minimum cost and characterized by
simplicity, easy to deal with and applicable, in addition to flexibility and meet the survey
objectives.
In general the sample design used for environment purpose could be divided into:
a-Demographic sample design
The frame used in this type of surveys is a population frame prepared by using
population census data, the population census is conducting each ten years, so this frame
is updated each ten years which is along period so the sample design should take this
point inconsideration.
The frame used in this type of survey is frame of clusters each cluster contain
number of households, and the frame is stratified by geographic, socioeconomic, location
of the cluster and the size of locality that cluster belong to.
The main sampling design in this field is:
Stratified two-stage cluster design; the stratum represent one governorate or urban/ rural
at one governorate or some times each homogenous population. At the first stage the
drawing of clusters by pps in the systematic way were applied, and then after updating the
psu. The number of households was selected by systematic way in the second stage.
Self-weighting design; this design was applied in many survey in last but no more use of
this design in many countries. The characteristic of this design is that all sampling units
have the same weight to simplify the calculation of weights and result extraction, but this
design is inefficient design in terms of cost effective sample size.
The use of this design in environment statistics like indoor environment, household
water consumption, quantity of waste produced, method of disposal and energy
consumption …ect.
b-Economic enterprises
Due to the variation between the enterprises in the size and input used and output
produced and by product as a result of processing it is difficult to have one sufficient
sample design. So to simplify the problem the frame was divided into sub sectors by the
main activity of each enterprise, then each sub sector was divided into classes by the size
of each enterprise.
The sample design applied in this field is a stratified sample design. The complete
coverage for all big enterprises and enterprises with small number in the same activity,
then the remain of the enterprises were stratified by size, and each stratum was stratified
by location of the enterprise and the activity in details (isc 4digt) then the sample were
97
drawn from each stratum after ordering the enterprises by pps method in the systematic
way to improve the efficiency of the sample design by providing implicit stratification.
The frame of these enterprises could be acquired from enterprises census or from
license keeper like ministry of economy or ministry of municipality; also it could be as a
result of combination of different sources.
The use of this sample in environment statistics like estimation of quantity and value
of water use and quantity and value of energy and estimation of wastes including
hazardous waste, also it could be used to estimate sustainable indicators in this sector and
other environment indicators.
c-Agriculture sample design
It is divided into three main categories
Crop statistics
This activity covers land use in agriculture sector including the distribution of
land by type of crop grown, the irrigated and non irrigated area, source of irrigated water,
method of irrigation, quantity of water required per area unit (hectare), and it provides
data about usage of pesticide and fertilizers and other agriculture inputs which is related
to environment.
The main sample designs for this activity are:
To estimate planted area the stratified one stage sample design were applied.
To estimate average yield and inputs the stratified two stage sample design were
applied.
Also the successive sample design was applied
Livestock statistics
The stratified multistage sample design was applied and the psu was drawn by
pps way.
Agriculture economic statistics
The cluster sample design was applied.
Case study
Sample design for wastes of manufacture activity
1-The frame
The economic enterprises census was conducted in 1999 and covered all
economic enterprises in Jordan. It provides good benchmark and frame for this activity. It
includes information about paid capital, total revenue, and total number of employees for
each enterprise besides the identification data like the detail activity (isic6digit) and other
information needed to make the sample design.
98
2 – stratification
All enterprises stratified by total revenue into 3 classes, it classified by paid
capital, total employee, and it classified by activity 4 digit at the region level.
3 – sample design
All enterprises classified as big enterprises were surveyed by complete coverage.
(Revenue 200000 JD and above, or paid capital 200000JD and above, or number of
employees 20 person or more).
All enterprises with small number (less than 10 enterprises in the frame) at the
same stratum also were surveyed by complete coverage.
The enterprises remained were divided into middle and small size (middle when
revenue between 60 thousands to less than 200 thousands, and small when revenue less
than 60 thousands J.D.). After that in each stratum and in each size of enterprises the
sampling units were selected.
4-Sample allocation
The Nyman allocation was applied to allocate sampling units between stratums
after calculating the sample size depending on 1999 results, the coefficient of variation
(C.V.) is around 5% at region level for each activity isic 4 digits.
5-Method of drawing sample
The systematic method was applied after ordering all sampling units in each stratum
ascending by total revenue, to provide implicit stratification to increase the efficiency of
the design.
Use of statistical tools for statistical inferenceTools mentioned in spss program-Calculation of mean and use of this parameter in water use (ex. from industrial sector).-Independent – sample t test.-Paired –sample t test.-One- way ANOVA.-Linear Regression.-Non-parametric tests.
- Chi- square.- Kruskal –wallis H- Wilcoxon.- Mann-Whitney U.
Limitation of using statistical tools in environment statisticsDue to the privacy of environment statistics like risk on health and other issue
There are some limitations of use statistical tools like1- Some time the absolute figures is only required as indicators
instead of averages like water quality, which makes itdifficult in statistical tools because sampling, and non-sampling errors.
99
2- The environment statistics needs to take many factorsinconsideration to make judge about the situation and takedecision. Which needs to apply complex methods anddifficult to simplify the problem.
3- The statistician who work in the environment statisticsshould has good experience in many fields.
4- The surveys and other statistics of environment are veryexpensive compared with other types of statistics.
5- It is difficult to have adequate result for some parameterslike water requirements for each crop.
Conclusion and Recommendation1- the environment statistics is still new subject, so the statistical methodology
needs more improvement and to have special methodology for this subject.2- the environment statistics covers huge number of field, which means to
derive new methodology and adapt new statistical tool for this field.3- the main source of environment data is from official and other reports, which
make the work more difficult because the data some time not consistence,and the tables not prepared in the statistical way, so it needs to think aboutharmonize system for data collection, classification, and other thing to solvethis problems.
4- the environment statistics needs to derive some technical coefficient andbuild models relate to this field.
5- it is useful to suggest sampling designs relate to the environment statistics asmaster and could be use after doing the adjustment to take care about thecondition of each country.
6- it suggested having complete software to use in this field byimproving the program already prepared or to improve newprogram, which is friendly, use by users with minimumdifficulties and cover all statistical requirements like dataentry and statistical analysis besides the available option in alshams software.
100
Annex 5• Estimated Emission of Air Pollutants due to Gasoline Consumption
1996.• Number of Localities in Some West Bank Governorates by Method of
Waste Water Collection and Disposal (Dec. /1996) Solid WasteCollection Service in West Bank and Gaza Strip 1994. ·
• Monthly Mean Air Temperature (Co) by Station Location in thePalestinian Territories 1997
• Monthly Mean Air Temperature Maximum (Co) by Station Location inthe Palestinian Territories 1997
• Monthly Mean Air Minimum Temperature (Co) by Station Location inthe Palestinian Territories 1997
• Absolute Maximum Air Temperature (Co) by Station Location in thePalestinian Territories 1997
• Absolute Minimum Air Temperature (Co) by Station Location in thePalestinian Territories 1997
• Monthly Rainfall (mm) by Station Location in the PalestinianTerritories 1997
• Maximum Daily Rainfall (mm) by Station Location in the PalestinianTerritories 1997
• Number of Rainy Daiys by Station Location in the PalestinianTerritories 1997
• Monthly Evapouration (mm) by Station Location in the PalestinianTerritories 1997
• Monthly Mean Relative Humidity (%) by Station Location in thePalestinian Territories 1997
• Monthly Mean Wind Speed (Km/hour) by Station Location in thePalestinian Territories 1997
• Household Environmental Survey 1998:
• Percentage of Households by Region, the Means of Obtaining Water,and Average Monthly Household Consumption (m3) 1988
• Percentage of Households by Region and Uses of Domestic Water1998
• Percent Distribution of Households by Region and HouseholdEvaluation of Water Quality 1998
• Percent Distribution of Households by Region and the Solid WasteDisposal Part 1998
• Percent Distribution of Not Served Households by Region and MostImportant Disposal Method of Solid Wastes 1998
• Percent Distribution of Not Served Households by Region and SecondImportant Disposal Method of Solid Wastes 1998
101
• Percent Distribution of Households by Region and Periodicity of SolidWastes Collection by Local Authority 1998
• Percent Distribution of Households by Availability of a Close SolidWastes Collection Location 1998
• Percent Distribution of Households by Region and Most ImportantComponent of Solid Wastes 1998
• Percent of Households by Region and Second Most ImportantComponent of Solid Wastes 1998
• Percent Distribution of Households by Region and existence of aCesspit and Domestic Well 1998
• Percent Distribution of Households Having Cesspit and Well byRegion and Location of Cesspit and Well 1998
• Percent Distribution of Households Having Cesspit and Well byRegion and Distance Between Cesspit and Well (m) 1998
• Percent Distribution of Households Having Cesspit by Region andPeriodicity of Evacuation 1998
• Percentage Distribution of Households by Region and Waste WaterLeakage Outside the House 1998
• Percent Distribution of Households by Region and Exposure to Noise1998
• Percent Distribution of Households by Region and the Most ImportantSource of Noise 1998
• Percent Distribution of Households by Region and Exposure to Smell1998
• Percent Distribution of Households by Region and the Most ImportantSource of Smell 1998
• Percent Distribution of Households by Region and Exposure to Dust1998
• Percent Distribution of Households by Region and the Most ImportantSource of Dust 1998
• Percent Distribution of Households by Region and Exposure to Smoke1998
• Percent Distribution of Households by Region and the Most ImportantSource of Smoke 1998
• Industrial Environmental Survey 1998:
• Percentage Distribution of Industrial Establishments by Region andMain Source of Water 1998
• Percentage Distribution of the Industrial Establishments by EconomicActivity and Main Source of Water 1998
• Percentage Distribution of Industrial Establishments by Region andSolid Waste Treatment Before Disposal 1998

102
• Percentage Distribution of Industrial Establishments by EconomicActivity and Solid Waste Treatment Before Disposal 1998
• Percentage Distribution of Industrial Establishments by Solid WasteDisposal Part 1998
• Percentage Distribution of Industrial Establishments by EconomicActivity and Solid Waste Disposal Part 1998
• Percentage Distribution of Industrial Establishments Not Served byWaste Disposal by the First Method of Solid Waste Disposal 1998
• Percentage Distribution of Industrial Establishments Not Served byWaste Disposal by Economic Activity and First Disposal Method 1998
• Percentage Distribution of Industrial Establishments by Region andPeriodicity of Solid Waste Collection by the Local Authority 1998
• Percentage Distribution of Industrial Establishments by the EconomicActivity and Periodicity of Solid Waste Collection by the LocalAuthority 1998
• Percentage Distribution of Industrial Establishments by Region andMost Important Component of Solid Waste 1998
• Percentage Distribution of Industrial Establishments by EconomicActivity and the Most Important Component of Solid Waste 1998
• Average Monthly Quantity of the Most Important Component of SolidWaste in the Industrial Establishments by Economic Activity 1998
• Percentage Distribution of Industrial Establishments by Region andMain Method of Waste Water Disposal 1998
• Percentage Distribution of Industrial Establishments by EconomicActivity and Main Method of Waste Water Disposal _1998
• Percentage Distribution of the Industrial Establishments by Region andTreatment of Waste Water 1998
• Percentage Distribution of the Industrial Establishments by EconomicActivity and Treatment of Waste Water 1998.