Embed Size (px)
Citation preview

ASSESSMENT OF THE RELATIONSHIP BETWEEN WORKING
CAPITAL MANAGEMENT AND PROFITABILITY OF LISTED
COMPANIES IN DAR ES SALAAM STOCK EXCHANGE
ASSESSMENT OF THE RELATIONSHIP BETWEEN WORKING
CAPITAL MANAGEMENT AND PROFITABILITY OF LISTED
COMPANIES IN DAR ES SALAAM STOCK EXCHANGE
By
Ngianael Paul Minja
A Dissertation Submitted to MUDCC in Partial Fulfillment of the Requirements for
the Award of the Degree of Master of Business Administration in Corporate
Management (MBA-CM) of Mzumbe University.
2014
ii
CERTIFICATION
We, the undersigned, certify that we have read and hereby recommend for
acceptance by the Mzumbe University, a thesis entitled Assessment of the
Relationship Between Working Capital Management and Profitability of Listed
Companies in Dar es Salaam Stock Exchange, in partial fulfillment of the
requirements for award of the degree of Master of Business Administration in
Corporate Management (MBA-CM) of Mzumbe University
___________________________
Major Supervisor
___________________________
Internal Examiner
Accepted for the Board of …………………….
_______________________________________________________
CHAIRPERSON, FACULTY/DIRECTORATE BOARD

iii
DECLARATION
AND
COPYRIGHT
I, Ngianael Paul Minja, I do hereby declare that this dissertation t is my own
original work and it has not been presented and will not be presented to any other
University for a similar any other degree award.
Signature: _____________________________
Date: _________________________________
© 2014
This dissertation is a copyright material protected under the Berne Convention, the
Copyright Act 1999 and other international and national enactments, in that behalf,
on intellectual property. It may not be reproduced by any means in full or in part,
except for short extracts in fair dealings, for research or private study, critical
scholarly review or discourse with an acknowledgement, without the written
permission of Mzumbe University, on behalf of the author.

iv
ACKWOLEDGEMENT
To God are the glory, honor and praise for his abundant love, inspiration and good
health throughout my study period at Mzumbe University Dar es Salaam Campus
College.
I thank the lecturing staff of Mzumbe University especially Business Administration
Department, whose support over fourteen months provided me with the necessary
background skills to undertake and complete this study. A special thanks to my
supervisor, Ms. Sarah R. Mngoya of Mzumbe University for her guidance, insight
and encouragement in the writing and compilation of this thesis. Your invaluable
support and patience throughout this journey has been unreal and is appreciated from
the bottom of my heart.
This work would not have been complete without the support and effort from my
employer ELCT – ECD and employees of Keko Lutheran Parish I am grateful to
them. I am also grateful to Chairperson and Treasurer of Financial committee of
Keko Parish for their cooperation and support.
It is practically impossible to mention all those who took me and made efforts to help
me. As such collective thanks go to all those who have not been acknowledged by
name I also give the same weight as those whose name appears.
Lastly but not least, I would like to express my heartfelt gratitude to my close fellow
Masters students at Mzumbe University.
MAY OUR GOD BLESS YOU ALL!

v
DEDICATION
This dissertation work is dedicated to my lovely family of Paul C. Minja, for their
patience, contribution and support throughout the study period. I am appreciative of
their prayers, moral, financial and material support. I am wishing them a lot of
success and happiness throughout, the blessings of the Lord be with them always.
vi
LIST OF ABBREVIATIONS AND ACRONYMS
CACLR - Current ratio
CCC - Cash Conversion Cycle
DSE - Dar es Salaam Stock Exchange
ECD - Eastern and costal Diocese
ECD - Eastern and Costal Diocese
ELCT - Evangelism Lutheran church of Tanzania
ELCT - Evangelism Lutheran church of Tanzania
FPD - Focus Panel Discussion
ROA - Return on assets
ROIC/ROE - Return on equity
SPSS - Statistical Package for Social Sciences
URT - United Republic of Tanzania
WCM - Working capital management
vii
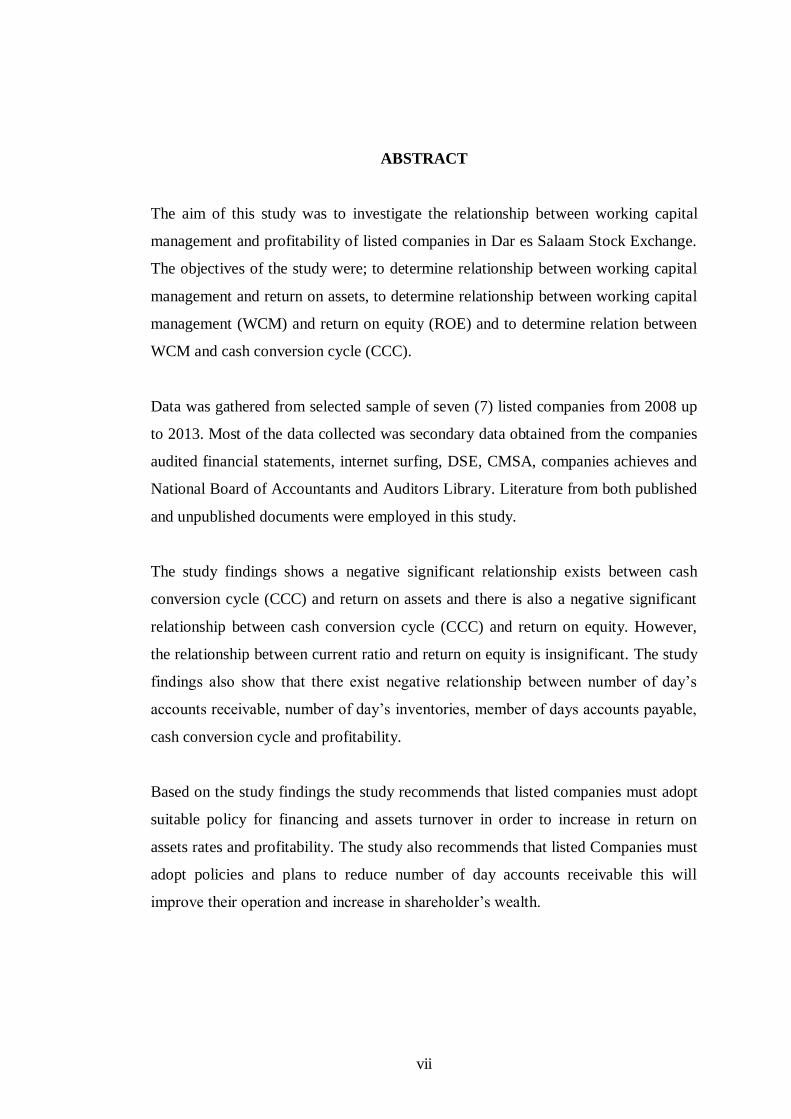
ABSTRACT
The aim of this study was to investigate the relationship between working capital
management and profitability of listed companies in Dar es Salaam Stock Exchange.
The objectives of the study were; to determine relationship between working capital
management and return on assets, to determine relationship between working capital
management (WCM) and return on equity (ROE) and to determine relation between
WCM and cash conversion cycle (CCC).
Data was gathered from selected sample of seven (7) listed companies from 2008 up
to 2013. Most of the data collected was secondary data obtained from the companies
audited financial statements, internet surfing, DSE, CMSA, companies achieves and
National Board of Accountants and Auditors Library. Literature from both published
and unpublished documents were employed in this study.
The study findings shows a negative significant relationship exists between cash
conversion cycle (CCC) and return on assets and there is also a negative significant
relationship between cash conversion cycle (CCC) and return on equity. However,
the relationship between current ratio and return on equity is insignificant. The study
findings also show that there exist negative relationship between number of day’s
accounts receivable, number of day’s inventories, member of days accounts payable,
cash conversion cycle and profitability.
Based on the study findings the study recommends that listed companies must adopt
suitable policy for financing and assets turnover in order to increase in return on
assets rates and profitability. The study also recommends that listed Companies must
adopt policies and plans to reduce number of day accounts receivable this will
improve their operation and increase in shareholder’s wealth.
viii
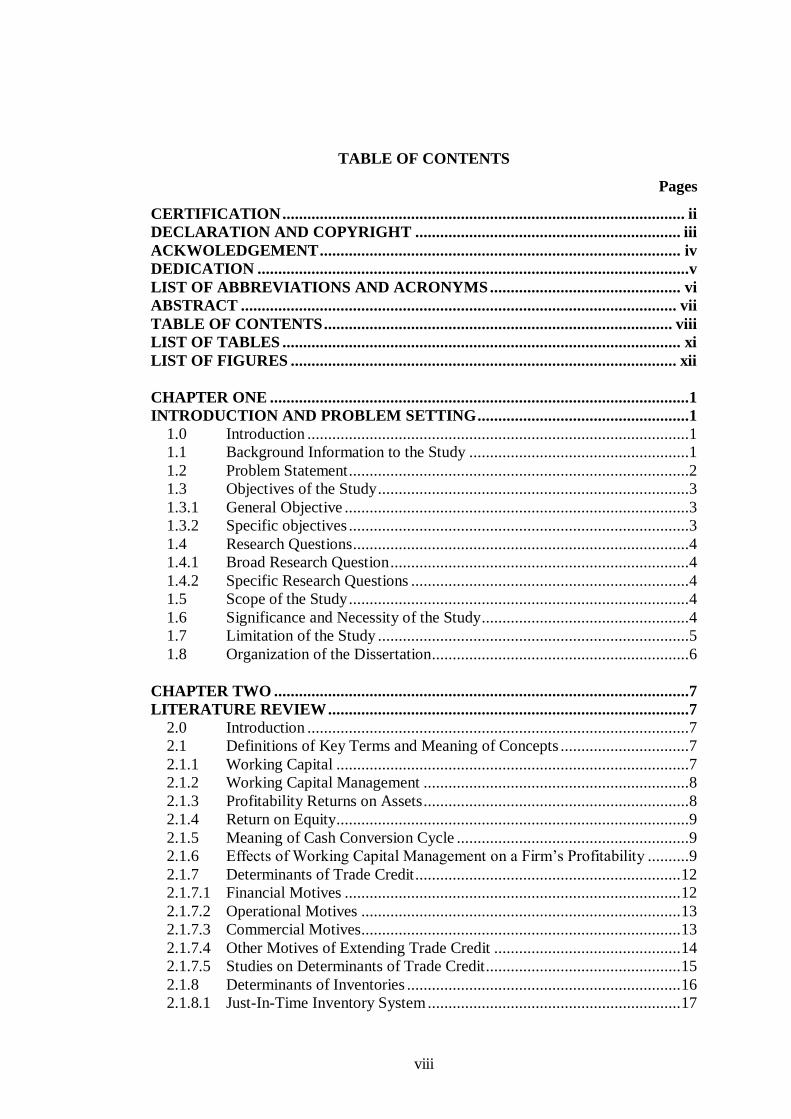
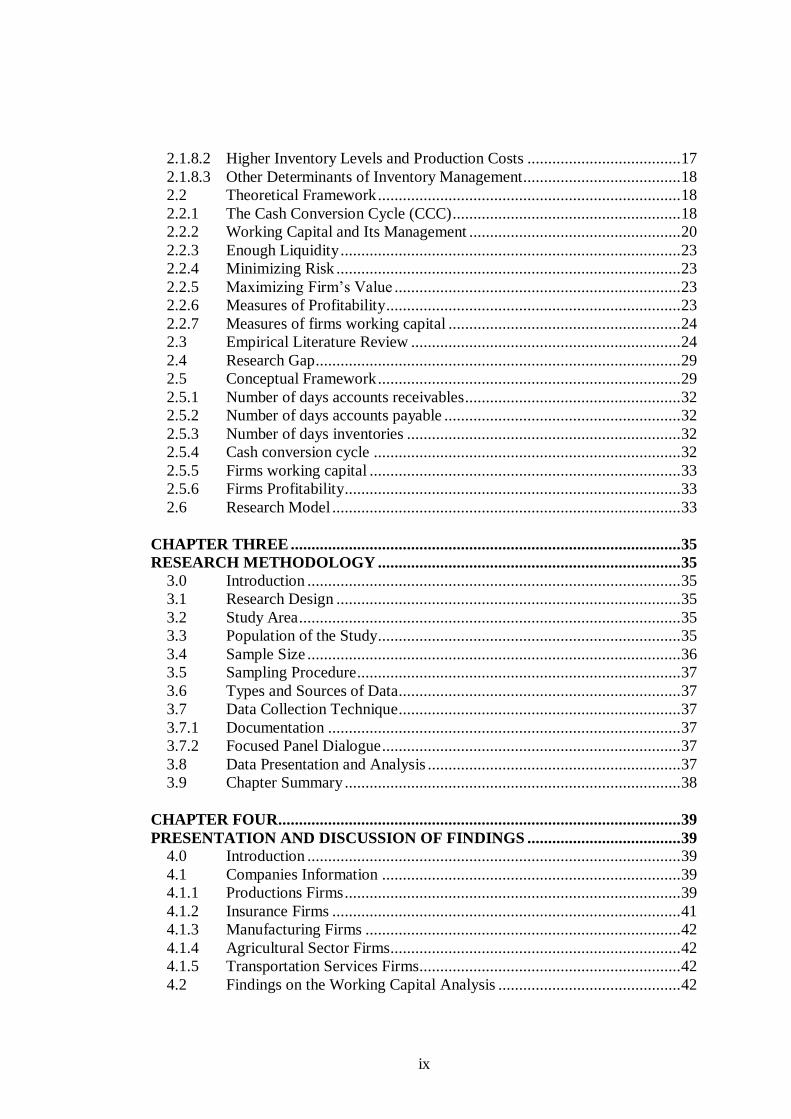
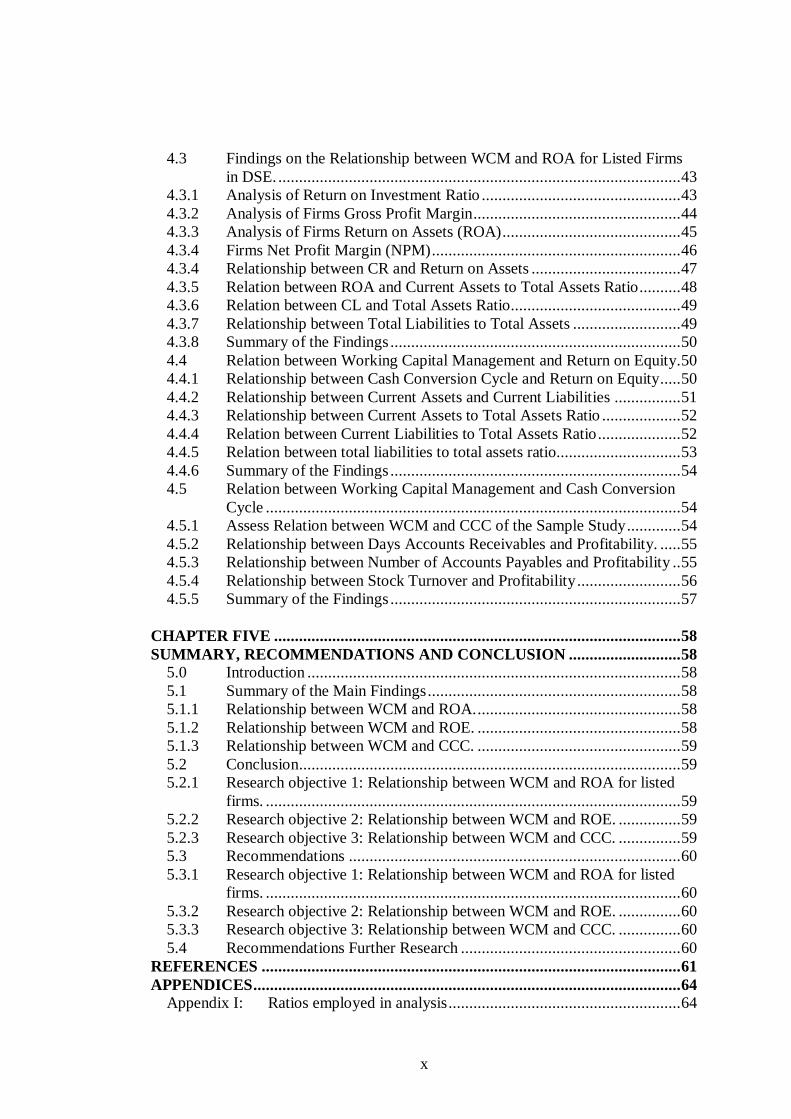
TABLE OF CONTENTS
Pages
CERTIFICATION ................................................................................................. ii DECLARATION AND COPYRIGHT ................................................................ iii
ACKWOLEDGEMENT ....................................................................................... iv DEDICATION ........................................................................................................v
LIST OF ABBREVIATIONS AND ACRONYMS .............................................. vi ABSTRACT ......................................................................................................... vii
TABLE OF CONTENTS .................................................................................... viii LIST OF TABLES ................................................................................................ xi
LIST OF FIGURES ............................................................................................. xii
CHAPTER ONE .....................................................................................................1 INTRODUCTION AND PROBLEM SETTING ...................................................1
1.0 Introduction ............................................................................................1 1.1 Background Information to the Study .....................................................1
1.2 Problem Statement ..................................................................................2 1.3 Objectives of the Study ...........................................................................3
1.3.1 General Objective ...................................................................................3 1.3.2 Specific objectives ..................................................................................3
1.4 Research Questions .................................................................................4 1.4.1 Broad Research Question ........................................................................4
1.4.2 Specific Research Questions ...................................................................4 1.5 Scope of the Study ..................................................................................4
1.6 Significance and Necessity of the Study ..................................................4 1.7 Limitation of the Study ...........................................................................5
1.8 Organization of the Dissertation ..............................................................6
CHAPTER TWO ....................................................................................................7 LITERATURE REVIEW .......................................................................................7
2.0 Introduction ............................................................................................7 2.1 Definitions of Key Terms and Meaning of Concepts ...............................7
2.1.1 Working Capital .....................................................................................7 2.1.2 Working Capital Management ................................................................8
2.1.3 Profitability Returns on Assets ................................................................8 2.1.4 Return on Equity .....................................................................................9
2.1.5 Meaning of Cash Conversion Cycle ........................................................9 2.1.6 Effects of Working Capital Management on a Firm’s Profitability ..........9
2.1.7 Determinants of Trade Credit ................................................................ 12 2.1.7.1 Financial Motives ................................................................................. 12
2.1.7.2 Operational Motives ............................................................................. 13 2.1.7.3 Commercial Motives............................................................................. 13
2.1.7.4 Other Motives of Extending Trade Credit ............................................. 14 2.1.7.5 Studies on Determinants of Trade Credit ............................................... 15
2.1.8 Determinants of Inventories .................................................................. 16 2.1.8.1 Just-In-Time Inventory System ............................................................. 17
ix
2.1.8.2 Higher Inventory Levels and Production Costs ..................................... 17
2.1.8.3 Other Determinants of Inventory Management...................................... 18 2.2 Theoretical Framework ......................................................................... 18
2.2.1 The Cash Conversion Cycle (CCC) ....................................................... 18 2.2.2 Working Capital and Its Management ................................................... 20
2.2.3 Enough Liquidity .................................................................................. 23 2.2.4 Minimizing Risk ................................................................................... 23
2.2.5 Maximizing Firm’s Value ..................................................................... 23 2.2.6 Measures of Profitability ....................................................................... 23
2.2.7 Measures of firms working capital ........................................................ 24 2.3 Empirical Literature Review ................................................................. 24
2.4 Research Gap ........................................................................................ 29 2.5 Conceptual Framework ......................................................................... 29
2.5.1 Number of days accounts receivables .................................................... 32 2.5.2 Number of days accounts payable ......................................................... 32
2.5.3 Number of days inventories .................................................................. 32 2.5.4 Cash conversion cycle .......................................................................... 32
2.5.5 Firms working capital ........................................................................... 33 2.5.6 Firms Profitability................................................................................. 33
2.6 Research Model .................................................................................... 33
CHAPTER THREE .............................................................................................. 35 RESEARCH METHODOLOGY ......................................................................... 35
3.0 Introduction .......................................................................................... 35 3.1 Research Design ................................................................................... 35
3.2 Study Area ............................................................................................ 35 3.3 Population of the Study ......................................................................... 35
3.4 Sample Size .......................................................................................... 36 3.5 Sampling Procedure .............................................................................. 37
3.6 Types and Sources of Data .................................................................... 37 3.7 Data Collection Technique .................................................................... 37
3.7.1 Documentation ..................................................................................... 37 3.7.2 Focused Panel Dialogue ........................................................................ 37
3.8 Data Presentation and Analysis ............................................................. 37 3.9 Chapter Summary ................................................................................. 38
CHAPTER FOUR................................................................................................. 39
PRESENTATION AND DISCUSSION OF FINDINGS ..................................... 39 4.0 Introduction .......................................................................................... 39
4.1 Companies Information ........................................................................ 39 4.1.1 Productions Firms ................................................................................. 39
4.1.2 Insurance Firms .................................................................................... 41 4.1.3 Manufacturing Firms ............................................................................ 42
4.1.4 Agricultural Sector Firms...................................................................... 42 4.1.5 Transportation Services Firms............................................................... 42
4.2 Findings on the Working Capital Analysis ............................................ 42
x
4.3 Findings on the Relationship between WCM and ROA for Listed Firms
in DSE. ................................................................................................. 43 4.3.1 Analysis of Return on Investment Ratio ................................................ 43
4.3.2 Analysis of Firms Gross Profit Margin .................................................. 44 4.3.3 Analysis of Firms Return on Assets (ROA) ........................................... 45
4.3.4 Firms Net Profit Margin (NPM) ............................................................ 46 4.3.4 Relationship between CR and Return on Assets .................................... 47
4.3.5 Relation between ROA and Current Assets to Total Assets Ratio .......... 48 4.3.6 Relation between CL and Total Assets Ratio......................................... 49
4.3.7 Relationship between Total Liabilities to Total Assets .......................... 49 4.3.8 Summary of the Findings ...................................................................... 50
4.4 Relation between Working Capital Management and Return on Equity. 50 4.4.1 Relationship between Cash Conversion Cycle and Return on Equity ..... 50
4.4.2 Relationship between Current Assets and Current Liabilities ................ 51 4.4.3 Relationship between Current Assets to Total Assets Ratio ................... 52
4.4.4 Relation between Current Liabilities to Total Assets Ratio .................... 52 4.4.5 Relation between total liabilities to total assets ratio.............................. 53
4.4.6 Summary of the Findings ...................................................................... 54 4.5 Relation between Working Capital Management and Cash Conversion
Cycle .................................................................................................... 54 4.5.1 Assess Relation between WCM and CCC of the Sample Study ............. 54
4.5.2 Relationship between Days Accounts Receivables and Profitability. ..... 55 4.5.3 Relationship between Number of Accounts Payables and Profitability .. 55
4.5.4 Relationship between Stock Turnover and Profitability ......................... 56 4.5.5 Summary of the Findings ...................................................................... 57
CHAPTER FIVE .................................................................................................. 58
SUMMARY, RECOMMENDATIONS AND CONCLUSION ........................... 58 5.0 Introduction .......................................................................................... 58
5.1 Summary of the Main Findings ............................................................. 58 5.1.1 Relationship between WCM and ROA. ................................................. 58
5.1.2 Relationship between WCM and ROE. ................................................. 58 5.1.3 Relationship between WCM and CCC. ................................................. 59
5.2 Conclusion............................................................................................ 59 5.2.1 Research objective 1: Relationship between WCM and ROA for listed
firms. .................................................................................................... 59 5.2.2 Research objective 2: Relationship between WCM and ROE. ............... 59
5.2.3 Research objective 3: Relationship between WCM and CCC. ............... 59 5.3 Recommendations ................................................................................ 60
5.3.1 Research objective 1: Relationship between WCM and ROA for listed
firms. .................................................................................................... 60
5.3.2 Research objective 2: Relationship between WCM and ROE. ............... 60 5.3.3 Research objective 3: Relationship between WCM and CCC. ............... 60
5.4 Recommendations Further Research ..................................................... 60
REFERENCES ..................................................................................................... 61
APPENDICES ....................................................................................................... 64 Appendix I: Ratios employed in analysis ........................................................ 64
xi
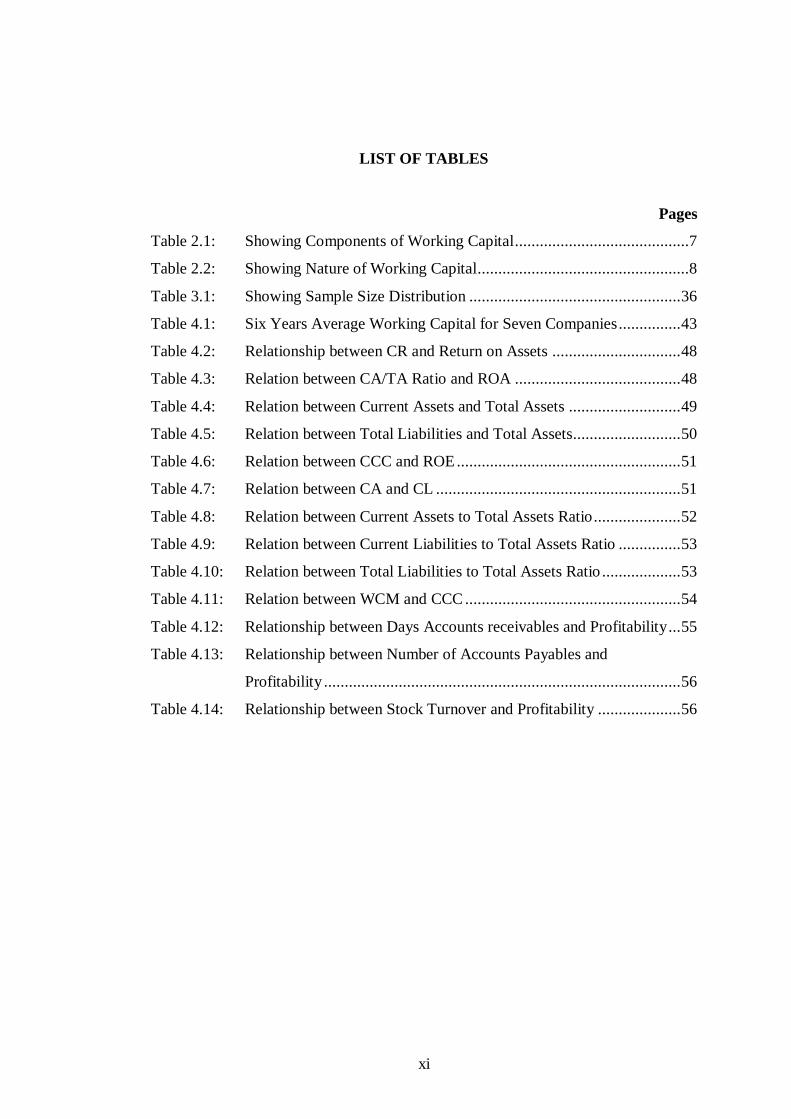
LIST OF TABLES
Pages
Table 2.1: Showing Components of Working Capital ..........................................7
Table 2.2: Showing Nature of Working Capital...................................................8
Table 3.1: Showing Sample Size Distribution ................................................... 36
Table 4.1: Six Years Average Working Capital for Seven Companies ............... 43
Table 4.2: Relationship between CR and Return on Assets ............................... 48
Table 4.3: Relation between CA/TA Ratio and ROA ........................................ 48
Table 4.4: Relation between Current Assets and Total Assets ........................... 49
Table 4.5: Relation between Total Liabilities and Total Assets.......................... 50
Table 4.6: Relation between CCC and ROE ...................................................... 51
Table 4.7: Relation between CA and CL ........................................................... 51
Table 4.8: Relation between Current Assets to Total Assets Ratio ..................... 52
Table 4.9: Relation between Current Liabilities to Total Assets Ratio ............... 53
Table 4.10: Relation between Total Liabilities to Total Assets Ratio ................... 53
Table 4.11: Relation between WCM and CCC .................................................... 54
Table 4.12: Relationship between Days Accounts receivables and Profitability ... 55
Table 4.13: Relationship between Number of Accounts Payables and
Profitability ...................................................................................... 56
Table 4.14: Relationship between Stock Turnover and Profitability .................... 56
xii
LIST OF FIGURES
Pages
Figure 2.1: The Cash Conversion Cycle (CCC).............................................. 19
Figure 2.2: A Conceptual Framework Model ................................................. 31
Figure 4.1: Bear Production in Tanzania ........................................................ 40
Figure 4.2: Bear Consumption Per Capita in Litters ....................................... 41
Figure 4.3: Analysis of Firms Return on Investment (ROI) ............................ 44
Figure 4.4: Gross Profit Margin ..................................................................... 45
Figure 4.5: Firms Return on Assets ................................................................ 46
Figure 4.6: Firms Net Profit Margin (NPM) ................................................... 47
1
CHAPTER ONE
INTRODUCTION AND PROBLEM SETTING
1.0 Introduction
This chapter is classified into eight sections. The first section airs the background to
the study. The second section focuses the problem statement. The third section
focuses on the study objectives. The fourth section exposes research questions. The
fifth section exposes the scope. The sixth section focuses on the significance of the
study. The seventh section exposes limitations of the study and the final section
exposes organization of the rest of this thesis.
1.1 Background Information to the Study
Capital is one of the most important trade factor and largest instrument for attracting
the profit. Each firm should have capital in order to access profit from its trade.
Importance of trade unit can be understood by their capital. Subject of capital, also
forms the fundamental discussion in the financial management and can be claimed
that all trade activities need to have capital. Capital refers to all financial resources
that trade unit consumes it and in this connection, financial management determines
the framework of the relationship between capital and firm. Generally, in all
organizations particularly in small size, a great part of organization capital is working
capital. Working capital includes all assets which companies use it in daily activities.
Working capital is an indicator for measuring the liquidity, which is defined as
adequacy of cash for doing firm’s obligations.
Firm with proper situation of liquidity, has enough cash for the payment of bills. On
the contrary, companies with improper situation cannot pay their bills on the maturity
date (Pike and Bill, 2006). Thus, working capital management is very important and
should be done on the basis of supply chain management. Working capital
management refers to determination of volume and combination of resources and
consumptions of working capital so that leads to increase in shareholder's wealth
(Neveu, 2001). Working capital management indicates policies and is adopting about
2
working capital in order to change types of current assets and financial resources.
Correct controlling the working capital management can affect importantly on the
firm’s profitability.
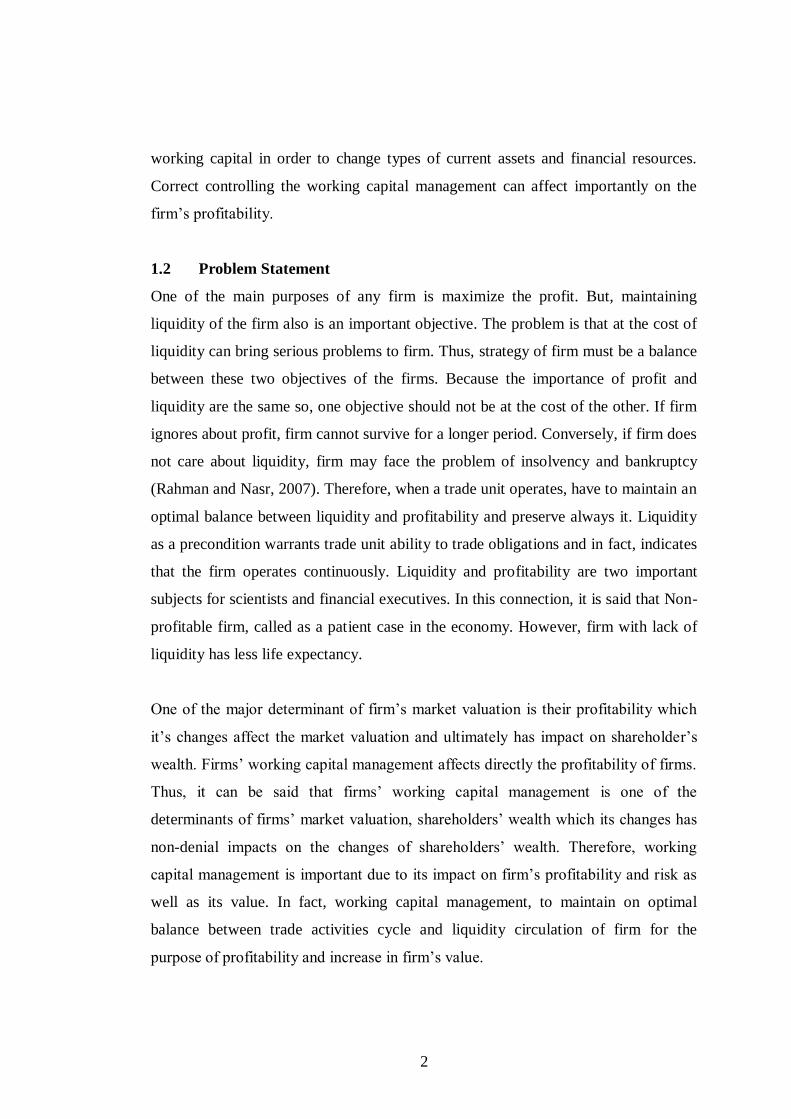
1.2 Problem Statement
One of the main purposes of any firm is maximize the profit. But, maintaining
liquidity of the firm also is an important objective. The problem is that at the cost of
liquidity can bring serious problems to firm. Thus, strategy of firm must be a balance
between these two objectives of the firms. Because the importance of profit and
liquidity are the same so, one objective should not be at the cost of the other. If firm
ignores about profit, firm cannot survive for a longer period. Conversely, if firm does
not care about liquidity, firm may face the problem of insolvency and bankruptcy
(Rahman and Nasr, 2007). Therefore, when a trade unit operates, have to maintain an
optimal balance between liquidity and profitability and preserve always it. Liquidity
as a precondition warrants trade unit ability to trade obligations and in fact, indicates
that the firm operates continuously. Liquidity and profitability are two important
subjects for scientists and financial executives. In this connection, it is said that Non-
profitable firm, called as a patient case in the economy. However, firm with lack of
liquidity has less life expectancy.
One of the major determinant of firm’s market valuation is their profitability which
it’s changes affect the market valuation and ultimately has impact on shareholder’s
wealth. Firms’ working capital management affects directly the profitability of firms.
Thus, it can be said that firms’ working capital management is one of the
determinants of firms’ market valuation, shareholders’ wealth which its changes has
non-denial impacts on the changes of shareholders’ wealth. Therefore, working
capital management is important due to its impact on firm’s profitability and risk as
well as its value. In fact, working capital management, to maintain on optimal
balance between trade activities cycle and liquidity circulation of firm for the
purpose of profitability and increase in firm’s value.
3
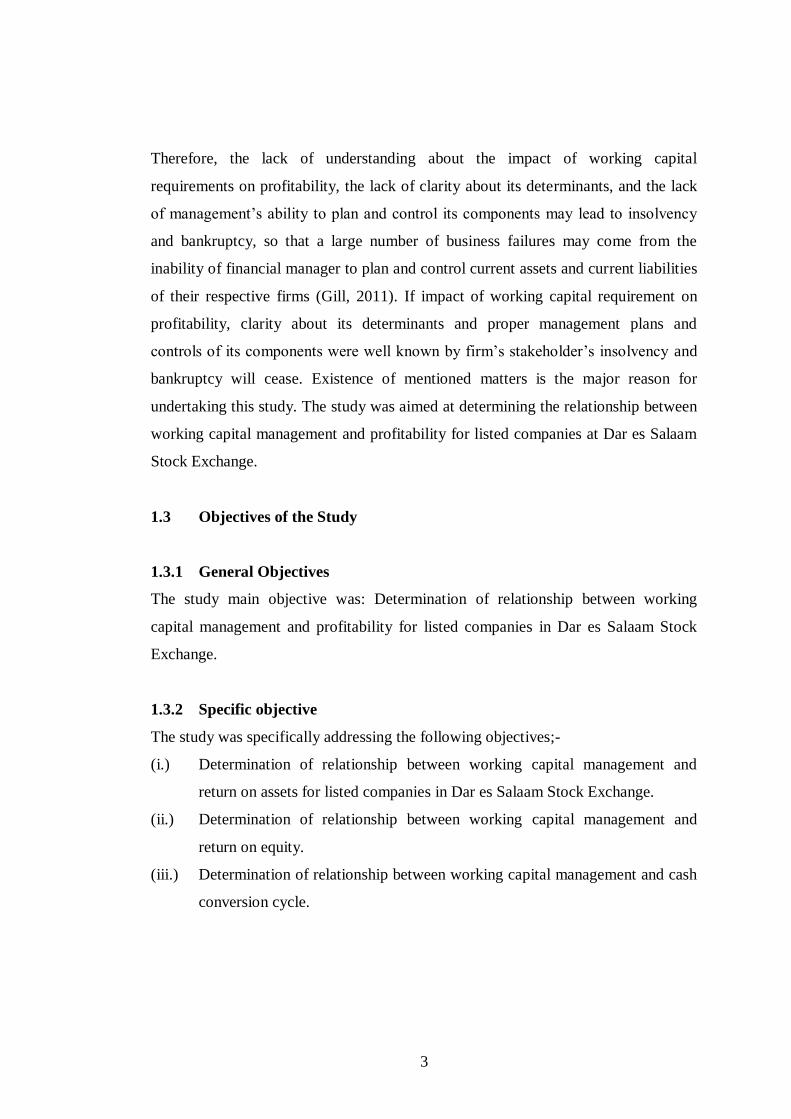
Therefore, the lack of understanding about the impact of working capital
requirements on profitability, the lack of clarity about its determinants, and the lack
of management’s ability to plan and control its components may lead to insolvency
and bankruptcy, so that a large number of business failures may come from the
inability of financial manager to plan and control current assets and current liabilities
of their respective firms (Gill, 2011). If impact of working capital requirement on
profitability, clarity about its determinants and proper management plans and
controls of its components were well known by firm’s stakeholder’s insolvency and
bankruptcy will cease. Existence of mentioned matters is the major reason for
undertaking this study. The study was aimed at determining the relationship between
working capital management and profitability for listed companies at Dar es Salaam
Stock Exchange.
1.3 Objectives of the Study
1.3.1 General Objectives
The study main objective was: Determination of relationship between working
capital management and profitability for listed companies in Dar es Salaam Stock
Exchange.
1.3.2 Specific objective
The study was specifically addressing the following objectives;-
(i.) Determination of relationship between working capital management and
return on assets for listed companies in Dar es Salaam Stock Exchange.
(ii.) Determination of relationship between working capital management and
return on equity.
(iii.) Determination of relationship between working capital management and cash
conversion cycle.
4
1.4 Research Questions
1.4.1 Broad Research Question
The general research question was: What is the relationship between working capital
management and profitability of listed companies in Dar es Salaam Stock Exchange?
1.4.2 Specific Research Questions
Specific research questions was the following;-
(i.) What is the relationship between working capital management and return on
assets for listed companies in Dar es Salaam Stock Exchange?
(ii.) What is the relationship between working capital management and return on
equity?
(iii.) What is the relationship between working capital management and cash
conversion cycle?
1.5 Scope of the Study
The study focus listed companies at Dar es Salaam Stock Exchange (DSE) in the
United Republic of Tanzania (URT). The main reason for this selection is the
accessibility to company’s annual reports. The data which was used for analysis
range from 2008 to 2013.
1.6 Significance and Necessity of the Study
Working capital management has been studied from 1995 to 2008 in other countries
by several researches including Soenen (2001), and Demirgunes (2008). General
results of these studies in different stock exchanges in America, Belgium, India,
Pakistan and Turkey are almost the same and indicate that there is significant
relationship between different variables of working capital management and
profitability. In respect of importance of working capital management and
inadequacy of researches on this subject in our century we will examine working
capital management in Dar es Salaam stock Exchange based on previous studies
which done in other countries, and also models or variables which were used in these
studies.
5
Working capital management is one of the parts which play vital role in structural
management of organization. So that, sometimes working capital management and
liquidity are resembled as a circulating blood in a trade unit. Management of working
capital is also known as a heart which pumps the blood to vessels of organization
(Kesseven, 2006). Examination of working capital management is particularly
important due to following reasons:
(i.) The study contributes to the existing body of literature on the relationship
between working capital management and company profitability based on
Tanzanian firms.
(ii.) The study is of useful to economists, financial analyst and firm’s
management to orient the efforts accordingly as the empirical evidence show
that deficiency of working capital is the main reason for their bankruptcy.
(iii.) Government has a need to study working capital management and company’s
profitability of an individual manufacturing companies or industry as a whole
for various reasons. Taxes, revenues, financial assistance, sanctioning,
subsidy, to a business organization or industry as well as price fixing policies,
frame outlines the key role of study for the Government lies in planning,
decision making and control process.
(iv.) The existence of inflationary situations and devaluation of money purchasing
power in Tanzania economy stimulated managers of trade units would rather
other types of properties than cash money. It caused managers face money
difficulties for the payment of their current debts.
1.7 Limitation of the Study
The research study was conducted based on secondary data of which some of them
was accessed from companies listed at Dar es Salaam Stock Exchange. The data
might be subjective due to unintended errors. But any typing and calculation errors
remain the weakness of the study or researcher should not be transmitted to the
management or owners of the analyzed companies.
Time and financial resources was a problem in whole process of conducting research
study since researcher is an employee. To overcome the funding challenge research
6
study was conducted in Dar es Salaam Tanzania so as to minimize cost and save
time.
1.8 Organization of the Dissertation
This dissertation is classified into five chapters. The first chapter discusses the
background information of the study, the statement of the problem, research
questions and objectives, scope of the study, significance and limitation of the study.
Chapter two focuses on the literature review and conceptual framework. The chapter
also includes definitions and meaning of variables and various concepts as used in
this study.
Chapter three presents the research methodology of the data and instruments for data
collections, ethical considerations and techniques employed in analyzing data in
order to attain objectives of the study.
Chapter four presents dissertation findings, analysis and discussion. Chapter five of
the dissertation presents summary of the main findings, recommendations and
conclusions. In this chapter recommendations for the prospects for further research
that may be of worth are put forward.
7
CHAPTER TWO
LITERATURE REVIEW
2.0 Introduction
This chapter brings out the literature review issues that have been explored and
studied on the two variables. The first variable is the working capital management
and the second variable is the profitability. The chapter also discusses the
relationship between the two variables.
2.1 Definitions of Key Terms and Meaning of Concepts
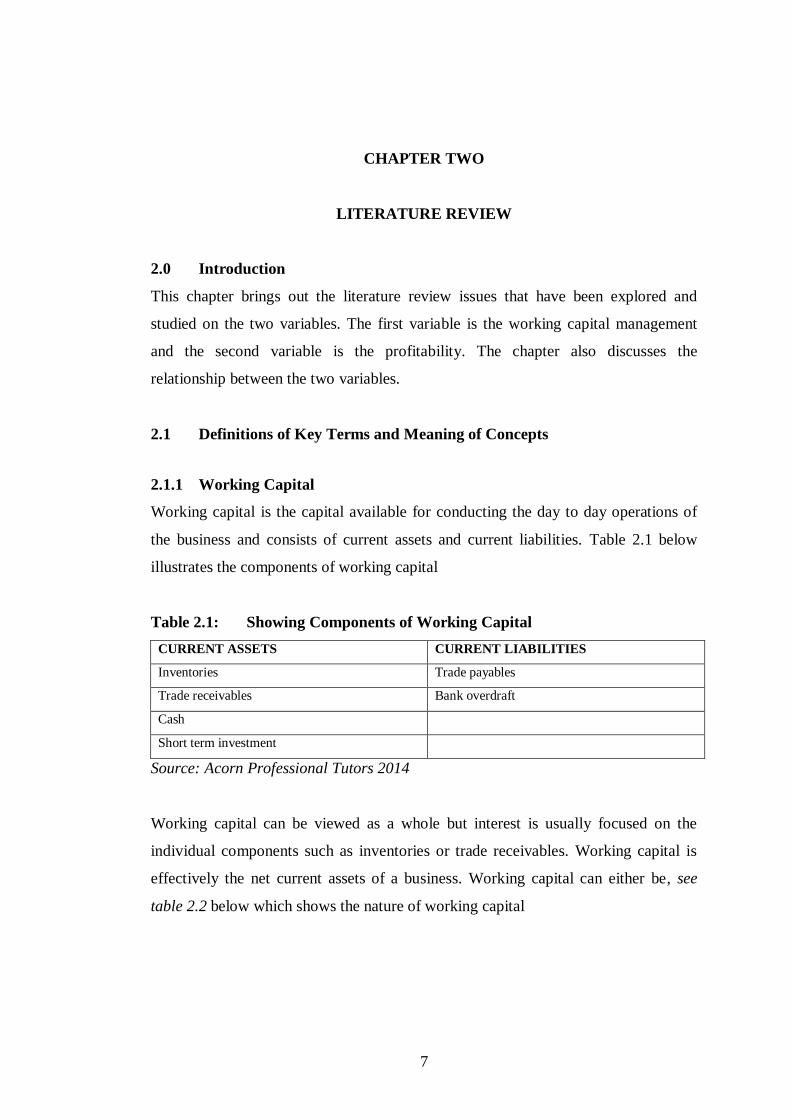
2.1.1 Working Capital
Working capital is the capital available for conducting the day to day operations of
the business and consists of current assets and current liabilities. Table 2.1 below
illustrates the components of working capital
Table 2.1: Showing Components of Working Capital
CURRENT ASSETS CURRENT LIABILITIES
Inventories Trade payables
Trade receivables Bank overdraft
Cash
Short term investment
Source: Acorn Professional Tutors 2014
Working capital can be viewed as a whole but interest is usually focused on the
individual components such as inventories or trade receivables. Working capital is
effectively the net current assets of a business. Working capital can either be, see
table 2.2 below which shows the nature of working capital
8
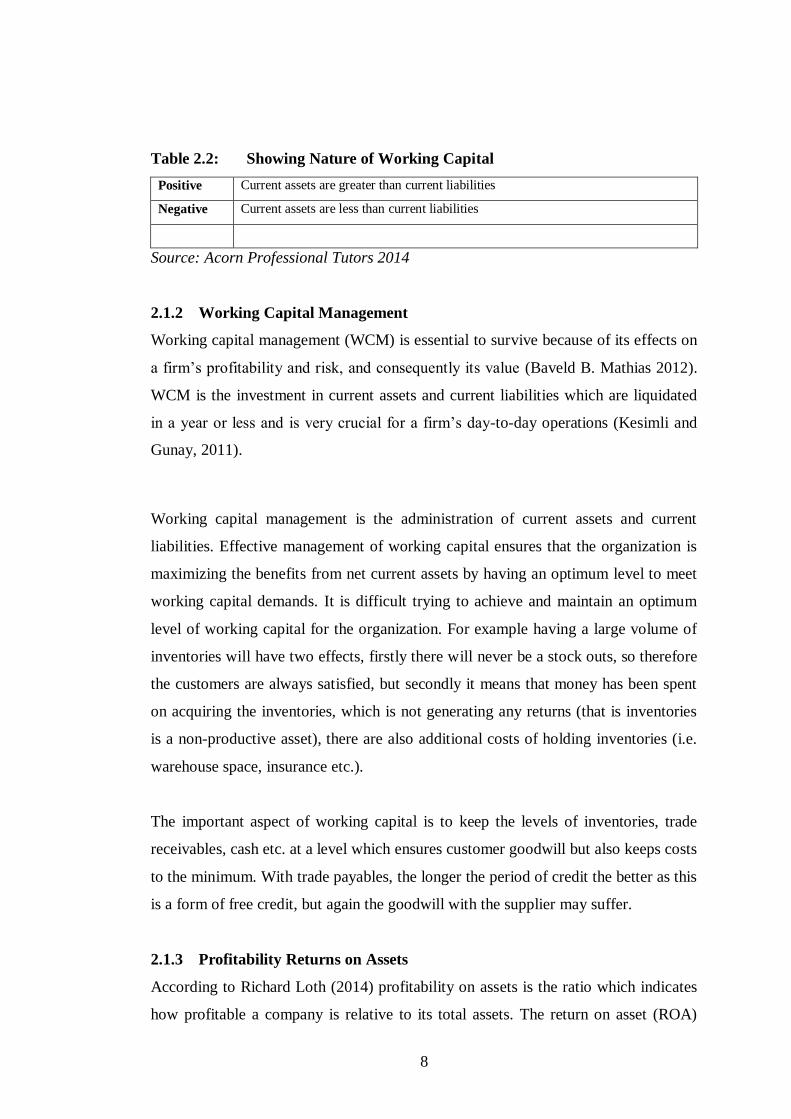
Table 2.2: Showing Nature of Working Capital
Positive Current assets are greater than current liabilities
Negative Current assets are less than current liabilities
Source: Acorn Professional Tutors 2014
2.1.2 Working Capital Management
Working capital management (WCM) is essential to survive because of its effects on
a firm’s profitability and risk, and consequently its value (Baveld B. Mathias 2012).
WCM is the investment in current assets and current liabilities which are liquidated
in a year or less and is very crucial for a firm’s day-to-day operations (Kesimli and
Gunay, 2011).
Working capital management is the administration of current assets and current
liabilities. Effective management of working capital ensures that the organization is
maximizing the benefits from net current assets by having an optimum level to meet
working capital demands. It is difficult trying to achieve and maintain an optimum
level of working capital for the organization. For example having a large volume of
inventories will have two effects, firstly there will never be a stock outs, so therefore
the customers are always satisfied, but secondly it means that money has been spent
on acquiring the inventories, which is not generating any returns (that is inventories
is a non-productive asset), there are also additional costs of holding inventories (i.e.
warehouse space, insurance etc.).
The important aspect of working capital is to keep the levels of inventories, trade
receivables, cash etc. at a level which ensures customer goodwill but also keeps costs
to the minimum. With trade payables, the longer the period of credit the better as this
is a form of free credit, but again the goodwill with the supplier may suffer.
2.1.3 Profitability Returns on Assets
According to Richard Loth (2014) profitability on assets is the ratio which indicates
how profitable a company is relative to its total assets. The return on asset (ROA)
9
ratio illustrates how well management is employing the company's total assets to
make a profit. The higher the return, the more efficient management is in utilizing its
asset base. The ROA ratio is calculated by comparing net income to average total
assets.
2.1.4 Return on Equity
Return on equity (ROE) is defined as the amount of net income returned as a
percentage of shareholders equity. It reveals how much profit a company earned in
comparison to the total amount of shareholder equity found on the balance sheet.
ROE is one of the most important financial ratios and profitability metrics. It is often
said to be the ultimate ratio or the ‘mother of all ratios’ that can be obtained from a
company’s financial statement. It measures how profitable a company is for the
owner of the investment, and how profitably a company employs its equity.
2.1.5 Meaning of Cash Conversion Cycle
Besley and Brigham (2005) describe cash conversion cycle as “the length of time
from the payment for the purchase of raw materials to manufacture a product until
the collection of account receivable associated with the sale of the product.” The
CCC length in days can be simply calculated as follows:
CCC days = inventory turnover days + debtor’s turnover days – payables
turnover days
2.1.6 Effects of Working Capital Management on a Firm’s Profitability
The main body of the literature of working capital focusses on studying the relation
between WCM and firm’s profitability. These studies evaluate WCM, by trying to
determine the effect of a firm’s working capital management on its profitability.
They argue that a WCM, which resulted in the highest profitability, must be the best
way of managing working capital that can be implemented. All these studies have
used regression analyses using different independent variables for profitability. The
main used independent variable operationalizing WCM is the Cash Conversion
Cycle (CCC). The CCC basically shows how long a firm takes to convert resource
10
inputs into cash flows (Quayyum, 2012). The CCC will be discussed in-depth in the
next subsection of this chapter. There are also several studies that have done research
on accounts receivables, accounts payables and inventories individually. Although
many studies have been carried out but all found a negative relation between WCM,
using the CCC, and firm profitability. This means that having a WCM policy which
results in a low as possible accounts receivables and inventories and the highest
amount of accounts payables leads to the highest profitability.
Contradicting evidence is found by Gill et al. (2010), whom did research in the USA
and found a positive relation between CCC and a firm’s profitability. But they did
find a highly significant negative relation between accounts receivables and a firm’s
profitability. They suggest that firm can enhance their profitability by keeping their
working capital to a minimum. This is because they argue that less profitable firms
will pursue a decrease of their accounts receivables in an attempt to reduce their cash
gap in the CCC (Gill et al., 2010).
Other studies have mainly focused on emerging market. These studies are Raheman
and Nasr (2007), Zariyawati et al. (2009), Falope and Ajilore (2009), Dong and Su
(2010), Mathuva (2010) and Quayyum (2012) whom did research in respectively
Pakistan, Malaysia, Nigeria, Vietnam, Kenya and Bangladesh. All these studies have
found a significant negative relation between the cash conversion cycle and a firm’s
profitability. This means that managers can create value for their firms, by keeping
their working capital to a reasonable minimum.
Contradicting evidence is found in India by Sharma and Kumar (2011). They found
evidence of a positive relation, which means that loosening the three parts of a firm
working capital management leads to higher profit. They argue that this is caused by
the fact that India is an emerging market and reputations of creditworthiness of firms
are not fully developed and therefore many companies loosen their working capital
management. Another reason they state is that only profitable firms can loosen their
working capital and therefore it’s because these firms are profitable, that they loosen
their working capital management and not the other way around.
11
Contradicting evidence is found on the effect of accounts payables on the
profitability of a firm. According to the cash conversion cycle, the number of days
accounts payables needs to be as large as possible. But researchers such as Deloof
(2003), Sharma and Kumar (2011), Lazaridis (2006), Banos-Caballero (2010) and
Karaduman (2011) have all found a negative relations between account payables and
profitability. The first reason for this could be that more profitable firms pay earlier
than less profitable firms, which in turn would affect the profitability and not the
other way round. An alternative reason is given by Deloof (2003); by arguing that if
a firm wait too long to pay their bills they have to pay without a discount. By
speeding up these payments a firm could receive this discount and which will
increase the profitability.
As mentioned before, authors have also studied the three parts of the CCC
individually. These parts are the number of day’s accounts receivables, inventories
and accounts payables. Almost all authors have found a negative effect of the three
parts on firm’s profitability. Sharma and Kumar (2011) argued that the positive
relation they found between accounts receivables and profitability is caused by the
fact that Indian firms have to grant more trade credit to sustain their competitiveness
with their foreign competitors, which have superior product and services.
Mathuva (2010) found contradicting evidence with the management of inventories in
Kenya. He argued that companies increase their inventory levels to reduce the cost of
possible production stoppages and the possibility of no access to raw materials and
other products. He further stated the findings of Blinder and Maccini (1991), which
indicate that higher inventory levels reduces the cost of supplying products and also
protects against price fluctuations caused by changing macroeconomic factors.
Also contradicting evidence is found by Mathuva (2010) with the management of
account payables. He found a positive effect of the number days accounts payables
on a firm’s profitability in Kenya. He explained this positive relation with two
reasons, first he argued that more profitable firms wait longer to pay their bills.
These firms use these accounts payables as a short-term source of funds. The second
12
argument why firms increase their accounts payables is that these firms are able to
increase their working capital levels and thus increasing their profitability. This is in
line with theory of a negative effect of the Cash Conversion Cycle (CCC) on the
profitability of a firm. This is caused by the fact that the number of days accounts
payables needs to be add in the measurement of the CCC. Thus a higher amount of a
number of day’s accounts payables leads to a higher profitability with a negative
relation between the CCC and a firm’s profitability.
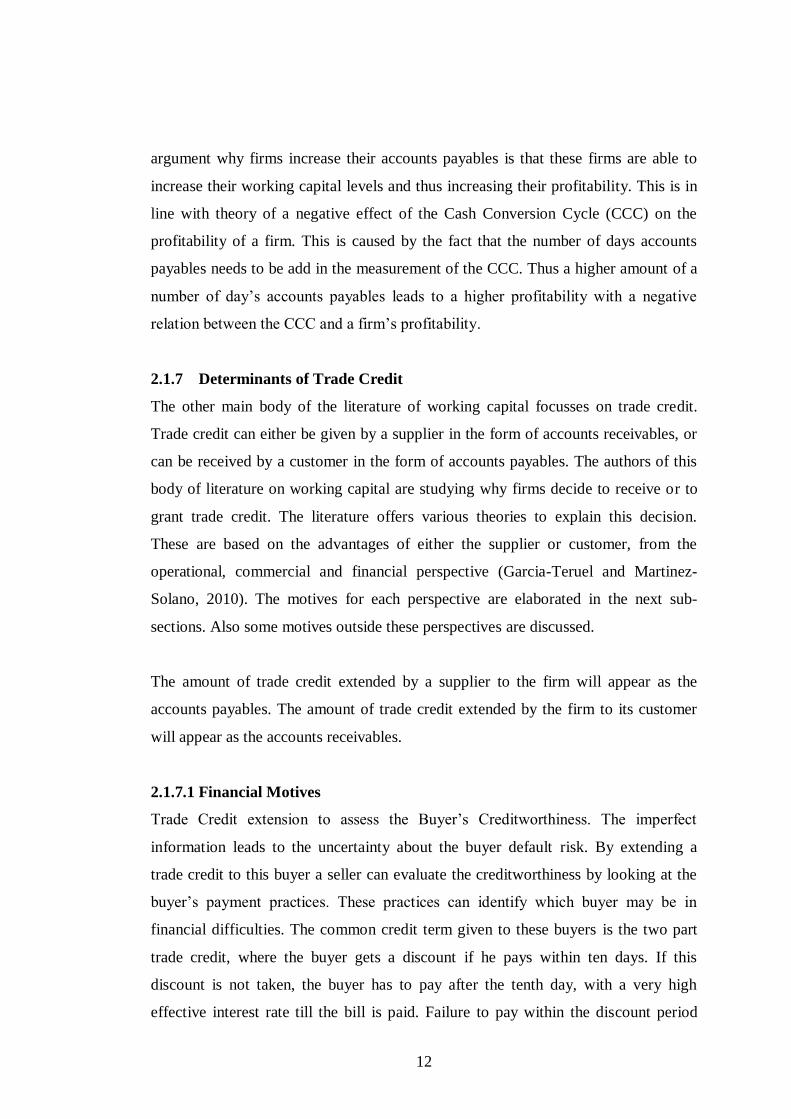
2.1.7 Determinants of Trade Credit
The other main body of the literature of working capital focusses on trade credit.
Trade credit can either be given by a supplier in the form of accounts receivables, or
can be received by a customer in the form of accounts payables. The authors of this
body of literature on working capital are studying why firms decide to receive or to
grant trade credit. The literature offers various theories to explain this decision.
These are based on the advantages of either the supplier or customer, from the
operational, commercial and financial perspective (Garcia-Teruel and Martinez-
Solano, 2010). The motives for each perspective are elaborated in the next sub-
sections. Also some motives outside these perspectives are discussed.
The amount of trade credit extended by a supplier to the firm will appear as the
accounts payables. The amount of trade credit extended by the firm to its customer
will appear as the accounts receivables.
2.1.7.1 Financial Motives
Trade Credit extension to assess the Buyer’s Creditworthiness. The imperfect
information leads to the uncertainty about the buyer default risk. By extending a
trade credit to this buyer a seller can evaluate the creditworthiness by looking at the
buyer’s payment practices. These practices can identify which buyer may be in
financial difficulties. The common credit term given to these buyers is the two part
trade credit, where the buyer gets a discount if he pays within ten days. If this
discount is not taken, the buyer has to pay after the tenth day, with a very high
effective interest rate till the bill is paid. Failure to pay within the discount period
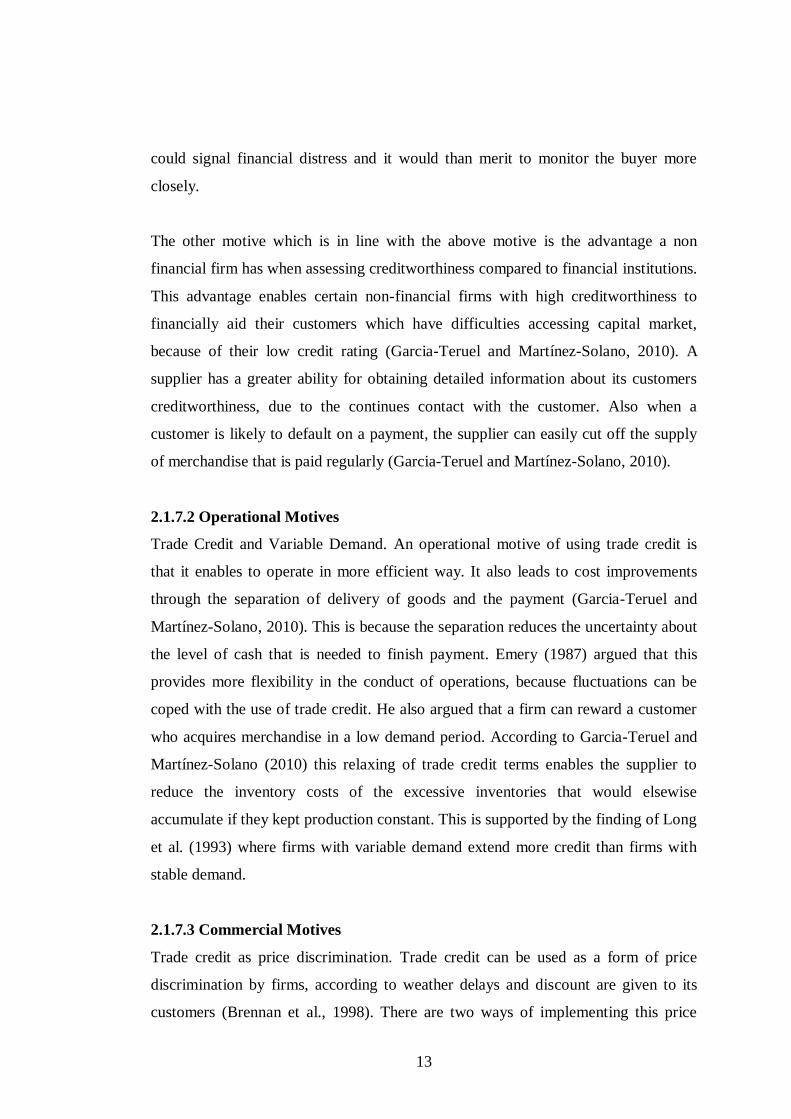
13
could signal financial distress and it would than merit to monitor the buyer more
closely.
The other motive which is in line with the above motive is the advantage a non
financial firm has when assessing creditworthiness compared to financial institutions.
This advantage enables certain non-financial firms with high creditworthiness to
financially aid their customers which have difficulties accessing capital market,
because of their low credit rating (Garcia-Teruel and Martínez-Solano, 2010). A
supplier has a greater ability for obtaining detailed information about its customers
creditworthiness, due to the continues contact with the customer. Also when a
customer is likely to default on a payment, the supplier can easily cut off the supply
of merchandise that is paid regularly (Garcia-Teruel and Martínez-Solano, 2010).
2.1.7.2 Operational Motives
Trade Credit and Variable Demand. An operational motive of using trade credit is
that it enables to operate in more efficient way. It also leads to cost improvements
through the separation of delivery of goods and the payment (Garcia-Teruel and
Martínez-Solano, 2010). This is because the separation reduces the uncertainty about
the level of cash that is needed to finish payment. Emery (1987) argued that this
provides more flexibility in the conduct of operations, because fluctuations can be
coped with the use of trade credit. He also argued that a firm can reward a customer
who acquires merchandise in a low demand period. According to Garcia-Teruel and
Martínez-Solano (2010) this relaxing of trade credit terms enables the supplier to
reduce the inventory costs of the excessive inventories that would elsewise
accumulate if they kept production constant. This is supported by the finding of Long
et al. (1993) where firms with variable demand extend more credit than firms with
stable demand.
2.1.7.3 Commercial Motives
Trade credit as price discrimination. Trade credit can be used as a form of price
discrimination by firms, according to weather delays and discount are given to its
customers (Brennan et al., 1998). There are two ways of implementing this price
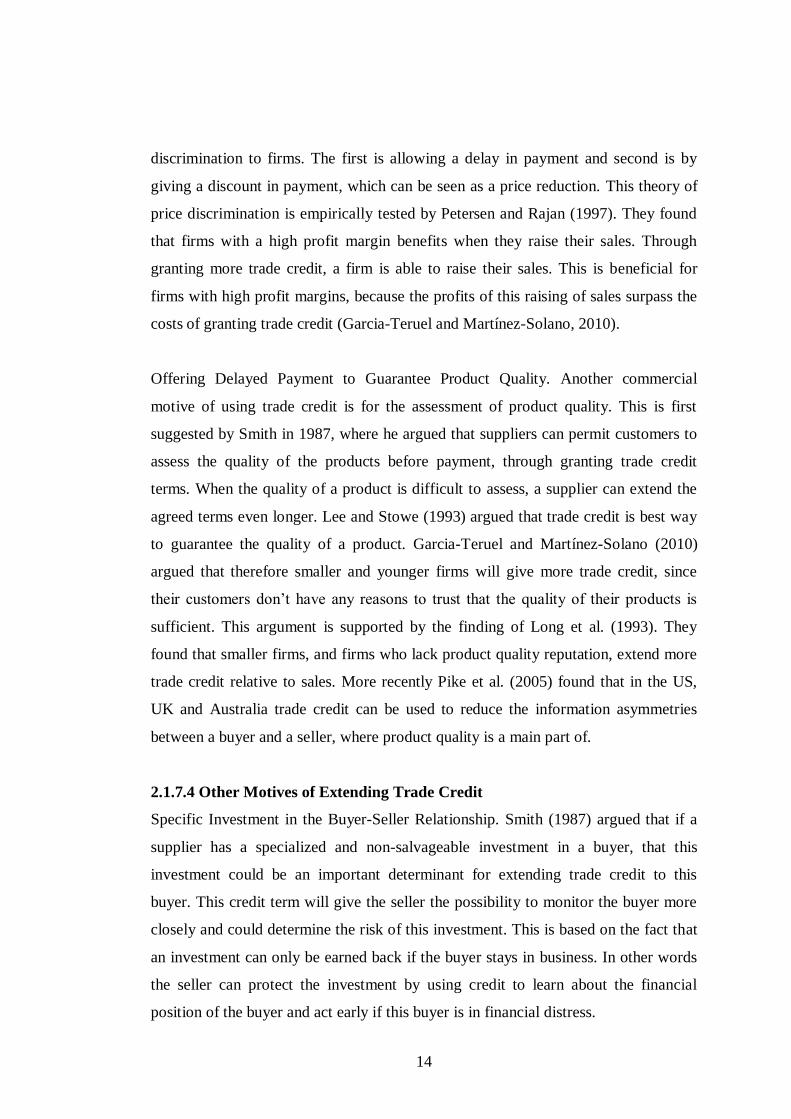
14
discrimination to firms. The first is allowing a delay in payment and second is by
giving a discount in payment, which can be seen as a price reduction. This theory of
price discrimination is empirically tested by Petersen and Rajan (1997). They found
that firms with a high profit margin benefits when they raise their sales. Through
granting more trade credit, a firm is able to raise their sales. This is beneficial for
firms with high profit margins, because the profits of this raising of sales surpass the
costs of granting trade credit (Garcia-Teruel and Martínez-Solano, 2010).
Offering Delayed Payment to Guarantee Product Quality. Another commercial
motive of using trade credit is for the assessment of product quality. This is first
suggested by Smith in 1987, where he argued that suppliers can permit customers to
assess the quality of the products before payment, through granting trade credit
terms. When the quality of a product is difficult to assess, a supplier can extend the
agreed terms even longer. Lee and Stowe (1993) argued that trade credit is best way
to guarantee the quality of a product. Garcia-Teruel and Martínez-Solano (2010)
argued that therefore smaller and younger firms will give more trade credit, since
their customers don’t have any reasons to trust that the quality of their products is
sufficient. This argument is supported by the finding of Long et al. (1993). They
found that smaller firms, and firms who lack product quality reputation, extend more
trade credit relative to sales. More recently Pike et al. (2005) found that in the US,
UK and Australia trade credit can be used to reduce the information asymmetries
between a buyer and a seller, where product quality is a main part of.
2.1.7.4 Other Motives of Extending Trade Credit
Specific Investment in the Buyer-Seller Relationship. Smith (1987) argued that if a
supplier has a specialized and non-salvageable investment in a buyer, that this
investment could be an important determinant for extending trade credit to this
buyer. This credit term will give the seller the possibility to monitor the buyer more
closely and could determine the risk of this investment. This is based on the fact that
an investment can only be earned back if the buyer stays in business. In other words
the seller can protect the investment by using credit to learn about the financial
position of the buyer and act early if this buyer is in financial distress.
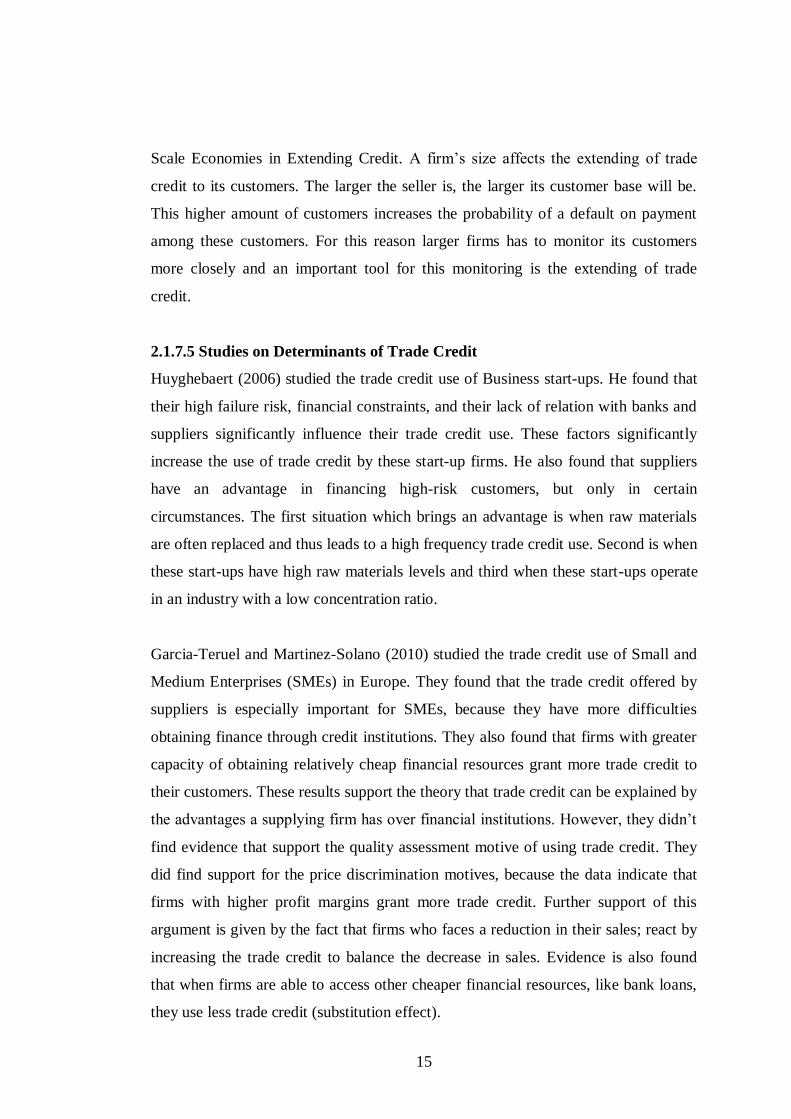
15
Scale Economies in Extending Credit. A firm’s size affects the extending of trade
credit to its customers. The larger the seller is, the larger its customer base will be.
This higher amount of customers increases the probability of a default on payment
among these customers. For this reason larger firms has to monitor its customers
more closely and an important tool for this monitoring is the extending of trade
credit.
2.1.7.5 Studies on Determinants of Trade Credit
Huyghebaert (2006) studied the trade credit use of Business start-ups. He found that
their high failure risk, financial constraints, and their lack of relation with banks and
suppliers significantly influence their trade credit use. These factors significantly
increase the use of trade credit by these start-up firms. He also found that suppliers
have an advantage in financing high-risk customers, but only in certain
circumstances. The first situation which brings an advantage is when raw materials
are often replaced and thus leads to a high frequency trade credit use. Second is when
these start-ups have high raw materials levels and third when these start-ups operate
in an industry with a low concentration ratio.
Garcia-Teruel and Martinez-Solano (2010) studied the trade credit use of Small and
Medium Enterprises (SMEs) in Europe. They found that the trade credit offered by
suppliers is especially important for SMEs, because they have more difficulties
obtaining finance through credit institutions. They also found that firms with greater
capacity of obtaining relatively cheap financial resources grant more trade credit to
their customers. These results support the theory that trade credit can be explained by
the advantages a supplying firm has over financial institutions. However, they didn’t
find evidence that support the quality assessment motive of using trade credit. They
did find support for the price discrimination motives, because the data indicate that
firms with higher profit margins grant more trade credit. Further support of this
argument is given by the fact that firms who faces a reduction in their sales; react by
increasing the trade credit to balance the decrease in sales. Evidence is also found
that when firms are able to access other cheaper financial resources, like bank loans,
they use less trade credit (substitution effect).
16
Petersen and Rajan (1997) did research on the theories and motives of the use or
granting of trade credit. They focused on smaller firms who have a limited access to
the capital market. They found that firms grant more trade credit to firms with higher
credit worthiness, but these firms use less trade credit when they have access to the
capital market. Also evidence is found which support the theory that supplying firms
have advantages over financial institutions concerning short-term financing. They
argue that this is mainly due to the fact that these suppliers have more current
information compared to the information of financial institutions. Also evidence is
found for the motives of these suppliers for extending trade credit when they have a
large interest in the survival of the customer and suppliers are able to liquidate the
goods without much loss. As mentioned before, they also found evidence supporting
the theory of price discrimination with firm with high profit margins.
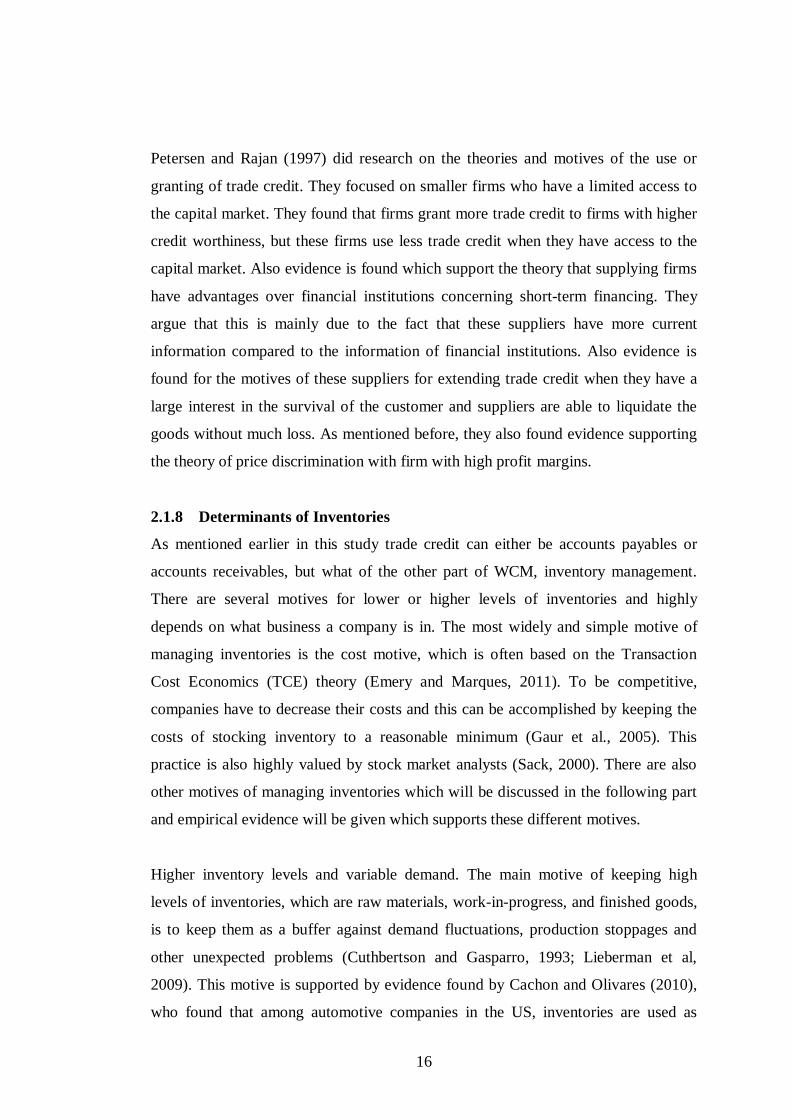
2.1.8 Determinants of Inventories
As mentioned earlier in this study trade credit can either be accounts payables or
accounts receivables, but what of the other part of WCM, inventory management.
There are several motives for lower or higher levels of inventories and highly
depends on what business a company is in. The most widely and simple motive of
managing inventories is the cost motive, which is often based on the Transaction
Cost Economics (TCE) theory (Emery and Marques, 2011). To be competitive,
companies have to decrease their costs and this can be accomplished by keeping the
costs of stocking inventory to a reasonable minimum (Gaur et al., 2005). This
practice is also highly valued by stock market analysts (Sack, 2000). There are also
other motives of managing inventories which will be discussed in the following part
and empirical evidence will be given which supports these different motives.
Higher inventory levels and variable demand. The main motive of keeping high
levels of inventories, which are raw materials, work-in-progress, and finished goods,
is to keep them as a buffer against demand fluctuations, production stoppages and
other unexpected problems (Cuthbertson and Gasparro, 1993; Lieberman et al,
2009). This motive is supported by evidence found by Cachon and Olivares (2010),
who found that among automotive companies in the US, inventories are used as
17
safety stocks to better withstand demand fluctuations. Kahn (1987) also found
evidence that companies increase their amount of stocks to decrease the probability
of stock outs when demand is high and thus inventory levels are determined by the
fluctuations of sales of a company.
2.1.8.1 Just-In-Time Inventory System
Managerial decisions have a huge impact on the levels of inventories. During the
seventies and eighties of the 20th century Japanese manufacturing companies
increased their activities significantly in the U.S. markets. They also brought in new
ideas of managing companies and since they increased their market shares
substantially, it was apparent that some of these new ideas of managing were very
successful. One of these ideas affected the way of managing inventories, which was
called the Just-In-Time (JIT) inventory management system. The basic idea of this
system was that companies should deliver products to their customer just-in-time. By
doing this, companies won’t have to have large amounts of stocks to be able to
deliver goods. This saves a lot of costs concerning inventory stocking. The question
of whether companies in the U.S. did decrease their amount of stocks was studied by
Chen et al. (2005). They found that a large amount of companies did significantly
reduce their inventory levels. This reduction was mostly implemented on the levels
of work-in-progress inventory. This decrease in inventory levels is also found by
Rajagopalan and Malhorta (2001) who studied a number of industries in the
manufacturing sector in the U.S.
2.1.8.2 Higher Inventory Levels and Production Costs
Another reason for companies to increase their finished goods inventory levels is to
be able to produce in periods in which production costs are relatively low (Blinder
and Maccini, 1990; Eichenbaum, 1984; and Eichenbaum, 1989). A comparable
motive of increasing inventory levels is when companies can produce cheaper in
batches, which can result in relatively high inventory levels.
18
2.1.8.3 Other Determinants of Inventory Management
Lieberman et al. (2009) studied the determinants of inventory policies of automotive
companies in the United States. They found that both technological and managerial
factors have a significant influence on the determining of the levels of inventories.
Technological factors, like longer setup and processing times increases the level of
inventories. While the average price per piece of inventory decreases the inventory
levels. They also found that managerial factors, like more employee training and
problem solving training have a reducing effect on the inventory levels. Lieberman et
al. (2009) also found that when companies have a greater and more frequent
communications with their supplier, the inventory levels will be lower. This finding
is supported by Milgrom and Roberts (1988) that view inventory and communication
with a supplier as substitutes. Also macro-economic conditions have a profound
impact on the levels of the different types of inventories. Chen et al. (2005) found
that when interest rates are increasing, the levels of work-in-progress are decreased.
Also evidence is found that inflation has a positive effect on the acquiring of raw
materials. This is caused by the fact that companies wanted to buy these materials
before the prices of these materials rise even more. They also found that when
managers assume better economic conditions in the future, they increase the levels of
finished goods (Chen et al., 2005).
2.2 Theoretical Framework
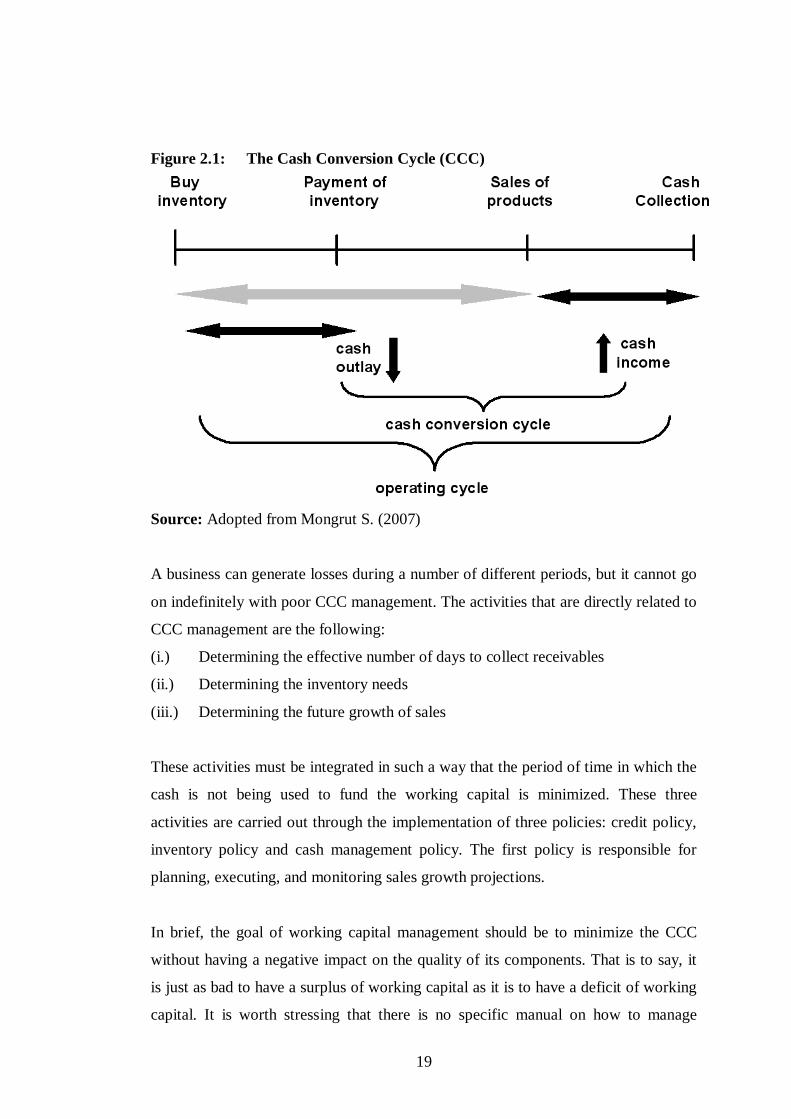
2.2.1 The Cash Conversion Cycle (CCC)
Working capital are the funds which are used to operate in the short term. If
receivables are postponed there can be delays in payments and these could be
suspended causing a situation of illiquidity for the firm.
In this context, CCC is an important tool of analysis that enables us to establish more
easily why and how the business needs more cash to operate and when and how it
will be in a position to refund the negotiated resources. The major ingredients of the
CCC turnover can be easily illustrated with the help of the following illustrated
figure 2.1:
19
Figure 2.1: The Cash Conversion Cycle (CCC)
Source: Adopted from Mongrut S. (2007)
A business can generate losses during a number of different periods, but it cannot go
on indefinitely with poor CCC management. The activities that are directly related to
CCC management are the following:
(i.) Determining the effective number of days to collect receivables
(ii.) Determining the inventory needs
(iii.) Determining the future growth of sales
These activities must be integrated in such a way that the period of time in which the
cash is not being used to fund the working capital is minimized. These three
activities are carried out through the implementation of three policies: credit policy,
inventory policy and cash management policy. The first policy is responsible for
planning, executing, and monitoring sales growth projections.
In brief, the goal of working capital management should be to minimize the CCC
without having a negative impact on the quality of its components. That is to say, it
is just as bad to have a surplus of working capital as it is to have a deficit of working
capital. It is worth stressing that there is no specific manual on how to manage
20
working capital, since it depends to a very great extent on the specific circumstances
of each company.
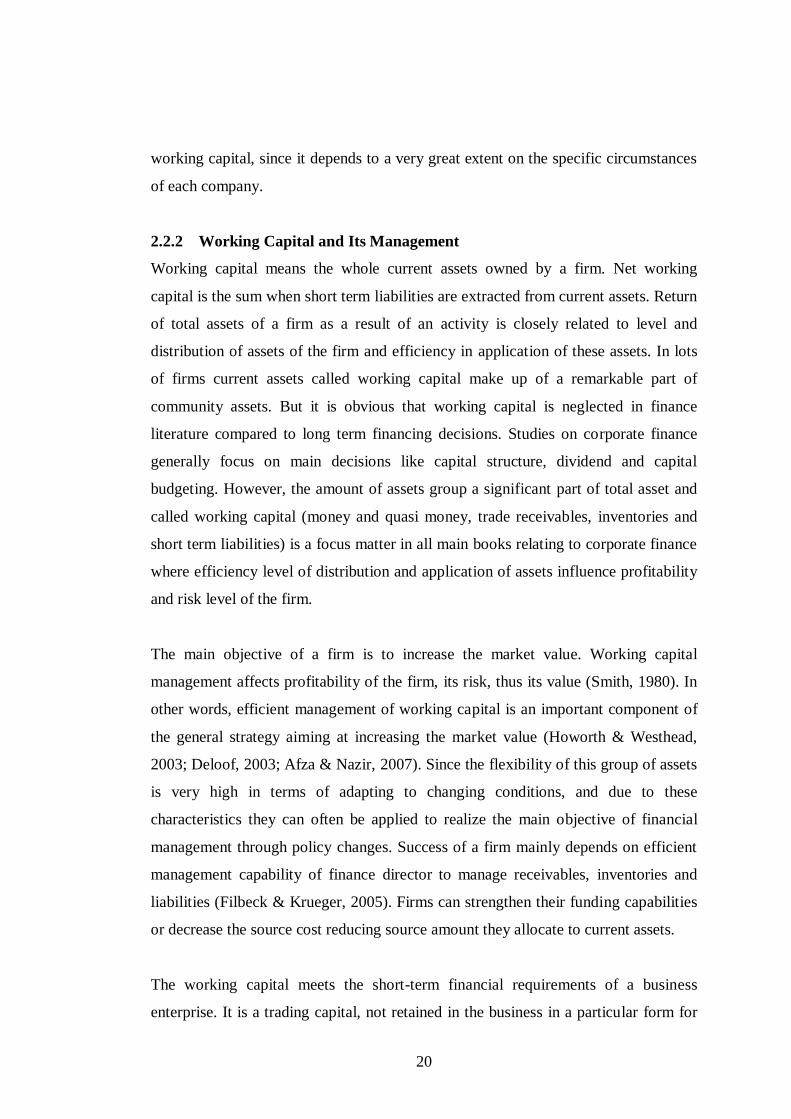
2.2.2 Working Capital and Its Management
Working capital means the whole current assets owned by a firm. Net working
capital is the sum when short term liabilities are extracted from current assets. Return
of total assets of a firm as a result of an activity is closely related to level and
distribution of assets of the firm and efficiency in application of these assets. In lots
of firms current assets called working capital make up of a remarkable part of
community assets. But it is obvious that working capital is neglected in finance
literature compared to long term financing decisions. Studies on corporate finance
generally focus on main decisions like capital structure, dividend and capital
budgeting. However, the amount of assets group a significant part of total asset and
called working capital (money and quasi money, trade receivables, inventories and
short term liabilities) is a focus matter in all main books relating to corporate finance
where efficiency level of distribution and application of assets influence profitability
and risk level of the firm.
The main objective of a firm is to increase the market value. Working capital
management affects profitability of the firm, its risk, thus its value (Smith, 1980). In
other words, efficient management of working capital is an important component of
the general strategy aiming at increasing the market value (Howorth & Westhead,
2003; Deloof, 2003; Afza & Nazir, 2007). Since the flexibility of this group of assets
is very high in terms of adapting to changing conditions, and due to these
characteristics they can often be applied to realize the main objective of financial
management through policy changes. Success of a firm mainly depends on efficient
management capability of finance director to manage receivables, inventories and
liabilities (Filbeck & Krueger, 2005). Firms can strengthen their funding capabilities
or decrease the source cost reducing source amount they allocate to current assets.
The working capital meets the short-term financial requirements of a business
enterprise. It is a trading capital, not retained in the business in a particular form for
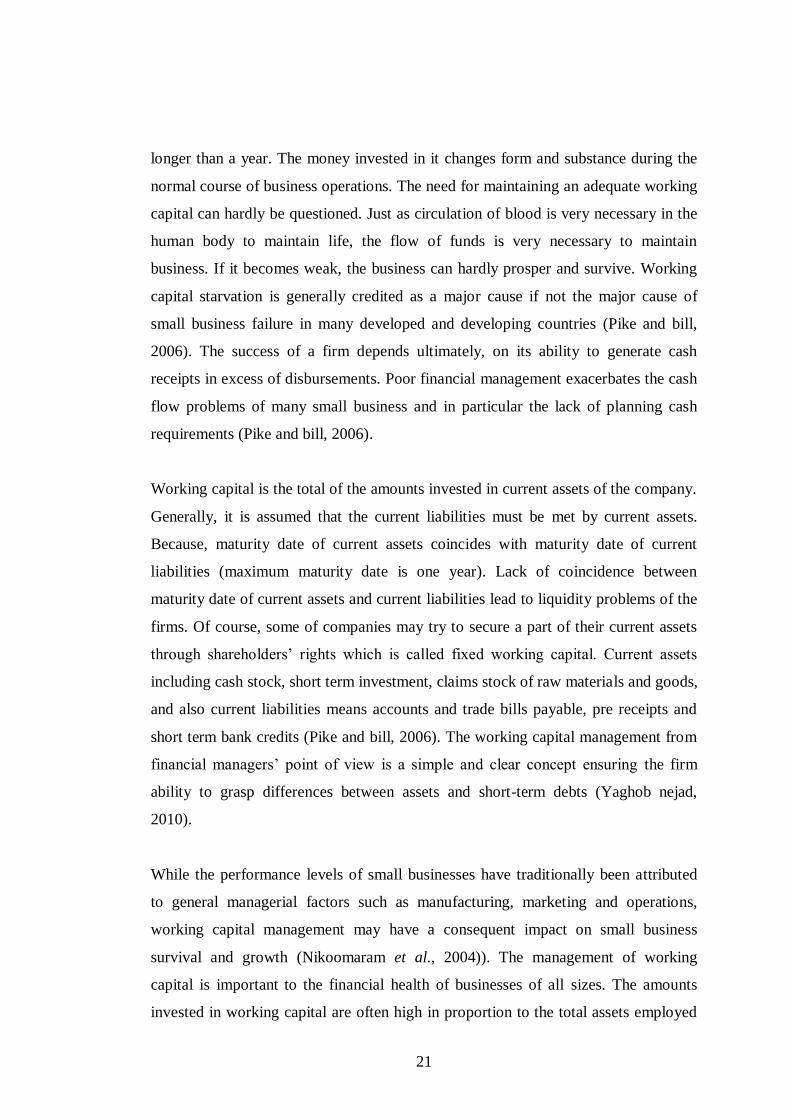
21
longer than a year. The money invested in it changes form and substance during the
normal course of business operations. The need for maintaining an adequate working
capital can hardly be questioned. Just as circulation of blood is very necessary in the
human body to maintain life, the flow of funds is very necessary to maintain
business. If it becomes weak, the business can hardly prosper and survive. Working
capital starvation is generally credited as a major cause if not the major cause of
small business failure in many developed and developing countries (Pike and bill,
2006). The success of a firm depends ultimately, on its ability to generate cash
receipts in excess of disbursements. Poor financial management exacerbates the cash
flow problems of many small business and in particular the lack of planning cash
requirements (Pike and bill, 2006).
Working capital is the total of the amounts invested in current assets of the company.
Generally, it is assumed that the current liabilities must be met by current assets.
Because, maturity date of current assets coincides with maturity date of current
liabilities (maximum maturity date is one year). Lack of coincidence between
maturity date of current assets and current liabilities lead to liquidity problems of the
firms. Of course, some of companies may try to secure a part of their current assets
through shareholders’ rights which is called fixed working capital. Current assets
including cash stock, short term investment, claims stock of raw materials and goods,
and also current liabilities means accounts and trade bills payable, pre receipts and
short term bank credits (Pike and bill, 2006). The working capital management from
financial managers’ point of view is a simple and clear concept ensuring the firm
ability to grasp differences between assets and short-term debts (Yaghob nejad,
2010).
While the performance levels of small businesses have traditionally been attributed
to general managerial factors such as manufacturing, marketing and operations,
working capital management may have a consequent impact on small business
survival and growth (Nikoomaram et al., 2004)). The management of working
capital is important to the financial health of businesses of all sizes. The amounts
invested in working capital are often high in proportion to the total assets employed
22
and so it is vital that these amounts are used in an efficient and effective way.
However, there is evidence that small businesses are not very good at managing their
working capital. Given that many small businesses suffer from undercapitalization,
the importance of exerting tight control over working capital investment is difficult
to overstate.
A firm can be very profitable, but if this is not translated into cash from operations
within the same operating cycle, the firm would need to borrow to support its
continued working capital needs. Thus, the twin objectives of profitability and
liquidity must be synchronized and one should not impinge on the other for long.
Investments in current assets are inevitable to ensure delivery of goods or services to
the ultimate customers and a proper management of same should give the desired
impact on either profitability or liquidity. If resources are blocked at the different
stage of the supply chain, this will prolong the cash operating cycle. Although this
might increase profitability (due to increase sales), it may also adversely affect the
profitability if the costs tied up in working capital exceed the benefits of holding
more inventory and/or granting more trade credit to customers.
Another component of working capital is accounts payable, but it is different in the
sense that it does not consume resources; instead it is often used as a short term
source of finance. Thus it helps firms to reduce its cash operating cycle, but it has an
implicit cost where discount is offered for early settlement of invoices.
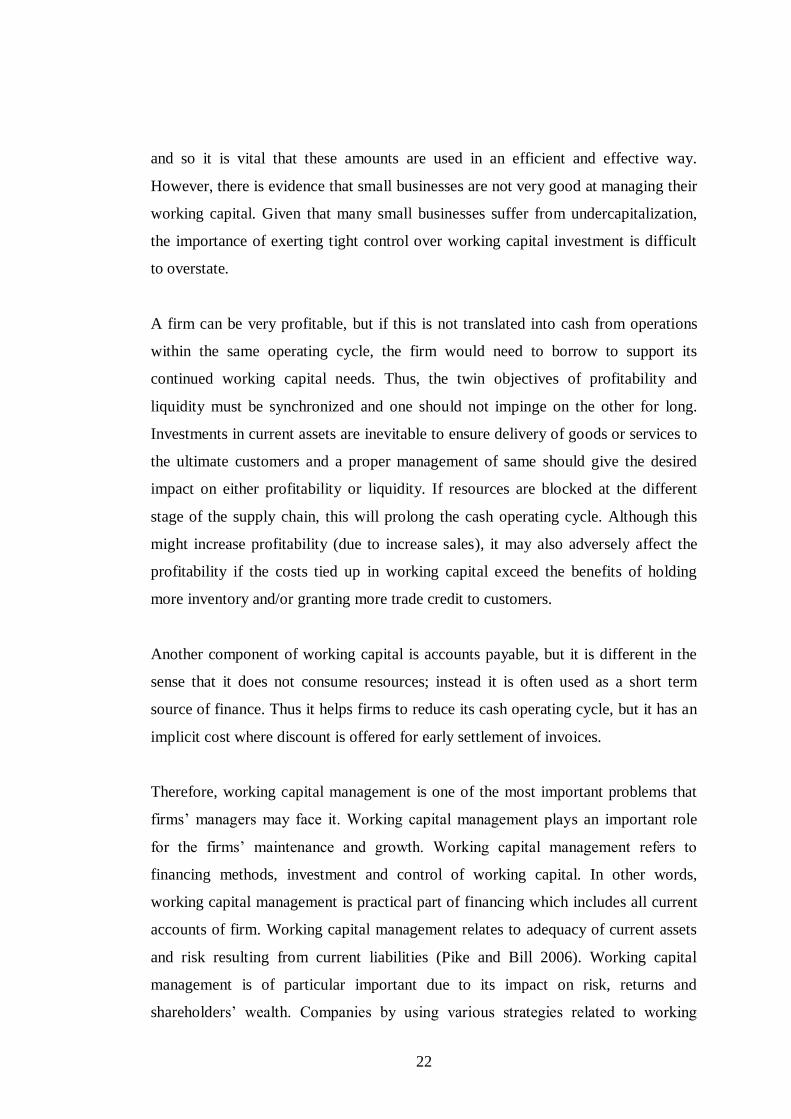
Therefore, working capital management is one of the most important problems that
firms’ managers may face it. Working capital management plays an important role
for the firms’ maintenance and growth. Working capital management refers to
financing methods, investment and control of working capital. In other words,
working capital management is practical part of financing which includes all current
accounts of firm. Working capital management relates to adequacy of current assets
and risk resulting from current liabilities (Pike and Bill 2006). Working capital
management is of particular important due to its impact on risk, returns and
shareholders’ wealth. Companies by using various strategies related to working
23
capital management can affect the amount of firm’s liquidity. These strategies
determine their risk level and returns (Nikoomaram et al., 2004). In other words,
firms by using efficient working capital management can facilitate access to
following objectives:
2.2.3 Enough Liquidity
Firms face difficulties if they have not enough cash for the payment of their invoices
on maturity date. Thus one of the most important objectives of working capital
management is access to enough liquidity in order to undertake daily activities and
prevention of disturbances in trade cycle operations.
2.2.4 Minimizing Risk
Firms must ensure that their short term obligations do not exceed their current assets.
Comparison of assets and liabilities among the current accounts is a responsibility
which aims to minimize risk of inability to the payment of invoices and other
obligations.
2.2.5 Maximizing Firm’s Value
Firms maintain working capital for the same reason that maintain other assets, means
help to maximizing share’s value of the firms and consequently firms’ value.
Investment of idle moneys, minimizing the stocks, fast receipt of receivable and
elimination of costly short term financing, all lead to increase in firms’ value.
2.2.6 Measures of Profitability
In this research study, cash conversion cycle, current ratio, current assets to total
assets, current liabilities to total assets and total liabilities to total assets are used to
measure profitability. Also, profitability will includes return on assets rate and return
on equity rate.
(i.) Cash conversion cycle (CCC): is calculated by (number of days inventories +
number of days accounts receivable) – number of days accounts payable
(ii.) Return on assets (ROA): is calculated by = Operating Profit
Total assets
24
(iii.) Return on equity (ROIC/ROE): is calculated by = Net Profit
Total equities
(iv.) Current ratio (CACLR): is calculated by = Current Assets
Current Liabilities
2.2.7 Measures of firms working capital
In this research study, current ratio, quick ratio or acid test, trade payables (turnover),
trade receivables days (turnover), inventory days and inventory turnover are used to
measure working capital of the firms selected. These variables are calculated as
detailed below;-
(i.) Current ratio (CA): is calculated by = Current Assets (Times)
Current Liabilities
(ii.) Quick ratio (QR): is calculated by = Current Assets less Inventories (Times)
Current Liabilities
(iii.) Trade payables (turnover): is calculated = Year end trade payables X365 days
Credit Purchases or (Cost of Sales)
(iv.) Trade receivables days (turnover):Calculated =Yr end receivables X 365 days
Credit sales (Turnover)
(v.) Inventory days: is calculated by = Average inventory X 365 days
Cost of sales
(vi.) Inventory Turnover: is calculated by = Cost of sales (Times)
Average inventory
2.3 Empirical Literature Review
In 2010 Izadima and Taki examined the effects of working capital management on
capability of profitability for listed companies on Tehran Stock Exchange for the
25
period of 2001-2008. In this study return on total assets is considered as a measure
for capability of profitability. The results indicate that there is a negative significant
relationship between cash conversion cycle and return on assets and also a lot of
investment in inventories and accounts receivable leads to declining of profitability.
YaghoobNejad, et al. (2010) examined the relationship between working capital
management and profitability. For this purpose of this study sample size selected was
86 active companies on Tehran stock exchange for the period of 2002-2007.
Researchers employed regression and Pearson correlation while analyzing data
collected. The results show that there is a negative relationship between variables of
working capital management and profitability. Also, the results indicate that increase
in number of day’s accounts receivable, number of day’s accounts payable, number
of day’s inventories and cash conversion cycle leads to decrease in profitability of
companies. Managers can increase the shareholder’s wealth by reducing number of
day’s accounts receivable, number of day’s accounts payable, number of day’s
inventories and cash conversion cycle.
Mohmmadi (2009) examined the impact of working capital management on
profitability for listed companies on Tehran Stock Exchange. The study analyses a
sample of 92 companies for the period of 1996 up to 2005. Research findings show
that there exist negative relationship between number of day’s accounts receivable,
number of day’s inventories, member of days accounts payable, cash conversion
cycle and profitability.
Lazaridis and Tryfonidis (2006) conducted a statistical analysis of 131 firms in
Athens for the period 2001 to 2004 and arrived at the conclusion that managers may
create benefits for the companies if they manage an adequate level of CCC and
maintain each one of its components at an optimal level. They also detected a
negative relationship between the company’s working capital and its profitability.
A study conducted by Padachi in 2006 with an objective of examining the effect of
accounts receivables days, inventories days, accounts payable days and cash
26
conversion cycle on return on total assets. He also analyses the tendency in working
capital requirements of firms, for a sample of 58 small manufacturing firms in
Mauritius for the period 1998 to 2003. Using pooled OLS and fixed effect regression
model, he established that lower profitability was related with higher investment in
receivables and inventories. The findings also reveal a rising tendency in the short-
term component of financing working capital.
Mongrut et al. (2007) determine the factors that affect working capital management
in Latin American companies. Using an unbalanced panel data analysis for
companies quoted in five Latin American capital markets it is shown that companies
in Argentina, Brazil, Chile and Mexico are holding cash excesses, which could
destroy firm value. Findings of the study show that the industry cash conversion
cycle, the company market power, its future sales and country risk have an influence
on the way Latin American companies manage their working capital with significant
differences among countries in the region.
Soenen (2002) examined the relationship between net trade cycle as an indicator of
waking capital and investment return in American companies. Chai-Square Test
results showed a negative relationship between net trade cycle time and properties
return. Future, the negative relation is different for different industries. An important
significant relationship for almost half of considered companies indicated that
negative relation depends on type of industry.
Soenen and Shin (1998) investigated the relation between measure of the cash
conversion cycle and corporate profitability for a large sample of listed American
firms for the 1975 up to 1994 periods. They found a strong negative relation. This
result indicates that managers can create value for their shareholders by reducing the
cash conversion cycle to a reasonable minimum. In addition to this, Shin and Soenen
(1998) intended to come up with the determinants of working capital and found that
its management is correlated in a positive way to firm size. They also established that
industry concentration does not affect working capital management and that a greater
27
compensation paid to the CEO of the firm definitely improves the company’s
management of working capital. These results suggest that WCM has an important
impact on the profitability of the firms.
Deloof (2003) investigated the relationship between working capital management
and profitability for a sample of 1009 Belgian Companies for the period of 1960-
1992. In this study have been used cash conversion cycle inventories and number of
day’s accounts receivable as indicators of trade credit and cash conversion cycle as
comprehensive indicator of working capital management. The results show that
manager can increase profitability of trade by reducing the number of accounts
receivable, inventories and also by reducing cash conversion cycle.
Samiloglu and Demirgunes (2008) examined the effect of working capital
management on profitability for a sample of Turkish companies, for the period of
1998-2007. Empirical findings show that accounts receivables period, inventory
period and leverage affect firm profitability negatively; while growth (in sales)
affects firm profitability positively.
Ganesan (2007) analyzed the efficiency of firms’ working capital management using
a sample of telecommunication equipment companies. The variables used to
represent the working capital were days’ sales outstanding, days’ inventory
outstanding, days’ payable outstanding, days’ working capital, and current ratio
while, profitability and liquidity were represented by cash conversion efficiency,
income to total assets and income to sales. The findings of the study support the
substantiation that although days’ working capital was negatively associated with the
profitability, yet, it was unable to influence the profitability of the firms in a
significant manner.
Ching, Novazzi and Gerab (2011) conducted a study to find out the relationship
between working capital management and profitability in Brazilian listed companies.
The objectives of their study were to investigate if there was any difference between
corporate profitability and working capital management in two separate groups of
28
companies: working capital intensive and fixed capital intensive; and to identify the
variables that most affect profitability. They have measured profitability in three
different ways: return on sales (ROS), on asset (ROA) and return on equity (ROE).
The independent variables used are cash conversion efficiency, debt ratio, days of
working capital, days’ receivable and days’ inventory. Multiple linear regression
used in their study identified that, there exists negative relationship between cash
conversion cycle (equal to days of working capital), debt ratio and profitability.
Mathias (2012) examine the impact of Working Capital Management on the
Profitability of Public Listed Firms in The Netherlands During the Financial Crisis.
The study employ a sample of 37 public listed companies from the Netherlands,
listed on either the AEX or AMX. The non-crisis sample period ranged from 2004 to
2006 and the crisis period from 2008 to 2009 and resulted in approximately 185
firm-years. The study used OLS regression analysis method, in which the number of
days accounts receivables, accounts payables, inventories and the cash conversion
cycle are analysed. These four different variables were analysed using multiple
regressions with different sets of control variables, checking for robustness this way.
The findings on the analyses of the number of days accounts receivables indicate that
there is a significant negative relation between these days and firm’s profitability
during a non-crisis period. No significant relation was found during the crisis period,
which indicate that the relation between accounts receivables and a firm’s
profitability was changed in times of a crisis. The analyses of the relation between
accounts receivables and the lead dependent variable gross operating profit divided
by total assets minus financial assets showed a significant positive relation.
Mehnet and Eda (2009) examine the relationship between efficiency level of firms
being traded in ISE (Istanbul Stock Exchange) in working capital management and
their return on total assets. They are sample consists of 49 production firms that
traded at least three months in Istanbul Stock Exchange from 1993 to 2007. They
results of the study in terms of both all the firms involved and sectors shows there
was a significance negative relationship between cash conversion cycle, net working
29
capital level, current ratio, accounts receivable period, inventory period and return on
total assets.
Mathuva (2009) investigated the impact of the components of working capital
management upon profitability of the firms. His sample consists of 30 listed firms
from Nairobi Stock Exchange (NSE) and the period of his study ranges from 1992-
93 to 2007-08. Apart from using Pearson’s correlations and Spearman’s correlations,
panel data regression analysis like pooled OLS and fixed effects models (FEM) were
also employed in the study. He found negative relationship between the age of
debtors and profitability while, a positive association was originated between the
inventory conversion period and profitability, and also between age of creditors and
profitability of the selected firms.
2.4 Research Gap
Lack of understanding about the impact of working capital requirements on
profitability, the lack of clarity about its determinants, and the lack of management’s
ability to plan and control its components may lead to insolvency and bankruptcy, so
that a large number of business failures may come from the inability of financial
manager to plan and control current assets and current liabilities of their respective
firms (Gill, 2011). If impact of working capital requirement on profitability, clarity
about its determinants and proper management plans and controls of its components
were well known by firm’s stakeholder’s insolvency and bankruptcy will cease.
Existence of mentioned matters is the major reason for undertaking this study in
Tanzania context. Therefore the study was aimed at determining the relationship
between working capital management and profitability for listed companies at Dar es
Salaam Stock Exchange.
2.5 Conceptual Framework
Conceptual framework is a visual or written product that explains graphically or in
narrative form, the main things to be studied. It describes the key factors, concepts,
and variables and the presumed relationship among them Maxwell Joseph A (2005).
According to the research under study conceptual framework developed from
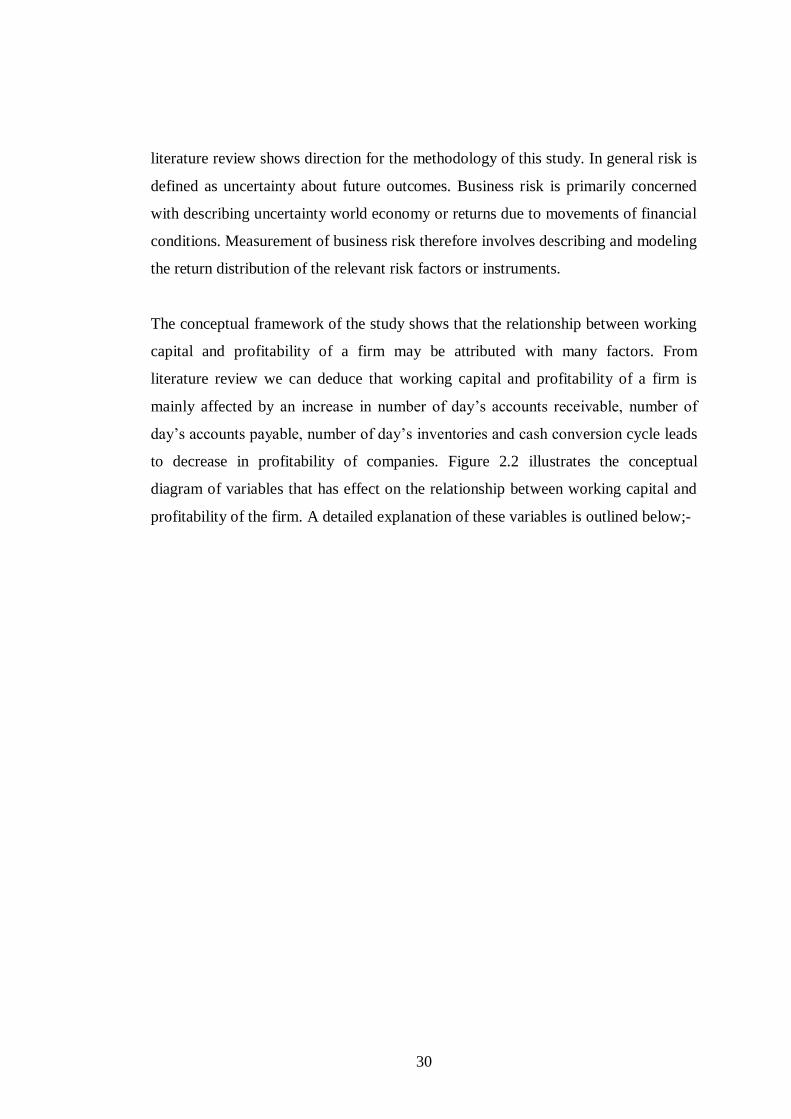
30
literature review shows direction for the methodology of this study. In general risk is
defined as uncertainty about future outcomes. Business risk is primarily concerned
with describing uncertainty world economy or returns due to movements of financial
conditions. Measurement of business risk therefore involves describing and modeling
the return distribution of the relevant risk factors or instruments.
The conceptual framework of the study shows that the relationship between working
capital and profitability of a firm may be attributed with many factors. From
literature review we can deduce that working capital and profitability of a firm is
mainly affected by an increase in number of day’s accounts receivable, number of
day’s accounts payable, number of day’s inventories and cash conversion cycle leads
to decrease in profitability of companies. Figure 2.2 illustrates the conceptual
diagram of variables that has effect on the relationship between working capital and
profitability of the firm. A detailed explanation of these variables is outlined below;-
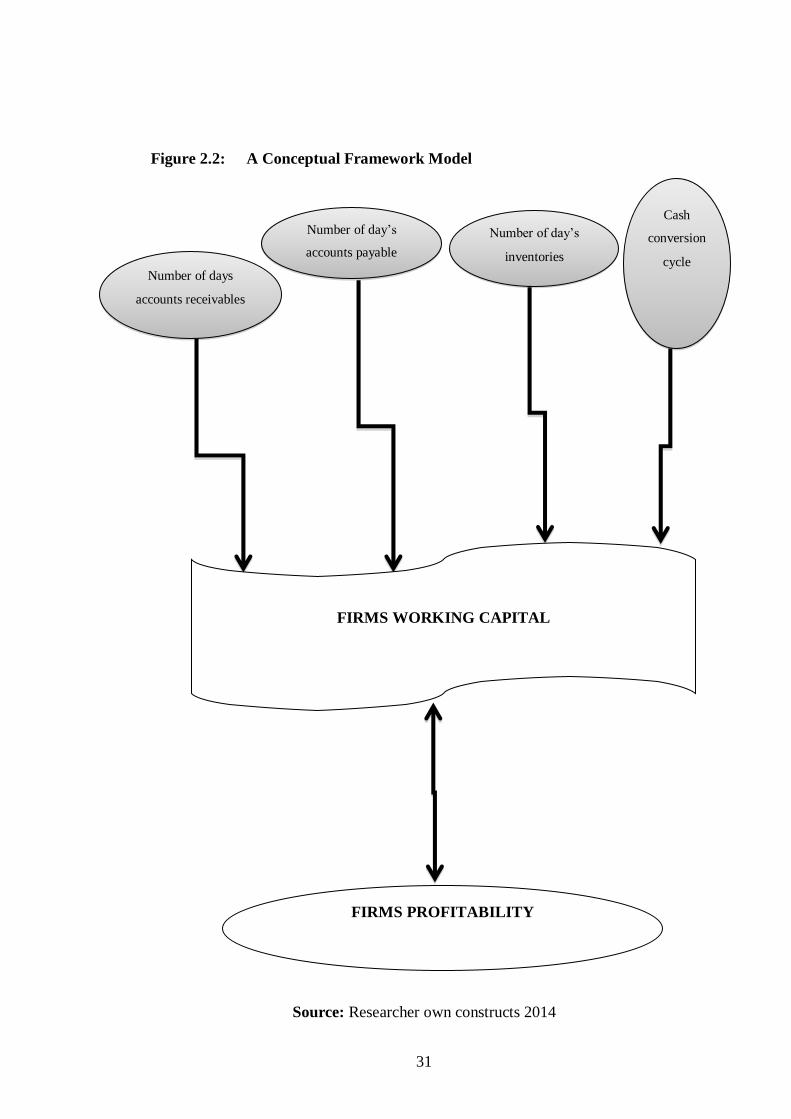
31
Figure 2.2: A Conceptual Framework Model
Source: Researcher own constructs 2014
Number of days
accounts receivables
Number of day’s
accounts payable
Cash
conversion
cycle
Number of day’s
inventories
FIRMS WORKING CAPITAL
FIRMS PROFITABILITY
32
2.5.1 Number of days accounts receivables
Number of days accounts receivables in this study is used as an accounting measure
used to quantify a firm's effectiveness in extending credit as well as collecting debts.
The receivables turnover ratio is an activity ratio, measuring how efficiently a firm
uses its assets. A turn of 12 would mean the receivables are collected on average
every 30 days.
2.5.2 Number of days accounts payable
In this study number of days accounts payable tells us how many times our turnover
our payables account per year. Accounts payable turnover ratio is calculated by
taking annualized materials COGS (supplier purchases) and dividing it by the
average accounts payable outstanding during the period. This is a short‐term liquidity
measure used to quantify the rate at which a company pays off its suppliers.
2.5.3 Number of days inventories
In this study number of days inventories is used as a ratio showing how many times a
company's inventory is sold and replaced over a one‐year period. Since inventory
represents the goods you sell, the more times you turn them over in a year usually the
better. Too many turns has the risk that if your sales are faster than you are
replenishing your inventory, you will not be able to fulfill orders. An inventory turn
of 12 is the same as having one month of inventory on hand for sale. How fast a
company collects its receivables, pays its bills, or “turns over” its inventory typically
has the most impact on a company’s cash flow. A company can have very good net
profits, but still run out of Cash if it does not manage these three metrics well.
2.5.4 Cash conversion cycle
In this study ccc is used as a measure of Receivables, Payables, and Inventory
reflected within the same time period. The CCC Measures how long a firm will be
deprived of cash if it increases its investment in resources in order to support
customer sales. It is thus a measure of liquidity risk. However, shortening the CCC
creates its own risks: while a firm could even achieve a negative CCC by collecting
from customers before paying suppliers, a policy of strict collections and lax
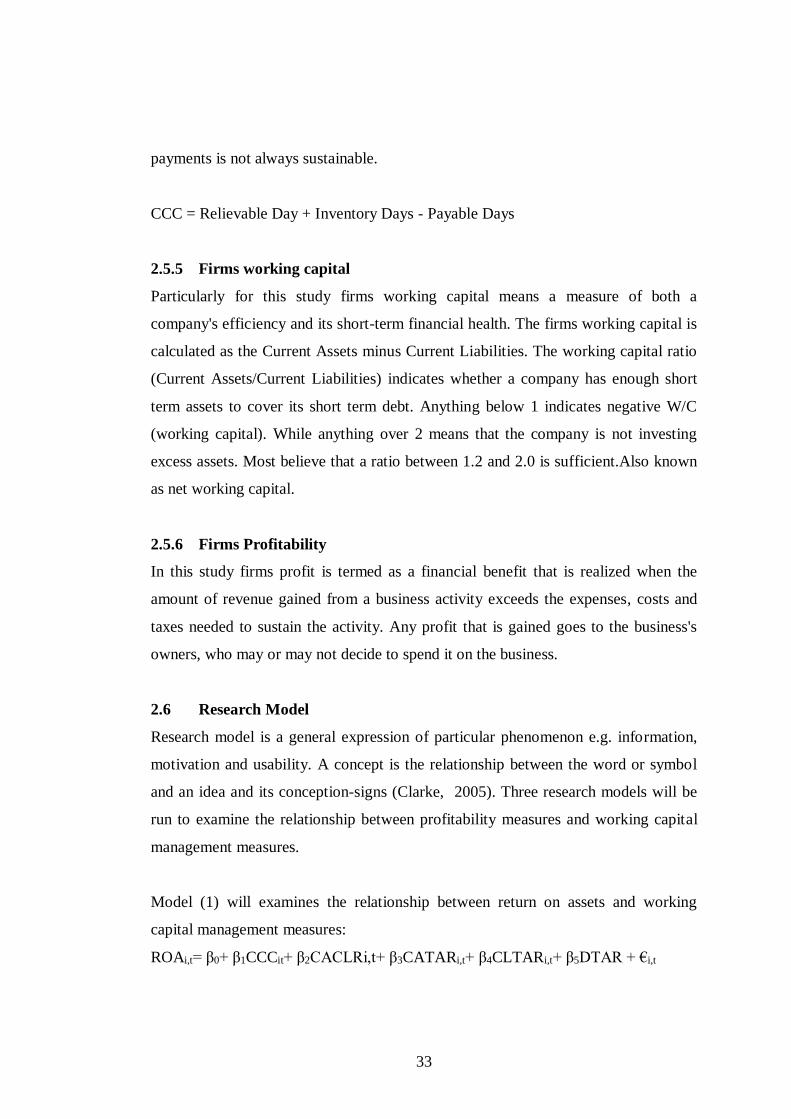
33
payments is not always sustainable.
CCC = Relievable Day + Inventory Days - Payable Days
2.5.5 Firms working capital
Particularly for this study firms working capital means a measure of both a
company's efficiency and its short-term financial health. The firms working capital is
calculated as the Current Assets minus Current Liabilities. The working capital ratio
(Current Assets/Current Liabilities) indicates whether a company has enough short
term assets to cover its short term debt. Anything below 1 indicates negative W/C
(working capital). While anything over 2 means that the company is not investing
excess assets. Most believe that a ratio between 1.2 and 2.0 is sufficient.Also known
as net working capital.
2.5.6 Firms Profitability
In this study firms profit is termed as a financial benefit that is realized when the
amount of revenue gained from a business activity exceeds the expenses, costs and
taxes needed to sustain the activity. Any profit that is gained goes to the business's
owners, who may or may not decide to spend it on the business.
2.6 Research Model
Research model is a general expression of particular phenomenon e.g. information,
motivation and usability. A concept is the relationship between the word or symbol
and an idea and its conception-signs (Clarke, 2005). Three research models will be
run to examine the relationship between profitability measures and working capital
management measures.
Model (1) will examines the relationship between return on assets and working
capital management measures:
ROAi,t= β0+ β1CCCit+ β2CACLRi,t+ β3CATARi,t+ β4CLTARi,t+ β5DTAR + €i,t
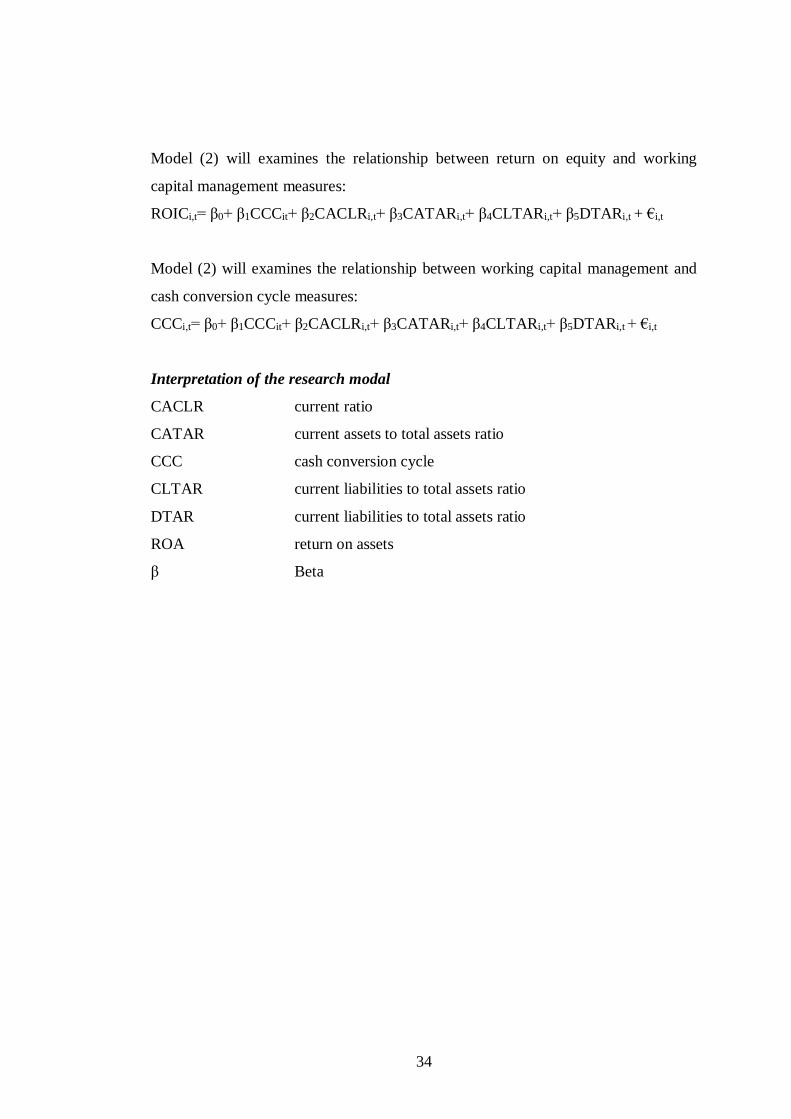
34
Model (2) will examines the relationship between return on equity and working
capital management measures:
ROICi,t= β0+ β1CCCit+ β2CACLRi,t+ β3CATARi,t+ β4CLTARi,t+ β5DTARi,t + €i,t
Model (2) will examines the relationship between working capital management and
cash conversion cycle measures:
CCCi,t= β0+ β1CCCit+ β2CACLRi,t+ β3CATARi,t+ β4CLTARi,t+ β5DTARi,t + €i,t
Interpretation of the research modal
CACLR current ratio
CATAR current assets to total assets ratio
CCC cash conversion cycle
CLTAR current liabilities to total assets ratio
DTAR current liabilities to total assets ratio
ROA return on assets
β Beta
35
CHAPTER THREE
RESEARCH METHODOLOGY
3.0 Introduction
The purpose of this chapter is to explain the research methodology relevant to this
research. In (2004) Kothari defined research methodology as a way to systematically
solving research problem. The chapter outlines methodology on how data and
information relevant to the research was gathered and analyzed to achieve the
objectives of the study.
3.1 Research Design
Research design is defined as a framework or blueprint that plans the action for the
research project (Zikmund, 2003). This study was descriptive research study. The
main reason for employing this design is to enable researcher to collect relevant
evidence pertaining the relationship between working capital management and
profitability of listed companies with minimal expenditure of effort, time and money.
3.2 Study Area
The study was conducted in a selected listed companies in the Dar es Salaam Stock
Exchange.
3.3 Population of the Study
According to Thomas (2004), a population may be defined as the total set of
elements we are interested in. The size of the population usually makes it impractical
and uneconomical to involve all members of the population in a research project
(Welman & Kruger, 2001). Samples are therefore drawn for investigation. Defining
the population we wish to study is an important prelude to being able to draw
samples from it (Thomas, 2004). The research objectives and scope of the study are
critical in defining the target population that was studied (Hair et al, 2003). As the
objective of this study was to assess the relationship between working capital
management and profitability of listed companies in Dar es Salaam stock exchange,
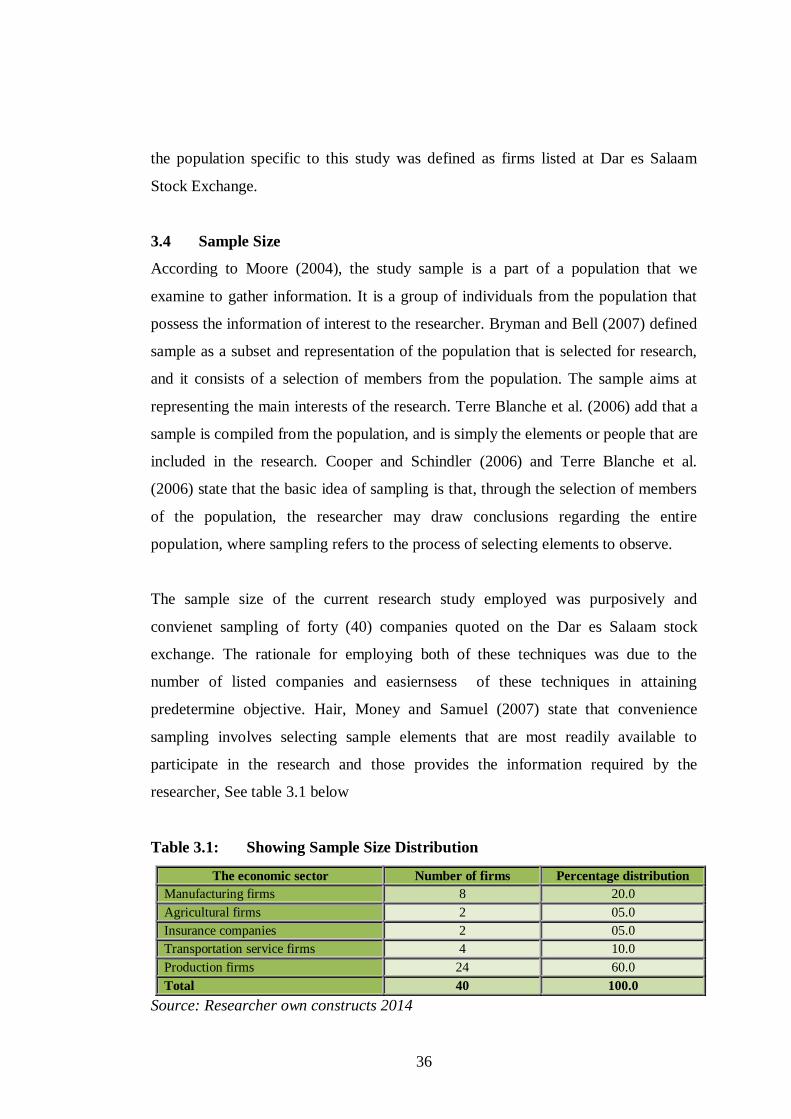
36
the population specific to this study was defined as firms listed at Dar es Salaam
Stock Exchange.
3.4 Sample Size
According to Moore (2004), the study sample is a part of a population that we
examine to gather information. It is a group of individuals from the population that
possess the information of interest to the researcher. Bryman and Bell (2007) defined
sample as a subset and representation of the population that is selected for research,
and it consists of a selection of members from the population. The sample aims at
representing the main interests of the research. Terre Blanche et al. (2006) add that a
sample is compiled from the population, and is simply the elements or people that are
included in the research. Cooper and Schindler (2006) and Terre Blanche et al.
(2006) state that the basic idea of sampling is that, through the selection of members
of the population, the researcher may draw conclusions regarding the entire
population, where sampling refers to the process of selecting elements to observe.
The sample size of the current research study employed was purposively and
convienet sampling of forty (40) companies quoted on the Dar es Salaam stock
exchange. The rationale for employing both of these techniques was due to the
number of listed companies and easiernsess of these techniques in attaining
predetermine objective. Hair, Money and Samuel (2007) state that convenience
sampling involves selecting sample elements that are most readily available to
participate in the research and those provides the information required by the
researcher, See table 3.1 below
Table 3.1: Showing Sample Size Distribution
The economic sector Number of firms Percentage distribution
Manufacturing firms 8 20.0
Agricultural firms 2 05.0
Insurance companies 2 05.0
Transportation service firms 4 10.0
Production firms 24 60.0
Total 40 100.0
Source: Researcher own constructs 2014
37
3.5 Sampling Procedure
The sampling procedure for this study included the following steps:
(i.) Obtaining a total list of all companies listed at Dar es Salaam Stock
Exchange.
(ii.) Select companies studied specifically profit oriented companies.
3.6 Types and Sources of Data
Data collection is the process of gathering and measuring information on variables of
interest, in an established systematic fashion that enables one to answer stated
research questions, test hypotheses, and evaluate outcomes. In order to achieve the
objective of this study only secondary data sources was employed.
3.7 Data Collection Technique
Data for the research study were collected by the aided of the following ways:
3.7.1 Documentation
This was including collecting information and data from published audited financial
statements, other reports and documents available at DSE and to the public at large.
3.7.2 Focused Panel Dialogue
The Focused Panel Dialogue (CPD) was carried out to compliment the secondary
source data. FPD in this study intended to explore the experiences of previous market
conditions and inflation rates.
3.8 Data Presentation and Analysis
Data are of little or no value merely as data (Zikmund, 2003). According to Kerlinger
(1973) content analysis refers to a technique used to analyze communication with
systematic, objectives and qualitative manner in order to measure variables. In this
research study quantitative data were analyzed by the aid of ratio analysis techniques
from 2008 to 2013, advanced excel and Statistical Package for Social Sciences
(SPSS) 16. Research findings are presented in the form tables, diagrams and graphs.
38
Regression analysis and Pearson Correlation were employed to test for the
relationship between WCM and Firms Profitability.
3.9 Chapter Summary
The use firms audited financial statements conducted assessment of the relationship
between working Capital Management and profitability.The study sample involves
seven (7) listed companies at DSE. Both primary and secondary data sources was
collected from a variety of sources such as books, journals, companies magazine and
internet surfing. SPSS, and Advanced Excel were employed to analyzed data
collected.
39
CHAPTER FOUR
PRESENTATION AND DISCUSSION OF FINDINGS
4.0 Introduction
The purpose of this chapter is to present and analyze data obtained in the analyzed
companies in simpler measures of statistics so that the data can be interpreted and
understood by the majority of people. The data presented in this chapter are the data
obtained from the three research questions respective to the specific research three
objectives.
4.1 Companies Information
The primary aim of this research study is to investigate the impact of WCM on
corporate profitability of Tanzania listed firms. With this in mind companies
background information was among the aspects of researcher’s investigation.
Researcher aimed at identifying whether the companies were listed in the Dar es
Salaam Stock Exchange. This analysis was classified in five economic sectors in
Tanzania as follows; - Alcoholic beverage firms, Manufacturing firms, agricultural
firms, Insurance firms, transportation services firms and other economic sector firms.
The data from these firms were obtained by analyzing there audited financial
statements from 2008 up to 2013.
4.1.1 Productions Firms
The researcher was interested in gathering data from twenty four (24) listed
productions companies in Tanzania. However DSE records shows that only four (4)
productions companies were listed up to 2014.
Analysis of the records shows existence of two (2) alcoholic beverage firms. Out of
the two (2) alcoholic beverage companies only one (1) company was listed/
registered with DSE. However the growth in the production of beer has been rather
flat due to high taxes, stiff competition from other beverage sub sectors and low
consumer spending. Increased economic integration is however likely to lead to
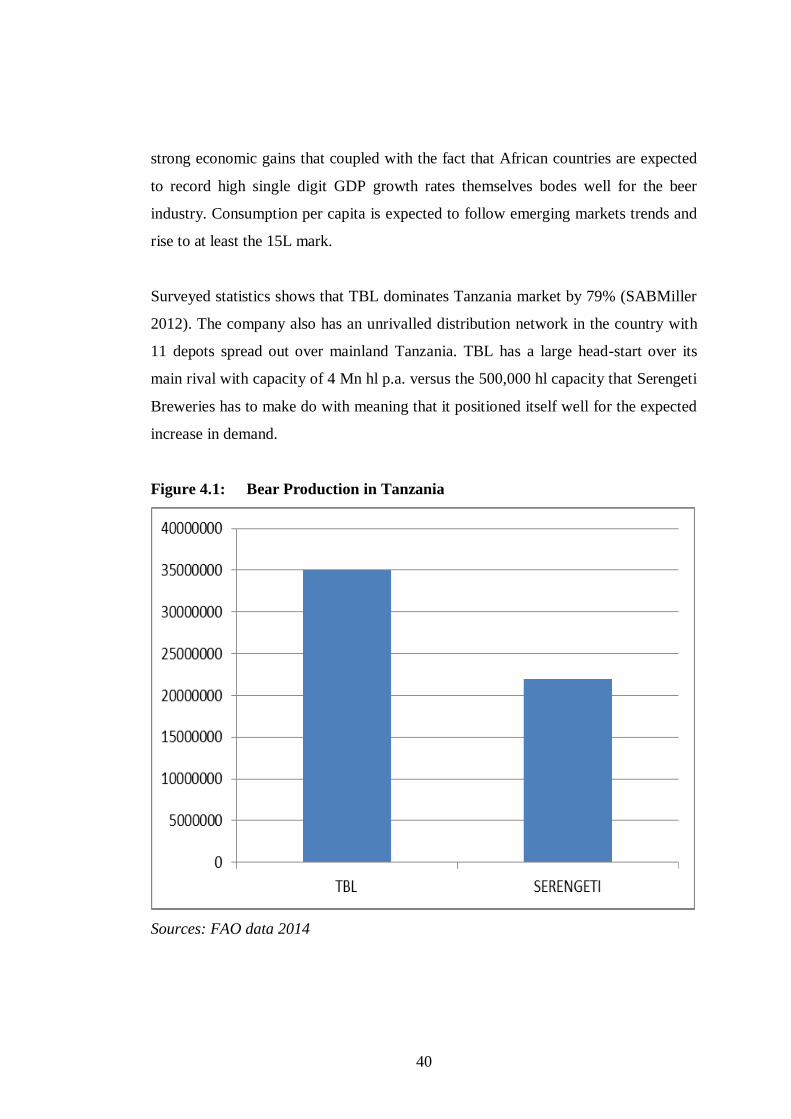
40
strong economic gains that coupled with the fact that African countries are expected
to record high single digit GDP growth rates themselves bodes well for the beer
industry. Consumption per capita is expected to follow emerging markets trends and
rise to at least the 15L mark.
Surveyed statistics shows that TBL dominates Tanzania market by 79% (SABMiller
2012). The company also has an unrivalled distribution network in the country with
11 depots spread out over mainland Tanzania. TBL has a large head-start over its
main rival with capacity of 4 Mn hl p.a. versus the 500,000 hl capacity that Serengeti
Breweries has to make do with meaning that it positioned itself well for the expected
increase in demand.
Figure 4.1: Bear Production in Tanzania
Sources: FAO data 2014
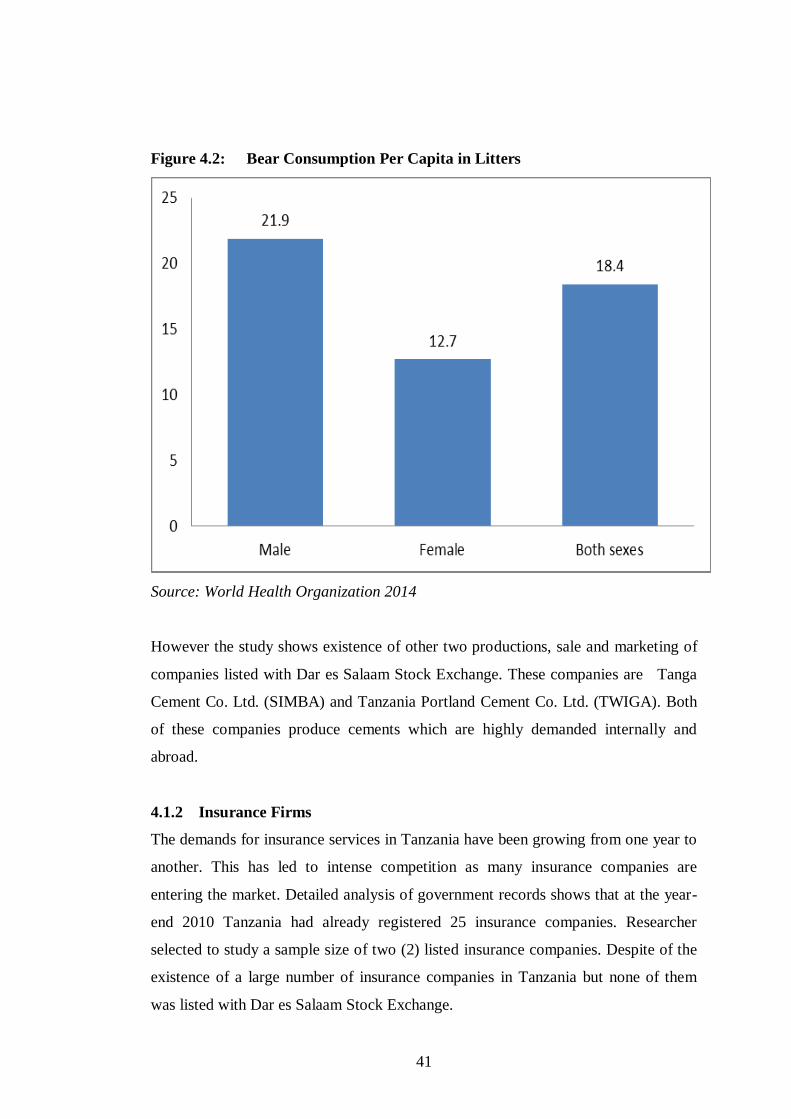
41
Figure 4.2: Bear Consumption Per Capita in Litters
Source: World Health Organization 2014
However the study shows existence of other two productions, sale and marketing of
companies listed with Dar es Salaam Stock Exchange. These companies are Tanga
Cement Co. Ltd. (SIMBA) and Tanzania Portland Cement Co. Ltd. (TWIGA). Both
of these companies produce cements which are highly demanded internally and
abroad.
4.1.2 Insurance Firms
The demands for insurance services in Tanzania have been growing from one year to
another. This has led to intense competition as many insurance companies are
entering the market. Detailed analysis of government records shows that at the year-
end 2010 Tanzania had already registered 25 insurance companies. Researcher
selected to study a sample size of two (2) listed insurance companies. Despite of the
existence of a large number of insurance companies in Tanzania but none of them
was listed with Dar es Salaam Stock Exchange.
42
4.1.3 Manufacturing Firms
The researcher was interested to include a sample size of eight (8) manufacturing
companies in this study equivalent to 100% of this economic sector. Analysis of DSE
registered manufacturing companies indicated that only one (1) company was listed
equals to 12.5%. This analysis implies that DSE has a lot to be done to ensure that
many manufacturing companies get listed in the near future.
4.1.4 Agricultural Sector Firms
It was expected that sample size from agricultural sector firms was 2 companies
equivalent to 100% from this economic sector. Review of DSE registration
documents only one agricultural company was listed equivalent to 50% of the
economic sector. The analysis implies that many agricultural firms should be
registered in order to foster economic development in agricultural sector.
4.1.5 Transportation Services Firms
From DSE surveyed statistics show that only two (2) transportation service firms
were registered out of the four (4) intended companies. This analysis implies that
DSE should encourage transportation companies in Tanzania to get listed at that
market.
4.2 Findings on the Working Capital Analysis
Survey statistics presented by Table 4.2 below shows that major components of
working capital include inventories (raw materials, work in progress and finished
goods), debtors, cash and bank balances. The composition of working capital
depends on a multiple of factors, such as operating level, level of operational
efficiency, inventory policies, book debt polies, technology used and nature of the
industry. Table 4.1 below presents analysis of each component of working capital
and some other interesting trends.
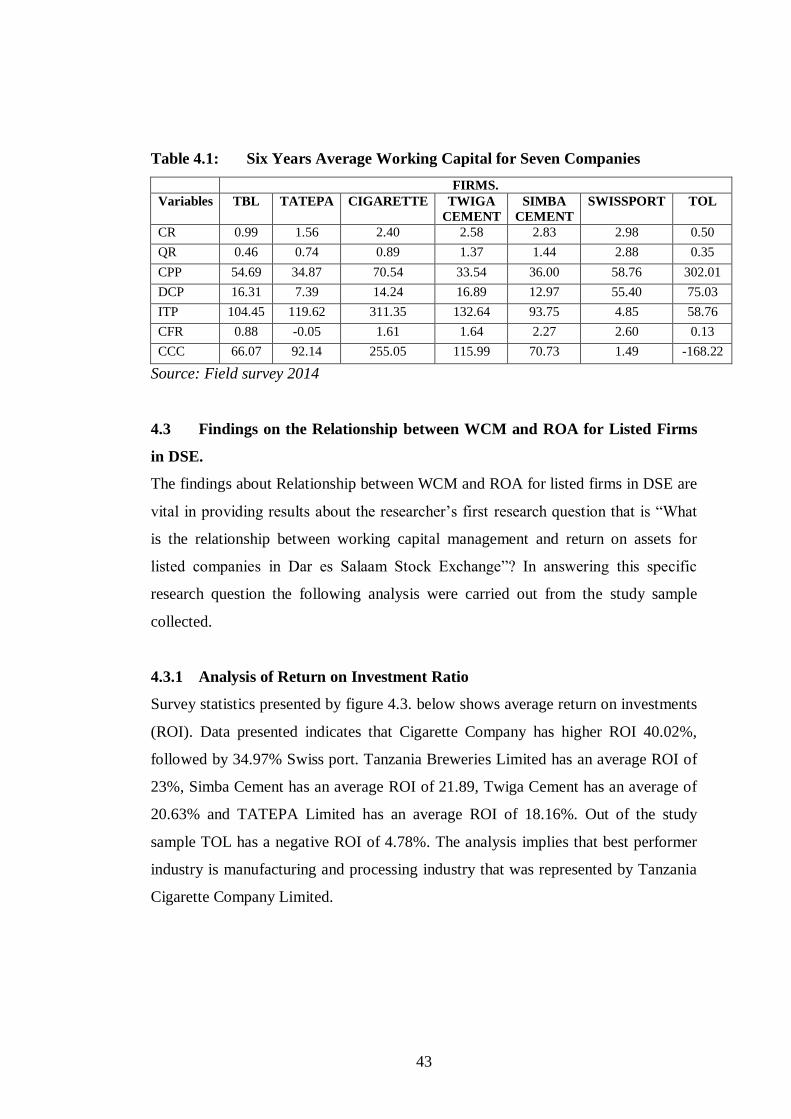
43
Table 4.1: Six Years Average Working Capital for Seven Companies
FIRMS.
Variables TBL TATEPA CIGARETTE TWIGA
CEMENT
SIMBA
CEMENT
SWISSPORT TOL
CR 0.99 1.56 2.40 2.58 2.83 2.98 0.50
QR 0.46 0.74 0.89 1.37 1.44 2.88 0.35
CPP 54.69 34.87 70.54 33.54 36.00 58.76 302.01
DCP 16.31 7.39 14.24 16.89 12.97 55.40 75.03
ITP 104.45 119.62 311.35 132.64 93.75 4.85 58.76
CFR 0.88 -0.05 1.61 1.64 2.27 2.60 0.13
CCC 66.07 92.14 255.05 115.99 70.73 1.49 -168.22
Source: Field survey 2014
4.3 Findings on the Relationship between WCM and ROA for Listed Firms
in DSE.
The findings about Relationship between WCM and ROA for listed firms in DSE are
vital in providing results about the researcher’s first research question that is “What
is the relationship between working capital management and return on assets for
listed companies in Dar es Salaam Stock Exchange”? In answering this specific
research question the following analysis were carried out from the study sample
collected.
4.3.1 Analysis of Return on Investment Ratio
Survey statistics presented by figure 4.3. below shows average return on investments
(ROI). Data presented indicates that Cigarette Company has higher ROI 40.02%,
followed by 34.97% Swiss port. Tanzania Breweries Limited has an average ROI of
23%, Simba Cement has an average ROI of 21.89, Twiga Cement has an average of
20.63% and TATEPA Limited has an average ROI of 18.16%. Out of the study
sample TOL has a negative ROI of 4.78%. The analysis implies that best performer
industry is manufacturing and processing industry that was represented by Tanzania
Cigarette Company Limited.
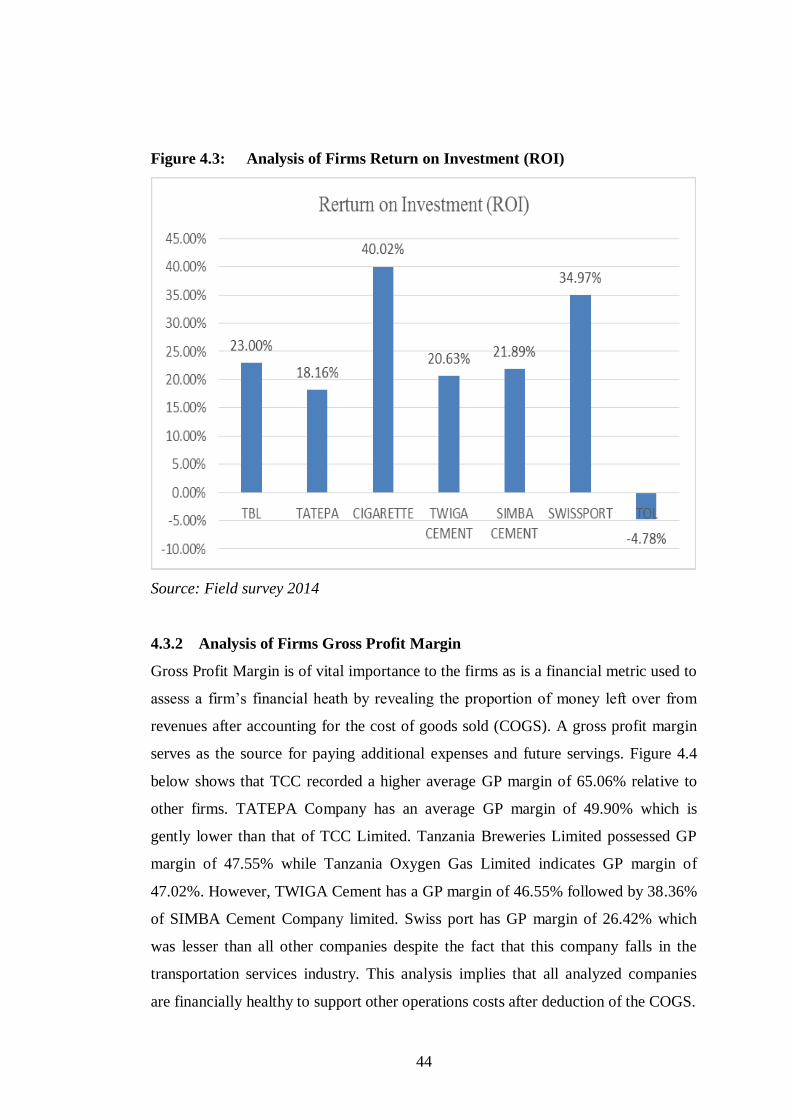
44
Figure 4.3: Analysis of Firms Return on Investment (ROI)
Source: Field survey 2014
4.3.2 Analysis of Firms Gross Profit Margin
Gross Profit Margin is of vital importance to the firms as is a financial metric used to
assess a firm’s financial heath by revealing the proportion of money left over from
revenues after accounting for the cost of goods sold (COGS). A gross profit margin
serves as the source for paying additional expenses and future servings. Figure 4.4
below shows that TCC recorded a higher average GP margin of 65.06% relative to
other firms. TATEPA Company has an average GP margin of 49.90% which is
gently lower than that of TCC Limited. Tanzania Breweries Limited possessed GP
margin of 47.55% while Tanzania Oxygen Gas Limited indicates GP margin of
47.02%. However, TWIGA Cement has a GP margin of 46.55% followed by 38.36%
of SIMBA Cement Company limited. Swiss port has GP margin of 26.42% which
was lesser than all other companies despite the fact that this company falls in the
transportation services industry. This analysis implies that all analyzed companies
are financially healthy to support other operations costs after deduction of the COGS.
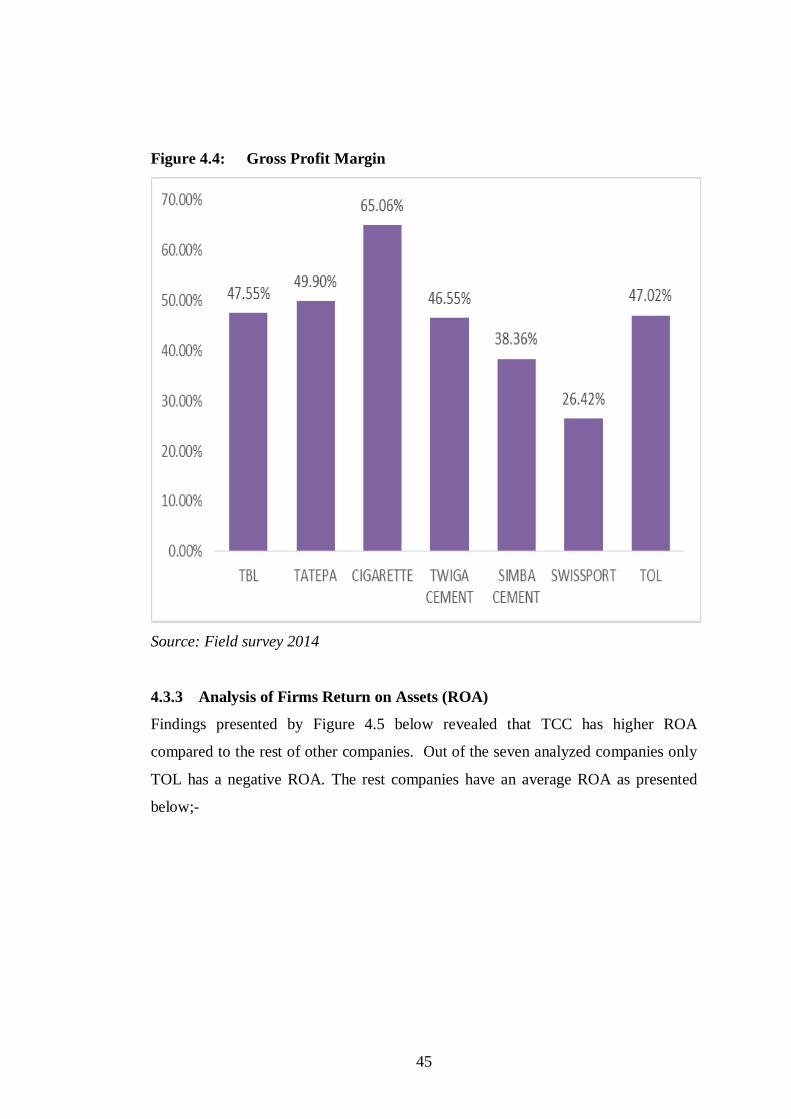
45
Figure 4.4: Gross Profit Margin
Source: Field survey 2014
4.3.3 Analysis of Firms Return on Assets (ROA)
Findings presented by Figure 4.5 below revealed that TCC has higher ROA
compared to the rest of other companies. Out of the seven analyzed companies only
TOL has a negative ROA. The rest companies have an average ROA as presented
below;-
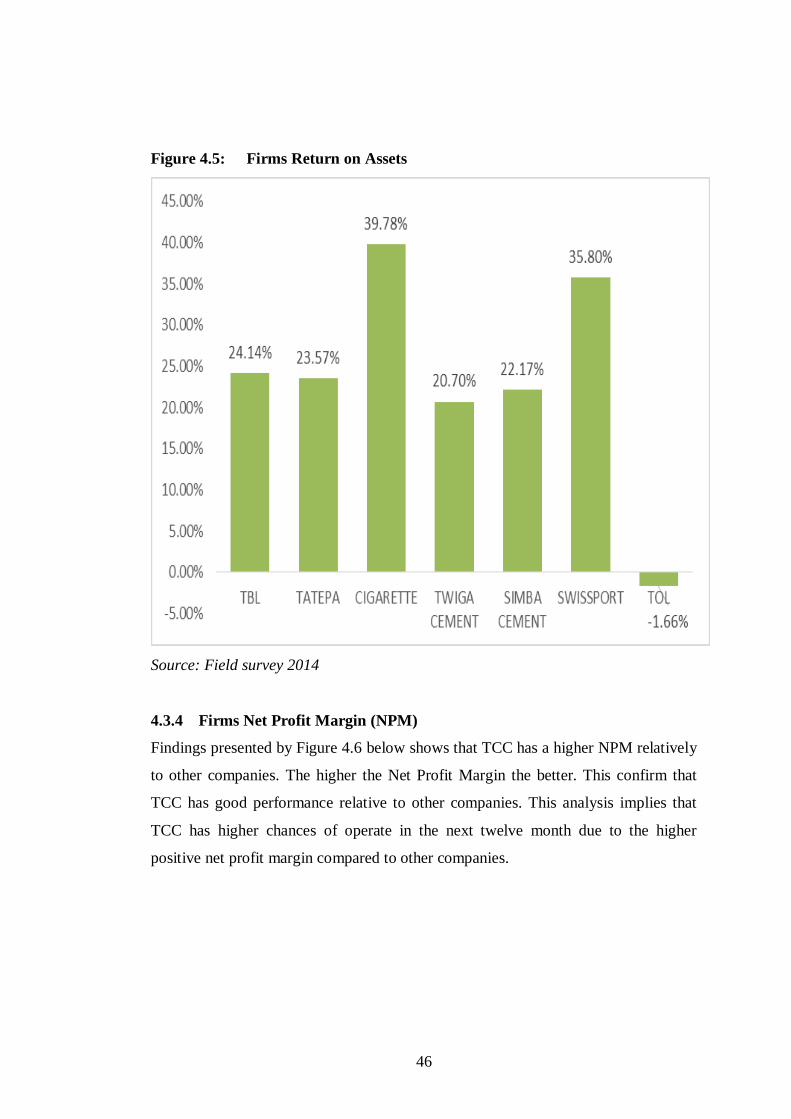
46
Figure 4.5: Firms Return on Assets
Source: Field survey 2014
4.3.4 Firms Net Profit Margin (NPM)
Findings presented by Figure 4.6 below shows that TCC has a higher NPM relatively
to other companies. The higher the Net Profit Margin the better. This confirm that
TCC has good performance relative to other companies. This analysis implies that
TCC has higher chances of operate in the next twelve month due to the higher
positive net profit margin compared to other companies.
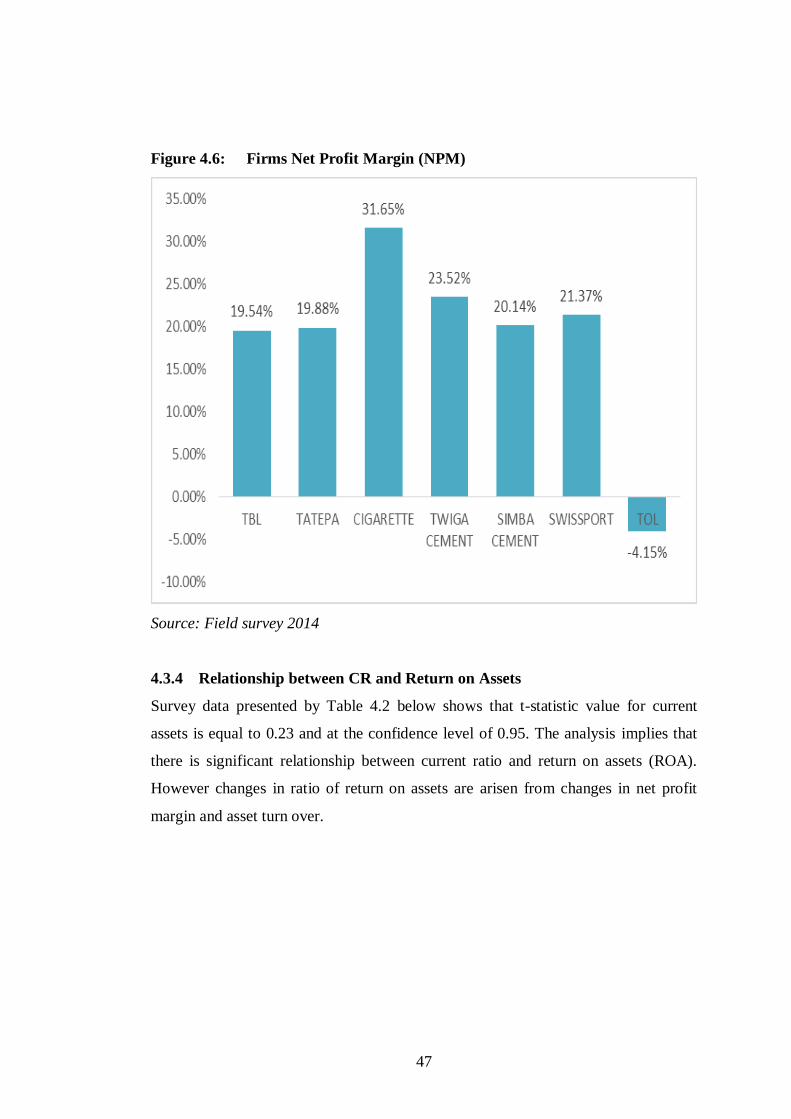
47
Figure 4.6: Firms Net Profit Margin (NPM)
Source: Field survey 2014
4.3.4 Relationship between CR and Return on Assets
Survey data presented by Table 4.2 below shows that t-statistic value for current
assets is equal to 0.23 and at the confidence level of 0.95. The analysis implies that
there is significant relationship between current ratio and return on assets (ROA).
However changes in ratio of return on assets are arisen from changes in net profit
margin and asset turn over.
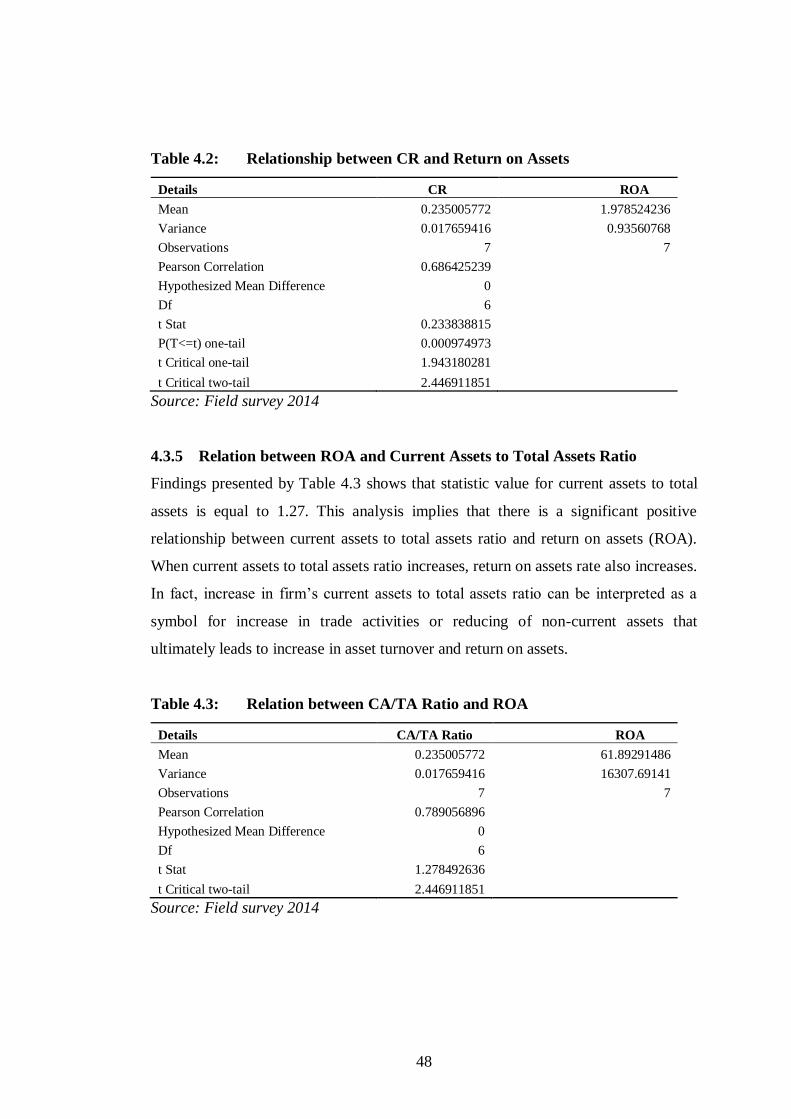
48
Table 4.2: Relationship between CR and Return on Assets
Details CR ROA
Mean 0.235005772 1.978524236
Variance 0.017659416 0.93560768
Observations 7 7
Pearson Correlation 0.686425239
Hypothesized Mean Difference 0
Df 6
t Stat 0.233838815
P(T<=t) one-tail 0.000974973
t Critical one-tail 1.943180281
t Critical two-tail 2.446911851
Source: Field survey 2014
4.3.5 Relation between ROA and Current Assets to Total Assets Ratio
Findings presented by Table 4.3 shows that statistic value for current assets to total
assets is equal to 1.27. This analysis implies that there is a significant positive
relationship between current assets to total assets ratio and return on assets (ROA).
When current assets to total assets ratio increases, return on assets rate also increases.
In fact, increase in firm’s current assets to total assets ratio can be interpreted as a
symbol for increase in trade activities or reducing of non-current assets that
ultimately leads to increase in asset turnover and return on assets.
Table 4.3: Relation between CA/TA Ratio and ROA
Details CA/TA Ratio ROA
Mean 0.235005772 61.89291486
Variance 0.017659416 16307.69141
Observations 7 7
Pearson Correlation 0.789056896
Hypothesized Mean Difference 0
Df 6
t Stat 1.278492636
t Critical two-tail 2.446911851
Source: Field survey 2014
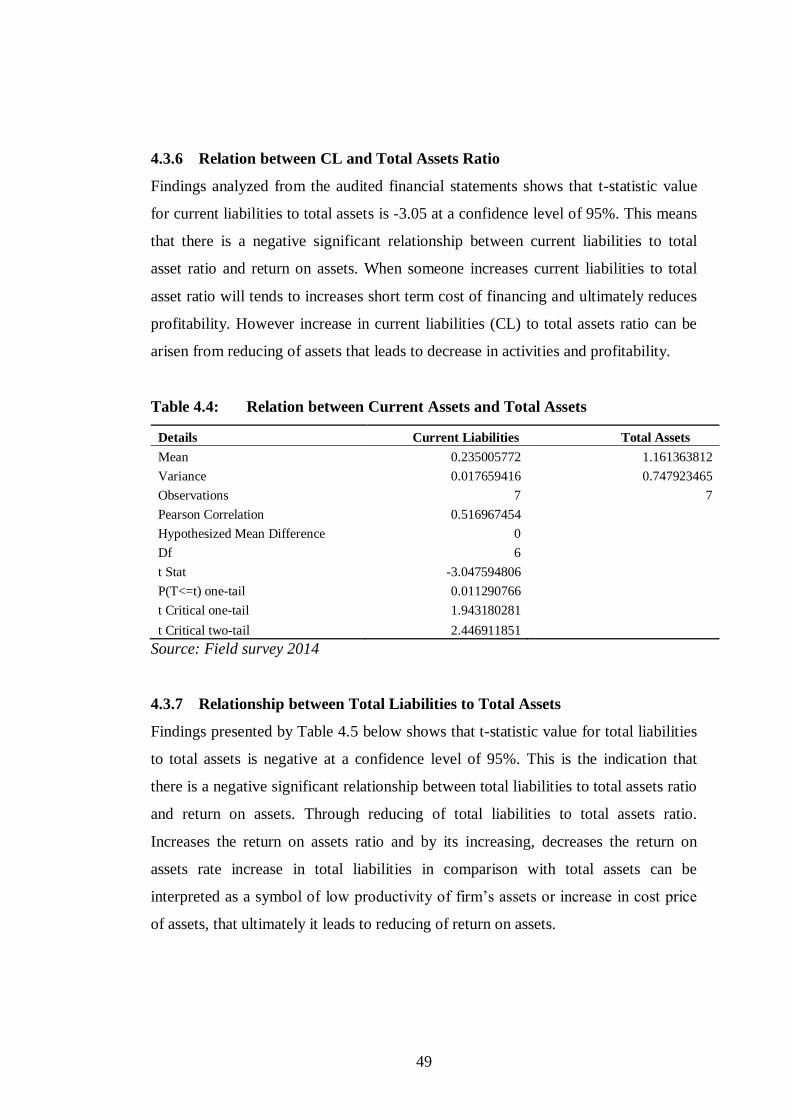
49
4.3.6 Relation between CL and Total Assets Ratio
Findings analyzed from the audited financial statements shows that t-statistic value
for current liabilities to total assets is -3.05 at a confidence level of 95%. This means
that there is a negative significant relationship between current liabilities to total
asset ratio and return on assets. When someone increases current liabilities to total
asset ratio will tends to increases short term cost of financing and ultimately reduces
profitability. However increase in current liabilities (CL) to total assets ratio can be
arisen from reducing of assets that leads to decrease in activities and profitability.
Table 4.4: Relation between Current Assets and Total Assets
Details Current Liabilities Total Assets
Mean 0.235005772 1.161363812
Variance 0.017659416 0.747923465
Observations 7 7
Pearson Correlation 0.516967454
Hypothesized Mean Difference 0
Df 6
t Stat -3.047594806
P(T<=t) one-tail 0.011290766
t Critical one-tail 1.943180281
t Critical two-tail 2.446911851
Source: Field survey 2014
4.3.7 Relationship between Total Liabilities to Total Assets
Findings presented by Table 4.5 below shows that t-statistic value for total liabilities
to total assets is negative at a confidence level of 95%. This is the indication that
there is a negative significant relationship between total liabilities to total assets ratio
and return on assets. Through reducing of total liabilities to total assets ratio.
Increases the return on assets ratio and by its increasing, decreases the return on
assets rate increase in total liabilities in comparison with total assets can be
interpreted as a symbol of low productivity of firm’s assets or increase in cost price
of assets, that ultimately it leads to reducing of return on assets.
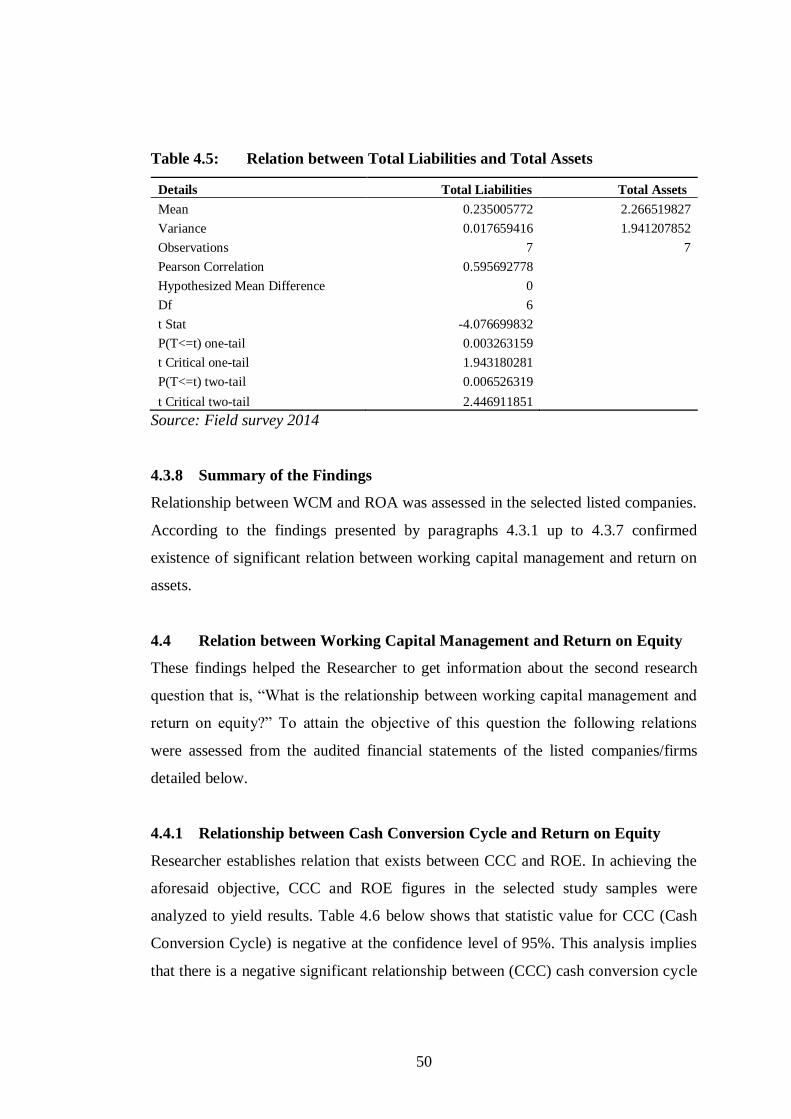
50
Table 4.5: Relation between Total Liabilities and Total Assets
Details Total Liabilities Total Assets
Mean 0.235005772 2.266519827
Variance 0.017659416 1.941207852
Observations 7 7
Pearson Correlation 0.595692778
Hypothesized Mean Difference 0
Df 6
t Stat -4.076699832
P(T<=t) one-tail 0.003263159
t Critical one-tail 1.943180281
P(T<=t) two-tail 0.006526319
t Critical two-tail 2.446911851
Source: Field survey 2014
4.3.8 Summary of the Findings
Relationship between WCM and ROA was assessed in the selected listed companies.
According to the findings presented by paragraphs 4.3.1 up to 4.3.7 confirmed
existence of significant relation between working capital management and return on
assets.
4.4 Relation between Working Capital Management and Return on Equity
These findings helped the Researcher to get information about the second research
question that is, “What is the relationship between working capital management and
return on equity?” To attain the objective of this question the following relations
were assessed from the audited financial statements of the listed companies/firms
detailed below.
4.4.1 Relationship between Cash Conversion Cycle and Return on Equity
Researcher establishes relation that exists between CCC and ROE. In achieving the
aforesaid objective, CCC and ROE figures in the selected study samples were
analyzed to yield results. Table 4.6 below shows that statistic value for CCC (Cash
Conversion Cycle) is negative at the confidence level of 95%. This analysis implies
that there is a negative significant relationship between (CCC) cash conversion cycle
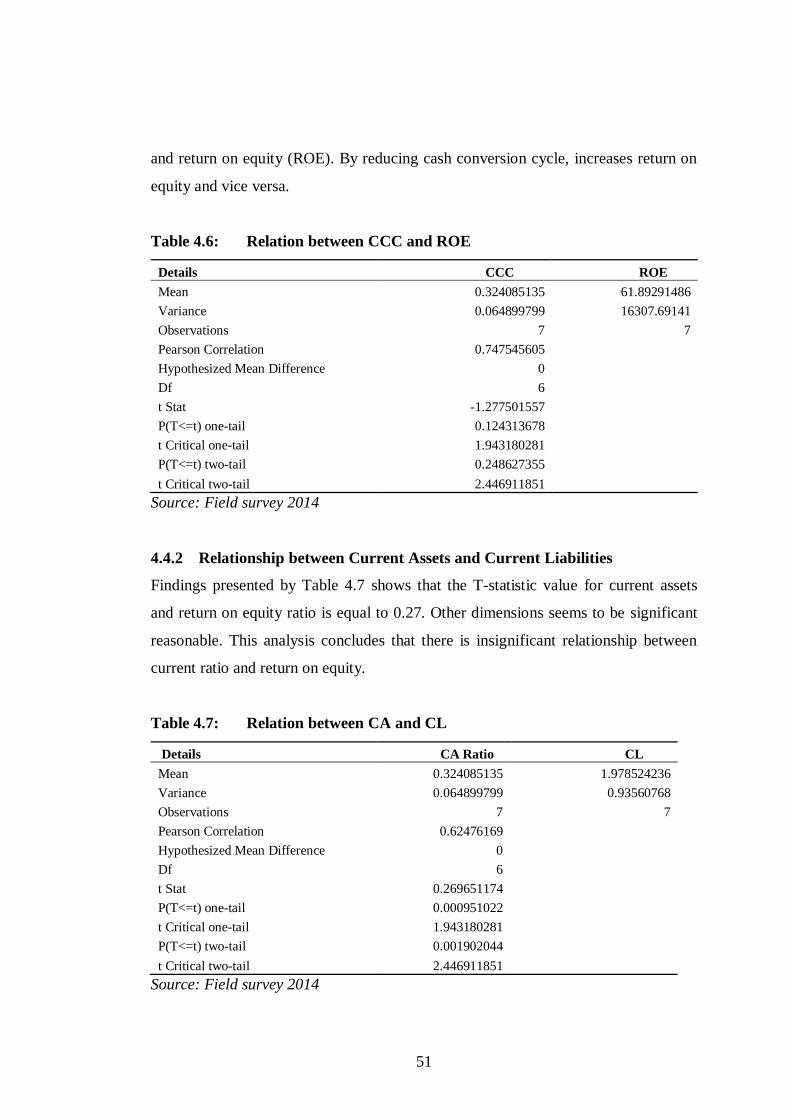
51
and return on equity (ROE). By reducing cash conversion cycle, increases return on
equity and vice versa.
Table 4.6: Relation between CCC and ROE
Details CCC ROE
Mean 0.324085135 61.89291486
Variance 0.064899799 16307.69141
Observations 7 7
Pearson Correlation 0.747545605
Hypothesized Mean Difference 0
Df 6
t Stat -1.277501557
P(T<=t) one-tail 0.124313678
t Critical one-tail 1.943180281
P(T<=t) two-tail 0.248627355
t Critical two-tail 2.446911851
Source: Field survey 2014
4.4.2 Relationship between Current Assets and Current Liabilities
Findings presented by Table 4.7 shows that the T-statistic value for current assets
and return on equity ratio is equal to 0.27. Other dimensions seems to be significant
reasonable. This analysis concludes that there is insignificant relationship between
current ratio and return on equity.
Table 4.7: Relation between CA and CL
Details CA Ratio CL
Mean 0.324085135 1.978524236
Variance 0.064899799 0.93560768
Observations 7 7
Pearson Correlation 0.62476169
Hypothesized Mean Difference 0
Df 6
t Stat 0.269651174
P(T<=t) one-tail 0.000951022
t Critical one-tail 1.943180281
P(T<=t) two-tail 0.001902044
t Critical two-tail 2.446911851
Source: Field survey 2014
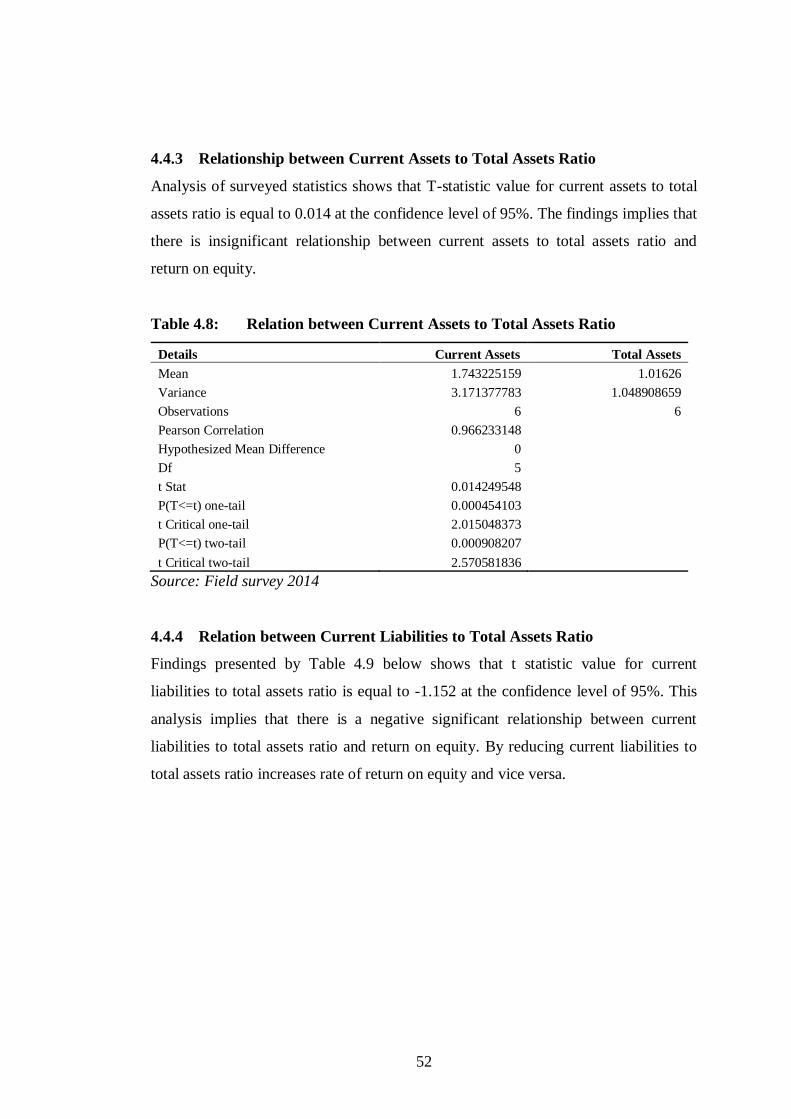
52
4.4.3 Relationship between Current Assets to Total Assets Ratio
Analysis of surveyed statistics shows that T-statistic value for current assets to total
assets ratio is equal to 0.014 at the confidence level of 95%. The findings implies that
there is insignificant relationship between current assets to total assets ratio and
return on equity.
Table 4.8: Relation between Current Assets to Total Assets Ratio
Details Current Assets Total Assets
Mean 1.743225159 1.01626
Variance 3.171377783 1.048908659
Observations 6 6
Pearson Correlation 0.966233148
Hypothesized Mean Difference 0
Df 5
t Stat 0.014249548
P(T<=t) one-tail 0.000454103
t Critical one-tail 2.015048373
P(T<=t) two-tail 0.000908207
t Critical two-tail 2.570581836
Source: Field survey 2014
4.4.4 Relation between Current Liabilities to Total Assets Ratio
Findings presented by Table 4.9 below shows that t statistic value for current
liabilities to total assets ratio is equal to -1.152 at the confidence level of 95%. This
analysis implies that there is a negative significant relationship between current
liabilities to total assets ratio and return on equity. By reducing current liabilities to
total assets ratio increases rate of return on equity and vice versa.
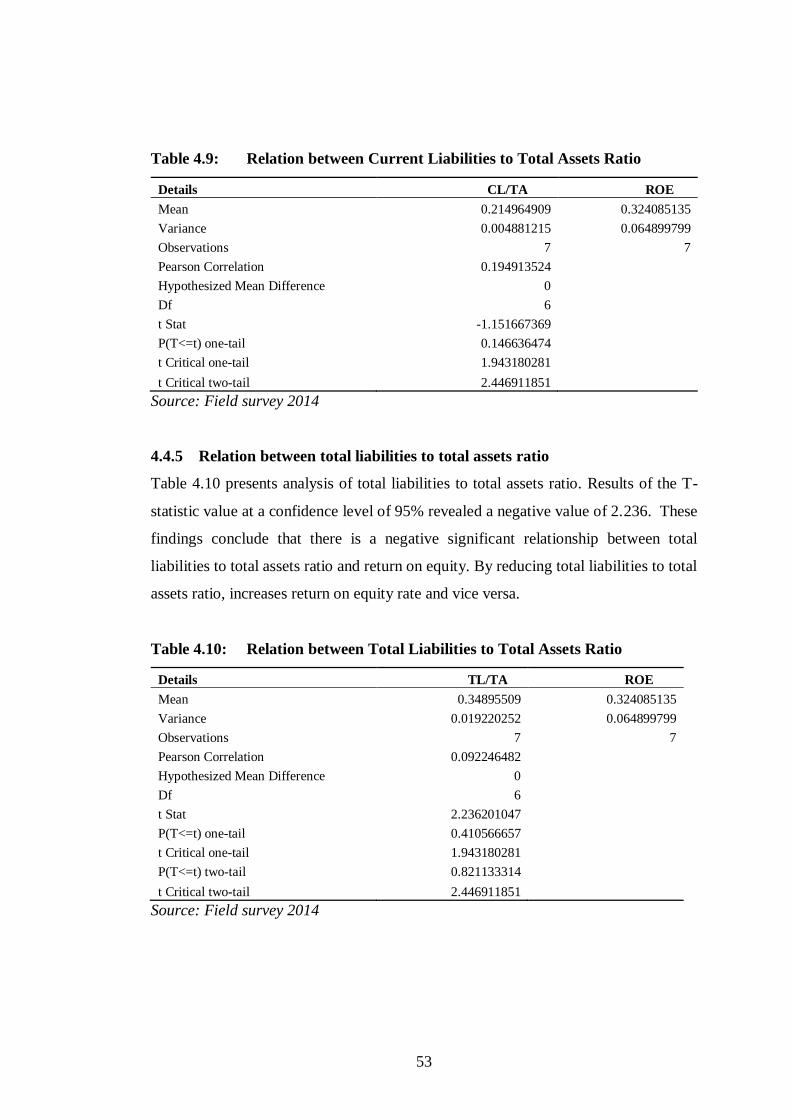
53
Table 4.9: Relation between Current Liabilities to Total Assets Ratio
Details CL/TA ROE
Mean 0.214964909 0.324085135
Variance 0.004881215 0.064899799
Observations 7 7
Pearson Correlation 0.194913524
Hypothesized Mean Difference 0
Df 6
t Stat -1.151667369
P(T<=t) one-tail 0.146636474
t Critical one-tail 1.943180281
t Critical two-tail 2.446911851
Source: Field survey 2014
4.4.5 Relation between total liabilities to total assets ratio
Table 4.10 presents analysis of total liabilities to total assets ratio. Results of the T-
statistic value at a confidence level of 95% revealed a negative value of 2.236. These
findings conclude that there is a negative significant relationship between total
liabilities to total assets ratio and return on equity. By reducing total liabilities to total
assets ratio, increases return on equity rate and vice versa.
Table 4.10: Relation between Total Liabilities to Total Assets Ratio
Details TL/TA ROE
Mean 0.34895509 0.324085135
Variance 0.019220252 0.064899799
Observations 7 7
Pearson Correlation 0.092246482
Hypothesized Mean Difference 0
Df 6
t Stat 2.236201047
P(T<=t) one-tail 0.410566657
t Critical one-tail 1.943180281
P(T<=t) two-tail 0.821133314
t Critical two-tail 2.446911851
Source: Field survey 2014
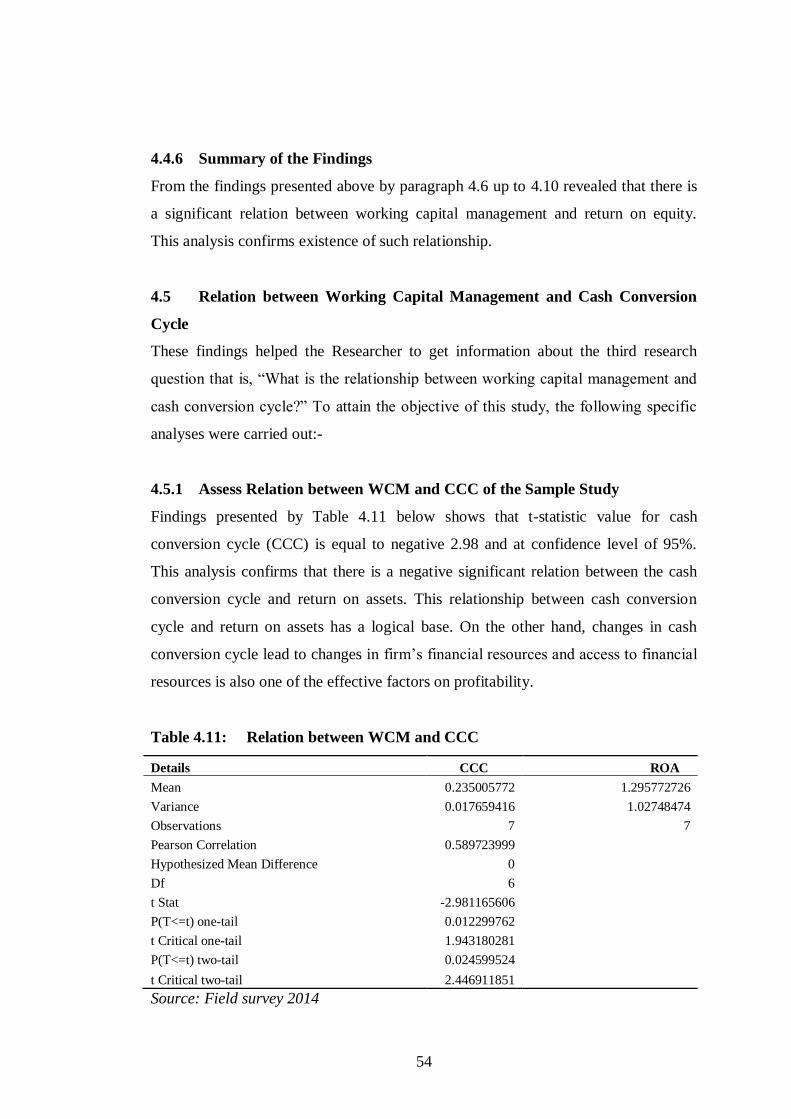
54
4.4.6 Summary of the Findings
From the findings presented above by paragraph 4.6 up to 4.10 revealed that there is
a significant relation between working capital management and return on equity.
This analysis confirms existence of such relationship.
4.5 Relation between Working Capital Management and Cash Conversion
Cycle
These findings helped the Researcher to get information about the third research
question that is, “What is the relationship between working capital management and
cash conversion cycle?” To attain the objective of this study, the following specific
analyses were carried out:-
4.5.1 Assess Relation between WCM and CCC of the Sample Study
Findings presented by Table 4.11 below shows that t-statistic value for cash
conversion cycle (CCC) is equal to negative 2.98 and at confidence level of 95%.
This analysis confirms that there is a negative significant relation between the cash
conversion cycle and return on assets. This relationship between cash conversion
cycle and return on assets has a logical base. On the other hand, changes in cash
conversion cycle lead to changes in firm’s financial resources and access to financial
resources is also one of the effective factors on profitability.
Table 4.11: Relation between WCM and CCC
Details CCC ROA
Mean 0.235005772 1.295772726
Variance 0.017659416 1.02748474
Observations 7 7
Pearson Correlation 0.589723999
Hypothesized Mean Difference 0
Df 6
t Stat -2.981165606
P(T<=t) one-tail 0.012299762
t Critical one-tail 1.943180281
P(T<=t) two-tail 0.024599524
t Critical two-tail 2.446911851
Source: Field survey 2014
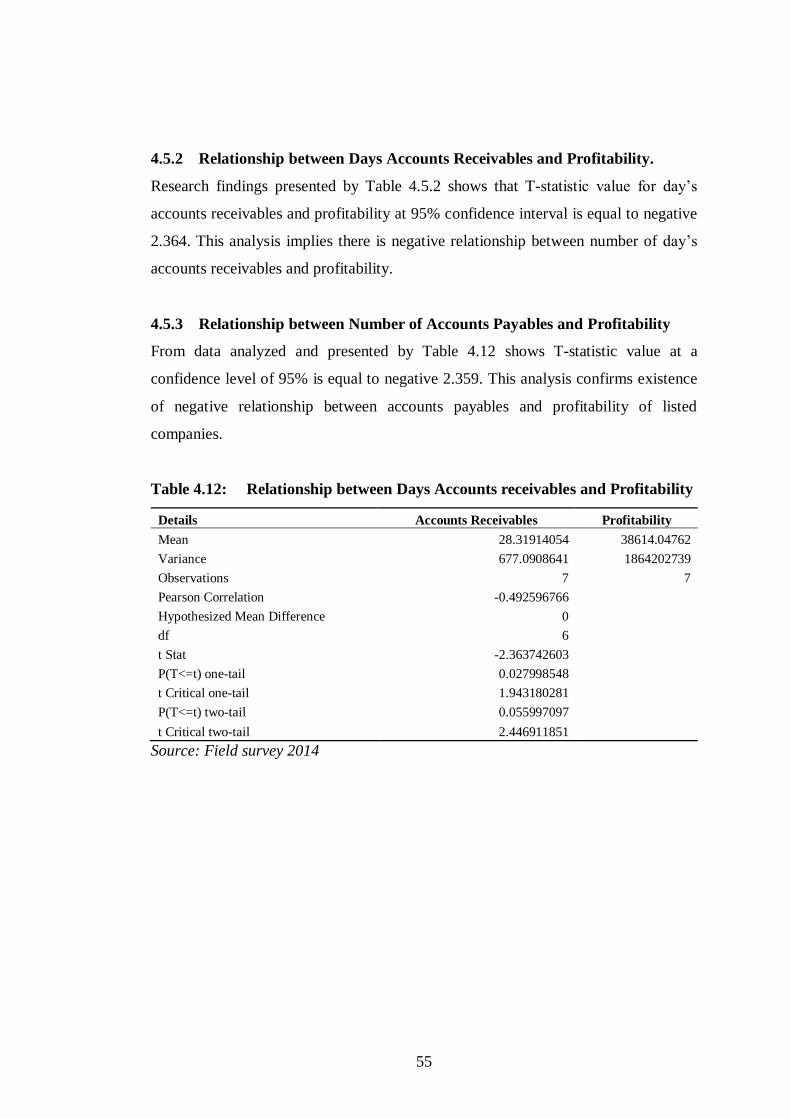
55
4.5.2 Relationship between Days Accounts Receivables and Profitability.
Research findings presented by Table 4.5.2 shows that T-statistic value for day’s
accounts receivables and profitability at 95% confidence interval is equal to negative
2.364. This analysis implies there is negative relationship between number of day’s
accounts receivables and profitability.
4.5.3 Relationship between Number of Accounts Payables and Profitability
From data analyzed and presented by Table 4.12 shows T-statistic value at a
confidence level of 95% is equal to negative 2.359. This analysis confirms existence
of negative relationship between accounts payables and profitability of listed
companies.
Table 4.12: Relationship between Days Accounts receivables and Profitability
Details Accounts Receivables Profitability
Mean 28.31914054 38614.04762
Variance 677.0908641 1864202739
Observations 7 7
Pearson Correlation -0.492596766
Hypothesized Mean Difference 0
df 6
t Stat -2.363742603
P(T<=t) one-tail 0.027998548
t Critical one-tail 1.943180281
P(T<=t) two-tail 0.055997097
t Critical two-tail 2.446911851
Source: Field survey 2014
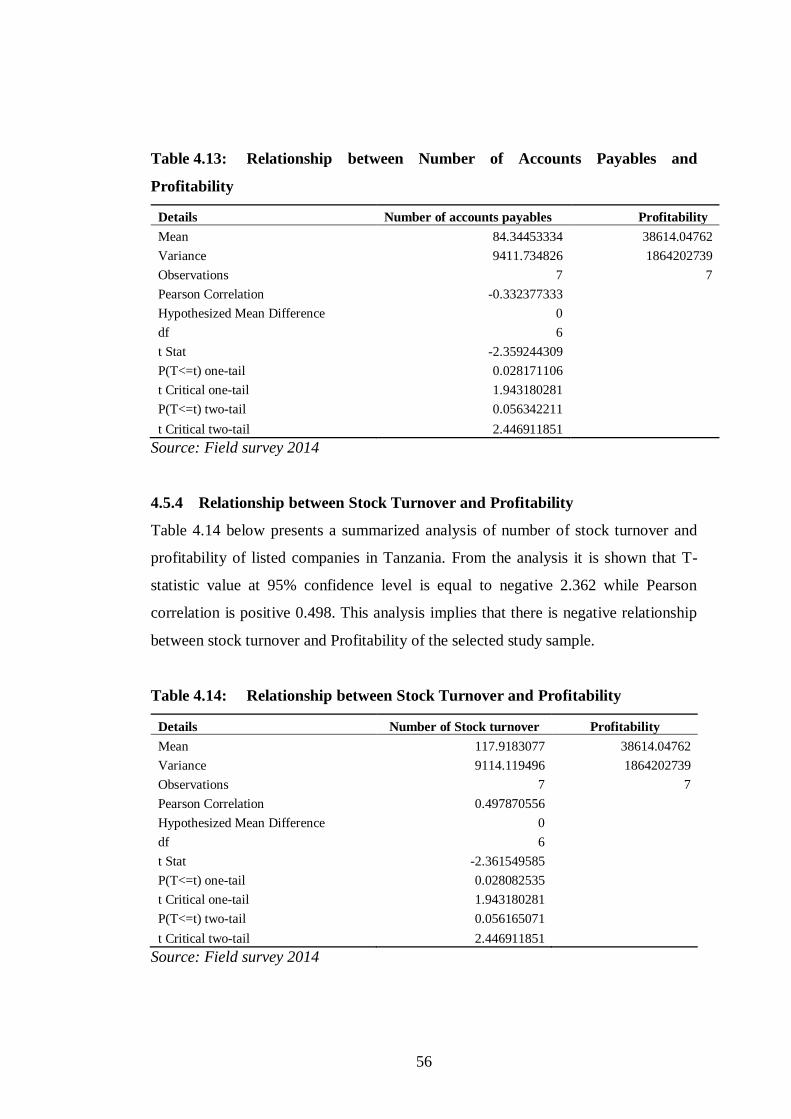
56
Table 4.13: Relationship between Number of Accounts Payables and
Profitability
Details Number of accounts payables Profitability
Mean 84.34453334 38614.04762
Variance 9411.734826 1864202739
Observations 7 7
Pearson Correlation -0.332377333
Hypothesized Mean Difference 0
df 6
t Stat -2.359244309
P(T<=t) one-tail 0.028171106
t Critical one-tail 1.943180281
P(T<=t) two-tail 0.056342211
t Critical two-tail 2.446911851
Source: Field survey 2014
4.5.4 Relationship between Stock Turnover and Profitability
Table 4.14 below presents a summarized analysis of number of stock turnover and
profitability of listed companies in Tanzania. From the analysis it is shown that T-
statistic value at 95% confidence level is equal to negative 2.362 while Pearson
correlation is positive 0.498. This analysis implies that there is negative relationship
between stock turnover and Profitability of the selected study sample.
Table 4.14: Relationship between Stock Turnover and Profitability
Details Number of Stock turnover Profitability
Mean 117.9183077 38614.04762
Variance 9114.119496 1864202739
Observations 7 7
Pearson Correlation 0.497870556
Hypothesized Mean Difference 0
df 6
t Stat -2.361549585
P(T<=t) one-tail 0.028082535
t Critical one-tail 1.943180281
P(T<=t) two-tail 0.056165071
t Critical two-tail 2.446911851
Source: Field survey 2014

57
4.5.5 Summary of the Findings
The existence of a negative significant relationship between cash conversion cycle
(CCC) and return on assets and there is also a negative significant relationship
between cash conversion cycle (CCC) and return on equity. The study also noted
existence of a negative relationship between number of day’s accounts receivable,
number of day’s inventories, number of days accounts payable, cash conversion
cycle and profitability.
58
CHAPTER FIVE
SUMMARY, RECOMMENDATIONS AND CONCLUSION
5.0 Introduction
This chapter provides summary of the main findings and recommendations from the
study. The summary and recommendations are derived from the findings of the
study, which are presented in chapter four. This chapter also suggests areas thought
necessary for further research.
5.1 Summary of the Main Findings
This category presents the summary of main findings of the relationship between
working capital management and return on assets, the relation between working
capital management and return on equity and the relationship between working
capital management and cash conversion cycle.
5.1.1 Relationship between WCM and ROA.
From the findings there was a negative relationship between total liabilities to total
assets ratio and profitability (return on assets to return on equity). The analysis
implies that Firms must, identity the ways which lead to reduce the productivity of
firms’ assets or increase in cost price of assets by reviewing their plans. It was
discovered that there was a negative relationship between current liabilities to total
assets ratio and profitability. Firms must adopt suitable policies for the management
of cash in financing part and sales; meanwhile have to use suitable policies in order
to prevent from reducing of assets.
5.1.2 Relationship between WCM and ROE.
It was further observed that existence of a positive relationship between current
assets to total assets ratio and profitability. Listed companies must adopt suitable
policy for financing and assets turnover in order to increase in return on assets rates
and profitability. The study also revealed that there was negative significant
59
relationship between cash conversion cycle (CCC) and return on equity. However,
the relationship between current ratio and return on equity is insignificant.
5.1.3 Relationship between WCM and CCC.
Study findings revealed that there was a negative relationship between cash
conversion cycle and profitability. Research findings also show that there exist
negative relationship between number of day’s accounts receivable, number of day’s
inventories, member of days accounts payable, cash conversion cycle and
profitability. This implies that for the Companies to improve their operation and
increase in shareholder’s wealth, must adopt policies and plans to reduce number of
day accounts receivable.
5.2 Conclusion
5.2.1 Research objective 1: Relationship between WCM and ROA for listed
firms.
It was observed that there are various ways to which firms could use to relate total
assets and total liabilities. This includes improve companies productivity or increase
in cost price of assets by reviewing organization plans. It was also noted that listed
companies must adopt suitable policy for financing and assets turnover in order to
increase in return on assets rates and profitability.
5.2.2 Research objective 2: Relationship between WCM and ROE.
The study findings revealed that there was negative significant relationship between
cash conversion cycle (CCC) and return on equity. However, the relationship
between current ratio and return on equity is insignificant.
5.2.3 Research objective 3: Relationship between WCM and CCC.
Study findings show that there exist negative relationship between number of day’s
accounts receivable, number of day’s inventories, member of days accounts payable,
cash conversion cycle and profitability. From study findings, it can be inferred that
60
one of the reasons for negative relationship between current liabilities to total assets
ratio and profitability was poor cash management policies in financing part and sales.
5.3 Recommendations
Based on the study findings on the assessment of the relationship between working
capital management and profitability of listed companies in Dar es Salaam stock
exchange.
5.3.1 Research objective 1: Relationship between WCM and ROA for listed
firms.
The study recommend the following; the listed companies should design suitable
ways for improving productivity of firms’ assets or increase in cost price of assets by
reviewing their plans.
5.3.2 Research objective 2: Relationship between WCM and ROE.
The study also recommends that listed companies must adopt suitable policy for
financing and assets turnover in order to increase in return on assets rates and
profitability.
5.3.3 Research objective 3: Relationship between WCM and CCC.
The study also recommends that listed Companies must adopt policies and plans to
reduce number of day accounts receivable this will improve their operation and
increase in shareholder’s wealth.
5.4 Recommendations Further Research
This research work focused on the assessment of the relationship between working
capital management and profitability of listed companies in Dar es Salaam stock
exchange. However the study did not investigated the following area which are
outlined below;-
(i.) Financial Institutions such as banks that were listed in the Dar es Salaam
Stock Exchange
(ii.) Non-profit making companies/firms and construction companies.
61
REFERENCES
Acorn Professional Tutors (2014); the components of working capital management
Baveld B. Mathias 2012, ‘Impact of Working Capital Management on the
Profitability of Public Listed Firms in the Netherlands during the
Financial Crisis’, University of TWENTE
Besley, S., and Brigham, E., (2005), Essentials of Managerial Finance, 13th Edition,
Thomson.
Deloof, M. (2003), “Dies Working Capital Management Affect Profitability of
Belgian Firms?” Journal of Business Finance and Accounting, Vol.
30, 3 and 4
Hair JF, Babin B, Money AH & Samouel P. 2003. Essentials of business research
Izadinia, Naser; Taki, Abdullah (2010), “Examination the effects of working capital
management an capability of profitability for listed companies on
Tehran stock exchange”, Journal –Financial Accounting Research;
No. 5
Mohammadi, Mohammad (2009), “effects of working capital management on
companies’ profitability of listed companies on Tehran stock
exchange”, Journal of management, No. 14
Neveu, Reymond (2001), Financial Management, volume 1, translator: Ali
jhankhany – Ali passayyan, Samt Publication.
Padachi, K. (2006). Trends in Working Capital Management and its Impact on
Firms’ Performance: An analysis of Mauritian small manufacturing
firms. International Review of Business Research Papers, 2(2)
62
Pike Richard and Bill Neale (2006) “Corporate Finance and Investment Decisions
and Strategies”, Published by Prentice Hall, Fifty Edition.
Quayyum, S. T. (2012). Relationship between Working Capital Management and
Profitability in Context of Manufacturing Industries in Bangladesh.
International Journal of Business and Management, 7 (1)
Rahman and Nasr, (2007), “Working Capital Management and Profitability: Case of
Pakistan Firms” International Review of Business Research Paper
Vol. 3.
Samiloglu, F. & Demirgunes, K. (2008). The Effects of Working Capital
Management on Firm Profitability: Evidence from Turkey. The
international Journal of Applied Economics and Finance
Shah, S. M. & Sana, A. (2006). Impact of Working Capital Management on the
Profitability of Oil and Gas Sector of Pakistan. European Journal of
Scientific Research, 15(3)
Sharma, A.K. & Kumar, S. (2011). Effect of Working Capital Management on Firm
Profitability: Empirical Evidence from India. Global Business
Review, 12
Thomas AB. 2004. Research skills for management studies. Routledge.
Ujar, A. (2009). The Relationship of Cash Conversion Cycle with Firm Size and
profitability: An Empirical Investigation in Turkey. International
Research Journal of Finance and Economics, 24(2009)
Wang, Y.J. (2002). Liquidity Management, Operating Performance, and Corporate
Value: Evidence from Japan and Taiwan. Journal of Multinational
Financial Management. 12
63
Welman C & Kruger F. 2001. Research Methodology for the business and
administrative sciences. Cape Town: Oxford University Press.
Yaaqobnejad, Ahmad, et al. (2010), “The relationship between working capital
management and profitability of listed companies an Tehran stock
exchange”, Journal of Financial engineering and portfolio
management, No. 2 methods. Hoboken: Wiley.
Zikmund WG. 2003. Business Research Methods. Mason USA: Thomson.
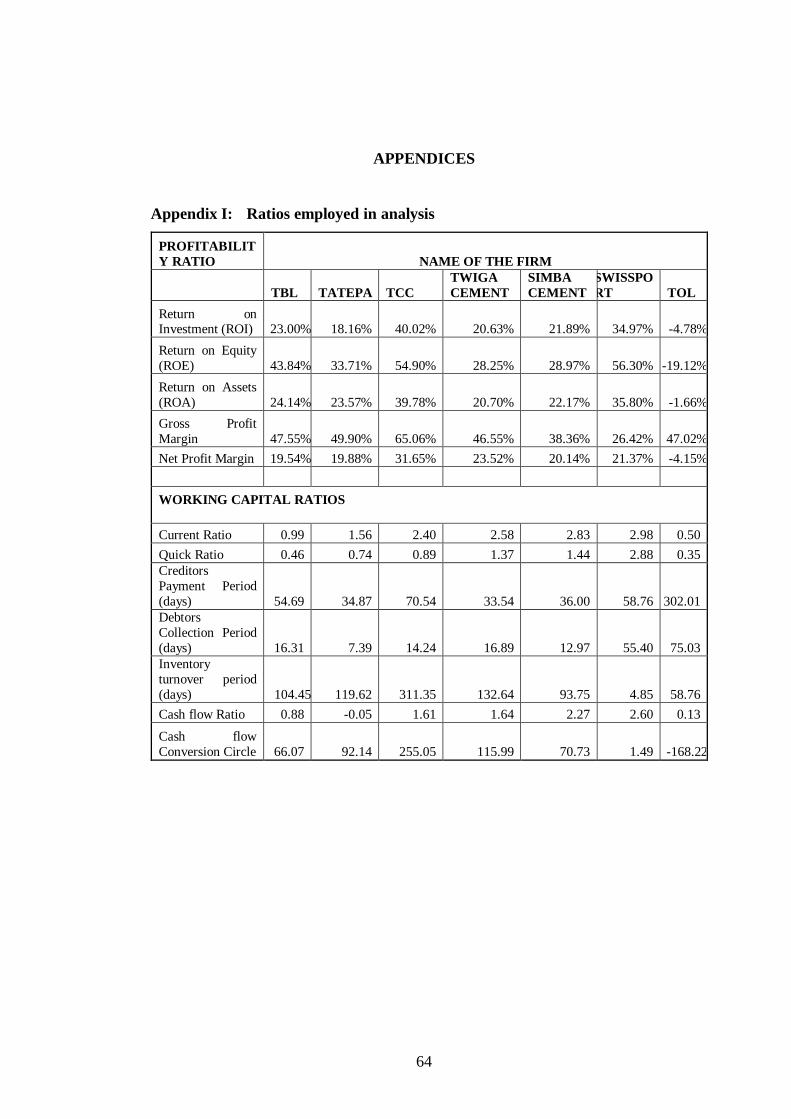
64
APPENDICES
Appendix I: Ratios employed in analysis
PROFITABILIT
Y RATIO NAME OF THE FIRM
TBL TATEPA TCC
TWIGA
CEMENT
SIMBA
CEMENT
SWISSPO
RT TOL
Return on Investment (ROI) 23.00% 18.16% 40.02% 20.63% 21.89% 34.97% -4.78%
Return on Equity
(ROE) 43.84% 33.71% 54.90% 28.25% 28.97% 56.30% -19.12%
Return on Assets
(ROA) 24.14% 23.57% 39.78% 20.70% 22.17% 35.80% -1.66%
Gross Profit
Margin 47.55% 49.90% 65.06% 46.55% 38.36% 26.42% 47.02%
Net Profit Margin 19.54% 19.88% 31.65% 23.52% 20.14% 21.37% -4.15%
WORKING CAPITAL RATIOS
Current Ratio 0.99 1.56 2.40 2.58 2.83 2.98 0.50
Quick Ratio 0.46 0.74 0.89 1.37 1.44 2.88 0.35
Creditors
Payment Period
(days) 54.69 34.87 70.54 33.54 36.00 58.76 302.01
Debtors
Collection Period
(days) 16.31 7.39 14.24 16.89 12.97 55.40 75.03
Inventory
turnover period
(days) 104.45 119.62 311.35 132.64 93.75 4.85 58.76
Cash flow Ratio 0.88 -0.05 1.61 1.64 2.27 2.60 0.13
Cash flow
Conversion Circle 66.07 92.14 255.05 115.99 70.73 1.49 -168.22