Embed Size (px)
Citation preview

Journal of Environmental Protection, 2014, 5, 120-134 Published Online February 2014 (http://www.scirp.org/journal/jep) http://dx.doi.org/10.4236/jep.2014.52016
Assessment of the Level of Awareness of E-Waste Management and Concern for the Environment amongst the Populace in Onitsha, Southeastern Nigeria
Anthony Okoye*, Chijioke Odoh
Department of Environmental Management, Nnamdi Azikiwe University, Awka, Nigeria. Email: *[email protected] Received October 9th, 2013; revised November 8th, 2013; accepted December 7th, 2013 Copyright © 2014 Anthony Okoye, Chijioke Odoh. This is an open access article distributed under the Creative Commons Attribu-tion License, which permits unrestricted use, distribution, and reproduction in any medium, provided the original work is properly cited. In accordance of the Creative Commons Attribution License all Copyrights © 2014 are reserved for SCIRP and the owner of the intellectual property Anthony Okoye, Chijioke Odoh. All Copyright © 2014 are guarded by law and by SCIRP as a guardian.
ABSTRACT This study was carried out to ascertain the peoples’ level of awareness of the regulation, their mode of disposal of the e-wastes and their awareness of the dangers inherent in improper handling and disposal of wastes. Data for this study were collected through the distribution of 247 well-structured questionnaires. Likert Scale was adopted for the analysis of the respondents. The results revealed that awareness is critically low. Though the respondents have concern for their environment in various degrees, majority dispose their e-waste alongside municipal wastes without knowing the implications. Awareness strategy was designed for sensitization campaign. KEYWORDS Awareness; Disposal; E-Waste; Strategy; Campaign
1. Introduction The present level of development globally cannot be sustained without steady advances in information and communication technology (ICT). The increasing de- mand for consumer electronics and electric products combined with the accelerated pace at which technology is evolving has inevitably resulted in an increase amount of obsolete, discarded, broken or abandoned products that must be treated by the society [1]. Currently, waste electrical and electronic equipment (WEEE) or electronic waste (e-waste) generation, trans-boundary movement and disposal are becoming issues of concern to the solid waste management professionals, environmental experts, international agencies and governments around the world [2,3].
Consumer electronics are the fastest growing sector of municipal solid waste (MSW) in both developed and developing countries and arguably one of the most toxic [4]. For instance, it has been estimated that 500 million PCs worldwide reached the end of their life in the decade
between 1994 and 2003 [5,6]. All these wastes contain valuable materials as well as large quantities of poten- tially hazardous materials.
Trans-boundry movement of e-waste from developed countries and rapidly rising sales of electronic goods have led to astronomical increase of hazardous electronic wastes in developing countries. Presently, large quanti- ties of e-wastes which are largely and illegally imported are being managed in Nigeria using various inappropriate routes that create the possibility for environmental pollu-tion (e.g. disposal with municipal solid waste and open burning) [7]. An estimated 400,000 units of secondhand desktop computers (PCs or monitors) are imported into Nigeria every month [8,9]. A large proportion of the im-ported used electronic are non-functional and are never reused but rather disposed of with municipal solid waste into open dumps which are most often set on fire. Vari-ous studies have assessed the public’s perception of the local environmental quality, environmental awareness, and environmental performance and their willingness to pay extra for efforts aimed at improving environmental quality [7]. Considering the global increase in awareness *Corresponding author.
OPEN ACCESS JEP
Assessment of the Level of Awareness of E-Waste Management and Concern for the Environment amongst the Populace in Onitsha, Southeastern Nigeria
121
of the problems of electronic waste management, studies have been focusing on the willingness of residents to purchase environmental friendly “green” products and to participate in e-waste recycling [10-12].
Onitsha, in Anambra State houses one of the biggest markets in West Africa. Several containers of electronic goods including those that are brand new and fairly used come into the commercial city on daily basis. Due to the current urbanization trend, traders from various countries, states and tribes live in the city or visit the town steadily. This has increased exponentially the amount of e-waste generated. The informal waste collectors (scavengers) are mainly the set of people that sort and collect these e- wastes from waste bins and dumps in the city. The sca-vengers, technicians and repairers process these e-wastes in unsound environmental manner even without their per- sonal protective equipment. All these contravene the pro- visions of the “National Environmental (Electrical/Elec- tronic Sector), 2011”; the enforcement/implementation of which is yet below sea level. Hence, there is an urgent need to ascertain the peoples’ level of awareness of the provisions of the regulation, whether they adhere to it or have concern for their immediate environment. The study equally seeks to find out people’s mode of disposal of the e-wastes and their awareness of the dangers inherent in improper handling and disposal of wastes. This will not only inform the government on the extent of awareness creation needed but will also make plans to embark on an e-waste recycling program that at least provides deposit centers for the people .
2. Methodology 2.1. Questionnaire Distribution Data for this study were collected through the distribu- tion of 176 well structured questionnaires distributed among different respondents ranging from importers (11), scavengers (55) and householders (110). Onitsha was selected because it houses one of the biggest markets in West Africa where both new and “fairly” used electron- ics are imported in the largest quantity in southeastern Nigeria.
The survey instrument focused on the various respon- dents’ level of awareness of government regulation and their adherence to it on e-waste management as well as their concern about the environment. It also investigated the respective respondents’ mode of disposal of e-waste as well as their awareness of the harmful nature of the waste. The questionnaires were distributed by hand which created room for one on one interaction with the respondents.
2.2. Statistical Analysis Statistical approach adopted for the analysis of the res-
pondents was Likert Scale Analysis in which responses were coded using figures to quantify the responses. Means of coding values were used as critical region and mean responses were compared with the critical region to determine the hypothesis to accept.
Also, charts were used for better understanding of available data, as well as, the demographic information of respondents.
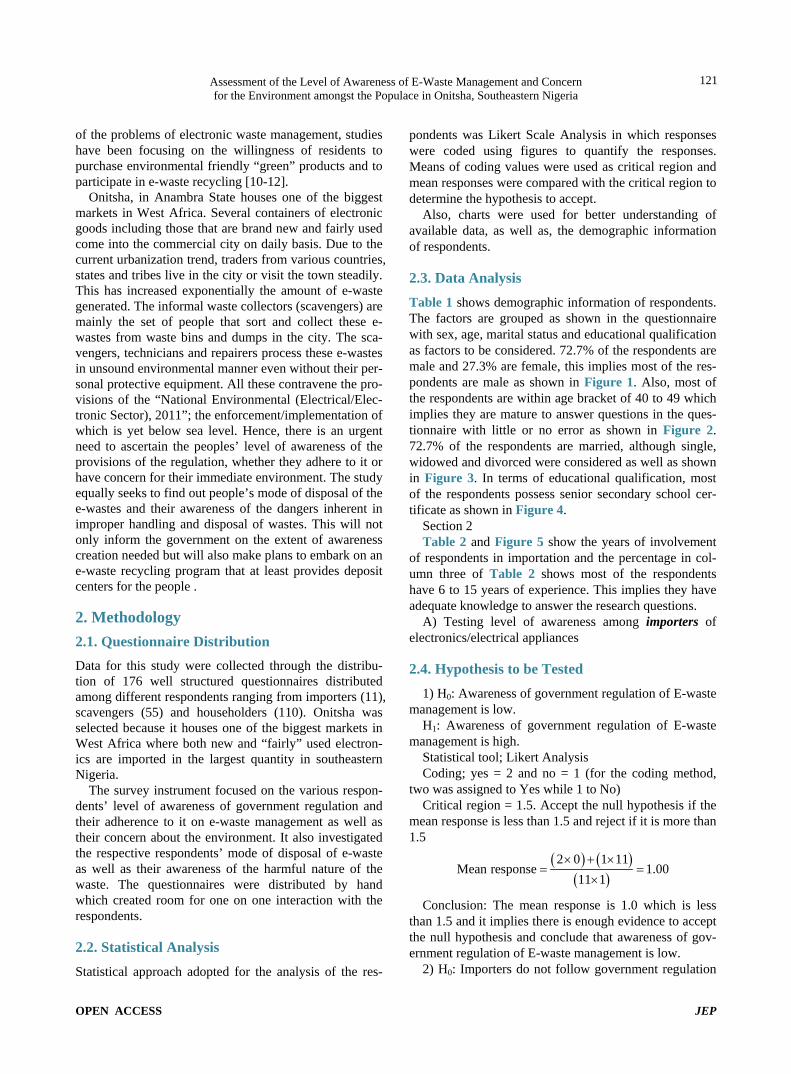
2.3. Data Analysis Table 1 shows demographic information of respondents. The factors are grouped as shown in the questionnaire with sex, age, marital status and educational qualification as factors to be considered. 72.7% of the respondents are male and 27.3% are female, this implies most of the res- pondents are male as shown in Figure 1. Also, most of the respondents are within age bracket of 40 to 49 which implies they are mature to answer questions in the ques- tionnaire with little or no error as shown in Figure 2. 72.7% of the respondents are married, although single, widowed and divorced were considered as well as shown in Figure 3. In terms of educational qualification, most of the respondents possess senior secondary school cer- tificate as shown in Figure 4.
Section 2 Table 2 and Figure 5 show the years of involvement
of respondents in importation and the percentage in col- umn three of Table 2 shows most of the respondents have 6 to 15 years of experience. This implies they have adequate knowledge to answer the research questions.
A) Testing level of awareness among importers of electronics/electrical appliances
2.4. Hypothesis to be Tested 1) H0: Awareness of government regulation of E-waste
management is low. H1: Awareness of government regulation of E-waste
management is high. Statistical tool; Likert Analysis Coding; yes = 2 and no = 1 (for the coding method,
two was assigned to Yes while 1 to No) Critical region = 1.5. Accept the null hypothesis if the
mean response is less than 1.5 and reject if it is more than 1.5
( ) ( )( )
2 0 1 11Mean response 1.00
11 1× + ×
= =×
Conclusion: The mean response is 1.0 which is less than 1.5 and it implies there is enough evidence to accept the null hypothesis and conclude that awareness of gov- ernment regulation of E-waste management is low.
2) H0: Importers do not follow government regulation
OPEN ACCESS JEP
Assessment of the Level of Awareness of E-Waste Management and Concern for the Environment amongst the Populace in Onitsha, Southeastern Nigeria
122
Table 1. Demographic Data of Respondents (Importers).
Frequency Percentage
Sex
Male 8 72.73
Female 3 27.27
Total 11 100
Age
20 - 29 1 9.09
30 - 39 0 0
40 - 49 7 63.64
50 and above 3 27.27
Total 11 100
Marital Status
Single 1 9.09
Married 8 72.73
Divorced 1 9.09
Widowed 1 9.09
Total 11 100
Educational Qualification
SSCE 10 90.91
ND 0 0
HND/B.SC/B.A 1 9.09
PGD 0 0
M.A/M.SC 0 0
PH.D 0 0
No formal education 0 0
Total 11 100
Source: Field Survey, 2012. Table 2. Involvement in Electrical/Electronic waste genera- tion.
YEARS OF INVOLVEMENT
NUMBER OF RESPONDENTS Percentage
2 to 5 1 9.0909
6 to 10 3 27.2727
11 to 15 3 27.2727
16 to 20 2 18.1818
above 20 2 18.1818
Total 11 100
for e-waste management.
H1: Importers do follow government regulation for e-waste management.
Figure 1. Pie Chart of Sex of Respondents.
Figure 2. Bar Chart of Age Distribution of Respondents.
Figure 3. Bar Chart of Marital Status of Respondents.
Figure 4. Bar Chart of Educational Qualification of Res- pondents.
73%
27%
Male
Female
0
1
2
3
4
5
6
7
20-29 30-39 40-49 50 and above
Freq
uenc
y
Age of respondents
012345678
Single Married Divorced Widowed
Freq
uenc
y
Marital Status
0123456789
10
Freq
uenc
y
Educational Qualification
OPEN ACCESS JEP
Assessment of the Level of Awareness of E-Waste Management and Concern for the Environment amongst the Populace in Onitsha, Southeastern Nigeria
123
Figure 5. Bar chart of years of involvement of respondents in importation of electrical/electronic equipment.
Statistical tool; Likert Analysis Coding; yes = 2 and no = 1 Critical region = 1.5. Accept the null hypothesis if the
mean response is less than 1.5 and reject if it is more than 1.5
( ) ( )( )
2 0 1 22Mean response 1.00
22 1× + ×
= =×
Conclusion: The mean response is 1.0 which is less than 1.5 and it implies there is enough evidence to accept the null hypothesis and conclude that importers do not follow government regulation for e-waste management.
Section 3 Generation and Management of E-waste 3) H0: Most importers do not import second-Hand
product/components. H1: Most importers import second-Hand product/
components. Statistical tool; Likert Analysis Coding; yes = 2 and no = 1 Critical region = 1.5. Accept the null hypothesis if the
mean response is less than 1.5 and reject if it is more than 1.5
( ) ( )( )
2 11 1 0Mean response 2.00
11 1× + ×
= =×
Conclusion: The mean response is 2.0 which is greater than 1.5 and it implies there is enough evidence to accept the alternative hypothesis and conclude that most impor- ters import second-Hand product/components.
2.5. Management of e-Waste by the Importers The above computation shows that most of the respon- dents dump their e-waste in designated places or refuse dump as shown in Table 3 above.
Section 4 Care for environment by selected importers
Table 3. Method of disposal of e-waste.
Mode of disposal of e-waste Number of respondents Percentage
Dump in designated places/refuse dump 8 72.7273
Sell to recycler 1 9.0909
Dump in any available place(s) 2 18.1818
Dump in river or sea 0 0.0000
Burning/incineration 0 0.0000
Others 0 0.0000
Total 11 100
Source: Field survey, 2012.
4) H0: Most importers are not concerned with envi- ronmental conditions.
H1: Most importers are concerned with environmental conditions.
Statistical tool; Likert Analysis Coding; Not concerned 1 Barely concerned 2 Concerned 3 Very concerned 4 Critical region = 2.5. Accept the null hypothesis if the
mean response is less than 2.5 and reject if it is more than 2.5
( ) ( ) ( ) ( )( )
4 1 3 9 2 1 1 0Mean response 3.00
11 1× + × + × + ×
= =×
Conclusion: The mean response is 3.0 which is greater than 2.5 and it implies there is enough evidence to accept the alternative hypothesis and conclude that most impor- ters are concerned with environmental conditions.
2.6. Awareness of Harmful Effect of Content of Electronics
5) H0: Most importers are not aware of harmful con- tent of electronics.
H1: Most importers are aware of harmful content of electronics.
Statistical tool; Likert Analysis Coding; yes = 2 and no = 1 Critical region = 1.5. Accept the null hypothesis if the
mean response is less than 1.5 and reject if it is more than 1.5
( ) ( )( )
2 1 1 10Mean response 1.09
11 1× + ×
= =×
Conclusion: The mean response is 1.09 which is less than 1.5 and it implies there is enough evidence to accept
0
0.5
1
1.5
2
2.5
3
2 to 5 6 to 10 11 to 15 16 to 20 above 20
Num
ber o
f Res
pode
nts
Years of involvement in the importation
OPEN ACCESS JEP
Assessment of the Level of Awareness of E-Waste Management and Concern for the Environment amongst the Populace in Onitsha, Southeastern Nigeria
124
the null hypothesis and conclude that most importers are not aware of harmful content of electronics
Also, the responses on negative impact of mode of disposal of electronic waste show that most of the res- pondents are not aware of the harmful effect of their ac- tion.
B) Findings from questionnaires on electrical/elec- tronic waste (e-waste) generation and management study in Anambra state (Scavengers)
Table 4 shows the personal information of respon- dents which can be referred to as demographic informa- tion of respondents. The factors are grouped as shown in the questionnaire with sex, age, marital status and educa- tional qualification as factors to be considered. Based on the responses from respondents, 100% of the respondents are male which implies men are into the business than
Table 4. Demographic Data of Respondents.
Frequency Percentage
Sex
Male 55 100
Female 0 0.00
Total 55 100
Age
20 - 29 20 36.3636
30 - 39 30 54.5455
40 - 49 5 9.0909
50 and above 0 0.0000
Total 55 100
Marital Status
Single 20 36.3636
Married 35 63.6364
Divorced 0 0.0000
Widowed 0 0.0000
Total 55 100
Educational Qualification
SSCE 55 100
ND 0 0
HND/B.SC/B.A 0 0
PGD 0 0
M.A/M.SC 0 0
PH.D 0 0
No formal education 0 0
Total 55 100
Source: Field Survey, 2012.
female as it was difficult to see a female scavenger dur- ing the field survey. Also, most of the respondents are within age bracket of 20 to 39 which implies they are mature to answer questions in the questionnaire with little or no error as shown in Figure 6. 64% of the res- pondents are married, and 36% are single, widowed and divorced were not seen among the selected group as shown in Figure 7. In terms of educational qualification, all respondents claim to have senior secondary school certificate.
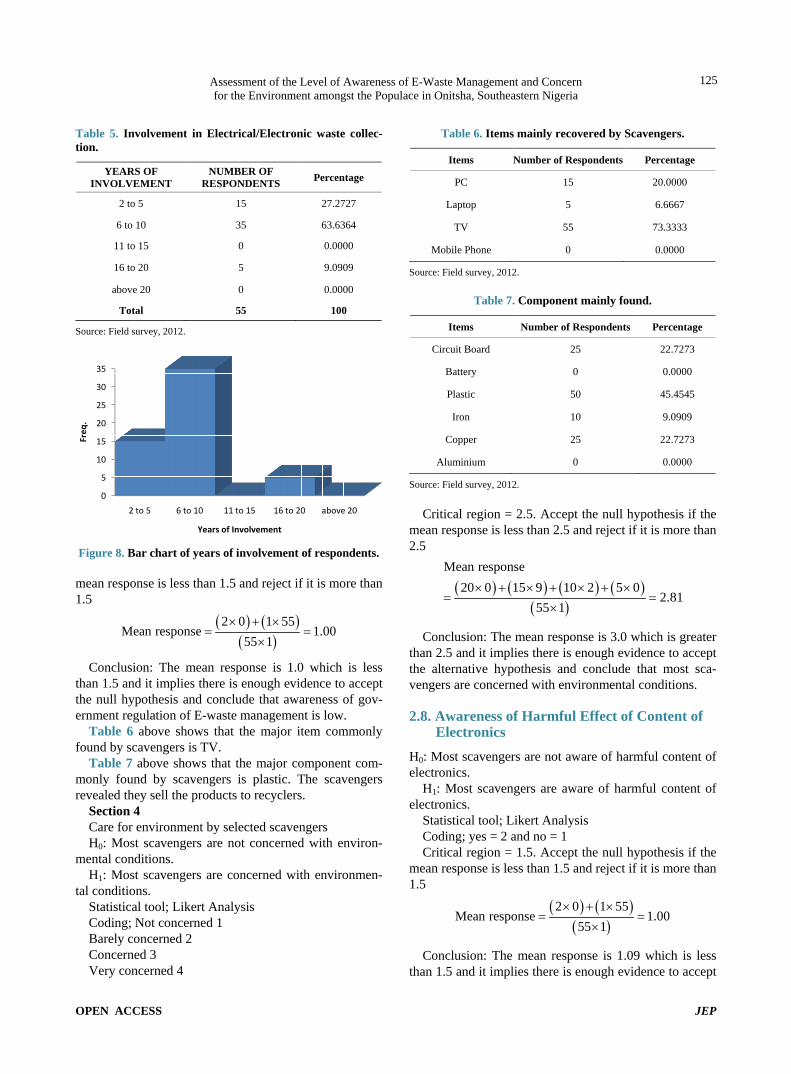
Section 2 Table 5 shows the extent of involvement of scaven-
gers in Electrical/Electronic waste generation. 35% of the respondents have 6 to 10 years of involvement in e-waste collection while 15 of them have 2 to 5 years of in- volvement as shown in Figure 8.
2.7. Hypothesis to be Tested H0: Awareness of government regulation of E-waste management is low.
H1: Awareness of government regulation of E-waste management is high.
Statistical tool; Likert Analysis Coding; yes = 2 and no = 1 Critical region = 1.5. Accept the null hypothesis if the
Figure 6. Bar chart of age distribution of respondents.
Figure 7. Bar chart of marital status distribution of res- pondents.
0
5
10
15
20
25
30
35
20-29 30-39 40-49 50 and above
Num
ber o
f Sca
veng
ers
Age brackets
0
5
10
15
20
25
30
35
Single Married Divorced Widowed
Freq
.
Marital Status
OPEN ACCESS JEP
Assessment of the Level of Awareness of E-Waste Management and Concern for the Environment amongst the Populace in Onitsha, Southeastern Nigeria
125
Table 5. Involvement in Electrical/Electronic waste collec- tion.
YEARS OF INVOLVEMENT
NUMBER OF RESPONDENTS Percentage
2 to 5 15 27.2727
6 to 10 35 63.6364
11 to 15 0 0.0000
16 to 20 5 9.0909
above 20 0 0.0000
Total 55 100
Source: Field survey, 2012.
Figure 8. Bar chart of years of involvement of respondents. mean response is less than 1.5 and reject if it is more than 1.5
( ) ( )( )
2 0 1 55Mean response 1.00
55 1× + ×
= =×
Conclusion: The mean response is 1.0 which is less than 1.5 and it implies there is enough evidence to accept the null hypothesis and conclude that awareness of gov- ernment regulation of E-waste management is low.
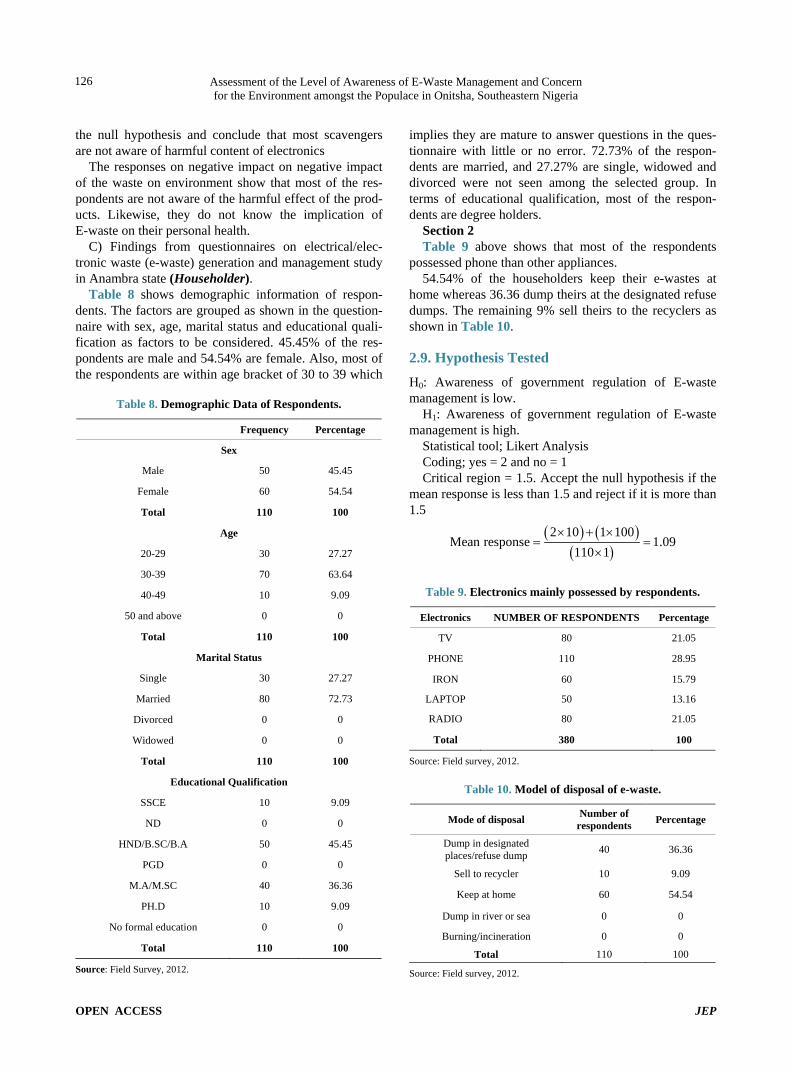
Table 6 above shows that the major item commonly found by scavengers is TV.
Table 7 above shows that the major component com- monly found by scavengers is plastic. The scavengers revealed they sell the products to recyclers.
Section 4 Care for environment by selected scavengers H0: Most scavengers are not concerned with environ-
mental conditions. H1: Most scavengers are concerned with environmen-
tal conditions. Statistical tool; Likert Analysis Coding; Not concerned 1 Barely concerned 2 Concerned 3 Very concerned 4
Table 6. Items mainly recovered by Scavengers.
Items Number of Respondents Percentage
PC 15 20.0000
Laptop 5 6.6667
TV 55 73.3333
Mobile Phone 0 0.0000
Source: Field survey, 2012.
Table 7. Component mainly found.
Items Number of Respondents Percentage
Circuit Board 25 22.7273
Battery 0 0.0000
Plastic 50 45.4545
Iron 10 9.0909
Copper 25 22.7273
Aluminium 0 0.0000
Source: Field survey, 2012.
Critical region = 2.5. Accept the null hypothesis if the mean response is less than 2.5 and reject if it is more than 2.5
( ) ( ) ( ) ( )( )
Mean response20 0 15 9 10 2 5 0
2.8155 1
× + × + × + ×= =
×
Conclusion: The mean response is 3.0 which is greater than 2.5 and it implies there is enough evidence to accept the alternative hypothesis and conclude that most sca- vengers are concerned with environmental conditions.
2.8. Awareness of Harmful Effect of Content of Electronics
H0: Most scavengers are not aware of harmful content of electronics.
H1: Most scavengers are aware of harmful content of electronics.
Statistical tool; Likert Analysis Coding; yes = 2 and no = 1 Critical region = 1.5. Accept the null hypothesis if the
mean response is less than 1.5 and reject if it is more than 1.5
( ) ( )( )
2 0 1 55Mean response 1.00
55 1× + ×
= =×
Conclusion: The mean response is 1.09 which is less than 1.5 and it implies there is enough evidence to accept
0
5
10
15
20
25
30
35
2 to 5 6 to 10 11 to 15 16 to 20 above 20
Freq
.
Years of Involvement
OPEN ACCESS JEP
Assessment of the Level of Awareness of E-Waste Management and Concern for the Environment amongst the Populace in Onitsha, Southeastern Nigeria
126
the null hypothesis and conclude that most scavengers are not aware of harmful content of electronics
The responses on negative impact on negative impact of the waste on environment show that most of the res- pondents are not aware of the harmful effect of the prod- ucts. Likewise, they do not know the implication of E-waste on their personal health.
C) Findings from questionnaires on electrical/elec- tronic waste (e-waste) generation and management study in Anambra state (Householder).
Table 8 shows demographic information of respon- dents. The factors are grouped as shown in the question- naire with sex, age, marital status and educational quali- fication as factors to be considered. 45.45% of the res- pondents are male and 54.54% are female. Also, most of the respondents are within age bracket of 30 to 39 which
Table 8. Demographic Data of Respondents.
Frequency Percentage
Sex
Male 50 45.45
Female 60 54.54
Total 110 100
Age
20-29 30 27.27
30-39 70 63.64
40-49 10 9.09
50 and above 0 0
Total 110 100
Marital Status
Single 30 27.27
Married 80 72.73
Divorced 0 0
Widowed 0 0
Total 110 100
Educational Qualification
SSCE 10 9.09
ND 0 0
HND/B.SC/B.A 50 45.45
PGD 0 0
M.A/M.SC 40 36.36
PH.D 10 9.09
No formal education 0 0
Total 110 100
Source: Field Survey, 2012.
implies they are mature to answer questions in the ques- tionnaire with little or no error. 72.73% of the respon- dents are married, and 27.27% are single, widowed and divorced were not seen among the selected group. In terms of educational qualification, most of the respon- dents are degree holders.
Section 2 Table 9 above shows that most of the respondents
possessed phone than other appliances. 54.54% of the householders keep their e-wastes at
home whereas 36.36 dump theirs at the designated refuse dumps. The remaining 9% sell theirs to the recyclers as shown in Table 10.
2.9. Hypothesis Tested H0: Awareness of government regulation of E-waste management is low.
H1: Awareness of government regulation of E-waste management is high.
Statistical tool; Likert Analysis Coding; yes = 2 and no = 1 Critical region = 1.5. Accept the null hypothesis if the
mean response is less than 1.5 and reject if it is more than 1.5
( ) ( )( )
2 10 1 100Mean response 1.09
110 1× + ×
= =×
Table 9. Electronics mainly possessed by respondents.
Electronics NUMBER OF RESPONDENTS Percentage
TV 80 21.05
PHONE 110 28.95
IRON 60 15.79
LAPTOP 50 13.16
RADIO 80 21.05
Total 380 100
Source: Field survey, 2012.
Table 10. Model of disposal of e-waste.
Mode of disposal Number of respondents Percentage
Dump in designated places/refuse dump 40 36.36
Sell to recycler 10 9.09
Keep at home 60 54.54
Dump in river or sea 0 0
Burning/incineration 0 0
Total 110 100
Source: Field survey, 2012.
OPEN ACCESS JEP
Assessment of the Level of Awareness of E-Waste Management and Concern for the Environment amongst the Populace in Onitsha, Southeastern Nigeria
127
Conclusion: The mean response is 1.09 which is less than 1.5 and it implies there is enough evidence to accept the null hypothesis and conclude that awareness of gov- ernment regulation of E-waste management is low among the selected householders.
2.10. Care for Environment by Selected Householders
H0: Most householders are not concerned with environ- mental conditions.
H1: Most householders are concerned with environ- mental conditions.
Statistical tool; Likert Analysis Coding; Not concerned 1 Barely concerned 2 Concerned 3 Very concerned 4 Critical region = 2.5. Accept the null hypothesis if the
mean response is less than 2.5 and reject if it is more than 2.5
( ) ( ) ( ) ( )( )
Mean response4 0 3 90 2 20 1 0
2.81110 1
× + × + × + ×= =
×
Conclusion: The mean response is 3.0 which is greater than 2.5 and it implies there is enough evidence to accept the alternative hypothesis and conclude that most house- holders are concerned with environmental conditions.
2.11. Awareness of Harmful Effect of Content of Electronics
H0: People are not aware of harmful content of electron- ics.
H1: People are aware of harmful content of electronics. Statistical tool; Likert Analysis Coding; yes = 2 and no = 1 Critical region = 1.5. Accept the null hypothesis if the
mean response is less than 1.5 and reject if it is more than 1.5
( ) ( )( )
2 30 1 80Mean response 1.27
110 1× + ×
= =×
Conclusion: The mean response is 1.27 which is less than 1.5 and it implies there is enough evidence to accept the null hypothesis and conclude that most householders are not aware of harmful content of electronics.
The responses on negative impact on negative impact of the waste on environment show that most of the res- pondents are not aware of the harmful effect of the prod- ucts. Likewise, they do not know the implication of E-waste on their personal health.
2.12. Summary of Results and Discussion The hypothesis “Awareness of the respondents on gov- ernment regulation is low” served as the null hypothesis while the opposite served as the alternate. The coding and the mean response were obtained thus for the impor- ters:
Coding; yes = 2 and no = 1 (for the coding method, two was assigned to Yes while 1 to No)
Critical region = 1.5. Accept the null hypothesis if the mean response is less than 1.5 and reject if it is more than 1.5
( ) ( )( )
2 0 1 11Mean response 1.00
11 1× + ×
= =×
The mean response is 1.0 which is less than 1.5 and it implies there is enough evidence to accept the null hy- pothesis and conclude that awareness of government regulation of E-waste management is critically low for the importers. This was equally the case for the analysis conducted for the scavengers and the householders. This simply implies that government is yet to make any mea- ningful effort in educating the major stakeholders on the relevant provision of the National Environmental (Elec- trical/Electronics sector) regulations. This ignorance coupled with corruption and poor implementation and enforcement of the regulations will create room for con- tinuous importation and poor management of e-wastes.
Another hypothesis was tested in the same way on whether the importers follow the government regulations. Again, it was concluded that they do not follow govern- ment regulation (Part1, Section 3) [13] for e-waste im- portation.
The responses of the importers mode of disposal of e-waste revealed that 72% dispose theirs in the general waste receptacle; 18% dump theirs in any available space while only 10% give to the recyclers. For the house- holders, 55% of them prefer to keep their e-waste at home hoping that the need for them might arise any day; 41% dumped theirs in the receptacles while 4% give out theirs to the scavengers. This calls for an urgent need for enlightenment campaign on the need and benefits of re- cycling e-waste and the implication of mixing e-waste with other municipal wastes in the state.
The responses of the importers on the kind of elec- tronics they import shows that 22% import only “fairly” used electronics; 60% import both brand new and “fairly” used while 18% import only brand new electronic goods.
On the concern about the environmental conditions, 82%, 70% and 96% of the importers, scavengers and householders respectively are concerned about their en- vironment. The awareness of the harmful content of e-waste was also tested for the respondents. The result shows that the importers (82%), the scavengers (94%)
OPEN ACCESS JEP
Assessment of the Level of Awareness of E-Waste Management and Concern for the Environment amongst the Populace in Onitsha, Southeastern Nigeria
128
and the householders (78%) are not aware of the hazard- ous nature of e-waste.
The items mainly sort after by the scavengers are CRT (54%), mobile phones (30%), laptops (6%) and other (10%). It was revealed during the interaction with the scavengers that in most cases they resort to incineration to extract the valuable component of the e-waste just as in most developing countries. They expressed their wil- lingness to use another environmentally friendly means provided they will not incur extra expenses.
2.13. Awareness Campaign Design Public awareness is critical in achieving environmental attitudes, skills and behaviour consistent with sustainable development and environmental protection. Awareness is an important tool for sensitization oxf public opinion to environmental issues and challenges. Educating all and sundry on the importance of environmental protection is one of the most effective ways to protect nature. An ef- fective strategy must put into consideration the characte- ristics of the target community, the major stakeholders view point about the environmental challenges and ef- forts being made by the government in solving the envi- ronmental problem
In the framework, experts shall train environmental NGOs and persons from line ministries and parastatals to acquire basic understanding of e-waste management and a motivation to participate in activities for improving the quality of the environment and develop skills for proper waste management. This training shall be directed at helping implementers to increase their understanding, interest and skills in e-waste management. It is the duty of these trained people to inculcate into the populace strong feelings fundamental to developing a concern for e-waste waste management.
The development of community based awareness pro- gramme on e-waste should consider the following as- pects;- • The programme should help the participants to de-
velop interest in improving the quality of their imme- diate environment and increase the awareness on en- vironmental health.
• The programme should increase the awareness of and knowledge about e-waste management, impart posi- tive attitudes and motivate action about it.
• It should provide continuity and progression because behaviour modification is a long term habit
• It will be linked with community realities and cater for the community’s e-waste problems as best as it could.
In urban areas where the problems is more paramount, the following target groups shall be worked with;- • Community leaders
• Church/religious leaders • Market unions • Town unions • Armed forces personnel • Land lord associations • Transport unions • Scavengers and informal waste collectors
The media including the television and radio stations should also organize periodic programmes with experts and also jingles. Information posters and pamphlets con- taining information shall be printed and distributed amongst the citizens. Some of the stakeholder’s inter- view suggested that citizens should be enjoined to speak informally to offenders. The visits to the aforementioned groups shall avail the citizens the opportunity to partici- pate in planning, maintain services and develop know- ledge of waste management. Provision shall be made for little working aids like bags, caps, T-shirts to attract all these participants
At the state level workshops and discussions shall be held with the members of the State House of Assembly and top government officials. All these will not be mea- ningful, if the government does not have the political will to embark on strong enforcement mechanisms whereby erring citizens will be decisively dealt with.
3. Conclusion E-waste must be generated because of the need to key into the technological age. However, it is both valuable as source for secondary raw material, and toxic if treated and discarded improperly. Hence, recycling of such wastes, thus assumes significant importance from the commer-cial standpoint while proper disposal is crucial from the health and environment point of view.
From the foregoing, the facts on ground is a clear in- dication that while most of e-waste are being brought down to developing countries in addition to the ones on ground, people are yet to appreciate the difference be- tween the regular municipal solid waste and e-waste, the potential benefits of recycling e-waste and the health implication of not handling them well. This therefore calls for a serious environmental sensitization campaign whereby if the recommended awareness model is adopted, it will go a long way into awakening both the people and the government on this environmental challenge.
REFERENCES [1] A. Hula, K. Jalali, S. J. Skerlos and K. Saitou, “Multi-
Criteria Decision Making for Optimization of Products Disassembly under Multi Situations,” Environmental Science Technology, Vol. 37, No. 23, 2003, pp. 5303- 5313. http://dx.doi.org/10.1021/es0345423
OPEN ACCESS JEP
Assessment of the Level of Awareness of E-Waste Management and Concern for the Environment amongst the Populace in Onitsha, Southeastern Nigeria
129
[2] J. Cui and E. Forssberg, “Mechanical Recycling of Waste Electric and Electronic Equipment: A Review,” Journal of Hazardous Materials, Vol. 99, No. 3, 2003, pp 243- 263. http://dx.doi.org/10.1016/S0304-3894(03)00061-X
[3] M. N. Mundada, S. Kumar and A. V. Shekdar, “E-Waste: A New Challenge for Waste Management in India,” In-ternational Journal of Environmental Studies, Vol. 61, No. 3, 2004, pp. 265-279. http://dx.doi.org/10.1080/0020723042000176060
[4] O. Osibanjo and I. C. Nnorom, “The Challenge of Elec-tronic Waste (E-Waste) Management in Developing Countries,” Waste Management Research, Vol. 25, No. 6, 2007, pp. 489-501. http://dx.doi.org/10.1177/0734242X07082028
[5] R. Widmer, H. Oswald-Krapf, A. Sinha-Khetriwal, M. Scnellmann and H. Boni, “Global Perspectives on the E-Waste,” Environmental Impact Assessment Review, Vol. 25, No. 5, 2005, pp. 436-458. http://dx.doi.org/10.1016/j.eiar.2005.04.001
[6] J. Dickenson, “Electronic Signals: A Year into the EU WEEE Directive,” Waste Management World, 2006, pp. 37-47.
[7] I. C. Nnorom, J. Ohakwe and O. Osibanjo, “Survey of Willingness of Residents to Participate in Electronic Waste Recycling in Nigeria—A Case Study of Mobile Phone Recycling,” Journal of Cleaner Production, Vol., No., 2009,pp 1629-1637. http://dx.doi.org/10.1016/j.jclepro.2009.08.009
[8] I. C. Nnorom and O. Osibanjo. “Electronic Waste E- Waste: Material Flows and Management Practices in Ni-geria,” Waste Management, Vol. 28, No. 8, 2008, pp. 1472-1479. http://dx.doi.org/10.1016/j.wasman.2007.06.012
[9] BAN, “The Digital Dump: Exporting Re-Use and Abuse to Africa,” Basel Action Network, 2005. www.ban.org.
[10] L. Darby and L. Obara, “Household Recycling Behavior and Attitudes toward the Disposal of Small Electrical and Electronic Equipment,” Resources Conservation Recy-cling, Vol. 44, No. 1, 2005, pp. 17-35. http://dx.doi.org/10.1016/j.resconrec.2004.09.002
[11] P. Huang, X. Zhang and X. Deng, “Survey and Analysis of Public Environmental Awareness and Performance in Ningbo, China: A Case Study on Household Electrical and Electronic Equipment,” Journal of Cleaner Produc-tion, Vol. 14, No. 18, 2006, pp. 1635-1643. http://dx.doi.org/10.1016/j.jclepro.2006.02.006
[12] J.-D. Saphores, H. Nixon, O. A. Ogunseitan, A. A. Sha-piro, “Household Willingness to Recycling Electronic Waste. An Application to California,” Environmental and Behavior, Vol. 38, No. 2, 2006, pp. 183-208. http://dx.doi.org/10.1177/0013916505279045
[13] Federal Republic of Nigeria Official Gazette, National Environmental (Electrical/Electronic Sector) Regulations, 2011, pp. 729-797.
OPEN ACCESS JEP
Assessment of the Level of Awareness of E-Waste Management and Concern for the Environment amongst the Populace in Onitsha, Southeastern Nigeria
130
Appendix QUESTIONNAIRE ON ASSESSMENT OF THE LEVEL OF AWARENESS OF E-WASTE MANAGEMENT AND CONCERN FOR THE ENVIRONMENT AMONGST THE POPULACE IN ONITSHA
FOR IMPORTERS OF ELECTRICAL/ELECTRONIC EQUIPMENT SECTION 1: Personal Data 1.1 SEX: Male □ Female □ 1.2 AGE: 20 - 29 □ 30 - 39 □ 40 - 49 □ 50 and above 1.3 MARITAL STATUS: Single □ Married □ Divorced □ Widowed □ 1.4 HIGHEST QUALIFICATION: SSCE □ ND □ HND/B.Sc/B.A □
PGD □ M.A/MSc □ PhD □ No formal education 1.5 LOCATION/ADDRESS OF BUSINESS (Not P.O BOX):…………………………………………………….. SECTION 2: Involvement in Electrical/Electronic Waste Generation 2.1 How long have you been involved in the importation of electrical/electronic equipment? 2 - 5 yrs □ 6 - 10 yrs □ 11 - 15 yrs □ 16 - 20yrs □ above 20yrs □ 2.2 Which electrical/electronic equipment?
TV □ PC □ Laptop □ Mobile phone □ 2.3 a) Do you belong to any trade association? Yes □ No □ b) If yes, name the association and its address: ……………………………………………………… ………………………………………………………………………………………………………. 2.4 Are you aware of of any government regulation on e-waste management? Yes □ No □ 2.5 a) Do you have rules guiding your activities in the association? Yes □ No□ b) If yes,
i) Are the rules in compliance with government regulation for waste management? Yes □ No□
Others (please specify)............................ ii) How effectively are the rules enforced? Strongly □ Fairly □ Not enforced □ SECTION 3: Generation and Management of E-Waste 3.1 What brand of new electronic equipment/component do you import? ……………….. 3.2 Indicate the volume of import per year for each product/component …………………. ........................................................................................................................................... 3.3 Country of Import?
European Union □ USA □ China □ India □ Others (please specify) ……………………….............. 3.4 Mode of Importation:
Container □ Trucks □ Buses □ 3.5 Route of Importation:
Sea port □ Airport □ Land Border □ 3.6 a) Do you import any second- hand product/component(s)? Yes □ No □
b) If yes, which product(s)/component(s)? Computer (PC) □ Laptop □ Mobile phone □ Monitor □ CRT □ Circuit board □
c) From which country? European Union □ USA □ Others (please specify)…………………………………………..
3.7 Percentage of obsolete/defective items in the import i.e. requiring service/repair before sale? 0% - 2% □ 3% - 5% □ 6% - 8% □ 9% - 12% □ Others (please specify) …………… 3.8 Percentage of obsolete/defective items that is repairable? 10% - 20% □ 21% - 30% □ 31% - 40% □ 41% - 50% □ above 50% □
OPEN ACCESS JEP

Assessment of the Level of Awareness of E-Waste Management and Concern for the Environment amongst the Populace in Onitsha, Southeastern Nigeria
131
3.9 a) Do you regard the unrepairable items as waste? Yes □ No □ b) If yes, how do you manage the waste/unserviceable items? Dump in designated places/refuse dump □ Sell to recycler □ Dump in any available place(s) □ Dump in Sea/River □ Burning/incineration □ Others (please specify) e.g. export ………………………………………………………….. SECTION 4: IMPACT ON THE ENVIRONMENT 4.1 Are you concerned about your environment?
Not concerned □ Barely concerned □ Concerned □□ Very concerned □ 4.2 a) Do you know that some components of electronic devices contain toxic/hazardous materials? Yes □ No □ b) If yes, are you aware that these toxic/hazardous materials require special treatment for environmentally sound
disposal? Yes □ No □
4.3 a) Does the disposal/treatment method in use for electronic waste have any impact on the environment? Yes □ No □ Not sure □
b) If yes, indicate the part(s) of the environment affected and rate the impact
IMPACT
PARTS OF ENVIRONMENT AFFECTED VERY STRONG STRONG FAIRLY NO EFFECT
Land
Air
Surface water
Underground water
Vegetation
ii) a) Does your involvement in handling of/ being in contact with electronic waste have a negative impact on your
health? Yes □ No □ Do not know b) If yes, what is the nature of health hazard? Rate severity.
SEVERITY
NATURE OF HEALTH HAZARD HIGHLY SEVERE SEVERE FAIRLY NOT SEVERE
Headache
Body Pain
Dizziness
Cough
Others specify
QUESTIONNAIRE ON ASSESSMENT OF THE LEVEL OF AWARENESS OF E-WASTE MANAGEMENT AND CONCERN FOR THE ENVIRONMENT AMONGST THE POPULACE IN ONITSHA
FOR SCAVENGERS SECTION 1: Personal Data 1.1 SEX: Male □ Female □ 1.2 AGE: 20 - 29 □ 30 - 39 □ 40 - 49 □ 50 and above □
OPEN ACCESS JEP

Assessment of the Level of Awareness of E-Waste Management and Concern for the Environment amongst the Populace in Onitsha, Southeastern Nigeria
132
1.3 MARITAL STATUS: Single □ Married □ Divorced □ Widowed □ 1.4 HIGHEST QUALIFICATION:
SSCE □ ND □ HND/B.Sc/B.A □ PGD □ M.A/MSc □ PhD □ No formal education □ 1.5 LOCATION/ADDRESS OF BUSINESS (Not P.O BOX):……………………………………………………….. SECTION 2: Involvement in Electrical/Electronic Waste Generation 2.1 How long have you been involved in scavenging? 2 - 5 yrs □ 6 - 10 yrs □ 11 - 15 yrs □ 16 - 20yrs □ above 20yrs □ 2.2 a) Do you belong to any trade association? b) If yes, name the association and its address: ……………………………………………………… ………………………………………………………………………………………………………. 2.4 Are you aware of any government regulation on e-waste management? Yes □ No □ 2.5 a) Do you have rules guiding your activities in the association?
Yes □ No □ b) If yes,
i) Are the rules in compliance with government regulation for waste management? Yes □ No □ Others (please specify)............................ ii) How effectively are the rules enforced? Strongly □ Fairly □ Not enforced □ SECTION 3: Generation and Management of E-Waste 3.1 What volume of electrical/electronic waste do you handle per day?............. 3.2. Do you recover any of the electrical/electronic equipment/components from waste? Yes □ No □
b) If yes, which equipment? PC □ Laptop □ TV □ Mobile phone □
c) Which component do you recycle/recover Circuit board □ Battery □ Plastics □ Iron □ Copper □ Aluminium □
Others (please specify) …………………………………….. 3.3 What do you do with the recovered equipment/components? Sell to repairers □ Sell to recyclers □ Reuse □ 3.4 Indicate the volume of reusable, recyclable and residue from your work ………… ………………………………………………………………………………………. SECTION 4: Impact on the Environment 4.1 Are you concerned about your environment?
Not concerned □ Barely concerned □ Concerned □ Very concerned □ 4.2 a) Do you know that some components of electronic devices contain toxic/hazardous materials? Yes □ No □ b) If yes, are you aware that these toxic/hazardous materials require special treatment for environmentally sound
disposal? Yes □ No □ 4.3 a) Does the disposal/treatment method in use for electronic waste have any impact on the environment?
Yes □ No □ Not sure □ b) If yes, indicate the part(s) of the environment affected and rate the impact
IMPACT
PARTS OF ENVIRONMENT AFFECTED VERY STRONG STRONG FAIRLY NO EFFECT
Land
Air
Surface water
Underground water
Vegetation
OPEN ACCESS JEP
Assessment of the Level of Awareness of E-Waste Management and Concern for the Environment amongst the Populace in Onitsha, Southeastern Nigeria
133
4.4 a) Does your involvement in handling of/ being in contact with electronic waste have a negative impact on your health?
Yes □ No □ Do not know □ b) If yes, what is the nature of health hazard? Rate Severity.
SEVERITY
NATURE OF HEALTH HAZARD HIGHLY SEVERE SEVERE FAIRLY NOT SEVERE
Headache
Body Pain
Dizziness
Cough
Others specify
FOR HOUSE HOLDERS
SECTION 1: Personal Data 1.1 SEX: Male □ Female □ 1.2 AGE: 20 - 29 □ 30 - 39 □ 40 - 49 □ 50 and above □ 1.3 MARITAL STATUS: Single □ Married □ Divorced □ Widowed □ 1.4 HIGHEST QUALIFICATION:
SSCE □ ND □ HND/B.Sc/B.A □ PGD □ M.A/MSc □ PhD □ No formal education □ 1.5 LOCATION/ADDRESS OF BUSINESS (Not P.O BOX):……………………………………………………….. SECTION 2: Involvement in Electrical/Electronic Waste Generation 2.1 List some of the electronics mainly possessed in the house................................................................................... 2.2 Which of the following is the model of disposal of e-waste adopted in the house? Dump in designated places/refuse dump □ Sell to recycler □ Keep at home □ Dump in river or sea □ Burning/incineration □. 2.3 Are you aware of any government regulation on e-waste management? Yes □ No □ 2.4 a) Do you have rules guiding your activities in the association?
Yes □ No □ b) If yes,
i) Are the rules in compliance with government regulation for waste management? Yes □ No □ Others (please specify)............................ ii) How effectively are the rules enforced? Strongly □ Fairly □ Not enforced □ SECTION 3: Generation and Management of E-Waste 3.1 What volume of electrical/electronic waste do you handle per day?............. 3.2 Do you recover any of the electrical/electronic equipment/components from waste? Yes □ No □ b) If yes, which equipment?
PC □ Laptop □ TV □ Mobile phone □ c) Which component do you recycle/recover Circuit board □ Battery □ Plastics □ Iron □ Copper □ Aluminium □
Others (please specify) …………………………………….. 3.3 What do you do with the recovered equipment/components? Sell to repairers □ Sell to recyclers □ Reuse 3.4 Indicate the volume of reusable, recyclable and residue from your work ………… ………………………………………………………………………………………. SECTION 4: Impact on the Environment 4.1 Are you concerned about your environment?
OPEN ACCESS JEP
Assessment of the Level of Awareness of E-Waste Management and Concern for the Environment amongst the Populace in Onitsha, Southeastern Nigeria
134
Not concerned □ Barely concerned □ Concerned □ Very concerned □ 4.2 a) Do you know that some components of electronic devices contain toxic/hazardous materials?
Yes □ No □ b) If yes, are you aware that these toxic/hazardous materials require special treatment for environmentally sound
disposal? Yes □ No □ 4.3 a) Does the disposal/treatment method in use for electronic waste have any impact on the environment?
Yes □ No □ Not sure □ b) If yes, indicate the part(s) of the environment affected and rate the impact
IMPACT
PARTS OF ENVIRONMENT AFFECTED VERY STRONG STRONG FAIRLY NO EFFECT
Land
Air
Surface water
Underground water
Vegetation
4.4 a) Does your involvement in handling of/ being in contact with electronic waste have a negative impact on your
health? Yes □ No □ Do not know □ b) If yes, what is the nature of health hazard? Rate severity.
SEVERITY
NATURE OF HEALTH HAZARD HIGHLY SEVERE SEVERE FAIRLY NOT SEVERE
Headache
Body Pain
Dizziness
Cough
Others specify
OPEN ACCESS JEP