Embed Size (px)
Citation preview

Report ITU-R M.2243(00/2011)
Assessment of the global mobile broadband deployments and
forecasts for International Mobile Telecommunications
M Series
Mobile, radiodetermination, amateurand related satellite services

ii Rep. ITU-R M.2243
Foreword
The role of the Radiocommunication Sector is to ensure the rational, equitable, efficient and economical use of the radio-frequency spectrum by all radiocommunication services, including satellite services, and carry out studies without limit of frequency range on the basis of which Recommendations are adopted.
The regulatory and policy functions of the Radiocommunication Sector are performed by World and Regional Radiocommunication Conferences and Radiocommunication Assemblies supported by Study Groups.
Policy on Intellectual Property Right (IPR)
ITU-R policy on IPR is described in the Common Patent Policy for ITU-T/ITU-R/ISO/IEC referenced in Annex 1 of Resolution ITU-R 1. Forms to be used for the submission of patent statements and licensing declarations by patent holders are available from http://www.itu.int/ITU-R/go/patents/en where the Guidelines for Implementation of the Common Patent Policy for ITU-T/ITU-R/ISO/IEC and the ITU-R patent information database can also be found.
Series of ITU-R Reports
(Also available online at http://www.itu.int/publ/R-REP/en)
Series Title
BO Satellite delivery
BR Recording for production, archival and play-out; film for television
BS Broadcasting service (sound)
BT Broadcasting service (television)
F Fixed service
M Mobile, radiodetermination, amateur and related satellite services
P Radiowave propagation
RA Radio astronomy
RS Remote sensing systems
S Fixed-satellite service
SA Space applications and meteorology
SF Frequency sharing and coordination between fixed-satellite and fixed service systems
SM Spectrum management
Note: This ITU-R Report was approved in English by the Study Group under the procedure detailed in Resolution ITU-R 1.
Electronic Publication Geneva, 2012
ITU 2012
All rights reserved. No part of this publication may be reproduced, by any means whatsoever, without written permission of ITU.

Rep. ITU-R M.2243 1
REPORT ITU-R M.2243
Assessment of the global mobile broadband deployments and forecasts for International Mobile Telecommunications1
(2011)
TABLE OF CONTENTS
Page
Overview .................................................................................................................................. 2
1 Introduction .................................................................................................................... 3
2 Traffic and user penetration information of existing mobile broadband deployments (until 2011) ..................................................................................................................... 6
2.1 Global IMT traffic from 2006 to 2011 ............................................................... 6
2.2 Global IMT subscriber information from 2006 to 2011 ..................................... 7
3 Trends contributing to increased demand for mobile broadband ................................... 8
3.1 New type of devices, such as smart phones, dongles, tablets ............................. 8
3.2 Mobile Internet usage is increasing .................................................................... 10
3.3 Huge increase of mobile software application offerings (Apps) ........................ 10
3.4 Video traffic is growing dramatically ................................................................. 10
3.5 Media rich social networks go mobile ................................................................ 10
3.6 Machine-to-machine traffic is growing and expanding to new applications ...... 11
3.7 More capable network – user experience improvement ..................................... 11
3.8 Cost reduction and price decrease ...................................................................... 12
3.9 Several policy initiatives to promote mobile broadband .................................... 12
3.10 Potential area to increase data traffic .................................................................. 12
3.11 Broader user-age demographics and its impact on traffic growth ...................... 13
4 Mobile broadband forecasts up to 2020 and beyond ...................................................... 13
4.1 Reviewing the previous ITU market forecast study ........................................... 13
4.2 Mobile data traffic forecast ................................................................................. 15
1 Certain information in this Report is based upon material with the indicated publication/availability dates and does not necessary reflect published changes to these materials that might have occurred subsequent to the preparation date (19 October 2011) of this Report.

2 Rep. ITU-R M.2243
Page
5 Conclusions .................................................................................................................... 17
Abbreviations ........................................................................................................................... 19
Annexes
A1 List of related ITU-R Recommendations and ITU-R Reports ....................................... 20
A2 Detailed information of existing mobile broadband implementation ............................. 22
A3 Detailed information on usage and application trends of mobile broadband ................. 45
A4 New mobile broadband forecasts ................................................................................... 69
A5 Various measures to respond to increased mobile broadband traffic ............................. 81
A6 International, regional and national mobile broadband initiatives ................................. 84
Overview
This Report reviews both the market and traffic forecasts for International Mobile Telecommunications (IMT) that were developed in previous study periods (extending from 2000-2007) and assesses the current perspectives and future needs of mobile broadband that would be supported by IMT over the next decade (2012-2022). It also presents new traffic forecasts provided by a number of industry sources for the forecast up to 2015 and one source for the forecast between 2015 and 2020 taking into account new market trends and market drivers.
See also relevant portions of reports from the UN Broadband Commission2 as appropriate.
Figure 1 below indicates the fixed and mobile broadband penetrations in percentages for different regions of the world. Most notable is Africa where fixed broadband is virtually non-existent and yet mobile broadband is growing. The Americas in Figure 1 includes North, Central and South America.
2 Recognizing the importance of mobile broadband, the ITU and UNESCO announced in May 2010 the establishment of UN Broadband Commission for digital development which will define strategies for accelerating broadband rollout worldwide and examine applications that could see broadband networks improve the delivery of a huge range of social services, from healthcare to education, environmental management, safety and much more. (See http://www.broadbandcommission.org).

Rep. ITU-R M.2243 3
FIGURE 1
Fixed and mobile broadband penetration in 20103
New types of mobile devices, such as smartphones and tablets, and new user behaviours have emerged. These developments were not foreseen in the last study period (before WRC-07), though it appears these trends will continue into the future.
Application stores for various mobile platforms have created a large new market. The use of mobile Applications has increased mobile broadband traffic significantly and would still increase it dramatically.
According to the various new forecasts, it is indicated that global mobile data traffic in the year 2015 would be much higher than the traffic in the year 2010 and this growth according to one source is estimated to continue to be strong between 2015 and 2020.
Based on the study of global mobile broadband deployments and forecasts for IMT, this Report clearly indicates that the ITU-R should consider this increasing mobile broadband traffic demand in the next study period.
In this report, at several places, there are statistics and information relating to the development of IMT which may indicate the situation in specific geographical regions, geographical locations, and/or group of countries. These statistics should not be considered reflecting the actual situation in other geographical regions, geographical locations, and/or group of other countries.
1 Introduction
Mobile communications including mobile broadband communications have been playing very positive roles in economic and social developments of both developed and developing countries. Over the past 25 years, the ITU has been coordinating the development of global broadband mobile
3 Source: ITU World Telecommunication/ICT Indicators Database.
2.5
10.27.5
11.2
41.3
24.1
0.21.9
5.58.3
23.8
14.1
0
5
10
15
20
25
30
35
40
45
Africa Arab States Asia & Pacific
CIS* Europe The Americas
Mobile Broadband
Fixed Broadband
Per 100 inhibitants
* CIS: Commonwealth of Independent States

4 Rep. ITU-R M.2243
telecommunication system and due to these efforts on IMT technologies, there has been successful and impressive growth of mobile communications and we see also the early uptake of mobile broadband.
IMT encompasses both IMT-2000 and IMT-Advanced collectively based on Resolution ITU-R 56. IMT-2000 provides access by means of one or more radio links to a wide range of telecommunications services supported by the fixed telecommunications networks (e.g. PSTN/Internet) and other services specific to mobile users.
Since the year 2000, IMT-2000 has been continuously enhanced and. IMT-2000 Recommendation ITU-R M.1457 has been updated continuously. Some new features and technologies were introduced to IMT-2000 which enhanced its capacity.
International Mobile Telecommunications – Advanced (IMT-Advanced) is a mobile system that includes the new capabilities of IMT that go far beyond those of IMT-2000 and also has capabilities for high-quality multimedia applications within a wide range of services and platforms providing a significant improvement in performance and quality of current services. IMT-Advanced systems support low to high mobility applications and a wide range of data rates in accordance with user and service demands in multiple user environments. Such systems provide access to a wide range of telecommunication services including advanced mobile services, supported by mobile and fixed networks, which are generally packet-based.
As of February 2011 there are globally 5.3 billion mobile subscriptions amongst the planet’s 6.9 billion people. Globally, it is estimated that 3.7 billion people out of the total of 6.9 billion people are connected and can be instantly in touch with each other at home, in the office or during travel. Also, more than 90% of the world’s population is under the coverage of mobile networks, which compared with the global Internet penetration of 30%, represents a huge potential for mobile broadband to become a major access enabler to Internet.
According to the ITU Statshot Issue 7, August 2011,4 in 2010, almost 100 economies had mobile cellular penetration over 100% – and 17 economies5 had penetration rates above 150% as depicted in Figure 2.
4 ITU Statshot Issue 7, August 2011, see http://www.itu.int/net/pressoffice/stats/2011/03/index.aspx.
5 From the same source in above footnote, the 17 economies are: Anguilla, Finland, Maldives, Kuwait, St Kitts & Nevis; Oman, Russia, Suriname, Libya, Vietnam, Cayman Islands, Antigua & Barbuda, Panama, Montenegro, Saudi Arabia, Hong Kong (China) and Macao (China).

Rep. ITU-R M.2243 5
FIGURE 2
Mobile penetration for various economies
(Source: ITU Statshot Issue 7, August 2011)
In some developing countries, the broadband access to the Internet is performed via mobile networks such as IMT. This type of internet access is spreading very fast. IMT services and applications are opening up new opportunities for connectivity and services, e.g. location based services will assist consumers to be aware of local circumstances and use that information to their benefit.
The mobile broadband manufacturing industry is continuously evolving towards more efficient radiocommunication technologies, coupled with an all-IP open Internet network architecture. Through innovations like beam forming antenna systems, interference mitigation, multiple and aggregated carriers, power control, repeaters and scheduling schemes, etc., efficiency of spectrum usage has been achieved. Although some of these enhancements in the IMT radiocommunication technologies are enabling operators to further increase their capability and capacity within their operating spectrum, it is foreseen that these new demands, especially, for much higher bit rate service, will require additional actions in the future, further leading to reduced costs to achieve greater affordability.

6 Rep. ITU-R M.2243
2 Traffic and user penetration information of existing mobile broadband deployments (until 2011)
2.1 Global IMT traffic from 2006 to 2011
Since WRC-07, the demand for mobile data services has grown significantly, with a reported 522% increase in total worldwide mobile data traffic between 2008 and 20106 as illustrated in Figure 3. This is placing increasing pressure on mobile networks to accommodate the continued growth in demand for services.
FIGURE 3
Global mobile traffic during years 2008-2010
By 2010 mobile data traffic was three times the volume of the entire global internet traffic in the year 20006. The dramatic increase has been driven by new services enabled by new devices and business models; most notable was mobile video traffic which grew to 50% of all mobile data traffic by 20107.
The current growth rates of mobile data traffic resemble those of the fixed network from 1997 through 2001, when the average yearly growth was 150%. In the case of the fixed network, the growth rate remained in the range of 150% for 5 years6. The top 1% of mobile data subscribers generate over 20% of mobile data traffic, down from 30% one year ago. Mobile data traffic has evened out over the last year and now matches the 1:20 ratio that has been true of fixed networks for several years. Similarly, the top 10% of mobile data subscribers now generate approximately 60% of mobile data traffic, down from 70% at the beginning of the year8 .
6 Cisco Visual Networking Index: Global Mobile Data traffic Forecast Update 2010–2015 (2011) available at http://www.cisco.com/en/US/solutions/collateral/ns341/ns525/ns537/ns705/ns827/white_paper_c11-520862.html.
7 Ibid.
8 Ibid.

Rep. ITU-R M.2243 7
Additionally, smart phones represent only 13% of total global handsets in use today, but they represent over 78% of total global handset traffic. In 2010, the typical smart phone generated 24 times more mobile data traffic (79 MB per month) than the typical basic-feature cell phone (which generated only 3.3 MB mobile data traffic per month)9.
2.2 Global IMT subscriber information from 2006 to 2011
As of February 2011 there are globally 5.3 billion mobile subscriptions amongst the planet’s 6.9 billion people and more than 1.2 billion10 people among the global population are connected via 3G network (18% penetration). Figures 4 and 5 depict both mobile subscriptions worldwide and active mobile broadband subscriptions, respectively11. Annex 2 provides more detailed information for existing mobile broadband implementation.
FIGURE 4
Mobile subscriptions (worldwide)
9 Ibid.
10 The 1.2 billion number is the sum of 677M global WCDMA subscriptions (including HSPA) from the UMTS Forum, http://www.umts-forum.org/: and 561M CDMA2000 (including EV-DO) from the CDMA Development Group, http://www.cdg.org/.
11 ITU, Key ICT indicators for developed and developing countries and the world (totals and penetration rates), available at webpage http://www.itu.int/ITUD/ict/statistics/at_glance/KeyTelecom2010.html, October 2010 and definition of the terms can be found at webpage http://www.itu.int/ITU-D/ict/handbook.html.
0
1000
2000
3000
2005 2006 2007 2008 2009 2010
Africa Arab States Asia & Pacific CIS Europe The Americas
millions

8 Rep. ITU-R M.2243
FIGURE 5
Active mobile broadband subscriptions (millions) per region
3 Trends contributing to increased demand for mobile broadband
3.1 New type of devices, such as smart phones, dongles, tablets
A wide range of enhanced devices that incorporate cellular connectivity have entered the market during the past three years, including smartphones, USB dongles, tablets, e-book readers and gaming consoles. These devices offer larger screen sizes and high resolution and hence increase data consumption and encourage the use of traffic-intensive applications such as video calling. As a result, these devices have been a key driver of increased mobile broadband traffic.
Smartphones
In 2008, basic mobile voice phones accounted for 70% of total traffic (1 319 Petabytes (PB) per year) while in 2010, smart phones represent 13% of total global handsets in use, but they represent over 78% of total global handset traffic and an average smart phone generated significantly more mobile data traffic (79 Mb per month) than the basic-feature mobile phone.
Touch-screen smartphones (launched from around 2007) have been a key driver of mobile data traffic growth, offering users the ability to browse standard websites on their mobile device for the first time. The volume of smartphone data carried by cellular networks is growing very rapidly, driven predominantly by increases in device penetration, but also by increases in average usage12
12 A significant proportion of smartphone traffic is generated indoors; accordingly, we estimate that between 80% and 90% of this traffic is routed over Wi-Fi and fixed broadband networks (included here in the data supplied).
0
50
100
150
200
250
300
350
2007 2008 2009 2010
Africa
Arab States
Asia & Pacific
CIS
Europe
The Americas

Rep. ITU-R M.2243 9
In developed markets, a smartphone generates about 50 times more data per month than a basic phone13. This includes all data generated and consumed by the device – including that offloaded onto a Wi-Fi network. For example, in Western Europe a smartphone generates 73 MB of data traffic per month, compared to an average of 1.22 MB per month for a basic phone, which equates to a ratio of 60:1 for the two device types.
In absolute terms the volume of traffic generated by smartphones remains small compared to tablets and laptops. One notable development will be 3D displays, which is anticipated to become well established on smartphones by 2013 and it is estimated that these 3D smartphones could generate many times more traffic than established user applications.
Connected devices
A wide range of new, connected devices, including tablets, e-readers and gaming devices, have emerged in the last three years and are already beginning to have an impact on mobile traffic volumes. A tablet generates as much as 500 times the data traffic of a basic mobile phone14. For example, in Western Europe a tablet generates a total of 740 MB per month compared to 1.22 MB per month for a basic phone.
Other device developments
Table 1 provides an overview of other technology developments that are set to increase user demand for mobile data:
TABLE 1
Technology developments that are set to increase user demand for mobile data
Development Remarks
Virtualisation Could enable users to partition one mobile phone into two separate devices – for example, to create a virtual business phone on a personal smartphone (or vice versa). This could reduce the cost of smartphone ownership by negating the need to purchase secondary devices, and thus drive take-up.
Multitasking The ability to run multiple applications concurrently, including the possibility of using multiple frequency bands simultaneously.
Introduction of GPUs
The introduction of graphical processing units (GPUs) will enhance the performance of video applications and thus promote mobile video consumption. The overall user experience of such applications is currently limited by network capacity.
Introduction of MPUs mobile cloud
The introduction of multiprocessor units (MPUs) will replace standalone GPUs and, along with virtualisation, is expected to reduce handset costs. The demand for mobile cloud services is expected to grow since the users are increasingly adopting more services that are required to be accessible. These services require synchronisation of data across multiple devices with a centralised storage access in the cloud.
13 Analysis Mason (UK, 2010).
14 Ibid.

10 Rep. ITU-R M.2243
3.2 Mobile Internet usage is increasing
Basically, people expect and would like to use any Internet application on their mobile devices in the same manner as they do in fixed connection. Additionally, mobile devices enable new applications such as location based services.
Mobile Internet took off in 2007 and by 2009; there were 95 million mobile Internet users in Europe and 55 million mobile Internet users in USA. The recent take-up of smart phones, which is tailored for mobile Internet experience, is also a key driving force in the significant development of the mobile Internet market. Most mobile broadband systems are extensions of the Internet services and focused on entertainment.
In February 2011, more than 90% of the world’s population was under the coverage of mobile networks which, compared with the global Internet penetration of 30%, represents a huge potential for mobile broadband to become a major access enabler to Internet. For the majority of people in developing countries, the first access to the Internet is performed via mobile broadband networks using IMT technologies in most instances. This continuous and seamless mobile connection is enabled by small and capable mobile terminals using IMT Technologies or PCs with dongles and tablets. This type of Internet access via mobile terminals is spreading very rapidly.
3.3 Huge increase of mobile software application offerings (Apps)
Between 2008-2010 alone, over 300,000 mobile Apps have been developed for smartphones. The most used mobile Apps are games, news, maps, social networking, music and more recently medical Apps. Many stakeholders are now offering mobile Apps through commercial online stores and application stores for various mobile platforms and thus have created a large new market, with an estimated 11 billion downloads by February 2011. It is estimated that global downloads will reach 77 billion in 2014 and will be worth US $35 billion. The majority of mobile Apps are planned with the assumption that users are online and connected, consequently increasing mobile broadband traffic.
3.4 Video traffic is growing dramatically
Mobile video generally refers to real time entertainment consumption of video streaming, generic Flash video and other various webcasting. By year 2010, YouTube and Flash have generated the majority of mobile video traffic. However video sharing has also emerged as a new way to consume audiovisual content, and has particularly been adopted by fixed Internet users. For many viewers, consuming a video no longer just means watching it, but also sharing it with their community, commenting on it, blogging about it, tagging it, etc. This is why the online video market is largely dominated by community-based sites.
Moreover, uploading videos on one’s social networking profile is also becoming a way to share video. Hence, community networks (like Facebook) are also video viewing sites.
For the coming years, video will be responsible for most mobile data traffic growth through streaming or downloading with a cumulative average growth rate (CAGR) exceeding 100% between 2009 and 2014 and it is predicted that video will account for 66% of mobile data traffic by 2014.
3.5 Media rich social networks go mobile
Since the middle of the last decade, social networks have seen ever-intensifying usage explosion, huge traffic growth and a greater portion of online time devoted to them. They represent a mass-market phenomenon, with almost 70% of Internet users worldwide visiting a social network

Rep. ITU-R M.2243 11
(July 2009). Out of the 770 million people who logged onto an online community that month (up 18% compared to the previous year), almost half visited Facebook.
The role of social network sites is evolving rapidly from their informal, chat-based roots. They are now used for a host of applications, from breaking global news, product marketing and political campaigning to the coordination of natural disaster relief.
On the mobile networks, social networking is experiencing a surging popularity akin to that seen on the fixed networks and is for the time being among the fastest growing mobile applications. According to Allot, Facebook increased its traffic consumption by 200% during the first half of 2010 while Twitter grew by 310% in the same timeframe. This growth can be explained by easy access to such services through smart phones but also the ability to access the services at any time: users with mobile Facebook applications installed on their smart phones are twice as active as the average Facebook user. In April 2010, it is estimated that more than 75% of smart phone users accessed social network sites. In the future it is expected that social networking applications will continue to drive mobile data consumption.
Also, the impact of social network applications on mobile network traffic is increasing. For example in UK, half of mobile web traffic is from Facebook use. On the other hand, the integration of location-based functions with social networks can lead to new applications on mobile networks that will generate lots of mobile data traffic.
3.6 Machine-to-machine traffic is growing and expanding to new applications
The next big wave to increase the mobile data demand will be machine-to-machine (M2M) applications and devices, and M2M is expected to be one of the fastest growing segments. The growth of the M2M market has been driven by markets such as fleet management, industrial asset management, point of sales, security and healthcare. The amount of M2M connections could be several orders of magnitude larger than the world population.
In terms of traffic, the M2M share will depend on related applications. For instance, smart utility meters dedicated to equip homes consume some hundreds of kilobytes/sec while surveillance video monitoring will consume tens of Megabytes/sec.
In addition, new applications such as Animal-Machine (A-M), Human-Machine (H-M), and Animal-Humans (A-H) are very likely to add more traffic. These applications are either in development or early stages of introduction and therefore their impact on data traffic is unknown.
Some of the machine-to-machine traffic may be asymmetric more towards uplink than downlink e.g. in on-line security closed circuit television (CCTV) camera uploads to server, wireless sensor networks, animal to human etc. Traffic requirements for such usage may also differ in timing and geographical location, which may have a lesser impact on network.
In the future, agricultural sciences would benefit vastly from the ability to communicate information remotely. Veterinary sciences, controlling the spread of pestilence/disease in crops and animal husbandry are all likely to gain from this development.
3.7 More capable network – user experience improvement
The introduction of new high-bit rate mobile networks from 2007 onwards has increased service bit-rates and improved reliability. This has led to enhanced mobile broadband user experience as for example users can view more internet pages in less time. The difference between user experience in the mobile environment and fixed (cable) environment is not that big anymore as mobile networks can offer high user bit-rates.
The introduction of IMT-Advanced networks will also provide better user experience by having substantially reduced latency and have the potential to provide multi-player gaming on the network.

12 Rep. ITU-R M.2243
These networks and devices will also provide better and equitable experience in cell edge and interfering environment by having enhanced interference mitigation and/or cancellation techniques. This will also provide better signal strength using co-ordinated multipoint (CoMP) to provide multi-cast services.
3.8 Cost reduction and price decrease
With innovative technologies, both capital and operational expenditures of mobile network operators could be lowered. A next generation wireless network could further enhance data traffic capacity and network flexibility while reducing an operator’s total costs for network deployment and operation. With the cost reduction, operators may offer affordable prices to subscribers with various choices. For instance, a flat-rate mobile data service, in which the user pays a single fixed monthly fee for virtually all the data access they want is already one of driving forces in several countries to increase data traffic.
3.9 Several policy initiatives to promote mobile broadband
The industry has been working on mobile broadband technologies for over a decade and with the current supportive administrations approach, the mobile broadband services are expanding the benefits to all. Many administrations are promoting mobile broadband with their national broadband plans (see Annex 6).
To realize these national plans, United Nations (ITU/UNESCO)15 mention that a new vision is needed of reduced regulatory burdens, innovative incentives and coordinated efforts by all links in the broadband value chain, in order to unleash opportunities for commercial deployments.
3.10 Potential area to increase data traffic
The demand for mobile cloud services is expected to grow exponentially since the users are increasingly adopting more services that are required to be accessible. The consequence is that the volume of mobile content they generate cumulatively grows. Multimedia services captured on mobile devices will overwhelmingly carry the greatest cloud computing and storage demand and the average size of these media files will grow substantially as camera pixel resolution continues to increase (ARC Chart16 predicts that mobile-generated content will consume 9,400 PB of cloud services by 2015).
It is expected that e-health, e-education and other e-government services will also be accessed by mobile devices, which will contribute to improvements in social welfare.
Furthermore, cloud services are getting a lot of attention since, among other benefits, they save costs for enterprises. These cloud services require guaranteed data communication between the clients and the connected data centres hosting IT servers. As the number of mobile users connecting through the mobile network to the cloud increase, the mobile data traffic will continuously grow. As mobile software applications advance due to increasing processing power, mobile data traffic is expected to increase.
15 See the ITU and UNESCO’s Broadband Commission for Digital Development Report “Broadband: A Platform for Progress”. Available: http://www.broadbandcommission.org/report2.pdf.
16 ARC Chart Research Report on the mobile cloud: Market analysis and forecasts, June 2011.

Rep. ITU-R M.2243 13
3.11 Broader user-age demographics and its impact on traffic growth
The age of the users and consequently the way of using Internet has changed over the last years, resulting in an increasing demand. There are two main streams which can be manifested:
– The age of the users is extending at both ends of the human live-cycle: more and more elderly people have started using the Internet and the younger generation is getting educated to the Internet through school and kindergarten at a very young age.
– In particular the new, younger generation is using the Internet for pre-school games, online education, net-homeworking for learning and studying more.
Annex 3 addresses this trend with some specific figures based on one country. It is worthwhile to note that although the figures do not show people below the age of 15, the importance of this group is increasing dramatically.
4 Mobile broadband forecasts up to 2020 and beyond
4.1 Reviewing the previous ITU market forecast study
Figure 6 summarises the previous study period (2003-2007) activities done by ITU-R in order to achieve the vision of IMT on Recommendation ITU-R M.1645, targeting to identify IMT spectrum at WRC-07.
FIGURE 6
Overview of earlier ITU-R studies (2003-2007)
Future services/Market analyses
Future technologyassumptions
Candidatebands
Spectrumsharing studies
Spectrum requirements
Proposal for WRC-07
Spectrum calculations (tool)
2008-2011: Development of standards for IMT-Advanced2008-2011: Development of standards for IMT-Advanced
Spectrumsurvey Name:
IMT-Advanced
Spectrumestimation
methodology
Draft CPM text CPM Report
ResolutionITU-R 56 (RA-07)
Reports ITU-R M.2109,M.2110, M.2111, M.2112,
M.2113, M.2116Resolution ITU-R 57 (RA-07) - PrinciplesWRC-07: WRC-07 Final Acts
Recommendation ITU-R M.1768Report ITU-R M.2072 Report ITU-R M.2074
Report ITU-R M.2078
Report ITU-R M.2079
ITU Radio Regulations (Edition of 2008)

14 Rep. ITU-R M.2243
Figure 6 also shows that there were three main areas of activity for studies performed between 2003 and 2007; on the left of the figure are the market analyses, forecasts and status of spectrum, on the right-hand side of the figure are the technical analyses, and the centre of the figure shows the activities that brought it all together starting with a spectrum estimation methodology and the calculations that considered the market analyses and technology forecasts. Various documents that were prepared, but are not formal ITU-R publications such as the spectrum survey and the spectrum estimation tool, are available online17.
Report ITU-R M.207218 provides market and traffic forecasts which were created based on the various contributions from administrations and organizations in response to the Questionnaires (Circular Letter CACE/326). Report ITU-R M.2072 also provides market related parameters with their values. The findings of Report ITU-R M.2072 were based on internal and external studies to the year 2020 as well as detailed data on the traffic forecasts in different parts of the world. Contributions submitted towards Report ITU-R M.2072 included forecasts for different regions and areas; from global forecasts, to individual countries. There was not a direct correlation between all of the submitted forecasts, so from a global perspective of Report ITU-R M.2072 actually reported a range of estimates.
Prior to WRC-07, Report ITU-R M.2078 calculated spectrum requirement estimates (a lower and higher market settings) based on the data in Report ITU-R M.2072 and other sources19 referred to in that report. In Figure 7 below, the range of the forecast for global traffic represented by Report ITU-R M.2072 is depicted by the blue area. Also included for comparison are the actual traffic figures (brown line) from the CISCO Report, as well as that report’s forecast (red line).
17 http://www.itu.int/ITU-R/index.asp?category=study-groups&rlink=estimate-spectrum&lang=en.
18 “World mobile telecommunication market forecast”, (2005).
19 There was one aggressive estimate “The demand for future mobile communication markets and services in Europe (FMS)”, http://fms.jrc.ec.europa.eu/pages/about.htm, but it used different units and was based on regional information; therefore, it is not easy to compare it to other estimates in Report ITU-R M.2072.

Rep. ITU-R M.2243 15
FIGURE 7
ITU traffic estimates done at year 2005 (Report ITU-R M.2072)
The global estimates from Report ITU-R M.2072 (2005) were quite conservative taking into account the actual mobile traffic rise from 2007 to 2010. It should be noted that the actual data traffic is many times greater (more than 5) than some of the estimates in Report ITU-R M.2072. Moreover, the actual traffic being experienced by the operators today is even greater than some of the forecasts in Report ITU-R M.2072 for the year 2020.
One Report ITU-R M.2072 forecast also anticipated that in 2015 data traffic would be equal to voice traffic for the first time, but, in reality, the proportion of traffic from mobile data already exceeded mobile voice in 2009.
4.2 Mobile data traffic forecast
Having seen the trends identified in previous section, there are several forecasts of global data traffic as depicted in Figure 8.
This figure illustrates a range of forecasts which have been published from various multiple external sources, and the average curve which results from this set of individual forecasts. For many sources, forecasts in Figure 8 are based on the most up-to-date reports which were updated over the time span between the end of 2010 and May 201120.
20 Cisco Visual Networking Index: Global Mobile Data Traffic Forecast Update, 2010-2015.

16 Rep. ITU-R M.2243
FIGURE 8
Mobile global data traffic estimates from 2011 to 2015 based on multiple sources
It can be seen from Figure 8 that there are some similarities in short term estimates, but variations in the long term forecasts. Some discrepancies are related to different assumptions assumed in each forecasts.
Based on existing mobile broadband growth and new trends, several new traffic estimates, as depicted in Figure 8 from multiple sources, have been concluded which forecast extensively more mobile broadband traffic compared to estimates done before WRC-07.
Moreover, when looking at the traffic forecasts over the next decade, one source (UMTS Forum)21 anticipates total mobile traffic of more than 127 Exabytes (EB) in 2020 that represents a 33 times increase compared with 2010 figures.
According to the same source, Asia will represent 34.3% of total world mobile traffic while Europe and The Americas (including North, Central and South America) represent 22% and 21.4%, respectively as depicted in Figure 9.
21 UMTS Forum Report: Mobile Traffic forecasts: 2010-2020, Report 44, January 2011.

Rep. ITU-R M.2243 17
FIGURE 9
Regional traffic forecasts for 2020
Finally, when looking deeper into the future beyond 2020, the same source anticipates global mobile traffic of 350 EB in 2025 (worldwide) representing a 174% increase compared to 2020. However, it should be noted that the 2025 forecasts here are given in order to show mobile traffic trends, but that the model used was designed for 2010-2020. Given this uncertainty this information should be considered as informative only at this stage.
5 Conclusions
Mobile communications including mobile broadband communications have been playing important roles in the economic and social developments of both developed and developing countries, such as growth of economy, mitigation of digital divide, improvement of life quality, and facilitation of other industries. Rapid uptake of smart phones, tablets and innovative mobile applications created by users has resulted in a tremendous increase in the volume of mobile data traffic which was not foreseen before WRC-07. The current data traffic (in year 2010) is more than 5 times greater than some of the estimates for Report ITU-R M.2072. Moreover, the actual traffic being experienced by some operators today (year 2011) is even greater than some of the 2020 forecasts given in Report ITU-R M.2072.
Developing countries will also play an important role in the next period, due to their large markets and relatively low deployment levels of IMT up until now. With the introduction of higher capability networks and enhanced devices, even more user friendly interfaces will emerge to make mobile applications more generally accessible.

18 Rep. ITU-R M.2243
New traffic forecasts are provided by a number of industry sources for the forecast up to 2015 and one source for the forecast between 2015 and 2020 taking into account new market trends and market drivers.
This Report reviews both the market and traffic forecasts for IMT that were developed in previous study periods (2000-2007) and assesses the current perspectives of the future needs of mobile broadband to be supported by the IMT for the next decade (2012-2022).
Based on the study of global mobile broadband deployments and forecasts for IMT, this Report clearly indicates that the ITU-R should consider this increasing mobile broadband traffic demand.
The following 6 Annexes are attached to this document:
Annex 1 List of related ITU-R Recommendations and ITU-R Reports
Annex 2 Detailed information on existing mobile broadband implementations
Annex 3 Detailed information on usage and application trends of mobile broadband
Annex 4 New mobile broadband forecasts
Annex 5 Various measures to respond to increased mobile broadband traffic
Annex 6 International, regional and national mobile broadband initiatives

Rep. ITU-R M.2243 19
Abbreviations
ACMA
App / Apps
BS
CA
Australian Communications and Media Authority
(Software) Application/-s
Base station
Carrier aggregation
CAGR Cumulative average growth rate
CCTV Closed circuit television
CoMP Coordinated multi point
eICIC Enhanced inter cell interference coordination
GDP Gross domestic product
GPU Graphical processing unit
HSDPA High speed data packet access
HSPA High speed packet access
IMT International Mobile Telecommunication
ISDN Integrated services digital network
M2M Machine-to-machine
MIMO Multiple input multiple output
MPU Multi processor unit
RATG
RFID
Radio Access Technology Group
Radio frequency identification
WRC World Radio Conference
PSTN
UGC
Public switched telecommunications network
User generated content
UN United Nations

20 Rep. ITU-R M.2243
Annex 1
List of related ITU-R Recommendations and ITU-R Reports
Recommendation ITU-R M.687: International Mobile Telecommunications-2000 (IMT-2000)
Recommendation ITU-R M.816: Framework for services supported on International Mobile Telecommunications-2000 (IMT-2000)
Recommendation ITU-R M.819: International Mobile Telecommunications-2000 (IMT-2000) for developing countries
Recommendation ITU-R M.1034: Requirements for the radio interface(s) for International Mobile Telecommunications-2000 (IMT-2000)
Recommendation ITU-R M.1457: Detailed specifications of the terrestrial radio interfaces of International Mobile Telecommunications-2000 (IMT-2000)
Recommendation ITU-R M.1645: Framework and overall objectives of the future development of IMT-2000 and systems beyond IMT-2000
Recommendation ITU-R M.1768: Methodology for calculation of spectrum requirements for the future development of the terrestrial component of IMT-2000 and systems beyond IMT-2000
Recommendation ITU-R M.1801: Radio interface standards for broadband wireless access systems, including mobile and nomadic applications, in the mobile service operating below 6 GHz
Recommendation ITU-R M.1822: Framework for services supported by IMT
Draft new Recommendation ITU-R M.[IMT.RSPEC]: Detailed specifications of the terrestrial radio interfaces of International Mobile Telecommunications – Advanced (IMT-Advanced). [Editor’s note: This Recommendation is still under the approval process].
Report ITU-R M.2040: Adaptive antennas concepts and key technical aspects
Report ITU-R M.2072: World mobile telecommunication market forecast
Report ITU-R M.2074: Radio aspects for the terrestrial component of IMT-2000 and systems beyond IMT-2000
Report ITU-R M.2078: Estimated spectrum bandwidth requirements for the future development of IMT-2000 and IMT-Advanced
Report ITU-R M.2079: Technical and operational information for identifying Spectrum for the terrestrial component of future development of IMT-2000 and IMT-Advanced
Report ITU-R M.2109: Sharing studies between IMT-Advanced systems and geostationary satellite networks in the fixed-satellite service in the 3 400-4 200 and 4 500-4 800 MHz frequency bands
Report ITU-R M.2110: Sharing studies between radiocommunication services and IMT systems operating in the 450-470 MHz band
Report ITU-R M.2111: Sharing studies between IMT-Advanced and the radiolocation service in the 3 400-3 700 MHz bands

Rep. ITU-R M.2243 21
Report ITU-R M.2112: Compatibility/sharing of airport surveillance radars and meteorological radar with IMT systems within the 2 700-2 900 MHz band
Report ITU-R M.2113: Sharing studies in the 2 500-2 690 MHz band between IMT-2000 and fixed broadband wireless access systems including nomadic applications in the same geographical area
Report ITU-R M.2116: Characteristics of broadband wireless access systems operating in the land mobile service for use in sharing studies

22 Rep. ITU-R M.2243
Annex 2
Detailed information of existing mobile broadband implementation
A2.1 Introduction
This Annex is covering some detailed information on current mobile implementations including information on subscriptions and infrastructure, penetration of subscriptions, traffic information on data and voice, growth and coverage on a regional and country basis.
Some particular detailed information to take notice of is that with regard to current mobile implementations, as of mid-2011 there are globally about 6 billion mobile subscriptions and at the end of 2010 there were almost 4 billion mobile cellular subscriptions in the developing world.
A2.2 Global information on mobile broadband implementations
Subscriptions, as of mid-2011 there are globally about 6 billion22 mobile subscriptions amongst the planet’s 6.9 billion people. At the end of 2010 there were almost 4 billion mobile cellular subscriptions23 in the developing world with active SIM cards. Globally, it is estimated that 3.7 billion people out of the total of 6.9 billion people are connected to the global network meaning that they are connected all the time and can be instantly in touch with each other at home, in the office or during travel. The number of IMT users is strongly growing in the regions of Asia-Pacific, Europe and North America. In other part of the world, e.g., in Africa, most of the new broadband users are IMT user, although the absolute number is not so high. In August 2011 1.535 billion24 people among the global population of 6.9 billion people are connected via IMT mobile broadband networks.
Penetration, in February 2011 IMT broadband systems had achieved 18% user penetration globally. LTE network migration is being initially driven by operators in Western Europe and North America, which account for a combined 70%25 of global LTE connections in 2010.
Traffic, at mid-2010, there were already more than 5 billion mobile users worldwide (excluding the machine-to-machine (M2M) market) as shown in the Figure A2.1 below.
22 GSA/Informa Telecoms & Media 5.214 billion (GSM, HSPA and LTE), CDG 738 million (cdma2000 and EV-DO) and WiMAX 20 million.
23 ITU Statshot http://www.itu.int/net/pressoffice/stats/2011/03/index.aspx.
24 UMTS Forum 799 million and CDG 738 million = 1.535 billion on 2011-08-15.
25 GSMA.

Rep. ITU-R M.2243 23
FIGURE A2.1
Mobile subscriptions and mobile density (worldwide)
As more and more users are connected via mobile communication systems, the traffic also grows very fast in recent years exponentially. By 2010 mobile data traffic was three times the size of the entire global internet in 200026, 27. The dramatic increase was driven by new services enabled by new devices and business models; most notably was mobile video traffic which grew to 50% of all mobile data traffic by 201026.
“The current growth rates of mobile data traffic resemble those of the fixed network from 1997 through 2001, when the average yearly growth was 150%. In the case of the fixed network, the growth rate remained in the range of 150% for 5 years”. The global mobile data traffic report referred in the above text also states that “The top 1% of mobile data subscribers generates over 20% of mobile data traffic, down from 30% one year ago. According to a mobile data usage study conducted by Cisco, mobile data traffic has evened out over the last year and now matches the 1:20 ratio that has been true of fixed networks for several years. Similarly, the top 10% of mobile data subscribers now generate approximately 60% of mobile data traffic, down from 70% at the beginning of the year26”.
Additionally, “Smartphones represent only 13% of total global handsets in use today, but they represent over 78% of total global handset traffic. In 2010, the typical smartphone generated 24 times more mobile data traffic (79 Mb per month) than the typical basic-feature cell phone (which generated only 3.3 Mb per month of mobile data traffic)26.
26 Cisco Visual Networking Index: Global Mobile Data traffic Forecast Update 2010–2015 (2011) available at http://www.cisco.com/en/US/solutions/collateral/ns341/ns525/ns537/ns705/ns827/white_paper_c11-520862.html.
27 Global mobile data traffic in 2010 (237 Pb per month) was over three times greater than the total global Internet traffic in 2000 (75 Pb per month); Cisco Sys.

24 Rep. ITU-R M.2243
TABLE A2.1
Global Internet traffic and mobile data traffic growths
FIGURE A2.2
3G users, by Quarter/region (Source: Informa)
Growth, driven by the maturation of IMT, the number of deployed IMT-2000 networks continues to grow, and increases rapidly in recent years. In the last 3 years, more licenses for IMT-2000 were issued. Today the coverage of IMT networks has expanded to a similar level of second generation (2G) networks. In Figure A2.3 below, for the 2G and IMT-2000 (often referred to as third generation, 3G) the number of new licenses by year are shown.
-
100,000,000,000
200,000,000,000
300,000,000,000
400,000,000,000
500,000,000,000
600,000,000,000
700,000,000,000
800,000,000,000
900,000,000,000
1,000,000,000,000
2,007 2,008 2,009 2,010
Total Traffic (MB pa)
Simple Voice
Messaging
Browsing
Location Based
M-Commerce
Images/personalistion
Games
Music
Video
Gambling
Mobile Office
Mobile Workforce
Business Email
VoIP

Rep. ITU-R M.2243 25
FIGURE A2.3
2G/3G number of new licenses by
In Figure A2.4 below, the IMT users in different regions and countries are shown on a quarterly basis between the years 2008 and 2010.
FIGURE A2.4
IMT users, by quarter per region
2003 2004 2005 2006 2007 2008 20090
50
100
150
200
250
300
Year
No. of new 3G licensesNo. of new 2G licensesNo. of accumulated 2G&3G licenses (after 2003)
0
50,000,000
100,000,000
150,000,000
200,000,000
250,000,000
2008Q2
2008Q3
2008Q4
2009Q1
2009Q2
2009Q3
2009Q4
2010Q1
Africa
Americas
Asia Pacific
Europe
Middle East
USA/Canada

26 Rep. ITU-R M.2243
Coverage, more than 90%28 of the world’s population is under the coverage of mobile networks, which compared with the global Internet penetration of about 30%29 represents a huge potential for mobile broadband to become a major access enabler to Internet. For the majority of people in developing countries, the first and only access to the Internet is performed via an IMT network. This type of internet access is spreading very fast.
The latest IMT technologies are capable of providing theoretical connection speed ranging between 3.6 Mbps and 100 Mbps, with authentic measurements using commercial devices in different places, in at least one metropolitan area showed an average downlink speed of 41.5 Mbps, which is on par with DSL type wired networks.
The total IMT population coverage has increased over recent years but is heterogeneous, depending on the country. Indeed, the first areas with mobile broadband coverage were cities where the density of population is highest. Other areas are now being covered and refarming enable operators to use the bands below the frequency 1 GHz, which provides properties for larger cell radius than the bands around the frequency 2 GHz.
A2.3 Regional specific information, Region 1
Europe
Subscriptions and infrastructure, when the issue of mobile service spectrum for IMT was considered by WRC-07, there were less than 30 million UMTS/HSPA connections in Europe. Today (January 2011) there are 115 million. According to wireless intelligence, relevant figures on HSPA and LTE-network deployments:
− There are currently 147 HSPA networks in Europe, including 40 HSPA+ networks.
− There are already 15 live LTE networks.
Penetration, the following Table A2.2 provides a summary of user penetration of mobile broadband (penetration as percent of the total population) can be drawn:
28 https://communicationsdirectnews.com/do.php/100/41984?7649: “UN Report Finds Global Mobile Coverage at More Than 90%” (October 20, 2010).
29 http://www.internetworldstats.com/stats.htm.

Rep. ITU-R M.2243 27
TABLE A2.2
Mobile broadband user penetration
Country User penetration (%) Notes (Response from questionnaire)
Andorra 5.4 4 500 users
Austria 15.4 1 291 000 mobile broadband users in Q4/2009
Croatia 6.4 289 000 mobile broadband users by mid-2010
Cyprus 1.1 1.1% in January 1st 2010
Czech Rep. 3.5 3.53% in December 2009
Denmark 29.6 1 636 000 subscriptions end 2009
Estonia 19 active Mb users = 18% - 19% Q1 2010
Finland 17 908 000 users on 31/12/2009
France 39 24.4 million active multimedia customers on 30/06/2010
Germany 23.2 19 millions in 2009
Iceland 6.2 19 755 out of 317 630 end of year 2009
Ireland 12 540,546 in Q3 2010
Latvia 17.6 391 000 in January 2010
Malta 15.1 62 345 on 01/2010
Netherlands 30.8 4 594 000+533000 in December 09
Poland 6.4 2 460 105 mobile broadband subscriptions by 30.06.2010
Portugal 19.5 By 15.02.2010
Russia 6 By 15.10.2010
Slovak Rep. 5 Approx. 5 %.
Sweden 63 From http://www.statistik.pts.se/pts2009/index.html
Switzerland 23 1 813 700 users on 31/12/2008
NOTE 1 – ‘.’ denotes the integer/decimals separator, i.e. 1.5 TB = 1 500 GB. NOTE 2 – Some difference between countries is due to the fact that the definition of mobile broadband differs country by country.
The evolution of the mobile broadband user penetration is indicated in the Figure A2.5 in percentage of the total population.

28 Rep. ITU-R M.2243
FIGURE A2.5
Evolution of mobile broadband user penetration
NOTE 1 − The definition of mobile broadband changed in Sweden and therefore the temporary decline in Swedish penetration curve.
NOTE 2 − Some difference between countries is due to the fact that the definition of mobile broadband differs country by country.
Traffic, in 2010, a Questionnaire to CEPT Administrations related to mobile broadband deployments was done in order to gather information in terms of traffic statistics and mobile broadband penetration rates. In responses received in CEPT Questionnaire, there were some variations of definition of mobile broadband. Also, there were some variations related to the unit used with received information; for example, instead of per subscriptions, responses indicated traffic (and penetration) per subscriber, per customer or per connection. This also can lead to some slight variation in figures.

Rep. ITU-R M.2243 29
TABLE A2.3
Mobile broadband total traffic statistics per country (per month)
Country Total Traffic (TB/month) Notes (Response from questionnaire)
Germany 2 792 33.5 million Gb in 2009
Sweden 2 787 (893 000 × 2 622 + 418 000 × 1 065) Mb/month
Netherlands 2 339 2 339 794 000 Mb in December 09
Austria 1 667 5 000 000 Gb in Q4/2009
Finland 1 667 10 000 TB in H2 2009
Denmark 771 4 626 million Mb in H2 2009
Ireland 660 602 379 +57 626 Gb/month in Sept. 09
Portugal 199
Slovak Rep. 121 5% penetration, 15 Mb per subscription per day
Switzerland 58 701 715 000 000 kilobytes in 2008
Estonia 41 123 million Mb in Q1 2010
Croatia 31
Russia 27 October 2010; the data is only relevant to UMTS in 2.1 GHz
Iceland 19 224 017 299 Mb in 2009
Malta 7 83 924 Gb in 2009
Andorra 0 42 218 360 000 Bytes/bonth
NOTE 1 − 1 TB (Terabyte) =1 000 GB (Gigabyte) =8 000 Gbits.
NOTE 2 − Traffic is rounded to the nearest integer.
FIGURE A2.6
Evolution of mobile broadband traffic

30 Rep. ITU-R M.2243
In order to get the daily traffic per subscription, the overall country traffic has to be calculated per day. Then that has to be divided by the amount of mobile broadband subscriptions. Table A2.4 depicts daily traffic statistics per county:
TABLE A2.4
Mobile broadband daily traffic statistics (from 2009-2010)
Country Mobile broadband traffic per day
Sweden 61 MB
Finland 61 MB
Hungary 45 MB
Denmark 43 MB
Austria 42 MB
Ireland 42 MB
Iceland 31 MB
Estonia 18 MB
Croatia 16 MB
Slovak Republik 15 MB
Germany 4.8MB
Netherlands 2.3MB
NOTE 1 − Traffic is rounded to the nearest integer.
There is a lot of variation between CEPT countries, depending on several issues e.g. pricing (flat rate) offers from operators. Also, there were some variations of definition of Mobile Broadband and variations related to the unit used with received information. TeliaSonera released figures on data use on their networks in November 2010. These TeliaSonera figures benchmark closely to other user figures from around the world showing:
− An average smartphone user consumes upward of 375 MB of data per month 12.5 MB/day.
− 3G modems use an average of 5 Gb of bandwidth per month 167 MB/day.
− LTE user are consuming 15 Gb of data per month 500 MB/day.
Other information, the following has been reported publicly by operators:
− The CEO of one major international operator has confirmed that the amount of data traffic is set to grow by a factor of 10 in the next 2 years30.
30 Orange CEO, Stephane Richard, reported in NamNews 10/12/2010, speaking at Le Web conference in Paris, “he said mobile internet traffic will increase ten-fold in the next two years due to the increased sales of smartphones using Google's operating system Android”.

Rep. ITU-R M.2243 31
− TeliaSonera – Stated31 “Today, seven out of ten customers in Sweden are buying a smartphone with higher usage and average revenue per user as a result,” said Lars Nyberg, TeliaSonera’s President and CEO.
− Vodafone (Vittorio Colao) – “We expect smartphone sales in Europe to grow from 32 % today to more than 70%” by 2013.
− Deutsche Telekom pointed to strong progress in its mobile segment, where service revenue rose 5 % and mobile data revenue was up nearly 27%. Smartphones accounted for 53% of all handsets sold.
− France Telecom results Oct ’10 – Revenue from mobile services in France rose by 2.1% to EUR 2.74 billion. This growth was attributed to the success of new offers on data services and the continued development of smart phones.” Data services represented 31.7% of network revenues in the third quarter of 2010, an increase of 5 points compared with the third quarter of 2009.
− KPN Belgium – The operator says that 60% of its new customers now buy smart phones.
Middle East and African Regions (MENA and SSA)32
The following Figure A2.7 depicts the mobile traffic in African continent both for MENA (Middle East and North Africa) and for SSA (Sub-Saharan Africa) that includes whole Africa except 5 North African countries, namely, Algeria, Egypt, Libya, Morocco and Tunisia.
FIGURE A2.7
Actual mobile traffic in ME and Africa
31 All references from Mobile Business Briefing quoting from public company statements released in Q3 2010.
32 Information provided by GSMA.

32 Rep. ITU-R M.2243
Subscriptions, according to wireless intelligence, the total number of mobile connections in Africa totalled 593.1 million in Q2 2011, increase of over 20% year-on-year. In Middle East the total number of subscriptions reached 314.3 million in Q2 2011 compared to 281.3 million a year before that.
Growth, above figure clearly indicates that traffic growth in MENA from 2008-2010 was 143%.
Penetration, in Q2 2011 the penetration of IMT services in the Middle East and Africa was 20% and 10% respectively. North Africa remains the largest and most technologically advanced sub-region in Africa, representing 28.5% of all IMT subscriptions in the continent. Elsewhere, South Africa, with its 11 million WCDMA/HSPA subscriptions, shares 18.5% of IMT market in Africa.
Other information, at the time of WRC-07, there were only some 4.3 million IMT systems connections in Africa. Today there are some 65 million UMTS/HSPA/CDMA2000 connections. The total number is expected to grow to around 80 million users by the year 2012. However, the key challenge for mobile operators in Africa remains network coverage – for both 2G and 3G.
A2.4 Regional specific information, Region 2
Brazil
Growth, 3G services were extensively implemented since 2008, when the 1.9-2.1 GHz operators started its deployments. Since then, the number of subscriptions increased rapidly, as shown in the Figure A2.8.
FIGURE A2.8
The number of 3G subscriptions in Brazil
Penetration, in Aug. 2011, the IMT-2000 systems penetration ratio was 16 %, and the total cellular penetration rate was 114%.
Coverage, in Aug. 2011, 99.87% of the Brazilian municipalities had cellular coverage and about 23% of these municipalities had 3G coverage.

Rep. ITU-R M.2243 33
Other information, in the initial deployment of IMT-2000 systems in Brazil, the systems was operated in the 850 MHz band. Nowadays, with the availability of other bands, like the 1.9-2.1 GHz band, 3G services are offered in multiple bands.
North America
Growth, The use of wireless broadband is growing rapidly, primarily in the area of mobile connectivity, but also in fixed broadband applications. Key drivers of this growth include the maturation of third-generation (3G) wireless network services, the development of smartphones and other mobile computing devices, the emergence of broad new classes of connected devices and the rollout of fourth-generation (4G) wireless technologies. 3G network services are in full bloom.
Data traffic on a the US operator AT&T’s mobile network, driven mainly by iPhone usage, is up 5,000% over the past three years33, a compound annual growth rate of 268%. Another major US mobile operator, Verizon Wireless has also recently experienced substantial data growth in its network34. According to Cisco, North American wireless networks carried approximately 49 petabytes35 per month in 201036.
Traffic, Advanced smartphones, such as the iPhone, and devices using the Android operating system consume hundreds of megabytes of data per user per month37. Laptops using data-cards
33 Kris Rinne, Sr. Vice Pres. of Architecture & Planning, AT&T, Remarks at the FCC Spectrum Workshop 11-12 (17 Sept. 2009), available at http://www.broadband.gov/docs/ws_25_spectrum.pdf. Ms. Rinne added that in addition to increased data usage, voice usage continues to rise also. Id.
34 Bill Stone, Executive Director of Network Strategy, Verizon Wireless, Remarks at the FCC Spectrum Workshop 14-15 (17 Sept. 2009), available at http://www.broadband.gov/docs/ws_25_spectrum.pdf. See also Verizon Wireless Comments in re NBPPN #6 (Comment Sought on Spectrum for Broadband—NBP Public Notice #6, GN Docket Nos. 09-51, 09-47, 09-137, 24 FCCRcd 12032 (WTB 2009) (NBPPN #6)), filed 23 Oct. 2009, at 3.
35 Traffic units used in the report are as follows:
1 Gigabyte = 1,000 Megabytes 1 Terabyte = 1,000 Gigabytes 1 Petabyte = 1,000 Terabytes = 1,000,000 Gigabytes 1 Exabyte = 1,000 Petabytes = 1,000,000 Terabyte
36 Cisco Systems, Cisco Visual Networking Index Global Mobile Data Forecast Update 2010-2015 (2011) (Cisco, Global Mobile Data Forecast 2009–2014), available at http://www.cisco.com/en/US/solutions/collateral/ns341/ns525/ns537/ns705/ns827/white_paper_c11-520862.pdf.
37 For example, T-Mobile states that its G1 customers consume 300+ MB per month. Neville Ray, Sr. Vice Pres., Engineering Operations, T-Mobile USA, Presentation at the FCC Wireless Broadband Workshop (12 Aug. 2009), available at http://www.broadband.gov/docs/ws_deployment_wireless/ws_deployment_wireless_Ray.pdf. See also T-Mobile Comments in re NBPPN #6, filed 23 Oct. 2009, at 4–6. According to research conducted by Validas for Consumer Reports, iPhone users consume almost twice the data most other smart phones do, on average 273 MB per month. See Jeff Blyskal, Exclusive: iPhones Hog Much More Data Than Other Smart phones, Consumer Reports Electronics Blog, 10 Feb. 2010, http://blogs.consumerreports.org/electronics/2010/02/iphone-data-usage-smart-phonessmartphones-blackberry-mb-network-att-carrieristress.html.

34 Rep. ITU-R M.2243
consume more than a gigabyte per user per month38. To put these numbers in perspective, Cisco estimates that smartphones such as the iPhone can generate 30 times more data traffic than a basic feature phone. Also, according to the Cisco Report, “In 2010, 3 million tablets were connected to the mobile network, and each tablet generated 5 times more traffic than the average smartphone. In 2010, mobile data traffic per tablet was 405 MB per month, compared to 79 MB per month per smartphone. There were 94 million laptops on the mobile network in 2010, and each laptop generated 22 times more traffic than the average smartphone”.
Penetration, a recent survey of 7,000 U.S. adults found that smartphone penetration is now at 33% of mobile subscriptions across the four largest wireless operators. Penetration rose steadily over the past several quarters39. These new devices drive higher data usage per subscriber, as users engage with data-intensive social networking applications and user-generated video content.
Coverage, the US operator Verizon reported coverage in 2011 of 110 million people and Sprint covered 40 million in 2010.
TABLE A2.5
Selected announced upgrade to the U.S. mobile broadband networks on persons covered
Other information, an increase in mobile broadband use raises demand for other wireless services, such as point-to-point microwave backhaul and unlicensed networks, to enhance the overall delivery of broadband. Wireless backhaul transports large quantities of data to and from cell sites, especially in rural areas. Unlicensed services such as Wi-Fi and Bluetooth are important complements to licensed mobile networks and to fixed wired-line networks. Most smartphones available today feature Wi-Fi, and users increasingly take advantage of this capability inside homes or businesses where high-speed broadband connectivity is available. According to a November 2008 report from AdMob, 42 % of all iPhone traffic was transported over Wi-Fi networks rather
38 For example, Bill Stone stated that laptops consume “north of 1 GB per month.” Bill Stone, Executive Director of Network Strategy, Verizon Wireless, Remarks at the FCC Spectrum Workshop 72 (17 Sept. 2009), available at http://www.broadband.gov/docs/ws_25_spectrum.pdf. According to research conducted by Validas for Consumer Reports, the average “aircard” user consumes 1.4 GB per month. See Jeff Blyskal, Exclusive: iPhones Hog Much More Data Than Other Smartphones, Consumer Reports Electronics Blog, 10 Feb. 2010, http://blogs.consumerreports.org/electronics/2010/02/iphone-data-usage-smart-phonessmartphones-blackberry-mb-network-att-carrieristress.html.
39 Meeker et al., The Mobile Internet Report.

Rep. ITU-R M.2243 35
than carriers’ own networks40. Other carriers report similar trends in how their customers use Wi-Fi to complement cellular service.
A2.5 Regional specific information, Region 3
China41
Subscriptions, 2000-2010 was a fast growth period of mobile subscriptions as seen in Figure A2.9. The CAGR42 of mobile subscriptions was about 17 %. The amount of subscriptions reached 859 million at the end of 2010, compared with 85.26 million at the end of 2000.
FIGURE A2.9
The increasing of mobile subscriptions in China
Considering the steadily increase of China’s mobile subscriptions during these years, it’s easy to know that mobile communication market is still in a rapid growth period.
2009 is a good start point for 3G in China. The process of TD-SCDMA industrialization and commercialization was noticeably accelerated with an investment plan being carried out steadily. The development process of the 3G network was accelerated. The 3G subscriptions also increase rapidly in China. The 3G subscriptions had reached 47.05 million by the end of 2010.
The subscriptions of China Mobile had reached 584.017 million and the subscriptions of TD-SCDMA had reached 20.7 million by the end of 2010.
40 See AdMob, AdMob Mobile Metrics Report 2 (2008), available at http://www.admob.com/marketing/pdf/mobile_metrics_nov_08.pdf.
41 More information of China, Japan and Korea can be found in the White Paper “Forecast of mobile broadband development in the Asia-Pacific Region” by CJK IMT WG, September 2011.
42 Compound Annual Growth Rate (CAGR) is a rounded annualized increase comparing the rates of two instances with the aim to reduce deflecting effects.

36 Rep. ITU-R M.2243
China Unicom started WCDMA commercial trial on 17th May 2009, and finally launched the network on 1st October 2009. At the end of 2010, the total number of WCDMA subscriptions was 14.06 million, with a quarterly average period-on-period growth of 51.3%.
By the end of 2010, China Telecom has 90.52 million mobile subscriptions, in which EV-DO subscriptions had been 12.29 million. In December 2010, monthly traffic volume increased by 72% compared with June of 2010.
Penetration, in last decade, mobile communication experienced the most active period in China. Penetration of mobile subscription grew from 6 % of 2000 to 64 % of 2010 as depicted in Figure A2.10.
FIGURE A2.10
Penetration rate of Chinese mobile subscriptions
The 3G subscriptions also increase rapidly in China. The 3G subscriptions had reached 47.05 million by the end of 2010. However the market share of 3G network is still very small. Huge potential of further development can be clearly expected in next decade.
Traffic and services, according to statistics of CNNIC43, Internet users in China had reached 457 million and 303 million for mobile Internet users by the end of 2010. The growth rate maintained 100 % during the last 2 years.
The market share of smart phone grows dramatically, which bring fast development of mobile application downloading service. All 3 Chinese mobile operators have their own APP-store. Services like mobile searching, mobile reading and mobile video and also micro blog are quickly popularized. According to statistics of CATR44, mobile reading users have reached 200 million, over 10 million for mobile video users and 100 million for users of micro blog by 2010.
43 China Internet Network Information Center (CNNIC). http://www.cnnic.net.cn/en/index/.
44 China Academy of Telecommunication Research (CATR) of the Ministry of Information Industry (MII) is a nation research organization in telecom field. http://www.catr.cn.

Rep. ITU-R M.2243 37
Mobile game and music services maintain stable increasing. The specifications of mobile payment are under study and operators push the work forward actively on service trail and commercialization.
Infrastructure and coverage, the development of 3G networks continues keeping a rapid growth. 3G Base Stations had reached 714,000 by May 2011 (see Figure A2.11). The construction scale has been over half of the 2G networks. The fastest and largest scale record has been made for the construction of mobile networks in the world telecommunication history.
3G networks respectively established by China Mobile, China Telecom and China Unicom have covered most municipalities, cities, counties and towns in China.
FIGURE A2.11
The number of base stations in China
Other information, it is estimated that the development of 3G brought 589 billion Yuan RMB of the domestic investment indirectly, 36.4 billion (29.7 billion for subscriptions and 6.7 billion for service) of the domestic consumptive demand directly, 14.1 billion of the domestic consumptive indirectly, 34.3 billion of GDP increasing directly and 141.3 billion of GDP increasing indirectly.
India
Subscriptions and penetration, the Telecom Wireless Subscription Base and Wireless Data Subscription base as given below:
As of 31st July 2011
− Total telecom wireless subscription base: 858.36 Million.
− Urban telecom wireless subscription base: 565.71 Million (share of urban subscriptions is 65.91%).
− Rural telecom wireless subscription base: 292.65 Million (share of rural subscriptions is 34.09%).
As of 31st March 2011
− 381.40 million subscribed to wireless data services.
Boosting rural mobile connections and bridging the rural-urban gap is extremely important to ensure that the people in rural and remote areas of the country, whose per capita income levels and access to other infrastructure/services are relatively low, do not miss out on tremendous opportunity

38 Rep. ITU-R M.2243
provided by mobile services to fulfil their communication and information needs. Government of India has mandated various roll-out obligations to the operators to ensure 3G and BWA services are also made available in rural and remote areas.
Other information, deployment status of 3G and Broadband Wireless Access Spectrum (BWA). India has chosen the band 2.1 GHz (1 920-1 980 MHz / 2 110-2 170 MHz) for 3G and 2.3-2.4 GHz / 2.5-2.69 GHz bands for BWA services. For 3G services, spectrum has been auctioned in the blocks of 2 x 5 MHz in the 2.1 GHz band. The number of blocks auctioned varied from 3 to 4 subject to availability in different telecom service areas. For the purpose of Telecom services, entire India is divided into 22 telecom service areas. In addition, one block is also allotted to MTNL / BSNL (Public Sector Enterprise) in all the 22 telecom service areas.
For BWA services, spectrum has been auctioned in the blocks of 20 MHz unpaired spectrum in the 2.3-2.4 GHz band. Two blocks of spectrum auctioned in all 22 telecom service areas. In addition, one block in 2.5-2.69 GHz band is also allotted to MTNL / BSNL in all the 22 telecom service areas. These 22 Telecom Service Areas are Delhi (1), Mumbai (2), Maharashtra (3), Gujarat (4), Andhra Pradesh (5), Karnataka (6), Tamil Nadu (7), Kolkata (8), Kerala (9), Punjab (10), Haryana (11), Uttar Pradesh East (12), Uttar Pradesh West (13), Rajasthan (14), Madhya Pradesh (15), West Bengal (16), Himachal Pradesh (17), Bihar (18), Orissa (19), Assam (20), North East (21), and Jammu & Kashmir (22). The following successful bidders have been allotted 3G and BWA spectrum:
TABLE A2.6
Successful bidders of mobile broadband including 3G and BWA in India in relation to frequency bands and Service Areas
Successful bidders of mobile broadband services in India
Number of
licenses
2.1 GHz
3G
Number of
licenses
2.3 GHz
BWA
Number of
licenses
2.6 GHz
BWA
Service Areas
(Circles)
Vodafone Essar Limited 8 1, 2, 3, 4, 7, 8, 11, 12
BhartiAirtel Limited 13 4 in service areas *
1, 2, 3*, 5, 6*, 7, 8*, 10*, 13, 14, 16, 17, 18, 20, 21, 22
Reliance Telecom Limited 13 1, 2, 8, 10, 14, 15, 16, 17, 18, 19, 20, 21, 22
MTNL/BSNL 22 22 22 All
Tata Teleservices Limited 9 3, 4, 6, 9, 10, 11,13, 14, 15
Idea Cellular Limited 10 3, 4, 5, 9, 11, 12, 13, 15, 17, 22
Aircel Limited 13 8 in service areas *
5*, 6, 7*, 8, 9, 10, 12, 16*, 18*, 19*, 20*, 21*, 22*,
S Tel Private Limited 3 17, 18, 19
Infotel Broadband Services Pvt. Ltd.
22 All
Tikona Digital Networks Private Ltd.
5 4, 12, 13, 14, 17
Augere (Mauritius) Ltd. 1 15

Rep. ITU-R M.2243 39
NOTE – * Indicates the reference between 2.3 GHz BWA licenses and service areas.
The maximum spectrum allotted to any 3G operator is 2 x 5 MHz only in the band 2.1 GHz. There is further requirement of spectrum for 3G services. Therefore, whenever additional spectrum is available in the 2.1 GHz band, it will be utilised for 3G services. The bands 800 MHz, 900 MHz and 1 800 MHz are presently being used for 2G services. In future, when spectrum in 800 MHz and 900 MHz bands is available for broadband services, it may be refarmed and allocated for the IMT services. Spectrum in 700 MHz (698-806 MHz) and 3.4-3.6 GHz bands are being refarmed for deployment of IMT technologies including BWA in India.
JapanError! Bookmark not defined.
Subscriptions, the total number of subscriptions for cellular mobile communication systems were around 118.2 million at the end of February 2011. Among these subscriptions, the number of subscriptions in IMT-2000 systems was around 116.7 million, and the number of subscriptions using Internet services provide by the mobile operators was around 96.4 million.
Penetration, the IMT-2000 systems penetration ratio was 98.7%, and the penetration of subscriptions using Internet services provide by the mobile operators ratio was 81.5%.
Coverage, in the fiscal year of 2010, the ratio of the population coverage of cellular mobile communications in Japan reached to 99.9%.
Traffic, the Ministry of Internal Affairs and Communication gathered the data traffic of the mobile communication with the cooperation of five mobile communication operators in June and September, 2010 and analyzed the data traffic volume (i.e., not including voice traffic) and trend of the mobile communication. Table A2.7 shows the data traffic of mobile communication in September, 2010 and the increase ratio of data traffic, comparing September’s with June’s, 2010.
TABLE A2.7
Data Traffic volume of mobile communication in September, 2010 and the increase ratio of data traffic, comparing September with June, 2010
Traffic Uplink (to Network)
Downlink (from Network)
Uplink + Downlink
Average and total traffic volume in September, 2010
Average traffic 6.6 Gbps 64.6 Gbps 71.2 Gbps
Total traffic volume 2,152 Tb 20,926 Tb 23,078 Tb
Increase ratio, comparing September with June, 2010
Ratio of increase of data traffic
+18.6% +12.7% +13.2%
According to Table A2.7, it was found that the actual total data traffic volume increased +13.2% comparing September’s with June’s, 2010, that is equivalent to the increase ratio of +64% per year. The drivers pushing such strong growth are the progressively increased proliferation of smartphone and new type of devices, huge increase of mobile application.
Figure A2.12 shows traffic change of mobile data communication every hour of the day of the week in September, 2010.
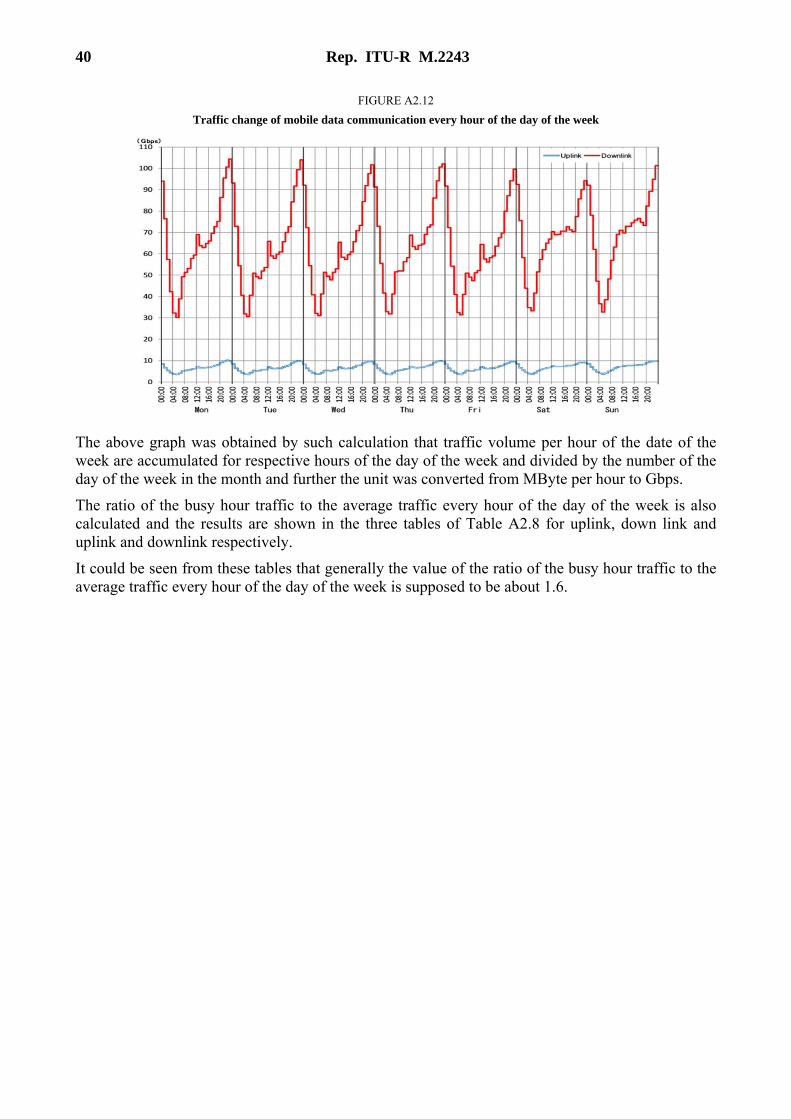
40 Rep. ITU-R M.2243
FIGURE A2.12
Traffic change of mobile data communication every hour of the day of the week
The above graph was obtained by such calculation that traffic volume per hour of the date of the week are accumulated for respective hours of the day of the week and divided by the number of the day of the week in the month and further the unit was converted from MByte per hour to Gbps.
The ratio of the busy hour traffic to the average traffic every hour of the day of the week is also calculated and the results are shown in the three tables of Table A2.8 for uplink, down link and uplink and downlink respectively.
It could be seen from these tables that generally the value of the ratio of the busy hour traffic to the average traffic every hour of the day of the week is supposed to be about 1.6.

Rep. ITU-R M.2243 41
TABLE A2.8
Traffic averaged for an hour of “(Hour):00” to (Hour+1):00”
Other information, in the initial deployment of IMT-2000 systems in Japan, the systems were operated in the 850 MHz band and 2.1 GHz band. In accordance with the increase of the number of subscriptions, the operating band for IMT-2000 systems was expanded to the 1.7 GHz band and 1.5 GHz band.
Korea (Republic of)Error! Bookmark not defined.
Subscriptions, The total number of mobile subscriptions for the past 5 years and the number of smart phone uses are shown in the following tables below.
Uplink
Mon Tue Wed Thu Fri Sat Sun
BHT(Gbps) 10.02 9.90 9.67 9.94 9.40 9.18 9.68
Avr (Gbps) 6.67 6.50 6.48 6.63 6.39 6.79 7.06
BHT/Avr 1.50 1.52 1.49 1.50 1.47 1.35 1.37
Downlink
Mon Tue Wed Thu Fri Sat Sun
BHT(Gbps) 104.41 103.90 101.63 102.12 99.64 94.20 101.22
Avr (Gbps) 65.54 62.86 62.64 64.89 61.30 66.39 68.89
BHT/Avr 1.59 1.65 1.62 1.57 1.63 1.42 1.47
Uplink + Downlink
Mon Tue Wed Thu Fri Sat Sun
BHT(Gbps) 114.27 113.68 111.18 111.76 109.04 103.33 110.86
Avr (Gbps) 72.21 69.36 69.13 71.53 67.69 73.18 75.95
BHT/Avr 1.58 1.64 1.61 1.56 1.61 1.41 1.46

42 Rep. ITU-R M.2243
TABLE A2.9
The increase of subscriptions and smart phone subscriptions
Year 2006 2007 2008 2009 2010 Current (2011.05)
Mobile Subscriptions
40,197,115 43,497,541 45,606,984 47,944,222 50,767,241 51,754,056
2009.12 2010.3 2010.6 2010.9 2010.12 2011.3 2011.7
Number of smart phone users
800,000 1,520,000 2,470,000 4,420,000 8,260,000 10,000,000 15,690,000
Traffic, the mobile traffic data usage (TB/month) for the past 16 month is as below:
TABLE A2.10
Data usage
2009.10 2009.12 2010.1 2010.3 2010.5 2010.7 2010.9 2010.11 2011.2
Data usage 315 400 455 514 677 916 1,569 3,182 6,112
Current mobile data usages are as below:
• Multimedia (video, audio, etc.) 66%
• Web/Data 17%
• Messaging/P2P 8%
• Mobile Games 5%
• VoIP 4%
Growth, traffic volume of mobile data communication is expected to grow at the average rate of 72% per annum.
Lao People's Democratic Republic
Subscriptions and growth, the number of the mobile phone subscriptions for the past ten years in Laos is indicated in the following table. The trend of subscriptions of mobile phone increases continuously during past ten years. According to various comfortable usages of mobile phone, the subscribers move to pay a lot of money for mobile services instead of others communication services.

Rep. ITU-R M.2243 43
TABLE A2.11
The increase of mobile subscriptions
The end of the year 2000 2001 2002 2003 2004 2005 2006 2007 2008 2009
The number of subscriptions of mobile phone
5 031 18 000 55 200 89 000 337 875 657 528 1 009 565 1 478 409 1 890 070 2 495 186
Macao, China
Subscriptions and growth, the following table shows the statistics of the number of 2G and 3G mobile subscriptions in Macao during the past five years. As of July of 2011, there were approximately 217 000 and 1.065 million local 2G and 3G subscriptions respectively (incl. both pre-paid and post-paid subscriptions) adding up to a total of 1.282 million subscriptions. A continuous growth has been observed on the number of 3G subscriptions since the 3G service was first launched in 2007, due to the increasing needs for mobile broadband services in recent years, while the 2G market share remains declining on the contrary.
TABLE A2.12
Growth of 2G and 3G subscriptions
2G 3G Total
Month/Year Subscriptions (in thousands)
% Subscriptions(in thousands)
% Subscriptions (in thousands)
%
12/2006 637 N/A 637
12/2007 748 17.43% 46 N/A 794 24.65%
12/2008 703 –6.02% 230 400.00% 933 17.51%
12/2009 428 –39.12% 609 164.78% 1037 11.15%
12/2010 293 –31.54% 830 36.29% 1123 8.29%
07/2011 217 –25.94% 1065 28.31% 1282 14.16%
Growth of 2G and 3G mobile subscriptions (pre- and post-paid)
Singapore (Republic of)
Subscriptions and growth, total mobile subscription for 2G and 3G (Year 2006 to 2010) is as follows:
TABLE A2.13
The total number of mobile subscriptions
Year 2006 Year 2007 Year 2008 Year 2009 Year 2010
4,090,633 4,391,733 5,073,833 5,606,117 6,576,875

44 Rep. ITU-R M.2243
Viet Nam (Socialist Republic of)
Subscriptions and penetration, the number of subscriptions and its penetration rate are shown in the table below. The number of 3G’s active subscriptions is 7,029,368 as April, 2010.
TABLE A2.14
The increase of mobile subscriptions and penetration
2006 2007 2008 2009 2010 Subscriptions 18,9 45,0 74,9 98,2 157,8
Penetration (%) 22,4 52,9 86,9 113,4 174,3

Rep. ITU-R M.2243 45
Annex 3
Detailed information on usage and application trends of mobile broadband
A3.1 Introduction
Recent trends indicate strong growth of mobile data usage:
− The amount of smart phones is strongly increasing and 42% of consumers are estimated to own a smartphone, up from 16% three years ago45.
− In some European countries, mobile broadband subscribers on average consume 1.8 Gb per month46 (72 times the amount of data used by a regular mobile phone47).
− PC modem card users consume 1.4 Gb per month48 (56 times the amount of data used by a regular mobile phone).
− One operator in USA has seen mobile network traffic increase 5,000% over past 3 years49.
This exponential growth is expected to continue and so questions are raised about the capacity of current mobile networks to keep up. Even with substantial investments it is likely that mobile data demand will exhaust the available resources within the next five years. In addition to economic benefits, mobile broadband will facilitate social benefits. In order to respond to this growth more IMT spectrum (like 800 MHz and 2.6 GHz) will be assigned in the coming few years.
Until recently, the growth in demand for data applications and services delivered over mobile networks was modest and could be accommodated easily by existing IMT-2000 networks. However, since 2007 a number of factors have lead to an explosion in demand for mobile broadband services:
− a proliferation of new devices (like smartphones) and applications resulting from more competition among both vendors and service providers;
− expanding capability of mobile networks delivering high-bit rate user experience demanded by consumers;
45 Para. 159 of the FCC’s 14th Mobile Wireless Competition Report, 20 May 2010. Data period cited is between October 2006 and December 2009.
46 Results from CEPT Questionnaire, August 2010, see table 2 below.
47 Para. 182, Validas LLC data, in the 14th Mobile Wireless Competition Report of the Federal Communications Commission, at released 20 May 2010. Traditional handsets are estimated to consume approximately 25 MB per month.
48 Para. 182, Validas LLC data, in the 14th Mobile Wireless Competition Report of the Federal Communications Commission, at released 20 May 2010. Traditional handsets are estimated to consume approximately 25 MB per month.
49 AT&T, Remarks at the FCC Spectrum Workshop 11–12 (17 Sept. 2009), available at http://www.broadband.gov/docs/ws_25_spectrum.pdf. AT&T stated that also voice usage continues to increase.

46 Rep. ITU-R M.2243
− more affordable subscription prices (like flat rates);
− adoption of globally recognized, market driven standards.
At global level, the mobile coverage is more than 90% of population50 while global Internet penetration is 28.7%51. So there is really a very huge potential for mobile broadband to become a major access enabler for Internet.
A3.2 New type of devices, such as smartphones, dongles, tablets
One key reason for the dramatic increase of mobile traffic is new services enabled by new devices and business models.
The use of harmonised spectrum and global standards for mobile broadband at 2.1 GHz created a market with sufficient scale to bring device prices down rapidly. Recently, sales of smartphones and dongles have taken off and computing is increasingly becoming a mobile activity.
Smartphones
Global combined sales of laptops and smartphones overtook desktop PCs already in 2006, and forecasts (by Morgan Stanley) estimate that global sales of smartphones alone will overtake combined desktop PC and laptop sales by 2012. Even when this point is reached, there is still significant room for growth, based on several forecasts for mobile broadband growth.
In 2010, smartphones represent 13% of total global handsets in use, but they represent over 78% of total global handset traffic and an average smartphone generated 24 times more mobile data traffic (79 Mb per month) than the basic-feature mobile phone.
Terminals with high usage profiles are growing explosively. The number of smart phones has reached 526 millions in 2010. The annual increase is 32% related to 2009. Mobile-connected tablets and laptops also present the fast growth the tendency. In the next decade, smart phones and mobile connected equipments will be more and more popular.
50 https://communicationsdirectnews.com/do.php/100/41984?7649: “UN Report Finds Global Mobile Coverage at More Than 90%” (20 October 2010).
51 http://www.internetworldstats.com/stats.htm.

Rep. ITU-R M.2243 47
FIGURE A3.1
High-end devices can multiply traffic
The increased number of smartphones and other mobile devices in the market will significantly impact the development of the mobile broadband.
FIGURE A3.2
Share of smartphones in mobile shipments, 2007-200952
52 UMTS Forum/IDATE Report on Mobile Traffic forecasts 2010-2020 Report, January 2011.
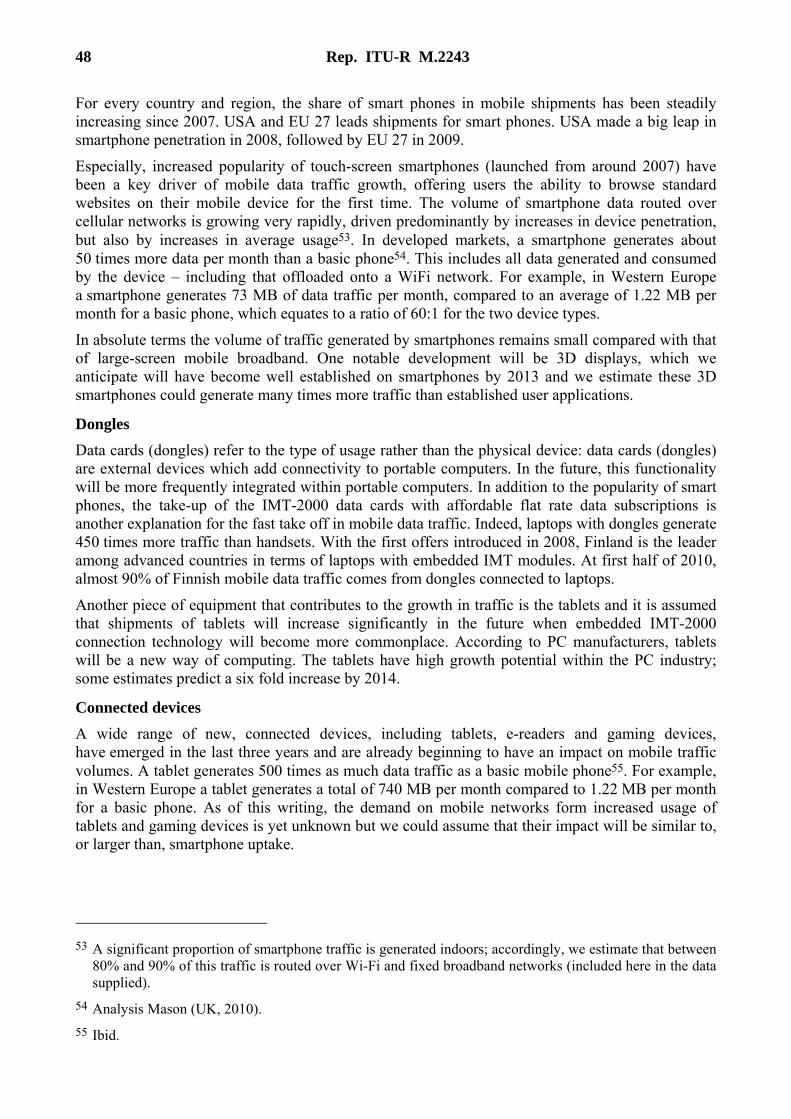
48 Rep. ITU-R M.2243
For every country and region, the share of smart phones in mobile shipments has been steadily increasing since 2007. USA and EU 27 leads shipments for smart phones. USA made a big leap in smartphone penetration in 2008, followed by EU 27 in 2009.
Especially, increased popularity of touch-screen smartphones (launched from around 2007) have been a key driver of mobile data traffic growth, offering users the ability to browse standard websites on their mobile device for the first time. The volume of smartphone data routed over cellular networks is growing very rapidly, driven predominantly by increases in device penetration, but also by increases in average usage53. In developed markets, a smartphone generates about 50 times more data per month than a basic phone54. This includes all data generated and consumed by the device – including that offloaded onto a WiFi network. For example, in Western Europe a smartphone generates 73 MB of data traffic per month, compared to an average of 1.22 MB per month for a basic phone, which equates to a ratio of 60:1 for the two device types.
In absolute terms the volume of traffic generated by smartphones remains small compared with that of large-screen mobile broadband. One notable development will be 3D displays, which we anticipate will have become well established on smartphones by 2013 and we estimate these 3D smartphones could generate many times more traffic than established user applications.
Dongles
Data cards (dongles) refer to the type of usage rather than the physical device: data cards (dongles) are external devices which add connectivity to portable computers. In the future, this functionality will be more frequently integrated within portable computers. In addition to the popularity of smart phones, the take-up of the IMT-2000 data cards with affordable flat rate data subscriptions is another explanation for the fast take off in mobile data traffic. Indeed, laptops with dongles generate 450 times more traffic than handsets. With the first offers introduced in 2008, Finland is the leader among advanced countries in terms of laptops with embedded IMT modules. At first half of 2010, almost 90% of Finnish mobile data traffic comes from dongles connected to laptops.
Another piece of equipment that contributes to the growth in traffic is the tablets and it is assumed that shipments of tablets will increase significantly in the future when embedded IMT-2000 connection technology will become more commonplace. According to PC manufacturers, tablets will be a new way of computing. The tablets have high growth potential within the PC industry; some estimates predict a six fold increase by 2014.
Connected devices
A wide range of new, connected devices, including tablets, e-readers and gaming devices, have emerged in the last three years and are already beginning to have an impact on mobile traffic volumes. A tablet generates 500 times as much data traffic as a basic mobile phone55. For example, in Western Europe a tablet generates a total of 740 MB per month compared to 1.22 MB per month for a basic phone. As of this writing, the demand on mobile networks form increased usage of tablets and gaming devices is yet unknown but we could assume that their impact will be similar to, or larger than, smartphone uptake.
53 A significant proportion of smartphone traffic is generated indoors; accordingly, we estimate that between 80% and 90% of this traffic is routed over Wi-Fi and fixed broadband networks (included here in the data supplied).
54 Analysis Mason (UK, 2010).
55 Ibid.

Rep. ITU-R M.2243 49
Other device developments
Table A3.1 provides an overview of other technology developments that are set to increase user demand for mobile data:
TABLE A3.1
Technology developments that are set to increase user demand for mobile data56
Development Remarks
Virtualisation Could enable users to partition one mobile phone into two separate devices – for example, to create a virtual business phone on a personal smartphone (or vice versa). This could reduce the cost of smartphone ownership by negating the need to purchase secondary devices, and thus drive take-up.
Multitasking The ability to run multiple applications concurrently, including the possibility of using multiple frequency bands simultaneously.
Introduction of GPUs
The introduction of graphical processing units (GPUs) by chipset vendors will enhance the performance of video applications and thus promote mobile video consumption. The overall user experience of such applications will still be limited by network capacity.
Introduction of MPUs
The introduction of multiprocessor units (MPUs) will replace standalone GPUs and, along with virtualisation, will reduce handset costs.
Mobile Cloud The demand for mobile cloud services is expected to grow since the users are increasingly adopting more services that require to be accessible. These services require synchronisation of data across multiple devices with a centralised storage access in the cloud.
A3.3 Mobile Internet usage is increasing
Basically people expect and would like to use any Internet application their mobile devices in a same manner as they do in fixed connection. Additionally, mobile devices enable new applications (e.g. location based services).
Mobile Internet took off in 2007 and by 2009, there were 95 million mobile Internet users in Europe and 55 million mobile Internet users in USA. The recent take-up of smartphones, which are tailor-made for mobile Internet experience, is also a key driving force in the significant development of the mobile Internet market. Most mobile Internet services are extensions of the PC-based Web and focus on entertainment.
At February 2011, more than 90% of the world’s population is covered by a mobile cellular signal and can be served by mobile networks, which compared with the global Internet penetration of 30%, represents a huge potential for mobile broadband to become a major access enabler to Internet. Actually, for the majority of people in developing countries, the first access to the Internet is performed via IMT network. This continuous and seamless mobile connection is enabled by small and capable mobile terminals or PCs with radio modems. This type of Internet access via mobile terminals is spreading very fast.
Many mobile Internet users are mobile-only,57 for example in Egypt the mobile-only penetration is 70%, in India is 59% and even in the US it is 25% of subscribers58.
56 Analysis Mason, 2011.

50 Rep. ITU-R M.2243
The range of applications used by mobile Internet users is widening and differs from one country to the next.
According to Nielsen, email became the N°1 application in 2010 followed by social networking. Last year, portal applications were the most popular in the USA accounting for 45.2 million visitors followed by email with 33 million users (as of February 2009).
TABLE A3.2
Internet mobile top applications in the USA
57 I.e. they do not or very rarely use a desktop, laptop or tablet to access the Web.
58 http://mobithinking.com/mobile-marketing-tools/latest-mobile-stats.

Rep. ITU-R M.2243 51
TABLE A3.3
Fastest growing content categories (USA)
So mobile Internet is advancing rapidly. Table A3.4 and Table A3.5 show the statistic and forecast result of traffic volume on application category by Cisco VNI in 2009 and 2010. Because of high traffic requirement, mobile video service will account for a large piece of mobile internet service, especially in the age of 3D video.
TABLE A3.4
Statistics and forecasts on application category and traffic volume in 2009
52 Rep. ITU-R M.2243
TABLE A3.5
Statistics and forecasts on application category and traffic volume in 2010
A3.4 Huge increase of mobile software applications offerings (Apps)
Over 300,000 mobile Apps have been developed in the last three years (2008-2010). The most used mobile Apps are games, news, maps, social networking and music. The use of those mobile Apps has and will increase mobile broadband traffic dramatically.
Application stores for all mobile platforms have created a large new market, with estimated at 10.97 billion downloads by February 2011 and it is estimated that global downloads will reach 76.9 billion in 201459.The use of those mobile Apps have and will increase mobile broadband traffic dramatically. In addition, analysts predict that demand for data-heavy mobile video content60 will grow significantly over the coming years, such that it will account for 66% of mobile data traffic by 201461. Also, social networking via mobile has taken up. For example, in Facebook there are 840 billion pages views monthly62. Some 100 Million users access Facebook only over their mobile phones, accounting for significant portion of mobile web traffic, e.g. 50% of mobile web traffic in UK is for Facebook use63.
A3.5 Video traffic is growing dramatically
Mobile video generally refers to real time entertainment consumption of video streaming, generic Flash video and other various webcasts. By year 2010, YouTube and Flash have generated the majority of mobile video traffic. However video sharing has also emerged as a new way to consume audiovisual content, and has particularly been adopted by fixed Internet users. For many viewers, consuming a video no longer just means watching it, but also sharing it with their community, commenting on it, blogging about it, tagging it, etc. This is why the online video market is largely dominated by community-based sites.
Moreover, uploading videos on its social networking profile is becoming also a way to share video. Hence, community networks (like Facebook) are also video viewing sites.
59 http://mobithinking.com/mobile-marketing-tools/latest-mobile-stats.
60 Mobile video consist of streaming video, flash and Internet TV (including also all kinds of TV content like series, news, sports).
61 Cisco, Visual Networking Index: Global Mobile Data Traffic Forecast Update 2009-2014.
62 http://www.conceivablytech.com/5833/business/facebook-scores-840-billion-pageviews-youtube-at-500-million-users.
63 ITU News, No.6, July/August 2010, page 39.

Rep. ITU-R M.2243 53
For the coming years, video will be responsible for most mobile data traffic growth through streaming or downloading with a CAGR exceeding 100% between 2009 and 2014 and it is predicted that it will account for 66% of mobile data traffic by 2014.
Various forms of video
Mobile video generally refers to real time entertainment consumption of video streaming, generic Flash video and other various webcasts. Today, YouTube and Flash generate the bulk of video watching on mobile devices.
However video sharing has also emerged as a new way to consume audiovisual content, and has particularly been adopted by fixed Internet users. For many viewers, consuming a video no longer just means watching it, but also sharing it with their community, commenting on it, blogging about it, tagging it, etc. This is why the online video market is largely dominated by community-based sites.
Most notable video sharing platforms based on user generated content (UGC) are YouTube, Dailymotion and Myspace. According to Sandvine, these services are becoming mainstream for mobile users.
Moreover, uploading videos on its social networking profile is becoming also a way to share video. Hence, community networks (with obviously Facebook at the head) are now video viewing sites in their own right.
Catch-up TV is also a way to watch video. It is a professional content made available for a limited period just after the broadcast diffusion. The content is generally focused on TV series and TV specific programs. However, few services are for the time being available on mobile devices.
Mobile TV
Generally speaking, TV refers to video applications as TV content and is mostly accessible through downloading or streaming. If we consider TV on mobile as strictly speaking a live TV service offered by mobile network operators this usage would appear to be rather insignificant despite the many offerings. However, for specific events like the World Cup, audiences can be exceptionally higher than for everyday usage.
Video traffic growth
When talking about video content, it covers all kind of TV content, however it is distinguished in short form videos (professional and UGC) and medium/long-form videos. On mobile devices, for the time being, a short clip is the adequate form of viewing videos. Generally found on web portals or on specialized video portals, they are generally related to sports highlights, music (TV clips), movie trailers, humour, news, video game trailers.
Video content is mainly watched on PC via dongles. Today, the relatively decline of P2P traffic in the overall Internet traffic is mainly the result of the shift from P2P file sharing to video streaming websites. Indeed, the sharp increase in real-time video consumption first experienced in the fixed market can now be observed on the mobile networks, which is heavily impacting mobile traffic volumes.
Both streaming and file sharing are the heaviest traffic usages and represent more than 50% of all traffic in 2009 in Western Europe and generating the highest growth rates (close to 100% growth for HTTP streaming).
According to YouTube, mobile viewing content grew by 160% in 2009 and that strong growth was also expected in 2010.
For the coming years, video will be responsible for most mobile data traffic growth through streaming or downloading with a CAGR exceeding 100% between 2009 and 2014.

54 Rep. ITU-R M.2243
FIGURE A3.3
Data traffic distribution in IMT-2000 networks in Western Europe
FIGURE A3.4
Top applications growth, 2H2009
A3.6 Media rich social networks go mobile
Since the middle of the last decade, social networks have seen ever-intensifying usage explosion, huge traffic growth and a greater portion of online time devoted to these sites. They represent a mass-market phenomenon, with almost 70% of Internet users worldwide visiting a social network (July 2009). Out of the 770 million people who logged onto an online community that month (up 18% compared to the previous year), almost half visited Facebook.

Rep. ITU-R M.2243 55
The role of social networks sites is evolving rapidly from their informal, chat-based roots. They are now used for a host of applications, from breaking global news, product marketing and political campaigning to the coordination of natural disaster relief.
On the mobile networks, social networking is experiencing a surging popularity akin to that seen on the fixed networks and is for the time being among the fastest growing mobile applications. According to Allot, Facebook increased its traffic consumption by 200% during the first half of 2010 while Twitter grew by 310% in the meantime. This growth can be explained by easy access to such services through smartphones but also the ability to access the services at any time: users with mobile Facebook applications installed on their smartphones are twice as active as the average Facebook user. In April 2010, it is estimated that more than 75% of smartphone users accessed social network sites. In the future it is expected that social networking applications will continue to drive mobile data consumption.
Also, the impact of social network applications on mobile network traffic is increasing. For example in UK, half of mobile web traffic is from Facebook use. On another hand, the integration of location-based functions with social networks can lead to new applications on mobile networks that will generate lots of mobile data traffic.
Social networks are transforming online user behaviour in terms of users’ initial entry point, search, browsing and purchasing behaviour. It is suggested that social media will increasingly supplant other ‘traditional’ search functions. Users will spend less time navigating the Internet independently, instead searching for information or make decisions based on word-of-mouth recommendations from friends and peers. The transformative role of social media is being accompanied by an evolution in user expectations of personal privacy, security and acceptable online behaviour.
FIGURE A3.5
Social networking growth applications, 1H2010
A3.7 Machine-to-machine traffic is growing and expanding to new applications
The next big wave to increase the mobile data demand will be machine-to-machine (M2M) applications and devices.
By end 2010, the M2M market represents 53 million modules worldwide. This market is growing very quickly within the wireless field. Overall growth for the next four years should top 33% per year for cellular modules, reaching 165 million in 2014. In 2014, M2M SIM cards will probably

56 Rep. ITU-R M.2243
represent 2.5% of total SIM cards (human and machine) and over 8.1% of total SIM cards in Europe.
FIGURE A3.6
Cellular M2M Modules/SIMs (million units)
FIGURE A3.7
World M2M market, 2009-2013 (million EUR)
The growth of the wireless M2M market has been mainly sustained by a few major vertical markets such as fleet management, industrial asset management, point of sales, and security. Healthcare is the next and most promising market.
According to specialists, M2M for security is already a mature market (in Japan, approximately 400,000 M2M modules have been rolled out nationwide in order to carry out age verification for all cigarette purchasing machines to combat under-age smoking). Fleet management is also an

Rep. ITU-R M.2243 57
advanced market in terms of M2M usage used by logistics companies and the retail industry to monitor their trucks and shipping. M2M has also a great potential in the energy domain thanks to the commitment of national governments and industries to deploy smart metering solutions: 40 million smart meters are planned to be deployed in USA by 2015, 33 million in France by 2017, 170 million in China by 2015.
Moreover, consumer electronics is gaining traction in the M2M space driven by the success of connected e-readers, connected portable navigation devices, photo frames and speed camera prevention systems. The arrival of new consumer electronics has had a great impact on M2M growth in general and in module sales growth particularly. As they address the mass market, consumer electronics will dominate in volume terms in the near future. Automotive applications, especially with expected e-call service, should be a key driver in the M2M market where we can imagine SIM cards embedded within vehicles. Driven by consumer electronics, we expect the market to grow at a very rapid pace as shown in the IDATE forecasts.
So, the next big wave to hit the data demand will be M2M applications and devices.
Defining the Pervasive Internet Opportunity
* Harbor research
M2M is expected to be one of the fastest growing segments for service providers 2010-2013. The traffic created by M2M might be short bursts of traffic but will generate from large number of devices at the same time. Also M2M will require large data in the control plane – leading to requirement of large bandwidth availability at the base station.
A3.8 More capable network – user experience improvement
The introduction of new high-bit rate mobile networks from 2007 onwards has increased service bit-rates and improved reliability. This has led to enhanced mobile broadband user experience as e.g. users can view more internet pages in less time. The difference between user experience in mobile environment and fixed (cable) environment is not that big anymore as mobile networks can offer high user bit-dates.
Present mobile communication systems have evolved by continually adding additional system capabilities and enhancements, and the user will see a significant increase in capability through the future development of IMT-2000. IMT-Advanced will be realized by functional fusion of

58 Rep. ITU-R M.2243
existing, enhanced and newly developed elements of IMT-2000, nomadic wireless access systems and other wireless systems with high commonality and seamless interworking.
One obvious condition required for the mobile broadband take off is a favorable environment, and most importantly a suitable network infrastructure. Although mobile Internet started with the emergence of EDGE devices, which made browsing the Web more comfortable, the provision of adequate connection speeds was and remains crucial for a satisfactory browsing experience.
The latest technology being deployed by operators encompass technologies with theoretical connection speed ranging between 3.6 Mbps and 100 Mbps, which is close to DSL-type wired networks. IMT coverage has increased over recent years but is heterogeneous, depending on the country. Indeed, the first areas with mobile broadband coverage were cities where the density of population is highest. Other areas are now being covered and refarming enable operators to use the 900 MHz band, which offers larger cell radius than the 2.1 GHz band.
FIGURE A3.8
Nationwide distribution of IMT-2000 subscribers
Currently, more than 30% of all mobile phones in the world are IMT-2000-ready. According to IDATE, sales should reach 623 million units in 2012 thanks to continued IMT-2000 deployments in countries such as China and India. By 2012, 48% of handsets will be IMT-2000-ready.
FIGURE A3.9
Sales forecasts for IMT-2000 terminals (million units)

Rep. ITU-R M.2243 59
With IMT-2000 networks emerging on the global scene, the volume of compatible handset sales started to take off in the third quarter of 2007. According to IDATE estimates, 37 million units were sold in 2008 which represents 3.1% of all handsets, and up from 1.2% in 2007.
A3.9 Broader user-age demographics and its impact on traffic demand
The age of users and consequently the way of using the Internet has changed over the last years, resulting in an increasing demand. There are two main streams which can be manifested:
– The age of the users is extending at both ends of the human live-cycle: more and more elderly people start using the Internet; and the younger generation is being introduced to the Internet at a very young age through school and their parents’ usage of smartphones.
– In particular the new, younger generation is using the Internet for pre-school games, online education, doing homework online, accessing other educational tools and more.
In one Report64 addressing this fact, over 95% of the age group 15-49 had an Internet subscription and slightly over 80% of those in the age group 50-64 and 50% of older age groups had an Internet subscription. The figure below (Figure A3.10) depicts the Internet subscription penetration by age group in 2010 based on Finnish market noting that “n” represents the number of observations in the market survey – in this case people in particular age group who have been asked the question in telephone interview.
It is seen that it does not show the people below the age of 15, though the importance of this group is increasing dramatically.
FIGURE A3.10
Internet subscription penetration by age groups in 2010 for Finland
64 Finnish Communications Regulatory Authority (FICORA), Communication markets in Finland, 2010 Annual Report, Spring 2011.

60 Rep. ITU-R M.2243
Furthermore, Figure A3.11 shows mobile broadband use by age group in 2010 based on the consumer survey in Finland. When viewed by age group, it is noticed that people aged 25-34 are the most active and diverse mobile broadband users, followed by those aged 35-49. The age group 15-24 was the most active user of mobile Internet communication services.
FIGURE A3.11
Mobile broadband use by age group in 2010 for Finland
A3.10 Other trends identified in addition to above key trends
A3.10.1 Mobile voice traffic will have a limited growth
Mobile voice traffic continued to grow in 2009 but at a lower pace with an annual increase of around 5% when compared to global traffic (growth rate between 100 and 150%). While mobile call minutes is increasing slightly or flattening in many countries, the number of voice minutes per user for a local-call in USA decreased from 2.27 minutes in 2008 to 1.81 in 2009, according to CTIA.
0 %
10 %
20 %
30 %
40 %
50 %
60 %
15-24 -year-oldsn=435
25-34 -year-oldsn=516
35-49 -year-oldsn=801
50-64 -year-oldsn=775
65-79 -year-oldsn=459
Internet browsing
MMS messages
Personal email
Map and positioning
Internet communication

Rep. ITU-R M.2243 61
FIGURE A3.12
Mobile call per subscription per year
FIGURE A3.13
Voice and data mobile traffic growth rates in Netherlands and in Sweden, 2008-2009, %
Voice traffic was overtaken by data traffic in the mobile networks at the end of 2009 when the global amount of traffic was around 280 Terabytes (TB)/month according to telecom industry players.
It is inevitable that mobile VoIP will be adopted on mass scale in the next ten years and will trigger increases in the mobile voice traffic. This is mainly due to attractive pricing of international calls. However, mobile VoIP take-off depends on each country’s characteristics (competitiveness of the mobile market, roaming pricing, trend for unlimited data plans, and mobile operators' acceptance of mobile VoIP applications). The two figures below illustrated the different trends between four developed countries in terms of mobile VoIP adoption, showing that between 8.4% and 17.5% mobile subscribers will use VoIP.

62 Rep. ITU-R M.2243
When considering the low capacity consumption of a mobile VoIP call – a Skype voice call minute consumes on average 0.5 MB – the traffic from Voice over IP communication will have little impact on the amount of capacity consumed in the mobile networks.
Mobile voice traffic growth will remain flat until 2020 and its contribution to global traffic is expected to be marginal.
FIGURE A3.14
Percentage of mobile VoIP users over total mobile subscribers, 2009-2014
FIGURE A3.15
Mobile VoIP users, million, 2009-2014

Rep. ITU-R M.2243 63
A3.10.2 HD (high definition) Voice will challenge VoIP
Recent improvements in circuit-switched voice means high-quality voice services are now being offered by mobile operators. The idea here is to use high definition codecs (Wideband Adaptive Multi- Rate) for “crystal clear” mobile calls, thus reducing background noise. Technically, the bandwidth for speech used is wider; 50-7 000 Hz instead of the traditional narrowband – 300-3 400 Hz. This enables significant improvement in sound quality and intelligibility over current voice calls. By doing so both attenuation and distortion that inherently exist during encoding of unvoiced sounds of conventional telephonic speech are reduced and consequently both intelligibility and quality of unvoiced sounds are improved significantly.
Given the quality offered with HD by Voice, some specific categories of users are targeted like business people and travellers for clear calls in public transport situations (buses, trains …). Thus, it is expected that assuming that HD Voice is adopted, mobile calls should be longer which should offset the current trend of limited growth.
Handsets manufacturers, e.g. Nokia, Sony Ericsson and Samsung, are committed to Mobile Voice HD and all of them are supporting the WB-AMR codec.
From the operators' side, Orange UK is the first to introduce “HD voice” service across its IMT-2000 network nationwide following a trial conducted during summer 2010. It is anticipated that other operators will follow suit mainly in advanced markets in coming years. According to the industry, more than 400 million mobile users will use mobile HD Voice by 2015.
A3.10.3 Short messaging is increasing
Mobile messaging traffic volume continued to show strong growth on a global basis in 2009 and will continue to increase in the coming years driven by strong SMS adoption despite the increasing use of social networking sites and IM accessible from phones. The growth can be observed e.g. in France where text messaging volume doubled in 2009 and in UK with a 25% volume growth for the same period.
Within the global mobile traffic, the weight of mobile messaging is irrelevant. According to Cisco, mobile messaging represented less than 0.1% in 2009 mobile traffic.
FIGURE A3.16
Annual average of SMS sent per subscription in Nordic countries

64 Rep. ITU-R M.2243
A3.10.4 Multimedia messaging has not been widely adopted
Multimedia messaging offers text with pictures, video and/or audio files. Unlike for successful SMS take-up, MMS has not been widely adopted. It is estimated by industry players and regulators that MMS accounted for 2% to 3% of mobile messaging in 2009.
MMS has not yet taken off, because of disincentive factors concerning interoperability (issues on mobile networks or handsets not supporting MMS) and pricing (in USA, MMS reception is still charged by some carriers). Moreover, it is now more common to send a picture/video/audio as an email attachment or to share it through any social website rather than sending a MMS.
The best scenario for MMS adoption is in countries with high mobile penetration (like in some Asian countries) where MMS can be the support for any entertainment updates, movie trailers etc.
FIGURE A3.17
Messaging volume in the UK
TABLE A3.6
MMS usage in the UK
A3.10.5 Peer-to-peer (P2P) traffic in mobile broadband network is becoming more and more important
Like in fixed broadband networks, P2P applications generate a significant share of traffic in mobile networks with the large-scale use of file sharing applications. This is mainly due to the democratisation of media files transferring. According to Cisco, P2P represents 17.1% of global traffic, the second largest mobile traffic consuming application.

Rep. ITU-R M.2243 65
Regarding geographical distribution, Figure A.3.3 presented by Ericsson shows that the average share of P2P file sharing accounts for 18.4% of mobile broadband traffic in Western Europe in 2009. This figure is in line with Allot distribution assuming that 17% is the weight in Europe; 18% in Americas and 23% in APAC region (see Figure A3.19).
FIGURE A3.18
P2P contribution in mobile broadband traffic
FIGURE A3.19
P2P weight in the mobile broadband traffic in Americas, EMEA and APAC
However, on a global basis, P2P application is still growing but according to Cisco, P2P share of overall mobile traffic is forecasted to decline in the years to come and will only represent 7.8% of the traffic by 2014.
A3.10.6 Other aspects related to trends
New markets and new models
Market players in media, telecommunications, consumer products and financial services seeking to reach the rising middle class in forming markets will need to re-think standard market development approaches. The key to success lies in understanding the unique ways in which the demand for

66 Rep. ITU-R M.2243
information and communication will evolve, and how those patterns differ from established countries.
A simple way to think about the demand for information and communication is to examine Internet and mobile phone penetration for every 100 people in a country. Analyzing the relationship of those two technology penetration levels with other variables such as income and time provides a good forward looking window into demand evolution.
Defying classic economic models
The difference in Internet (information) and mobile phone (communication) patterns and trends between developing and emerging economies is striking. Internet penetration for established economies follows a fairly typical pattern, rising with income levels, and requiring a threshold of around $20,000 of per capita GDP to achieve 50% penetration.
To help meet the ever increasing demands for wireless communication and the expected higher data rates needed to meet user demands, it is necessary to forecast the evolution of mobile market and services for the future development of IMT.

Rep. ITU-R M.2243 67
First, mobile penetration often exceeds 100% because people own multiple mobile phones. Second, while mobile phone penetration also rises with per capita GDP, it happens earlier and faster, than Internet adoption. Instead of a $20,000 threshold, in many countries mobile phone penetration exceeds 50% with a per capita GDP as low as $5,000. In middle income countries such as e.g. Russia and Saudi Arabia, mobile phone penetration rates are even higher than those of more advanced economies such as the U.S. and Canada because mobile is an affordable, accessible alternative to the Internet. Altogether, the analysis on every dimension suggests that mobile communication is a truly disruptive phenomenon, acting on a global scale.
Uptake Outlook
Over the next 5-10 years, mobile penetration will rise to roughly 140 phones per 100 inhabitants, even in very low per capita GDP countries, and then rise gradually with income. At that point, the gap in mobile communication between developed and emerging economies will have largely disappeared, although some differences in technological sophistication will remain. In fact, within emerging markets, mobile communication may actually foster greater business and GDP growth, creating a feedback loop which will further boost mobile penetration, which is part of the disruption caused by this technology.
Changes in advertising
Research conducted by The Cambridge Group and the Columbia University Business School on the future of advertising found that different media had different roles in the minds of advertisers. For example, TV was associated with achieving reach and awareness among key audiences, while online/Internet was viewed as better suited for targeting, reaching an engaged audience and the ability to measure ROI.
In developed countries, a combination of TV and Internet can produce effective advertising, enhanced by the addition of the emerging mobile platform. In emerging economies however, Internet penetration will still be low by 2014, and any ad campaign relying on the Internet as an integral component will miss out on a large section of the middle class.

68 Rep. ITU-R M.2243
Reverse innovation model is evolving
Because the vast majority of world economies can be classified as mobile dominant versus mobile/Internet balanced, a reverse innovation model is evolving, where effective mobile advertising platforms are identified first in emerging markets, then transferred back for further refinement in established markets. The implications of the disruptive growth associated with mobile technology in emerging markets also should readily transfer to other industry sectors.
For example, mobile banking holds much greater potential than online banking, with a high likelihood that it will leapfrog online financial activity in emerging markets. Value-add services ranging from personalized weather reports, to product and price information on-demand, to location-based and remotely-activated services will continue to bolster demand for mobile offerings.
Proof of the middle class appetite for mobile applications and the potential for businesses in developed economies can be found in the success of the iPhone. At last count, the iPhone store offered more than 200,000 individual applications. The mobile application potential is virtually limitless for companies with an innovative bent, quick to move on media trends. In advanced economies, the advent of IMT-Advanced will blur the distinction between mobile and Internet, as consumers increasingly access the latter through mobile devices.
A vibrant set of mobile advertising solutions will be an essential ingredient for long-term growth in emerging markets to ensure adequate trade-up to higher price points and brands as per capita income rises. The respective importance of different media by market development suggests that mobile serves as a substitute for the Internet among the middle class in emerging markets for the distribution of broad-based marketing messages, and a complementary platform in established economies. Like any good investment, timing is everything, and mobile should be the leading-edge technology deployed by advertisers in developing markets and added to the portfolio in established sectors.
When investigating the socio-economic impact of mobile technology, the researchers found that Indian states with 10% higher than average mobile phone penetration enjoy an annual average growth rate 1.2% higher than those with a lower teledensity.
The research was funded by Vodafone, which claims that the findings demonstrate that mobile phones aid the process by which disadvantaged groups, including the low-skilled labor force, enjoy the fruits of economic growth.
Research leader Rajat Kathuria, of the ICRIER, said: “We believe this analysis shows that telecommunications is a critical building block for the country’s economic development. Our work also shows that the real benefits of telecommunications only start when a region passes a threshold penetration rate of about 25%. Many areas have still not attained that level, which indicates the importance of increasing teledensity as soon as possible. If Bihar’s mobile penetration rates were similar to those of Punjab, for example, then it would enjoy a growth rate that is 4% higher than its current rate.”
But while such information as weather reports and market prices, accessed by mobile phone, have begun to have an impact on productivity for the agricultural sector, the research concludes that other infrastructure challenges, such as poor roads and lack of refrigerated transport, need to be addressed in parallel in order for farmers to realize the full potential of access to information via mobile.

Rep. ITU-R M.2243 69
Annex 4
New mobile broadband forecasts
A4.1 Regulator views
The increase of traffic volume in cellular mobile communication service and broadband wireless service is expected by request for a big volume and a high quality in the data transmission services.
In a report developed by Telecommunications Council of Japan, the following information and figures were assumed in order to estimate the traffic volume for future mobile service.
– The spreading ratio of LTE/WiMAX as a whole, in mobile communication systems in Japan, was assumed to be 25% in 2012.
– It would be expected that LTE/WiMAX system could be a core mobile communication system in 2017 in Japan and its occupation percentage in the mobile service could be around 90%.
The report also investigated the changes of services and associated contents of mobile communication systems during the migration to LTE/WiMAX system. A simulation based on the various corresponding assumptions and change of the services indicated that the increase ratio of the traffic volume in Japan from 2007 to 2017 would be about 200 times.
It is also recognized that frequency usage efficiency should be increased by the development of technology. However, the introduction of such a highly efficient system would not be capable to cope with the expected vast increase of traffic volume if there had been no new additional frequency allocation for mobile communication system.
Figure A4.1 shows a forecast of mobile data traffic typically for China. It clearly indicates that there will be a rapid growth period of mobile data traffic in China in coming years, and mobile data traffic will be 494.53 PB per month in 2015, which is around 40 times of that in 2010.
FIGURE A4.1
Forecast of mobile data traffic for China
Figure A4.2 shows a forecast of mobile subscriptions in China up to year 2020. The subscriptions will continue to grow in next decade in China.
24.57 50.28
103.90
218.36
494.53
0
100
200
300
400
500
600
2011 2012 2013 2014 2015
Peta
byte
/month

70 Rep. ITU-R M.2243
FIGURE A4.2
Forecast of mobile subscriptions for China in the next decade
A4.2 Industry views
As introduced in Section 2, a significant increase of mobile cellular subscribers and users has happened in the year 2006-2010. This trend would maintain in coming years because more and more people from emerging markets will become IMT users. Traffic of voice service – once dominated the total mobile traffic – is still growing. However, usage of some new mobile applications like music downloading, video streaming, mobile gaming and access to media rich social networks have increased rapidly in past years resulting in an exponential growth of global mobile data traffic, which outnumbered voice traffic during December 200965.
A4.2.1 New mobile traffic forecasts by UMTS Forum
The new traffic forecasts by UMTS Forum66 presented thereafter correspond to the following:
– Traffic forecasts presented in this section represent the uplink and downlink traffic for voice and data¨.
– The traffic taken into account is the traffic transported on mobile networks using licensed spectrum.
– WiFi offloading is not taken into account67.
– The forecasts include the traffic managed by Femtocells.
65 Mobile data traffic surpasses voice, Ericsson Press Release, 23 March 2010.
66 Mobile traffic forecasts 2010-2020 Report, UMTS Forum Report No. 44, January 2011.
67 In the USA, AT&T indicated that its mobile customers made 85.5 million connections to the Internet in 2009 using AT&T’s Wi-Fi network (20 000 hotspots), four times the number of Wi-Fi connections made in 2008. According to some industry sources, the traffic offloaded on Wi-Fi networks could represent up to 20% of the mobile traffic in 2015.

Rep. ITU-R M.2243 71
– The forecasts presented in this report do not take into account RFID traffic or any other traffic on unlicensed frequency bands.
A4.2.1.1 Main hypothesis
Global mobile device market
Table A4.1 shows that at mid-2010, there were already more than 5 billion mobile users worldwide (excluding the M2M market). 2020 forecasts show that mobile penetration should reach 119% of the population (excluding the M2M market).
TABLE A4.1
Mobile users’ forecasts (excluding M2M – dates refer to end of corresponding year)
Global Base (million) 2010 2015 2020
Europe 1,014 1,151 1,242
Americas68 898 1,109 1,302
Asia 2,570 3,780 4,764
Rest of the world69 794 1,238 1,730
World 5,275 7,278 9,038
The global mobile device market in our 2010 assumptions differ from those presented in Report ITU-R M.2072 Chapter 6.2.6: our 2010 assumptions lead us to predict a 119% penetration rate in 2020 (excluding M2M). Asia-Pacific will still be home to the largest share of total mobile subscriptions in 2020 with Americas taking the number 2 position ahead of Europe.
With M2M subscriptions, the total number of subscriptions comes close to 10 billion. M2M devices are expected to represent 6.7% of the subscriptions in 2020.
TABLE A4.2
Mobile forecasts (including M2M – dates refer to end of corresponding year)
Device mix–- Worldwide
Our hypothesis regarding device mix take into account the growing share for mid-range and high-end smart phones, bringing low-end phones’ share down below the 20% mark in 2020.
68 Americas covers North, Central and South America in the Report.
69 Rest of the world covers Middle East and Africa in the Report.

72 Rep. ITU-R M.2243
FIGURE A4.3
Device mix
According to our hypothesis, high-end smart phones will represent a little bit more than 20% of the total devices in 2010. Low-end phones will see their share falling from 76.6% in 2010 to 17.2% in 2020.
FIGURE A4.4
Device mix in 2010 and 2020
2010 2020
Traffic mix – Worldwide
Traffic distribution by service
Peer-to-peer (P2P) mobile traffic is not included in the following distribution as it was considered to represent an access scheme rather than a service. P2P mobile traffic can be used to carry video or audio content which fall into the “infotainment” category, but can also be used to download other content such as software.

Rep. ITU-R M.2243 73
FIGURE A4.5
Distribution of traffic by service – 2020
Monthly traffic per device
The monthly traffic per device is expressed in Mb and represents the addition of uplink and downlink traffic. High-end smart phones will represent monthly traffic close to 2 Gb while traffic for dongles is expected to reach 4.8 Gb per month.
FIGURE A4.6
Monthly traffic per device (World average)
It should be noted that these figures represent an average for all countries combined, and that they will be much higher in the most mature markets.

74 Rep. ITU-R M.2243
TABLE A4.3
Monthly traffic per device (MB – World average)
A4.2.1.2 Worldwide mobile traffic
Total mobile traffic will reach more than 127 Eb in 2020, representing a 33 times increase over 2010.
TABLE A4.4
Total mobile traffic (Eb per year - World)
In 2020, we forecast that Asia will represent 34.3% of total world mobile traffic, Europe 22% and Americas 21.4%.
FIGURE A4.7
Total mobile traffic (EB per year - World)

Rep. ITU-R M.2243 75
For rest of the world that covers both Middle East and Africa, more precise forecasts are given in Figure A4.870. In this figure, MENA is for Middle East and North Africa while SSA corresponds to Sub-Saharan Africa (includes whole Africa except 5 North African countries, namely, Algeria, Egypt, Libya, Morocco and Tunisia).
FIGURE A4.8
Mobile traffic forecast in ME and Africa
A4.2.1.3 Conclusion on mobile traffic forecast
Mobile traffic will increase by a factor of 33 (worldwide): from 2010 to 2020, total worldwide traffic will grow from 3.86 Eb to 127.8 Eb. This growth in many countries in Europe, for example will come from the combination of a higher number of subscriptions and the importance of video traffic.
The traffic will be dominated by video, i.e. user related content. As a result, the traffic will continue to be unevenly distributed with a significant unbalance between busy and non-busy hours, along with very large variations across the different parts of the globe. Traffic is likely to vary parallel to peaks in population density, coupled with the peak of leisure time.
A4.2.1.4 Estimate beyond 2020: 2025 forecasts
Disclaimer (UMTS Forum): these 2025 forecasts are presented here in order to show mobile traffic trends but the model for this study was designed for 2010-2020. There is even more uncertainty as far as mobile traffic is concerned for 2020-2025, this forecast should be considered as “informative” only.
We anticipate total mobile traffic of more than 350 Eb in 2025 (worldwide) representing a 174% increase compared to 2020 as depicted in Figure A4.9.
70 Source is GSMA, October 2011.

76 Rep. ITU-R M.2243
FIGURE A4.9
2025 mobile traffic forecasts
A4.2.2 Forecasted WCDMA/HSPA subscriber numbers by GSMA/Wireless Intelligence
Table A4.5 shows forecasts for European WCDMA and HSPA subscriber numbers. It is forecasted that these subscriber numbers will pass 500 million by Q3 2014, up from 114 million in Q3 2010.
TABLE A4.5
Forecasts for European WCDMA and HSPA subscriber numbers (Wireless Intelligence 20.12.2010)
Q3 2008 Q3 2009 Q3 2010 Q3 2011 Q3 2012 Q3 2013 Q3 2014
Eastern Europe
2,284,257 9,040,255 19,160,963 33,392,827 55,405,918 91,553,990 141,901,802
Western Europe
28,170,268 56,310,363 95,540,908 151,050,361 222,732,319 304,146,750 361,233,855
Total 30,454,525 65,350,618 114,701,871 184,443,188 278,138,237 395,700,740 503,135,657
Wireless Intelligence 20/12/2010 Calculated data
A4.2.3 Market of pre-IMT-2000 and IMT-2000 mobile systems
This section provides market information both on a worldwide and regional level. The information includes background information on types of systems used, traffic volume, coverage areas as well as information on subscribers and the transition from 2G to 3G to 4G.
Worldwide market overview
Many factors contribute to explain the current mobile penetration levels: some are linked to a country’s historical peculiarities such as the nature of the regulatory environment, or the particulars of the operator’s offerings – these factors are short-term by nature. Other factors are linked to fundamental social and economic characteristics of the country. Extensive literature exists that describes the historical evolution of the fixed and mobile telecommunication penetration worldwide.
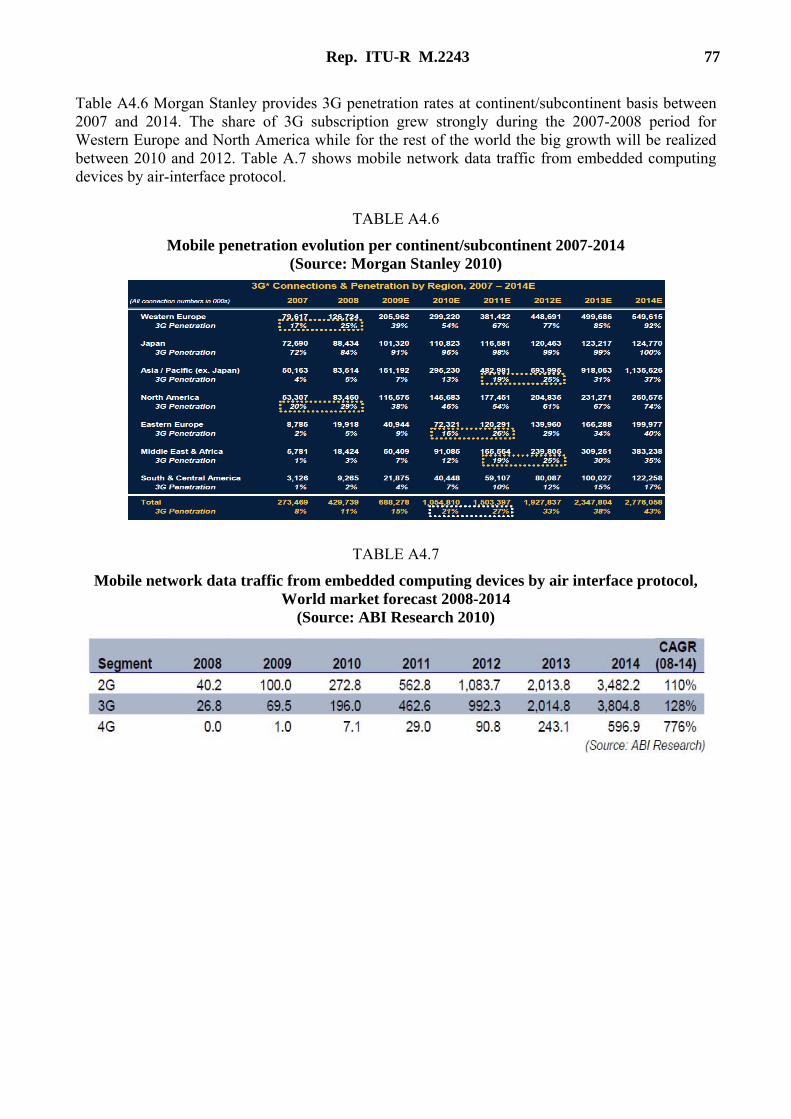
Rep. ITU-R M.2243 77
Table A4.6 Morgan Stanley provides 3G penetration rates at continent/subcontinent basis between 2007 and 2014. The share of 3G subscription grew strongly during the 2007-2008 period for Western Europe and North America while for the rest of the world the big growth will be realized between 2010 and 2012. Table A.7 shows mobile network data traffic from embedded computing devices by air-interface protocol.
TABLE A4.6
Mobile penetration evolution per continent/subcontinent 2007-2014 (Source: Morgan Stanley 2010)
TABLE A4.7
Mobile network data traffic from embedded computing devices by air interface protocol, World market forecast 2008-2014
(Source: ABI Research 2010)

78 Rep. ITU-R M.2243
FIGURE A4.10
Global Mobile will pass the Desktop Internet users by 2014 (Source: Morgan Stanley 2010)
Based on Ovum, the mobile global usage market will be 3.15 B connections by 2015, 73% of which will be based on small-screen devices at 2.3 B. However, the number of big-screen devices is on the rise with introduction of netbook and tablets. Figure A4.11 below presents the year over year data.
FIGURE A4.11
(Source: Ovum)

Rep. ITU-R M.2243 79
The number of usage is driven by the high number of subscribers. Based on Cisco, the number of Mobile-Only Internet users will reach 788 Million worldwide and Asia Pacific will account for over half of them.
TABLE A4.8
Number of mobile-only Internet users: 2010-2015 (Source: CISCO 2011)
Additionally, the total traffic usage is increasing significantly because of the increase in mobile internet devices. Figure A4.12 provides the traffic usage for 2008-2014.
FIGURE A4.12

80 Rep. ITU-R M.2243
TABLE A4.9
Mobile network data traffic from embedded devices by region, world market, forecast: 2008-2014 in petabytes
(Source: ABI Research 2010)
Average traffic per device is expected to increase rapidly in coming years. Table A4.10 provides this growth between 2009 and 2015.
TABLE A4.10
Growth average traffic per device
A4.3 Global IMT subscriber development forecast
According to ABI Report and infrastructure giant Ericsson the number of mobile subscribers has hit 5 billion as of 2010. The same study claims 2 million additions are made every day, more than 500 million of those subscribers are on 3G.
More importantly the number of devices connected to the internet has continued to climb up. Consumer devices to M2M devices have continued to hog the spectrum space. According to the research of Morgan Stanley the compute continuum continues to expand with better processing power and expansion in the services space. The number of devices that will access the spectrum space will be magnified to up to 10 B units by 2015.

Rep. ITU-R M.2243 81
FIGURE A4.13
As more and more people move to 2G to 3G and then subsequently to 4G the requirements of spectrum and demand will continue to increase. The chart below shows the change in usage behaviour. More and more people are moving towards high bandwidth applications such as video usage. Video is driving tremendous amount of demand for network capacity. The demand increase of data is estimated to be about 66 times by 2013.
Annex 5
Various measures to respond to increased mobile broadband traffic
A5.1 Introduction
This section describes the various initial measures Administrations, operators, and manufacturers have taken to address the dramatic increase in mobile broadband traffic in the last few years. Further technical and operational studies on these and other measures are anticipated during the next study period (2012-2016) to complement other ITU-R actions in order to address increasing traffic demand in the long term as justified in the report by various market and traffic forecasts.

82 Rep. ITU-R M.2243
A5.2 Measures to meet the expanding traffic demand
To meet this growing traffic demand in the near future, the following four approaches (see Figure A5.1), among others, are being considered71:
1) adopting more efficient mobile broadband technologies such as IMT-Advanced72;
2) improving capacity through network densification such as applying new network structure/topology);
3) offloading traffic to other networks such as offloading of traffic via WiFi and Femtocells;
4) addressing spectrum availability, such as the amount and ranges of spectrum (e.g. lower/higher bands).
FIGURE A5.1
Four approaches to address the increasing mobile traffic demand73
A5.2.1 New air interface technologies
The opening of spectrum currently used by 2G technologies (e.g. 900 and 1 800 MHz bands) to new technologies (IMT2000 and IMT-Advanced) will allow more capacity to be delivered over existing
71 There are several other options which could also be pursued (but these four are the most relevant). One important element is the use of cognitive radio technologies since they have the potential to support new applications in several markets and therefore the capability to increase the overall spectrum usage and to increase sharing opportunities between applications.
72 Including e.g. Multiple Input Multiple Output (MIMO), Coordinated Multi Point (CoMP) transmission, Enhanced Inter Cell Interference Coordination (eICIC).
73 C. Evci, “Meeting future mobile market and traffic demands – An industrial view”, 6th. Spectrum Management Conference, Brussels, Belgium, June 2011.
Technologies
Spectrum Availability
New networkstructure andtopology
Offloading of Traffic
Number of radio sites and Smaller cell sizes for more local capacity and for offloading of traditonal networks
Wi-Fi or any type of traffic offoading
Amount of spectrum used by radio interface
Migration to innovative, more efficient technologies

Rep. ITU-R M.2243 83
IMT spectrum. Up to today, peak wireless spectral efficiency is doubling every 30 months74, but user demand for bandwidth doubles at a much faster rate, every 11 months.
Moreover, advancements in radio link performance of advanced mobile broadband technologies are approaching theoretical limits (i.e. Shannon limit).
A5.2.2 Network densification
The highest capacity demand occurs in dense urban centres at peak times. For example, in one network in Europe, average network utilisation stands at around 30%, but this rises to 90% for the densest urban centres (5% of sites) during peak hours.75 As a result, it is urban hotspot sites that require additional capacity, however, in these areas networks are already very dense today and further real estate for sites is very hard to find and is costly.
Smaller cells are likely to be used to increase capacity without a need of tower based radio sites. Femtocells can also provide capacity increase in many applications, for example domestic environments where they are used to deliver service to users. 3G femtocells today out number macro cells globally. Over 2.3 million femtocells compared with 1.6 million 3G macrocells and rapid growth forecast to continue as some predictions indicate 48 million in use by 201476.
A5.2.3 Offloading of traffic
Offloading of traffic to the fixed network can be considered as another approach to meet the increased mobile broadband traffic demand77. This can be done via WiFi networks, or as mentioned above, via femtocells. WiFi or any type of offloading on unlicensed spectrum, in essence, takes place through stationary wireless broadband access. Many operators are using WiFi as an additional route to increase their total network capacity and WiFi capability in smartphones is widely available to mobile subscribers. However, a drawback is that mobile operators are not able to guarantee the QoS on the WiFi system due to unlicensed spectrum usage.
A5.2.4 Addressing spectrum availability
The increased mobile traffic demand is driving the development and deployment of MBB technologies such as IMT, but currently, the identified IMT spectrum is not fully available in many countries that limits IMT usage in those countries
The demand of mobile broadband traffic could also be accommodated by the assignment of new spectrum for mobile broadband use. Sufficient and suitable spectrum resources would also facilitate the development of innovative services and applications and stimulate competition in mobile broadband landscape to the benefit of consumers. As mentioned in Annex 6 multiple Administrations have already set targets for the release of more mobile broadband spectrum.
Realising the full potential of technologies such as LTE-Advanced requires large carrier bandwidths (at least 20 MHz), scalable up to 100 MHz. None of the current bands (except 3.5 GHz band) offer this potential of scaling to 100 MHz. In Europe, for example, only C-band (3.4-3.8 GHz) could
74 Information Technology and Innovation Foundation, Going Mobile: Technology and Policy Issues in the Mobile Internet (March 2010), p.46.
75 Morgan Stanley, Mobile Internet Report: Key Themes (December 2009), p. 425.
76 “Femtocell Market status and Femto Forum activities”, Presentation by Femto Forum at ECC meeting, Split, Croatia, June 2011.
77 Some traffic forecasts in the main body of the IMT.UPDATE excludes WiFi traffic load since the primary aim is Mobile broadband, not stationary wireless broadband.

84 Rep. ITU-R M.2243
satisfy these requirements on a stand-alone basis, achievable with contiguous block of at least 40 MHz.
An alternative is to introduce Carrier Aggregation (CA) that combines various bands for LTE-Advanced operation in order to satisfy both carrier bandwidth demand and also to carry huge traffic growth.
However, it should be noted that CA requires that several bands be simultaneously activated in the terminals, which could impact terminal battery life and energy efficiency. CA could lead to greater spectrum fragmentation in the market as regions/countries can implement differing CA plans, based on their national spectrum availability.
Annex 6
International, regional and national mobile broadband initiatives
A6.1 International broadband initiatives
Recognizing the importance of mobile broadband, the ITU and UNESCO announced on 10 May 2010 the establishment of a top level broadband Commission for digital development which will define strategies for accelerating broadband rollout worldwide and examine applications that could see broadband networks improve the delivery of a huge range of social services, from healthcare to education, environmental management, safety and much more.
The Broadband Commission reported its findings to United Nations Secretary-General Ban Ki-Moon in September 2010, immediately before the summit in New York to review work on achieving the Millennium Development Goals by the target date of 2015. The initial outcomes of the Broadband Commission for Digital Development include two reports (Available at: http://www.itu.int/net/pressoffice/press_releases/2010/33.aspx):
– “Broadband: A Leadership Imperative”: it is a concise, high-level report. Available: http://www.broadbandcommission.org/report1.pdf.
– “Broadband: A Platform for Progress” is a comprehensive analytical report that looks at financing models, return on investment, technology choices, and strategies for deployment across a range of different types of economies. Available: http://www.broadbandcommission.org/report2.pdf.
A6.2 Regional broadband initiatives
European Union78
The European Union (EU) released its Digital Agenda for Europe: 2010-2020 in May 2010 setting out the following objectives79:
– ensure broadband coverage of all EU citizens by 2013;
78 ACMA Report on «Towards 2020-Future Spectrum requirements for mobile broadband», Appendix A, May 2011.
79 European Commission Information Society, Digital Agenda for Europe: 2010–2020, May 2010, available at ec.europa.eu/information_society/digital-agenda/index_en.htm.

Rep. ITU-R M.2243 85
– offer broadband coverage at 30 Mbps or more for at least half of EU households by 2020.
The Digital Agenda for Europe: 2010–2020 also included a strategy designed to improve spectrum allocations in Europe through the creation of a coordinated and strategic spectrum policy directed at the EU level that would increase the efficiency of spectrum management and, in turn, maximise the benefits for consumers and industry. The details of this strategy are expected to include recommendations on stimulating investments and propose a comprehensive spectrum plan, in accordance with Recommendation 4 – Very Fast Internet80. However, these details are yet to be released.
The EU is currently negotiating its Radio Spectrum Policy Programme for the next five years. The proposal put on the table by the European Commission includes the following measures:
– take all steps necessary to ensure that sufficient spectrum for coverage and capacity purposes is allocated within the Union, in order to ensure that wireless applications contribute effectively to achieving the target for all citizens to have access to broadband of a speed of at least 30 Mbps by 2020;
– by 1st January 2012, authorise the use of all the spectrum designated by Commission Decisions (total amount of 810 MHz)), under conditions that provide consumers with easy access to wireless broadband services.
– by 1st January 2013 make the 800 MHz band available for electronic communications services in line with the harmonised technical conditions laid down pursuant to the Decision No. 676/2002/EC. In Member States where exceptional national or local circumstances would prevent the availability of the band, the Commission may authorise specific derogations until 2015.
– keep under review the use of the spectrum below 1 GHz and assess whether additional spectrum could be freed and made available for new applications.
In the negotiation, the European Parliament, the Council and the Commission reached an agreement on the need of at least 1 200 MHz that is to be available for wireless broadband applications by 2015 at the latest.
A6.3 National broadband plans
Several countries have issued national broadband plans which can e.g. be found from public sources like:
http://en.wikipedia.org/wiki/National_broadband_plans_from_around_the_world
http://www.oecd.org/countrylist/0,3349,en_2649_34223_38711225_1_1_1_1,00.html
In this Annex, some national broadband plans are listed.
Australia
ACMA has issued a Report on “Towards 2020-Future Spectrum requirements for mobile broadband”, May 2011, available from http://www.acma.gov.au/WEB/STANDARD/pc=PC_312514 which states:
The ACMA began its dialogue with stakeholders on future spectrum requirements in Australia in its consultation process on wireless access services (WAS) in 2006. The consultation process was completed in 2008 and identified the 2.5 GHz and 3.6 GHz as bands that could be made available for WAS in the short to medium term. The WAS consultation process also considered the dividend
80 There are seven recommendations made in the Digital Agenda for Europe: 2010–2020, available at ec.europa.eu/information_society/digital-agenda/index_en.htm.

86 Rep. ITU-R M.2243
that would become available as a result of the transition to digital television; however, analysis and planning for the 700 MHz band was undertaken separately.
As indicated in the Five-year spectrum outlook 2011-2015, a key ACMA spectrum management priority is the mobile broadband project. The project is intended to continue a dialogue with stakeholders on issues including the future spectrum requirements for mobile broadband services and the needs of incumbent spectrum users.
Analysis undertaken by the ACMA and presented at the RadComms2010 conference identified a shortfall of approximately 150 MHz of spectrum which will be required to meet demand for mobile broadband services out to 2015; however, any estimation of spectrum requirements beyond this timeframe is notional.
The ACMA expects that the demand for spectrum to support mobile broadband services will increase over time in response to the increased proliferation of machine to machine (M2M) interactions but that the level of spectrum demand from portable screens will flatten or plateau. Significant and continuing advances in the spectrum efficiency offered by mobile broadband technologies, that is its capacity to carry data, have occurred since 2005 and these advances are expected to continue until at least 2020. The ACMA also expects industry to deploy infrastructure more extensively in order to ease the pressure on spectrum.
The ACMA has undertaken further analysis of spectrum demand out to 2020. The assumptions for this analysis were complex, looking at a combination of coding efficiencies, additional infrastructure and fixed-to-mobile convergence whereby data is offloaded from the mobile network using very small ‘WiFi’ like cells.
From this analysis, the ACMA estimates that an additional 150 MHz of spectrum will be required by 2020. This estimate takes into account the 800 MHz of spectrum already dedicated for operation by mobile communications services; and includes the 150 MHz previously identified by the ACMA as being required by 2015.
Delivering on this estimation would ensure that approximately 1 100 MHz of spectrum is available in the Australian communications environment to support mobile broadband services by 2020. However, it is the issue of identifying which frequency bands and how the spectrum may be made available for use by future mobile broadband services that will take time and careful consideration.
This is particularly the case where possible frequency bands have other, important existing uses or users. It is also important for mobile operators to consider what techniques could be deployed in their existing and proposed network architecture to achieve greater spectral efficiencies.
This paper details the existing mobile broadband environment in Australia and the ACMA’s analysis of the quantum of spectrum required to meet that demand. The paper looks at those bands and services below 6 GHz that could be made available for mobile broadband and invites interested stakeholders to comment on these. The paper also invites stakeholders to consider options for mobile broadband beyond 6 GHz and the potential for these bands to be used for in-home and personal communications services.
Concurrently released with this paper is a second paper, The 900 MHz Band: Exploring new opportunities, that examines options to replan the 820-960 MHz band (known as the 900 MHz band) to improve its utility and potentially make additional spectrum available in the medium term for mobile broadband services.
The paper considers possible re-planning activities for the band including ‘refarming’ the digital cellular mobile telephony service segments (890-915 MHz paired with 935-960 MHz), currently planned for GSM technologies, to better facilitate 3G and 4G technologies and provides analysis on the potential for the 850 MHz “expansion” band to be made available for future mobile broadband services. Given the concurrent release of this paper, the 900 MHz band is not considered in this

Rep. ITU-R M.2243 87
paper. This is also the case for those frequency bands already under review or development including the 2.5 GHz and 700 MHz bands.
The submissions and comments received from stakeholders in relation to the issues raised in this paper will assist the ACMA in developing a forward work plan that will focus on particular frequency bands and associated planning and regulatory issues. The ACMA will consult on the proposed work plan at a later date.
Brazil
The National Broadband Plan (PNBL – Programa Nacional de Banda Larga) was created by the Brazilian Government in May 2010 with the objective of expanding broadband Internet access throughout the country. The implementation will be carried out by actions set out by the Digital Inclusion Program Steering Committee – CGPID, who will define the actions, goals and priorities of the PNBL, among other activities, with the participation of Telecomunicações Brasileiras S.A. (Telebras) as the public telecommunications operator to facilitate the achievement of the goals of the Plan. The National Telecommunications Agency (Anatel), as the telecommunications regulator in Brazil will play the role of implementing regulatory actions in order to foster the popularization of broadband access.
In order to promote the digital inclusion, the expansion of e-gov services, technological autonomy and reduction of social and regional inequalities, the PNBL expects to reach, with broadband connections, 40 million households by 2014.
In this context, the IMT plays an important role with the spread of IMT terminals throughout the country since 2008, when the first licenses for the 1.9-2.1 GHz spectrum were granted. For the coming years, it is expected a great IMT expansion of terminals using 1.9-2.1 GHz as well as other frequency bands.
In accordance with the provisions of the PNBL in completing the goal to achieve mobile broadband access in all municipalities, the Brazilian Administration released a schedule for the license process and auction for the 2 500-2 690 MHz band and it is expected the first licensees to start operation by the beginning of 2013. In accordance with Recommendation ITU-R M.1036-3 frequency arrangement, Brazil will keep the band 2 500-2 570 MHz paired with 2 620-2 690 MHz for IMT-FDD systems and the band 2 570-2 620 MHz for IMT-TDD systems. The 2 570-2 585 MHz block can be used directly or indirectly by public authorities, except public companies, in order to promote digital inclusion.
The Brazilian Administration is also working in a license process and auction for the 3.400-3.600 MHz band and intends to use the 3 400-3 410 MHz block for digital inclusion promoted directly or indirectly by public authorities, except public companies.
In regards of the 450 MHz band, the General Plan of Goals for Universalization – PGMU (Plano Geral de Metas para a Universalização do Serviço Telefônico Fixo Comutado Prestado no Regime Público), approved in June 2011, establishes that the auction for this band should occur before 30th April 2012, and should involve counterparts related to attendance of rural/remote areas.
Additionally, Anatel´s Plan on the review of current regulations, released in 2008, establishes as short term action the availability of radiofrequencies in order to foster broadband access, as medium term action the identification of new bands considering the demand for full mobility and as long term action the studies for spectrum use after the analog TV switch off. More information can be found in Portuguese at: http://www4.planalto.gov.br/brasilconectado/pnbl.
88 Rep. ITU-R M.2243
Canada
With the auction of the Advanced Wireless Systems (AWS) spectrum in 2008, the entry of several new players into the wireless market and the deployment of advanced IMT networks across the country, the wireless industry in Canada is service-innovative, vibrant and competitive81, providing coverage to 93% of the Canadian population.
The Government of Canada established The National Broadband Task Force in 2001 that produced a report entitled “The New National Dream: Networking the Nation for Broadband Access”82. This was followed by the undertaking of a widespread, and thorough, mapping exercise in order to understand the extent to which Canadians remain un-served or underserved. Based on this mapping data, Geographic Service Areas (GSAs) were defined and a competitive call for applications was open from September 1, 2009 to October 23, 2009, to fund projects in the GSAs. Applicants to the program could receive up to 50% of eligible project costs. The broadband program is an applications-based program to make broadband service available to as many un-served and underserved households as possible. Broadband is defined, at a minimum, as a connection capability of 1.5 Mbit/s. Since 9 May 2010, a total of 77 projects with federal funding up to $110 million have been announced as conditionally approved. These 77 projects, in 9 provinces and territories across Canada, will bring broadband Internet access to an estimated 220 000 households. More projects will be announced in the near future83.
A study commissioned by the Canadian Wireless Telecommunications Association (CWTA) was carried out by OVUM Consulting: “The Benefit of the Wireless Telecommunications Industry to the Canadian Economy” (April 2010)84.
Principal findings from the report include:
– Wireless communications generate a total economic value of some $39 billion for the Canadian economy: over $16 billion in terms of direct contribution to the GDP through the sale of goods and services;
– An additional $14 billion benefit due to the economic flow through to contributing suppliers in the supply chain; and
– Nearly $9 billion in consumer surplus (additional benefit or satisfaction that consumers get from wireless services, above and beyond what they pay for the services).
More than 294 000 people are employed in Canada as a result of the wireless industry (about 2% of the work force), with the wireless sector offering high value employment.
Finland
In 2008, Finnish government issued a Broadband Plan, which stated that high-speed broadband would be available to all permanent residences and private enterprise/public administration domiciles by the end of 2015, in accordance with demand. Connection speeds would be at least 100 megabytes per second. The distance from the user to the nearest fibre optic or cable network cannot be more than two kilometres.
81 Senate of Canada, Standing Committee on Transport and Communications, Plan for a Digital Canada, June 2010. Available: http://www.planpouruncanadanumerique.com/images/stories/pdf/report.pdf.
82 http://dsp-psd.pwgsc.gc.ca/Collection/C2-574-2001E.pdf.
83 As these projects have received conditional approval only, funding amounts and the number of households connected are subject to change as Contribution Agreements are signed. For further information see http://www.ic.gc.ca/eic/site/719.nsf/eng/h_00001.html.
84 http://www.cwta.ca/CWTASite/english/newsletter_260410.html#3.

Rep. ITU-R M.2243 89
More information at http://www.lvm.fi/web/en/topical/pressreleases/view/820526.
France
In 2008, the French government issued a first plan “France Numérique 2012” (Digital France 2012) with the view to provide guidance to the French administration and targets regarding the digital economy, recognizing that this sector was one of the most dynamic in modern economies, providing high added-value products and services. This ambitious plan aimed at supporting the French economy with the following priorities:
– to enable any French citizen to access networks and digital services;
– to develop the production and offers of digital contents;
– increase and diversify the digital usages and services in enterprises, administrations and personal environments;
– modernize the governance of the digital economy.
Specific actions referring to mobile spectrum were included in the plan as follows:
– Start, in the first quarter of 2009, the request for applications for the use of available frequencies in the 2 GHz band based on three objectives: promote competition, derive the best value from spectrum and ensure the best possible coverage of the territory. In 2009, specify the conditions for granting the authorizations in the 2.6 GHz band.
– Allocate the sub-band 790-862 MHz released by the analogue TV switch-off to coverage of the territory by fixed and mobile high data-rate networks.
Since then, the remaining spectrum at 2 GHz has been granted, with the exception of one block in the band 1 900-1 920 MHz (1 905.1-1 910.1 MHz) and the entire band 2 010-2 025 MHz for which no authorisation has yet been delivered. This enabled a new operator (Free Mobile) to access the French market in 2010.
The spectrum at 2.6 GHz (only the paired bands: 2x70) has been recently delivered to the existing operators (Orange, SFR, Bouygues Telecom and Free Mobile), following their application on 15 September 2011, for a total of 936 million €.
The spectrum at 800 MHz will be attributed by the end of 2011 (deadline for application: 15 December 2011).
In addition to these actions, the refarming of the 900 MHz band has to be noted: following actions carried out at the CEPT and EC levels so as to apply principles based on technology neutrality, France has modified its regulatory framework accordingly.
A second plan “France Numérique 2020” (Digital France 2020) is currently being elaborated by the Minister in charge of the digital economy. This plan will cover the period 2012-2020.
Germany
High-speed broadband networks that enable the rapid exchange of information and knowledge are crucial for economic growth. Nowadays, these networks are as important for our economic and social development as road and rail networks, rivers and canals, or gas, water and electricity distribution networks. Access to a high-speed broadband infrastructure provides a basis for innovative broadband services offering high economic returns, e.g. in the e-Work, e-Government, e-Health and e-Learning sectors. Broadband connections vastly accelerate knowledge transfer, while opening up an ever broader and richer range of audiovisual media content and infotainment services.
Rural areas stand to gain especially from broadband and the opportunities it offers. Since broadband access is an important factor for companies and families in deciding where to locate, it is critical for

90 Rep. ITU-R M.2243
safeguarding jobs and making rural areas more attractive and financially viable. However, numerous “white spot” areas without broadband still exist, many in parts of eastern Germany. Cable and telecommunication companies are investing heavily to expand their broadband networks (up to 50 billion Euros in the next few years, according to estimates). If we are to have access to higher-performance broadband connections that will act as a central nerve pathway within the German economy, now is the time to create the right general framework. Such measures will encourage the efficient development of broadband networks and facilitate the rollout of broadband access to every home in the country.
Working together with the federal states (Länder), local authorities and industry, the Federal government intends to give a massive boost to the development of the broadband network in Germany. This will be achieved by capitalising on synergies in the construction of infrastructure, using the “Digital Dividend”, formulating regulation that fosters investment and growth, and through financial support. A total of 75% of households should have high speed broadband access with transmission rates of at least 50 MB/sec by 2014. The government’s goal is to deliver nationwide access with this high-speed broadband as soon as possible.
Furthermore, the telecommunication industry in Germany agrees on fundamental principles for broadband expansion. This was done in the Next Generation Access (NGA) Forum, which was established based on voluntary principles of cooperation. The Forum has now adopted a policy document on the interoperability of modern broadband networks – in other words, on how these networks interact. This foundation allows a host of different actors – particularly those with local or regional broadband networks – to offer their services in competition across networks and across the country. A pleasingly large number of telecommunications companies are already investing in high-performance broadband networks, particularly optical fibre networks. However, an extraordinarily high level of investment remains necessary for the development of modern broadband networks as far as possible across the country. Uniformly specified wholesale products and multilateral agreement on technical interfaces and operative processes are absolutely essential in order for the individual networks created in this process to be able to realise services across networks.
India
India’s Department of Telecommunications has recently allocated spectrum in the 2.1 GHz, 2.3 GHz and 2.5 GHz bands to support 3G services and broadband wireless access (BWA) services respectively. The Department of Telecommunications is undertaking spectrum reform initiatives in the following frequency bands to make them available for mobile services and other IMT applications:
– 450-470 MHz (450.5-457.5 MHz/460.5-467.5 MHz)
– 698-806 MHz
– 1 900-1 910 MHz / 1 980-1 990 MHz
– 3 400-3 600 MHz.
The Telecom Industry in India has witnessed a phenomenal growth in the last decade, mainly due to mobile telephony. With 858.37 million wireless mobile subscribers at the end of July 2011, India is today the second largest and fastest growing telecom market in the world in terms of number of wireless connections. A significant part of this growth is now taking place in smaller cities and rural areas. For the majority of the people in the developing countries (including India), the first and only access to the internet is largely being performed via mobile systems.
India has ambitious plans in its National Broadband Policy to take the ICT/broadband revolution to rural India, which constitutes 70% of India’s population and promote convergence between mobile and other services such as e-health, e-education, e-Governance, e-infotainment etc. on a large scale. The Draft National Telecom Policy (announced on 10th October 2011) notified by the Government
Rep. ITU-R M.2243 91
has planned to provide affordable and reliable broadband in the country with a target of 175 million subscribers by 2017, and 600 million by 2020. “IMT” technologies will be the likely prime technology drivers for the future broadband market in India. Presently India has only 12.5 million broadband subscribers. Current subscribers using wireless technology for broadband being less than 1%, explosive growth of mobile broadband is expected in the country.
The Indian regulator has projected that wireless base figures will be over 1 000 million subscribers by March 2014. The number of mobile subscribers in urban and rural areas is estimated 572 million (urban) and 468 million (rural) respectively. Usage would be shifting progressively to more data intensive applications. However, it seems that with the current rate of growth of mobile phones in the country and rapid increase in multi-media traffic, this estimate is likely to be surpassed earlier than 2014.
The new generation of mobile broadband networks will support higher data throughput rates, lower latencies and more consistent network performance through a cell site. The changing pace of modern life style, economic growth and technical developments, greater device sophistication, accelerated growth of smart phones along with economies of scale for affordability and new bandwidth hungry applications will continue to drive demand for mobile services and spectrum. These will give an impetus to the growth of smart phones and other data enabled devices in the country and the number of data users and data volume will increase exponentially. It is estimated by the Indian regulator that the number of smart phones will be about 120 million by the year 2014.
The Telecom Regulatory Authority of India (TRAI) has indicated the estimated traffic calculations by 2014 in its Report (May 2010), and concludes that for voice and data services, India needs about 660 MHz. The Government (on 10th October 2011) has announced that it will make additional 300 MHz spectrum for IMT services by 2017, and another 200 MHz by 2020. Considering the fact that all the identified spectrum is not sufficient for projected IMT services in India, this may necessitate additional frequency bands to be identified and harmonized for IMT.
Japan
The action Plan for future wireless broadband in Japan was reported on November 30th, 2010, and it indicates a plan to assign a frequency band for future wireless broadband. The plan summarizes the requirements that an additional 300 MHz frequency bandwidth below 5 GHz for future mobile communication system, wireless sensor system for ITS, Smart Meter and others could be required to be assigned by 2015 and the frequency bandwidth of 1 500 MHz including the above mentioned additional 300 MHz frequency bandwidth could be required to be assigned by 2020 for future IMT system, aeronautical, ship and railway system and others.
Korea (Republic of)
Korea Communications Commission (KCC) has announced the initiation of the National Broadband Plan (so called Mobile Gwanggaeto Plan) on July 20, 2011 in an aim to finalize it end of 2011. With its vision for a “Smart Korea for All”, four core projects for ‘Smart Korea for All’were introduced as follows;
1) Global ICT Hub Korea
2) Promoting a smart ecosystem and creating new industries
3) Advanced digital broadcasting
4) Reinforcing broadcasting and communication user welfare.
Especially regarding the issue on Global ICT Hub Korea, KCC is planning to launch commercial Giga Internet service by 2012 which will provide 10 times faster internet connection than the current service and plans provide a 10Gbps service by 2020.

92 Rep. ITU-R M.2243
Furthermore, as shown in the Figure A6.1, KCC is considering new/additional mobile frequency bands for IMT including mobile broadband application, total 668 MHz including frequency bands identified to IMT which is more than double of total bandwidths currently licensed, to meet the demands of drastically increasing data traffics by proliferation of smart devices and unlimited mobile data service with flat rate. As a first step to achieve the goal, spectrum requirement for 2020 is taking into account the current mobile trends such as the increase of smart devices, technology evolutions, etc. Based on the results of the study, detailed plans to allocate new mobile frequency bands will be announced in the near future.
FIGURE A6.1.
Plan for new mobile spectrum allocation (Korea)
Sweden
Decisions made by the Swedish Post and Telecom Agency (PTS) contribute greatly to how various stakeholders can develop their operations, both nationally and internationally.
In order to facilitate a future expansion of mobile broadband PTS has identified additional spectrum that may be released in the future (see Table A6.1). The frequency ranges in the table below might be of special interest to IMT; a list of ongoing activities in other bands can be found in the Swedish spectrum policy which is available at http://www.pts.se/sv/Bransch/Radio/Spekttrumpolicy-och-inriktningsplan/.
TABLE A6.1
Swedish Case by PTS
Low frequency
(MHz)
High frequency
(MHz)
Current use Planned future use License
2 300 2 400 WAPECS/Licensing during 2011/2012
National block licenses
2 700 2 900 Radionavigation Under investigation / WAPECS/ENG – OB/Block
licensing
3 800 4 200 Space service Under investigation / WAPECS Maybe block license

Rep. ITU-R M.2243 93
NOTE – This data is provided for information only and provides a snapshot of the situation in Sweden in July 2011. The information is non-binding and not officially translated; any information can be changed any time by the Swedish Post and Telecom Agency (PTS).
United Kingdom85
On 16 June 2009, the UK Government published its Digital Britain: Final Report in which the government proposed, inter alia, a combined auction of the 800 MHz and 2.6 GHz bands in conjunction with a relinquishment of spectrum in the 1.8 GHz or 2.1 GHz bands by mobile network operators. The objective is to increase mobile network operators’ capacity to provide mobile broadband access in urban and rural areas.
In December 2010, the UK Government released a paper titled Britain’s Superfast Broadband Future (the paper) that echoed the announcement of the FCC in 2010 and recommended at least 500 MHz of spectrum be made available for mobile broadband within 10 years. This quantum of spectrum would assist in ensuring that virtually all homes in the UK have access to a minimum service level of 2 Mbps by 2015.
The service mix highlighted in the paper aligns heavily with those of the Australian NBN; that is, a mixture of fixed, mobile and satellite services. The paper suggests that part of the spectrum requirements may be met through the Ministry of Defence reviewing its spectrum holdings and relinquishing some spectrum for release to the market in 2013. The government target of 500 MHz is to be found below 5 GHz in bands not already allocated to mobile broadband. It should be noted that the suggestions set out in the paper have not been supported by Ofcom to date.
United States
On 16 March 2010 the Federal Communications Commission delivered to Congress its National Broadband Plan setting an ambitious agenda for connecting all corners of the nation while transforming the economy and society with the communications network of the future – robust, affordable Internet.
The FCC plans call for action over the next decade includes the following goals and recommendations:
– Connect 100 million households to affordable 100-megabits-per-second service, building the world's largest market of high-speed broadband users and ensuring that new jobs and businesses are created in America.
– Affordable access in every American community to ultra-high-speed broadband of at least 1 gigabit per second at anchor institutions such as schools, hospitals, and military installations so that America is hosting the experiments that produce tomorrow's ideas and industries.
– Ensure that the United States is leading the world in mobile innovation by making 500 megahertz of spectrum newly available for licensed and unlicensed use.
– Move our adoption rates from roughly 65% to more than 90% and make sure that every child in America is digitally literate by the time he or she leaves high school.
– Bring affordable broadband to rural communities, schools, libraries, and vulnerable populations by transitioning existing Universal Service Fund support from yesterday’s analog technologies to tomorrow’s digital infrastructure.
85 ACMA Report on «Towards 2020-Future spectrum requirements for mobile broadband», Appendix A, May 2011.

94 Rep. ITU-R M.2243
– Promote competition across the broadband ecosystem by ensuring greater transparency, removing barriers to entry, and conducting market-based analysis with quality data on price, speed, and availability.
– Enhance the safety of the American people by providing every first responder with access to a nationwide, wireless, interoperable public safety network.
About half of the Plan’s recommendations are addressed to the FCC, while the remainder are for consideration by Congress, the Executive Branch, state and local government, working closely with the private and non-profit sectors.
More information about the FCC’s National Broadband Plan can be found at: www.broadband.gov
The text of the FCC’s National Broadband Plan is available at: http://download.broadband.gov/plan/national-broadband-plan.pdf