Embed Size (px)
Citation preview

Composite Structures 119 (2015) 24–37
Contents lists available at ScienceDirect
Composite Structures
journal homepage: www.elsevier .com/locate /compstruct
Assessment of the efficiency of prefabricated hybrid composite plates(HCPs) for retrofitting of damaged interior RC beam–column joints
http://dx.doi.org/10.1016/j.compstruct.2014.08.0240263-8223/� 2014 Elsevier Ltd. All rights reserved.
⇑ Corresponding author. Address: ISISE, Dept. Civil Eng., School Eng., University ofMinho, Campus de Azurém, 4800-058 Guimarães, Portugal. Tel.: +351 917 40 90 75.
E-mail addresses: [email protected] (E. Esmaeeli), [email protected] (J.A.O. Barros), [email protected] (J. Sena-Cruz), [email protected](H. Varum), [email protected] (J. Melo).
Esmaeel Esmaeeli a,⇑, Joaquim A.O. Barros a, Jose Sena-Cruz a, Humberto Varum b, José Melo b
A ISISE, Dept. Civil Eng., University of Minho, Guimarães, Portugalb Dept. Civil Eng., University of Aveiro, Portugal
a r t i c l e i n f o
Article history:Available online 23 August 2014
Keywords:Strain hardening cementitious composite(SHCC)Carbon fiber reinforced polymer (CFRP)Hybrid composite plate (HCP)Interior reinforced concrete (RC)beam–column jointCyclic behaviorRetrofitting
a b s t r a c t
The effectiveness of prefabricated hybrid composite plates (HCPs) as a seismic retrofitting solution fordamaged interior RC beam–column joints is experimentally studied. HCP is composed of a thin platemade of strain hardening cementitious composite (SHCC) reinforced with CFRP sheets/laminates. Twofull-scale severely damaged interior beam–column joints are retrofitted using two different configura-tions of HCPs. The effectiveness of these retrofitting solutions mainly in terms of hysteretic response, dis-sipated energy, degradation of secant stiffness, displacement ductility and failure modes are compared totheir virgin states. According to these criteria, both solutions resulted in superior responses regarding theones registered in their virgin states.
� 2014 Elsevier Ltd. All rights reserved.
1. Introduction
The performance of each element composing framed systems inreinforced concrete (RC) structures has direct impact on their glo-bal response to withstand lateral seismic demands. High inelasticrotation capacity of the beams at the vicinity of the connectionto the column, sufficient shear strength and stiffness of thebeam–column joint panels, and a predominant elastic responseof the columns will allow the dissipation of a high amount of theenergy, if the stability of the structure to transfer the gravity loadto its supports is assured. According to the provisions of the mod-ern codes oriented to seismic design, the capacity hierarchy design,along with a proper detailing of the internal steel arrangementshould be taken into account to achieve such a ductile and saferesponse of the designed RC structures located in moderate andhigh seismic risk zones. However, there are a considerable numberof existing RC structures designed with previous codes, with onlyGravity Load Design (GLD) approaches, especially those designedaccording to pre-1970th codes provisions. These structures have,in general, inadequate detailing to resist the lateral demandsinduced by earthquake actions. Recognizing these deficiencies,
the scientific community working on structural seismic designand retrofitting started proposing several strategies for the seismicrehabilitation and retrofitting [1,2]. Steel jacketing, cast-in-placeconcrete/RC jacketing [3], shotcrete jacketing [4], epoxy injectionrepair [5], application of fiber reinforced polymers (FRPs) [3,5–13] are the proposed solutions that can be found in literature ascommon strengthening/repair solutions. Among the aforemen-tioned techniques, FRP materials have attracted special attentionof several researchers, mainly due to their lightweight, flexibilityfor practical application and easiness of application. These compos-ite materials are used in the shape of externally bonded sheets orlaminates. The main practical challenge for using FRP in the retro-fitting of RC elements is related to their premature de-bonding[14]. In general, mechanical anchors are proposed in an attemptof preventing/delaying debonding, or even to assure the ultimatecapacity of the composite material. The research carried out byEngindeniz et al. [15] on the retrofitting of both damaged andundamaged three-dimensional beam–column–slab joint speci-mens clearly highlighted the important role of proper anchoringfor the FRP systems, since debonding was the main failure mecha-nism, avoiding the full exploitation of the strengthening potential-ities of these materials. However, special attention is needed toprevent high stress concentrations around the anchored zone inorder to avoid premature rupture of FRP. Anchoring FRP materialbonded to the top and bottom faces of a beam inside a groove, exe-cuted at the concrete cover of the column, is proposed as an alter-native solution to transfer tensile stresses of the FRP material

E. Esmaeeli et al. / Composite Structures 119 (2015) 24–37 25
behind the critical section at beam–column interface [7,16]. How-ever, this technique is limited to the depth of concrete cover andmight involve the risk of introducing damage to the column’s lon-gitudinal bars during the carving of the groove. Moreover, the jointregion should resist higher demands associated to the shear stres-ses introduced by FRP anchorage while shear deficiency of thiszone is one the most common vulnerabilities known in RC struc-tures with seismic retrofitting requirements. The solution studiedby Mukherjee and Joshi [7] based on using the ‘‘L’’ shape FRPstrengthening technique in combination with FRP wraps on bothbeam and column elements might be an alternative to partiallytreat the aforementioned concerns. Besides the aforementionedpractical drawback, the properties of FRP materials are negativelyaffected by temperatures higher than the glass transition temper-ature of the adhesive used in these materials and in FRP-basedstrengthening techniques (epoxy is the most used adhesive). More-over, the composite layer needs to be protected against vandalism.A comprehensive review on FRP durability issues is reported byBenmokrane and Mohamed [17].
Strain hardening cementitious composite (SHCC) is a class ofFiber Reinforced Concretes (FRCs), with the character of developinga continuous increase of post-cracking tensile capacity up to thestress localization at one of the multiple formed cracks for a rela-tively high tensile strain. The formation of multiple diffused hair-line cracks through all the loaded length of the specimen duringthe hardening stage assures levels of ductility not possible to attainin conventional FRCs. By testing in bending masonry elementsstrengthened with a thin layer of SHCC applied to their bottomface, Esmaeeli et al. [18] demonstrated that higher load carryingcapacity and ductility is achievable when compared to flexuralstrengthening methodologies based on the use of thicker layersof ordinary steel FRC.
Recently Esmaeeli et al. [19] have investigated the effectivenessof a new technique for the shear strengthening of short-span sheardeficient beams. The strengthening element, nominated as hybridcomposite plate (HCP), combines the potential structural effective-ness of prefabricated plates made of SHCC with carbon fiber rein-forced polymer (CFRP) sheets for the shear strengthening of deepbeams. In fact, covering the internal surface of the SHCC plate witha CFRP sheet results in mutual advantages for these materials: inthe durability perspective the SHCC provides protection for theCFRP, adding an extra safety against the detrimental effects of van-dalism, and cycles of relatively high humidity and temperature; inits turn the CFRP increases significantly the tensile capacity for theHCP. Furthermore, the SHCC contributes to increase the resistanceof the compressive strut, and to restrain the propagation of macrocracks due to the fiber reinforcing mechanisms, being expectablemuch higher load carrying capacity and deformation performance.
In the present study the effectiveness of HCP to retrofit full-scale damaged GLD interior beam–column joints is investigated.HCPs are attached to the damaged interior beam–column jointsby means of epoxy resin and chemical anchors to partially coverthese framed elements. Two different configurations of HCPs wereused: (i) a cross shape SHCC plate reinforced with CFRP laminatesaccording to the near surface mounting (NSM) technique [20]; (ii)SHCC plates reinforced with externally bonded CFRP sheets form-ing an ‘‘L’’ shape configuration.
2. Experimental program
The experimental program comprised the retrofitting of twofull-scale damaged interior beam–column joints. After retrofitting,these specimens were subjected to the same loading history aspreviously imposed in their virgin state. To assess the effectivenessof each of the two proposed HCP-based retrofitting solutions, the
results determined in the strengthened specimens are comparedto those obtained in the corresponding specimens in the virginstate. The performance of both strengthening strategies is alsocompared.
2.1. Damaged specimens
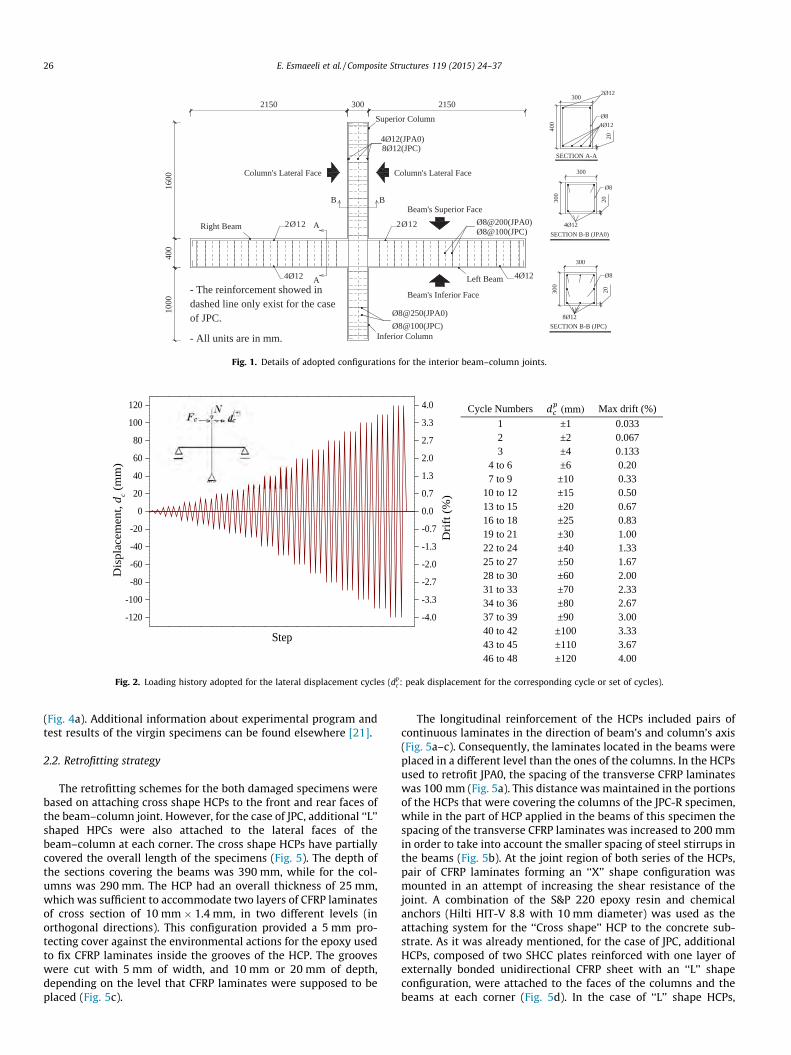
Two damaged interior RC beam–column joints were selectedamong a series of tested specimens. These specimens were thesubject of an experimental research in the scope of a PhD thesis[21,22]. Configurations of pre-1970th RC buildings were adoptedfor the design process of these framed elements. Therefore, plainsteel bars were used as the reinforcement of beams and columnsof these specimens. No transverse reinforcement in the joint regionwas applied, and 90� hook arrangement was adopted for the stir-rups and hoops in beams and columns, respectively. The beamsand the columns of these full-scale specimens had a length of thehalf-span and the half-story, respectively, of common RC buildings.This configuration of the elements allows representing the behav-ior of the beam–column joint assemblage under lateral loading,considering the end-points in beams and columns of the specimenswhere the moment inflection is expected to occur. The geometriesand steel configurations of the selected specimens for the retrofit,JPA0 and JPC, are shown in Fig. 1. It should be noted that theshorter length adopted for the inferior column of the specimens,associated to a steel element with equivalent stiffness, allows torepresent the behavior of the assemblage and to accommodatethe load cells and pin connection at the bottom of the column, asit is evident in the test setup.
The average concrete compressive strength, measured in cubesof 150 mm edge, was equal to 23.8 MPa with an estimated charac-teristic compressive strength of 19.8 MPa, corresponding to theC16/C20 concrete strength class according to the grades existingin EC2-1992-1-1 [23]. By performing tensile tests on steel bars,average values of 590 and 640 MPa were determined for the yieldand the ultimate tensile strength of the longitudinal reinforcement,respectively, with an elasticity modulus of 198 GPa.
A lateral reversal displacement history was imposed to the topof the superior column combined with a constant axial load of450 kN. This axial force represents the gravity load correspondingto an axial compressive stress of 21.3% of the average concretecompressive strength. The lateral load was constituted of a seriesof displacement-controlled cycles, in push (positive displacement)and pull (negative displacement) direction, with an incrementalmagnitude up to 4% interstory drift. After three cycles of loadingthat introduced a drift level of 0.13%, each level of displacementwas repeated three times, as it is shown in Fig. 2. The specimenswere tested horizontally according to the test setup illustrated inFig. 3.
The maximum load carrying capacity of 43.2 and 38.3 kN wasregistered for JPA0 and JPC, respectively, at the drift levels of2.7% and 3.3%.
According to PA damage index proposed by Park and Ang [24],these damaged specimens can be categorized as ‘‘collapsed’’ due tothe extensive damage that they experienced during tests [21].
As consequence of deficient bond between smooth longitudinalbars and the surrounding concrete, the damages at the end of thetest were mainly localized in the vicinity of the joint region intothe beams and columns. As shown in Fig. 4, the extent of the dam-ages includes concrete crushing and spalling off at the intersec-tions of the beams and the columns, severe sliding oflongitudinal reinforcement due to significant bond deteriorationand, eventually, flexural cracks localized at the beam–joint inter-faces or column-joint interfaces. In JPA0 one of the flexural crackswas, however, localized at a certain distance from the joint region
A
B B
A
4Ø12(JPA0)
4Ø12
2Ø12 Ø8@200(JPA0)
8Ø12(JPC)
Ø8@100(JPC)
- The reinforcement showed indashed line only exist for the caseof JPC.
- All units are in mm.
1600
400
1000
2150 300 2150
Left Beam 4Ø12
2Ø12
Superior Column
Inferior Column
Column's Lateral Face
Beam's Superior Face
Beam's Inferior Face
Ø8@250(JPA0)Ø8@100(JPC)
Column's Lateral Face
Right Beam
300
400
2Ø12
4Ø12
20
SECTION A-A
Ø8
300
Ø8
300
20
SECTION B-B (JPA0)4Ø12
300
20
8Ø12
Ø8
SECTION B-B (JPC)
300
Fig. 1. Details of adopted configurations for the interior beam–column joints.
Cycle Numbers Max drift (%)1 ±1 0.0332 ±2 0.0673 ±4 0.133
4 to 6 ±6 0.207 to 9 ±10 0.33
10 to 12 ±15 0.5013 to 15 ±20 0.6716 to 18 ±25 0.8319 to 21 ±30 1.0022 to 24 ±40 1.3325 to 27 ±50 1.6728 to 30 ±60 2.0031 to 33 ±70 2.3334 to 36 ±80 2.6737 to 39 ±90 3.0040 to 42 ±100 3.3343 to 45 ±110 3.6746 to 48 ±120 4.00
-120
-100
-80
-60
-40
-20
0
20
40
60
80
100
120
-4.0
-3.3
-2.7
-2.0
-1.3
-0.7
0.0
0.7
1.3
2.0
2.7
3.3
4.0
Drif
t (%
)
Dis
plac
emen
t, d c (
mm
)
Step
Fig. 2. Loading history adopted for the lateral displacement cycles (dpc : peak displacement for the corresponding cycle or set of cycles).
26 E. Esmaeeli et al. / Composite Structures 119 (2015) 24–37
(Fig. 4a). Additional information about experimental program andtest results of the virgin specimens can be found elsewhere [21].
2.2. Retrofitting strategy
The retrofitting schemes for the both damaged specimens werebased on attaching cross shape HCPs to the front and rear faces ofthe beam–column joint. However, for the case of JPC, additional ‘‘L’’shaped HPCs were also attached to the lateral faces of thebeam–column at each corner. The cross shape HCPs have partiallycovered the overall length of the specimens (Fig. 5). The depth ofthe sections covering the beams was 390 mm, while for the col-umns was 290 mm. The HCP had an overall thickness of 25 mm,which was sufficient to accommodate two layers of CFRP laminatesof cross section of 10 mm � 1.4 mm, in two different levels (inorthogonal directions). This configuration provided a 5 mm pro-tecting cover against the environmental actions for the epoxy usedto fix CFRP laminates inside the grooves of the HCP. The grooveswere cut with 5 mm of width, and 10 mm or 20 mm of depth,depending on the level that CFRP laminates were supposed to beplaced (Fig. 5c).
The longitudinal reinforcement of the HCPs included pairs ofcontinuous laminates in the direction of beam’s and column’s axis(Fig. 5a–c). Consequently, the laminates located in the beams wereplaced in a different level than the ones of the columns. In the HCPsused to retrofit JPA0, the spacing of the transverse CFRP laminateswas 100 mm (Fig. 5a). This distance was maintained in the portionsof the HCPs that were covering the columns of the JPC-R specimen,while in the part of HCP applied in the beams of this specimen thespacing of the transverse CFRP laminates was increased to 200 mmin order to take into account the smaller spacing of steel stirrups inthe beams (Fig. 5b). At the joint region of both series of the HCPs,pair of CFRP laminates forming an ‘‘X’’ shape configuration wasmounted in an attempt of increasing the shear resistance of thejoint. A combination of the S&P 220 epoxy resin and chemicalanchors (Hilti HIT-V 8.8 with 10 mm diameter) was used as theattaching system for the ‘‘Cross shape’’ HCP to the concrete sub-strate. As it was already mentioned, for the case of JPC, additionalHCPs, composed of two SHCC plates reinforced with one layer ofexternally bonded unidirectional CFRP sheet with an ‘‘L’’ shapeconfiguration, were attached to the faces of the columns and thebeams at each corner (Fig. 5d). In the case of ‘‘L’’ shape HCPs,

N
2000 mm2000 mm
1500
mm
1500
mm
Supe
rior
Col
umn
Infe
rior
Col
umn
Fc
Left Beam Right Beam
HydrolicActuators
dc
ConnectorPiece
(+)(-)
Load Celles
Fig. 3. Test setup for the horizontally placed specimens [21].
E. Esmaeeli et al. / Composite Structures 119 (2015) 24–37 27
S&P 50 epoxy resin and chemical anchors (Hilti HIT-V 8.8 with10 mm diameter) were used to fix these panels to the lateral facesof beams and columns. To the retrofitted JPC and JPA0 specimens,
Fig. 4. The extent of damages before
the nomination of the JPC-R and JPA0-R was attributed,respectively.
All the retrofitting process was performed with the specimensin horizontal position. For both specimens the remaining crushedand spalled off concrete at the corners of the joints was removedand then replaced with Sika Grout-213. To seal the cracks, bore-holes were drilled through the cracked sections. After cleaningthe holes using compressed air, small diameter pipes were placedinside them, then the superior face of the cracks was sealed andthen epoxy resin SikaDur-52 was injected through these pipes.After turning the specimens, the sealing process was repeated toassure that the cracked section was sealed as much as possible.The concrete substrate was also slightly roughened using hand-held concrete scabbler to partially expose the aggregates. This sur-face roughening aims to improve the HCP-concrete interface bondproperties. Prior to the installation of the HCPs, chemical anchorswere mounted inside the holes perforated on the beams, columnsand joint regions, at the positions represented in Fig. 5. Beforemounting the anchors, the holes were partially filled with HiltiHit-HY 200-A as a fast curing injectable bonding agent. The embed-ded length of the anchors inside the concrete was 115 mm. Fig. 6shows a view of the specimens after the HCPs have been applied.
2.3. Material properties of retrofitting system
The self-compacting SHCC was composed of a cementitiousmortar reinforced with 2% of volume short discrete PVA fibers.The PVA fiber used in this study had a length of 8 mm and was pro-duced by Kuraray Company with designation of RECs15 � 8. Theaverage tensile stress at crack initiation and the average tensilestrength of the SHCC was 2.43 and 3.35 MPa, respectively, with aminimum tensile strain capacity of 1.3%. More details on mixture
retrofitting (a) JPA0 and (b) JPC.

(a)
(b)
40
805 290 805
CFRP10 1.4@100mm
2CFRP10 1.4
200
300
200
300
8921
389
317 282 108
2CFRP10 1.4
CFRP10 1.4@200mm
317282108
2CFRP10 1.4
B
A A
M12B
605
390
605
50
HCP for JPC-R
Region of superiorcolumn
M12
Region ofleft beam
805 290 805
605
390
605
CFRP10 1.4@100mm
2CFRP10 1.4
200
300
200
300
8921
389
317 282 108
2CFRP10 1.4
CFRP10 1.4@100mm
317282108
2CFRP10 1.4
M12
M12
40
50Region of superior
column
Region ofleft beam
AA
B
B
HCP for JPA0-R
(c)
(d)
5
SECTION A-A
1015
35 110 5
SECTION B-B
15
Epoxy ResinCFRP Laminate
SHCC Plate
(Longitudinal)CFRP Laminate
(Transverse)45150
EpoxyResin
CFRP LaminateSHCC Plate(Longitudinal)
CFRP Laminate(Transverse)
10
5
M12
790
25
25
755
555
Lateral View of the "L" Shape HCP
One layer of bondedCFRP sheet
SHCC plate for the columnSHCC plate for the beam
555 755
140 300 150 200 200 200 190108
7510
8
35 35
Expanded Top View of the "L" Shape HCP
SHCC Plate (Column Part)
Unidirectional Carbon Fabric Bonded tothe Backside of the Plates
SHCC Plate (Beam Part)
Fig. 5. Details of the HCPs used for the repair of the damaged specimens (a) cross shape HCP for JPA0-R, (b) cross shape HCP for JPC-R, (c) section views of the cross shapeHCPs, and (d) ‘‘L’’ shape HCP for JPC-R.
28 E. Esmaeeli et al. / Composite Structures 119 (2015) 24–37

(a) (b)
“Cross” HCP
Column
“Cross” HCP
Column
“L” HCP
Fig. 6. View of the repaired specimens (a) JPA0-R and (b) JPC-R.
E. Esmaeeli et al. / Composite Structures 119 (2015) 24–37 29
ingredients, mixing process and test setup of the SHCC can befound in [18,19,25]. The commercial name of the utilized carbonfabric is S&P C-Sheet 240. According to the supplier, this fabrichas a tensile elasticity modulus of 240 GPa and a nominal tensilestrength of 3800 MPa. The fabric elongation at rupture is 1.55%.The measured thickness of this fabric was 0.3 mm. Based on tech-nical data, S&P 50 epoxy resin develops a tensile strength of35.8 MPa and a modulus of elasticity around 2.6 GPa at the ageof 14 days. An average tensile strength of 18 MPa and averagemodulus of elasticity of 6.8 GPa were obtained based on uniaxialtensile tests carried out following the recommendations of ISO527-2:1996 [26] on six dumbbell-shaped S&P 220 epoxy resin after7 days of curing. Tensile properties of the used CFRP laminate (S&Plaminate CFK 150/2000) with a cross section of 1.4 � 10 mm2 werecharacterized following the procedure proposed in ISO 527-5:2009[27]. From the tests executed in six coupons, average values of2689 MPa, 1.6% and 165 GPa were obtained for the tensilestrength, strain at CFRP rupture and modulus of elasticity, respec-tively. The average compressive strength of 38.4 MPa for SikaG-rout-213 was obtained by means of compression tests on fourcubes of 100 mm edge.
2.4. Test setup and loading pattern
The same test setup, cyclic lateral load history and axial load inthe columns used for testing the virgin specimens were adopted fortesting the retrofitted ones. Fig. 7 shows the schematic configura-tion of the displacement transducers (DTs) mounted on the speci-mens to measure the local deformations. Four slices along eachbeam and each column were considered for this purpose. The axialdeformation of each region, along the longitudinal CFRP laminates,was registered using a parallel pair of DTs installed in each slice. Bycombining diagonal, vertical and horizontal DTs in the joint region,the distortion of the panel of the joint was also evaluated.
3. Results and discussion
3.1. Hysteretic response
Fig. 8 shows the hysteretic responses of both virgin and retrofit-ted specimens in terms of lateral load vs. lateral displacement (anddrift), registered at the top of the superior column. Both techniquesresulted in successful retrofitting solutions in comparison with theresults obtained with the corresponding specimen in the virginstate, since higher load carrying capacity was obtained. The pinch-ing effect observed in the reversal loops of JPC was also slightlyimproved by using the proposed strengthening technique. The val-ues registered for the maximum lateral load (Fp) and the corre-sponding drifts (dp) for specimens in the retrofitted and virginstates are indicated in Table 1.
The increase level in terms of lateral peak load after strengthen-ing is also indicated in this table. According to the obtained results,the retrofitting technique provided an increase of 25.5% and 18.2%in terms of maximum lateral load carrying capacity of JPA0 for thenegative and the positive displacements, respectively. The corre-sponding values for JPC-R are even larger, so that an increase of54.5% and 48.3% was obtained for the negative and positive direc-tion, respectively. A relatively different hysteretic response duringthe positive and negative loading directions for JPC-R is correlatedto an unsymmetrical damage distribution and will be discussedfurther in this paper.
3.2. Damage evolution and failure modes
3.2.1. JPA0-RThe initiation of the first series of cracks occurred at the cycles
corresponding to a drift of 0.33%. These cracks were formed at theinferior face of the left beam and also at the inferior and superiorface of the right beam at the vicinity of the first series of theanchors, almost inside slice 2 (see Fig. 9 and also Fig. 7). Furtherincrease in the displacement demand led to the formation of acrack crossing the section of the right beam, while in the left beamthe relevant damage seems to have become restricted to theincrease of the crack’s width on the beam’s inferior face. Althougha single crack was formed on the lateral faces of the beams, duringtheir widening up to a drift of 1.3% multiple hairline cracks wereformed on the surface of HCP at the vicinity of the locations ofthese cracks. At cycles corresponding to 1% drift, diagonal cracksstarted to appear at the beam–column intersections. By furtherincrease in the amplitude of the drift cycles, these inclined cracksstarted propagating toward the opposite corners forming an Xshape crack pattern coinciding with the inclined CFRP laminatespositioned in the joint of the HCP (Fig. 9). When the drift cyclesreached the value of 1.3%, horizontal and vertical cracks startedto appear inside the joint region, between the intersections of lon-gitudinal CFRP laminates of the beams and columns. At the drift of2.0%, the retrofitted corners at the intersection of beams and col-umns started to spall off. The widening and propagation of thecracks inside the joint region may have governed the failure modeof the JPA0-R specimen. The visual inspection of the joint panelafter the test revealed the bulged faces of the HCPs in the jointregion with X shape cracks along with crushing of the old concrete,which was confined inside the HCPs.
3.2.2. JPC-RThe onset of the first crack was at the 2nd cycle of the set of
cycles corresponding to 0.2% of drift in negative direction (seeFig. 2). This crack was formed at the superior face of the right beamin a distance of 80 mm far from the extremity of HCP (on the non-retrofitted region). During the positive displacement of this drift

1 2 3 4
12
3
4
1234
1
2
3
4
0.32
0.68
0.10 0.20
0.20
0.32
0.28
0.10
1.03 0.42 0.30
0.10
0.10
0.30 0.42 1.03
0.18
0.30
0.28
0.40
0.40
Fig. 7. Geometry of the slices assumed on each specimen to assess local deformations (the nodes are representing the regions where the displacement transducers weresupported; dimensions in mm).
(a) (b)
-120 -90 -60 -30 0 30 60 90 120
-60
-40
-20
0
20
40
60
-4 -3 -2 -1 0 1 2 3 4
-60
-40
-20
0
20
40
60
Drift (%)
Late
ral l
oad
(kN
)
Lateral displacement (mm)
JPA0-RJPA0
-120 -90 -60 -30 0 30 60 90 120
-60
-40
-20
0
20
40
60
-4 -3 -2 -1 0 1 2 3 4
-60
-40
-20
0
20
40
60
Drift (%)
Late
ral l
oad
(kN
)
Lateral displacement (mm)
JPC-RJPC
Fig. 8. Hysteretic responses of the specimens (a) JPA0 and (b) JPC in the retrofitted and virgin states.
Table 1Maximum lateral load capacity and the corresponding drifts of the specimens in the retrofitted and virgin states.
Specimen Negative direction Positive direction Negative direction Positive direction
F�p (kN) d�p (%) Fþp (kN) dþp (%) Increase in peak load
JPA0-R �52.6 �2.65 +51.2 +2.31 +25.5% +18.2%JPA0 �41.9 �2.31 +43.3 +2.60JPC-R �57.2 �1.65 +56.8 +2.64 +54.5% +48.3%JPC �36.7 �2.94 +38.3 +3.25
30 E. Esmaeeli et al. / Composite Structures 119 (2015) 24–37
level, a second crack was also observed out of the retrofittedregion, at a distance of 40 mm far from the extreme edge of theHCPs on the superior face of the left beam. At 0.33% of negativedrift, the first crack has progressed in terms of length and width.At the same level of drift but in the positive direction, a third crackwas formed at the inferior face of the right beam in a distance
approximately equal to the crack which was already formed atthe superior face of this beam.
During the following cycles, the propagation of the existingcrack on the left beam seems to have been restricted by the pres-ence of the HCP, while the existing cracks on the right beam havepropagated up to become connected. It should be noted that, since

Close up view “A”
A
Left beam
Superior column
Fig. 9. Inclined cracks and bulging of the joint region of JPA0-R at the end of the test.
E. Esmaeeli et al. / Composite Structures 119 (2015) 24–37 31
the sliding of the longitudinal bars of both beams was restricted bythe adoption of 90� bend extremities for these bars, furtherincrease in displacement demand, up to 1.67% drift, was followedby higher load carrying capacity. This higher load is a consequenceof the moment redistribution towards other regions of thebeam–column assembly not so damaged.
During both the positive and the negative displacements of thecycles corresponding to 1% drift, further cracks on both the left andright beams adjacent to the beam–column interfaces were formed(Fig. 10). The sequence of the cracks occurrence was at: (i) inferiorface of the left beam; (ii) inferior face of the right beam; (iii) supe-rior face of the right beam; (iv) superior face of the left beam. Byincreasing the drift up to 1.3%, these cracks on the left beam inter-sected each other. The crack on the inferior face of the right beamhas widened and propagated, while the crack at the superior facein this region has only experienced a small increase in its width.This was due to the action of the previously cracked region ofthe right beam out of the retrofitted zone, which acted as the
(a)
(b)
A
Left beam
Superior column
Governing damright beam
Governing damage on left beam
B
Left beam
Superior columnGoverning da
right be
Governing damage on left beam
Fig. 10. Damage distribution along the beam–column joint elements with close up vieloading direction and (b) negative loading direction.
governing damage region on the right beam. By repeating thecycles with the same level of the drift, the cracks at the vicinityof the beam–column interfaces progressed into the bonded regionof the CFRP sheet on the left side of the superior and inferior col-umn, as well as towards the right side of the inferior column. Whenthe drift cycles corresponding to 1.67% were imposed, this detach-ment progress met the first level of anchors positioned in the supe-rior and inferior columns. Further detachment of the CFRP sheet innormal and tangential directions was resisted by the flexural resis-tance of the SHCC plate and bearing capacity of the anchors,respectively. At a drift cycle of 2.67% the SHCC plate reached itsflexural-tensile capacity and failed. At the higher levels of drift,only the width of these cracks has increased without any furthercrack formation. By the end of the test, to visualize the developedmicro-cracks, the surface of the HCPs that was varnished beforetesting, was sprayed with a penetrating liquid. As a result of thistechnique, it was visible multiple diffuse micro-cracks inside thejoint panel zone with diagonal orientation, fish spinal shape
Close up view “A”
Close up view “B”
age on
mage on am
cracks Micro
ws of micro-cracks at the end of testing of the JPC-R corresponding to (a) positive

32 E. Esmaeeli et al. / Composite Structures 119 (2015) 24–37
micro-cracks along the longitudinal CFRP laminates on the crossshape HCP, and diffuse micro-cracks in the vicinity of macro-cracksaround the anchors in the joint region and in the first slice of bothbeams (see Fig. 10 and also Fig. 7).
3.2.3. Failure modesThe flexural capacity of the beams was the governing failure
mode of JPC-R, while joint shear failure was the governing failuremode for JPA0-R. This joint shear failure can be attributed to theperformance of the ‘‘L’’ shape panels attached to the beam–columncorners of the JPC-R. In fact, due to the continuity of the strength-ening system at the junction of the beams and columns, wherethey are subjected to the largest bending moments, the ‘‘L’’ shapepanel was submitted to high tensile stresses, mainly due to thecontribution of the CFRP sheet. The effectiveness of the bond adhe-sive and anchors, as well as the flexural capacity of the SHCC plate,have assured a proper medium for the transference of these tensilestresses to the interior of the beam and column (therefore lowershear stress were transferred to the joint region) preventing a pro-gressive detachment of the CFRP sheet. In fact the detachment ofthe CFRP sheet has only propagated up to the position of the firstanchor in the column.
3.3. Flexural capacity of beams
When the flexural capacity of the columns and the shear capac-ity of the beams and columns are adequate, the failure mechanismof the interior beam–column joints depends either on the flexuralcapacity of the beams subjected to reversal loadings or the shearcapacity of the joint panel, as it was the case for JPC-R and JPA0-R, respectively. Eq. (1) presents the state of the static equilibriumbetween the maximum developed moments at the left and theright beams with respect to the lateral force at the top of thecolumn.
Vc ¼ MR þML
Lcð1Þ
where Vc is the shear force in the column, MR and ML are the inter-nal moment developed at the beam–column interface of the rightbeam and the left beam, respectively. In Eq. (1), LC is the length ofthe column between the positions of lateral load at the superior col-umn and the lateral support at the inferior column. Therefore, anyreduction in the flexural capacity of the left or right beams mayresult in the loss of lateral capacity of the beam–column assembly,
(a)
ML MRPull Cylces
ML MRPush Cylces
-4 -3 -2 -1 0 1 2 3 4
-120
-90
-60
-30
0
30
60
90
120
Flex
ural
Str
engt
h (k
N.m
)
Drift (%)
ML
MR
Fig. 11. Development of the resisting bending moment at the interfaces of the beamsspecimen (a) JPA0-R and (b) JPC-R.
unless this reduction could be compensated through the momentredistribution into the other parts of the structure.
The maximum moments (at the mid-section of slice 1 on theleft and the right beams) vs. the drift demands were calculatedby considering the force values registered in the load cells andequilibrium conditions, and the obtained results are illustrated inFig. 11. For the signs of the internal moments a criterion identicalto the lateral displacements was assumed. Therefore, for a positivedrift (Fig. 2 or Fig. 3) the moments generated in the interfaces ofbeam–column are considered positive, while they are negativefor a negative drift (see the schematic representation in Fig. 11).
According to Fig. 11a, the maximum bending moments devel-oped in the left and the right beams of JPA0-R, during the negativedisplacement, were �92.95 kN m at a drift of �3.00% and�54.03 kN m at a �2.65% drift, respectively. During the positivedisplacement, the left and the right beams reached their maximumbending moment, +52.11 and +90.69 kN m, at drift levels of +2.31%and +2.99%, respectively.
As depicted in Fig. 11b, the values of maximum bendingmoments for JPC-R in the left and the right beams, during the neg-ative displacement were �114.13 kN m at a drift level of �2.66%and �55.58 kN m at �1.65% of drift, respectively. The developedmaximum bending moment for the positive displacement, in theleft and the right beams were +51.09 N m and +106.4 kN m at driftlevel of +2.64%, respectively. A sudden reduction observed in bend-ing moment capacity of the right beam during negative loading, atdrift cycle of 1.67% (Fig. 11b), is associated to a noticeable sliding oflongitudinal steel bars at the superior face of that beam. Sliding ofthese bars has initiated out of the retrofitted region where damagewas already extensive, and then progressed along the beam towardits supporting extremity. Due to this process a sudden drop in lat-eral load carrying capacity of JPC-R was registered at this level ofdrift (Fig. 8b), after which the specimen presented a structural soft-ening behavior for any further loading in the negative direction.
As mentioned when the damage evolution of JPC-R was dis-cussed, at a drift cycle of 2.67% the SHCC plate installed on the lat-eral face of the column reached its flexural-tensile capacity, andfailed. Failure of this plate resulted in the loss of the contributionof the CFRP sheet for the flexural strengthening of the beam. In fact,the tensile stresses developed in CFRP sheet of the beam could notbe effectively transferred to the column anymore. As a direct con-sequence, in the longitudinal CFRP laminates of the cross shapeHCP, at the inferior face of the right beam, the tensile stressesincreased significantly and one of these CFRP laminates ruptured.Therefore, the maximum bending capacity of the right beam dur-
(b)
ML MRPush Cylces
ML MRPull Cylces
-4 -3 -2 -1 0 1 2 3 4
-120
-90
-60
-30
0
30
60
90
120
Flex
ural
Str
engt
h (k
N.m
)
Drift (%)
ML
MR
with columns (the positive moment is assumed as the anticlockwise rotation) for

Table 2Maximum bending moments developed in the beams of the retrofitted and the virgin specimens.
Specimen Negative direction Positive direction Negative direction Positive direction
ML (kN m) MR (kN m) ML (kN m) MR (kN m) ML increase (%) MR increase(kN m)
ML increase(kN m)
MR increase(kN m)
JPA0-R �92.95 (�3.00)a �54.03 (�2.65) +52.11 (+2.31) +90.69 (+2.99) 22.5 34.5 30.8 13.4JPA0 �75.85 (�2.32) �40.16 (�2.32) +39.84 (+2.59) +79.95 (+2.59)JPC-R �114.13 (�2.66) �55.58 (�1.65) +51.09 (+2.64) +106.4 (+2.64) 61.3 74.8 47.5 45.1JPC �70.75 (�3.28) �31.79 (�2.94) +34.64 (+1.94) +73.34 (+3.25)
a Values in parentheses indicate the corresponding drift in percentage at maximum bending moment.
E. Esmaeeli et al. / Composite Structures 119 (2015) 24–37 33
ing positive displacement (+106.4 kN m at 2.67% drift) was reachedby the rupture of this longitudinal CFRP laminate. In consequenceof significant bond deterioration between this laminate and sur-rounding SHCC in the joint region, the flexural capacity of the leftbeam was also limited due to the sliding of this laminate duringthe lateral load reversal. This justifies the sudden drop in bothpositive and negative displacements at a drift level of 2.67%, asshown in Fig. 8b.
The registered maximum bending moments for these speci-mens during both the positive and the negative loading displace-ments is also indicated in Table 2. Corresponding values for theirvirgin state and the percentage of the increase in their flexuralcapacity achieved after the retrofitting are also reported in thistable. According to this data, the flexural capacity of the JPA0 afterthe retrofit increased up to 34.54% and 30.80%, for the negative andpositive loading directions, respectively. The retrofitting systemadopted in the JPC provided a larger increase in the resisting bend-ing moments, since values of 74.8% and 47.5% are obtained for thenegative and the positive loading, respectively. It should be notedthat the values registered for the JPA0-R do not necessarily repre-sent the flexural capacity of the beams, since the beam–columnjoint shear failure was the governing mode.
3.4. Drift components
The lateral displacement of a beam–column joint can be decom-posed into the contribution of the deformation developed in eachof its elements. These drift components are the shear and the flex-ural deformations of both the columns and beams, fixed end rota-tions of the columns and the beams and eventually the distortionof the panel of the joint region in shear. In general, the shear defor-mation of the beams and columns has low contribution to theoverall drift, as it is also the case of this study, and therefore can
(a)
1 2 3 40
20
40
60
80
100
Dri
ft C
ompo
nent
s C
ontr
ibut
ion
(%)
Drift (%)
Beams Flexure Columns Flexure Joint Distortion
Fig. 12. Contribution of the beams flexure, the columns flexure, and the
be neglected. Also the beams and columns flexural deformationsmay include the fixed end rotation since they were not indepen-dently measured. The flexural deformation of beams and columnsis calculated using the average rotation of each slice determined bythe measured values of the DTs installed on them. The contributionof the joint panel to the interstory drift is also calculated using thejoint shear distortion. Measured values by the diagonally placedDTs are used to obtain the joint distortion at each level of intersto-ry drift.
Fig. 12 illustrates the contribution of each of the abovemen-tioned components as the percentage of each level of the interstorydrift during the steps of the positive displacements. The remainingportion of the graphs includes the shear deformation of the beamsand columns, rigid body motion of the specimens due to the flex-ibility of supporting frames and finally local deformations at thesupporting regions of the specimens.
According to the Fig. 12a, the contribution of the beams flexuraldeformation in lateral displacement of JPA0-R increased up to 59%at the level of 1% drift. After this level of the drift the beams flex-ural contribution started decreasing, and reached to its minimumcontribution of 19% at 4% drift. The joint distortion contributionstarted increasing after the drift level above 1.3% and at 3% drifthas reached 35%, which was larger than the contribution of theother components. The maximum contribution of the joint distor-tion, 37%, has occurred at 3.33% of drift. The flexural contributionof the columns varied between 22% and 40%. Considering theobserved damages and Fig. 12a, it can be concluded that at 4% ofdrift the fixed end rotation of the column, due to the excessive slid-ing of the unbounded longitudinal reinforcements inside the jointregion, and the joint shear distortion have dominated the intersto-ry drift.
Fig. 12b shows the contribution of the drift components in theinterstory drift of JPC-R. It can be seen that the beams flexural con-
(b)
1 2 3 40
20
40
60
80
100
Dri
ft C
ompo
nent
s C
ontr
ibut
ion
(%)
Drift (%)
Beams Flexure Columns Flexure Joint Distortion
joint shear distortion to the overall drift of (a) JPA0-R, and (b) JPC-R.

(a) (b)
0 10 20 30 40 500
10
20
30
40
50 JPA0-R JPA0
Drift (%)
Dis
sipa
ted
ener
gy (k
N.m
)
Cycle number
1 2 3 4
0 10 20 30 40 500
10
20
30
40
50 JPC-R JPC
Drift (%)
Dis
sipa
ted
ener
gy (k
N.m
)
Cycle number
1 2 3 4
Fig. 13. Evolution of the dissipated energy during the cyclic loading of (a) JPA0-R and JPA0, and (b) JPC-R and JPC.
34 E. Esmaeeli et al. / Composite Structures 119 (2015) 24–37
tribution up to 1% of drift has increased up to 59%, similar to whatwas observed for JPA0-R. Between this drift level and 2.64% drift,the contribution of the beams flexural deformation was almostconstant, but above 2.64% drifts the beams flexural contributionhas increased and reached its maximum contribution of 86% at4% of drift. Except at the drift level of 0.2%, where the contributionof the joint distortion was more than 20%, up to a drift level of 1%the joint distortion had almost a constant contribution with anaverage value of 12%. By increasing the imposed drift the contribu-tion of the joint distortion has also increased and reached its max-imum value of 23.8% at a drift level of 2.33%. Above this level ofdrift, the joint distortion had a reduction tendency so that at 4%of drift its contribution was only 5.2%. The column flexural contri-bution had a general tendency to decrease with the increase of thedrift, with a 39% of contribution at a drift level of 0.2%, and 5.5% atthe end of the test. This hierarchy of the contribution of each driftcomponents for lateral displacement of JPC-R explains how the ret-rofitting system was efficient to decrease the joint shear distortionand, therefore, to maintain the columns undamaged.
3.5. Dissipated energy
Energy dissipation and inelastic deformations of a lateral loadresisting system indicate the potential of the structure towithstand the loading demands of seismic events. The amount of
(a)
0 1 2 3 40
1000
2000
3000
4000
5000
6000
7000 JPC-R JPC
Seca
nt s
tiffn
ess
(kN
/m)
Drift (%)
Fig. 14. Secant stiffness of (a) JPA0-R
dissipated energy can be calculated from the enclosed area in eachloading cycle as presented by the hysteresis response of lateralload vs. lateral displacement. Integration of the dissipated energywith respect to the increment in lateral drift can result in total dis-sipated energy at each given level of interstory drift. The evolutionof the dissipated energy for retrofitted and corresponding speci-men in virgin state is presented in Fig. 13. Both retrofitting solu-tions have provided an energy dissipation capacity higher thanthe one registered in the corresponding specimen in virgin stateduring all loading steps. In this respect, the retrofitting solutionapplied in JPC specimen was more effective. In fact, at 4% drift,the dissipated energy of JPA0-R was 52.3 kN m, which is 23% largerthan the energy dissipated in JPA0, while the JPC-R reached54.03 kN m corresponding to an increase of 84% comparing to dis-sipated energy of JPC.
3.6. Secant stiffness
As a consequence of reversal and repeated actions of cyclicloading, the stiffness of a beam–column assembly can be deterio-rated. To assess the stiffness degradation, the secant stiffness isestimated during the drift evolution, and its relationship is repre-sented in Fig. 14, for both the specimen in the retrofitted and virginstates. The secant stiffness is taken as the slope of the straight linewhich connects the peak loads at the positive and the negative
(b)
0 1 2 3 40
1000
2000
3000
4000
5000
6000
7000 JPA0-R JPA0
Seca
nt st
iffne
ss (k
N/m
)
Drift (%)
and JPA0, and (b) JPC-R and JPC.

Fig. 15. Schematic representation of the definition of the equivalent bilinear curvefor the evaluation of the displacement ductility index.
E. Esmaeeli et al. / Composite Structures 119 (2015) 24–37 35
displacements of the load versus displacement envelop at eachlevel of the drift. According to this figure both specimens in the ret-rofitted state presented higher secant stiffness than in the virginstate, at least up to 3% drift. In terms of initial secant stiffness,JPA0-R presented the same stiffness as in its virgin state, whilethe initial secant stiffness of JPC-R was 22.5% higher than the valueregistered in its virgin state. This increase is attributed to the largercross section after the retrofit, and higher level of concrete confine-ment introduced by the post-tension effect of the chemical anchorsin all lateral faces of the framed elements. In addition, it should bementioned that both retrofitting systems were able to recover (atleast) the initial stiffness.
For the case of JPA0-R, when the first crack was formed, at 0.33%drift, the initial secant stiffness reduced more than 44%. Due to theconcentration of damage at the superior face of the right beam ofJPC-R, out of the retrofitted region, and initiation of the sliding ofthe longitudinal plain steel bars in this region, a significant dropin its secant stiffness at a drift level of 0.33% was registered. Thisstiffness reduction was about 58% of the initial secant stiffness.
3.7. Displacement ductility
Ductility is the potential of a lateral load resisting system toundergo large inelastic deformations during its post-peak regime
(a)
-5 -4 -3 -2 -1 0 1 2 3 4 5-60
-40
-20
0
20
40
60
Late
ral L
oad
(kN
)
Drift (%)
JPA0-R JPA0
Fig. 16. Envelope of the load vs. drift for both the retrofitted and virgin specimens along wR and JPC.
with only slight reduction in its ultimate lateral load carryingcapacity. The ductility is generally quantified as a normalized dis-placement or a rotation index depending if the ductility is aimed tobe assessed in terms of local or global behavior, respectively. Forthe case of the present study, the displacement ductility index(lD) is calculated as the ratio of the ultimate lateral displacement(du) and the displacement at the yield point (dy). The ultimate pointcan be defined as the displacement corresponding to a load level inthe post-peak response of the specimen that is a fraction of thepeak load (Fp). According to the available literature, this ratio canbe taken between 10% and 20% [28–30]. The yield displacementcan be obtained from a bi-linear curve assuming equivalent elas-tic-perfectly plastic response. To estimate this bi-linear curve,two conditions should be fulfilled: (i) the area under this curveshould be equal to that for the envelope of load versus lateral dis-placement, and (ii) the deviation between these two curves, mea-sured based on the absolute sum of the areas enclosed betweenthese curves, should be the minimum (see Fig. 15). The displace-ment ductility index is then calculated as the ratio between theultimate displacement and the yield displacement. In this contextit was assumed for the ultimate displacement the one correspond-ing to 10% loss of the peak load (0.9Fp). The envelope of the load vs.drift and also the equivalent elastic-perfectly plastic curves esti-mated for both the retrofitted and virgin specimens are presentedin Fig. 16. Table 3 also indicates the yield and the ultimate dis-placement obtained for the calculation of the displacement ductil-ity index for the positive and negative loading, where lV
D and lRD
are the ductility for the specimen in the virgin and retrofitted state,respectively. The reported ductility index is calculated as the aver-age ductility using the corresponding values of displacement duc-tility in both positive and negative displacements. It is verified thatfor both retrofitted specimens the yield displacement hasdecreased when compared to the value registered in correspondingspecimen in the virgin state. The reduction of the yield displace-ment is a consequence of the stiffness increase provided by the ret-rofitting system, with the main impact during the initial cycles.According to the results included in Table 3, the retrofitting strat-egy has assured an increase in terms of displacement ductility of22.66% in the JPA0 specimen, while JPC-R presented a reductionof 18.2% in comparison to the displacement ductility factor regis-tered in its virgin state. This reduction in ductility of JPC-R canbe attributed to the loss of the right beams rotational ductility atthe concentrated damage zone localized out of the retrofittedregion, where the sliding of longitudinal steel bars at the superiorface of the beam was initiated. Furthermore, due to the failure of
(b)
-5 -4 -3 -2 -1 0 1 2 3 4 5-60
-40
-20
0
20
40
60 JPC-R JPC
Late
ral L
oad
(kN
)
Drift (%)
ith the equivalent elastic-perfectly plastic curves of (a) JPA0-R and JPA0, and (b) JPC-

Table 3Details of components for the evaluation of displacement ductility factor.
Specimen Negative direction Positive direction lD lRD�lV
D
lVDð%Þ
d�y (mm) d�u (mm) dþy (mm) dþu (mm)
JPA0-R �28.5 (�0.95)a �116 (�3.86) +28.6 (+0.95) +100.5 (+3.35) 3.8 22.6%JPA0 �34.5 (�1.15) �110.5 (�3.68) +34.5 (+1.15) +105.2 (+3.51) 3.1JPC-R �22.5 (�0.75) �57.6 (�1.92) +28.5 (+0.95) +82.9 (+2.76) 2.7 �18.2%JPC �37.5 (�1.25) �117.3 (�3.91) +37.5 (+1.25) +117.7 (+3.92) 3.3
a Values in parentheses indicate the corresponding drift in percentage at maximum bending moment.
36 E. Esmaeeli et al. / Composite Structures 119 (2015) 24–37
HCPs at the lateral face of the column, the CFRP sheet bonded tothe critical section of the right beam lost its anchorage mechanism,which has promoted a gradient of tensile stress leading to the rup-ture of CFRP laminate at the inferior face of the HCP on the rightbeam.
Moreover, in comparison with JPA0-R, a lower damage in thejoint region of JPC-R restricted the occurrence of any excessivejoint shear distortion. Therefore, a reduction in displacement duc-tility of JPC-R is also defined by a lower contribution of the sheardeformation at the joint region to the lateral displacement at thetop of the column.
4. Conclusions
The effectiveness of a retrofitting system, based on attachingprefabricated HCPs to two severely damaged RC interior beam–column joints, was investigated by executing an experimentalprogram with full-scale prototypes representative of RC frame-type buildings susceptible of severe damages if subjected toseismic events. HCP is a thin panel that conjugates the benefitsof the ultra-high ductility of strain hardening cement composites(SHCC) with the high strength, elasticity modulus and durabilityof carbon fiber reinforced polymer (CFRP) reinforcement systems.
Both retrofitted specimens showed a superior performance interms of hysteretic response, energy dissipation capacity, lateralload carrying capacity, beams flexural resistance and degradationof the secant stiffness than the corresponding values recordedwhen these specimens were tested in their virgin state.
While the adopted retrofitting system for JPA0-R resulted inhigher displacement ductility with respect to its virgin state, aslight decrease in displacement ductility of JPC-R was registered.This is mainly associated to the increase in the initial stiffness,damage concentration out of the retrofitted region of the rightbeam and sliding of longitudinal steel bars at this region. Lowerdamage propagation in the joint region provided by the strength-ening system and also partial detachment of the lateral HCPsduring relatively early stages of cyclic loading are the complemen-tary explanations for reduction in displacement ductility of JPC-R.
Progress in detachment of HCPs at the higher displacementdemands was effectively restricted due to the presence of chemicalanchors.
The much higher amount of dissipated energy presented byboth the retrofitted specimens is attributed to the contribution ofthe HCPs by distributing the damage in the form of diffused multi-ple micro-cracks in the SHCC, increasing the concrete confinementof the joint, and offering resistance to the occurrence of a prema-ture collapse due to the sliding of plain rebars.
Adding ‘‘L’’ shape HCPs to the retrofitting configuration resultedin lower shear stress development inside the joint region and, there-fore, in lower damage in the joint region and its higher stability.
Acknowledgments
This work is supported by FCT (PTDC/ECM/114511/2009). Thefirst author acknowledges the PhD scholarship SFRH/BD/65663/
2009 provided by FCT. The authors also thank the collaborationof the following material suppliers: SIKA, Dow Chemical Co.,ENDESA Compostilla Power Station, S&P Clever Reinforcement,and Hilti.
References
[1] Engindeniz M, Kahn LF, Zureick A-H. Repair and strengthening of reinforcedconcrete beam–column joints: state of the art. ACI Struct J 2005;102(2):1–14.
[2] Bousselham A. State of research on seismic retrofit of RC beam–column jointswith externally bonded FRP. J Compos Constr 2010;14(1):49–61.
[3] Tsonos AG. Effectiveness of CFRP-jackets and RC-jackets in post-earthquakeand pre-earthquake retrofitting of beam–column subassemblages. Eng Struct2008;30(3):777–93.
[4] Tsonos A-DG. Performance enhancement of R/C building columns and beam–column joints through shotcrete jacketing. Eng Struct 2010;32(3):726–40.
[5] Karayannis CG, Sirkelis GM. Strengthening and rehabilitation of RC beam–column joints using carbon-FRP jacketing and epoxy resin injection.Earthquake Eng Struct Dyn 2008;37(5):769–90.
[6] Al-Salloum Y, Almusallam T. Seismic response of interior RC beam–columnjoints upgraded with FRP sheets. I: experimental study. J Compos Constr2007;11(6):575–89.
[7] Mukherjee A, Joshi M. FRPC reinforced concrete beam–column joints undercyclic excitation. Compos Struct 2005;70(2):185–99.
[8] Pantelides CP, Okahashi Y, Reaveley LD. Seismic rehabilitation of RC frameinterior beam–column joints with FRP composites. In: The 14th Worldconference on earthquake engineering. Beijing, China; 2008.
[9] Esmaeeli E, Danesh F. Shear Strengthening of 3D corner beam–columnconnection using bidirectional GFRP layers. In: Proceeding of fourthinternational conference on FRP composites in civil engineering (CICE2008).Zurich; 2008.
[10] Danesh F, Esmaeeli E, Alam MF. Shear strengthening of 3D RC beam–columnconnection using GFRP: FEM study. Asian J Appl Sci 2008;1(3):217–27.
[11] Ha G-J, Cho C-G, Kang H-W, Feo L. Seismic improvement of RC beam–columnjoints using hexagonal CFRP bars combined with CFRP sheets. Compos Struct2013;95:464–70.
[12] Lee WT, Chiou YJ, Shih MH. Reinforced concrete beam–column jointstrengthened with carbon fiber reinforced polymer. Compos Struct2010;92(1):48–60.
[13] Mahini SS, Ronagh HR. Strength and ductility of FRP web-bonded RC beamsfor the assessment of retrofitted beam–column joints. Compos Struct2010;92(6):1325–32.
[14] Antonopoulos C, Triantafillou T. Experimental investigation of FRP-strengthened RC beam–column joints. J Compos Constr 2003;7(1):39–49.
[15] Engindeniz M, Kahn LF, Zureick A-H. Pre-1970 RC corner beam–column–slabjoints: seismic adequacy and upgradability with CFRP composites. In: The 14thWorld conference on earthquake engineering. Beijing, China; 2008.
[16] Eslami A, Ronagh H. Experimental investigation of an appropriate anchoragesystem for flange-bonded carbon fiber–reinforced polymers in retrofitted RCbeam–column joints. J Compos Constr 2014;18(4).
[17] Benmokrane B, Mohamed HM. Durability issues of FRP for civil infrastructure.In: 11th international symposium on fiber reinforced polymers for reinforcedconcrete structures (FRPRCS11). Guimaraes; 2013.
[18] Esmaeeli E, Manning E, Barros JA. Strain hardening fibre reinforced cementcomposites for the flexural strengthening of masonry elements of ancientstructures. Constr Build Mater 2013;38:1010–1021 [special issue].
[19] Esmaeeli E, Barros JAO, Baghi H. Hybrid composite plates (HCP) for shearstrengthening of RC beams. In: 11th International symposium on fiberreinforced polymers for reinforced concrete structures (FRPRCS11).Guimaraes; 2013.
[20] Barros JAO, Fortes AS. Flexural strengthening of concrete beams with CFRPlaminates bonded into slits. Cem Concr Compos 2005;27(4):471–80.
[21] Fernandes CAL. Cyclic behaviour of RC elements with plain reinforcing bars[Ph.D. thesis]. Aveiro, Portugal: Civil Engineerig, Univeristy of Aveiro; 2012.
[22] Fernandes C, Melo J, Varum H, Costa A. Cyclic behavior of substandardreinforced concrete beam–column joints with plain bars. ACI Struct J2013;110(1):137–47.
[23] EN1992-1-1. Eurocode 2: design of concrete structures. Part 1–1: general rulesand rules for buildings. Brussels, Belgium: European Committee forStandardization; 2004.

E. Esmaeeli et al. / Composite Structures 119 (2015) 24–37 37
[24] Park YJ, Ang AHS, Wen YK. Damage-limiting aseismic design of buildings.Earthquake Spectra 1987;3(1):1–26.
[25] Esmaeeli E, Barros JAO, Mastali M. Effects of curing conditions on crackbridging response of PVA reinforced cementitious matrix. In: 8th RILEMinternational symposium on fibre reinforced concrete: challenges andopportunities (BEFIB2012). Guimaraes, Portugal; 2012.
[26] International Organization for Standardization – ISO 527–2:1996. Plastics —Determination of tensile properties — Part 2: test conditions for moulding andextrusion plastics. London South Bank University.
[27] Verderame GM, Fabbrocino G, Manfredi G. Seismic response of r.c. columns withsmooth reinforcement. Part II: cyclic tests. Eng Struct 2008;30(9):2289–300.
[28] Paulay T. Equilibrium criteria for reinforced concrete beam–column joints. ACIStruct J 1989;86(6):635–43.
[29] EN 1998–3. 2005. Eurocode 8: Design of structures for earthquake resistance— Part 3: assessment and retrofitting of buildings.
[30] Fardis M, Biskinis D. Deformation capacity of R.C. members, as controlled byflexure or shear. In: Performance-based engineering for earthquake resistantreinforced concrete structures: a volume honoring Shunsuke Otani. Universityof Tokyo; 2003.